Jay, OK Map & Demographics
Jay Map
Jay Overview
$21,031
PER CAPITA INCOME
$49,306
AVG FAMILY INCOME
$36,625
AVG HOUSEHOLD INCOME
34.2%
WAGE / INCOME GAP [ % ]
65.8¢/ $1
WAGE / INCOME GAP [ $ ]
$7,687
FAMILY INCOME DEFICIT
0.51
INEQUALITY / GINI INDEX
2,900
TOTAL POPULATION
1,477
MALE POPULATION
1,423
FEMALE POPULATION
103.79
MALES / 100 FEMALES
96.34
FEMALES / 100 MALES
35.4
MEDIAN AGE
3.7
AVG FAMILY SIZE
3.0
AVG HOUSEHOLD SIZE
1,153
LABOR FORCE [ PEOPLE ]
51.1%
PERCENT IN LABOR FORCE
10.3%
UNEMPLOYMENT RATE
Jay Zip Codes
Jay Area Codes
Income in Jay
Income Overview in Jay
Per Capita Income in Jay is $21,031, while median incomes of families and households are $49,306 and $36,625 respectively.
| Characteristic | Number | Measure |
| Per Capita Income | 2,900 | $21,031 |
| Median Family Income | 611 | $49,306 |
| Mean Family Income | 611 | $65,128 |
| Median Household Income | 957 | $36,625 |
| Mean Household Income | 957 | $56,705 |
| Income Deficit | 611 | $7,687 |
| Wage / Income Gap (%) | 2,900 | 34.24% |
| Wage / Income Gap ($) | 2,900 | 65.76¢ per $1 |
| Gini / Inequality Index | 2,900 | 0.51 |
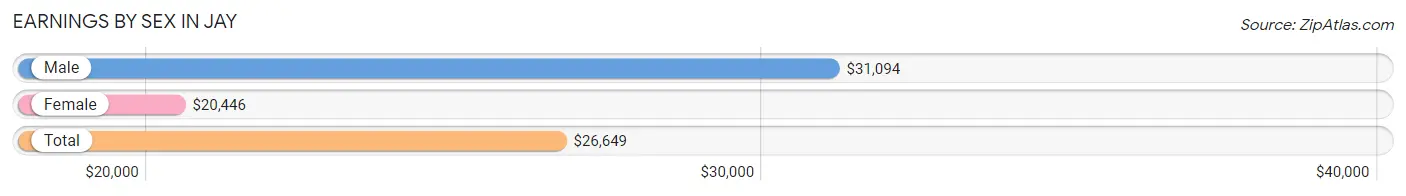
Earnings by Sex in Jay
Average Earnings in Jay are $26,649, $31,094 for men and $20,446 for women, a difference of 34.2%.
| Sex | Number | Average Earnings |
| Male | 687 (55.6%) | $31,094 |
| Female | 549 (44.4%) | $20,446 |
| Total | 1,236 (100.0%) | $26,649 |
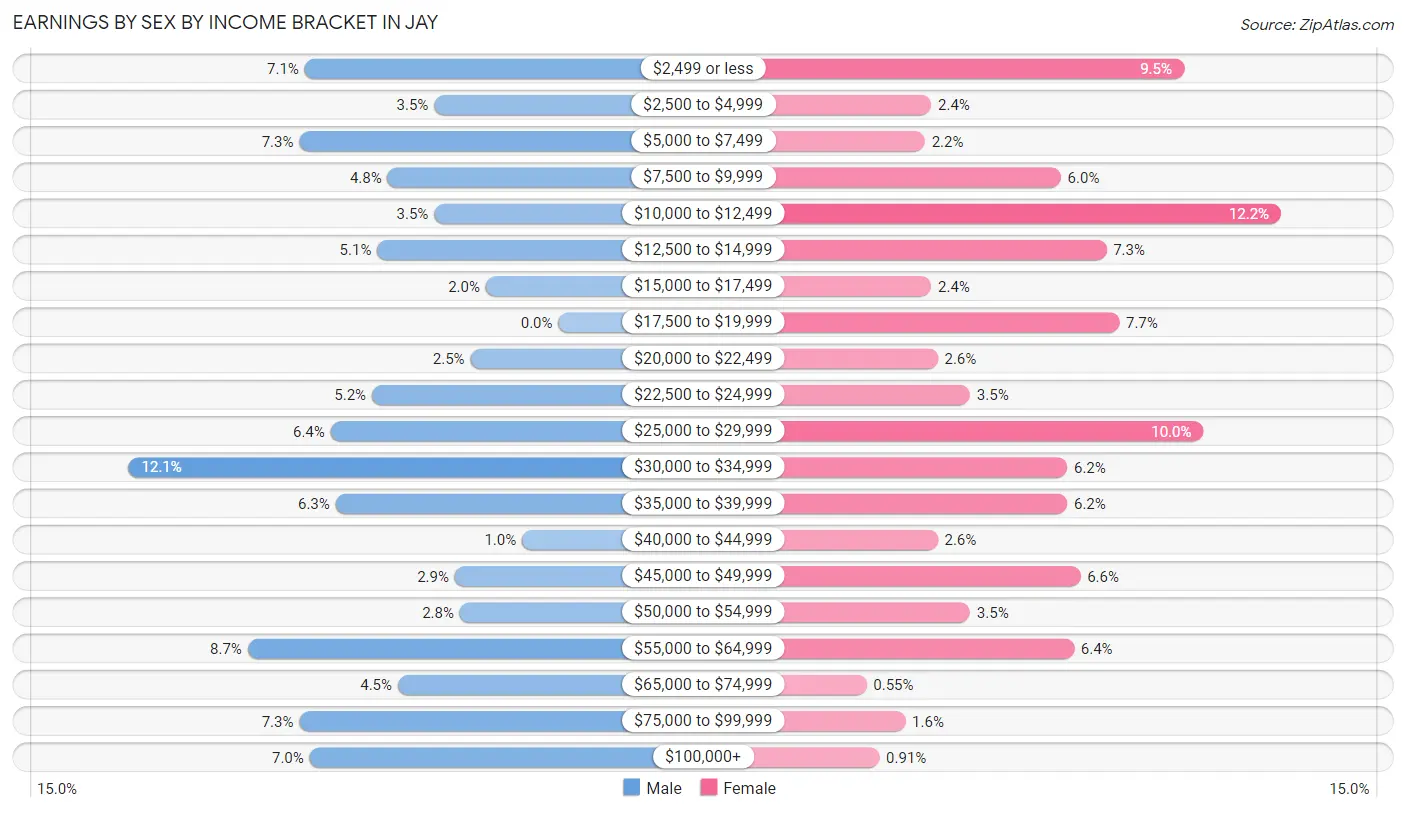
Earnings by Sex by Income Bracket in Jay
The most common earnings brackets in Jay are $30,000 to $34,999 for men (83 | 12.1%) and $10,000 to $12,499 for women (67 | 12.2%).
| Income | Male | Female |
| $2,499 or less | 49 (7.1%) | 52 (9.5%) |
| $2,500 to $4,999 | 24 (3.5%) | 13 (2.4%) |
| $5,000 to $7,499 | 50 (7.3%) | 12 (2.2%) |
| $7,500 to $9,999 | 33 (4.8%) | 33 (6.0%) |
| $10,000 to $12,499 | 24 (3.5%) | 67 (12.2%) |
| $12,500 to $14,999 | 35 (5.1%) | 40 (7.3%) |
| $15,000 to $17,499 | 14 (2.0%) | 13 (2.4%) |
| $17,500 to $19,999 | 0 (0.0%) | 42 (7.6%) |
| $20,000 to $22,499 | 17 (2.5%) | 14 (2.5%) |
| $22,500 to $24,999 | 36 (5.2%) | 19 (3.5%) |
| $25,000 to $29,999 | 44 (6.4%) | 55 (10.0%) |
| $30,000 to $34,999 | 83 (12.1%) | 34 (6.2%) |
| $35,000 to $39,999 | 43 (6.3%) | 34 (6.2%) |
| $40,000 to $44,999 | 7 (1.0%) | 14 (2.5%) |
| $45,000 to $49,999 | 20 (2.9%) | 36 (6.6%) |
| $50,000 to $54,999 | 19 (2.8%) | 19 (3.5%) |
| $55,000 to $64,999 | 60 (8.7%) | 35 (6.4%) |
| $65,000 to $74,999 | 31 (4.5%) | 3 (0.5%) |
| $75,000 to $99,999 | 50 (7.3%) | 9 (1.6%) |
| $100,000+ | 48 (7.0%) | 5 (0.9%) |
| Total | 687 (100.0%) | 549 (100.0%) |
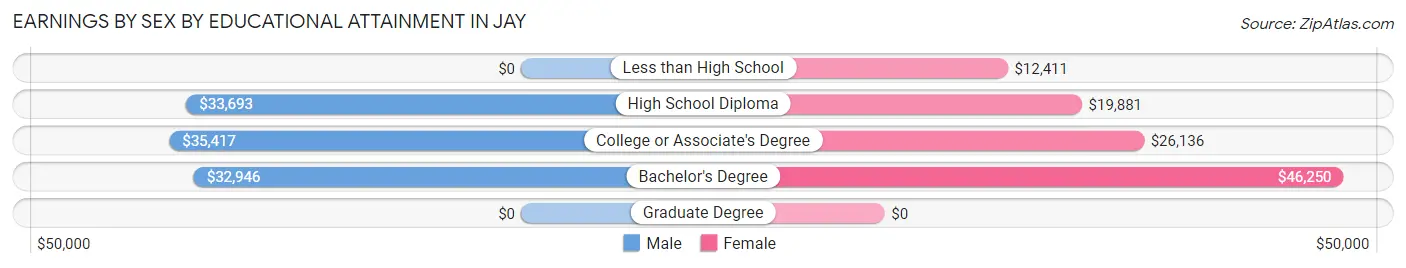
Earnings by Sex by Educational Attainment in Jay
Average earnings in Jay are $31,815 for men and $24,342 for women, a difference of 23.5%. Men with an educational attainment of college or associate's degree enjoy the highest average annual earnings of $35,417, while those with bachelor's degree education earn the least with $32,946. Women with an educational attainment of bachelor's degree earn the most with the average annual earnings of $46,250, while those with less than high school education have the smallest earnings of $12,411.
| Educational Attainment | Male Income | Female Income |
| Less than High School | - | - |
| High School Diploma | $33,693 | $19,881 |
| College or Associate's Degree | $35,417 | $26,136 |
| Bachelor's Degree | $32,946 | $46,250 |
| Graduate Degree | - | - |
| Total | $31,815 | $24,342 |
Family Income in Jay
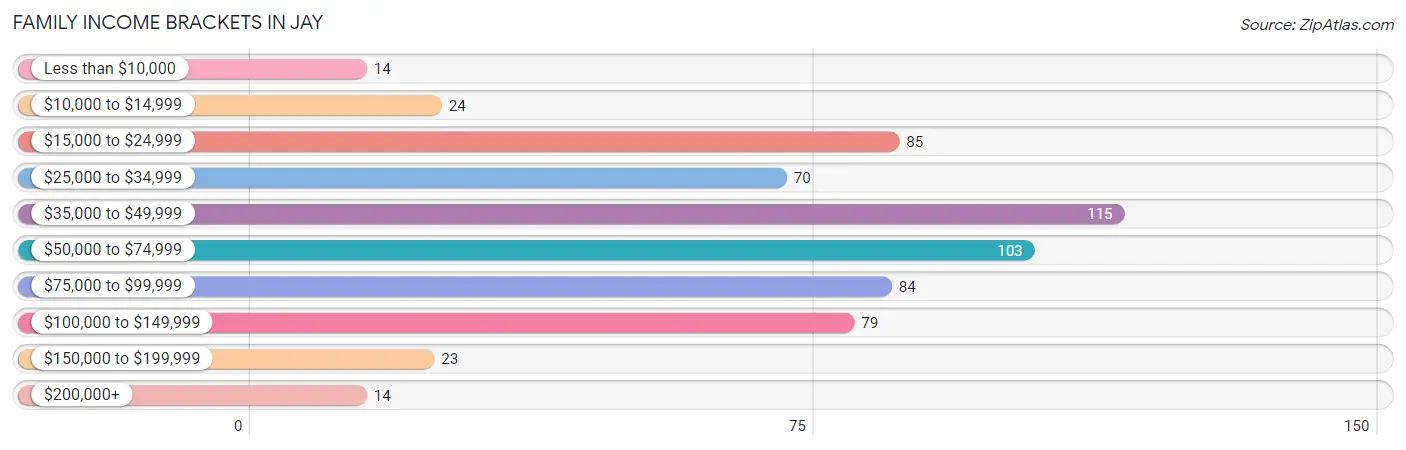
Family Income Brackets in Jay
According to the Jay family income data, there are 115 families falling into the $35,000 to $49,999 income range, which is the most common income bracket and makes up 18.8% of all families. Conversely, the less than $10,000 income bracket is the least frequent group with only 14 families (2.3%) belonging to this category.
| Income Bracket | # Families | % Families |
| Less than $10,000 | 14 | 2.3% |
| $10,000 to $14,999 | 24 | 3.9% |
| $15,000 to $24,999 | 85 | 13.9% |
| $25,000 to $34,999 | 70 | 11.5% |
| $35,000 to $49,999 | 115 | 18.8% |
| $50,000 to $74,999 | 103 | 16.9% |
| $75,000 to $99,999 | 84 | 13.7% |
| $100,000 to $149,999 | 79 | 12.9% |
| $150,000 to $199,999 | 23 | 3.8% |
| $200,000+ | 14 | 2.3% |
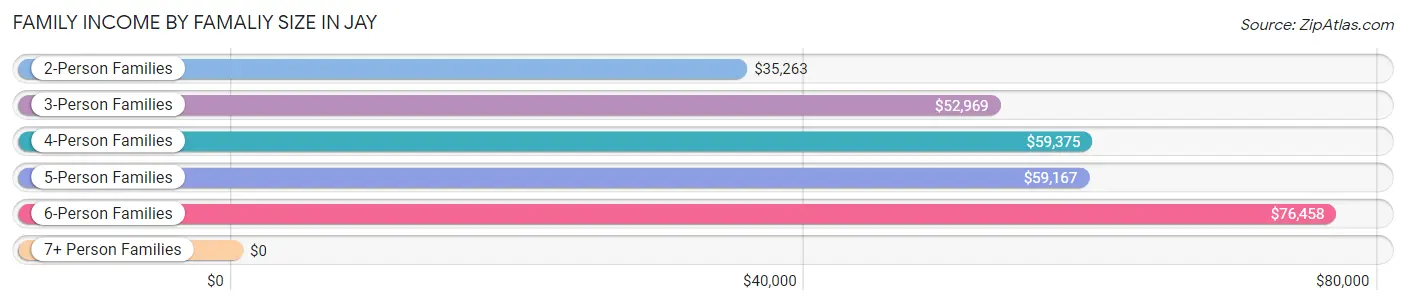
Family Income by Famaliy Size in Jay
6-person families (39 | 6.4%) account for the highest median family income in Jay with $76,458 per family, while 3-person families (109 | 17.8%) have the highest median income of $17,656 per family member.
| Income Bracket | # Families | Median Income |
| 2-Person Families | 244 (39.9%) | $35,263 |
| 3-Person Families | 109 (17.8%) | $52,969 |
| 4-Person Families | 129 (21.1%) | $59,375 |
| 5-Person Families | 56 (9.2%) | $59,167 |
| 6-Person Families | 39 (6.4%) | $76,458 |
| 7+ Person Families | 34 (5.6%) | $0 |
| Total | 611 (100.0%) | $49,306 |
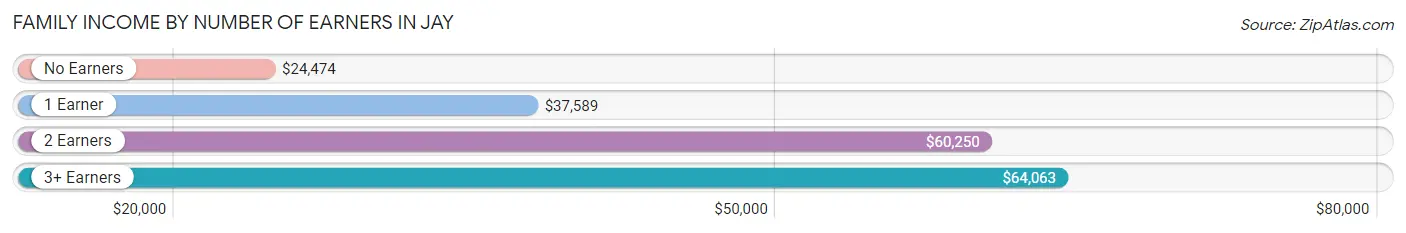
Family Income by Number of Earners in Jay
The median family income in Jay is $49,306, with families comprising 3+ earners (43) having the highest median family income of $64,063, while families with no earners (110) have the lowest median family income of $24,474, accounting for 7.0% and 18.0% of families, respectively.
| Number of Earners | # Families | Median Income |
| No Earners | 110 (18.0%) | $24,474 |
| 1 Earner | 201 (32.9%) | $37,589 |
| 2 Earners | 257 (42.1%) | $60,250 |
| 3+ Earners | 43 (7.0%) | $64,063 |
| Total | 611 (100.0%) | $49,306 |
Household Income in Jay
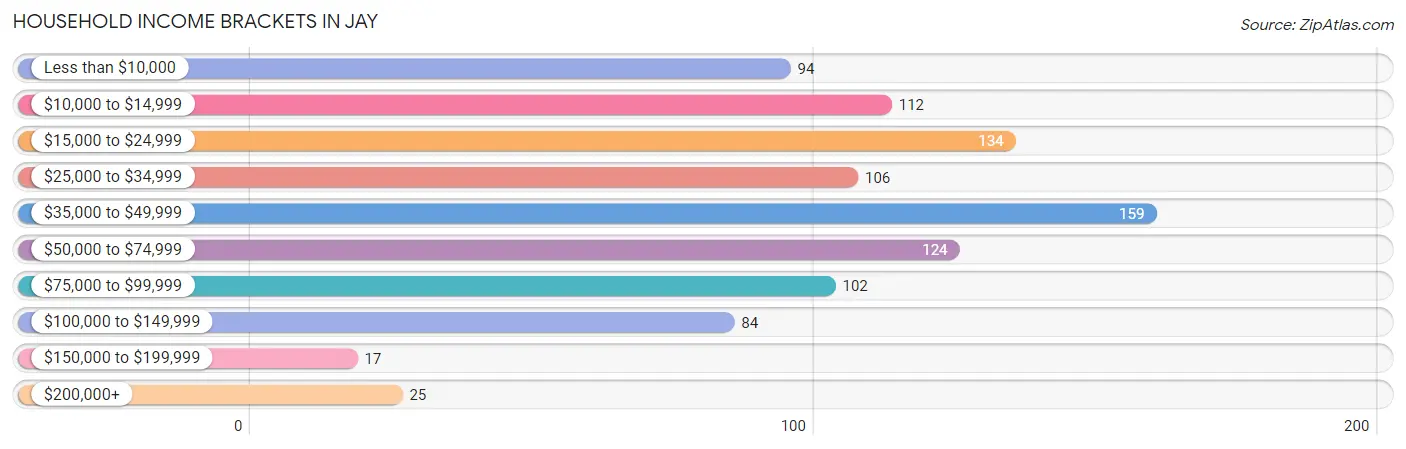
Household Income Brackets in Jay
With 159 households falling in the category, the $35,000 to $49,999 income range is the most frequent in Jay, accounting for 16.6% of all households. In contrast, only 17 households (1.8%) fall into the $150,000 to $199,999 income bracket, making it the least populous group.
| Income Bracket | # Households | % Households |
| Less than $10,000 | 94 | 9.8% |
| $10,000 to $14,999 | 112 | 11.7% |
| $15,000 to $24,999 | 134 | 14.0% |
| $25,000 to $34,999 | 106 | 11.1% |
| $35,000 to $49,999 | 159 | 16.6% |
| $50,000 to $74,999 | 124 | 13.0% |
| $75,000 to $99,999 | 102 | 10.7% |
| $100,000 to $149,999 | 84 | 8.8% |
| $150,000 to $199,999 | 17 | 1.8% |
| $200,000+ | 25 | 2.6% |
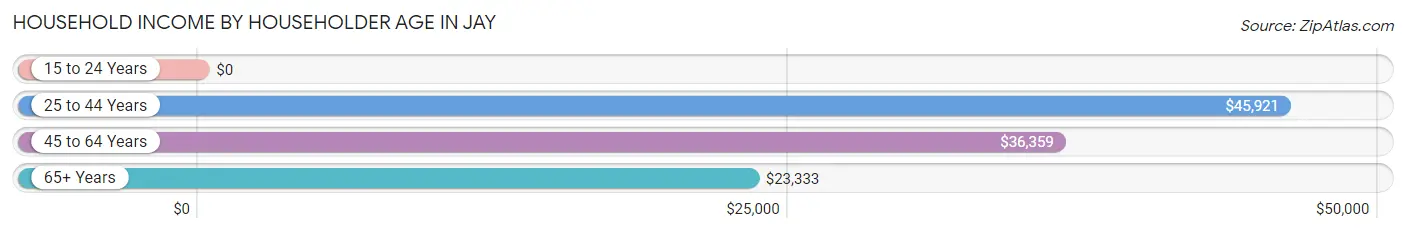
Household Income by Householder Age in Jay
The median household income in Jay is $36,625, with the highest median household income of $45,921 found in the 25 to 44 years age bracket for the primary householder. A total of 336 households (35.1%) fall into this category. Meanwhile, the 15 to 24 years age bracket for the primary householder has the lowest median household income of $0, with 30 households (3.1%) in this group.
| Income Bracket | # Households | Median Income |
| 15 to 24 Years | 30 (3.1%) | $0 |
| 25 to 44 Years | 336 (35.1%) | $45,921 |
| 45 to 64 Years | 345 (36.0%) | $36,359 |
| 65+ Years | 246 (25.7%) | $23,333 |
| Total | 957 (100.0%) | $36,625 |
Poverty in Jay
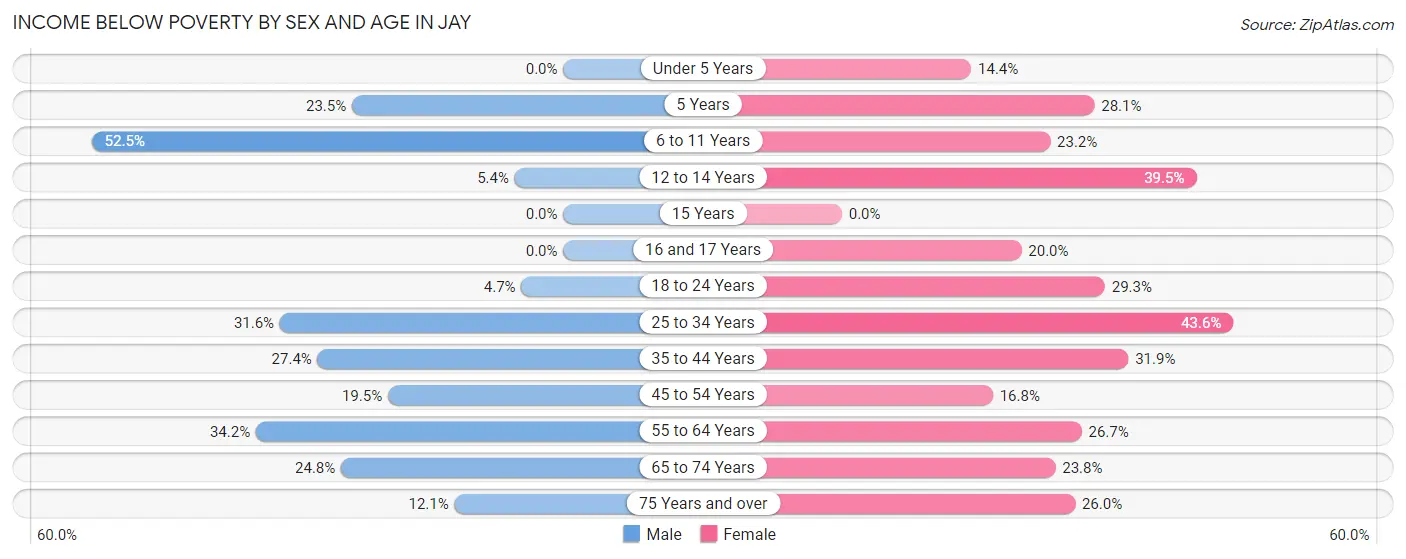
Income Below Poverty by Sex and Age in Jay
With 23.4% poverty level for males and 27.1% for females among the residents of Jay, 6 to 11 year old males and 25 to 34 year old females are the most vulnerable to poverty, with 52 males (52.5%) and 68 females (43.6%) in their respective age groups living below the poverty level.
| Age Bracket | Male | Female |
| Under 5 Years | 0 (0.0%) | 18 (14.4%) |
| 5 Years | 4 (23.5%) | 9 (28.1%) |
| 6 to 11 Years | 52 (52.5%) | 29 (23.2%) |
| 12 to 14 Years | 4 (5.4%) | 15 (39.5%) |
| 15 Years | 0 (0.0%) | 0 (0.0%) |
| 16 and 17 Years | 0 (0.0%) | 7 (20.0%) |
| 18 to 24 Years | 7 (4.7%) | 41 (29.3%) |
| 25 to 34 Years | 77 (31.6%) | 68 (43.6%) |
| 35 to 44 Years | 55 (27.4%) | 74 (31.9%) |
| 45 to 54 Years | 25 (19.5%) | 19 (16.8%) |
| 55 to 64 Years | 76 (34.2%) | 47 (26.7%) |
| 65 to 74 Years | 25 (24.7%) | 34 (23.8%) |
| 75 Years and over | 4 (12.1%) | 20 (26.0%) |
| Total | 329 (23.4%) | 381 (27.1%) |
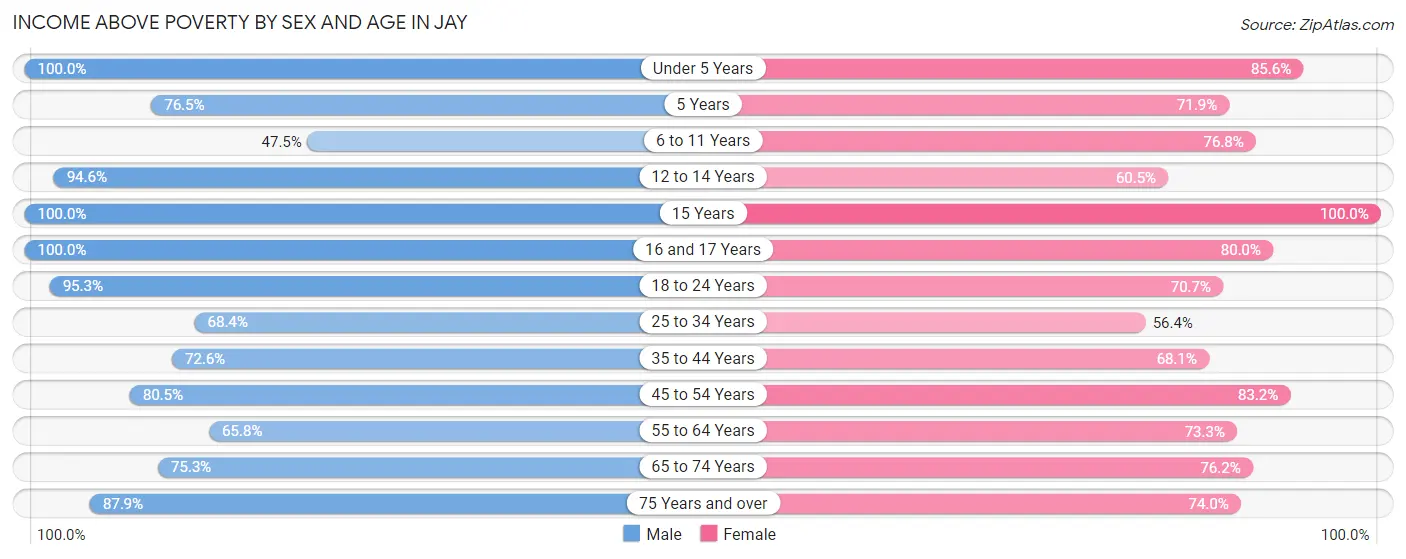
Income Above Poverty by Sex and Age in Jay
According to the poverty statistics in Jay, males aged under 5 years and females aged 15 years are the age groups that are most secure financially, with 100.0% of males and 100.0% of females in these age groups living above the poverty line.
| Age Bracket | Male | Female |
| Under 5 Years | 54 (100.0%) | 107 (85.6%) |
| 5 Years | 13 (76.5%) | 23 (71.9%) |
| 6 to 11 Years | 47 (47.5%) | 96 (76.8%) |
| 12 to 14 Years | 70 (94.6%) | 23 (60.5%) |
| 15 Years | 42 (100.0%) | 12 (100.0%) |
| 16 and 17 Years | 39 (100.0%) | 28 (80.0%) |
| 18 to 24 Years | 143 (95.3%) | 99 (70.7%) |
| 25 to 34 Years | 167 (68.4%) | 88 (56.4%) |
| 35 to 44 Years | 146 (72.6%) | 158 (68.1%) |
| 45 to 54 Years | 103 (80.5%) | 94 (83.2%) |
| 55 to 64 Years | 146 (65.8%) | 129 (73.3%) |
| 65 to 74 Years | 76 (75.2%) | 109 (76.2%) |
| 75 Years and over | 29 (87.9%) | 57 (74.0%) |
| Total | 1,075 (76.6%) | 1,023 (72.9%) |
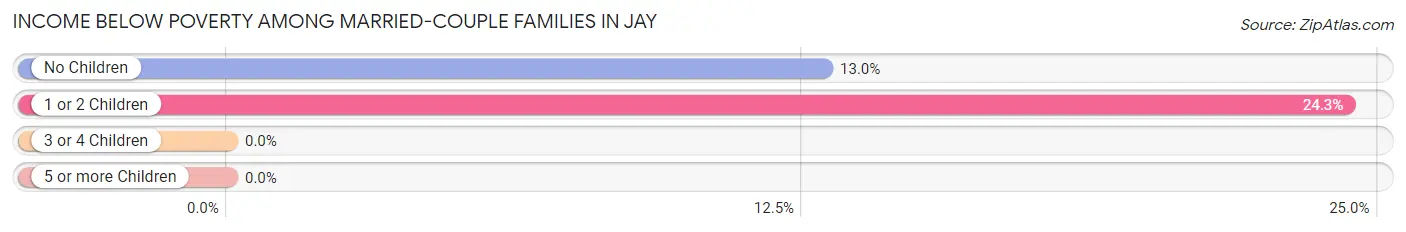
Income Below Poverty Among Married-Couple Families in Jay
The poverty statistics for married-couple families in Jay show that 14.6% or 60 of the total 412 families live below the poverty line. Families with 1 or 2 children have the highest poverty rate of 24.3%, comprising of 35 families. On the other hand, families with 3 or 4 children have the lowest poverty rate of 0.0%, which includes 0 families.
| Children | Above Poverty | Below Poverty |
| No Children | 168 (87.1%) | 25 (13.0%) |
| 1 or 2 Children | 109 (75.7%) | 35 (24.3%) |
| 3 or 4 Children | 64 (100.0%) | 0 (0.0%) |
| 5 or more Children | 11 (100.0%) | 0 (0.0%) |
| Total | 352 (85.4%) | 60 (14.6%) |
Income Below Poverty Among Single-Parent Households in Jay
According to the poverty data in Jay, 26.5% or 22 single-father households and 22.4% or 26 single-mother households are living below the poverty line. Among single-father households, those with no children have the highest poverty rate, with 11 households (52.4%) experiencing poverty. Likewise, among single-mother households, those with 3 or 4 children have the highest poverty rate, with 5 households (100.0%) falling below the poverty line.
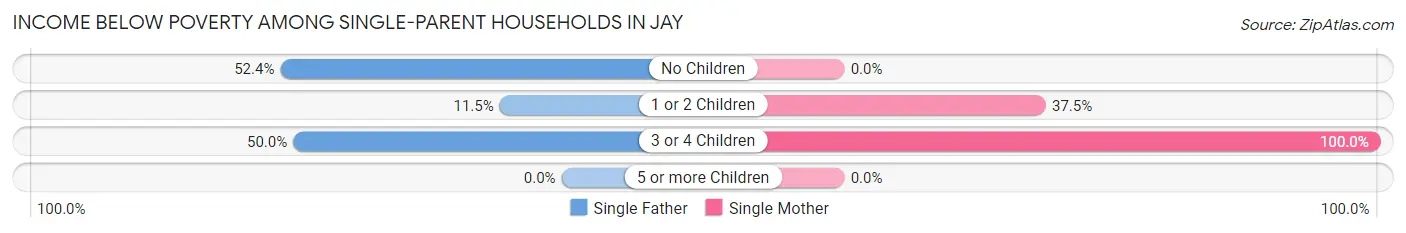
| Children | Single Father | Single Mother |
| No Children | 11 (52.4%) | 0 (0.0%) |
| 1 or 2 Children | 6 (11.5%) | 21 (37.5%) |
| 3 or 4 Children | 5 (50.0%) | 5 (100.0%) |
| 5 or more Children | 0 (0.0%) | 0 (0.0%) |
| Total | 22 (26.5%) | 26 (22.4%) |
Income Below Poverty Among Married-Couple vs Single-Parent Households in Jay
The poverty data for Jay shows that 60 of the married-couple family households (14.6%) and 48 of the single-parent households (24.1%) are living below the poverty level. Within the married-couple family households, those with 1 or 2 children have the highest poverty rate, with 35 households (24.3%) falling below the poverty line. Among the single-parent households, those with 3 or 4 children have the highest poverty rate, with 10 household (66.7%) living below poverty.
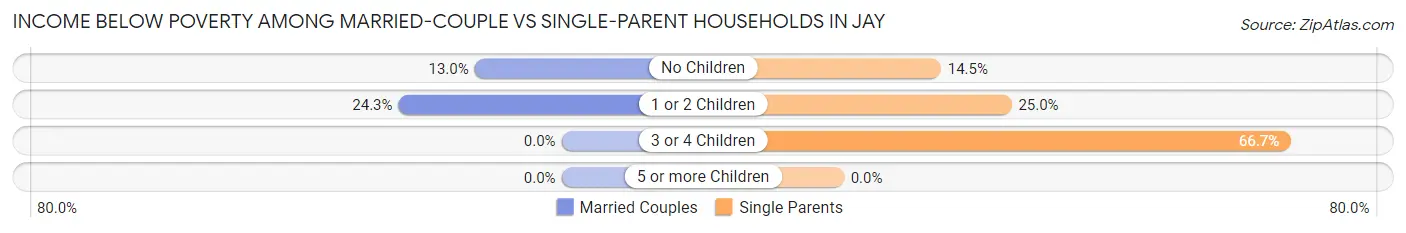
| Children | Married-Couple Families | Single-Parent Households |
| No Children | 25 (13.0%) | 11 (14.5%) |
| 1 or 2 Children | 35 (24.3%) | 27 (25.0%) |
| 3 or 4 Children | 0 (0.0%) | 10 (66.7%) |
| 5 or more Children | 0 (0.0%) | 0 (0.0%) |
| Total | 60 (14.6%) | 48 (24.1%) |
Race in Jay
The most populous races in Jay are White / Caucasian (1,210 | 41.7%), Native / Alaskan (1,039 | 35.8%), and Two or more Races (562 | 19.4%).
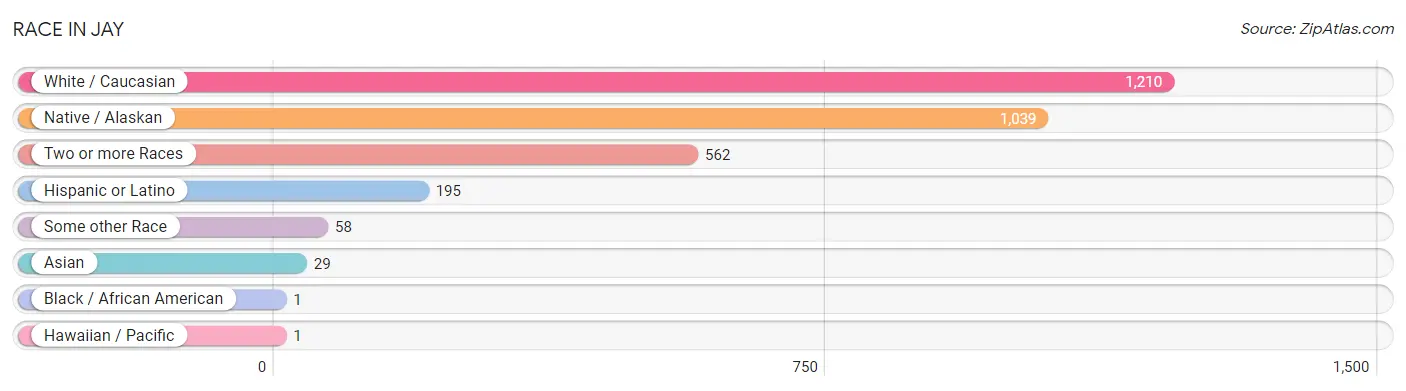
| Race | # Population | % Population |
| Asian | 29 | 1.0% |
| Black / African American | 1 | 0.0% |
| Hawaiian / Pacific | 1 | 0.0% |
| Hispanic or Latino | 195 | 6.7% |
| Native / Alaskan | 1,039 | 35.8% |
| White / Caucasian | 1,210 | 41.7% |
| Two or more Races | 562 | 19.4% |
| Some other Race | 58 | 2.0% |
| Total | 2,900 | 100.0% |
Ancestry in Jay
The most populous ancestries reported in Jay are Cherokee (1,335 | 46.0%), German (276 | 9.5%), English (201 | 6.9%), Irish (172 | 5.9%), and Mexican (152 | 5.2%), together accounting for 73.7% of all Jay residents.
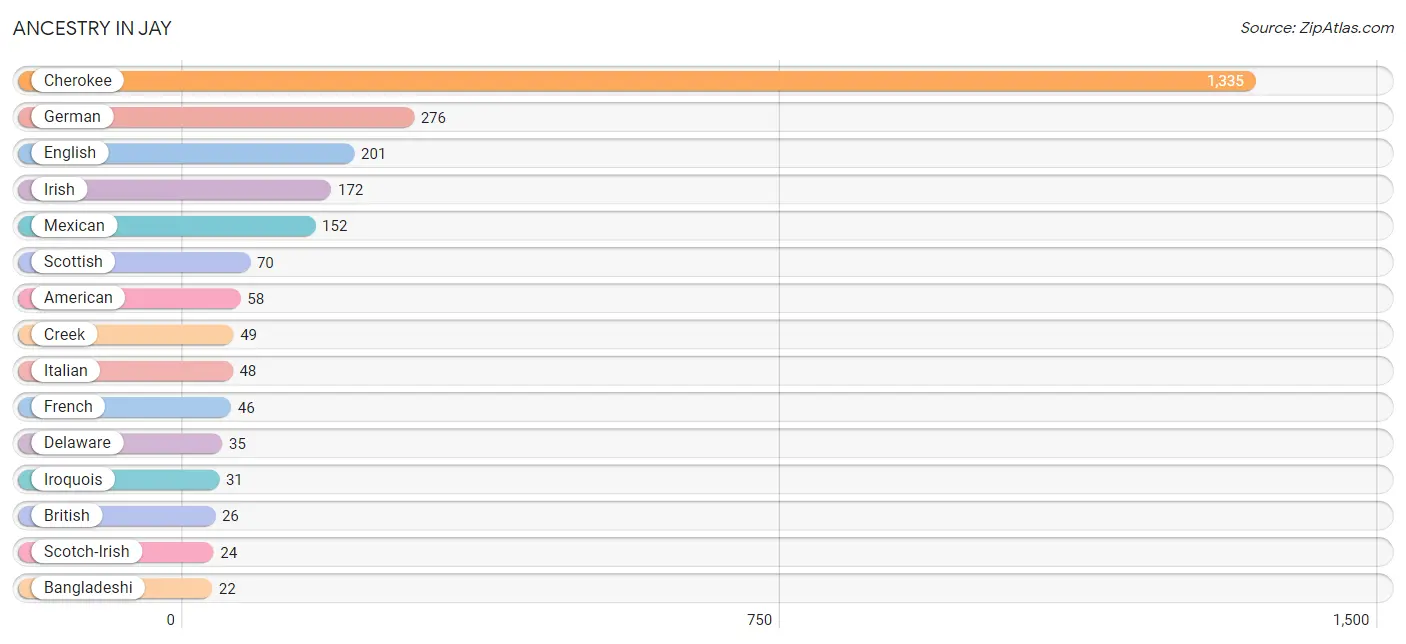
| Ancestry | # Population | % Population |
| American | 58 | 2.0% |
| Bangladeshi | 22 | 0.8% |
| British | 26 | 0.9% |
| Burmese | 4 | 0.1% |
| Central American | 9 | 0.3% |
| Cherokee | 1,335 | 46.0% |
| Chickasaw | 12 | 0.4% |
| Chippewa | 2 | 0.1% |
| Choctaw | 22 | 0.8% |
| Comanche | 4 | 0.1% |
| Creek | 49 | 1.7% |
| Delaware | 35 | 1.2% |
| Dutch | 19 | 0.7% |
| English | 201 | 6.9% |
| Ethiopian | 1 | 0.0% |
| European | 6 | 0.2% |
| French | 46 | 1.6% |
| French Canadian | 4 | 0.1% |
| German | 276 | 9.5% |
| Honduran | 9 | 0.3% |
| Irish | 172 | 5.9% |
| Iroquois | 31 | 1.1% |
| Italian | 48 | 1.7% |
| Japanese | 9 | 0.3% |
| Korean | 4 | 0.1% |
| Mexican | 152 | 5.2% |
| Osage | 13 | 0.4% |
| Polish | 13 | 0.4% |
| Russian | 4 | 0.1% |
| Scotch-Irish | 24 | 0.8% |
| Scottish | 70 | 2.4% |
| Sioux | 10 | 0.3% |
| Spaniard | 8 | 0.3% |
| Sri Lankan | 5 | 0.2% |
| Subsaharan African | 1 | 0.0% |
| Swedish | 12 | 0.4% |
| Ukrainian | 6 | 0.2% |
| Welsh | 11 | 0.4% | View All 38 Rows |
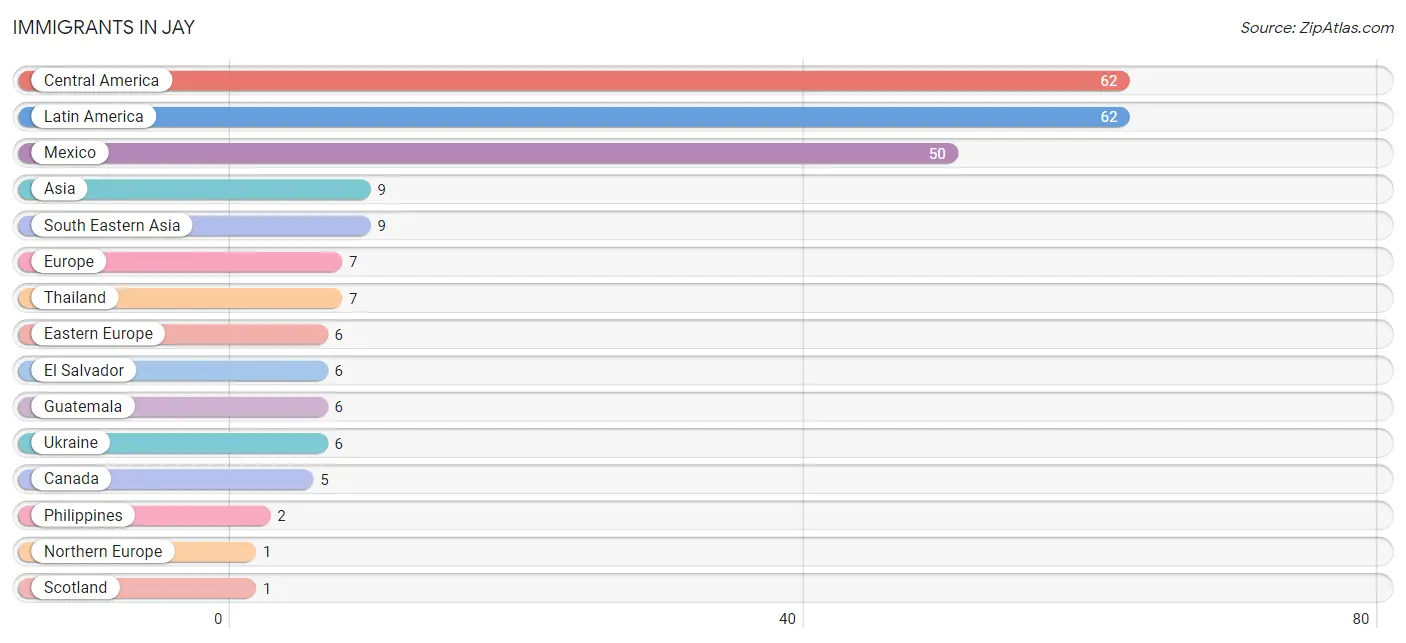
Immigrants in Jay
The most numerous immigrant groups reported in Jay came from Central America (62 | 2.1%), Latin America (62 | 2.1%), Mexico (50 | 1.7%), Asia (9 | 0.3%), and South Eastern Asia (9 | 0.3%), together accounting for 6.6% of all Jay residents.
| Immigration Origin | # Population | % Population |
| Asia | 9 | 0.3% |
| Canada | 5 | 0.2% |
| Central America | 62 | 2.1% |
| Eastern Europe | 6 | 0.2% |
| El Salvador | 6 | 0.2% |
| Europe | 7 | 0.2% |
| Guatemala | 6 | 0.2% |
| Latin America | 62 | 2.1% |
| Mexico | 50 | 1.7% |
| Northern Europe | 1 | 0.0% |
| Philippines | 2 | 0.1% |
| Scotland | 1 | 0.0% |
| South Eastern Asia | 9 | 0.3% |
| Thailand | 7 | 0.2% |
| Ukraine | 6 | 0.2% | View All 15 Rows |
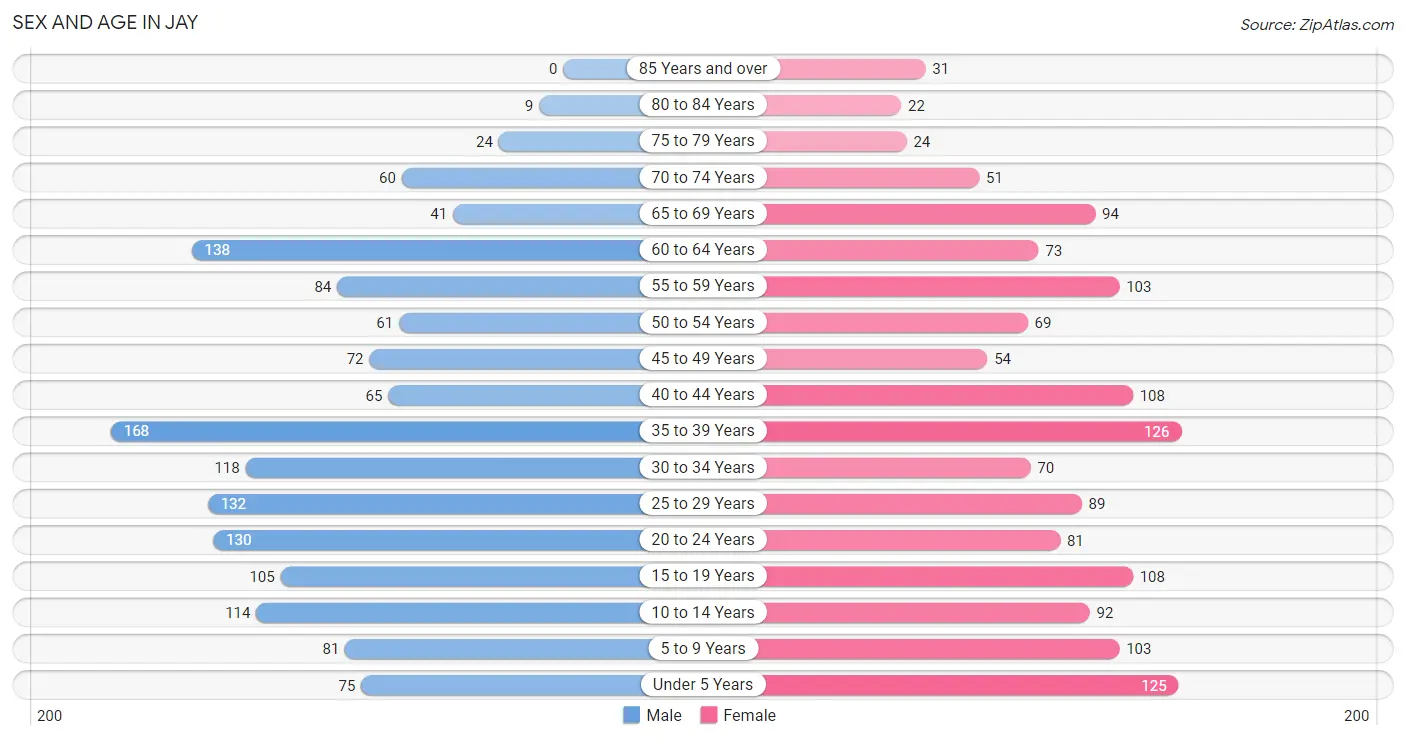
Sex and Age in Jay
Sex and Age in Jay
The most populous age groups in Jay are 35 to 39 Years (168 | 11.4%) for men and 35 to 39 Years (126 | 8.8%) for women.
| Age Bracket | Male | Female |
| Under 5 Years | 75 (5.1%) | 125 (8.8%) |
| 5 to 9 Years | 81 (5.5%) | 103 (7.2%) |
| 10 to 14 Years | 114 (7.7%) | 92 (6.5%) |
| 15 to 19 Years | 105 (7.1%) | 108 (7.6%) |
| 20 to 24 Years | 130 (8.8%) | 81 (5.7%) |
| 25 to 29 Years | 132 (8.9%) | 89 (6.2%) |
| 30 to 34 Years | 118 (8.0%) | 70 (4.9%) |
| 35 to 39 Years | 168 (11.4%) | 126 (8.8%) |
| 40 to 44 Years | 65 (4.4%) | 108 (7.6%) |
| 45 to 49 Years | 72 (4.9%) | 54 (3.8%) |
| 50 to 54 Years | 61 (4.1%) | 69 (4.9%) |
| 55 to 59 Years | 84 (5.7%) | 103 (7.2%) |
| 60 to 64 Years | 138 (9.3%) | 73 (5.1%) |
| 65 to 69 Years | 41 (2.8%) | 94 (6.6%) |
| 70 to 74 Years | 60 (4.1%) | 51 (3.6%) |
| 75 to 79 Years | 24 (1.6%) | 24 (1.7%) |
| 80 to 84 Years | 9 (0.6%) | 22 (1.5%) |
| 85 Years and over | 0 (0.0%) | 31 (2.2%) |
| Total | 1,477 (100.0%) | 1,423 (100.0%) |
Families and Households in Jay
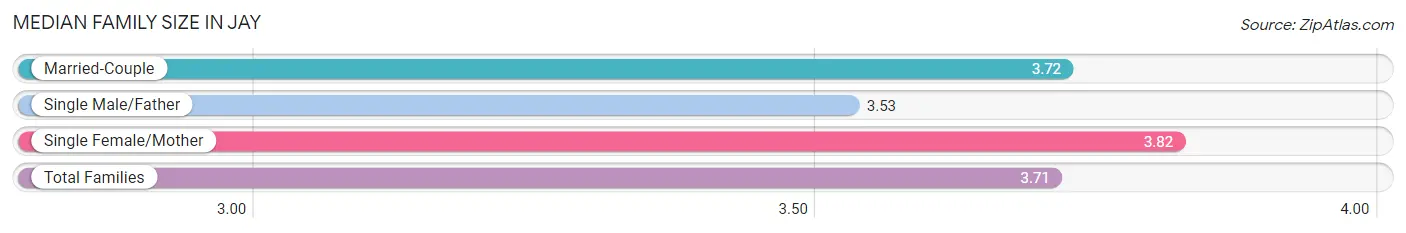
Median Family Size in Jay
The median family size in Jay is 3.71 persons per family, with single female/mother families (116 | 19.0%) accounting for the largest median family size of 3.82 persons per family. On the other hand, single male/father families (83 | 13.6%) represent the smallest median family size with 3.53 persons per family.
| Family Type | # Families | Family Size |
| Married-Couple | 412 (67.4%) | 3.72 |
| Single Male/Father | 83 (13.6%) | 3.53 |
| Single Female/Mother | 116 (19.0%) | 3.82 |
| Total Families | 611 (100.0%) | 3.71 |
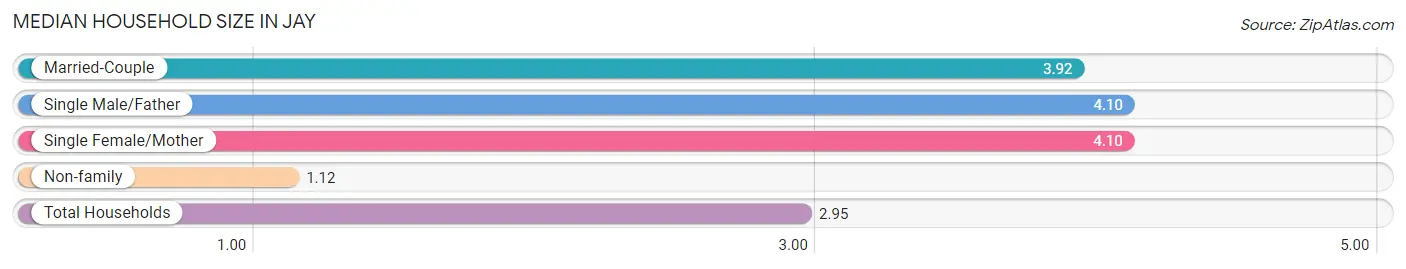
Median Household Size in Jay
The median household size in Jay is 2.95 persons per household, with single male/father households (83 | 8.7%) accounting for the largest median household size of 4.1 persons per household. non-family households (346 | 36.1%) represent the smallest median household size with 1.12 persons per household.
| Household Type | # Households | Household Size |
| Married-Couple | 412 (43.0%) | 3.92 |
| Single Male/Father | 83 (8.7%) | 4.10 |
| Single Female/Mother | 116 (12.1%) | 4.10 |
| Non-family | 346 (36.1%) | 1.12 |
| Total Households | 957 (100.0%) | 2.95 |
Household Size by Marriage Status in Jay
Out of a total of 957 households in Jay, 611 (63.8%) are family households, while 346 (36.1%) are nonfamily households. The most numerous type of family households are 2-person households, comprising 219, and the most common type of nonfamily households are 1-person households, comprising 320.
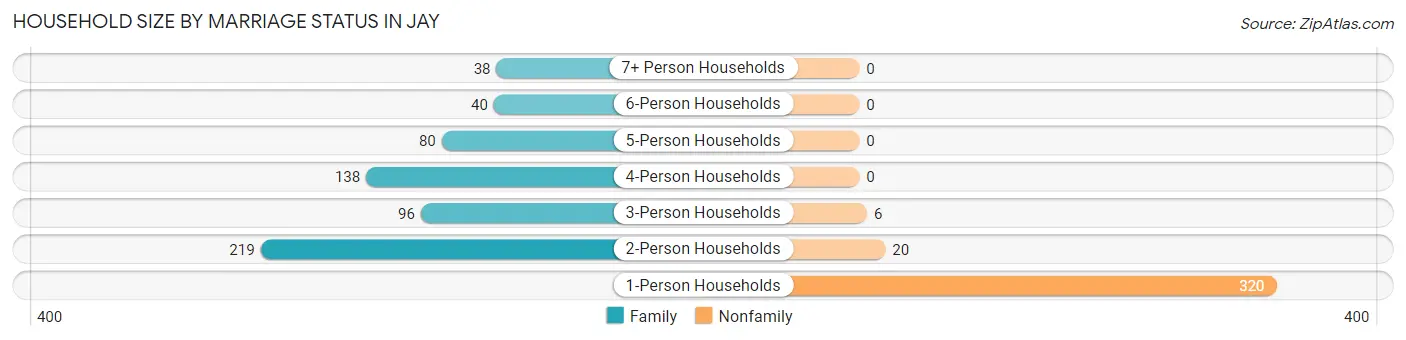
| Household Size | Family Households | Nonfamily Households |
| 1-Person Households | - | 320 (33.4%) |
| 2-Person Households | 219 (22.9%) | 20 (2.1%) |
| 3-Person Households | 96 (10.0%) | 6 (0.6%) |
| 4-Person Households | 138 (14.4%) | 0 (0.0%) |
| 5-Person Households | 80 (8.4%) | 0 (0.0%) |
| 6-Person Households | 40 (4.2%) | 0 (0.0%) |
| 7+ Person Households | 38 (4.0%) | 0 (0.0%) |
| Total | 611 (63.8%) | 346 (36.1%) |
Female Fertility in Jay
Fertility by Age in Jay
Average fertility rate in Jay is 72.0 births per 1,000 women. Women in the age bracket of 20 to 34 years have the highest fertility rate with 196.0 births per 1,000 women. Women in the age bracket of 20 to 34 years acount for 100.0% of all women with births.
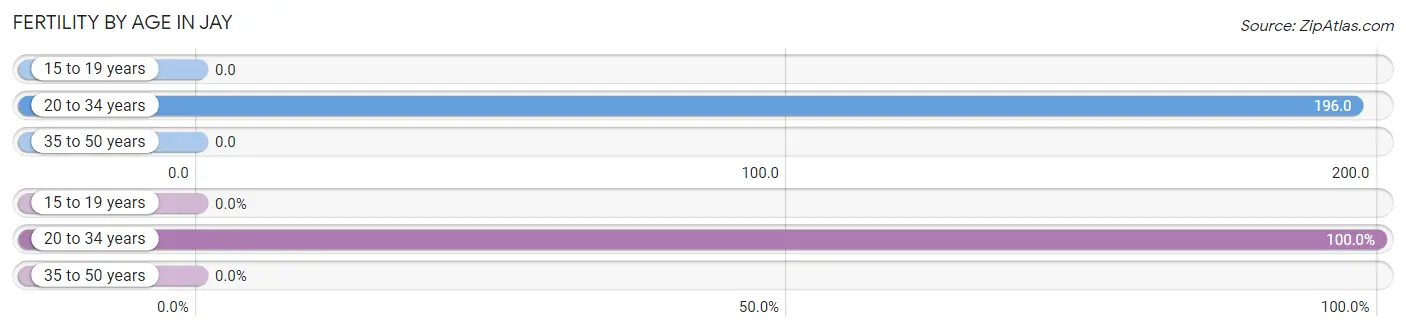
| Age Bracket | Women with Births | Births / 1,000 Women |
| 15 to 19 years | 0 (0.0%) | 0.0 |
| 20 to 34 years | 47 (100.0%) | 196.0 |
| 35 to 50 years | 0 (0.0%) | 0.0 |
| Total | 47 (100.0%) | 72.0 |
Fertility by Age by Marriage Status in Jay
68.1% of women with births (47) in Jay are married. The highest percentage of unmarried women with births falls into 20 to 34 years age bracket with 31.9% of them unmarried at the time of birth, while the lowest percentage of unmarried women with births belong to 20 to 34 years age bracket with 31.9% of them unmarried.
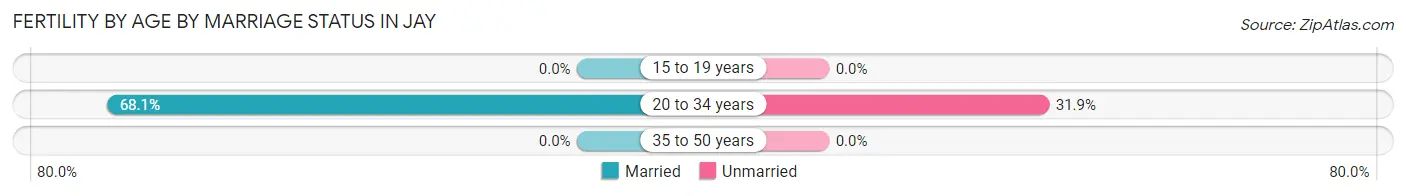
| Age Bracket | Married | Unmarried |
| 15 to 19 years | 0 (0.0%) | 0 (0.0%) |
| 20 to 34 years | 32 (68.1%) | 15 (31.9%) |
| 35 to 50 years | 0 (0.0%) | 0 (0.0%) |
| Total | 32 (68.1%) | 15 (31.9%) |
Fertility by Education in Jay
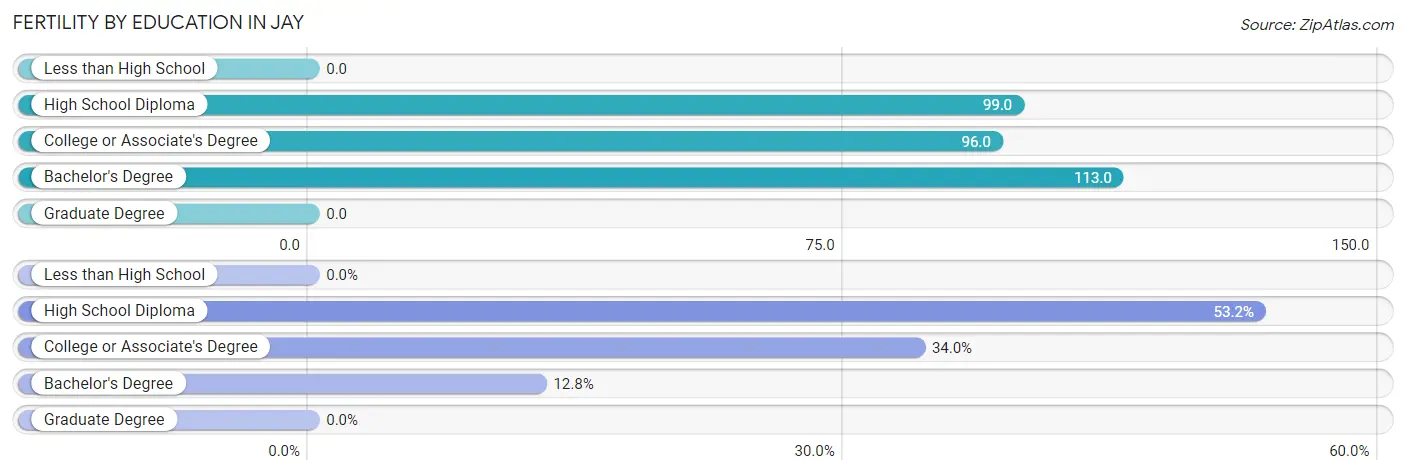
| Educational Attainment | Women with Births | Births / 1,000 Women |
| Less than High School | 0 (0.0%) | 0.0 |
| High School Diploma | 25 (53.2%) | 99.0 |
| College or Associate's Degree | 16 (34.0%) | 96.0 |
| Bachelor's Degree | 6 (12.8%) | 113.0 |
| Graduate Degree | 0 (0.0%) | 0.0 |
| Total | 47 (100.0%) | 72.0 |
Fertility by Education by Marriage Status in Jay
31.9% of women with births in Jay are unmarried. Women with the educational attainment of college or associate's degree are most likely to be married with 100.0% of them married at childbirth, while women with the educational attainment of high school diploma are least likely to be married with 60.0% of them unmarried at childbirth.
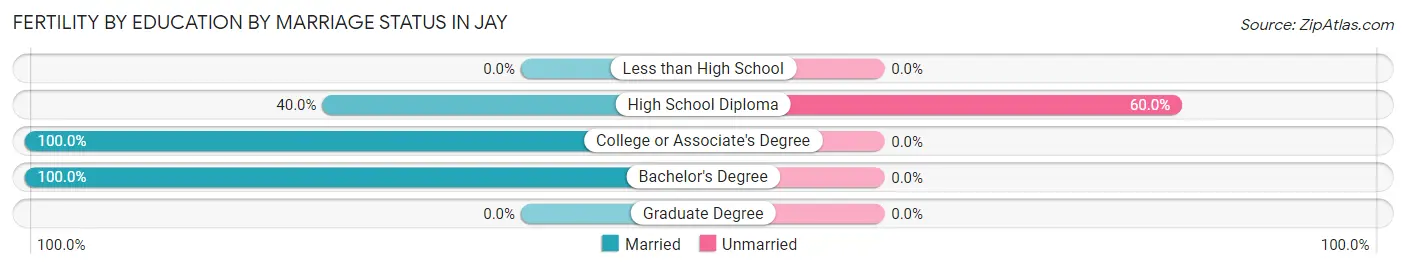
| Educational Attainment | Married | Unmarried |
| Less than High School | 0 (0.0%) | 0 (0.0%) |
| High School Diploma | 10 (40.0%) | 15 (60.0%) |
| College or Associate's Degree | 16 (100.0%) | 0 (0.0%) |
| Bachelor's Degree | 6 (100.0%) | 0 (0.0%) |
| Graduate Degree | 0 (0.0%) | 0 (0.0%) |
| Total | 32 (68.1%) | 15 (31.9%) |
Employment Characteristics in Jay
Employment by Class of Employer in Jay
Among the 1,022 employed individuals in Jay, private company employees (709 | 69.4%), not-for-profit organizations (110 | 10.8%), and self-employed (not incorporated) (50 | 4.9%) make up the most common classes of employment.
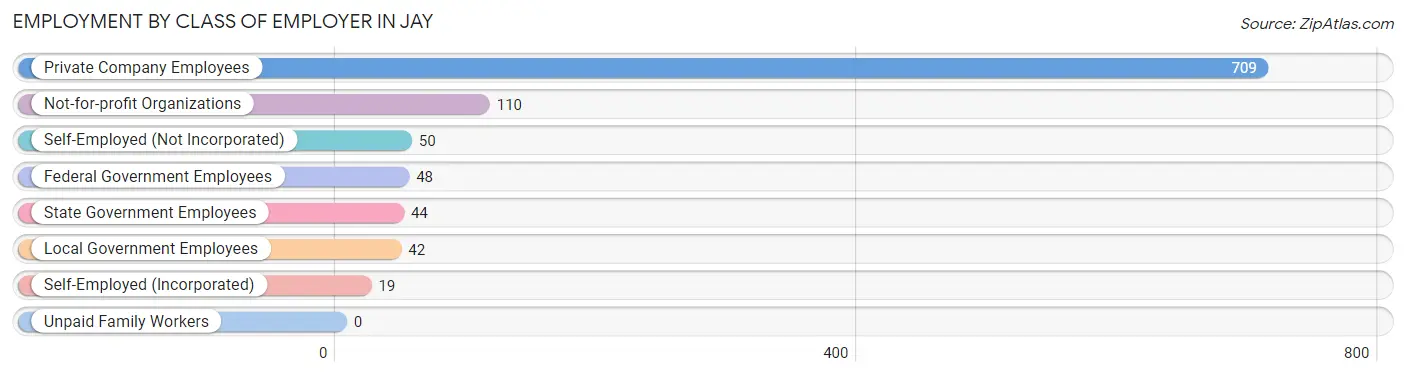
| Employer Class | # Employees | % Employees |
| Private Company Employees | 709 | 69.4% |
| Self-Employed (Incorporated) | 19 | 1.9% |
| Self-Employed (Not Incorporated) | 50 | 4.9% |
| Not-for-profit Organizations | 110 | 10.8% |
| Local Government Employees | 42 | 4.1% |
| State Government Employees | 44 | 4.3% |
| Federal Government Employees | 48 | 4.7% |
| Unpaid Family Workers | 0 | 0.0% |
| Total | 1,022 | 100.0% |
Employment Status by Age in Jay
According to the labor force statistics for Jay, out of the total population over 16 years of age (2,256), 51.1% or 1,153 individuals are in the labor force, with 10.3% or 119 of them unemployed. The age group with the highest labor force participation rate is 30 to 34 years, with 76.6% or 144 individuals in the labor force. Within the labor force, the 25 to 29 years age range has the highest percentage of unemployed individuals, with 17.6% or 27 of them being unemployed.
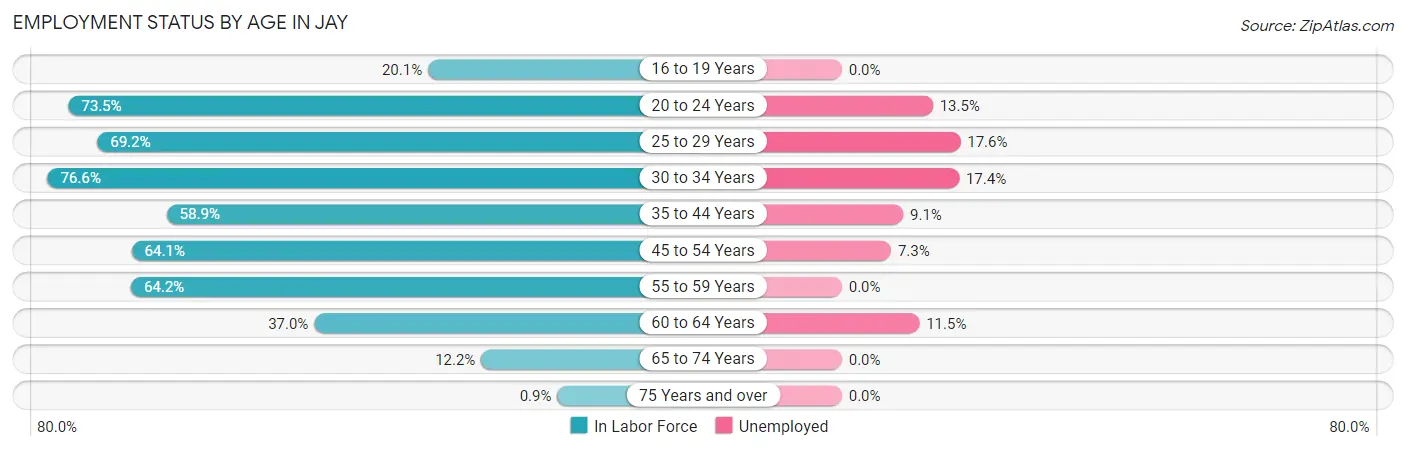
| Age Bracket | In Labor Force | Unemployed |
| 16 to 19 Years | 32 (20.1%) | 0 (0.0%) |
| 20 to 24 Years | 155 (73.5%) | 21 (13.5%) |
| 25 to 29 Years | 153 (69.2%) | 27 (17.6%) |
| 30 to 34 Years | 144 (76.6%) | 25 (17.4%) |
| 35 to 44 Years | 275 (58.9%) | 25 (9.1%) |
| 45 to 54 Years | 164 (64.1%) | 12 (7.3%) |
| 55 to 59 Years | 120 (64.2%) | 0 (0.0%) |
| 60 to 64 Years | 78 (37.0%) | 9 (11.5%) |
| 65 to 74 Years | 30 (12.2%) | 0 (0.0%) |
| 75 Years and over | 1 (0.9%) | 0 (0.0%) |
| Total | 1,153 (51.1%) | 119 (10.3%) |
Employment Status by Educational Attainment in Jay
According to labor force statistics for Jay, 61.0% of individuals (933) out of the total population between 25 and 64 years of age (1,530) are in the labor force, with 10.5% or 98 of them being unemployed. The group with the highest labor force participation rate are those with the educational attainment of bachelor's degree or higher, with 82.6% or 114 individuals in the labor force. Within the labor force, individuals with less than high school education have the highest percentage of unemployment, with 19.0% or 29 of them being unemployed.
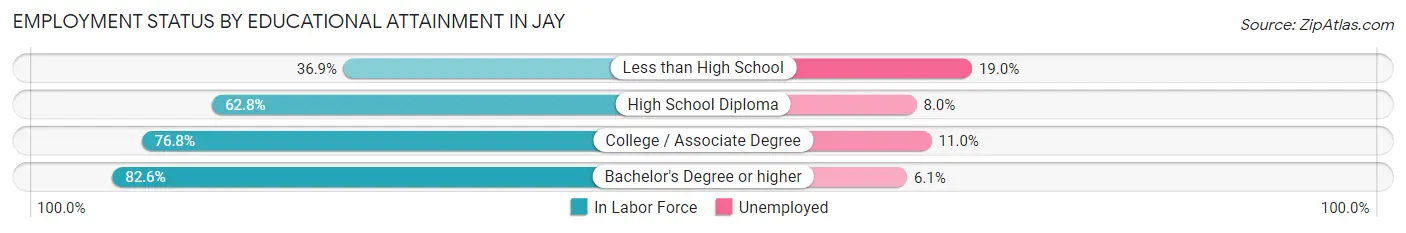
| Educational Attainment | In Labor Force | Unemployed |
| Less than High School | 153 (36.9%) | 79 (19.0%) |
| High School Diploma | 375 (62.8%) | 48 (8.0%) |
| College / Associate Degree | 292 (76.8%) | 42 (11.0%) |
| Bachelor's Degree or higher | 114 (82.6%) | 8 (6.1%) |
| Total | 933 (61.0%) | 161 (10.5%) |
Employment Occupations by Sex in Jay
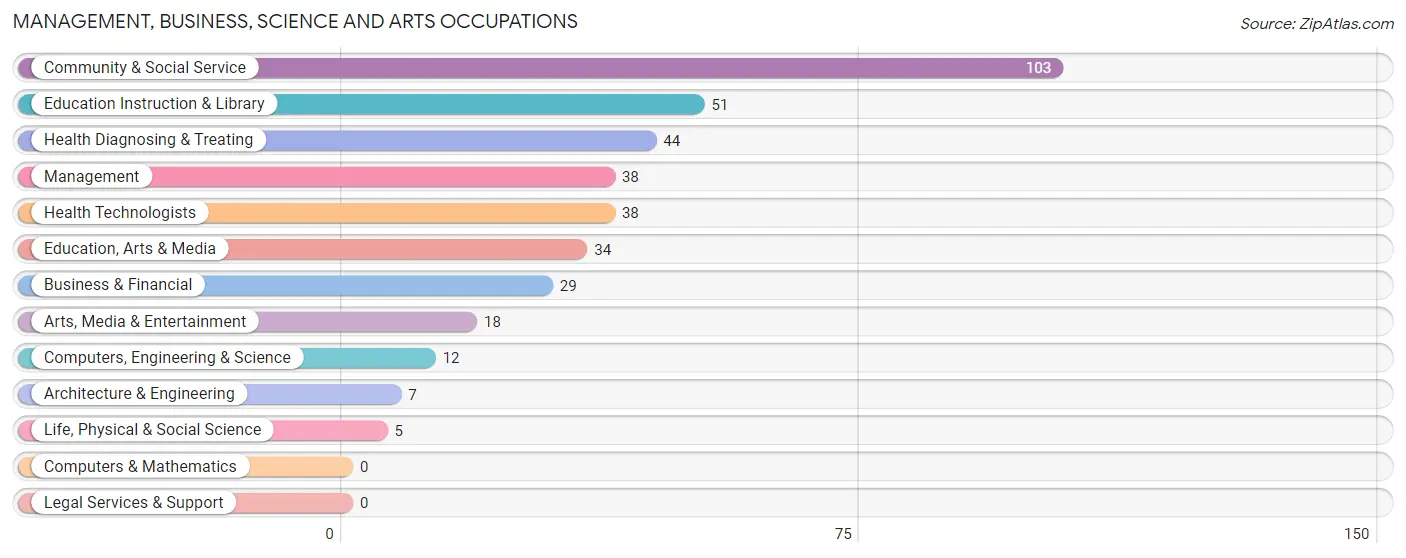
Management, Business, Science and Arts Occupations
The most common Management, Business, Science and Arts occupations in Jay are Community & Social Service (103 | 10.0%), Education Instruction & Library (51 | 4.9%), Health Diagnosing & Treating (44 | 4.3%), Management (38 | 3.7%), and Health Technologists (38 | 3.7%).
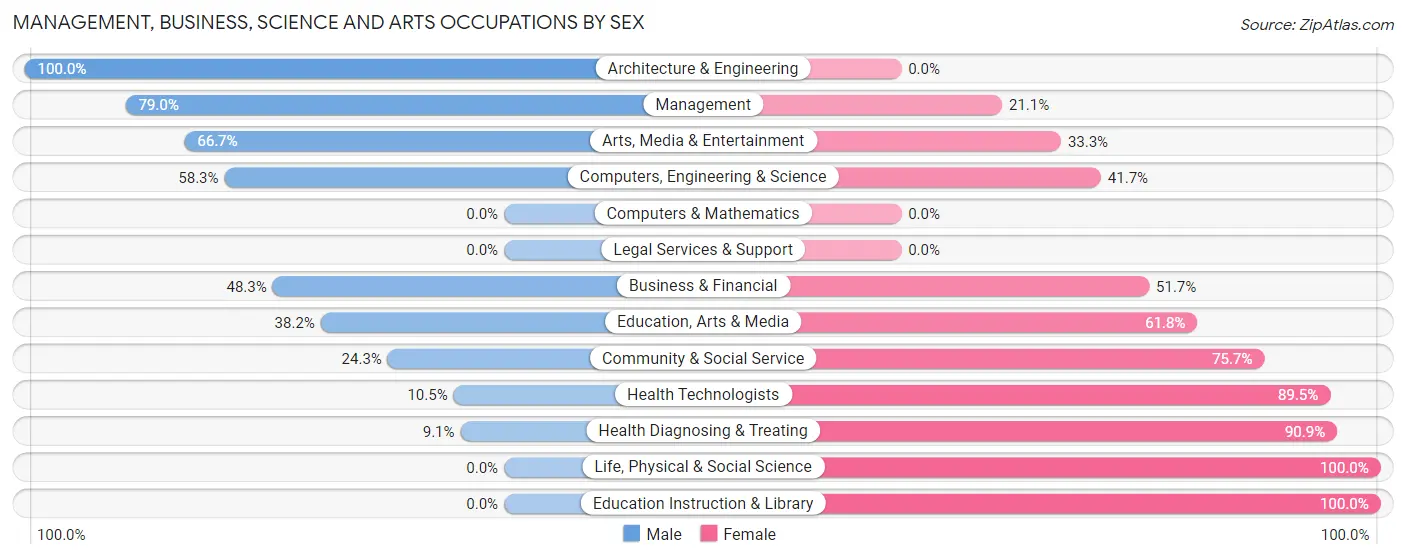
Management, Business, Science and Arts Occupations by Sex
Within the Management, Business, Science and Arts occupations in Jay, the most male-oriented occupations are Architecture & Engineering (100.0%), Management (78.9%), and Arts, Media & Entertainment (66.7%), while the most female-oriented occupations are Life, Physical & Social Science (100.0%), Education Instruction & Library (100.0%), and Health Diagnosing & Treating (90.9%).
| Occupation | Male | Female |
| Management | 30 (78.9%) | 8 (21.0%) |
| Business & Financial | 14 (48.3%) | 15 (51.7%) |
| Computers, Engineering & Science | 7 (58.3%) | 5 (41.7%) |
| Computers & Mathematics | 0 (0.0%) | 0 (0.0%) |
| Architecture & Engineering | 7 (100.0%) | 0 (0.0%) |
| Life, Physical & Social Science | 0 (0.0%) | 5 (100.0%) |
| Community & Social Service | 25 (24.3%) | 78 (75.7%) |
| Education, Arts & Media | 13 (38.2%) | 21 (61.8%) |
| Legal Services & Support | 0 (0.0%) | 0 (0.0%) |
| Education Instruction & Library | 0 (0.0%) | 51 (100.0%) |
| Arts, Media & Entertainment | 12 (66.7%) | 6 (33.3%) |
| Health Diagnosing & Treating | 4 (9.1%) | 40 (90.9%) |
| Health Technologists | 4 (10.5%) | 34 (89.5%) |
| Total (Category) | 80 (35.4%) | 146 (64.6%) |
| Total (Overall) | 556 (53.8%) | 477 (46.2%) |
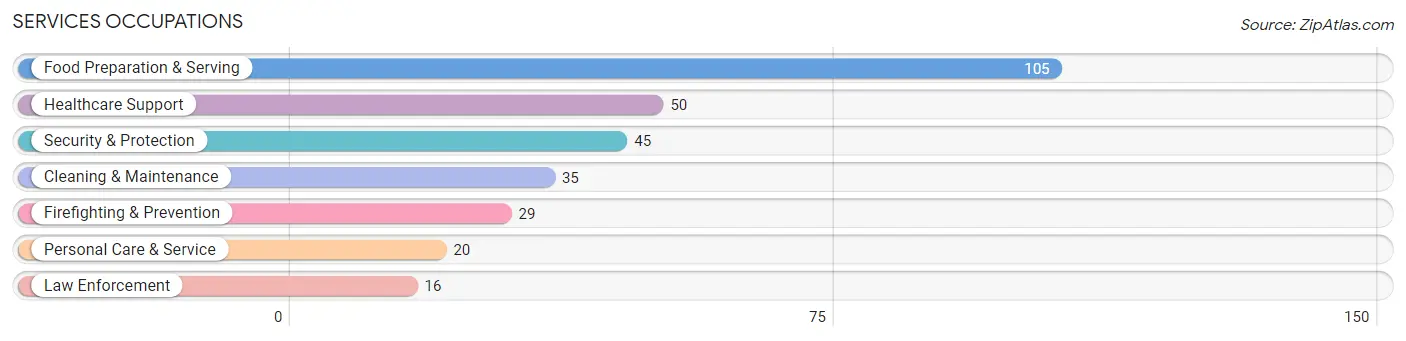
Services Occupations
The most common Services occupations in Jay are Food Preparation & Serving (105 | 10.2%), Healthcare Support (50 | 4.8%), Security & Protection (45 | 4.4%), Cleaning & Maintenance (35 | 3.4%), and Firefighting & Prevention (29 | 2.8%).
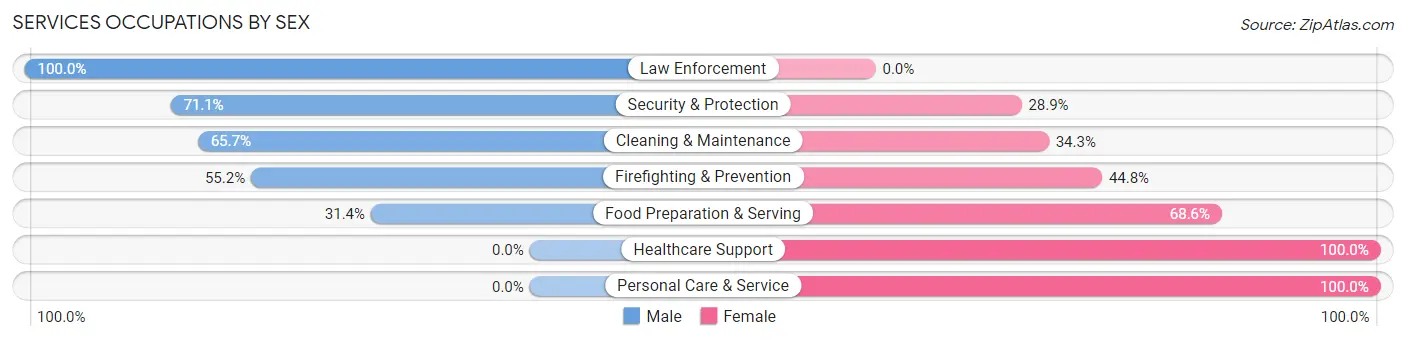
Services Occupations by Sex
Within the Services occupations in Jay, the most male-oriented occupations are Law Enforcement (100.0%), Security & Protection (71.1%), and Cleaning & Maintenance (65.7%), while the most female-oriented occupations are Healthcare Support (100.0%), Personal Care & Service (100.0%), and Food Preparation & Serving (68.6%).
| Occupation | Male | Female |
| Healthcare Support | 0 (0.0%) | 50 (100.0%) |
| Security & Protection | 32 (71.1%) | 13 (28.9%) |
| Firefighting & Prevention | 16 (55.2%) | 13 (44.8%) |
| Law Enforcement | 16 (100.0%) | 0 (0.0%) |
| Food Preparation & Serving | 33 (31.4%) | 72 (68.6%) |
| Cleaning & Maintenance | 23 (65.7%) | 12 (34.3%) |
| Personal Care & Service | 0 (0.0%) | 20 (100.0%) |
| Total (Category) | 88 (34.5%) | 167 (65.5%) |
| Total (Overall) | 556 (53.8%) | 477 (46.2%) |
Sales and Office Occupations
The most common Sales and Office occupations in Jay are Office & Administration (96 | 9.3%), and Sales & Related (71 | 6.9%).
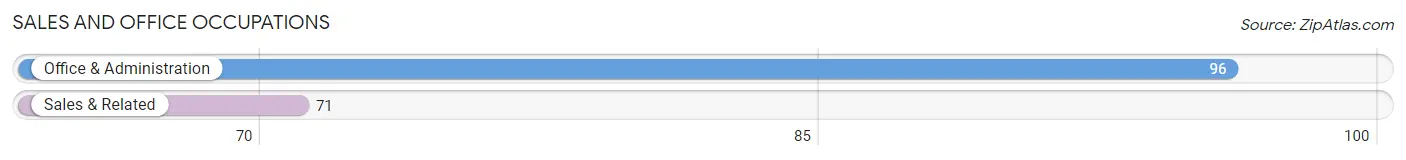
Sales and Office Occupations by Sex
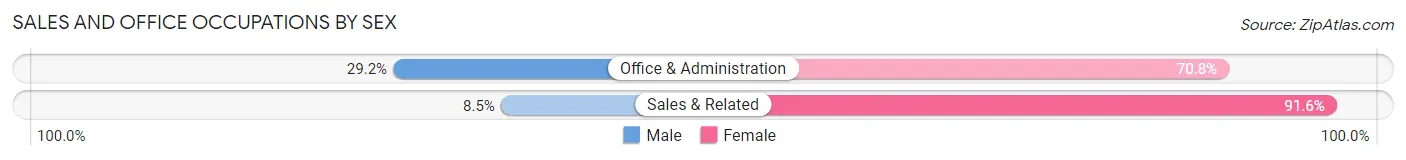
| Occupation | Male | Female |
| Sales & Related | 6 (8.5%) | 65 (91.5%) |
| Office & Administration | 28 (29.2%) | 68 (70.8%) |
| Total (Category) | 34 (20.4%) | 133 (79.6%) |
| Total (Overall) | 556 (53.8%) | 477 (46.2%) |
Natural Resources, Construction and Maintenance Occupations
The most common Natural Resources, Construction and Maintenance occupations in Jay are Construction & Extraction (64 | 6.2%), Installation, Maintenance & Repair (58 | 5.6%), and Farming, Fishing & Forestry (21 | 2.0%).
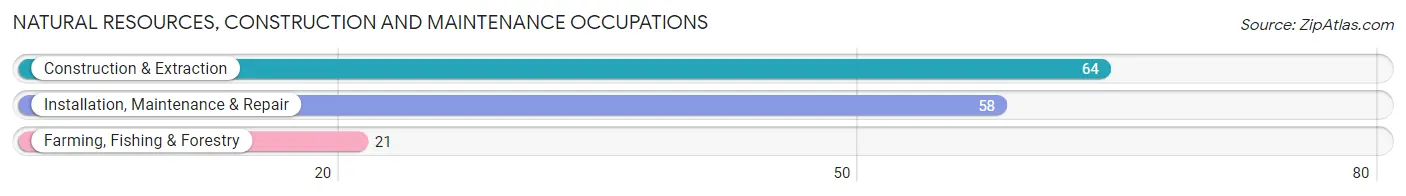
Natural Resources, Construction and Maintenance Occupations by Sex
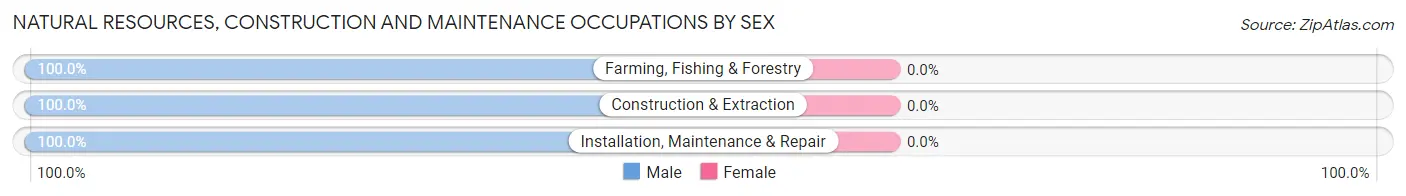
| Occupation | Male | Female |
| Farming, Fishing & Forestry | 21 (100.0%) | 0 (0.0%) |
| Construction & Extraction | 64 (100.0%) | 0 (0.0%) |
| Installation, Maintenance & Repair | 58 (100.0%) | 0 (0.0%) |
| Total (Category) | 143 (100.0%) | 0 (0.0%) |
| Total (Overall) | 556 (53.8%) | 477 (46.2%) |
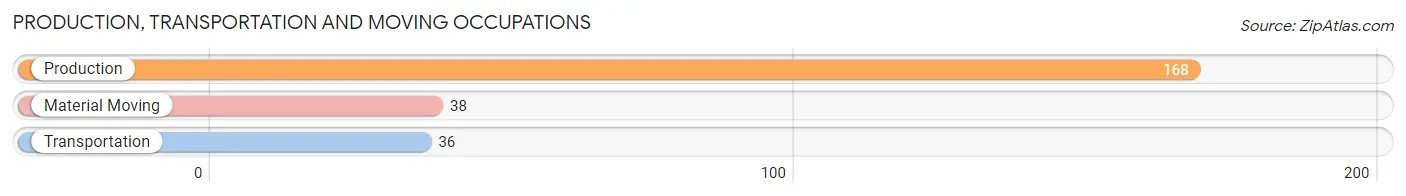
Production, Transportation and Moving Occupations
The most common Production, Transportation and Moving occupations in Jay are Production (168 | 16.3%), Material Moving (38 | 3.7%), and Transportation (36 | 3.5%).
Production, Transportation and Moving Occupations by Sex
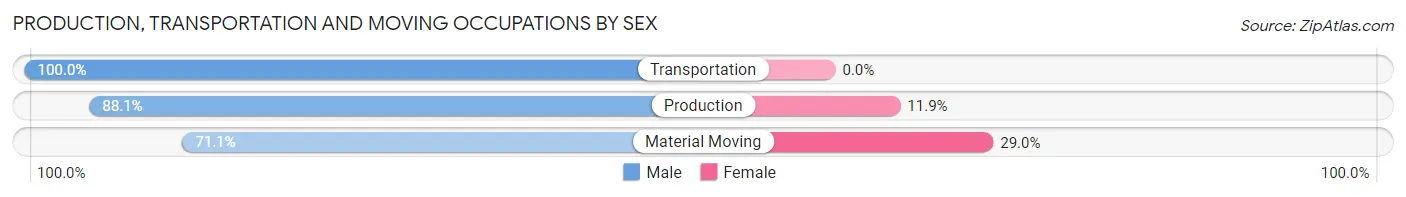
| Occupation | Male | Female |
| Production | 148 (88.1%) | 20 (11.9%) |
| Transportation | 36 (100.0%) | 0 (0.0%) |
| Material Moving | 27 (71.1%) | 11 (28.9%) |
| Total (Category) | 211 (87.2%) | 31 (12.8%) |
| Total (Overall) | 556 (53.8%) | 477 (46.2%) |
Employment Industries by Sex in Jay
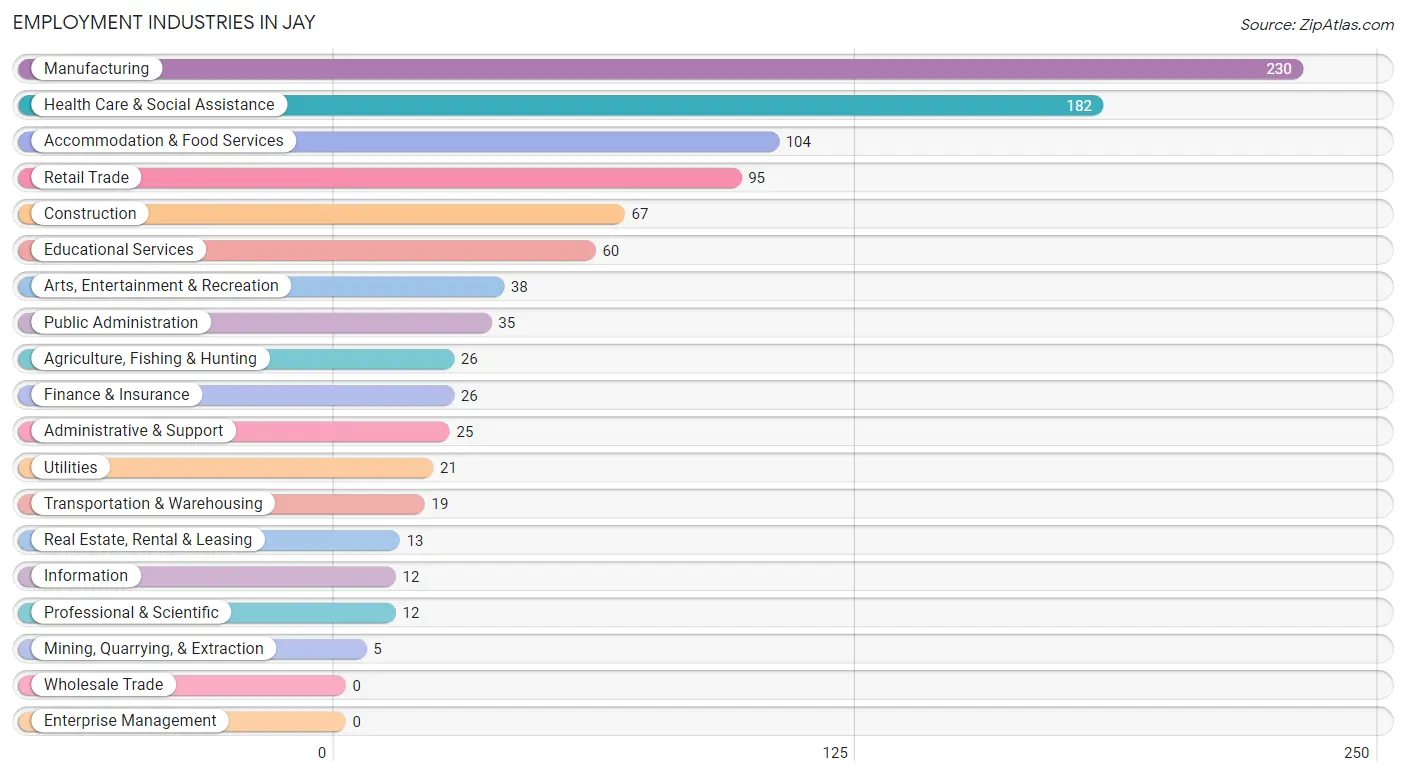
Employment Industries in Jay
The major employment industries in Jay include Manufacturing (230 | 22.3%), Health Care & Social Assistance (182 | 17.6%), Accommodation & Food Services (104 | 10.1%), Retail Trade (95 | 9.2%), and Construction (67 | 6.5%).
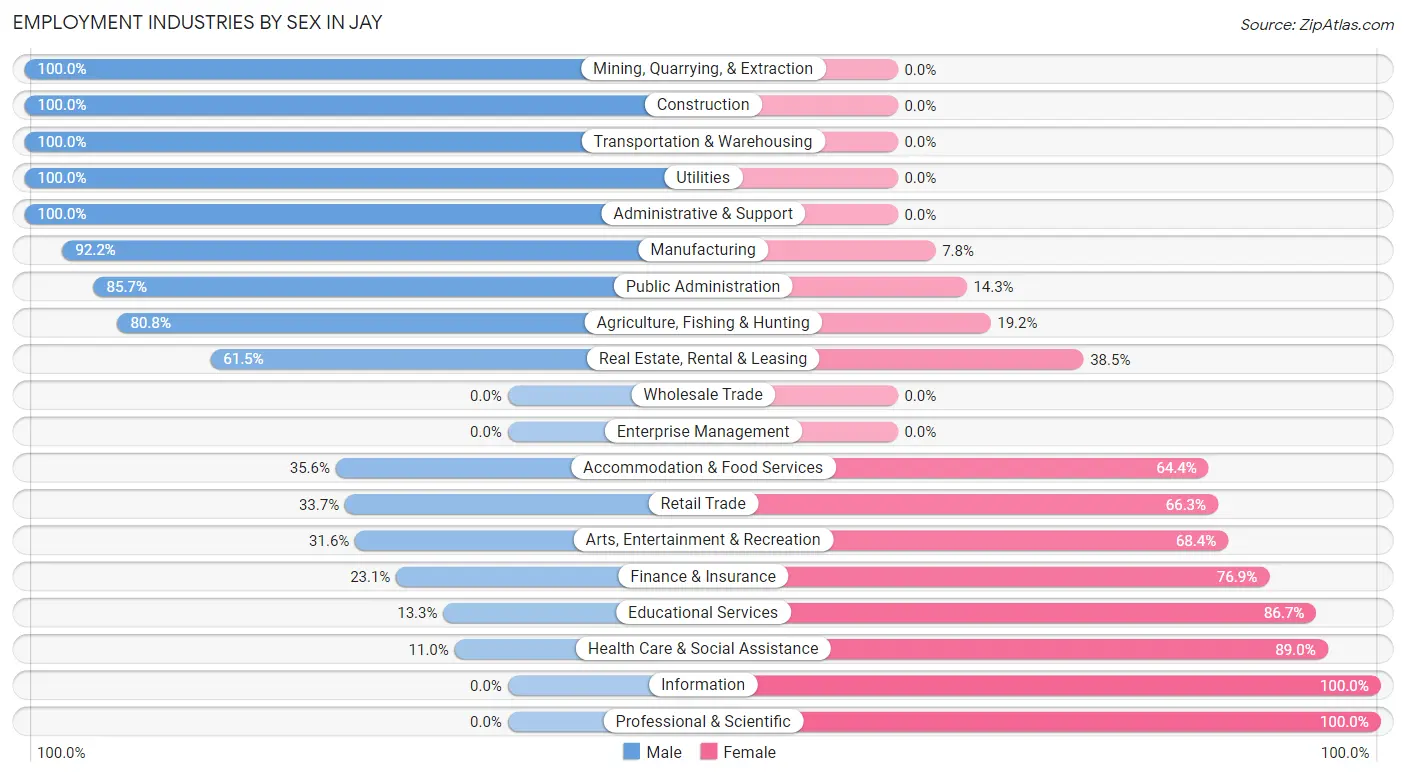
Employment Industries by Sex in Jay
The Jay industries that see more men than women are Mining, Quarrying, & Extraction (100.0%), Construction (100.0%), and Transportation & Warehousing (100.0%), whereas the industries that tend to have a higher number of women are Information (100.0%), Professional & Scientific (100.0%), and Health Care & Social Assistance (89.0%).
| Industry | Male | Female |
| Agriculture, Fishing & Hunting | 21 (80.8%) | 5 (19.2%) |
| Mining, Quarrying, & Extraction | 5 (100.0%) | 0 (0.0%) |
| Construction | 67 (100.0%) | 0 (0.0%) |
| Manufacturing | 212 (92.2%) | 18 (7.8%) |
| Wholesale Trade | 0 (0.0%) | 0 (0.0%) |
| Retail Trade | 32 (33.7%) | 63 (66.3%) |
| Transportation & Warehousing | 19 (100.0%) | 0 (0.0%) |
| Utilities | 21 (100.0%) | 0 (0.0%) |
| Information | 0 (0.0%) | 12 (100.0%) |
| Finance & Insurance | 6 (23.1%) | 20 (76.9%) |
| Real Estate, Rental & Leasing | 8 (61.5%) | 5 (38.5%) |
| Professional & Scientific | 0 (0.0%) | 12 (100.0%) |
| Enterprise Management | 0 (0.0%) | 0 (0.0%) |
| Administrative & Support | 25 (100.0%) | 0 (0.0%) |
| Educational Services | 8 (13.3%) | 52 (86.7%) |
| Health Care & Social Assistance | 20 (11.0%) | 162 (89.0%) |
| Arts, Entertainment & Recreation | 12 (31.6%) | 26 (68.4%) |
| Accommodation & Food Services | 37 (35.6%) | 67 (64.4%) |
| Public Administration | 30 (85.7%) | 5 (14.3%) |
| Total | 556 (53.8%) | 477 (46.2%) |
Education in Jay
School Enrollment in Jay
The most common levels of schooling among the 642 students in Jay are elementary school (157 | 24.4%), high school (151 | 23.5%), and middle school (142 | 22.1%).
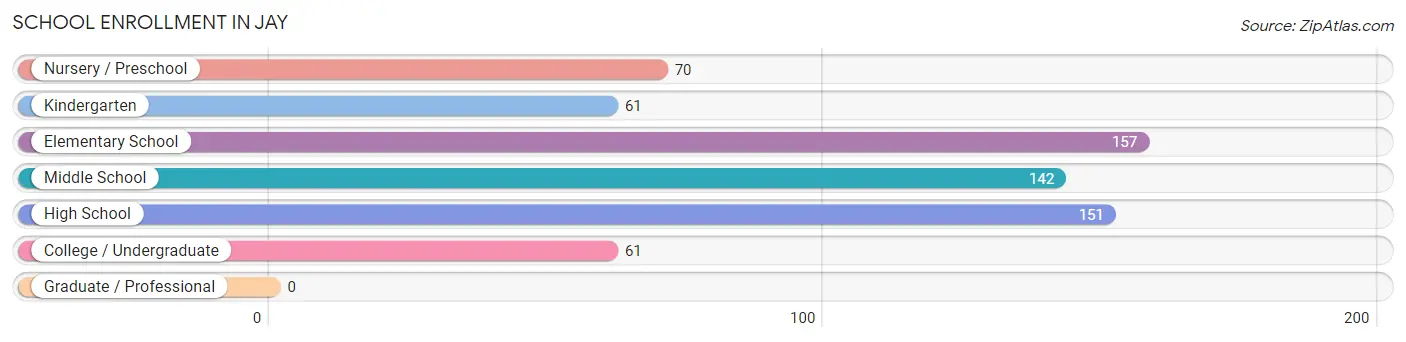
| School Level | # Students | % Students |
| Nursery / Preschool | 70 | 10.9% |
| Kindergarten | 61 | 9.5% |
| Elementary School | 157 | 24.4% |
| Middle School | 142 | 22.1% |
| High School | 151 | 23.5% |
| College / Undergraduate | 61 | 9.5% |
| Graduate / Professional | 0 | 0.0% |
| Total | 642 | 100.0% |
School Enrollment by Age by Funding Source in Jay
Out of a total of 642 students who are enrolled in schools in Jay, 25 (3.9%) attend a private institution, while the remaining 617 (96.1%) are enrolled in public schools. The age group of 20 to 24 year olds has the highest likelihood of being enrolled in private schools, with 7 (46.7% in the age bracket) enrolled. Conversely, the age group of 3 to 4 year olds has the lowest likelihood of being enrolled in a private school, with 47 (100.0% in the age bracket) attending a public institution.
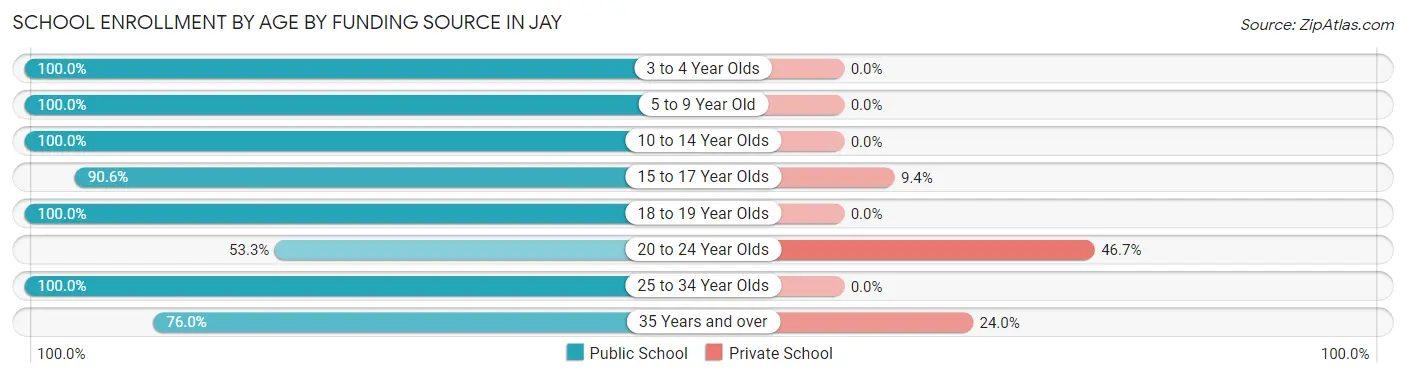
| Age Bracket | Public School | Private School |
| 3 to 4 Year Olds | 47 (100.0%) | 0 (0.0%) |
| 5 to 9 Year Old | 184 (100.0%) | 0 (0.0%) |
| 10 to 14 Year Olds | 199 (100.0%) | 0 (0.0%) |
| 15 to 17 Year Olds | 116 (90.6%) | 12 (9.4%) |
| 18 to 19 Year Olds | 24 (100.0%) | 0 (0.0%) |
| 20 to 24 Year Olds | 8 (53.3%) | 7 (46.7%) |
| 25 to 34 Year Olds | 20 (100.0%) | 0 (0.0%) |
| 35 Years and over | 19 (76.0%) | 6 (24.0%) |
| Total | 617 (96.1%) | 25 (3.9%) |
Educational Attainment by Field of Study in Jay
Education (57 | 29.5%), business (36 | 18.6%), science & technology (19 | 9.8%), psychology (16 | 8.3%), and multidisciplinary studies (16 | 8.3%) are the most common fields of study among 193 individuals in Jay who have obtained a bachelor's degree or higher.
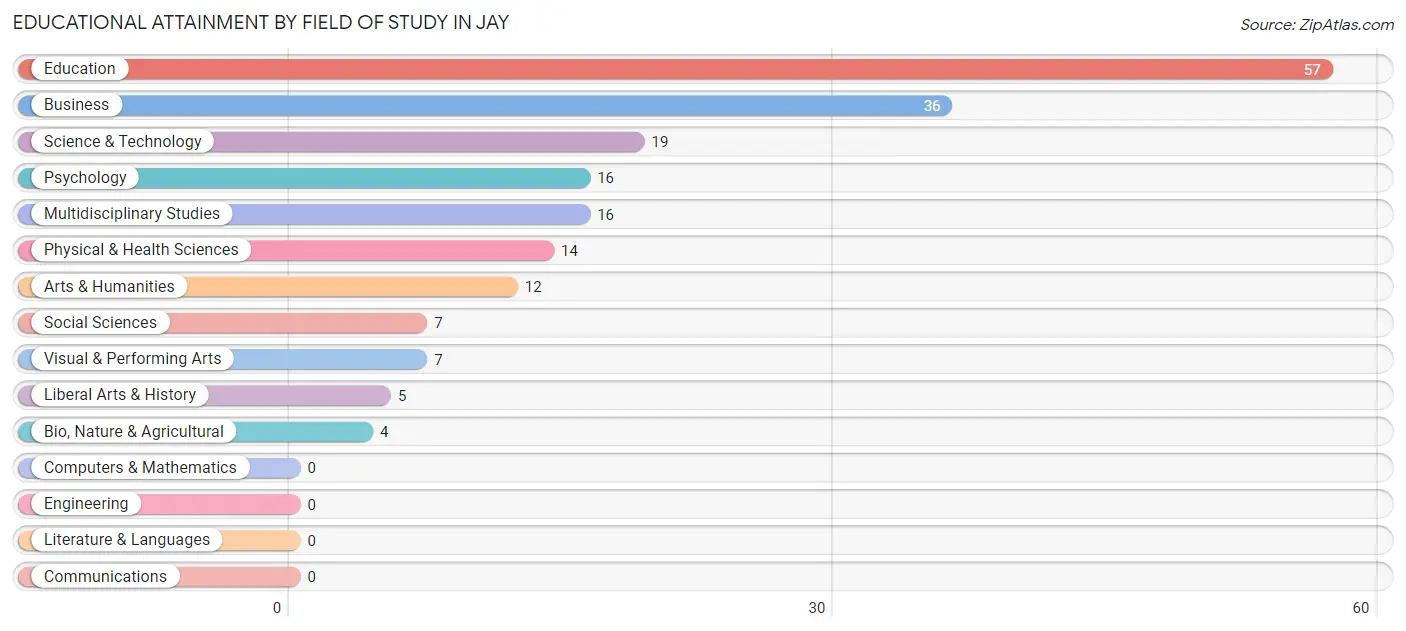
| Field of Study | # Graduates | % Graduates |
| Computers & Mathematics | 0 | 0.0% |
| Bio, Nature & Agricultural | 4 | 2.1% |
| Physical & Health Sciences | 14 | 7.2% |
| Psychology | 16 | 8.3% |
| Social Sciences | 7 | 3.6% |
| Engineering | 0 | 0.0% |
| Multidisciplinary Studies | 16 | 8.3% |
| Science & Technology | 19 | 9.8% |
| Business | 36 | 18.6% |
| Education | 57 | 29.5% |
| Literature & Languages | 0 | 0.0% |
| Liberal Arts & History | 5 | 2.6% |
| Visual & Performing Arts | 7 | 3.6% |
| Communications | 0 | 0.0% |
| Arts & Humanities | 12 | 6.2% |
| Total | 193 | 100.0% |
Transportation & Commute in Jay
Vehicle Availability by Sex in Jay
The most prevalent vehicle ownership categories in Jay are males with 3 vehicles (147, accounting for 27.0%) and females with 3 vehicles (94, making up 30.8%).
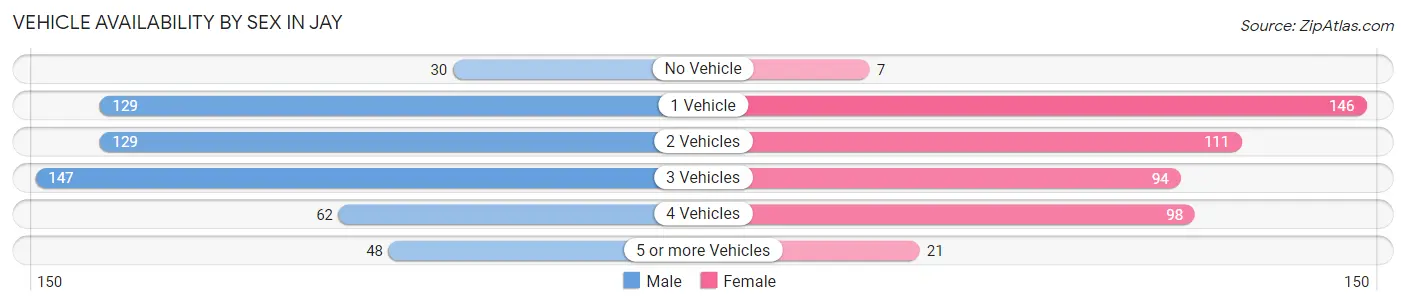
| Vehicles Available | Male | Female |
| No Vehicle | 30 (5.5%) | 7 (1.5%) |
| 1 Vehicle | 129 (23.7%) | 146 (30.6%) |
| 2 Vehicles | 129 (23.7%) | 111 (23.3%) |
| 3 Vehicles | 147 (27.0%) | 94 (19.7%) |
| 4 Vehicles | 62 (11.4%) | 98 (20.5%) |
| 5 or more Vehicles | 48 (8.8%) | 21 (4.4%) |
| Total | 545 (100.0%) | 477 (100.0%) |
Commute Time in Jay
The most frequently occuring commute durations in Jay are 5 to 9 minutes (217 commuters, 21.5%), 20 to 24 minutes (151 commuters, 15.0%), and 45 to 59 minutes (117 commuters, 11.6%).
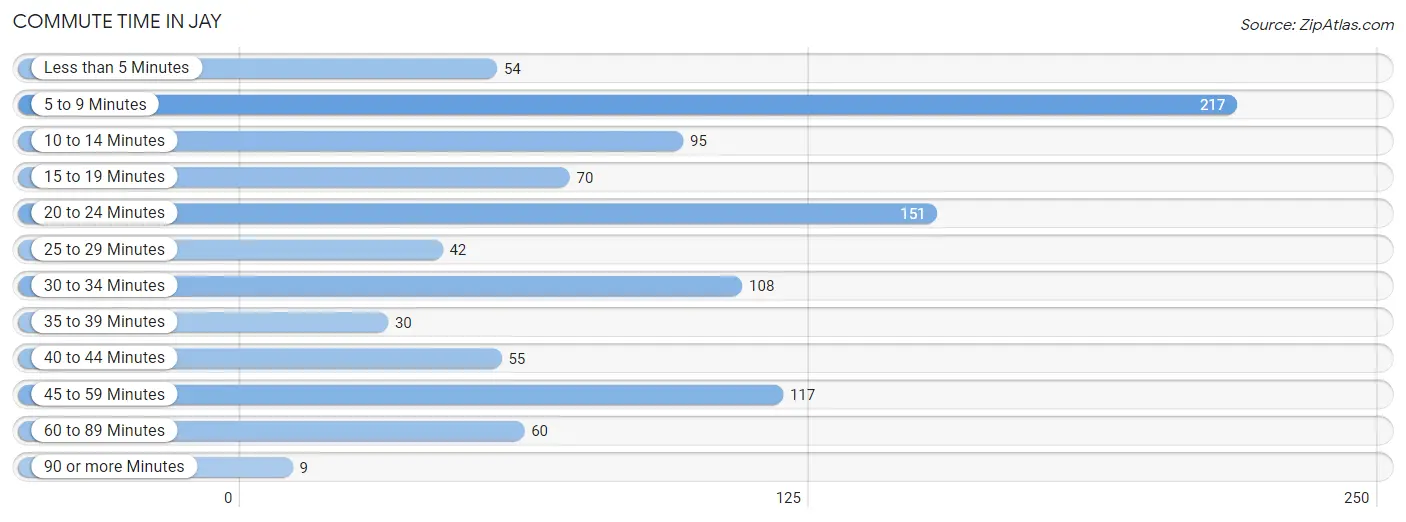
| Commute Time | # Commuters | % Commuters |
| Less than 5 Minutes | 54 | 5.4% |
| 5 to 9 Minutes | 217 | 21.5% |
| 10 to 14 Minutes | 95 | 9.4% |
| 15 to 19 Minutes | 70 | 6.9% |
| 20 to 24 Minutes | 151 | 15.0% |
| 25 to 29 Minutes | 42 | 4.2% |
| 30 to 34 Minutes | 108 | 10.7% |
| 35 to 39 Minutes | 30 | 3.0% |
| 40 to 44 Minutes | 55 | 5.5% |
| 45 to 59 Minutes | 117 | 11.6% |
| 60 to 89 Minutes | 60 | 5.9% |
| 90 or more Minutes | 9 | 0.9% |
Commute Time by Sex in Jay
The most common commute times in Jay are 5 to 9 minutes (98 commuters, 18.0%) for males and 5 to 9 minutes (119 commuters, 25.7%) for females.
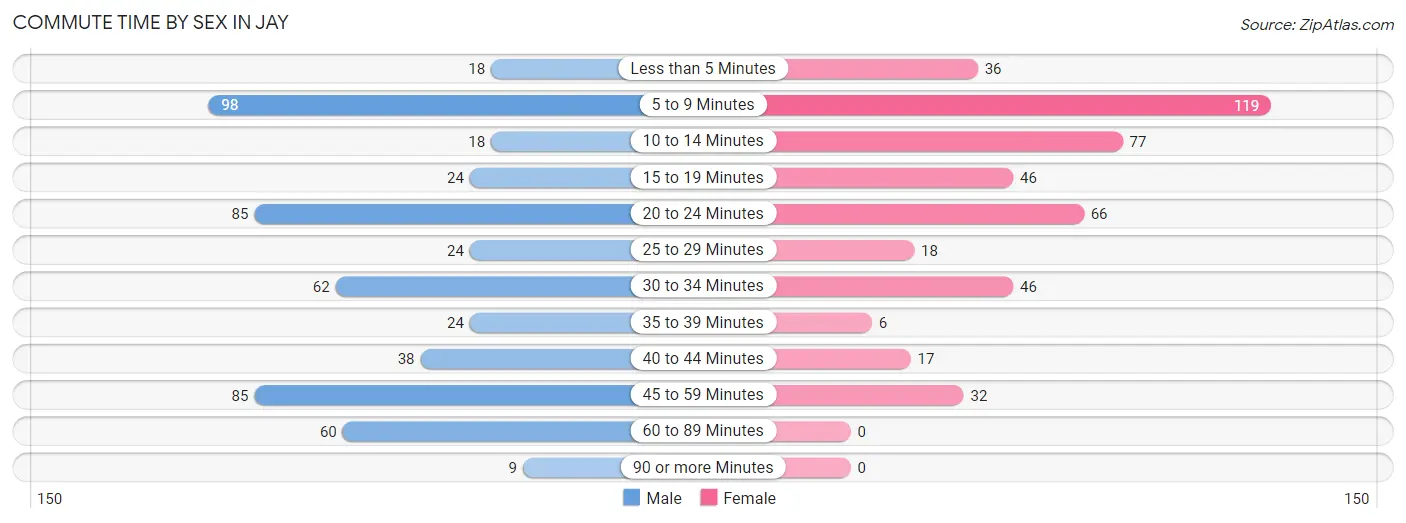
| Commute Time | Male | Female |
| Less than 5 Minutes | 18 (3.3%) | 36 (7.8%) |
| 5 to 9 Minutes | 98 (18.0%) | 119 (25.7%) |
| 10 to 14 Minutes | 18 (3.3%) | 77 (16.6%) |
| 15 to 19 Minutes | 24 (4.4%) | 46 (9.9%) |
| 20 to 24 Minutes | 85 (15.6%) | 66 (14.2%) |
| 25 to 29 Minutes | 24 (4.4%) | 18 (3.9%) |
| 30 to 34 Minutes | 62 (11.4%) | 46 (9.9%) |
| 35 to 39 Minutes | 24 (4.4%) | 6 (1.3%) |
| 40 to 44 Minutes | 38 (7.0%) | 17 (3.7%) |
| 45 to 59 Minutes | 85 (15.6%) | 32 (6.9%) |
| 60 to 89 Minutes | 60 (11.0%) | 0 (0.0%) |
| 90 or more Minutes | 9 (1.7%) | 0 (0.0%) |
Time of Departure to Work by Sex in Jay
The most frequent times of departure to work in Jay are 7:00 AM to 7:29 AM (86, 15.8%) for males and 7:30 AM to 7:59 AM (98, 21.2%) for females.
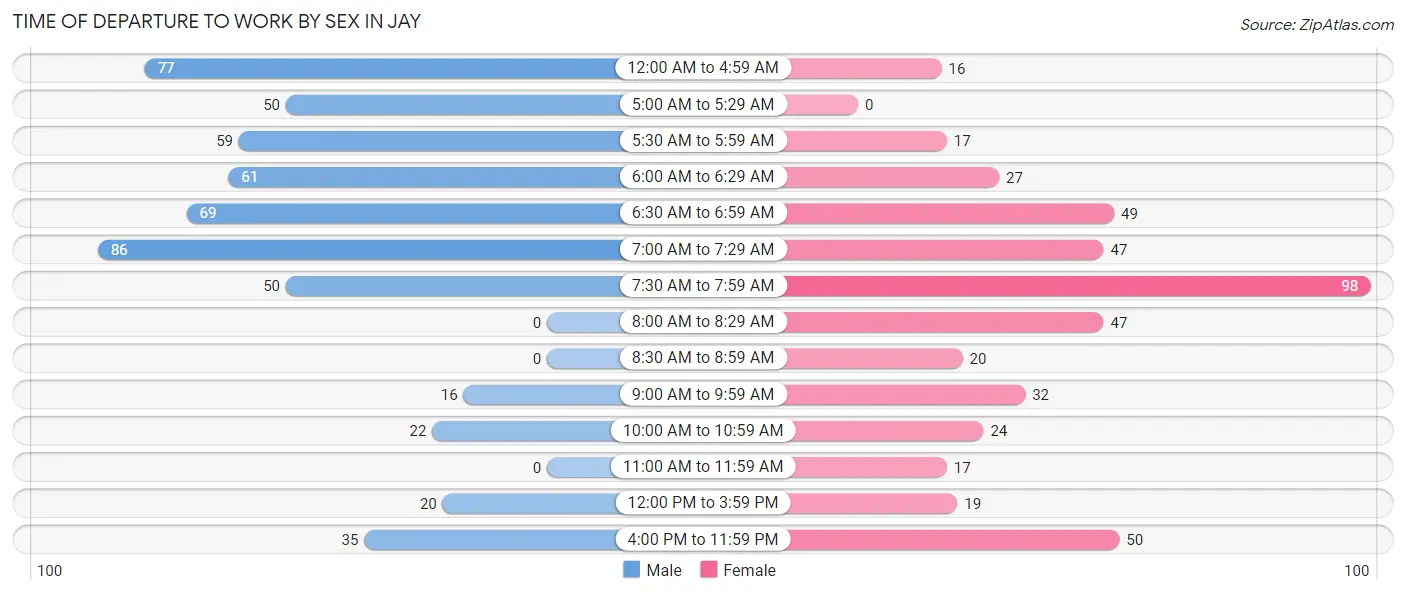
| Time of Departure | Male | Female |
| 12:00 AM to 4:59 AM | 77 (14.1%) | 16 (3.5%) |
| 5:00 AM to 5:29 AM | 50 (9.2%) | 0 (0.0%) |
| 5:30 AM to 5:59 AM | 59 (10.8%) | 17 (3.7%) |
| 6:00 AM to 6:29 AM | 61 (11.2%) | 27 (5.8%) |
| 6:30 AM to 6:59 AM | 69 (12.7%) | 49 (10.6%) |
| 7:00 AM to 7:29 AM | 86 (15.8%) | 47 (10.2%) |
| 7:30 AM to 7:59 AM | 50 (9.2%) | 98 (21.2%) |
| 8:00 AM to 8:29 AM | 0 (0.0%) | 47 (10.2%) |
| 8:30 AM to 8:59 AM | 0 (0.0%) | 20 (4.3%) |
| 9:00 AM to 9:59 AM | 16 (2.9%) | 32 (6.9%) |
| 10:00 AM to 10:59 AM | 22 (4.0%) | 24 (5.2%) |
| 11:00 AM to 11:59 AM | 0 (0.0%) | 17 (3.7%) |
| 12:00 PM to 3:59 PM | 20 (3.7%) | 19 (4.1%) |
| 4:00 PM to 11:59 PM | 35 (6.4%) | 50 (10.8%) |
| Total | 545 (100.0%) | 463 (100.0%) |
Housing Occupancy in Jay
Occupancy by Ownership in Jay
Of the total 957 dwellings in Jay, owner-occupied units account for 527 (55.1%), while renter-occupied units make up 430 (44.9%).
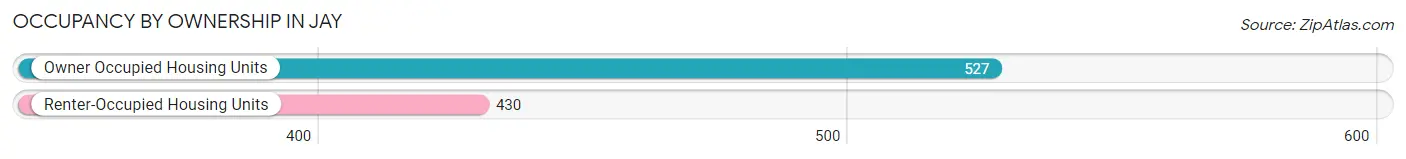
| Occupancy | # Housing Units | % Housing Units |
| Owner Occupied Housing Units | 527 | 55.1% |
| Renter-Occupied Housing Units | 430 | 44.9% |
| Total Occupied Housing Units | 957 | 100.0% |
Occupancy by Household Size in Jay
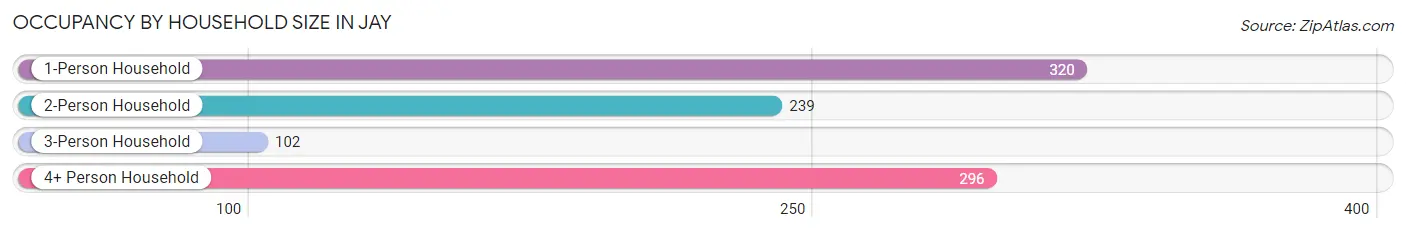
| Household Size | # Housing Units | % Housing Units |
| 1-Person Household | 320 | 33.4% |
| 2-Person Household | 239 | 25.0% |
| 3-Person Household | 102 | 10.7% |
| 4+ Person Household | 296 | 30.9% |
| Total Housing Units | 957 | 100.0% |
Occupancy by Ownership by Household Size in Jay
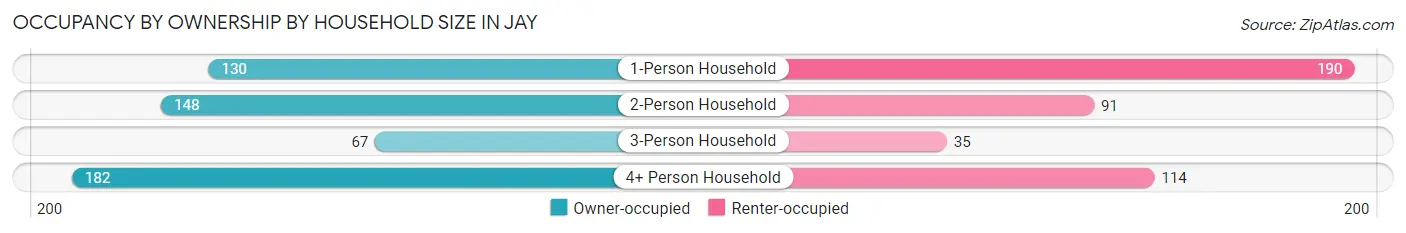
| Household Size | Owner-occupied | Renter-occupied |
| 1-Person Household | 130 (40.6%) | 190 (59.4%) |
| 2-Person Household | 148 (61.9%) | 91 (38.1%) |
| 3-Person Household | 67 (65.7%) | 35 (34.3%) |
| 4+ Person Household | 182 (61.5%) | 114 (38.5%) |
| Total Housing Units | 527 (55.1%) | 430 (44.9%) |
Occupancy by Educational Attainment in Jay
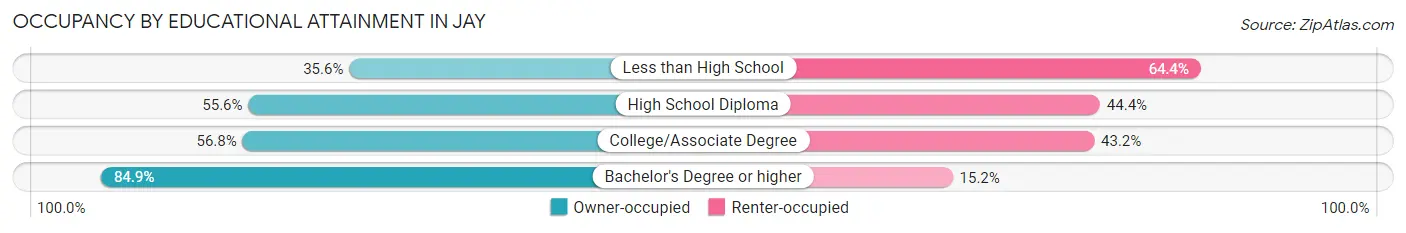
| Household Size | Owner-occupied | Renter-occupied |
| Less than High School | 67 (35.6%) | 121 (64.4%) |
| High School Diploma | 217 (55.6%) | 173 (44.4%) |
| College/Associate Degree | 159 (56.8%) | 121 (43.2%) |
| Bachelor's Degree or higher | 84 (84.9%) | 15 (15.1%) |
Occupancy by Age of Householder in Jay
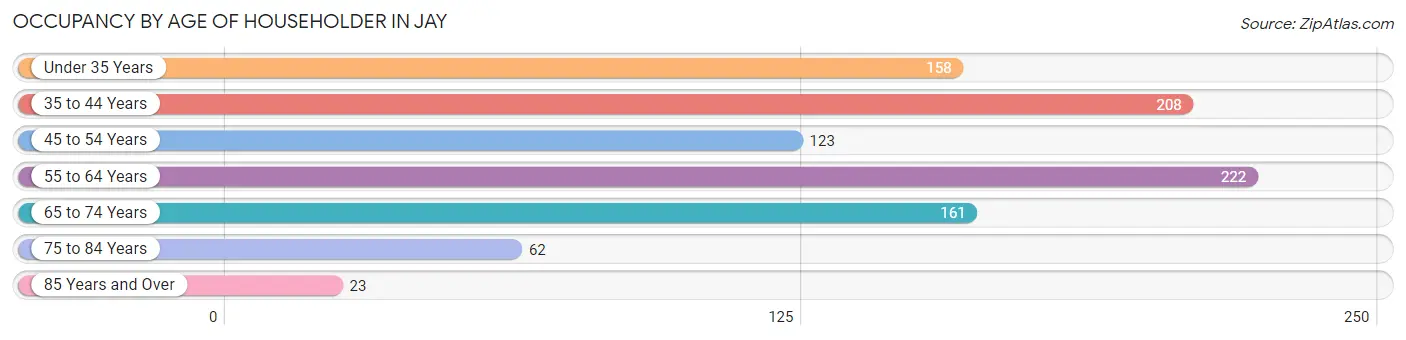
| Age Bracket | # Households | % Households |
| Under 35 Years | 158 | 16.5% |
| 35 to 44 Years | 208 | 21.7% |
| 45 to 54 Years | 123 | 12.9% |
| 55 to 64 Years | 222 | 23.2% |
| 65 to 74 Years | 161 | 16.8% |
| 75 to 84 Years | 62 | 6.5% |
| 85 Years and Over | 23 | 2.4% |
| Total | 957 | 100.0% |
Housing Finances in Jay
Median Income by Occupancy in Jay
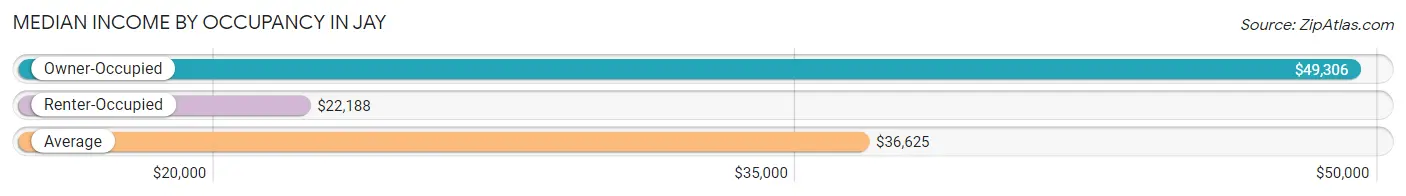
| Occupancy Type | # Households | Median Income |
| Owner-Occupied | 527 (55.1%) | $49,306 |
| Renter-Occupied | 430 (44.9%) | $22,188 |
| Average | 957 (100.0%) | $36,625 |
Occupancy by Householder Income Bracket in Jay
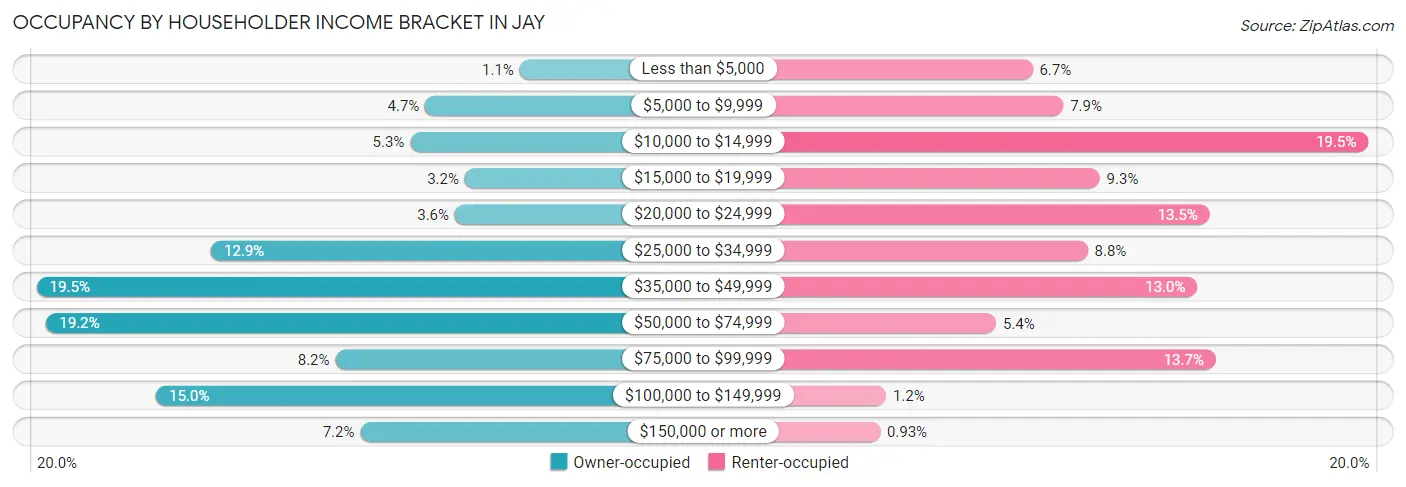
| Income Bracket | Owner-occupied | Renter-occupied |
| Less than $5,000 | 6 (1.1%) | 29 (6.7%) |
| $5,000 to $9,999 | 25 (4.7%) | 34 (7.9%) |
| $10,000 to $14,999 | 28 (5.3%) | 84 (19.5%) |
| $15,000 to $19,999 | 17 (3.2%) | 40 (9.3%) |
| $20,000 to $24,999 | 19 (3.6%) | 58 (13.5%) |
| $25,000 to $34,999 | 68 (12.9%) | 38 (8.8%) |
| $35,000 to $49,999 | 103 (19.5%) | 56 (13.0%) |
| $50,000 to $74,999 | 101 (19.2%) | 23 (5.3%) |
| $75,000 to $99,999 | 43 (8.2%) | 59 (13.7%) |
| $100,000 to $149,999 | 79 (15.0%) | 5 (1.2%) |
| $150,000 or more | 38 (7.2%) | 4 (0.9%) |
| Total | 527 (100.0%) | 430 (100.0%) |
Monthly Housing Cost Tiers in Jay
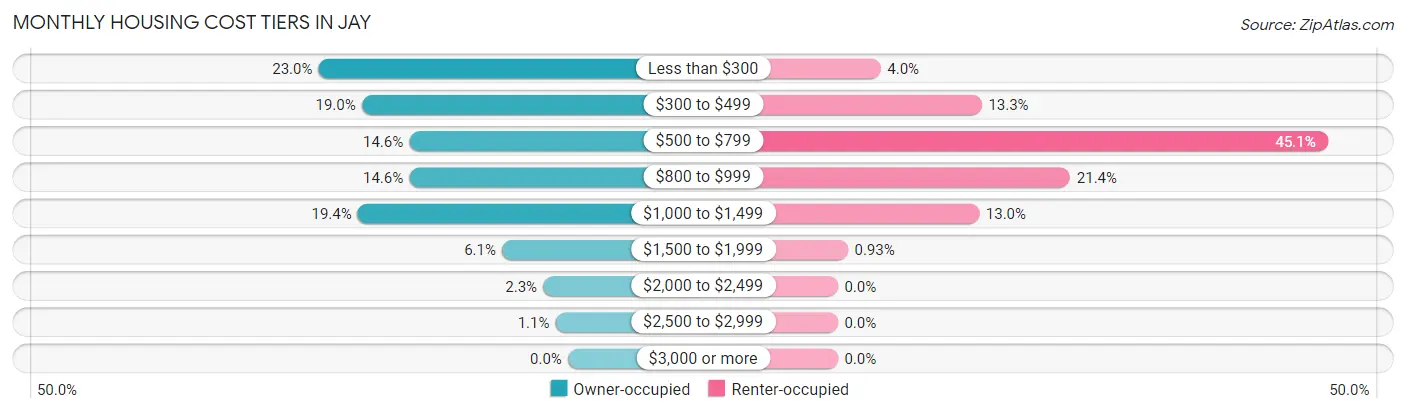
| Monthly Cost | Owner-occupied | Renter-occupied |
| Less than $300 | 121 (23.0%) | 17 (4.0%) |
| $300 to $499 | 100 (19.0%) | 57 (13.3%) |
| $500 to $799 | 77 (14.6%) | 194 (45.1%) |
| $800 to $999 | 77 (14.6%) | 92 (21.4%) |
| $1,000 to $1,499 | 102 (19.4%) | 56 (13.0%) |
| $1,500 to $1,999 | 32 (6.1%) | 4 (0.9%) |
| $2,000 to $2,499 | 12 (2.3%) | 0 (0.0%) |
| $2,500 to $2,999 | 6 (1.1%) | 0 (0.0%) |
| $3,000 or more | 0 (0.0%) | 0 (0.0%) |
| Total | 527 (100.0%) | 430 (100.0%) |
Physical Housing Characteristics in Jay
Housing Structures in Jay
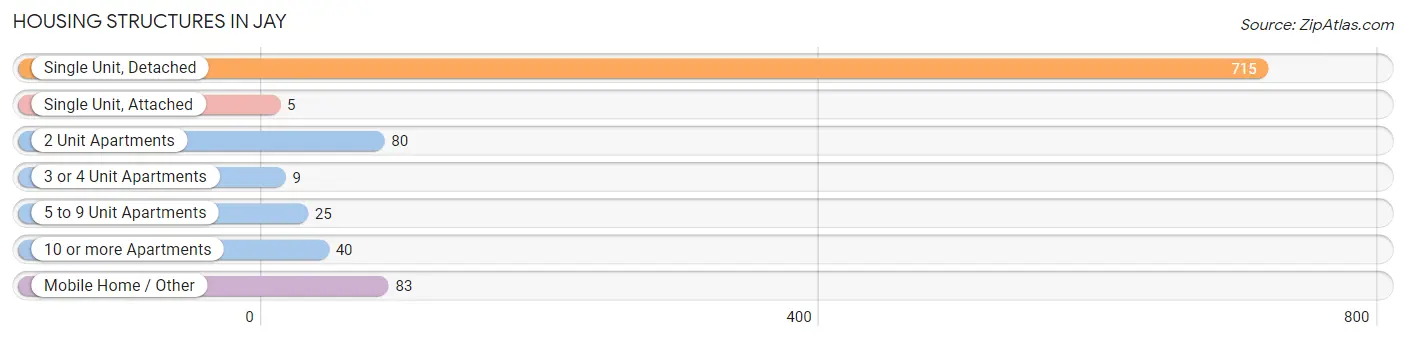
| Structure Type | # Housing Units | % Housing Units |
| Single Unit, Detached | 715 | 74.7% |
| Single Unit, Attached | 5 | 0.5% |
| 2 Unit Apartments | 80 | 8.4% |
| 3 or 4 Unit Apartments | 9 | 0.9% |
| 5 to 9 Unit Apartments | 25 | 2.6% |
| 10 or more Apartments | 40 | 4.2% |
| Mobile Home / Other | 83 | 8.7% |
| Total | 957 | 100.0% |
Housing Structures by Occupancy in Jay
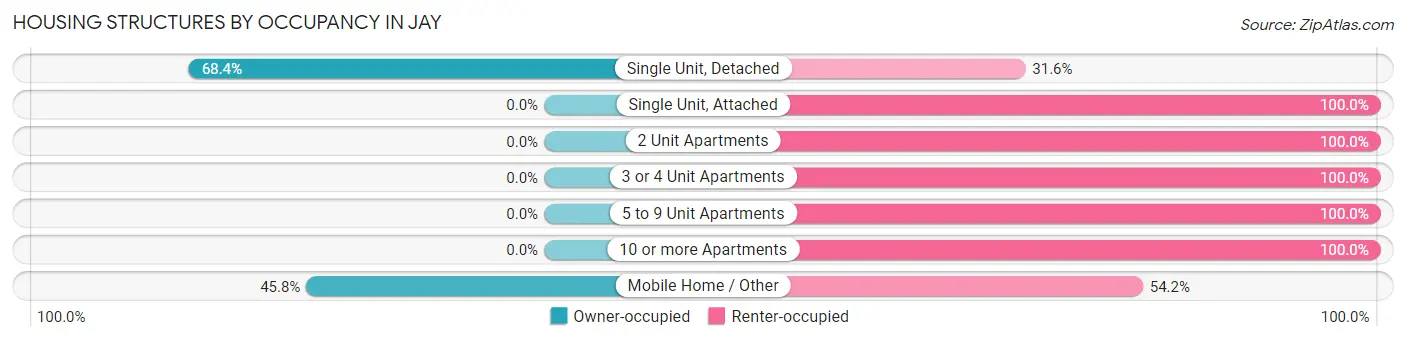
| Structure Type | Owner-occupied | Renter-occupied |
| Single Unit, Detached | 489 (68.4%) | 226 (31.6%) |
| Single Unit, Attached | 0 (0.0%) | 5 (100.0%) |
| 2 Unit Apartments | 0 (0.0%) | 80 (100.0%) |
| 3 or 4 Unit Apartments | 0 (0.0%) | 9 (100.0%) |
| 5 to 9 Unit Apartments | 0 (0.0%) | 25 (100.0%) |
| 10 or more Apartments | 0 (0.0%) | 40 (100.0%) |
| Mobile Home / Other | 38 (45.8%) | 45 (54.2%) |
| Total | 527 (55.1%) | 430 (44.9%) |
Housing Structures by Number of Rooms in Jay
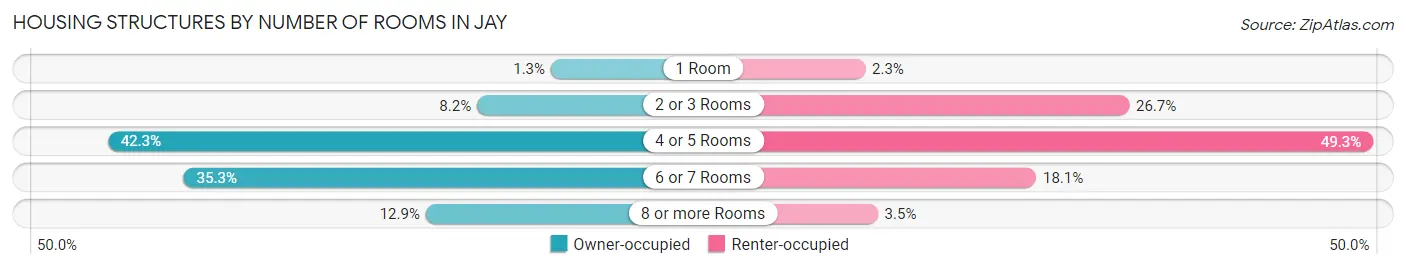
| Number of Rooms | Owner-occupied | Renter-occupied |
| 1 Room | 7 (1.3%) | 10 (2.3%) |
| 2 or 3 Rooms | 43 (8.2%) | 115 (26.7%) |
| 4 or 5 Rooms | 223 (42.3%) | 212 (49.3%) |
| 6 or 7 Rooms | 186 (35.3%) | 78 (18.1%) |
| 8 or more Rooms | 68 (12.9%) | 15 (3.5%) |
| Total | 527 (100.0%) | 430 (100.0%) |
Housing Structure by Heating Type in Jay
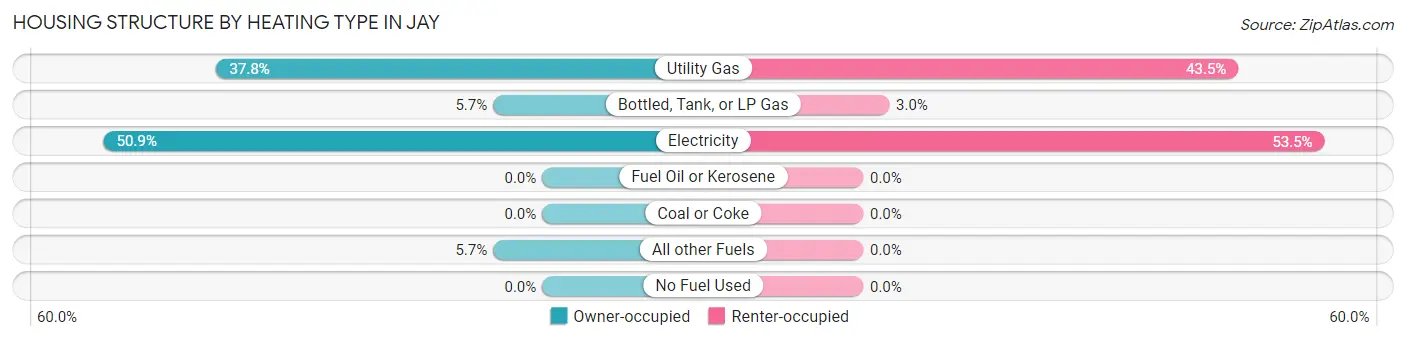
| Heating Type | Owner-occupied | Renter-occupied |
| Utility Gas | 199 (37.8%) | 187 (43.5%) |
| Bottled, Tank, or LP Gas | 30 (5.7%) | 13 (3.0%) |
| Electricity | 268 (50.8%) | 230 (53.5%) |
| Fuel Oil or Kerosene | 0 (0.0%) | 0 (0.0%) |
| Coal or Coke | 0 (0.0%) | 0 (0.0%) |
| All other Fuels | 30 (5.7%) | 0 (0.0%) |
| No Fuel Used | 0 (0.0%) | 0 (0.0%) |
| Total | 527 (100.0%) | 430 (100.0%) |
Household Vehicle Usage in Jay
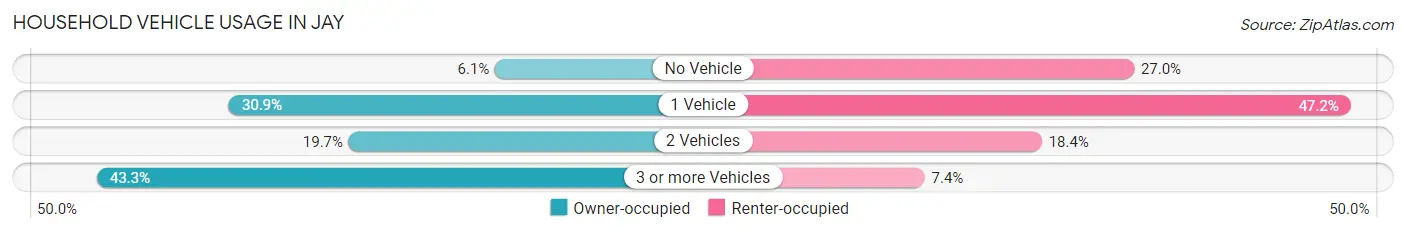
| Vehicles per Household | Owner-occupied | Renter-occupied |
| No Vehicle | 32 (6.1%) | 116 (27.0%) |
| 1 Vehicle | 163 (30.9%) | 203 (47.2%) |
| 2 Vehicles | 104 (19.7%) | 79 (18.4%) |
| 3 or more Vehicles | 228 (43.3%) | 32 (7.4%) |
| Total | 527 (100.0%) | 430 (100.0%) |
Real Estate & Mortgages in Jay
Real Estate and Mortgage Overview in Jay
| Characteristic | Without Mortgage | With Mortgage |
| Housing Units | 238 | 289 |
| Median Property Value | $52,400 | $125,400 |
| Median Household Income | $35,469 | $26 |
| Monthly Housing Costs | $297 | $0 |
| Real Estate Taxes | $280 | $57 |
Property Value by Mortgage Status in Jay
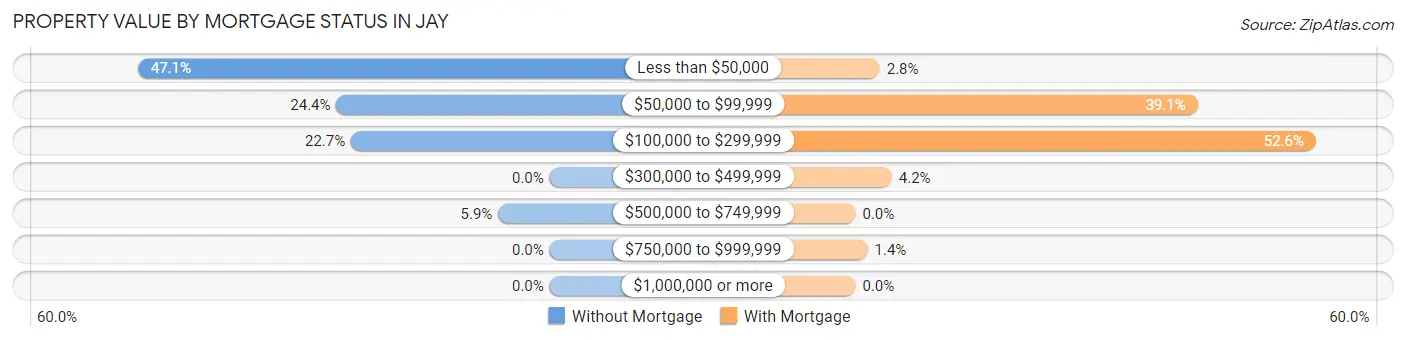
| Property Value | Without Mortgage | With Mortgage |
| Less than $50,000 | 112 (47.1%) | 8 (2.8%) |
| $50,000 to $99,999 | 58 (24.4%) | 113 (39.1%) |
| $100,000 to $299,999 | 54 (22.7%) | 152 (52.6%) |
| $300,000 to $499,999 | 0 (0.0%) | 12 (4.2%) |
| $500,000 to $749,999 | 14 (5.9%) | 0 (0.0%) |
| $750,000 to $999,999 | 0 (0.0%) | 4 (1.4%) |
| $1,000,000 or more | 0 (0.0%) | 0 (0.0%) |
| Total | 238 (100.0%) | 289 (100.0%) |
Household Income by Mortgage Status in Jay
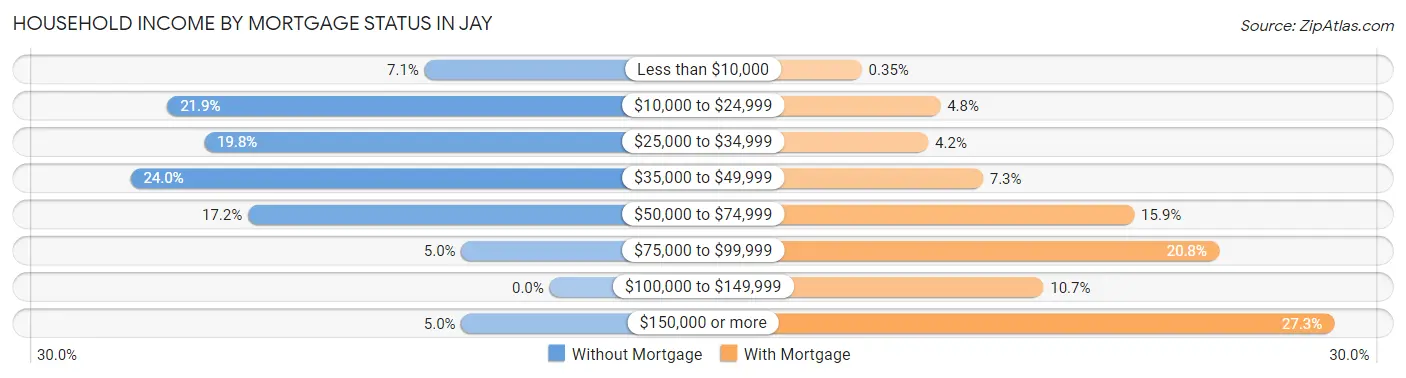
| Household Income | Without Mortgage | With Mortgage |
| Less than $10,000 | 17 (7.1%) | 1 (0.4%) |
| $10,000 to $24,999 | 52 (21.8%) | 14 (4.8%) |
| $25,000 to $34,999 | 47 (19.8%) | 12 (4.2%) |
| $35,000 to $49,999 | 57 (23.9%) | 21 (7.3%) |
| $50,000 to $74,999 | 41 (17.2%) | 46 (15.9%) |
| $75,000 to $99,999 | 12 (5.0%) | 60 (20.8%) |
| $100,000 to $149,999 | 0 (0.0%) | 31 (10.7%) |
| $150,000 or more | 12 (5.0%) | 79 (27.3%) |
| Total | 238 (100.0%) | 289 (100.0%) |
Property Value to Household Income Ratio in Jay
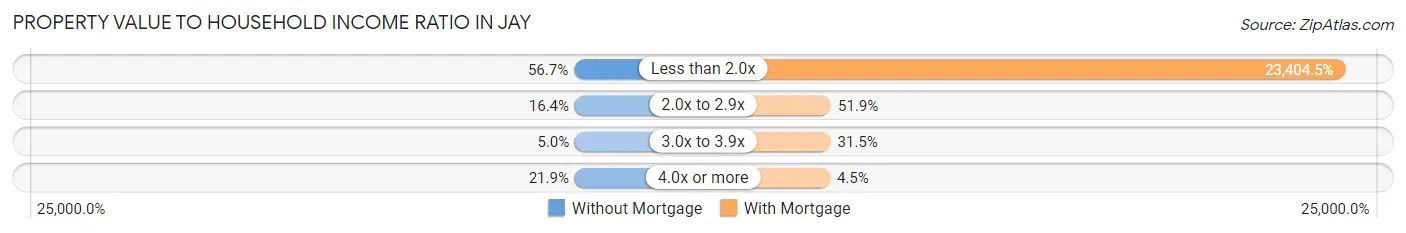
| Value-to-Income Ratio | Without Mortgage | With Mortgage |
| Less than 2.0x | 135 (56.7%) | 67,639 (23,404.5%) |
| 2.0x to 2.9x | 39 (16.4%) | 150 (51.9%) |
| 3.0x to 3.9x | 12 (5.0%) | 91 (31.5%) |
| 4.0x or more | 52 (21.8%) | 13 (4.5%) |
| Total | 238 (100.0%) | 289 (100.0%) |
Real Estate Taxes by Mortgage Status in Jay
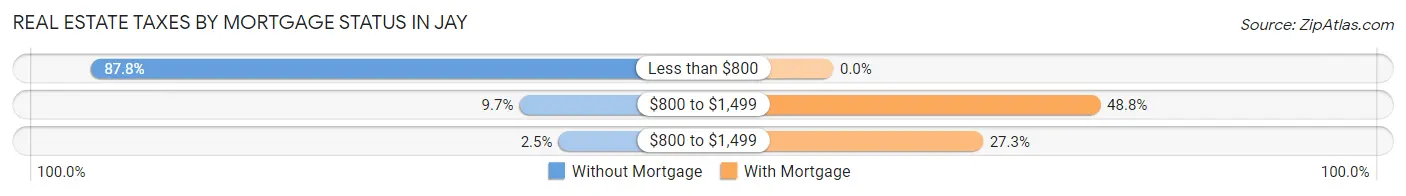
| Property Taxes | Without Mortgage | With Mortgage |
| Less than $800 | 209 (87.8%) | 0 (0.0%) |
| $800 to $1,499 | 23 (9.7%) | 141 (48.8%) |
| $800 to $1,499 | 6 (2.5%) | 79 (27.3%) |
| Total | 238 (100.0%) | 289 (100.0%) |
Health & Disability in Jay
Health Insurance Coverage by Age in Jay
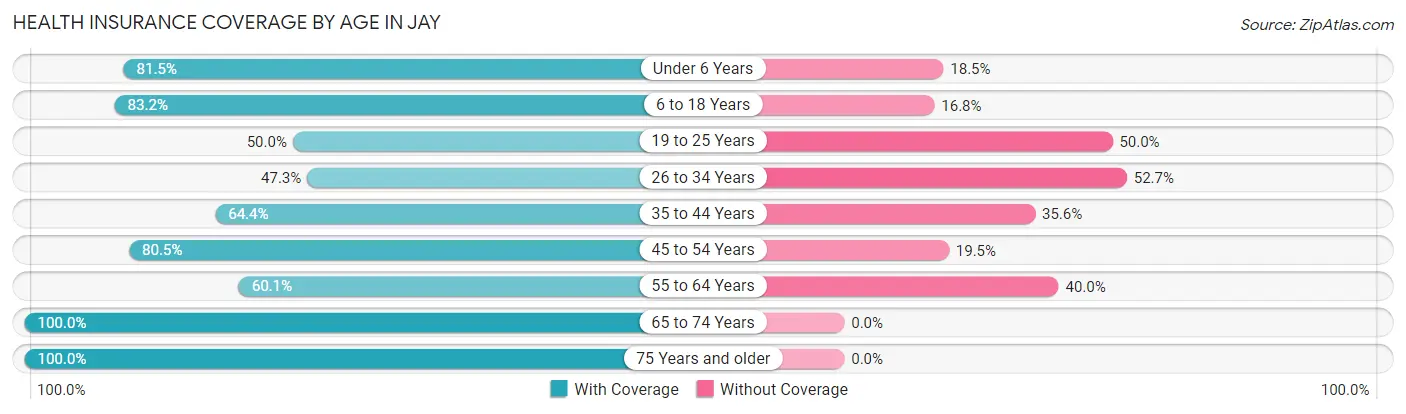
| Age Bracket | With Coverage | Without Coverage |
| Under 6 Years | 203 (81.5%) | 46 (18.5%) |
| 6 to 18 Years | 421 (83.2%) | 85 (16.8%) |
| 19 to 25 Years | 149 (50.0%) | 149 (50.0%) |
| 26 to 34 Years | 168 (47.3%) | 187 (52.7%) |
| 35 to 44 Years | 279 (64.4%) | 154 (35.6%) |
| 45 to 54 Years | 194 (80.5%) | 47 (19.5%) |
| 55 to 64 Years | 239 (60.1%) | 159 (40.0%) |
| 65 to 74 Years | 244 (100.0%) | 0 (0.0%) |
| 75 Years and older | 110 (100.0%) | 0 (0.0%) |
| Total | 2,007 (70.8%) | 827 (29.2%) |
Health Insurance Coverage by Citizenship Status in Jay
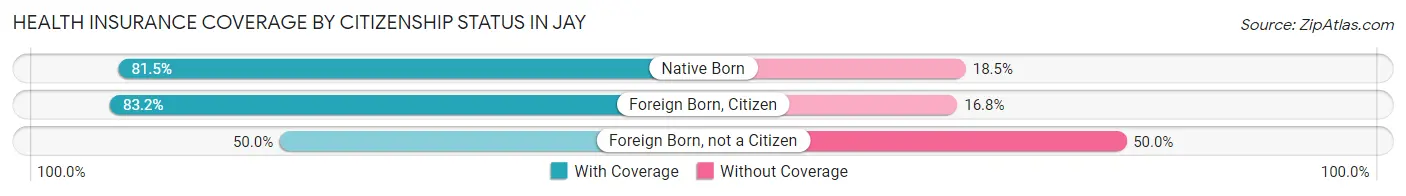
| Citizenship Status | With Coverage | Without Coverage |
| Native Born | 203 (81.5%) | 46 (18.5%) |
| Foreign Born, Citizen | 421 (83.2%) | 85 (16.8%) |
| Foreign Born, not a Citizen | 149 (50.0%) | 149 (50.0%) |
Health Insurance Coverage by Household Income in Jay
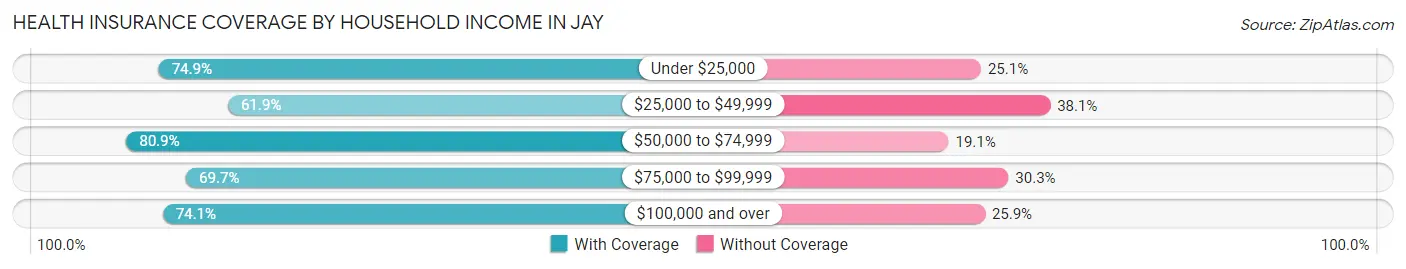
| Household Income | With Coverage | Without Coverage |
| Under $25,000 | 405 (74.9%) | 136 (25.1%) |
| $25,000 to $49,999 | 536 (61.9%) | 330 (38.1%) |
| $50,000 to $74,999 | 310 (80.9%) | 73 (19.1%) |
| $75,000 to $99,999 | 343 (69.7%) | 149 (30.3%) |
| $100,000 and over | 398 (74.1%) | 139 (25.9%) |
Public vs Private Health Insurance Coverage by Age in Jay
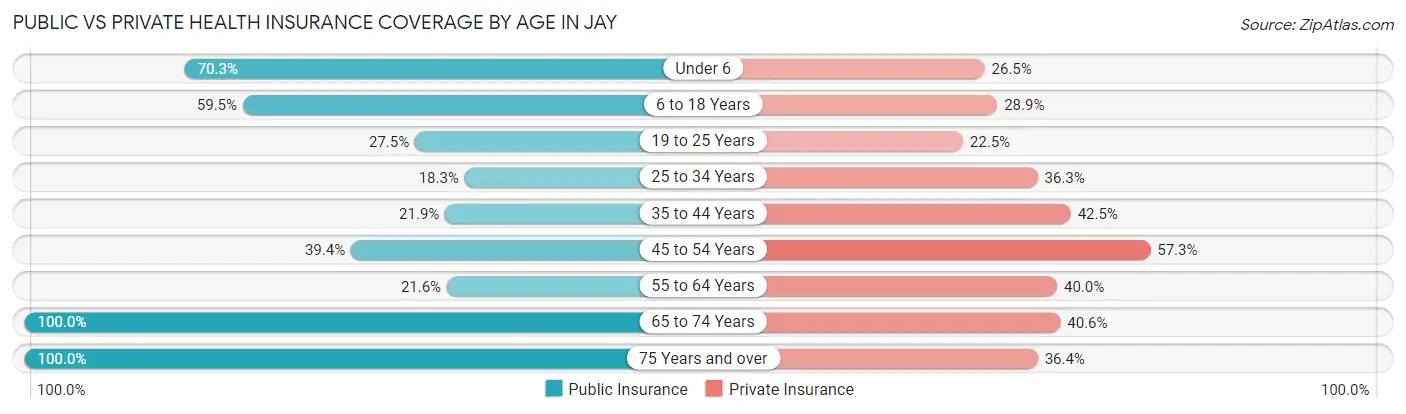
| Age Bracket | Public Insurance | Private Insurance |
| Under 6 | 175 (70.3%) | 66 (26.5%) |
| 6 to 18 Years | 301 (59.5%) | 146 (28.8%) |
| 19 to 25 Years | 82 (27.5%) | 67 (22.5%) |
| 25 to 34 Years | 65 (18.3%) | 129 (36.3%) |
| 35 to 44 Years | 95 (21.9%) | 184 (42.5%) |
| 45 to 54 Years | 95 (39.4%) | 138 (57.3%) |
| 55 to 64 Years | 86 (21.6%) | 159 (40.0%) |
| 65 to 74 Years | 244 (100.0%) | 99 (40.6%) |
| 75 Years and over | 110 (100.0%) | 40 (36.4%) |
| Total | 1,253 (44.2%) | 1,028 (36.3%) |
Disability Status by Sex by Age in Jay
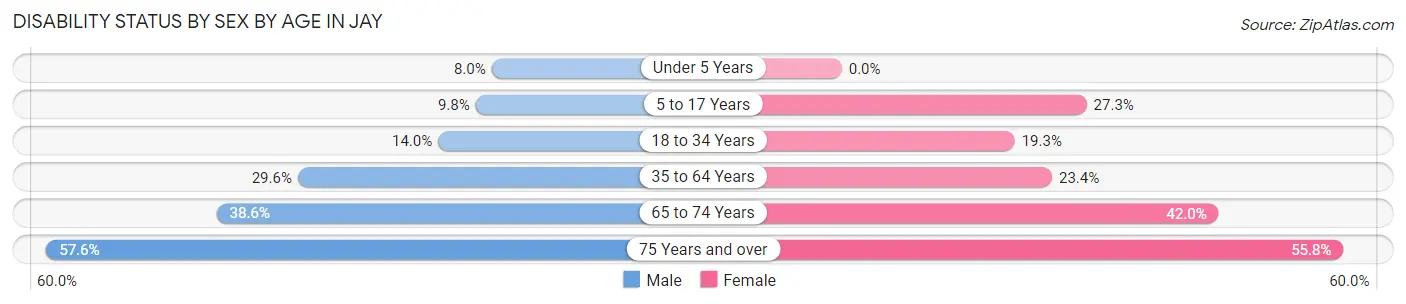
| Age Bracket | Male | Female |
| Under 5 Years | 6 (8.0%) | 0 (0.0%) |
| 5 to 17 Years | 27 (9.8%) | 66 (27.3%) |
| 18 to 34 Years | 55 (14.0%) | 57 (19.3%) |
| 35 to 64 Years | 163 (29.6%) | 122 (23.4%) |
| 65 to 74 Years | 39 (38.6%) | 60 (42.0%) |
| 75 Years and over | 19 (57.6%) | 43 (55.8%) |
Disability Class by Sex by Age in Jay
Disability Class: Hearing Difficulty
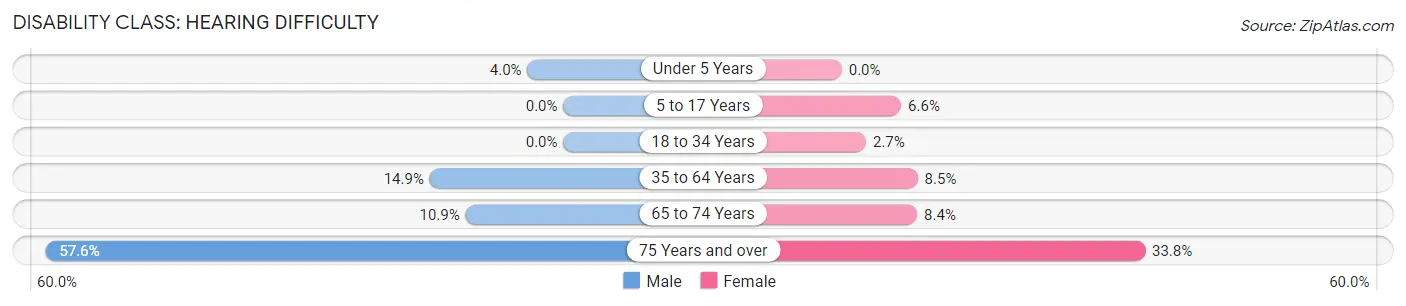
| Age Bracket | Male | Female |
| Under 5 Years | 3 (4.0%) | 0 (0.0%) |
| 5 to 17 Years | 0 (0.0%) | 16 (6.6%) |
| 18 to 34 Years | 0 (0.0%) | 8 (2.7%) |
| 35 to 64 Years | 82 (14.9%) | 44 (8.5%) |
| 65 to 74 Years | 11 (10.9%) | 12 (8.4%) |
| 75 Years and over | 19 (57.6%) | 26 (33.8%) |
Disability Class: Vision Difficulty
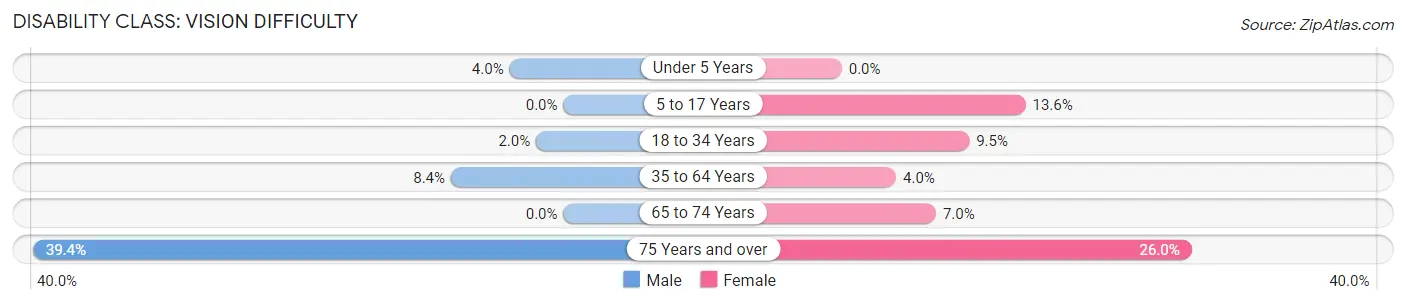
| Age Bracket | Male | Female |
| Under 5 Years | 3 (4.0%) | 0 (0.0%) |
| 5 to 17 Years | 0 (0.0%) | 33 (13.6%) |
| 18 to 34 Years | 8 (2.0%) | 28 (9.5%) |
| 35 to 64 Years | 46 (8.4%) | 21 (4.0%) |
| 65 to 74 Years | 0 (0.0%) | 10 (7.0%) |
| 75 Years and over | 13 (39.4%) | 20 (26.0%) |
Disability Class: Cognitive Difficulty
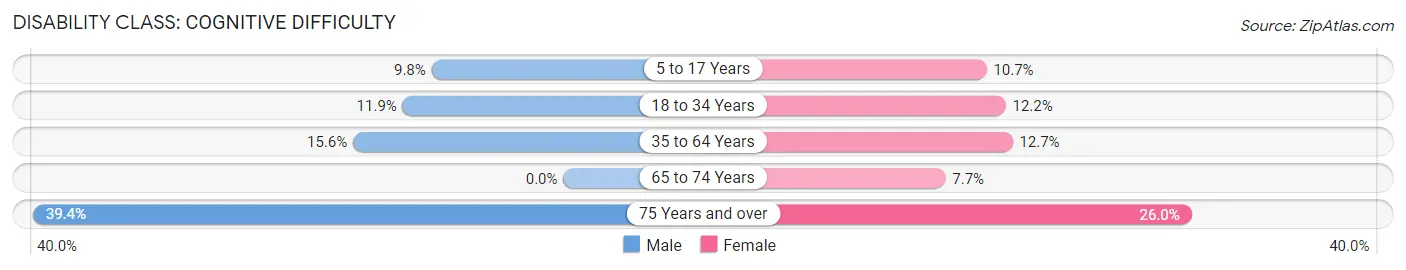
| Age Bracket | Male | Female |
| 5 to 17 Years | 27 (9.8%) | 26 (10.7%) |
| 18 to 34 Years | 47 (11.9%) | 36 (12.2%) |
| 35 to 64 Years | 86 (15.6%) | 66 (12.7%) |
| 65 to 74 Years | 0 (0.0%) | 11 (7.7%) |
| 75 Years and over | 13 (39.4%) | 20 (26.0%) |
Disability Class: Ambulatory Difficulty
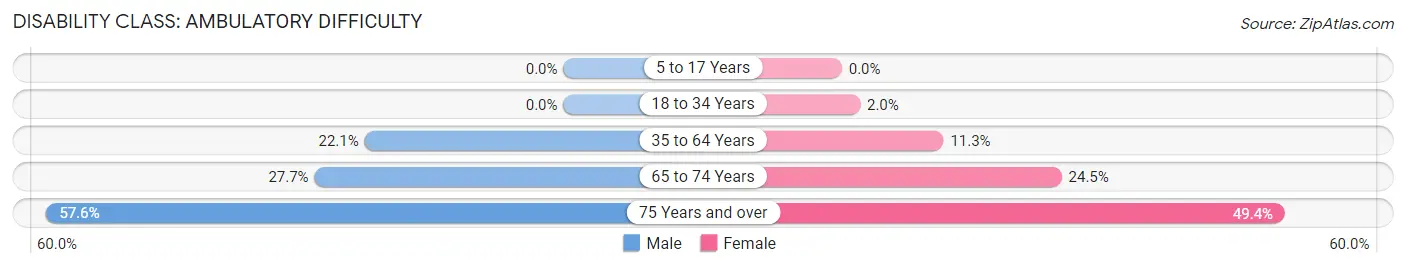
| Age Bracket | Male | Female |
| 5 to 17 Years | 0 (0.0%) | 0 (0.0%) |
| 18 to 34 Years | 0 (0.0%) | 6 (2.0%) |
| 35 to 64 Years | 122 (22.1%) | 59 (11.3%) |
| 65 to 74 Years | 28 (27.7%) | 35 (24.5%) |
| 75 Years and over | 19 (57.6%) | 38 (49.3%) |
Disability Class: Self-Care Difficulty
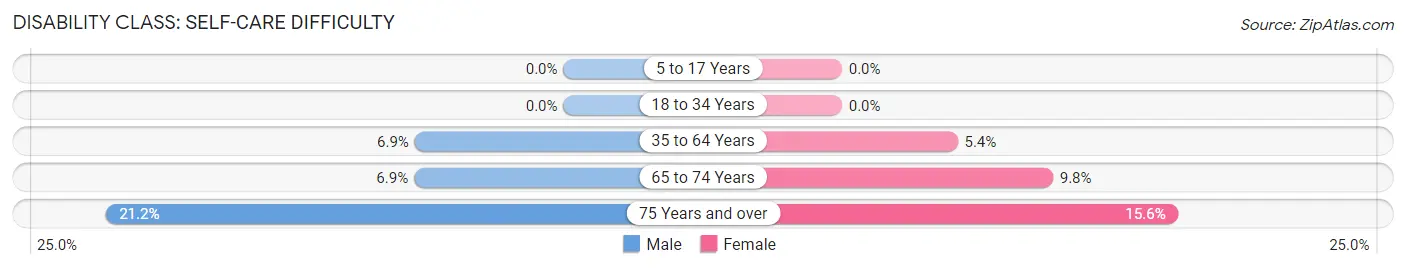
| Age Bracket | Male | Female |
| 5 to 17 Years | 0 (0.0%) | 0 (0.0%) |
| 18 to 34 Years | 0 (0.0%) | 0 (0.0%) |
| 35 to 64 Years | 38 (6.9%) | 28 (5.4%) |
| 65 to 74 Years | 7 (6.9%) | 14 (9.8%) |
| 75 Years and over | 7 (21.2%) | 12 (15.6%) |
Technology Access in Jay
Computing Device Access in Jay
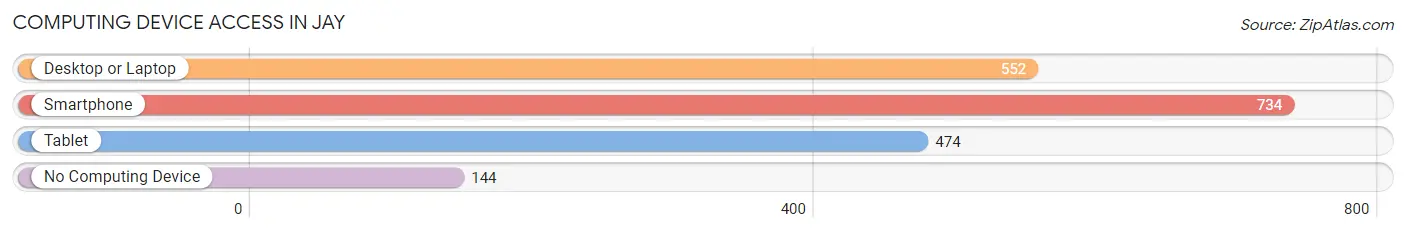
| Device Type | # Households | % Households |
| Desktop or Laptop | 552 | 57.7% |
| Smartphone | 734 | 76.7% |
| Tablet | 474 | 49.5% |
| No Computing Device | 144 | 15.0% |
| Total | 957 | 100.0% |
Internet Access in Jay
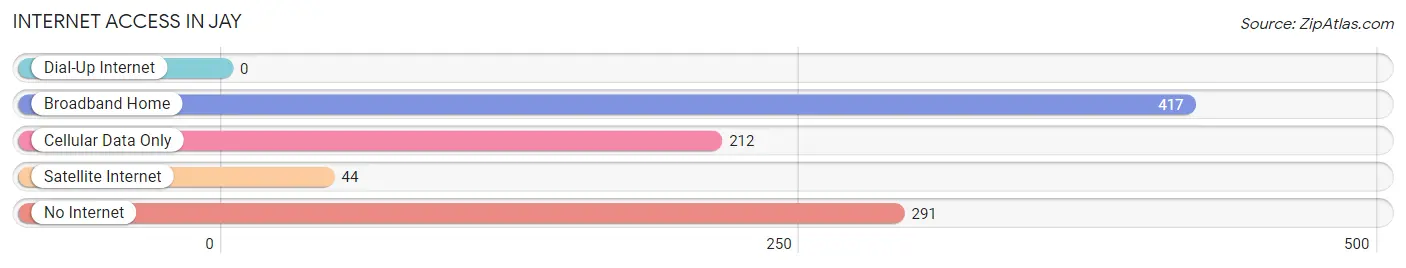
| Internet Type | # Households | % Households |
| Dial-Up Internet | 0 | 0.0% |
| Broadband Home | 417 | 43.6% |
| Cellular Data Only | 212 | 22.2% |
| Satellite Internet | 44 | 4.6% |
| No Internet | 291 | 30.4% |
| Total | 957 | 100.0% |
Jay Summary
Oklahoma is a state located in the South Central region of the United States. It is bordered by Texas to the south, Arkansas to the east, Kansas to the north, and New Mexico to the west. Oklahoma is the 20th most extensive and the 28th most populous of the 50 United States. The state's name is derived from the Choctaw words okla and humma, meaning "red people". It is also known informally by its nickname, The Sooner State, in reference to the non-Native settlers who staked their claims on the choicest pieces of land before the official opening date of lands in the western Oklahoma Territory or before the Indian Appropriations Act of 1889, which increased European-American settlement in the eastern Indian Territory.
History
The area now known as Oklahoma was first settled by Native Americans, including the Caddo, Comanche, Osage, and Choctaw tribes. The first European to visit the area was Spanish explorer Francisco Vásquez de Coronado in 1541. In the early 1800s, the area was part of the Louisiana Purchase. In 1803, the United States acquired the area from France. In 1819, the area was part of the Arkansas Territory. In 1820, the area was part of the Missouri Territory. In 1821, the area was part of the Indian Territory.
In 1889, the Oklahoma Territory was created from the western half of the Indian Territory. In 1907, Oklahoma became the 46th state admitted to the Union. During the early 20th century, Oklahoma experienced a period of economic growth and development, fueled by the discovery of oil and natural gas. The state also experienced a period of racial tension and violence, culminating in the 1921 Tulsa Race Riot.
Geography
Oklahoma is located in the South Central region of the United States. It is bordered by Texas to the south, Arkansas to the east, Kansas to the north, and New Mexico to the west. Oklahoma covers an area of 69,899 square miles, making it the 20th largest state in the country. The state is divided into 77 counties and contains 597 incorporated municipalities.
The state is divided into four distinct geographic regions: the Great Plains, the Ouachita Mountains, the Ozark Mountains, and the Red River Valley. The Great Plains region is located in the western part of the state and is characterized by flat, rolling terrain. The Ouachita Mountains are located in the southeastern part of the state and are characterized by steep, rugged terrain. The Ozark Mountains are located in the northeastern part of the state and are characterized by rolling hills and valleys. The Red River Valley is located in the southwestern part of the state and is characterized by flat, fertile land.
Economy
Oklahoma has a diversified economy, with a mix of industries including agriculture, energy, manufacturing, and services. The state’s agricultural sector is the largest in the nation, accounting for over one-third of the state’s total economic output. The state’s energy sector is also a major contributor to the economy, with oil and natural gas production accounting for over one-third of the state’s total economic output. The state’s manufacturing sector is also a major contributor to the economy, with food processing, aerospace, and automotive manufacturing accounting for over one-fifth of the state’s total economic output.
Demographics
As of 2019, Oklahoma had an estimated population of 3.9 million, making it the 28th most populous state in the country. The state’s population is composed of a variety of racial and ethnic groups, including White (68.3%), American Indian and Alaska Native (9.2%), Black or African American (7.7%), Asian (2.2%), and Hispanic or Latino (10.2%). The state’s largest metropolitan area is Oklahoma City, with an estimated population of 1.4 million. The state’s second largest metropolitan area is Tulsa, with an estimated population of 991,000.
Common Questions
What is Per Capita Income in Jay?
Per Capita income in Jay is $21,031.
What is the Median Family Income in Jay?
Median Family Income in Jay is $49,306.
What is the Median Household income in Jay?
Median Household Income in Jay is $36,625.
What is Income or Wage Gap in Jay?
Income or Wage Gap in Jay is 34.2%.
Women in Jay earn 65.8 cents for every dollar earned by a man.
What is Family Income Deficit in Jay?
Family Income Deficit in Jay is $7,687.
Families that are below poverty line in Jay earn $7,687 less on average than the poverty threshold level.
What is Inequality or Gini Index in Jay?
Inequality or Gini Index in Jay is 0.51.
What is the Total Population of Jay?
Total Population of Jay is 2,900.
What is the Total Male Population of Jay?
Total Male Population of Jay is 1,477.
What is the Total Female Population of Jay?
Total Female Population of Jay is 1,423.
What is the Ratio of Males per 100 Females in Jay?
There are 103.79 Males per 100 Females in Jay.
What is the Ratio of Females per 100 Males in Jay?
There are 96.34 Females per 100 Males in Jay.
What is the Median Population Age in Jay?
Median Population Age in Jay is 35.4 Years.
What is the Average Family Size in Jay
Average Family Size in Jay is 3.7 People.
What is the Average Household Size in Jay
Average Household Size in Jay is 3.0 People.
How Large is the Labor Force in Jay?
There are 1,153 People in the Labor Forcein in Jay.
What is the Percentage of People in the Labor Force in Jay?
51.1% of People are in the Labor Force in Jay.
What is the Unemployment Rate in Jay?
Unemployment Rate in Jay is 10.3%.