Chupadero, NM Map & Demographics
Chupadero Map
Chupadero Overview
$78,487
PER CAPITA INCOME
$146,426
AVG FAMILY INCOME
$144,792
AVG HOUSEHOLD INCOME
0.35
INEQUALITY / GINI INDEX
285
TOTAL POPULATION
123
MALE POPULATION
162
FEMALE POPULATION
75.93
MALES / 100 FEMALES
131.71
FEMALES / 100 MALES
46.6
MEDIAN AGE
1.9
AVG FAMILY SIZE
1.6
AVG HOUSEHOLD SIZE
192
LABOR FORCE [ PEOPLE ]
74.1%
PERCENT IN LABOR FORCE
4.7%
UNEMPLOYMENT RATE
Income in Chupadero
Income Overview in Chupadero
Per Capita Income in Chupadero is $78,487, while median incomes of families and households are $146,426 and $144,792 respectively.
| Characteristic | Number | Measure |
| Per Capita Income | 285 | $78,487 |
| Median Family Income | 109 | $146,426 |
| Mean Family Income | 109 | $167,109 |
| Median Household Income | 183 | $144,792 |
| Mean Household Income | 183 | $125,074 |
| Income Deficit | 109 | $0 |
| Wage / Income Gap (%) | 285 | 0.00% |
| Wage / Income Gap ($) | 285 | 100.00¢ per $1 |
| Gini / Inequality Index | 285 | 0.35 |
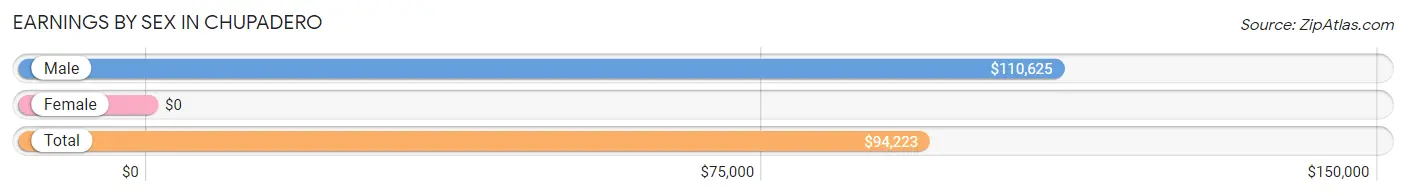
Earnings by Sex in Chupadero
| Sex | Number | Average Earnings |
| Male | 96 (50.8%) | $110,625 |
| Female | 93 (49.2%) | $0 |
| Total | 189 (100.0%) | $94,223 |
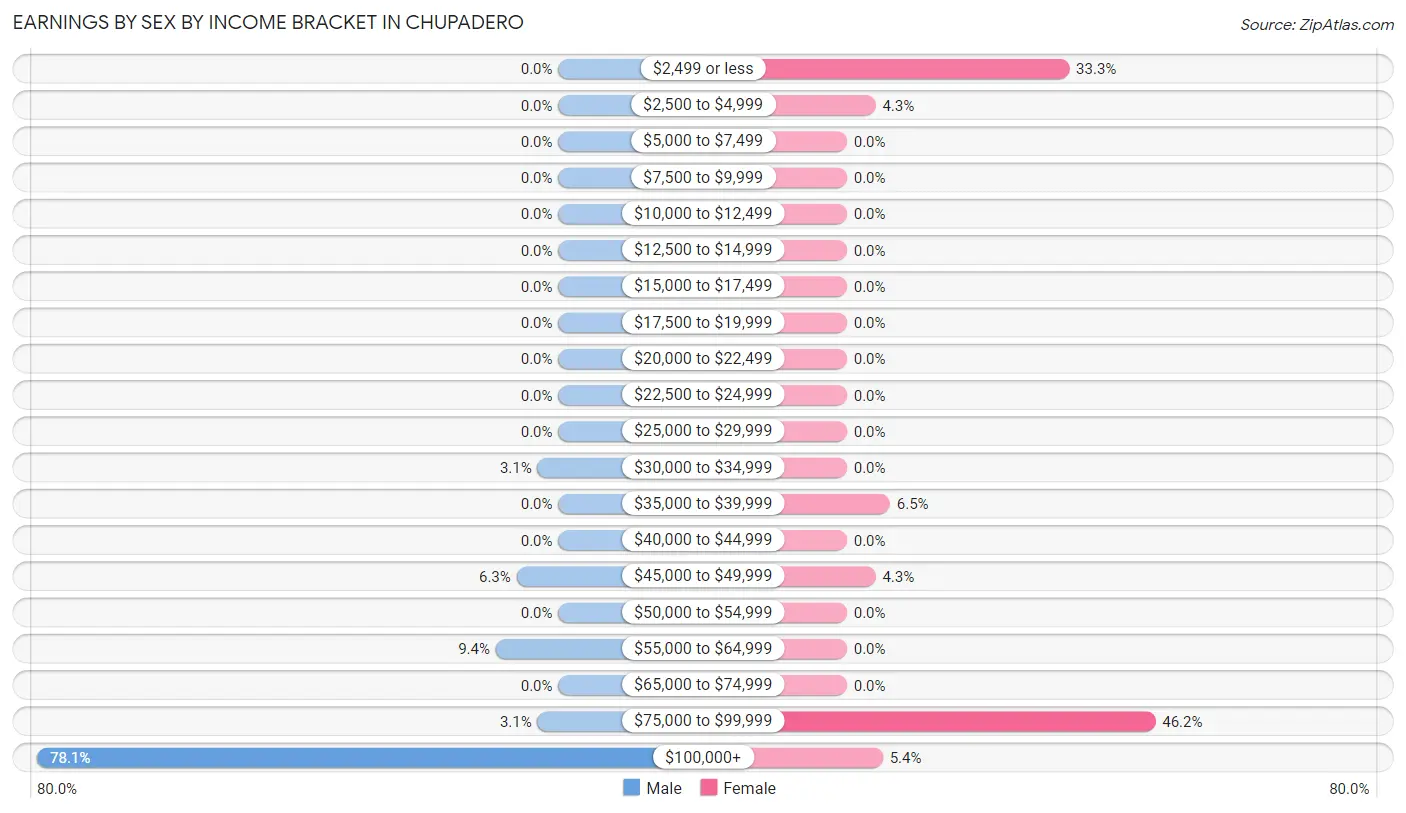
Earnings by Sex by Income Bracket in Chupadero
The most common earnings brackets in Chupadero are $100,000+ for men (75 | 78.1%) and $75,000 to $99,999 for women (43 | 46.2%).
| Income | Male | Female |
| $2,499 or less | 0 (0.0%) | 31 (33.3%) |
| $2,500 to $4,999 | 0 (0.0%) | 4 (4.3%) |
| $5,000 to $7,499 | 0 (0.0%) | 0 (0.0%) |
| $7,500 to $9,999 | 0 (0.0%) | 0 (0.0%) |
| $10,000 to $12,499 | 0 (0.0%) | 0 (0.0%) |
| $12,500 to $14,999 | 0 (0.0%) | 0 (0.0%) |
| $15,000 to $17,499 | 0 (0.0%) | 0 (0.0%) |
| $17,500 to $19,999 | 0 (0.0%) | 0 (0.0%) |
| $20,000 to $22,499 | 0 (0.0%) | 0 (0.0%) |
| $22,500 to $24,999 | 0 (0.0%) | 0 (0.0%) |
| $25,000 to $29,999 | 0 (0.0%) | 0 (0.0%) |
| $30,000 to $34,999 | 3 (3.1%) | 0 (0.0%) |
| $35,000 to $39,999 | 0 (0.0%) | 6 (6.5%) |
| $40,000 to $44,999 | 0 (0.0%) | 0 (0.0%) |
| $45,000 to $49,999 | 6 (6.2%) | 4 (4.3%) |
| $50,000 to $54,999 | 0 (0.0%) | 0 (0.0%) |
| $55,000 to $64,999 | 9 (9.4%) | 0 (0.0%) |
| $65,000 to $74,999 | 0 (0.0%) | 0 (0.0%) |
| $75,000 to $99,999 | 3 (3.1%) | 43 (46.2%) |
| $100,000+ | 75 (78.1%) | 5 (5.4%) |
| Total | 96 (100.0%) | 93 (100.0%) |
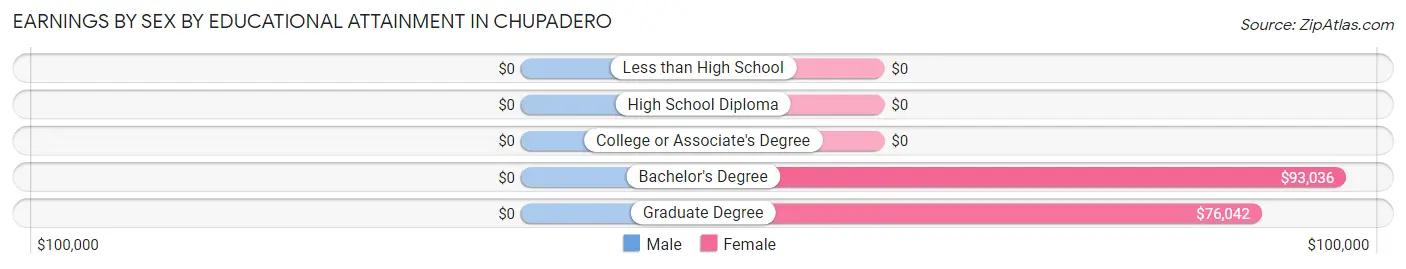
Earnings by Sex by Educational Attainment in Chupadero
| Educational Attainment | Male Income | Female Income |
| Less than High School | - | - |
| High School Diploma | - | - |
| College or Associate's Degree | - | - |
| Bachelor's Degree | - | - |
| Graduate Degree | - | - |
| Total | $110,625 | $93,243 |
Family Income in Chupadero
Family Income Brackets in Chupadero
According to the Chupadero family income data, there are 73 families falling into the $100,000 to $149,999 income range, which is the most common income bracket and makes up 67.0% of all families.
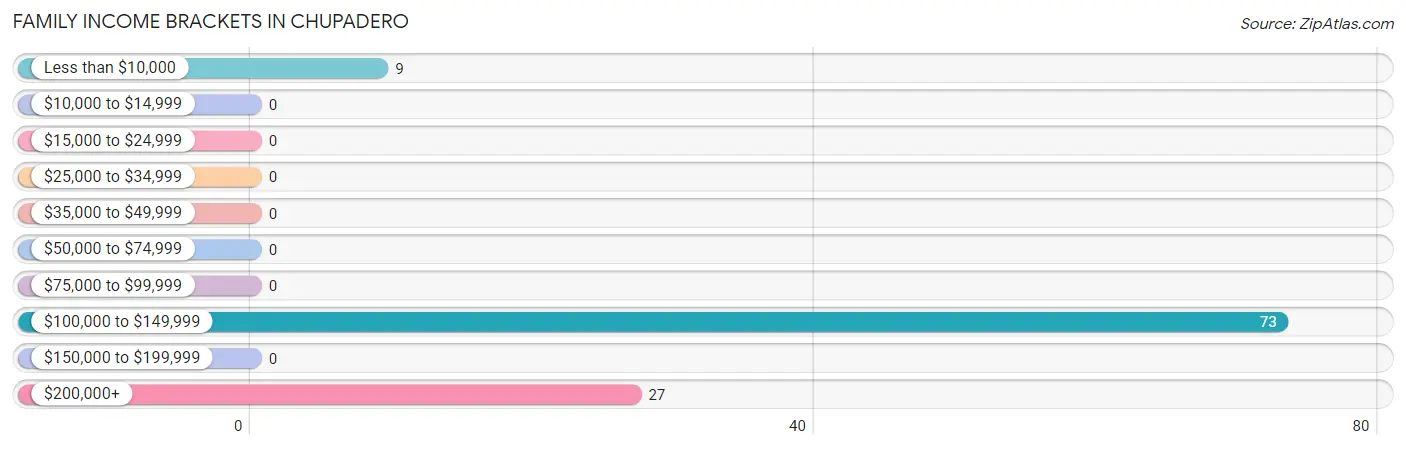
| Income Bracket | # Families | % Families |
| Less than $10,000 | 9 | 8.3% |
| $10,000 to $14,999 | 0 | 0.0% |
| $15,000 to $24,999 | 0 | 0.0% |
| $25,000 to $34,999 | 0 | 0.0% |
| $35,000 to $49,999 | 0 | 0.0% |
| $50,000 to $74,999 | 0 | 0.0% |
| $75,000 to $99,999 | 0 | 0.0% |
| $100,000 to $149,999 | 73 | 67.0% |
| $150,000 to $199,999 | 0 | 0.0% |
| $200,000+ | 27 | 24.8% |
Family Income by Famaliy Size in Chupadero
2-person families (89 | 81.7%) account for the highest median family income in Chupadero with $146,621 per family, while 2-person families (89 | 81.7%) have the highest median income of $73,310 per family member.
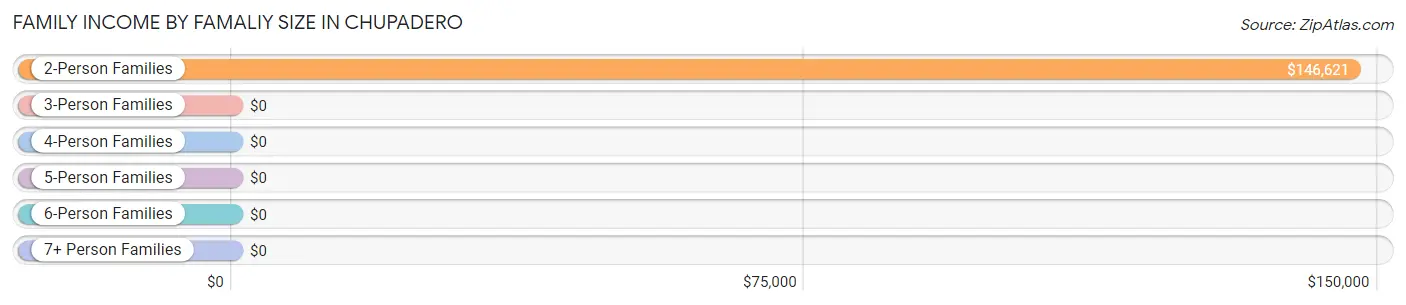
| Income Bracket | # Families | Median Income |
| 2-Person Families | 89 (81.7%) | $146,621 |
| 3-Person Families | 11 (10.1%) | $0 |
| 4-Person Families | 9 (8.3%) | $0 |
| 5-Person Families | 0 (0.0%) | $0 |
| 6-Person Families | 0 (0.0%) | $0 |
| 7+ Person Families | 0 (0.0%) | $0 |
| Total | 109 (100.0%) | $146,426 |
Family Income by Number of Earners in Chupadero
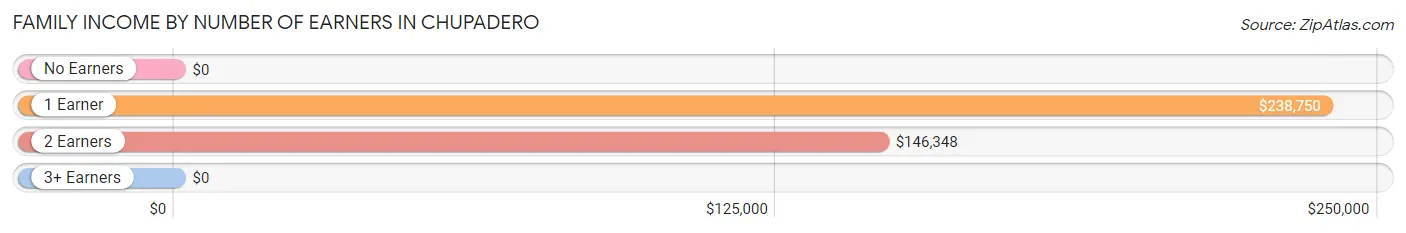
| Number of Earners | # Families | Median Income |
| No Earners | 9 (8.3%) | $0 |
| 1 Earner | 19 (17.4%) | $238,750 |
| 2 Earners | 81 (74.3%) | $146,348 |
| 3+ Earners | 0 (0.0%) | $0 |
| Total | 109 (100.0%) | $146,426 |
Household Income in Chupadero
Household Income Brackets in Chupadero
With 87 households falling in the category, the $100,000 to $149,999 income range is the most frequent in Chupadero, accounting for 47.5% of all households.
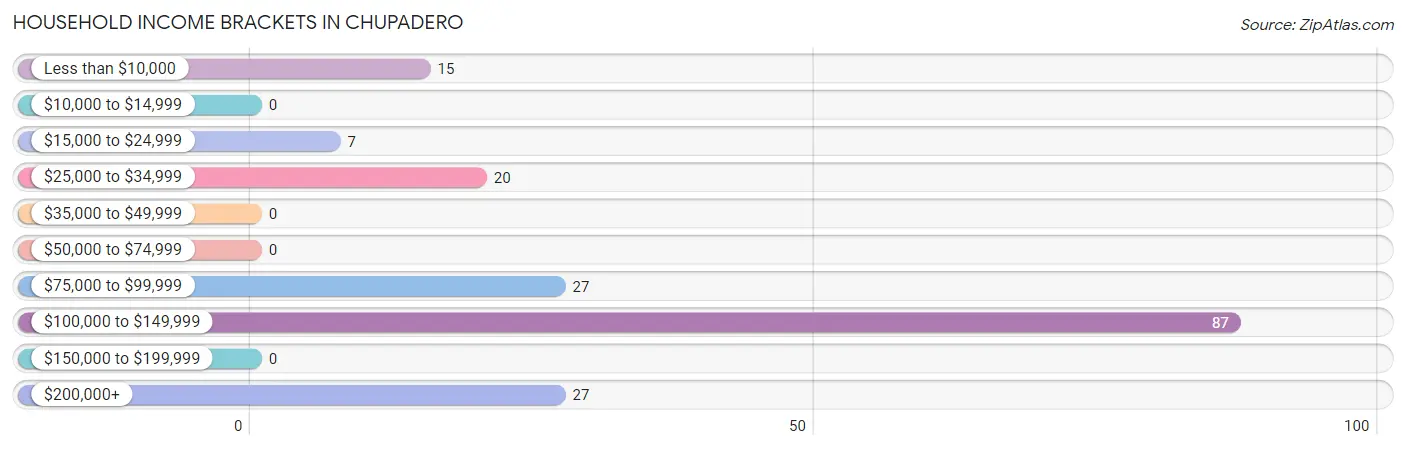
| Income Bracket | # Households | % Households |
| Less than $10,000 | 15 | 8.2% |
| $10,000 to $14,999 | 0 | 0.0% |
| $15,000 to $24,999 | 7 | 3.8% |
| $25,000 to $34,999 | 20 | 10.9% |
| $35,000 to $49,999 | 0 | 0.0% |
| $50,000 to $74,999 | 0 | 0.0% |
| $75,000 to $99,999 | 27 | 14.8% |
| $100,000 to $149,999 | 87 | 47.5% |
| $150,000 to $199,999 | 0 | 0.0% |
| $200,000+ | 27 | 14.8% |
Household Income by Householder Age in Chupadero
The median household income in Chupadero is $144,792, with the highest median household income of $145,566 found in the 45 to 64 years age bracket for the primary householder. A total of 111 households (60.7%) fall into this category.
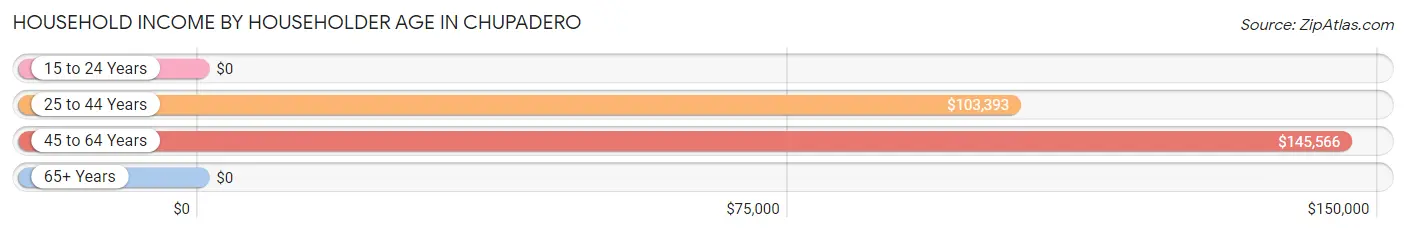
| Income Bracket | # Households | Median Income |
| 15 to 24 Years | 0 (0.0%) | $0 |
| 25 to 44 Years | 28 (15.3%) | $103,393 |
| 45 to 64 Years | 111 (60.7%) | $145,566 |
| 65+ Years | 44 (24.0%) | $0 |
| Total | 183 (100.0%) | $144,792 |
Poverty in Chupadero
Income Below Poverty by Sex and Age in Chupadero
With 13.0% poverty level for males and 19.1% for females among the residents of Chupadero, 35 to 44 year old males and under 5 year old females are the most vulnerable to poverty, with 9 males (100.0%) and 16 females (80.0%) in their respective age groups living below the poverty level.
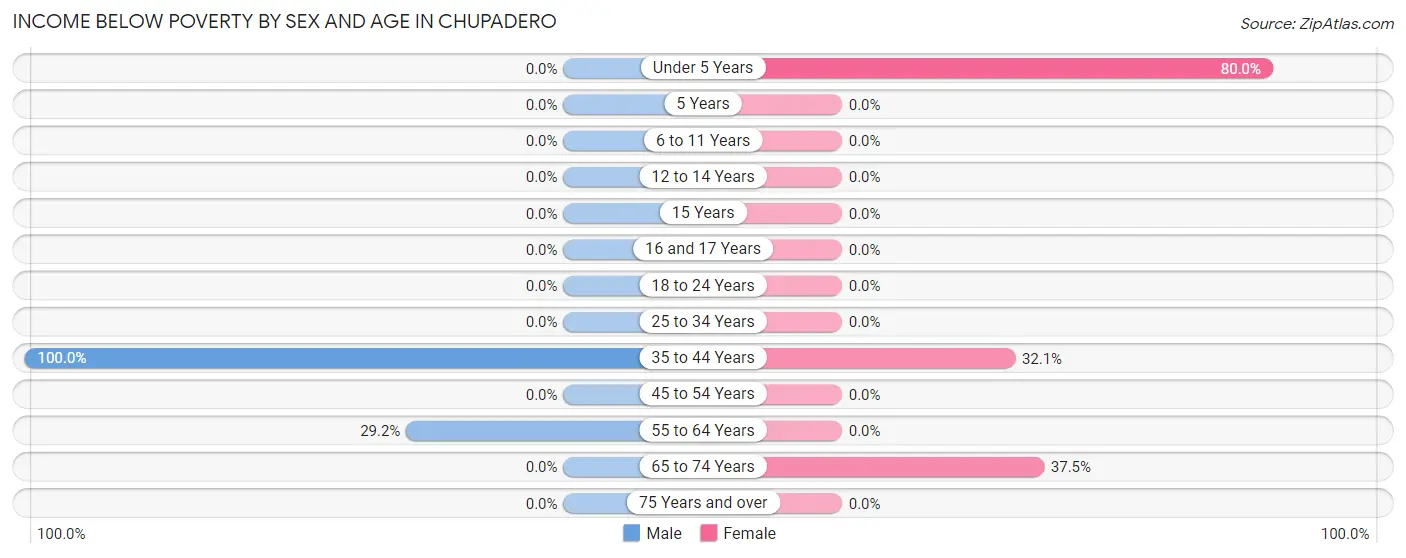
| Age Bracket | Male | Female |
| Under 5 Years | 0 (0.0%) | 16 (80.0%) |
| 5 Years | 0 (0.0%) | 0 (0.0%) |
| 6 to 11 Years | 0 (0.0%) | 0 (0.0%) |
| 12 to 14 Years | 0 (0.0%) | 0 (0.0%) |
| 15 Years | 0 (0.0%) | 0 (0.0%) |
| 16 and 17 Years | 0 (0.0%) | 0 (0.0%) |
| 18 to 24 Years | 0 (0.0%) | 0 (0.0%) |
| 25 to 34 Years | 0 (0.0%) | 0 (0.0%) |
| 35 to 44 Years | 9 (100.0%) | 9 (32.1%) |
| 45 to 54 Years | 0 (0.0%) | 0 (0.0%) |
| 55 to 64 Years | 7 (29.2%) | 0 (0.0%) |
| 65 to 74 Years | 0 (0.0%) | 6 (37.5%) |
| 75 Years and over | 0 (0.0%) | 0 (0.0%) |
| Total | 16 (13.0%) | 31 (19.1%) |
Income Above Poverty by Sex and Age in Chupadero
According to the poverty statistics in Chupadero, males aged 45 to 54 years and females aged 15 years are the age groups that are most secure financially, with 100.0% of males and 100.0% of females in these age groups living above the poverty line.
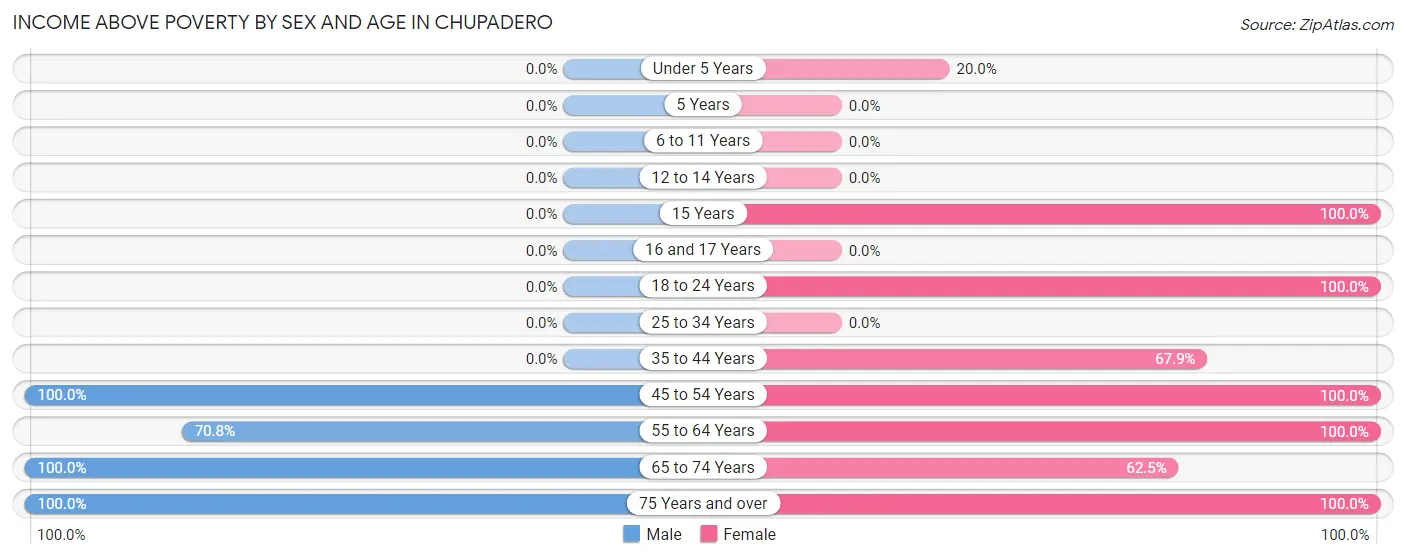
| Age Bracket | Male | Female |
| Under 5 Years | 0 (0.0%) | 4 (20.0%) |
| 5 Years | 0 (0.0%) | 0 (0.0%) |
| 6 to 11 Years | 0 (0.0%) | 0 (0.0%) |
| 12 to 14 Years | 0 (0.0%) | 0 (0.0%) |
| 15 Years | 0 (0.0%) | 6 (100.0%) |
| 16 and 17 Years | 0 (0.0%) | 0 (0.0%) |
| 18 to 24 Years | 0 (0.0%) | 31 (100.0%) |
| 25 to 34 Years | 0 (0.0%) | 0 (0.0%) |
| 35 to 44 Years | 0 (0.0%) | 19 (67.9%) |
| 45 to 54 Years | 69 (100.0%) | 7 (100.0%) |
| 55 to 64 Years | 17 (70.8%) | 29 (100.0%) |
| 65 to 74 Years | 3 (100.0%) | 10 (62.5%) |
| 75 Years and over | 18 (100.0%) | 25 (100.0%) |
| Total | 107 (87.0%) | 131 (80.9%) |
Income Below Poverty Among Married-Couple Families in Chupadero
The poverty statistics for married-couple families in Chupadero show that 20.0% or 9 of the total 45 families live below the poverty line. Families with 1 or 2 children have the highest poverty rate of 45.0%, comprising of 9 families. On the other hand, families with no children have the lowest poverty rate of 0.0%, which includes 0 families.
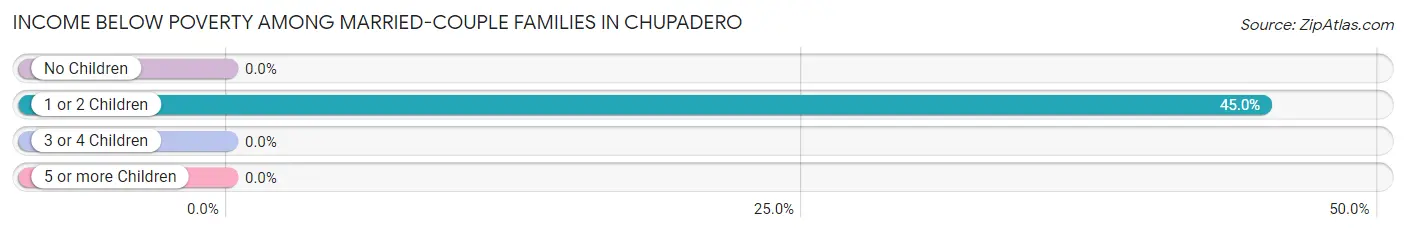
| Children | Above Poverty | Below Poverty |
| No Children | 25 (100.0%) | 0 (0.0%) |
| 1 or 2 Children | 11 (55.0%) | 9 (45.0%) |
| 3 or 4 Children | 0 (0.0%) | 0 (0.0%) |
| 5 or more Children | 0 (0.0%) | 0 (0.0%) |
| Total | 36 (80.0%) | 9 (20.0%) |
Income Below Poverty Among Single-Parent Households in Chupadero
| Children | Single Father | Single Mother |
| No Children | 0 (0.0%) | 0 (0.0%) |
| 1 or 2 Children | 0 (0.0%) | 0 (0.0%) |
| 3 or 4 Children | 0 (0.0%) | 0 (0.0%) |
| 5 or more Children | 0 (0.0%) | 0 (0.0%) |
| Total | 0 (0.0%) | 0 (0.0%) |
Income Below Poverty Among Married-Couple vs Single-Parent Households in Chupadero
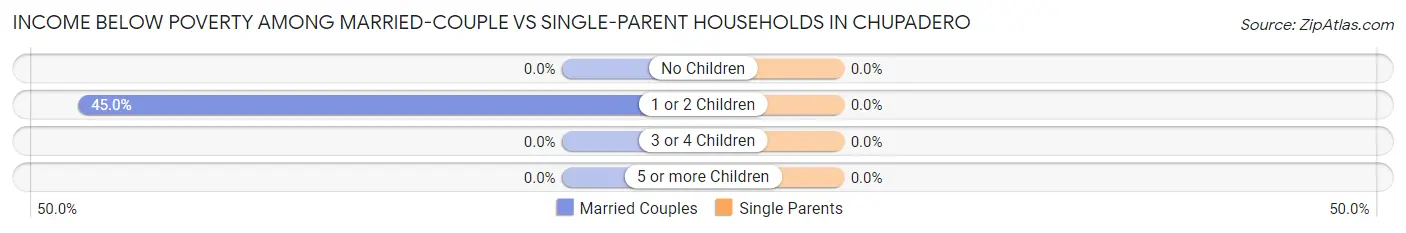
| Children | Married-Couple Families | Single-Parent Households |
| No Children | 0 (0.0%) | 0 (0.0%) |
| 1 or 2 Children | 9 (45.0%) | 0 (0.0%) |
| 3 or 4 Children | 0 (0.0%) | 0 (0.0%) |
| 5 or more Children | 0 (0.0%) | 0 (0.0%) |
| Total | 9 (20.0%) | 0 (0.0%) |
Race in Chupadero
The most populous races in Chupadero are White / Caucasian (171 | 60.0%), Hispanic or Latino (158 | 55.4%), and Some other Race (110 | 38.6%).
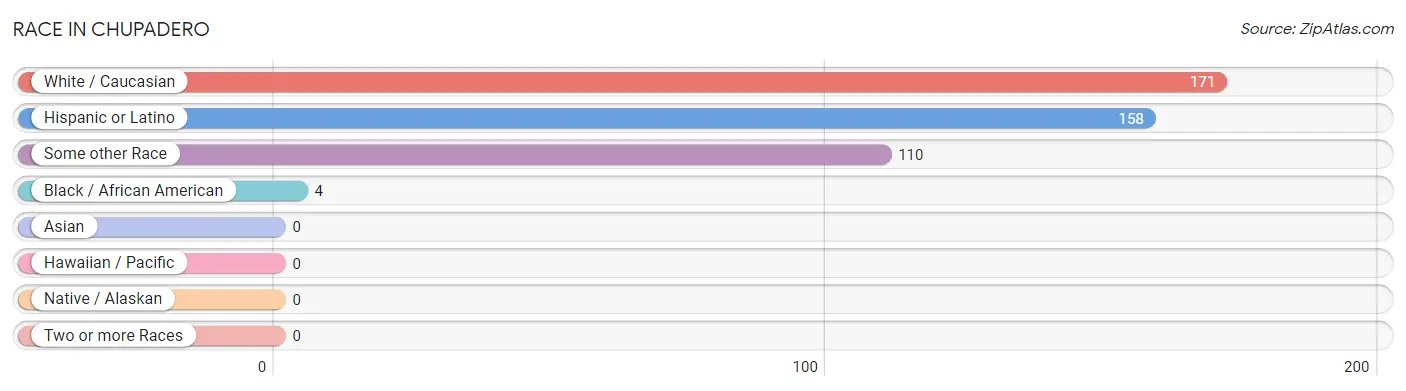
| Race | # Population | % Population |
| Asian | 0 | 0.0% |
| Black / African American | 4 | 1.4% |
| Hawaiian / Pacific | 0 | 0.0% |
| Hispanic or Latino | 158 | 55.4% |
| Native / Alaskan | 0 | 0.0% |
| White / Caucasian | 171 | 60.0% |
| Two or more Races | 0 | 0.0% |
| Some other Race | 110 | 38.6% |
| Total | 285 | 100.0% |
Ancestry in Chupadero
The most populous ancestries reported in Chupadero are Mexican (110 | 38.6%), Spanish (34 | 11.9%), German (18 | 6.3%), Irish (18 | 6.3%), and Eastern European (16 | 5.6%), together accounting for 68.8% of all Chupadero residents.
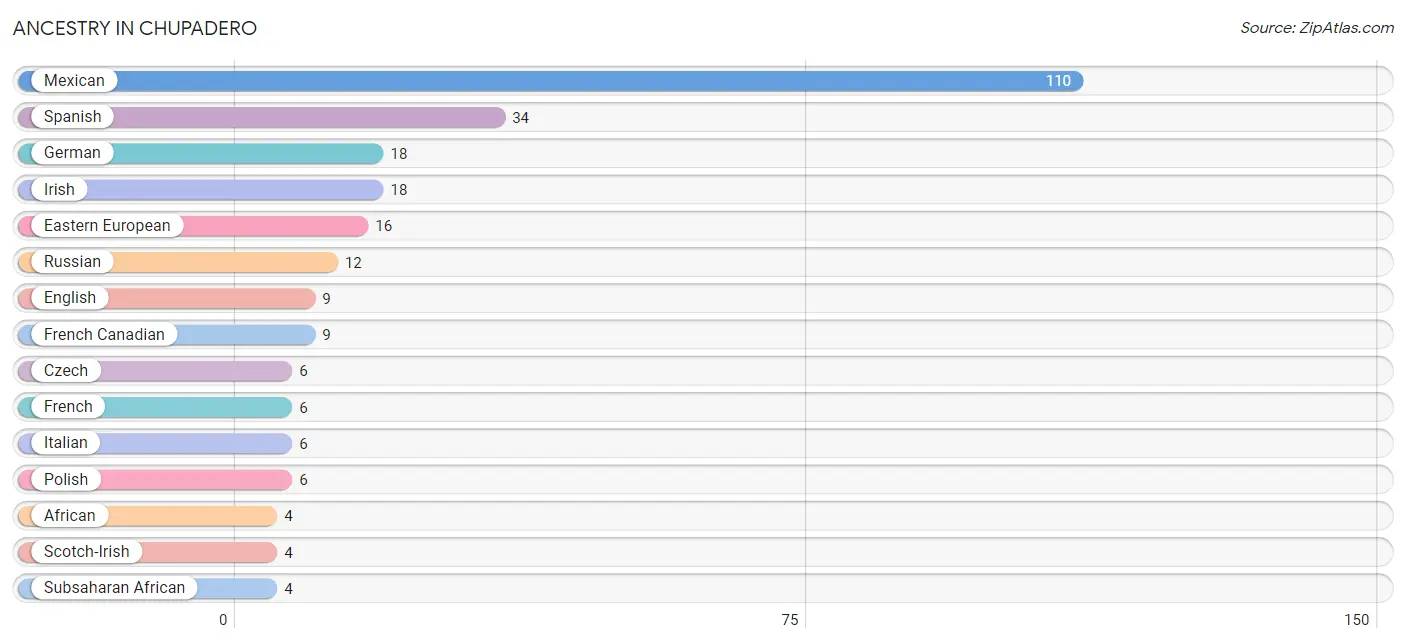
| Ancestry | # Population | % Population |
| African | 4 | 1.4% |
| Czech | 6 | 2.1% |
| Eastern European | 16 | 5.6% |
| English | 9 | 3.2% |
| French | 6 | 2.1% |
| French Canadian | 9 | 3.2% |
| German | 18 | 6.3% |
| Irish | 18 | 6.3% |
| Italian | 6 | 2.1% |
| Mexican | 110 | 38.6% |
| Norwegian | 3 | 1.1% |
| Polish | 6 | 2.1% |
| Russian | 12 | 4.2% |
| Scotch-Irish | 4 | 1.4% |
| Spanish | 34 | 11.9% |
| Subsaharan African | 4 | 1.4% | View All 16 Rows |
Immigrants in Chupadero
The most numerous immigrant groups reported in Chupadero came from England (13 | 4.6%), Europe (13 | 4.6%), Northern Europe (13 | 4.6%), and Canada (3 | 1.1%), together accounting for 14.7% of all Chupadero residents.
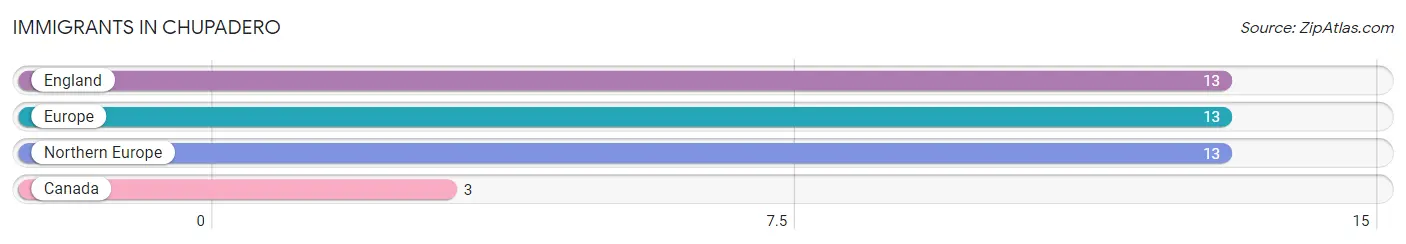
| Immigration Origin | # Population | % Population |
| Canada | 3 | 1.1% |
| England | 13 | 4.6% |
| Europe | 13 | 4.6% |
| Northern Europe | 13 | 4.6% | View All 4 Rows |
Sex and Age in Chupadero
Sex and Age in Chupadero
The most populous age groups in Chupadero are 45 to 49 Years (69 | 56.1%) for men and 15 to 19 Years (37 | 22.8%) for women.
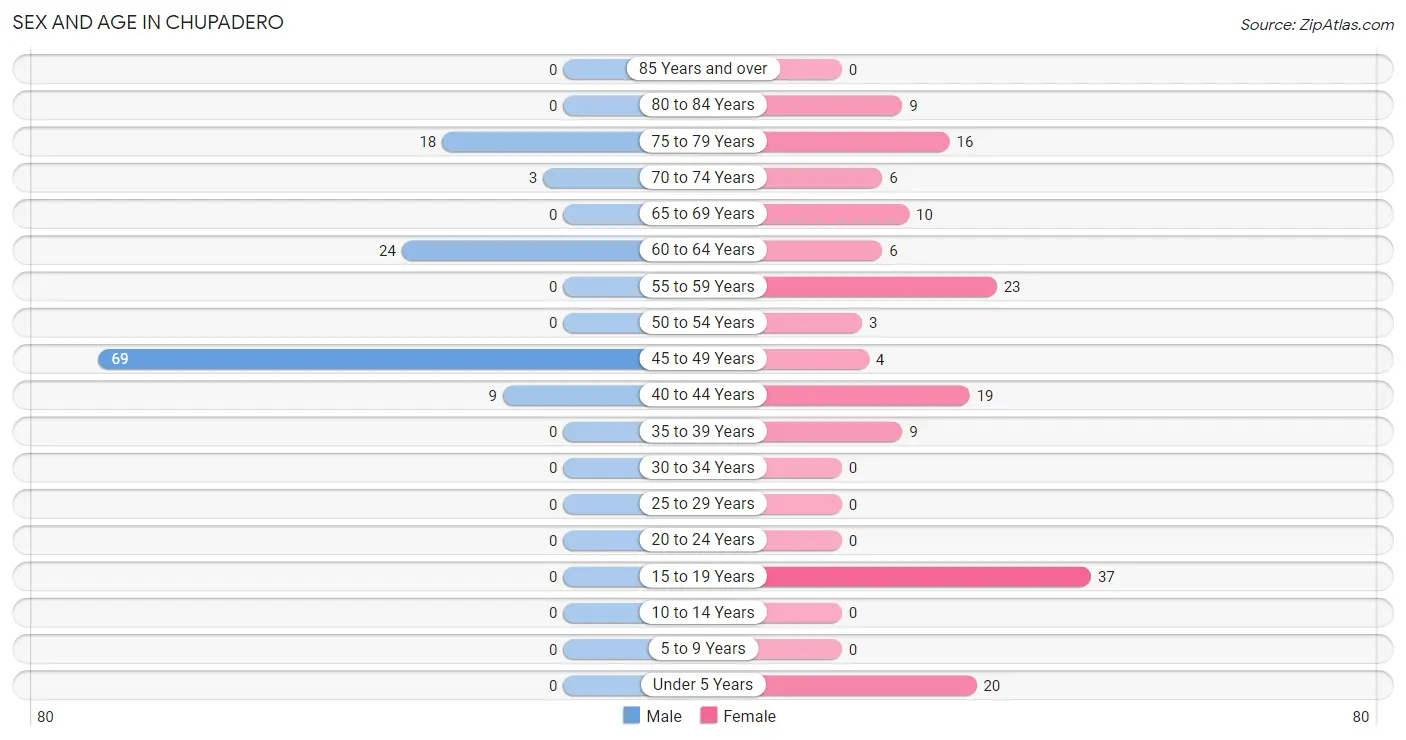
| Age Bracket | Male | Female |
| Under 5 Years | 0 (0.0%) | 20 (12.3%) |
| 5 to 9 Years | 0 (0.0%) | 0 (0.0%) |
| 10 to 14 Years | 0 (0.0%) | 0 (0.0%) |
| 15 to 19 Years | 0 (0.0%) | 37 (22.8%) |
| 20 to 24 Years | 0 (0.0%) | 0 (0.0%) |
| 25 to 29 Years | 0 (0.0%) | 0 (0.0%) |
| 30 to 34 Years | 0 (0.0%) | 0 (0.0%) |
| 35 to 39 Years | 0 (0.0%) | 9 (5.6%) |
| 40 to 44 Years | 9 (7.3%) | 19 (11.7%) |
| 45 to 49 Years | 69 (56.1%) | 4 (2.5%) |
| 50 to 54 Years | 0 (0.0%) | 3 (1.8%) |
| 55 to 59 Years | 0 (0.0%) | 23 (14.2%) |
| 60 to 64 Years | 24 (19.5%) | 6 (3.7%) |
| 65 to 69 Years | 0 (0.0%) | 10 (6.2%) |
| 70 to 74 Years | 3 (2.4%) | 6 (3.7%) |
| 75 to 79 Years | 18 (14.6%) | 16 (9.9%) |
| 80 to 84 Years | 0 (0.0%) | 9 (5.6%) |
| 85 Years and over | 0 (0.0%) | 0 (0.0%) |
| Total | 123 (100.0%) | 162 (100.0%) |
Families and Households in Chupadero
Median Family Size in Chupadero
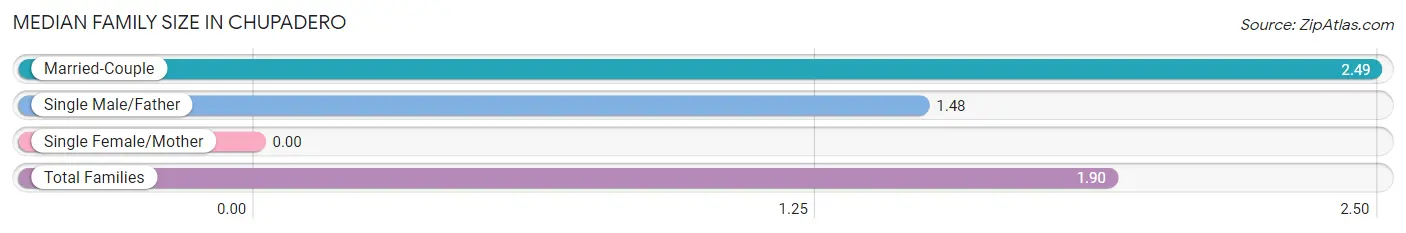
| Family Type | # Families | Family Size |
| Married-Couple | 45 (41.3%) | 2.49 |
| Single Male/Father | 64 (58.7%) | 1.48 |
| Single Female/Mother | 0 (0.0%) | - |
| Total Families | 109 (100.0%) | 1.90 |
Median Household Size in Chupadero
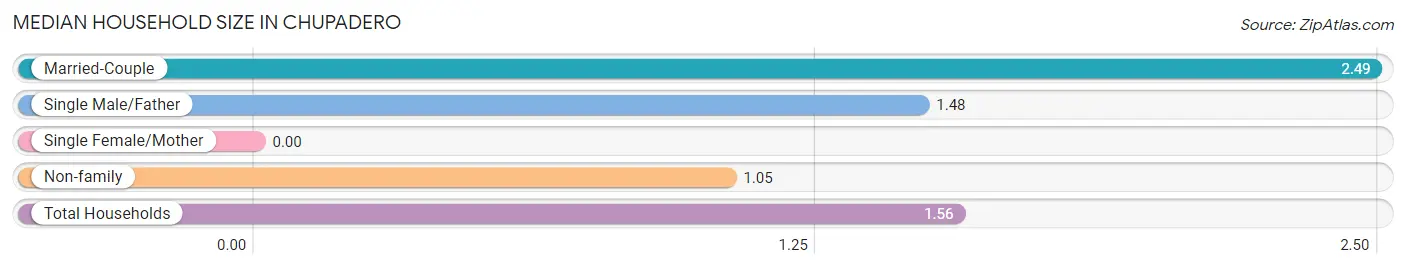
| Household Type | # Households | Household Size |
| Married-Couple | 45 (24.6%) | 2.49 |
| Single Male/Father | 64 (35.0%) | 1.48 |
| Single Female/Mother | 0 (0.0%) | - |
| Non-family | 74 (40.4%) | 1.05 |
| Total Households | 183 (100.0%) | 1.56 |
Household Size by Marriage Status in Chupadero
Out of a total of 183 households in Chupadero, 109 (59.6%) are family households, while 74 (40.4%) are nonfamily households. The most numerous type of family households are 2-person households, comprising 89, and the most common type of nonfamily households are 1-person households, comprising 70.
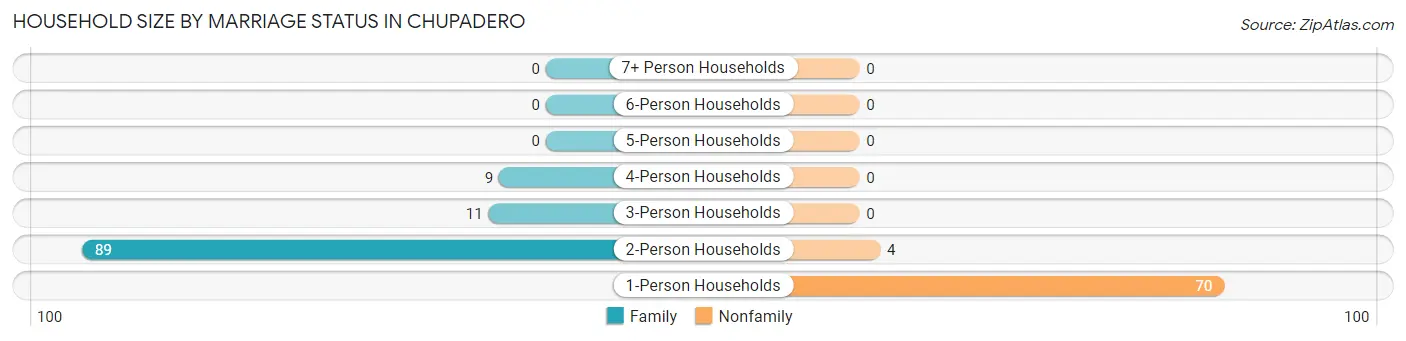
| Household Size | Family Households | Nonfamily Households |
| 1-Person Households | - | 70 (38.3%) |
| 2-Person Households | 89 (48.6%) | 4 (2.2%) |
| 3-Person Households | 11 (6.0%) | 0 (0.0%) |
| 4-Person Households | 9 (4.9%) | 0 (0.0%) |
| 5-Person Households | 0 (0.0%) | 0 (0.0%) |
| 6-Person Households | 0 (0.0%) | 0 (0.0%) |
| 7+ Person Households | 0 (0.0%) | 0 (0.0%) |
| Total | 109 (59.6%) | 74 (40.4%) |
Female Fertility in Chupadero
Fertility by Age in Chupadero
Average fertility rate in Chupadero is 72.0 births per 1,000 women. Women in the age bracket of 35 to 50 years have the highest fertility rate with 156.0 births per 1,000 women. Women in the age bracket of 35 to 50 years acount for 100.0% of all women with births.
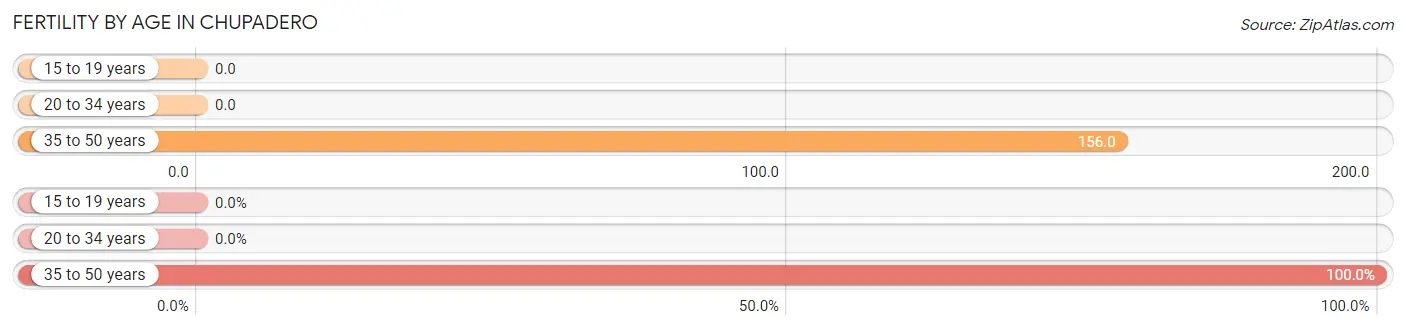
| Age Bracket | Women with Births | Births / 1,000 Women |
| 15 to 19 years | 0 (0.0%) | 0.0 |
| 20 to 34 years | 0 (0.0%) | 0.0 |
| 35 to 50 years | 5 (100.0%) | 156.0 |
| Total | 5 (100.0%) | 72.0 |
Fertility by Age by Marriage Status in Chupadero
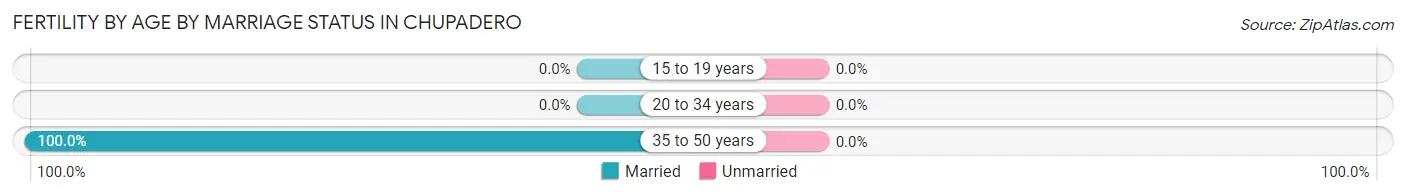
| Age Bracket | Married | Unmarried |
| 15 to 19 years | 0 (0.0%) | 0 (0.0%) |
| 20 to 34 years | 0 (0.0%) | 0 (0.0%) |
| 35 to 50 years | 5 (100.0%) | 0 (0.0%) |
| Total | 5 (100.0%) | 0 (0.0%) |
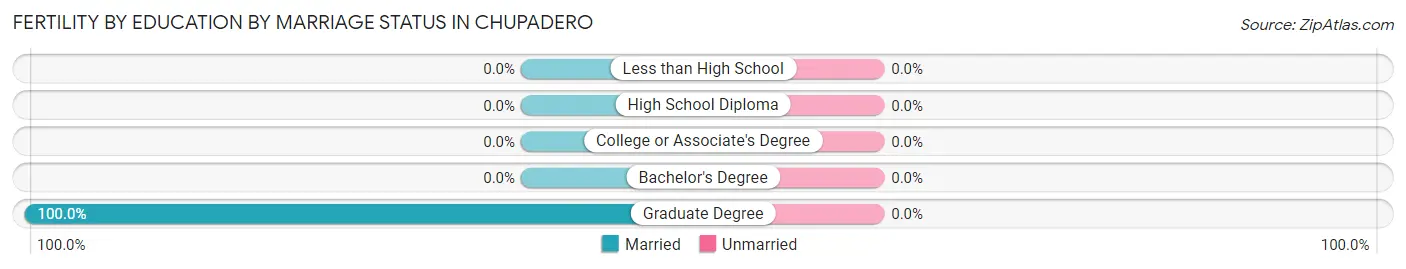
Fertility by Education in Chupadero
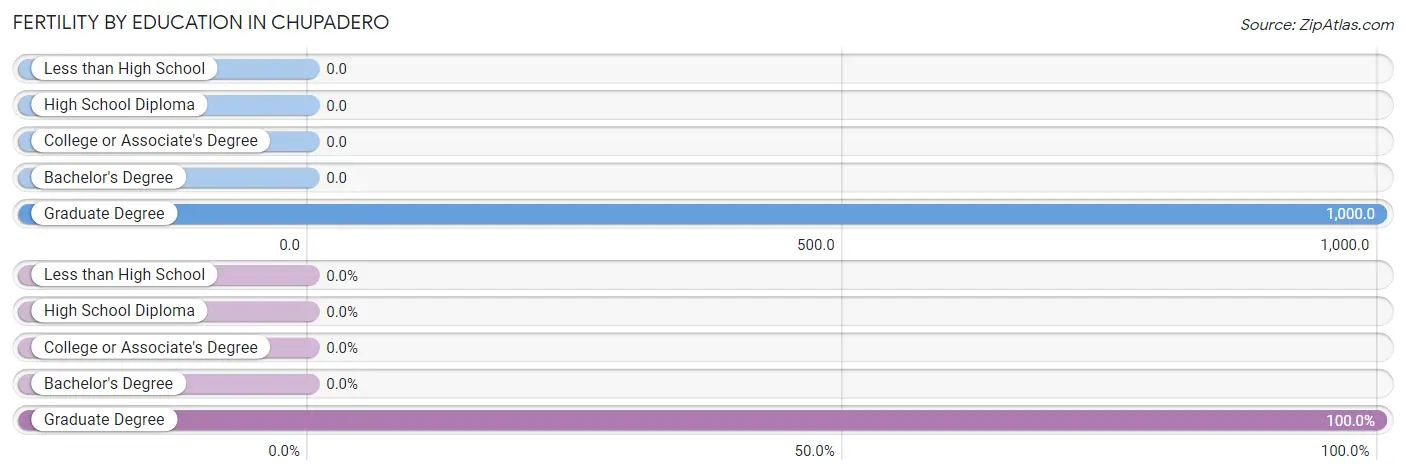
| Educational Attainment | Women with Births | Births / 1,000 Women |
| Less than High School | 0 (0.0%) | 0.0 |
| High School Diploma | 0 (0.0%) | 0.0 |
| College or Associate's Degree | 0 (0.0%) | 0.0 |
| Bachelor's Degree | 0 (0.0%) | 0.0 |
| Graduate Degree | 5 (100.0%) | 1,000.0 |
| Total | 5 (100.0%) | 72.0 |
Fertility by Education by Marriage Status in Chupadero
| Educational Attainment | Married | Unmarried |
| Less than High School | 0 (0.0%) | 0 (0.0%) |
| High School Diploma | 0 (0.0%) | 0 (0.0%) |
| College or Associate's Degree | 0 (0.0%) | 0 (0.0%) |
| Bachelor's Degree | 0 (0.0%) | 0 (0.0%) |
| Graduate Degree | 5 (100.0%) | 0 (0.0%) |
| Total | 5 (100.0%) | 0 (0.0%) |
Employment Characteristics in Chupadero
Employment by Class of Employer in Chupadero
Among the 183 employed individuals in Chupadero, federal government employees (64 | 35.0%), private company employees (47 | 25.7%), and not-for-profit organizations (46 | 25.1%) make up the most common classes of employment.
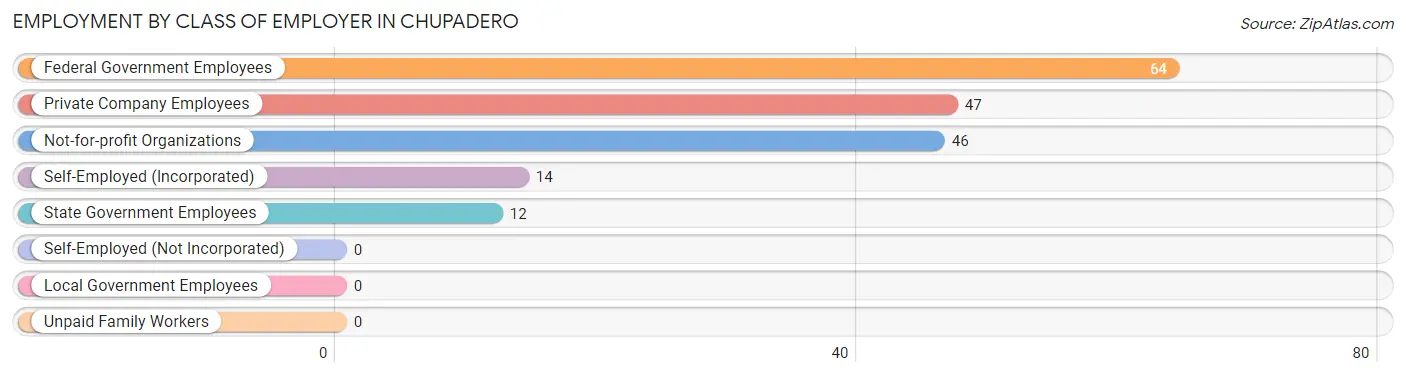
| Employer Class | # Employees | % Employees |
| Private Company Employees | 47 | 25.7% |
| Self-Employed (Incorporated) | 14 | 7.6% |
| Self-Employed (Not Incorporated) | 0 | 0.0% |
| Not-for-profit Organizations | 46 | 25.1% |
| Local Government Employees | 0 | 0.0% |
| State Government Employees | 12 | 6.6% |
| Federal Government Employees | 64 | 35.0% |
| Unpaid Family Workers | 0 | 0.0% |
| Total | 183 | 100.0% |
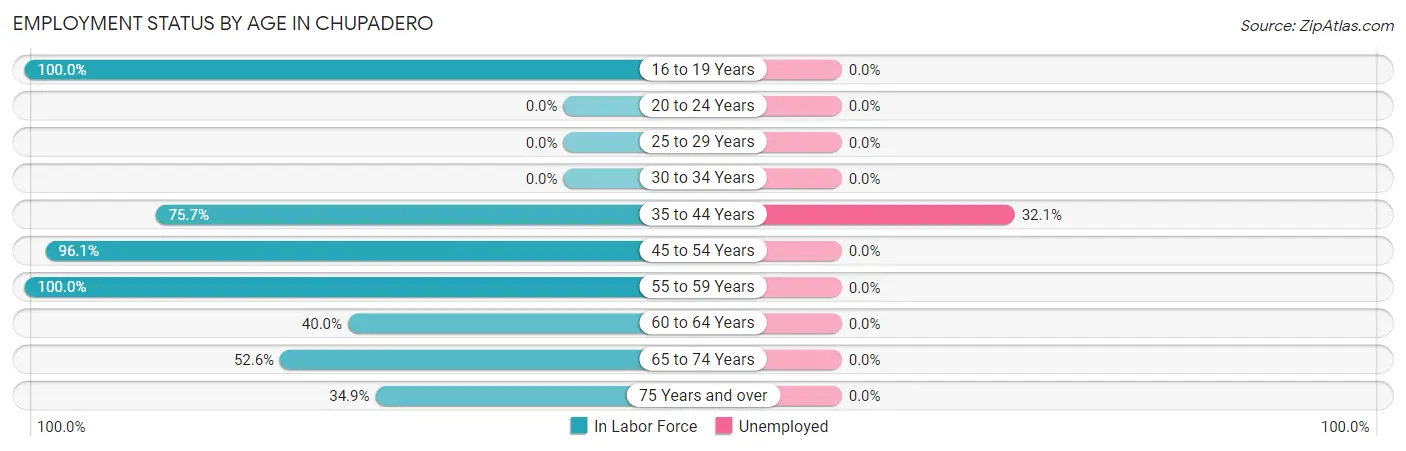
Employment Status by Age in Chupadero
According to the labor force statistics for Chupadero, out of the total population over 16 years of age (259), 74.1% or 192 individuals are in the labor force, with 4.7% or 9 of them unemployed. The age group with the highest labor force participation rate is 16 to 19 years, with 100.0% or 31 individuals in the labor force. Within the labor force, the 35 to 44 years age range has the highest percentage of unemployed individuals, with 32.1% or 9 of them being unemployed.
| Age Bracket | In Labor Force | Unemployed |
| 16 to 19 Years | 31 (100.0%) | 0 (0.0%) |
| 20 to 24 Years | 0 (0.0%) | 0 (0.0%) |
| 25 to 29 Years | 0 (0.0%) | 0 (0.0%) |
| 30 to 34 Years | 0 (0.0%) | 0 (0.0%) |
| 35 to 44 Years | 28 (75.7%) | 9 (32.1%) |
| 45 to 54 Years | 73 (96.1%) | 0 (0.0%) |
| 55 to 59 Years | 23 (100.0%) | 0 (0.0%) |
| 60 to 64 Years | 12 (40.0%) | 0 (0.0%) |
| 65 to 74 Years | 10 (52.6%) | 0 (0.0%) |
| 75 Years and over | 15 (34.9%) | 0 (0.0%) |
| Total | 192 (74.1%) | 9 (4.7%) |
Employment Status by Educational Attainment in Chupadero
According to labor force statistics for Chupadero, 81.9% of individuals (136) out of the total population between 25 and 64 years of age (166) are in the labor force, with 6.6% or 9 of them being unemployed. The group with the highest labor force participation rate are those with the educational attainment of high school diploma, with 87.7% or 64 individuals in the labor force. Within the labor force, individuals with bachelor's degree or higher education have the highest percentage of unemployment, with 18.4% or 9 of them being unemployed.
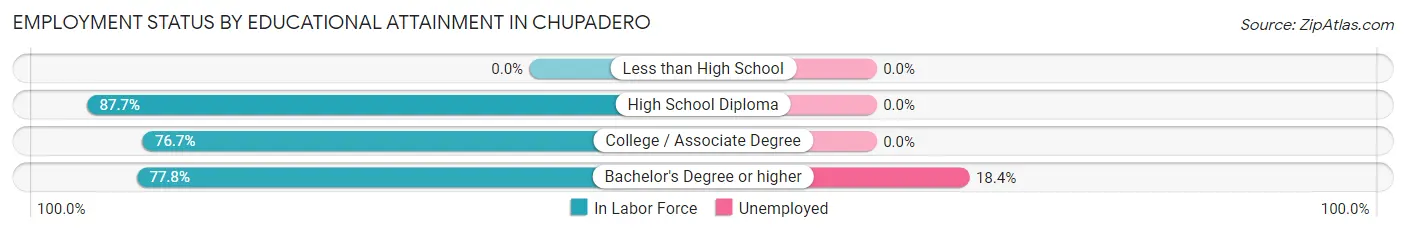
| Educational Attainment | In Labor Force | Unemployed |
| Less than High School | 0 (0.0%) | 0 (0.0%) |
| High School Diploma | 64 (87.7%) | 0 (0.0%) |
| College / Associate Degree | 23 (76.7%) | 0 (0.0%) |
| Bachelor's Degree or higher | 49 (77.8%) | 12 (18.4%) |
| Total | 136 (81.9%) | 11 (6.6%) |
Employment Occupations by Sex in Chupadero
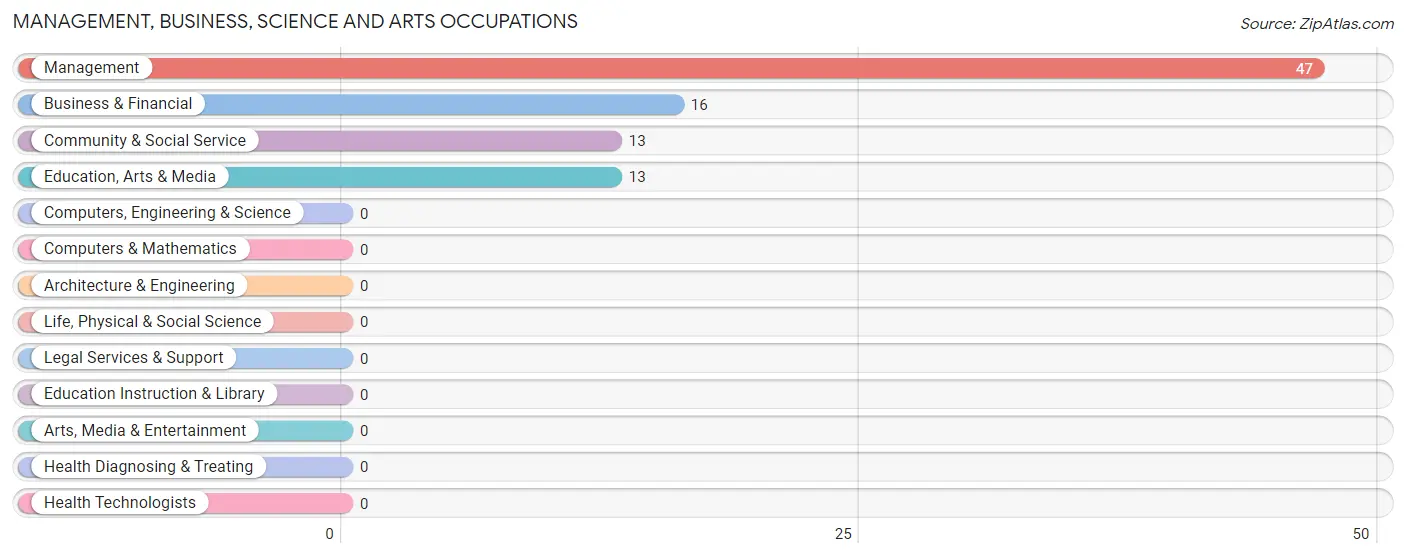
Management, Business, Science and Arts Occupations
The most common Management, Business, Science and Arts occupations in Chupadero are Management (47 | 25.7%), Business & Financial (16 | 8.7%), Community & Social Service (13 | 7.1%), and Education, Arts & Media (13 | 7.1%).
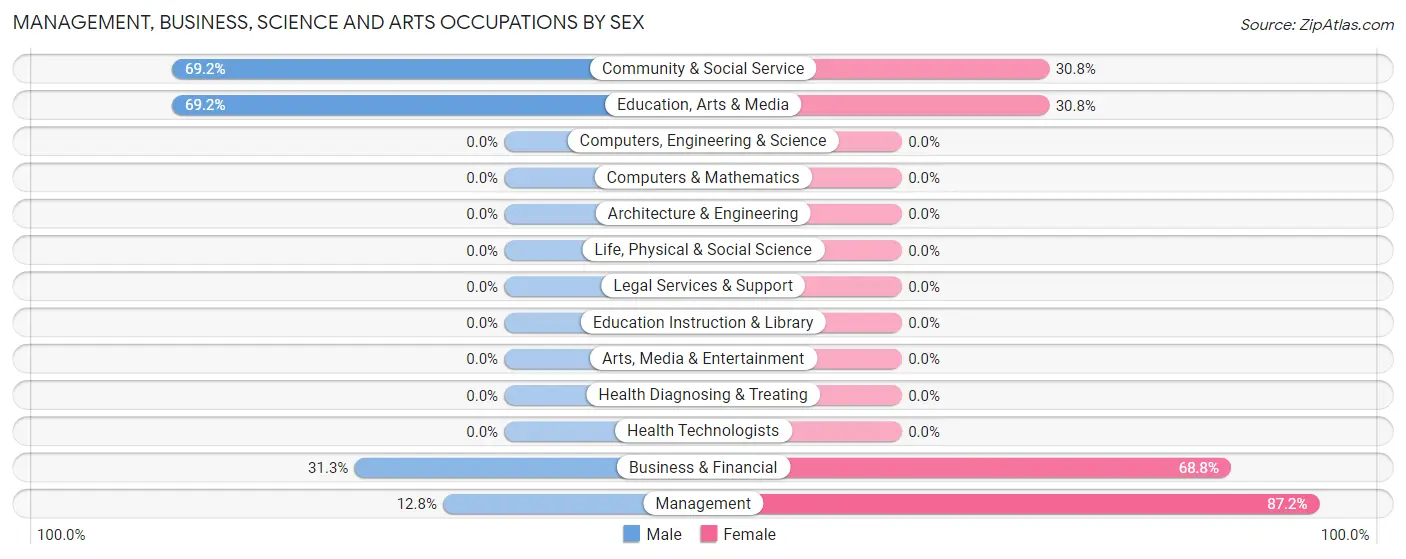
Management, Business, Science and Arts Occupations by Sex
Within the Management, Business, Science and Arts occupations in Chupadero, the most male-oriented occupations are Community & Social Service (69.2%), Education, Arts & Media (69.2%), and Business & Financial (31.2%), while the most female-oriented occupations are Management (87.2%), Business & Financial (68.8%), and Community & Social Service (30.8%).
| Occupation | Male | Female |
| Management | 6 (12.8%) | 41 (87.2%) |
| Business & Financial | 5 (31.2%) | 11 (68.8%) |
| Computers, Engineering & Science | 0 (0.0%) | 0 (0.0%) |
| Computers & Mathematics | 0 (0.0%) | 0 (0.0%) |
| Architecture & Engineering | 0 (0.0%) | 0 (0.0%) |
| Life, Physical & Social Science | 0 (0.0%) | 0 (0.0%) |
| Community & Social Service | 9 (69.2%) | 4 (30.8%) |
| Education, Arts & Media | 9 (69.2%) | 4 (30.8%) |
| Legal Services & Support | 0 (0.0%) | 0 (0.0%) |
| Education Instruction & Library | 0 (0.0%) | 0 (0.0%) |
| Arts, Media & Entertainment | 0 (0.0%) | 0 (0.0%) |
| Health Diagnosing & Treating | 0 (0.0%) | 0 (0.0%) |
| Health Technologists | 0 (0.0%) | 0 (0.0%) |
| Total (Category) | 20 (26.3%) | 56 (73.7%) |
| Total (Overall) | 90 (49.2%) | 93 (50.8%) |
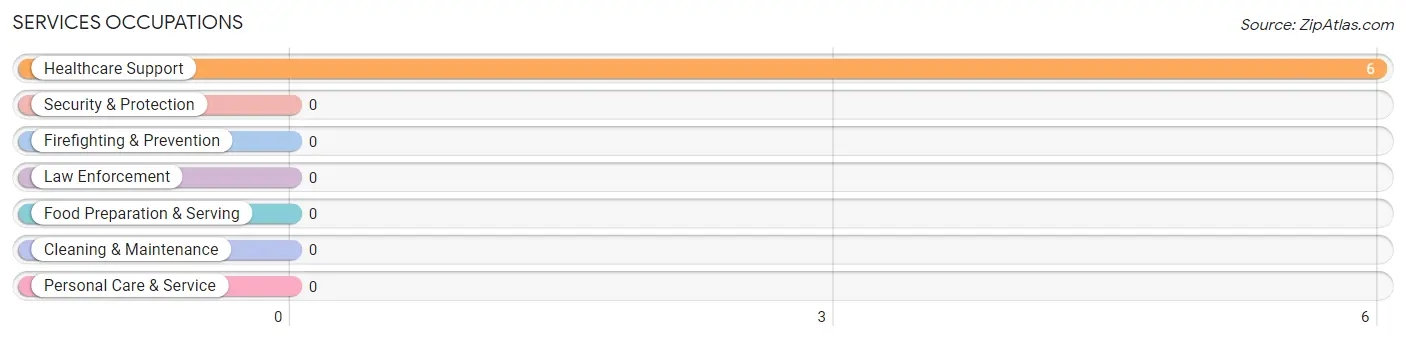
Services Occupations
The most common Services occupations in Chupadero are , and Healthcare Support (6 | 3.3%).
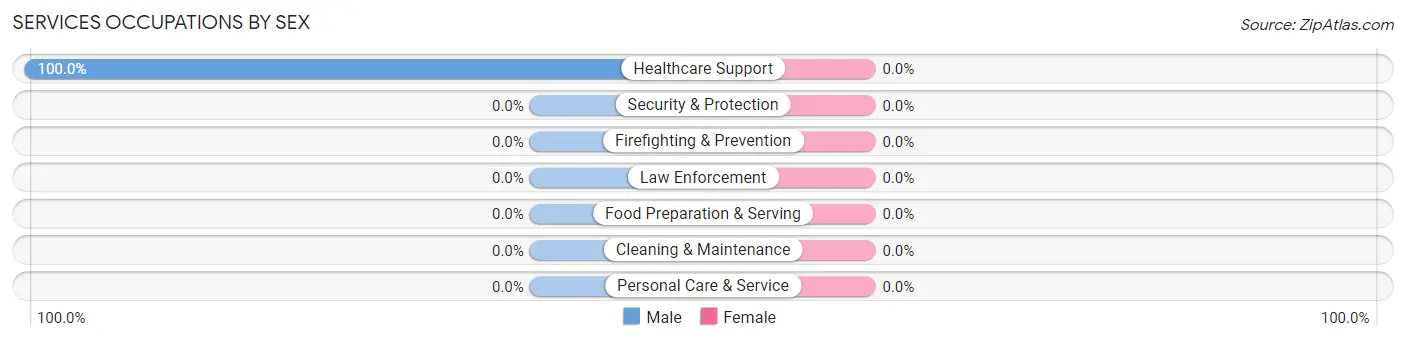
Services Occupations by Sex
| Occupation | Male | Female |
| Healthcare Support | 6 (100.0%) | 0 (0.0%) |
| Security & Protection | 0 (0.0%) | 0 (0.0%) |
| Firefighting & Prevention | 0 (0.0%) | 0 (0.0%) |
| Law Enforcement | 0 (0.0%) | 0 (0.0%) |
| Food Preparation & Serving | 0 (0.0%) | 0 (0.0%) |
| Cleaning & Maintenance | 0 (0.0%) | 0 (0.0%) |
| Personal Care & Service | 0 (0.0%) | 0 (0.0%) |
| Total (Category) | 6 (100.0%) | 0 (0.0%) |
| Total (Overall) | 90 (49.2%) | 93 (50.8%) |
Sales and Office Occupations
The most common Sales and Office occupations in Chupadero are , and Office & Administration (37 | 20.2%).
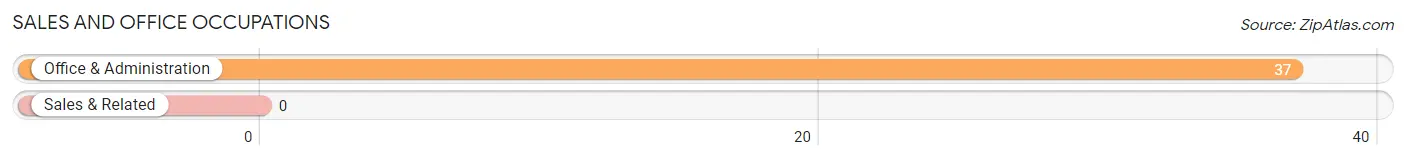
Sales and Office Occupations by Sex

| Occupation | Male | Female |
| Sales & Related | 0 (0.0%) | 0 (0.0%) |
| Office & Administration | 0 (0.0%) | 37 (100.0%) |
| Total (Category) | 0 (0.0%) | 37 (100.0%) |
| Total (Overall) | 90 (49.2%) | 93 (50.8%) |
Natural Resources, Construction and Maintenance Occupations
The most common Natural Resources, Construction and Maintenance occupations in Chupadero are , and Construction & Extraction (64 | 35.0%).
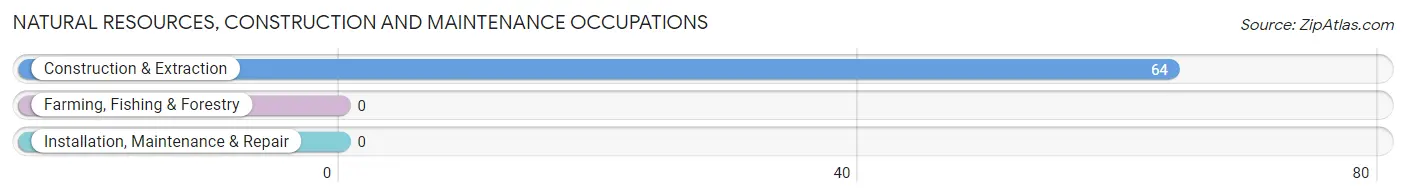
Natural Resources, Construction and Maintenance Occupations by Sex

| Occupation | Male | Female |
| Farming, Fishing & Forestry | 0 (0.0%) | 0 (0.0%) |
| Construction & Extraction | 64 (100.0%) | 0 (0.0%) |
| Installation, Maintenance & Repair | 0 (0.0%) | 0 (0.0%) |
| Total (Category) | 64 (100.0%) | 0 (0.0%) |
| Total (Overall) | 90 (49.2%) | 93 (50.8%) |
Production, Transportation and Moving Occupations
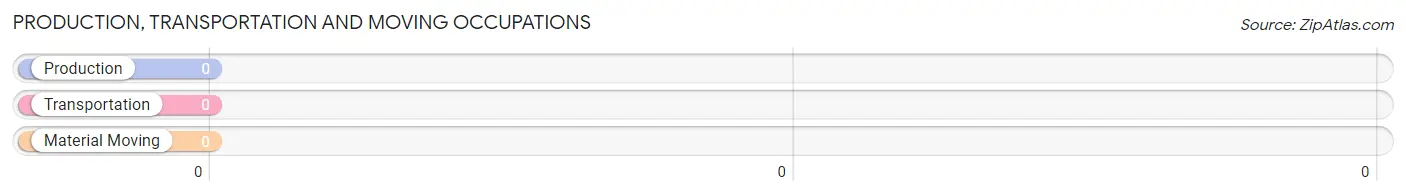
Production, Transportation and Moving Occupations by Sex
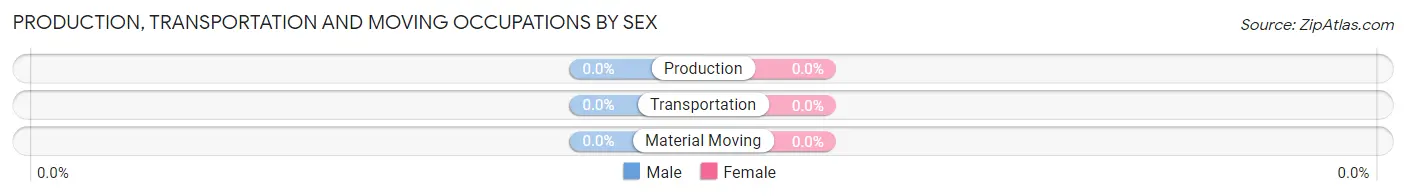
| Occupation | Male | Female |
| Production | 0 (0.0%) | 0 (0.0%) |
| Transportation | 0 (0.0%) | 0 (0.0%) |
| Material Moving | 0 (0.0%) | 0 (0.0%) |
| Total (Category) | 0 (0.0%) | 0 (0.0%) |
| Total (Overall) | 90 (49.2%) | 93 (50.8%) |
Employment Industries by Sex in Chupadero
Employment Industries in Chupadero
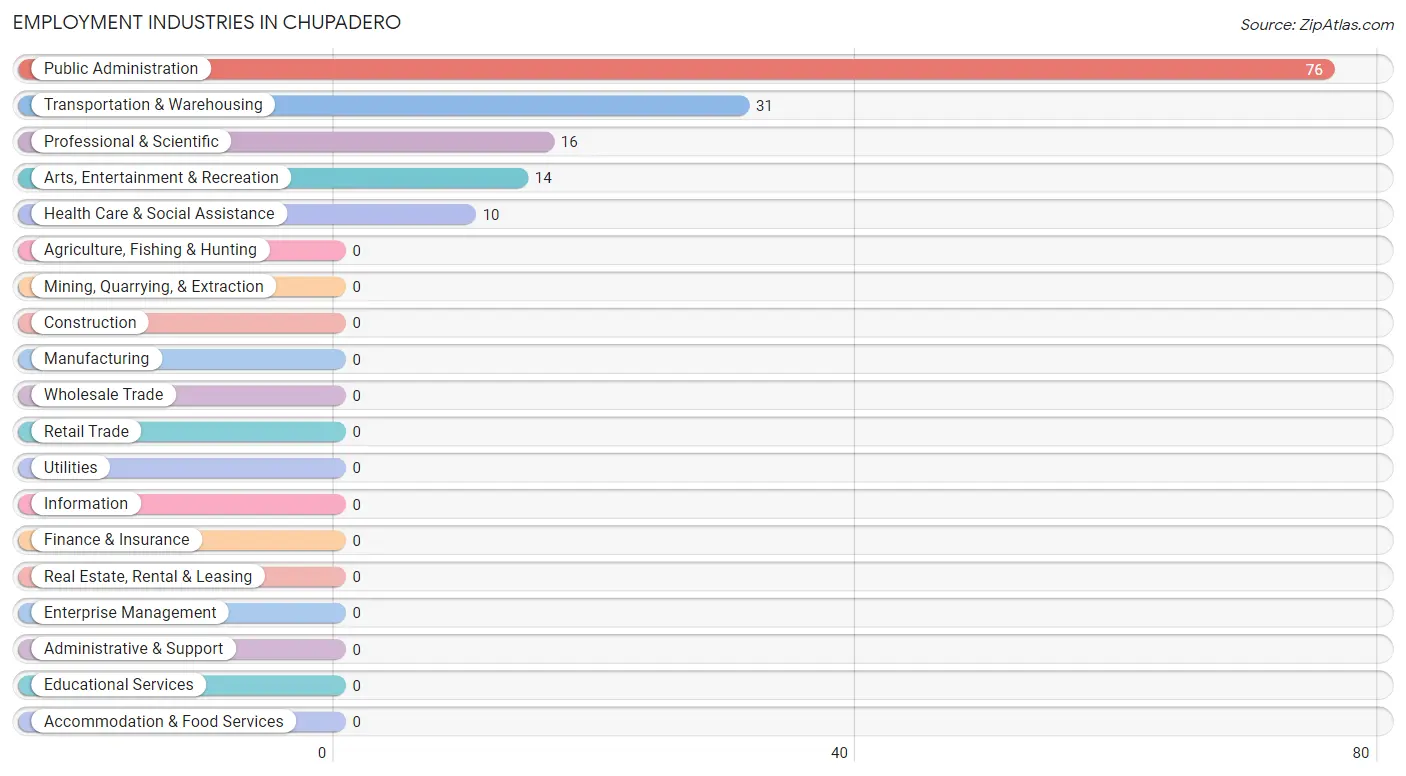
The major employment industries in Chupadero include Public Administration (76 | 41.5%), Transportation & Warehousing (31 | 16.9%), Professional & Scientific (16 | 8.7%), Arts, Entertainment & Recreation (14 | 7.6%), and Health Care & Social Assistance (10 | 5.5%).
Employment Industries by Sex in Chupadero
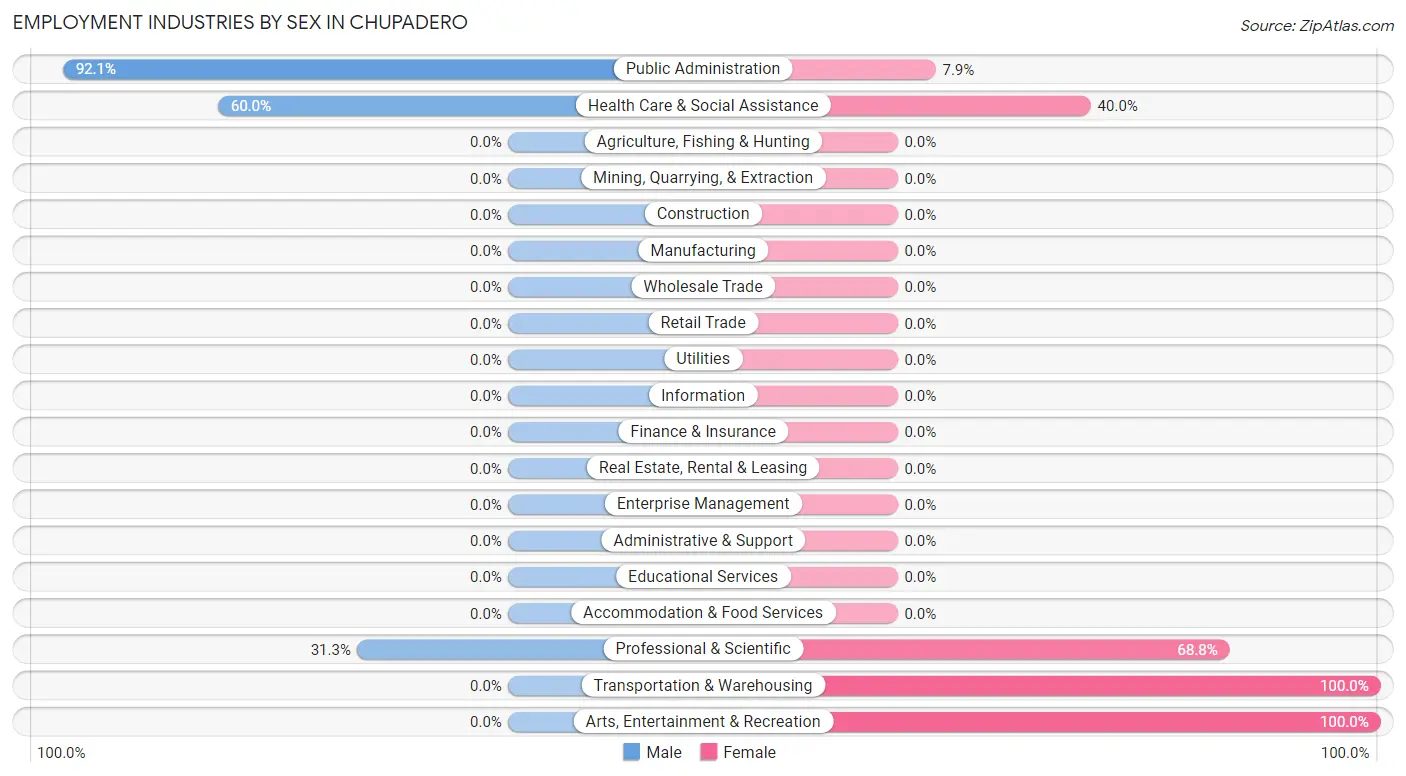
The Chupadero industries that see more men than women are Public Administration (92.1%), Health Care & Social Assistance (60.0%), and Professional & Scientific (31.2%), whereas the industries that tend to have a higher number of women are Transportation & Warehousing (100.0%), Arts, Entertainment & Recreation (100.0%), and Professional & Scientific (68.8%).
| Industry | Male | Female |
| Agriculture, Fishing & Hunting | 0 (0.0%) | 0 (0.0%) |
| Mining, Quarrying, & Extraction | 0 (0.0%) | 0 (0.0%) |
| Construction | 0 (0.0%) | 0 (0.0%) |
| Manufacturing | 0 (0.0%) | 0 (0.0%) |
| Wholesale Trade | 0 (0.0%) | 0 (0.0%) |
| Retail Trade | 0 (0.0%) | 0 (0.0%) |
| Transportation & Warehousing | 0 (0.0%) | 31 (100.0%) |
| Utilities | 0 (0.0%) | 0 (0.0%) |
| Information | 0 (0.0%) | 0 (0.0%) |
| Finance & Insurance | 0 (0.0%) | 0 (0.0%) |
| Real Estate, Rental & Leasing | 0 (0.0%) | 0 (0.0%) |
| Professional & Scientific | 5 (31.2%) | 11 (68.8%) |
| Enterprise Management | 0 (0.0%) | 0 (0.0%) |
| Administrative & Support | 0 (0.0%) | 0 (0.0%) |
| Educational Services | 0 (0.0%) | 0 (0.0%) |
| Health Care & Social Assistance | 6 (60.0%) | 4 (40.0%) |
| Arts, Entertainment & Recreation | 0 (0.0%) | 14 (100.0%) |
| Accommodation & Food Services | 0 (0.0%) | 0 (0.0%) |
| Public Administration | 70 (92.1%) | 6 (7.9%) |
| Total | 90 (49.2%) | 93 (50.8%) |
Education in Chupadero
School Enrollment in Chupadero
| School Level | # Students | % Students |
| Nursery / Preschool | 0 | 0.0% |
| Kindergarten | 0 | 0.0% |
| Elementary School | 0 | 0.0% |
| Middle School | 0 | 0.0% |
| High School | 0 | 0.0% |
| College / Undergraduate | 0 | 0.0% |
| Graduate / Professional | 0 | 0.0% |
| Total | 0 | 0.0% |
School Enrollment by Age by Funding Source in Chupadero
| Age Bracket | Public School | Private School |
| 3 to 4 Year Olds | 0 (0.0%) | 0 (0.0%) |
| 5 to 9 Year Old | 0 (0.0%) | 0 (0.0%) |
| 10 to 14 Year Olds | 0 (0.0%) | 0 (0.0%) |
| 15 to 17 Year Olds | 0 (0.0%) | 0 (0.0%) |
| 18 to 19 Year Olds | 0 (0.0%) | 0 (0.0%) |
| 20 to 24 Year Olds | 0 (0.0%) | 0 (0.0%) |
| 25 to 34 Year Olds | 0 (0.0%) | 0 (0.0%) |
| 35 Years and over | 0 (0.0%) | 0 (0.0%) |
| Total | 0 (0.0%) | 0 (0.0%) |
Educational Attainment by Field of Study in Chupadero
Literature & languages (29 | 25.4%), bio, nature & agricultural (20 | 17.5%), business (14 | 12.3%), computers & mathematics (13 | 11.4%), and physical & health sciences (12 | 10.5%) are the most common fields of study among 114 individuals in Chupadero who have obtained a bachelor's degree or higher.
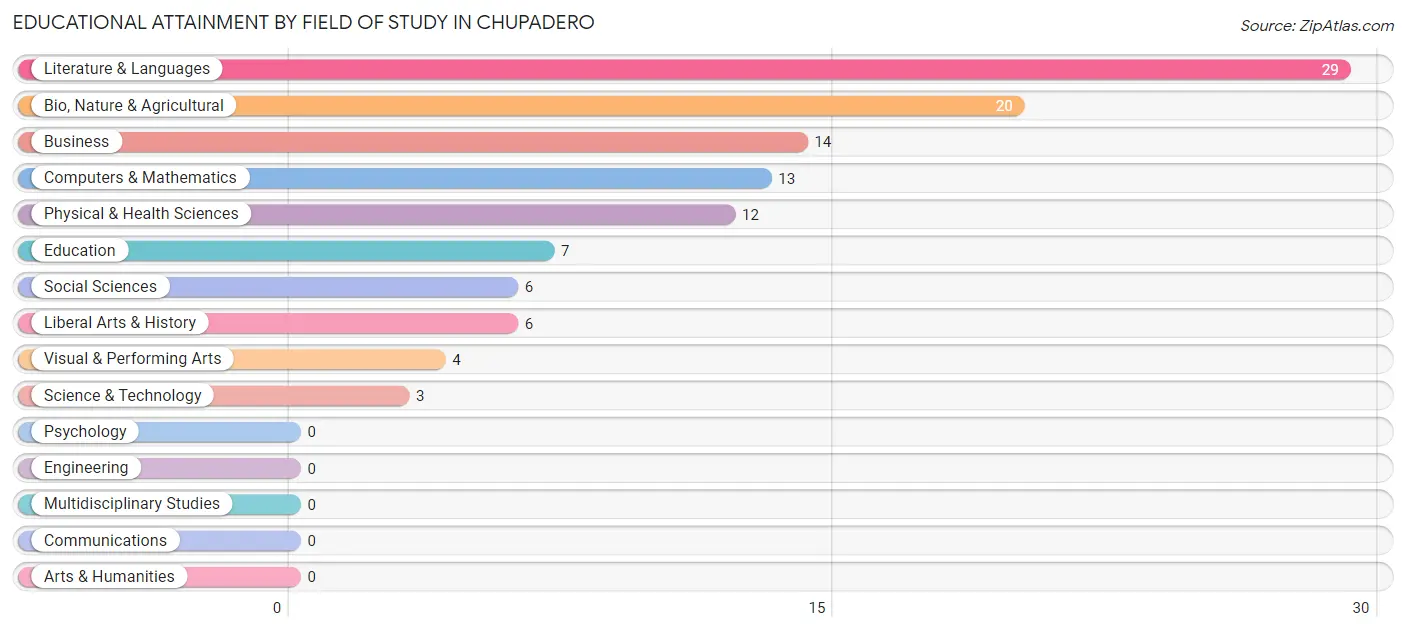
| Field of Study | # Graduates | % Graduates |
| Computers & Mathematics | 13 | 11.4% |
| Bio, Nature & Agricultural | 20 | 17.5% |
| Physical & Health Sciences | 12 | 10.5% |
| Psychology | 0 | 0.0% |
| Social Sciences | 6 | 5.3% |
| Engineering | 0 | 0.0% |
| Multidisciplinary Studies | 0 | 0.0% |
| Science & Technology | 3 | 2.6% |
| Business | 14 | 12.3% |
| Education | 7 | 6.1% |
| Literature & Languages | 29 | 25.4% |
| Liberal Arts & History | 6 | 5.3% |
| Visual & Performing Arts | 4 | 3.5% |
| Communications | 0 | 0.0% |
| Arts & Humanities | 0 | 0.0% |
| Total | 114 | 100.0% |
Transportation & Commute in Chupadero
Vehicle Availability by Sex in Chupadero
The most prevalent vehicle ownership categories in Chupadero are males with 3 vehicles (64, accounting for 71.1%) and females with 3 vehicles (31, making up 68.8%).
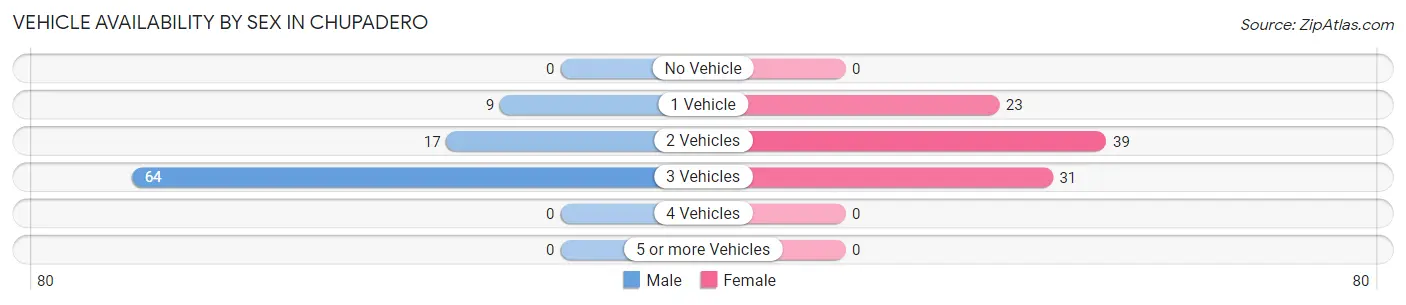
| Vehicles Available | Male | Female |
| No Vehicle | 0 (0.0%) | 0 (0.0%) |
| 1 Vehicle | 9 (10.0%) | 23 (24.7%) |
| 2 Vehicles | 17 (18.9%) | 39 (41.9%) |
| 3 Vehicles | 64 (71.1%) | 31 (33.3%) |
| 4 Vehicles | 0 (0.0%) | 0 (0.0%) |
| 5 or more Vehicles | 0 (0.0%) | 0 (0.0%) |
| Total | 90 (100.0%) | 93 (100.0%) |
Commute Time in Chupadero
The most frequently occuring commute durations in Chupadero are 40 to 44 minutes (64 commuters, 40.3%), 30 to 34 minutes (53 commuters, 33.3%), and 45 to 59 minutes (23 commuters, 14.5%).
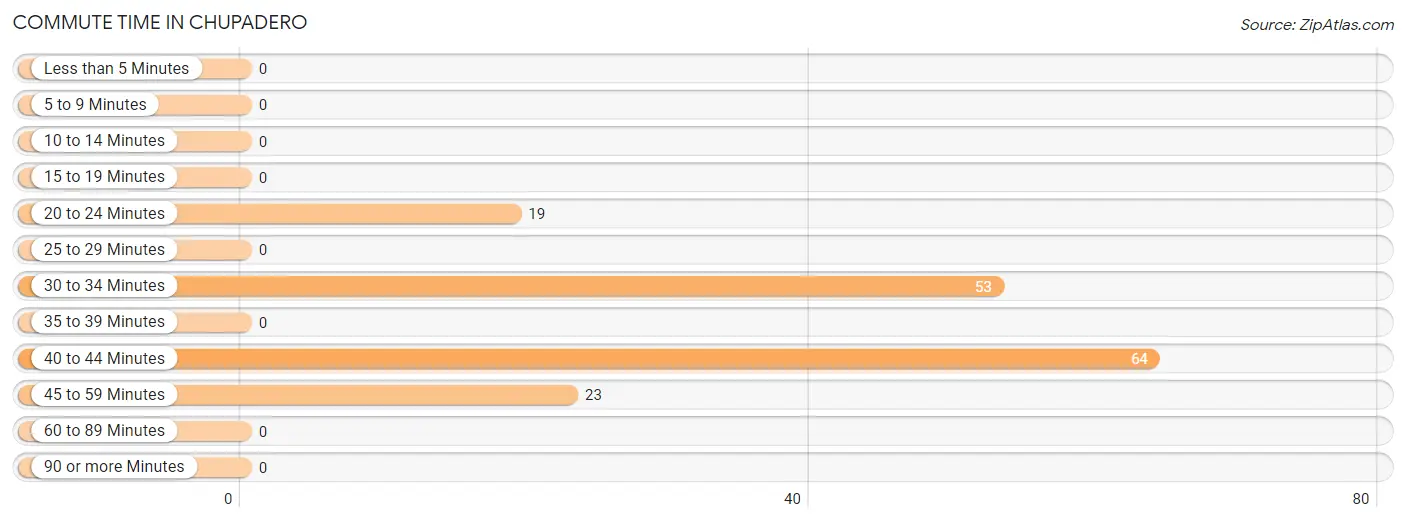
| Commute Time | # Commuters | % Commuters |
| Less than 5 Minutes | 0 | 0.0% |
| 5 to 9 Minutes | 0 | 0.0% |
| 10 to 14 Minutes | 0 | 0.0% |
| 15 to 19 Minutes | 0 | 0.0% |
| 20 to 24 Minutes | 19 | 11.9% |
| 25 to 29 Minutes | 0 | 0.0% |
| 30 to 34 Minutes | 53 | 33.3% |
| 35 to 39 Minutes | 0 | 0.0% |
| 40 to 44 Minutes | 64 | 40.3% |
| 45 to 59 Minutes | 23 | 14.5% |
| 60 to 89 Minutes | 0 | 0.0% |
| 90 or more Minutes | 0 | 0.0% |
Commute Time by Sex in Chupadero
The most common commute times in Chupadero are 40 to 44 minutes (64 commuters, 82.1%) for males and 30 to 34 minutes (53 commuters, 65.4%) for females.
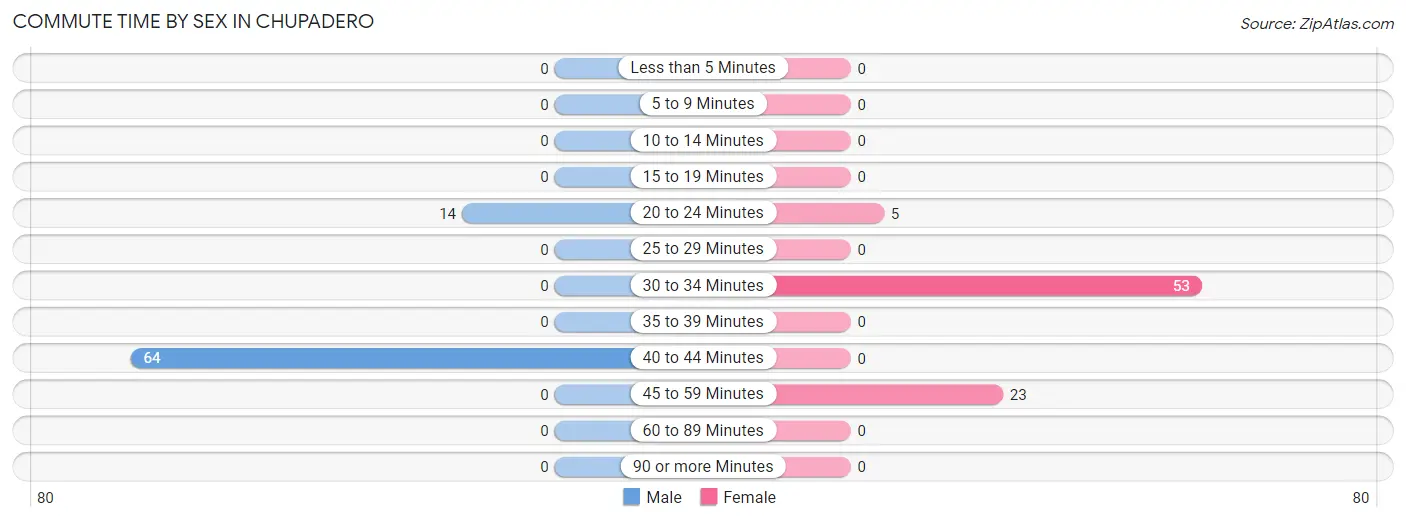
| Commute Time | Male | Female |
| Less than 5 Minutes | 0 (0.0%) | 0 (0.0%) |
| 5 to 9 Minutes | 0 (0.0%) | 0 (0.0%) |
| 10 to 14 Minutes | 0 (0.0%) | 0 (0.0%) |
| 15 to 19 Minutes | 0 (0.0%) | 0 (0.0%) |
| 20 to 24 Minutes | 14 (17.9%) | 5 (6.2%) |
| 25 to 29 Minutes | 0 (0.0%) | 0 (0.0%) |
| 30 to 34 Minutes | 0 (0.0%) | 53 (65.4%) |
| 35 to 39 Minutes | 0 (0.0%) | 0 (0.0%) |
| 40 to 44 Minutes | 64 (82.1%) | 0 (0.0%) |
| 45 to 59 Minutes | 0 (0.0%) | 23 (28.4%) |
| 60 to 89 Minutes | 0 (0.0%) | 0 (0.0%) |
| 90 or more Minutes | 0 (0.0%) | 0 (0.0%) |
Time of Departure to Work by Sex in Chupadero
The most frequent times of departure to work in Chupadero are 12:00 PM to 3:59 PM (64, 82.1%) for males and 8:00 AM to 8:29 AM (31, 38.3%) for females.
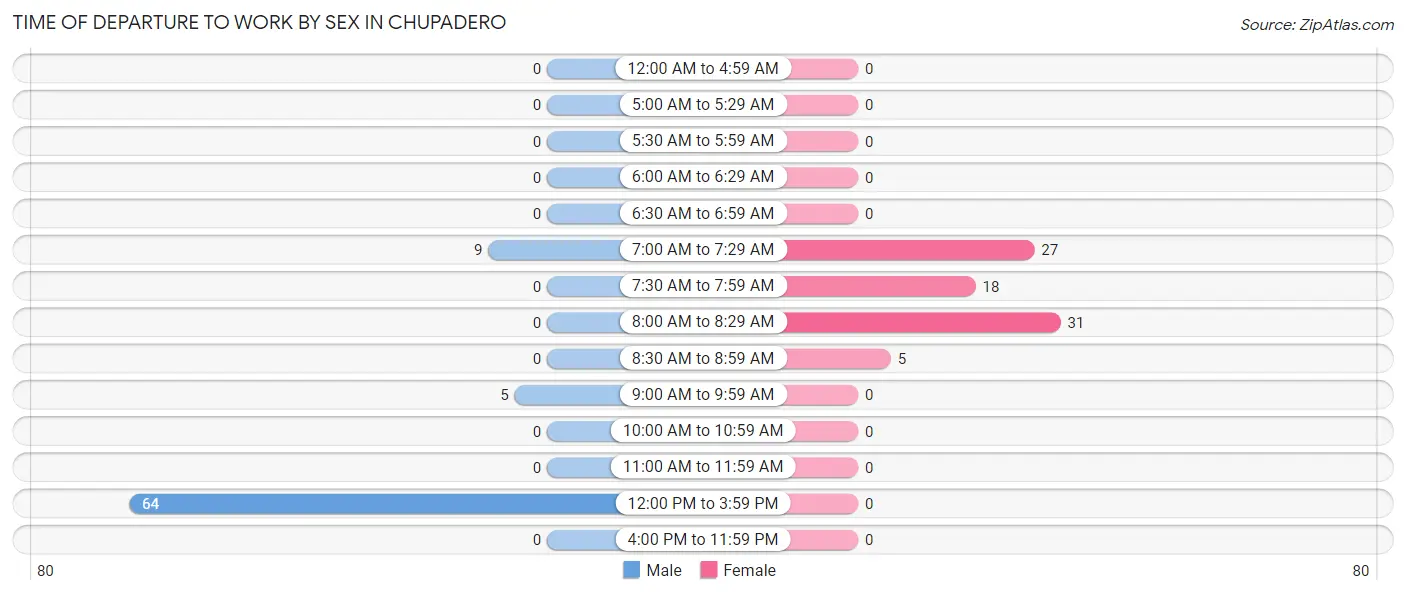
| Time of Departure | Male | Female |
| 12:00 AM to 4:59 AM | 0 (0.0%) | 0 (0.0%) |
| 5:00 AM to 5:29 AM | 0 (0.0%) | 0 (0.0%) |
| 5:30 AM to 5:59 AM | 0 (0.0%) | 0 (0.0%) |
| 6:00 AM to 6:29 AM | 0 (0.0%) | 0 (0.0%) |
| 6:30 AM to 6:59 AM | 0 (0.0%) | 0 (0.0%) |
| 7:00 AM to 7:29 AM | 9 (11.5%) | 27 (33.3%) |
| 7:30 AM to 7:59 AM | 0 (0.0%) | 18 (22.2%) |
| 8:00 AM to 8:29 AM | 0 (0.0%) | 31 (38.3%) |
| 8:30 AM to 8:59 AM | 0 (0.0%) | 5 (6.2%) |
| 9:00 AM to 9:59 AM | 5 (6.4%) | 0 (0.0%) |
| 10:00 AM to 10:59 AM | 0 (0.0%) | 0 (0.0%) |
| 11:00 AM to 11:59 AM | 0 (0.0%) | 0 (0.0%) |
| 12:00 PM to 3:59 PM | 64 (82.1%) | 0 (0.0%) |
| 4:00 PM to 11:59 PM | 0 (0.0%) | 0 (0.0%) |
| Total | 78 (100.0%) | 81 (100.0%) |
Housing Occupancy in Chupadero
Occupancy by Ownership in Chupadero
Of the total 183 dwellings in Chupadero, owner-occupied units account for 170 (92.9%), while renter-occupied units make up 13 (7.1%).
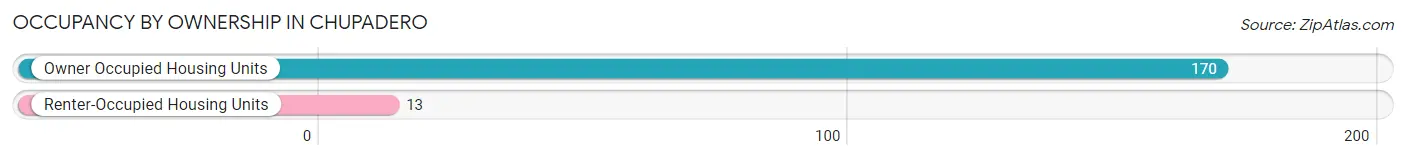
| Occupancy | # Housing Units | % Housing Units |
| Owner Occupied Housing Units | 170 | 92.9% |
| Renter-Occupied Housing Units | 13 | 7.1% |
| Total Occupied Housing Units | 183 | 100.0% |
Occupancy by Household Size in Chupadero
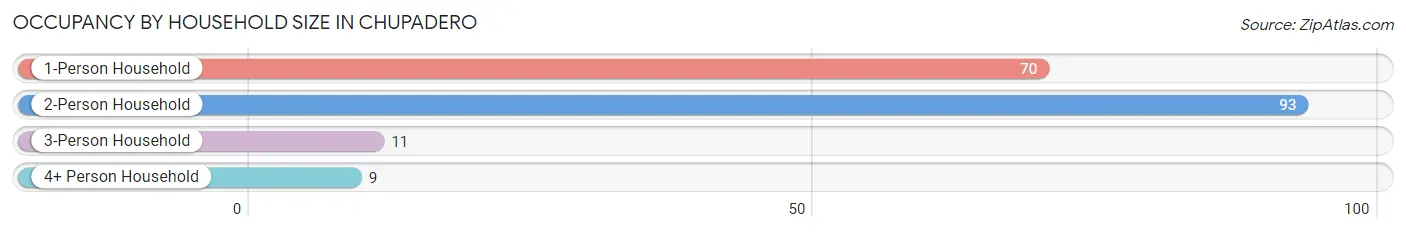
| Household Size | # Housing Units | % Housing Units |
| 1-Person Household | 70 | 38.3% |
| 2-Person Household | 93 | 50.8% |
| 3-Person Household | 11 | 6.0% |
| 4+ Person Household | 9 | 4.9% |
| Total Housing Units | 183 | 100.0% |
Occupancy by Ownership by Household Size in Chupadero
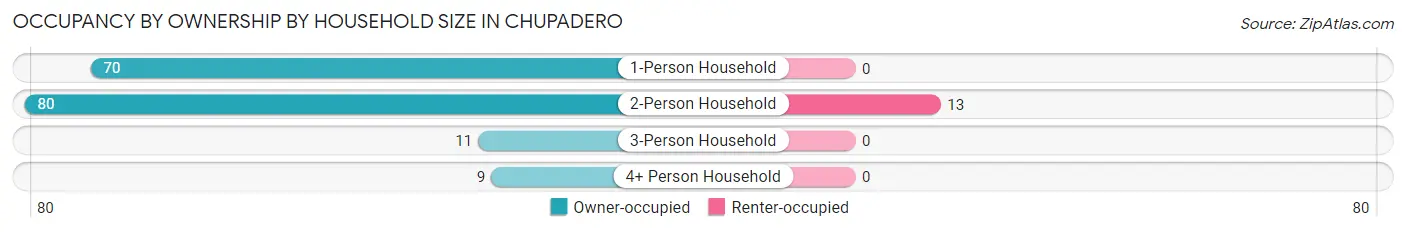
| Household Size | Owner-occupied | Renter-occupied |
| 1-Person Household | 70 (100.0%) | 0 (0.0%) |
| 2-Person Household | 80 (86.0%) | 13 (14.0%) |
| 3-Person Household | 11 (100.0%) | 0 (0.0%) |
| 4+ Person Household | 9 (100.0%) | 0 (0.0%) |
| Total Housing Units | 170 (92.9%) | 13 (7.1%) |
Occupancy by Educational Attainment in Chupadero
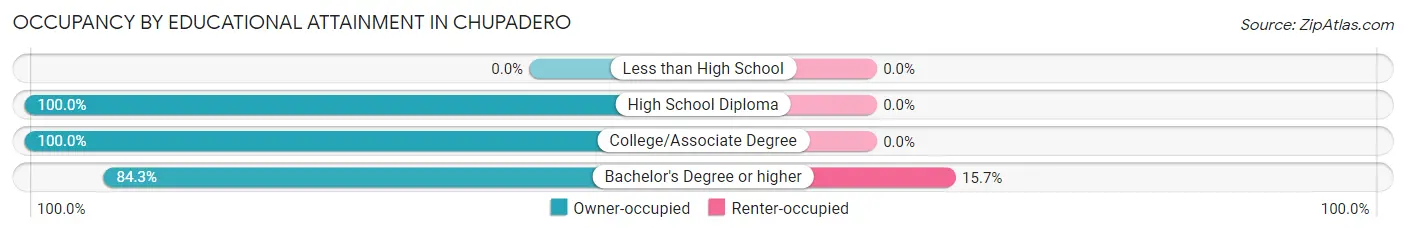
| Household Size | Owner-occupied | Renter-occupied |
| Less than High School | 0 (0.0%) | 0 (0.0%) |
| High School Diploma | 70 (100.0%) | 0 (0.0%) |
| College/Associate Degree | 30 (100.0%) | 0 (0.0%) |
| Bachelor's Degree or higher | 70 (84.3%) | 13 (15.7%) |
Occupancy by Age of Householder in Chupadero
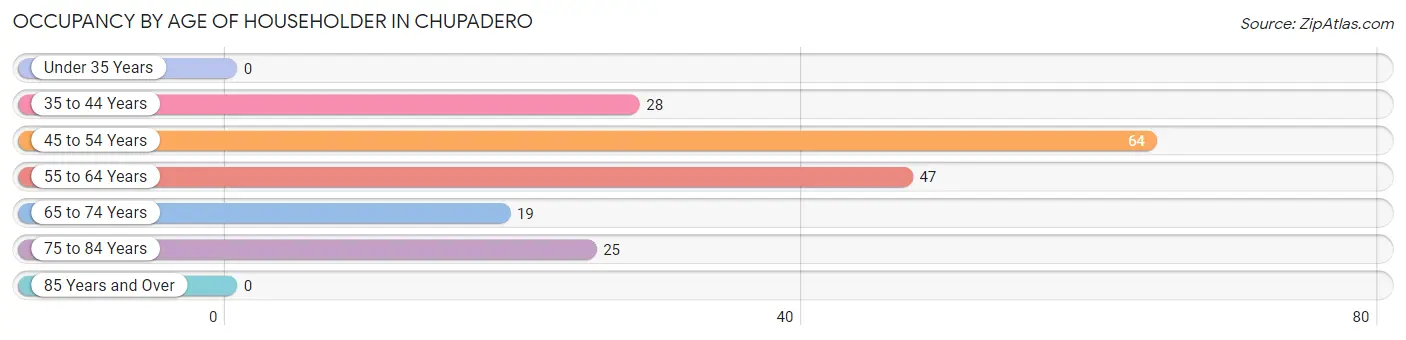
| Age Bracket | # Households | % Households |
| Under 35 Years | 0 | 0.0% |
| 35 to 44 Years | 28 | 15.3% |
| 45 to 54 Years | 64 | 35.0% |
| 55 to 64 Years | 47 | 25.7% |
| 65 to 74 Years | 19 | 10.4% |
| 75 to 84 Years | 25 | 13.7% |
| 85 Years and Over | 0 | 0.0% |
| Total | 183 | 100.0% |
Housing Finances in Chupadero
Median Income by Occupancy in Chupadero
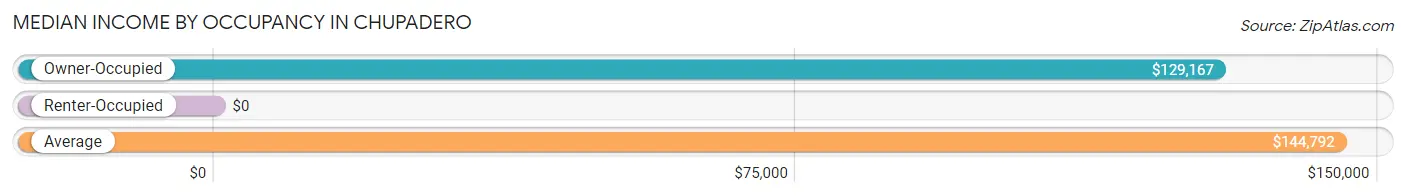
| Occupancy Type | # Households | Median Income |
| Owner-Occupied | 170 (92.9%) | $129,167 |
| Renter-Occupied | 13 (7.1%) | $0 |
| Average | 183 (100.0%) | $144,792 |
Occupancy by Householder Income Bracket in Chupadero
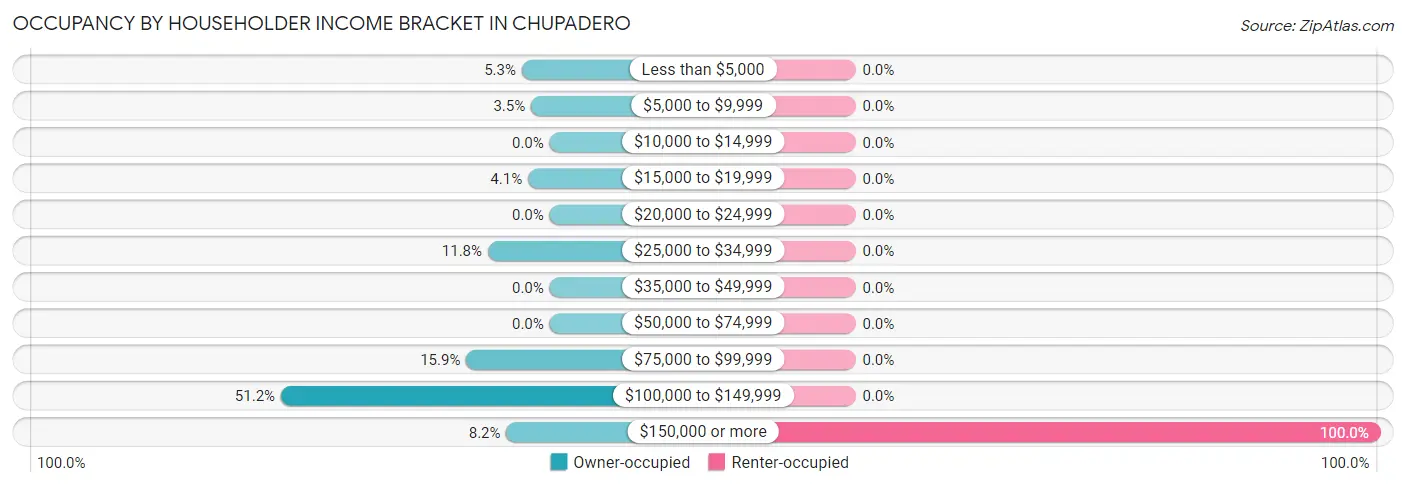
| Income Bracket | Owner-occupied | Renter-occupied |
| Less than $5,000 | 9 (5.3%) | 0 (0.0%) |
| $5,000 to $9,999 | 6 (3.5%) | 0 (0.0%) |
| $10,000 to $14,999 | 0 (0.0%) | 0 (0.0%) |
| $15,000 to $19,999 | 7 (4.1%) | 0 (0.0%) |
| $20,000 to $24,999 | 0 (0.0%) | 0 (0.0%) |
| $25,000 to $34,999 | 20 (11.8%) | 0 (0.0%) |
| $35,000 to $49,999 | 0 (0.0%) | 0 (0.0%) |
| $50,000 to $74,999 | 0 (0.0%) | 0 (0.0%) |
| $75,000 to $99,999 | 27 (15.9%) | 0 (0.0%) |
| $100,000 to $149,999 | 87 (51.2%) | 0 (0.0%) |
| $150,000 or more | 14 (8.2%) | 13 (100.0%) |
| Total | 170 (100.0%) | 13 (100.0%) |
Monthly Housing Cost Tiers in Chupadero
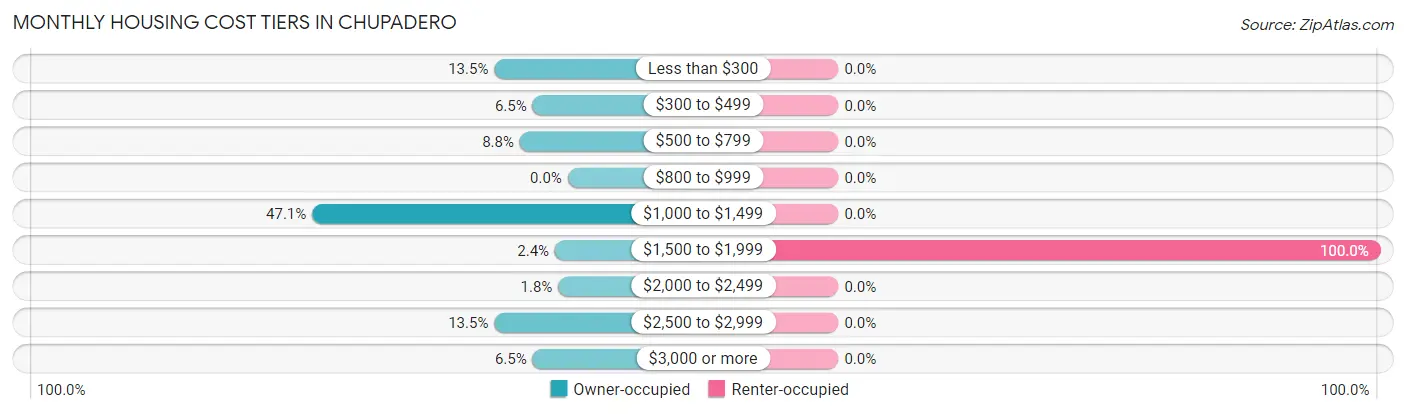
| Monthly Cost | Owner-occupied | Renter-occupied |
| Less than $300 | 23 (13.5%) | 0 (0.0%) |
| $300 to $499 | 11 (6.5%) | 0 (0.0%) |
| $500 to $799 | 15 (8.8%) | 0 (0.0%) |
| $800 to $999 | 0 (0.0%) | 0 (0.0%) |
| $1,000 to $1,499 | 80 (47.1%) | 0 (0.0%) |
| $1,500 to $1,999 | 4 (2.4%) | 13 (100.0%) |
| $2,000 to $2,499 | 3 (1.8%) | 0 (0.0%) |
| $2,500 to $2,999 | 23 (13.5%) | 0 (0.0%) |
| $3,000 or more | 11 (6.5%) | 0 (0.0%) |
| Total | 170 (100.0%) | 13 (100.0%) |
Physical Housing Characteristics in Chupadero
Housing Structures in Chupadero
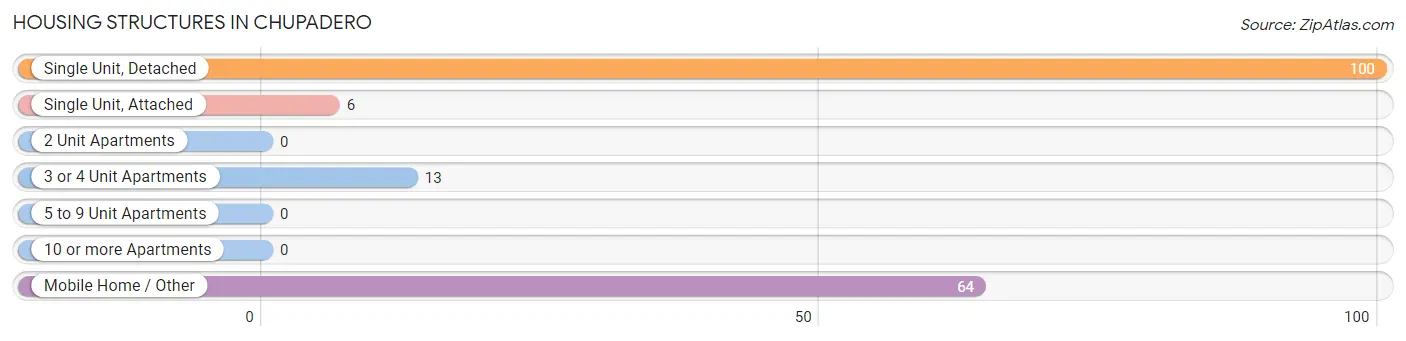
| Structure Type | # Housing Units | % Housing Units |
| Single Unit, Detached | 100 | 54.6% |
| Single Unit, Attached | 6 | 3.3% |
| 2 Unit Apartments | 0 | 0.0% |
| 3 or 4 Unit Apartments | 13 | 7.1% |
| 5 to 9 Unit Apartments | 0 | 0.0% |
| 10 or more Apartments | 0 | 0.0% |
| Mobile Home / Other | 64 | 35.0% |
| Total | 183 | 100.0% |
Housing Structures by Occupancy in Chupadero
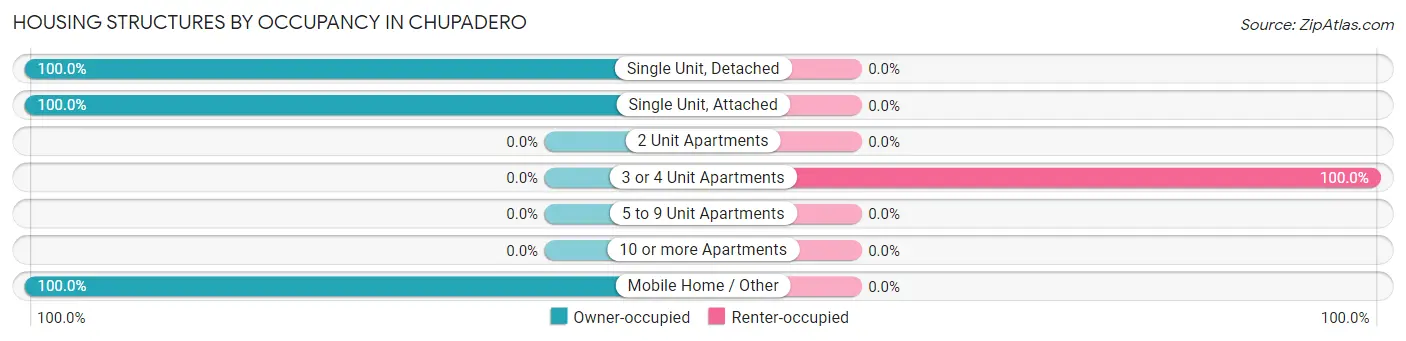
| Structure Type | Owner-occupied | Renter-occupied |
| Single Unit, Detached | 100 (100.0%) | 0 (0.0%) |
| Single Unit, Attached | 6 (100.0%) | 0 (0.0%) |
| 2 Unit Apartments | 0 (0.0%) | 0 (0.0%) |
| 3 or 4 Unit Apartments | 0 (0.0%) | 13 (100.0%) |
| 5 to 9 Unit Apartments | 0 (0.0%) | 0 (0.0%) |
| 10 or more Apartments | 0 (0.0%) | 0 (0.0%) |
| Mobile Home / Other | 64 (100.0%) | 0 (0.0%) |
| Total | 170 (92.9%) | 13 (7.1%) |
Housing Structures by Number of Rooms in Chupadero
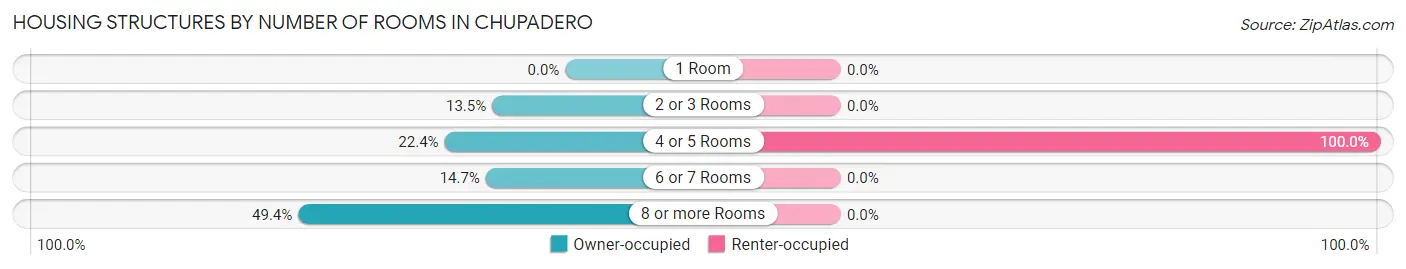
| Number of Rooms | Owner-occupied | Renter-occupied |
| 1 Room | 0 (0.0%) | 0 (0.0%) |
| 2 or 3 Rooms | 23 (13.5%) | 0 (0.0%) |
| 4 or 5 Rooms | 38 (22.4%) | 13 (100.0%) |
| 6 or 7 Rooms | 25 (14.7%) | 0 (0.0%) |
| 8 or more Rooms | 84 (49.4%) | 0 (0.0%) |
| Total | 170 (100.0%) | 13 (100.0%) |
Housing Structure by Heating Type in Chupadero
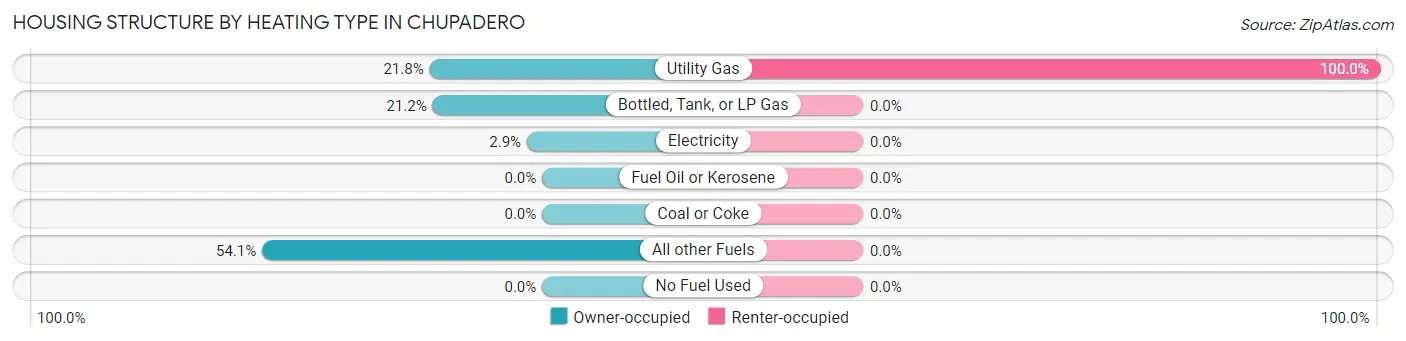
| Heating Type | Owner-occupied | Renter-occupied |
| Utility Gas | 37 (21.8%) | 13 (100.0%) |
| Bottled, Tank, or LP Gas | 36 (21.2%) | 0 (0.0%) |
| Electricity | 5 (2.9%) | 0 (0.0%) |
| Fuel Oil or Kerosene | 0 (0.0%) | 0 (0.0%) |
| Coal or Coke | 0 (0.0%) | 0 (0.0%) |
| All other Fuels | 92 (54.1%) | 0 (0.0%) |
| No Fuel Used | 0 (0.0%) | 0 (0.0%) |
| Total | 170 (100.0%) | 13 (100.0%) |
Household Vehicle Usage in Chupadero
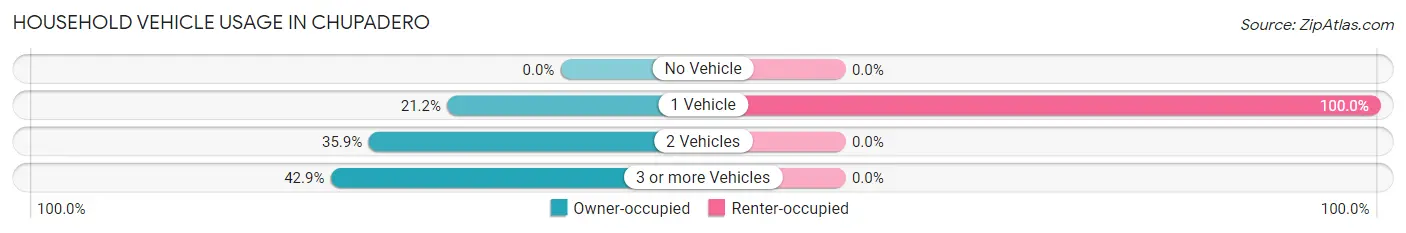
| Vehicles per Household | Owner-occupied | Renter-occupied |
| No Vehicle | 0 (0.0%) | 0 (0.0%) |
| 1 Vehicle | 36 (21.2%) | 13 (100.0%) |
| 2 Vehicles | 61 (35.9%) | 0 (0.0%) |
| 3 or more Vehicles | 73 (42.9%) | 0 (0.0%) |
| Total | 170 (100.0%) | 13 (100.0%) |
Real Estate & Mortgages in Chupadero
Real Estate and Mortgage Overview in Chupadero
| Characteristic | Without Mortgage | With Mortgage |
| Housing Units | 65 | 105 |
| Median Property Value | - | - |
| Median Household Income | - | - |
| Monthly Housing Costs | - | - |
| Real Estate Taxes | $3,167 | $0 |
Property Value by Mortgage Status in Chupadero
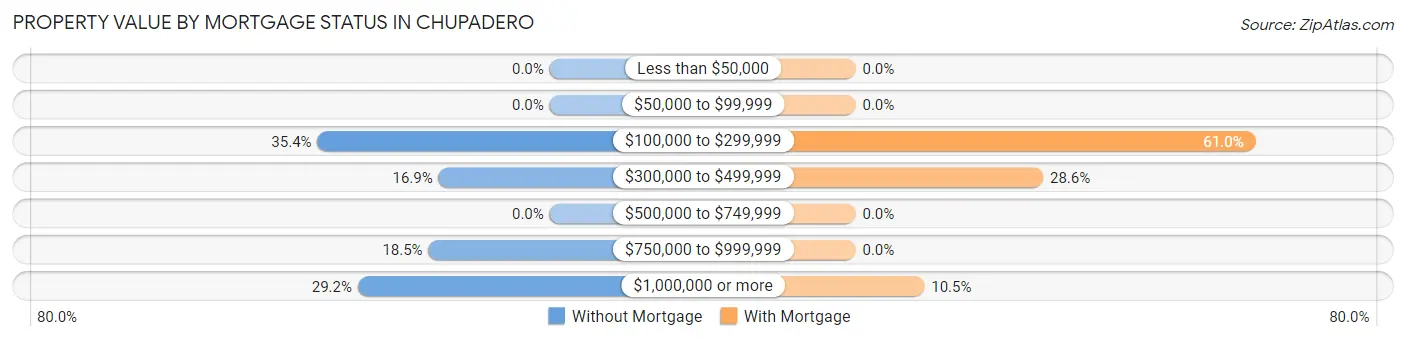
| Property Value | Without Mortgage | With Mortgage |
| Less than $50,000 | 0 (0.0%) | 0 (0.0%) |
| $50,000 to $99,999 | 0 (0.0%) | 0 (0.0%) |
| $100,000 to $299,999 | 23 (35.4%) | 64 (61.0%) |
| $300,000 to $499,999 | 11 (16.9%) | 30 (28.6%) |
| $500,000 to $749,999 | 0 (0.0%) | 0 (0.0%) |
| $750,000 to $999,999 | 12 (18.5%) | 0 (0.0%) |
| $1,000,000 or more | 19 (29.2%) | 11 (10.5%) |
| Total | 65 (100.0%) | 105 (100.0%) |
Household Income by Mortgage Status in Chupadero
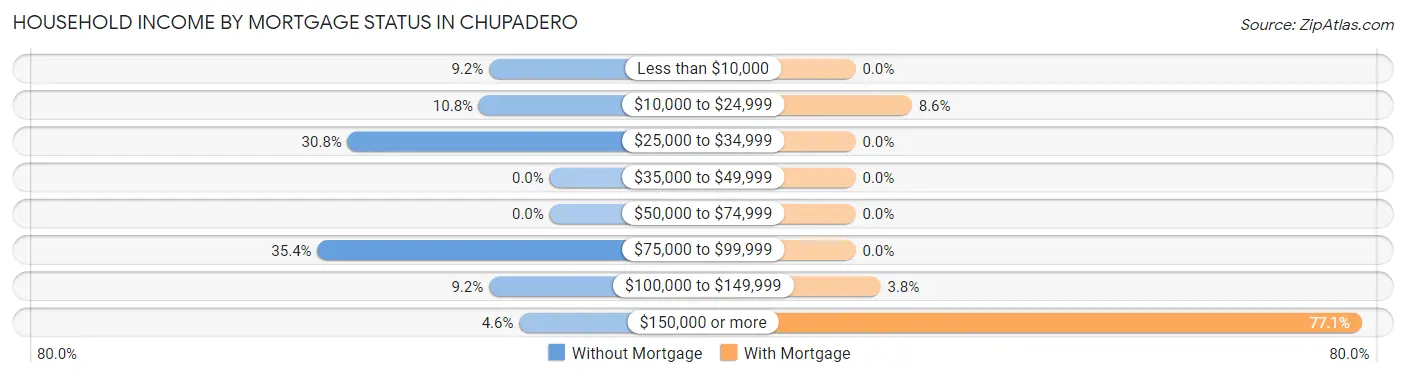
| Household Income | Without Mortgage | With Mortgage |
| Less than $10,000 | 6 (9.2%) | 0 (0.0%) |
| $10,000 to $24,999 | 7 (10.8%) | 9 (8.6%) |
| $25,000 to $34,999 | 20 (30.8%) | 0 (0.0%) |
| $35,000 to $49,999 | 0 (0.0%) | 0 (0.0%) |
| $50,000 to $74,999 | 0 (0.0%) | 0 (0.0%) |
| $75,000 to $99,999 | 23 (35.4%) | 0 (0.0%) |
| $100,000 to $149,999 | 6 (9.2%) | 4 (3.8%) |
| $150,000 or more | 3 (4.6%) | 81 (77.1%) |
| Total | 65 (100.0%) | 105 (100.0%) |
Property Value to Household Income Ratio in Chupadero
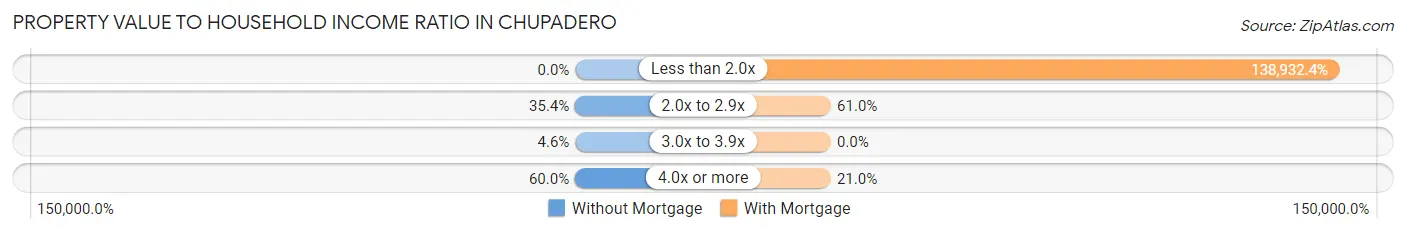
| Value-to-Income Ratio | Without Mortgage | With Mortgage |
| Less than 2.0x | 0 (0.0%) | 145,879 (138,932.4%) |
| 2.0x to 2.9x | 23 (35.4%) | 64 (61.0%) |
| 3.0x to 3.9x | 3 (4.6%) | 0 (0.0%) |
| 4.0x or more | 39 (60.0%) | 22 (20.9%) |
| Total | 65 (100.0%) | 105 (100.0%) |
Real Estate Taxes by Mortgage Status in Chupadero
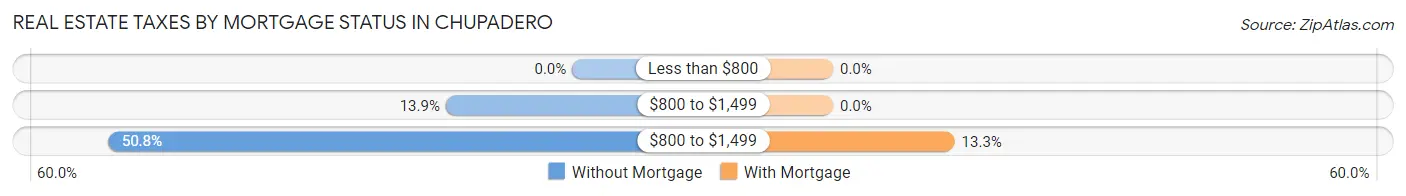
| Property Taxes | Without Mortgage | With Mortgage |
| Less than $800 | 0 (0.0%) | 0 (0.0%) |
| $800 to $1,499 | 9 (13.9%) | 0 (0.0%) |
| $800 to $1,499 | 33 (50.8%) | 14 (13.3%) |
| Total | 65 (100.0%) | 105 (100.0%) |
Health & Disability in Chupadero
Health Insurance Coverage by Age in Chupadero
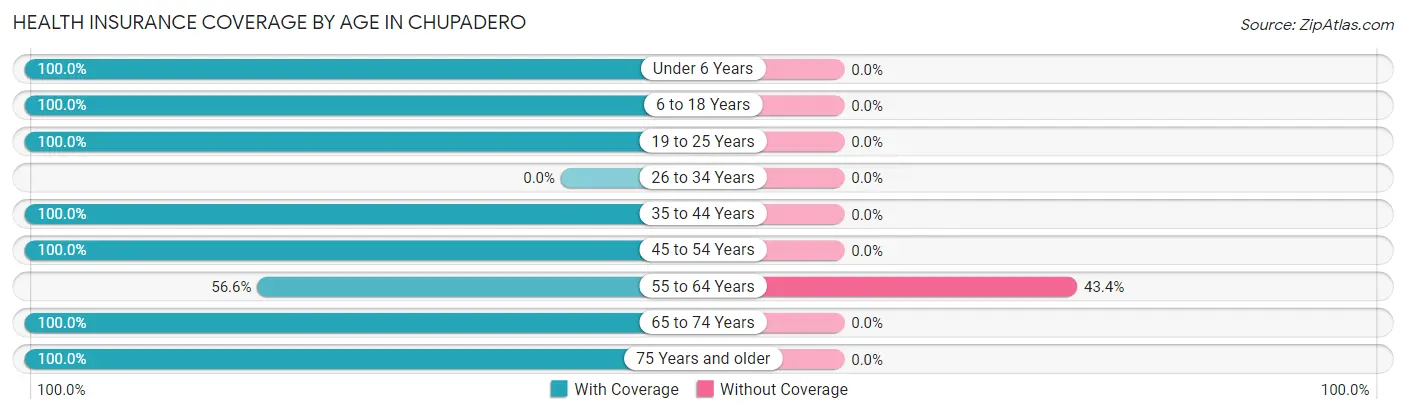
| Age Bracket | With Coverage | Without Coverage |
| Under 6 Years | 20 (100.0%) | 0 (0.0%) |
| 6 to 18 Years | 6 (100.0%) | 0 (0.0%) |
| 19 to 25 Years | 31 (100.0%) | 0 (0.0%) |
| 26 to 34 Years | 0 (0.0%) | 0 (0.0%) |
| 35 to 44 Years | 37 (100.0%) | 0 (0.0%) |
| 45 to 54 Years | 76 (100.0%) | 0 (0.0%) |
| 55 to 64 Years | 30 (56.6%) | 23 (43.4%) |
| 65 to 74 Years | 19 (100.0%) | 0 (0.0%) |
| 75 Years and older | 43 (100.0%) | 0 (0.0%) |
| Total | 262 (91.9%) | 23 (8.1%) |
Health Insurance Coverage by Citizenship Status in Chupadero

| Citizenship Status | With Coverage | Without Coverage |
| Native Born | 20 (100.0%) | 0 (0.0%) |
| Foreign Born, Citizen | 6 (100.0%) | 0 (0.0%) |
| Foreign Born, not a Citizen | 31 (100.0%) | 0 (0.0%) |
Health Insurance Coverage by Household Income in Chupadero
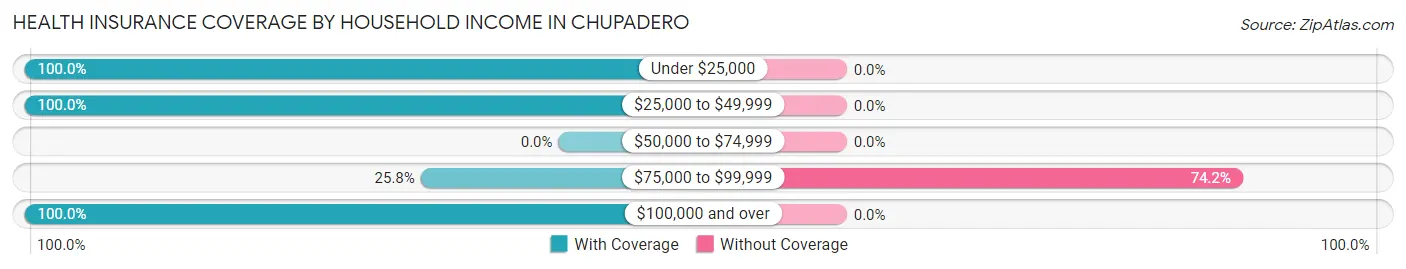
| Household Income | With Coverage | Without Coverage |
| Under $25,000 | 47 (100.0%) | 0 (0.0%) |
| $25,000 to $49,999 | 20 (100.0%) | 0 (0.0%) |
| $50,000 to $74,999 | 0 (0.0%) | 0 (0.0%) |
| $75,000 to $99,999 | 8 (25.8%) | 23 (74.2%) |
| $100,000 and over | 187 (100.0%) | 0 (0.0%) |
Public vs Private Health Insurance Coverage by Age in Chupadero
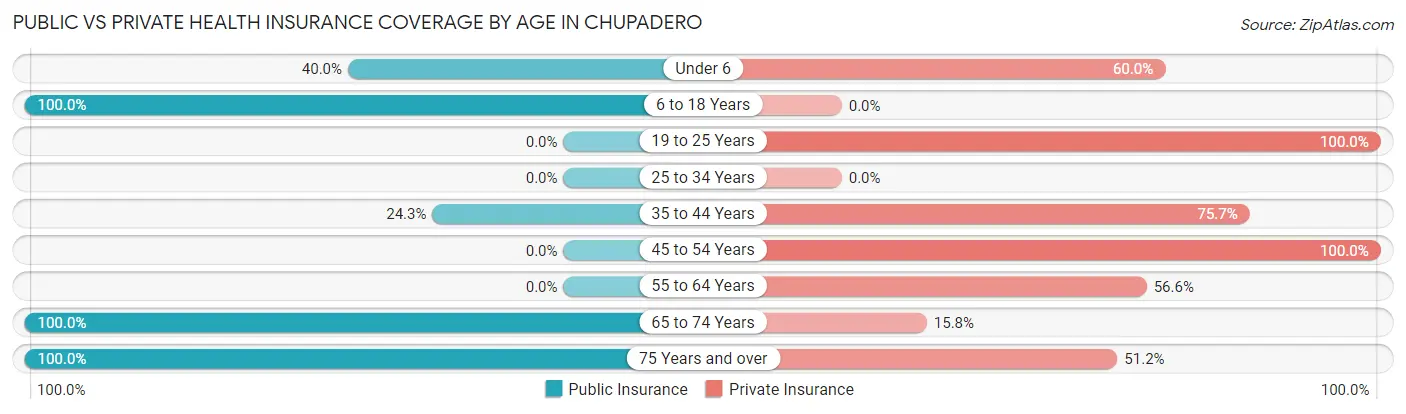
| Age Bracket | Public Insurance | Private Insurance |
| Under 6 | 8 (40.0%) | 12 (60.0%) |
| 6 to 18 Years | 6 (100.0%) | 0 (0.0%) |
| 19 to 25 Years | 0 (0.0%) | 31 (100.0%) |
| 25 to 34 Years | 0 (0.0%) | 0 (0.0%) |
| 35 to 44 Years | 9 (24.3%) | 28 (75.7%) |
| 45 to 54 Years | 0 (0.0%) | 76 (100.0%) |
| 55 to 64 Years | 0 (0.0%) | 30 (56.6%) |
| 65 to 74 Years | 19 (100.0%) | 3 (15.8%) |
| 75 Years and over | 43 (100.0%) | 22 (51.2%) |
| Total | 85 (29.8%) | 202 (70.9%) |
Disability Status by Sex by Age in Chupadero
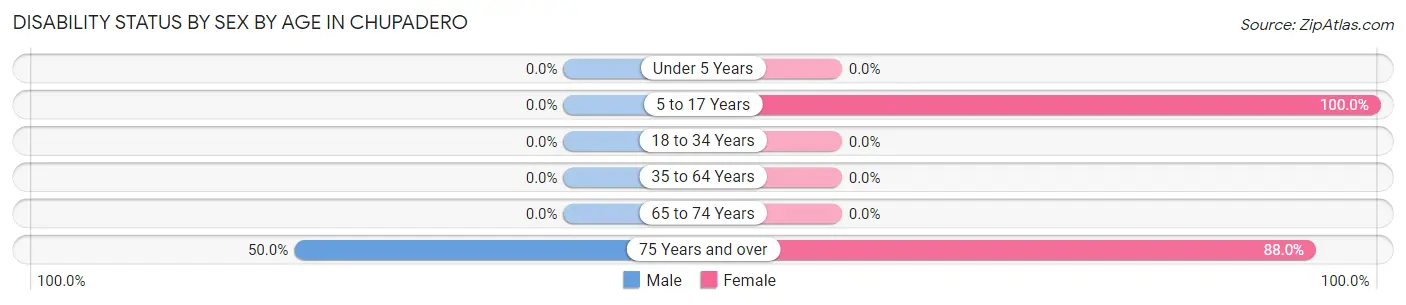
| Age Bracket | Male | Female |
| Under 5 Years | 0 (0.0%) | 0 (0.0%) |
| 5 to 17 Years | 0 (0.0%) | 6 (100.0%) |
| 18 to 34 Years | 0 (0.0%) | 0 (0.0%) |
| 35 to 64 Years | 0 (0.0%) | 0 (0.0%) |
| 65 to 74 Years | 0 (0.0%) | 0 (0.0%) |
| 75 Years and over | 9 (50.0%) | 22 (88.0%) |
Disability Class by Sex by Age in Chupadero
Disability Class: Hearing Difficulty
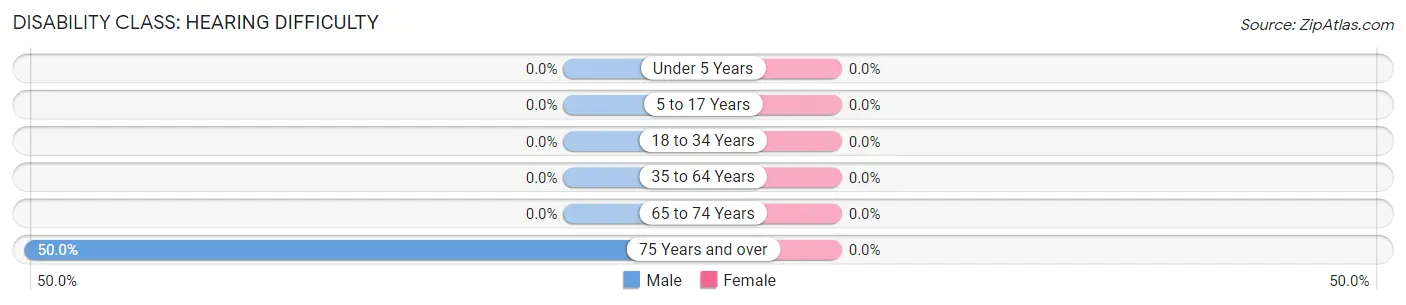
| Age Bracket | Male | Female |
| Under 5 Years | 0 (0.0%) | 0 (0.0%) |
| 5 to 17 Years | 0 (0.0%) | 0 (0.0%) |
| 18 to 34 Years | 0 (0.0%) | 0 (0.0%) |
| 35 to 64 Years | 0 (0.0%) | 0 (0.0%) |
| 65 to 74 Years | 0 (0.0%) | 0 (0.0%) |
| 75 Years and over | 9 (50.0%) | 0 (0.0%) |
Disability Class: Vision Difficulty
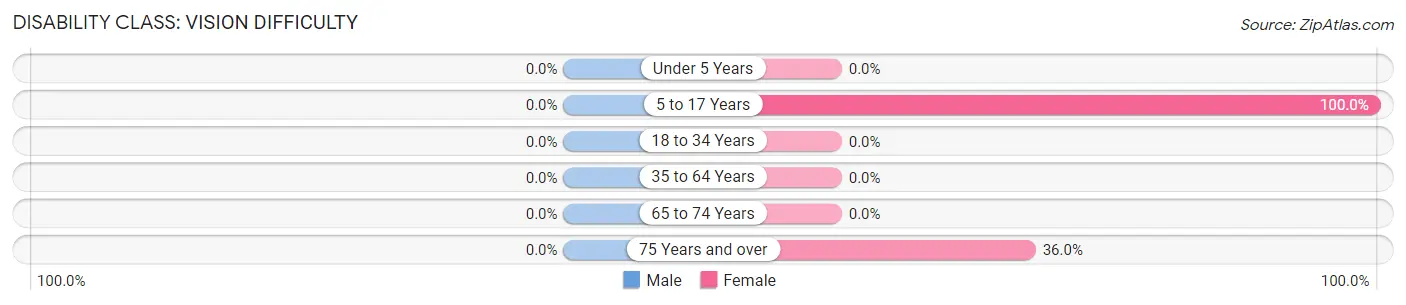
| Age Bracket | Male | Female |
| Under 5 Years | 0 (0.0%) | 0 (0.0%) |
| 5 to 17 Years | 0 (0.0%) | 6 (100.0%) |
| 18 to 34 Years | 0 (0.0%) | 0 (0.0%) |
| 35 to 64 Years | 0 (0.0%) | 0 (0.0%) |
| 65 to 74 Years | 0 (0.0%) | 0 (0.0%) |
| 75 Years and over | 0 (0.0%) | 9 (36.0%) |
Disability Class: Cognitive Difficulty
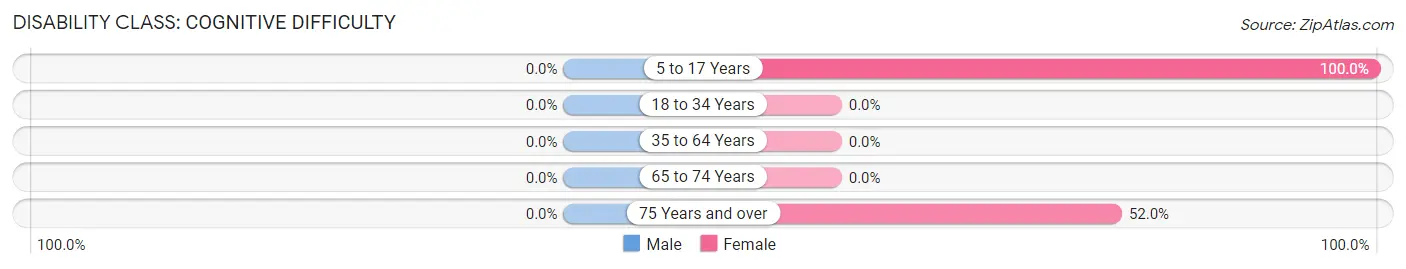
| Age Bracket | Male | Female |
| 5 to 17 Years | 0 (0.0%) | 6 (100.0%) |
| 18 to 34 Years | 0 (0.0%) | 0 (0.0%) |
| 35 to 64 Years | 0 (0.0%) | 0 (0.0%) |
| 65 to 74 Years | 0 (0.0%) | 0 (0.0%) |
| 75 Years and over | 0 (0.0%) | 13 (52.0%) |
Disability Class: Ambulatory Difficulty
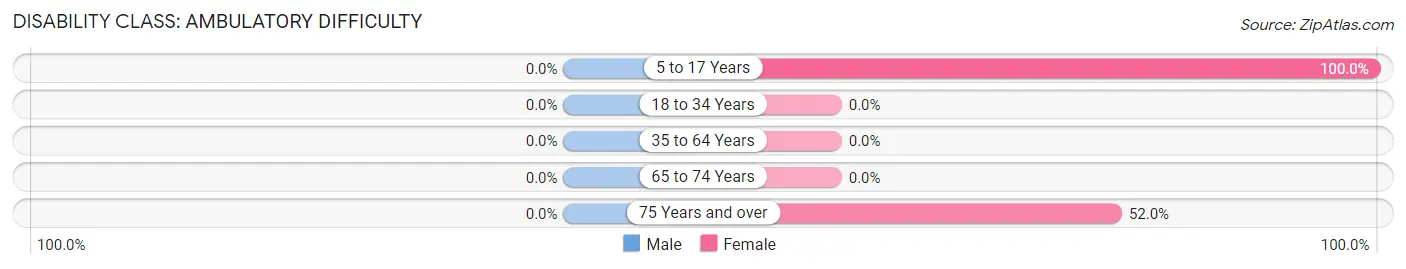
| Age Bracket | Male | Female |
| 5 to 17 Years | 0 (0.0%) | 6 (100.0%) |
| 18 to 34 Years | 0 (0.0%) | 0 (0.0%) |
| 35 to 64 Years | 0 (0.0%) | 0 (0.0%) |
| 65 to 74 Years | 0 (0.0%) | 0 (0.0%) |
| 75 Years and over | 0 (0.0%) | 13 (52.0%) |
Disability Class: Self-Care Difficulty
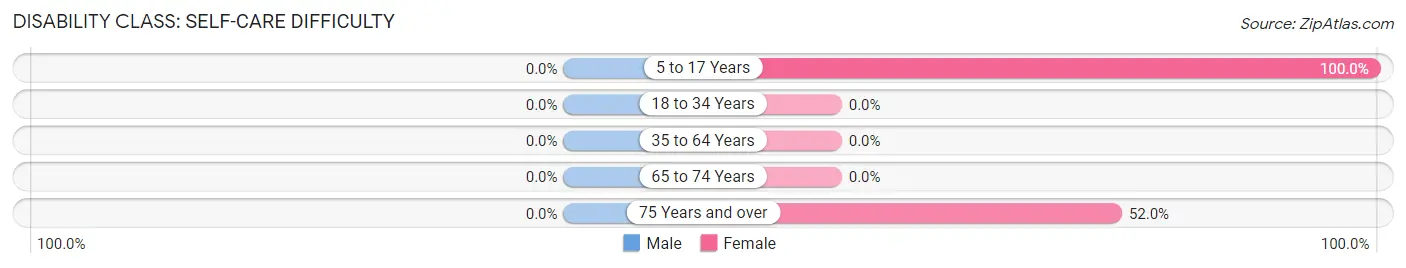
| Age Bracket | Male | Female |
| 5 to 17 Years | 0 (0.0%) | 6 (100.0%) |
| 18 to 34 Years | 0 (0.0%) | 0 (0.0%) |
| 35 to 64 Years | 0 (0.0%) | 0 (0.0%) |
| 65 to 74 Years | 0 (0.0%) | 0 (0.0%) |
| 75 Years and over | 0 (0.0%) | 13 (52.0%) |
Technology Access in Chupadero
Computing Device Access in Chupadero
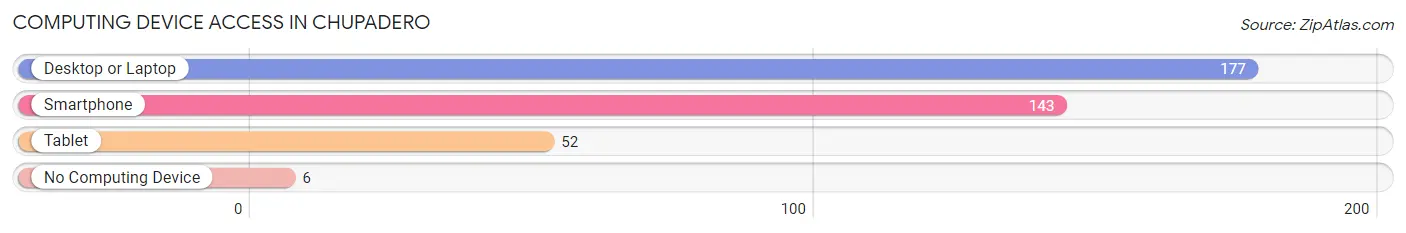
| Device Type | # Households | % Households |
| Desktop or Laptop | 177 | 96.7% |
| Smartphone | 143 | 78.1% |
| Tablet | 52 | 28.4% |
| No Computing Device | 6 | 3.3% |
| Total | 183 | 100.0% |
Internet Access in Chupadero
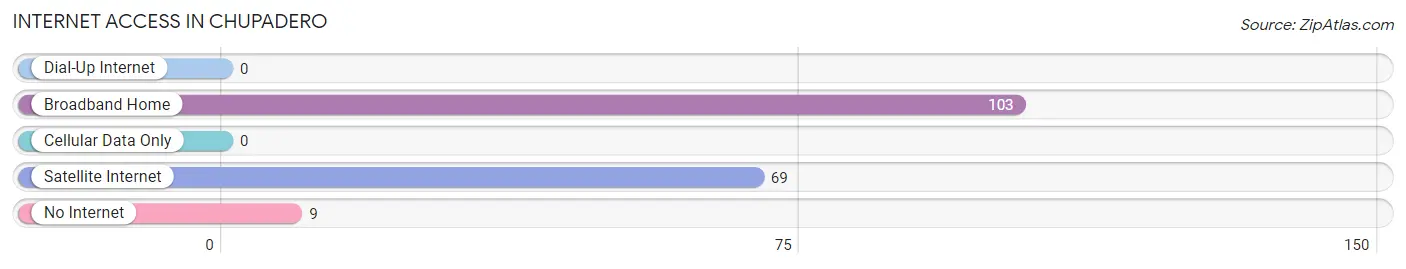
| Internet Type | # Households | % Households |
| Dial-Up Internet | 0 | 0.0% |
| Broadband Home | 103 | 56.3% |
| Cellular Data Only | 0 | 0.0% |
| Satellite Internet | 69 | 37.7% |
| No Internet | 9 | 4.9% |
| Total | 183 | 100.0% |
Chupadero Summary
Chupadero, New Mexico is a small unincorporated community located in the northern part of the state. It is situated in the foothills of the Sangre de Cristo Mountains, about 25 miles south of Santa Fe. The area is known for its scenic beauty and its rich cultural heritage.
History
Chupadero has a long and varied history. The area was first inhabited by the Pueblo Indians, who lived in the area for centuries before the arrival of the Spanish in the 16th century. The Spanish established a mission in the area in 1610, and the area was later settled by Spanish colonists. The area was part of the Spanish province of New Mexico until 1821, when Mexico gained independence from Spain. After the Mexican-American War, the area became part of the United States.
In the late 19th century, the area was settled by ranchers and farmers, who established small communities in the area. The town of Chupadero was established in the early 20th century, and the area has remained largely unchanged since then.
Geography
Chupadero is located in the northern part of New Mexico, in the foothills of the Sangre de Cristo Mountains. The area is characterized by rolling hills, grassy plains, and rugged mountains. The climate is semi-arid, with hot summers and cold winters. The area receives an average of 12 inches of precipitation per year.
Economy
The economy of Chupadero is largely based on agriculture and ranching. The area is known for its cattle and sheep ranches, as well as its production of hay, alfalfa, and other crops. The area is also home to several small businesses, including a general store, a gas station, and a restaurant.
Demographics
As of the 2010 census, the population of Chupadero was 1,072. The population is largely Hispanic, with a small percentage of Native American and White residents. The median household income is $31,250, and the median age is 37. The area is served by the Chupadero School District, which includes two elementary schools and one high school.
Conclusion
Chupadero, New Mexico is a small unincorporated community located in the northern part of the state. It is known for its scenic beauty and its rich cultural heritage. The area is largely rural, with a largely Hispanic population and an economy based on agriculture and ranching. The area is served by the Chupadero School District, which includes two elementary schools and one high school.
Common Questions
What is Per Capita Income in Chupadero?
Per Capita income in Chupadero is $78,487.
What is the Median Family Income in Chupadero?
Median Family Income in Chupadero is $146,426.
What is the Median Household income in Chupadero?
Median Household Income in Chupadero is $144,792.
What is Inequality or Gini Index in Chupadero?
Inequality or Gini Index in Chupadero is 0.35.
What is the Total Population of Chupadero?
Total Population of Chupadero is 285.
What is the Total Male Population of Chupadero?
Total Male Population of Chupadero is 123.
What is the Total Female Population of Chupadero?
Total Female Population of Chupadero is 162.
What is the Ratio of Males per 100 Females in Chupadero?
There are 75.93 Males per 100 Females in Chupadero.
What is the Ratio of Females per 100 Males in Chupadero?
There are 131.71 Females per 100 Males in Chupadero.
What is the Median Population Age in Chupadero?
Median Population Age in Chupadero is 46.6 Years.
What is the Average Family Size in Chupadero
Average Family Size in Chupadero is 1.9 People.
What is the Average Household Size in Chupadero
Average Household Size in Chupadero is 1.6 People.
How Large is the Labor Force in Chupadero?
There are 192 People in the Labor Forcein in Chupadero.
What is the Percentage of People in the Labor Force in Chupadero?
74.1% of People are in the Labor Force in Chupadero.
What is the Unemployment Rate in Chupadero?
Unemployment Rate in Chupadero is 4.7%.