North San Ysidro, NM Map & Demographics
North San Ysidro Map
North San Ysidro Overview
$33,560
PER CAPITA INCOME
0.12
INEQUALITY / GINI INDEX
214
TOTAL POPULATION
85
MALE POPULATION
129
FEMALE POPULATION
65.89
MALES / 100 FEMALES
151.76
FEMALES / 100 MALES
38.5
MEDIAN AGE
3.9
AVG FAMILY SIZE
3.7
AVG HOUSEHOLD SIZE
125
LABOR FORCE [ PEOPLE ]
58.4%
PERCENT IN LABOR FORCE
Income in North San Ysidro
Income Overview in North San Ysidro
| Characteristic | Number | Measure |
| Per Capita Income | 214 | $33,560 |
| Median Family Income | 31 | $0 |
| Mean Family Income | 31 | $0 |
| Median Household Income | 58 | $0 |
| Mean Household Income | 58 | $0 |
| Income Deficit | 31 | $0 |
| Wage / Income Gap (%) | 214 | 0.00% |
| Wage / Income Gap ($) | 214 | 100.00¢ per $1 |
| Gini / Inequality Index | 214 | 0.12 |
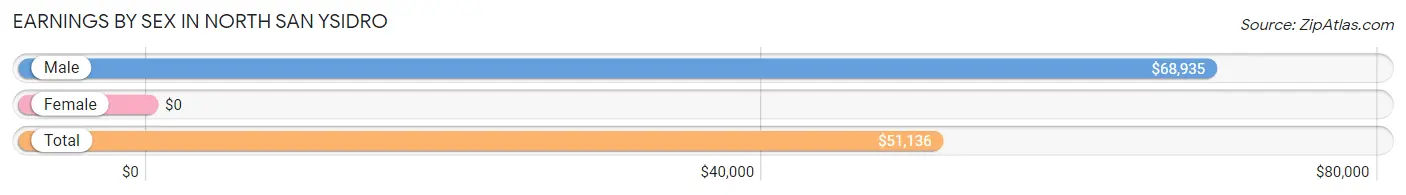
Earnings by Sex in North San Ysidro
| Sex | Number | Average Earnings |
| Male | 85 (55.9%) | $68,935 |
| Female | 67 (44.1%) | $0 |
| Total | 152 (100.0%) | $51,136 |
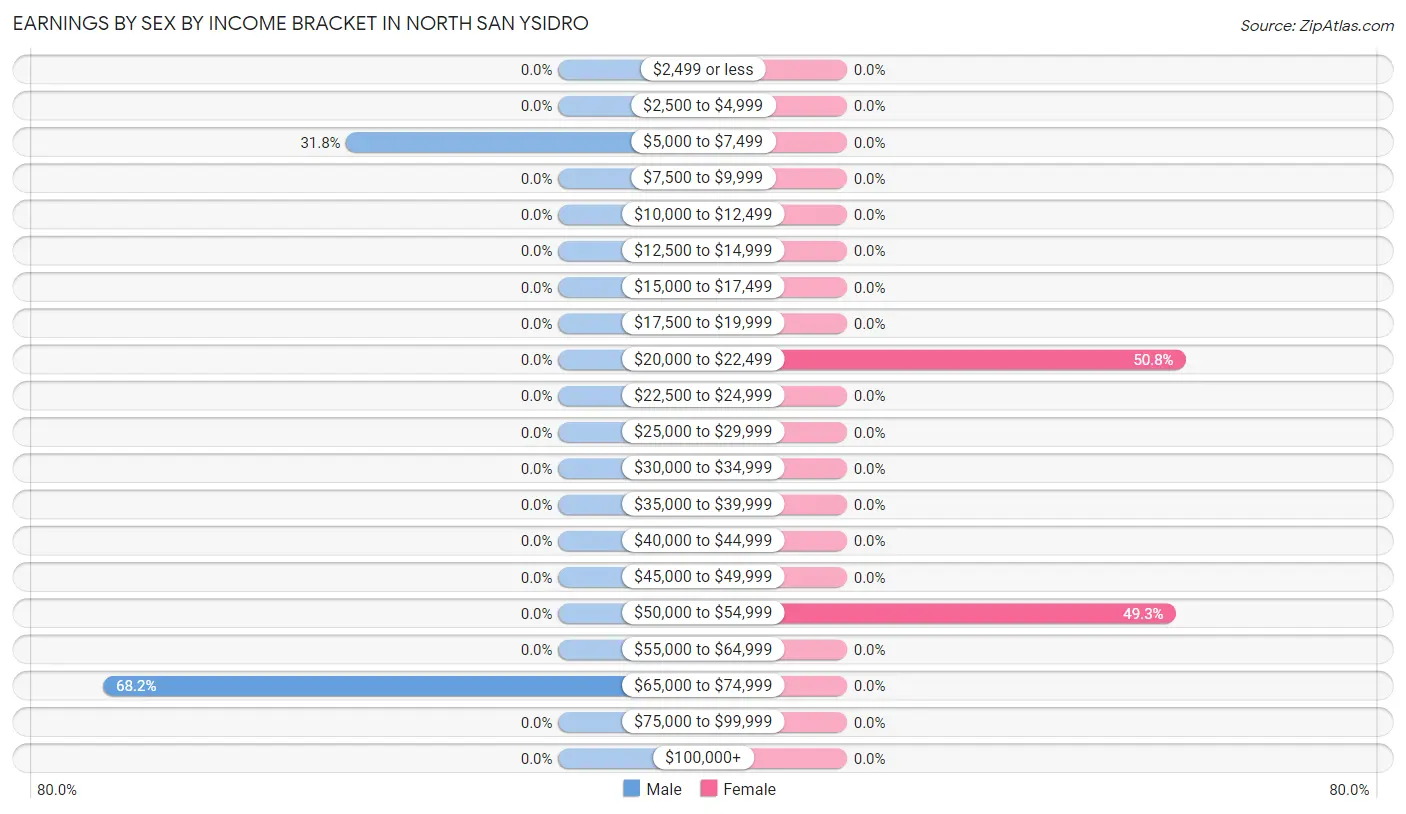
Earnings by Sex by Income Bracket in North San Ysidro
The most common earnings brackets in North San Ysidro are $65,000 to $74,999 for men (58 | 68.2%) and $20,000 to $22,499 for women (34 | 50.7%).
| Income | Male | Female |
| $2,499 or less | 0 (0.0%) | 0 (0.0%) |
| $2,500 to $4,999 | 0 (0.0%) | 0 (0.0%) |
| $5,000 to $7,499 | 27 (31.8%) | 0 (0.0%) |
| $7,500 to $9,999 | 0 (0.0%) | 0 (0.0%) |
| $10,000 to $12,499 | 0 (0.0%) | 0 (0.0%) |
| $12,500 to $14,999 | 0 (0.0%) | 0 (0.0%) |
| $15,000 to $17,499 | 0 (0.0%) | 0 (0.0%) |
| $17,500 to $19,999 | 0 (0.0%) | 0 (0.0%) |
| $20,000 to $22,499 | 0 (0.0%) | 34 (50.7%) |
| $22,500 to $24,999 | 0 (0.0%) | 0 (0.0%) |
| $25,000 to $29,999 | 0 (0.0%) | 0 (0.0%) |
| $30,000 to $34,999 | 0 (0.0%) | 0 (0.0%) |
| $35,000 to $39,999 | 0 (0.0%) | 0 (0.0%) |
| $40,000 to $44,999 | 0 (0.0%) | 0 (0.0%) |
| $45,000 to $49,999 | 0 (0.0%) | 0 (0.0%) |
| $50,000 to $54,999 | 0 (0.0%) | 33 (49.2%) |
| $55,000 to $64,999 | 0 (0.0%) | 0 (0.0%) |
| $65,000 to $74,999 | 58 (68.2%) | 0 (0.0%) |
| $75,000 to $99,999 | 0 (0.0%) | 0 (0.0%) |
| $100,000+ | 0 (0.0%) | 0 (0.0%) |
| Total | 85 (100.0%) | 67 (100.0%) |
Earnings by Sex by Educational Attainment in North San Ysidro
| Educational Attainment | Male Income | Female Income |
| Less than High School | - | - |
| High School Diploma | - | - |
| College or Associate's Degree | - | - |
| Bachelor's Degree | - | - |
| Graduate Degree | - | - |
| Total | - | - |
Family Income in North San Ysidro
Family Income Brackets in North San Ysidro
According to the North San Ysidro family income data, there are 31 families falling into the $75,000 to $99,999 income range, which is the most common income bracket and makes up 100.0% of all families.
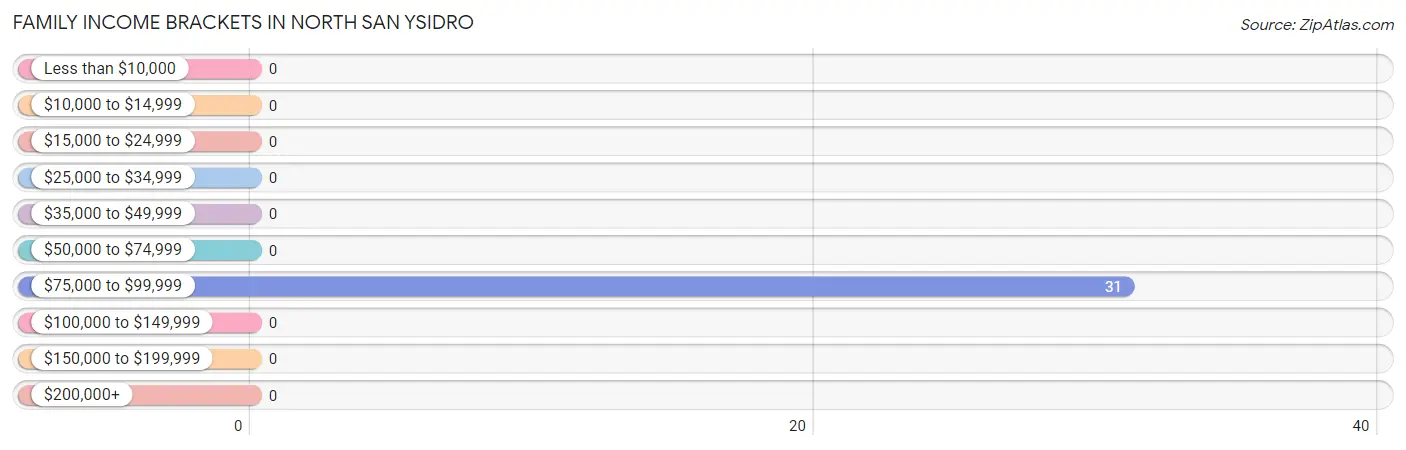
| Income Bracket | # Families | % Families |
| Less than $10,000 | 0 | 0.0% |
| $10,000 to $14,999 | 0 | 0.0% |
| $15,000 to $24,999 | 0 | 0.0% |
| $25,000 to $34,999 | 0 | 0.0% |
| $35,000 to $49,999 | 0 | 0.0% |
| $50,000 to $74,999 | 0 | 0.0% |
| $75,000 to $99,999 | 31 | 100.0% |
| $100,000 to $149,999 | 0 | 0.0% |
| $150,000 to $199,999 | 0 | 0.0% |
| $200,000+ | 0 | 0.0% |
Family Income by Famaliy Size in North San Ysidro
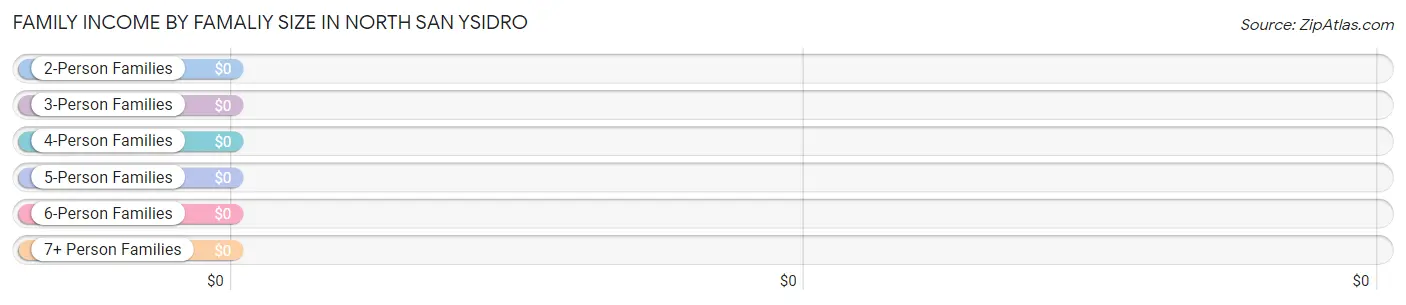
| Income Bracket | # Families | Median Income |
| 2-Person Families | 0 (0.0%) | $0 |
| 3-Person Families | 31 (100.0%) | $0 |
| 4-Person Families | 0 (0.0%) | $0 |
| 5-Person Families | 0 (0.0%) | $0 |
| 6-Person Families | 0 (0.0%) | $0 |
| 7+ Person Families | 0 (0.0%) | $0 |
| Total | 31 (100.0%) | $0 |
Family Income by Number of Earners in North San Ysidro
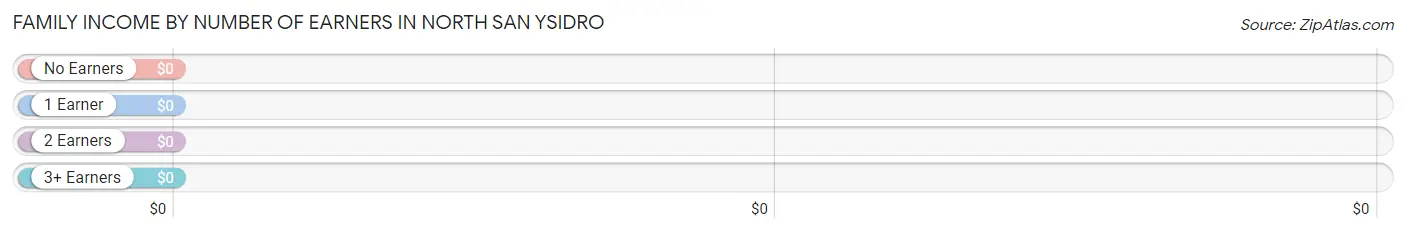
| Number of Earners | # Families | Median Income |
| No Earners | 0 (0.0%) | $0 |
| 1 Earner | 0 (0.0%) | $0 |
| 2 Earners | 31 (100.0%) | $0 |
| 3+ Earners | 0 (0.0%) | $0 |
| Total | 31 (100.0%) | $0 |
Household Income in North San Ysidro
Household Income Brackets in North San Ysidro
With 31 households falling in the category, the $100,000 to $149,999 income range is the most frequent in North San Ysidro, accounting for 53.4% of all households.
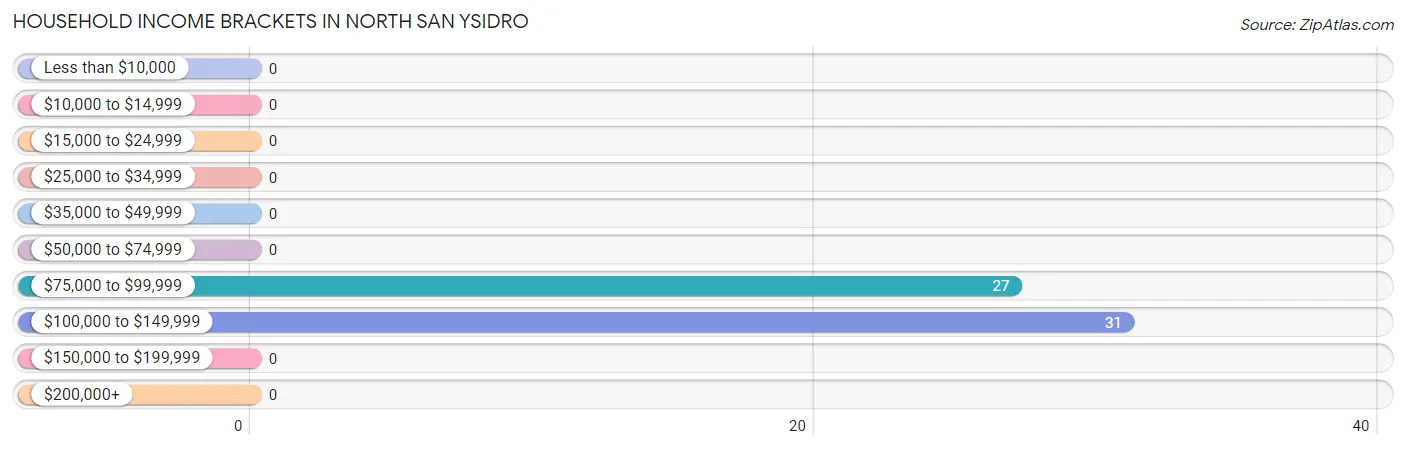
| Income Bracket | # Households | % Households |
| Less than $10,000 | 0 | 0.0% |
| $10,000 to $14,999 | 0 | 0.0% |
| $15,000 to $24,999 | 0 | 0.0% |
| $25,000 to $34,999 | 0 | 0.0% |
| $35,000 to $49,999 | 0 | 0.0% |
| $50,000 to $74,999 | 0 | 0.0% |
| $75,000 to $99,999 | 27 | 46.6% |
| $100,000 to $149,999 | 31 | 53.4% |
| $150,000 to $199,999 | 0 | 0.0% |
| $200,000+ | 0 | 0.0% |
Household Income by Householder Age in North San Ysidro
| Income Bracket | # Households | Median Income |
| 15 to 24 Years | 0 (0.0%) | $0 |
| 25 to 44 Years | 27 (46.6%) | $0 |
| 45 to 64 Years | 31 (53.4%) | $0 |
| 65+ Years | 0 (0.0%) | $0 |
| Total | 58 (100.0%) | $0 |
Poverty in North San Ysidro
Income Below Poverty by Sex and Age in North San Ysidro
| Age Bracket | Male | Female |
| Under 5 Years | 0 (0.0%) | 0 (0.0%) |
| 5 Years | 0 (0.0%) | 0 (0.0%) |
| 6 to 11 Years | 0 (0.0%) | 0 (0.0%) |
| 12 to 14 Years | 0 (0.0%) | 0 (0.0%) |
| 15 Years | 0 (0.0%) | 0 (0.0%) |
| 16 and 17 Years | 0 (0.0%) | 0 (0.0%) |
| 18 to 24 Years | 0 (0.0%) | 0 (0.0%) |
| 25 to 34 Years | 0 (0.0%) | 0 (0.0%) |
| 35 to 44 Years | 0 (0.0%) | 0 (0.0%) |
| 45 to 54 Years | 0 (0.0%) | 0 (0.0%) |
| 55 to 64 Years | 0 (0.0%) | 0 (0.0%) |
| 65 to 74 Years | 0 (0.0%) | 0 (0.0%) |
| 75 Years and over | 0 (0.0%) | 0 (0.0%) |
| Total | 0 (0.0%) | 0 (0.0%) |
Income Above Poverty by Sex and Age in North San Ysidro
According to the poverty statistics in North San Ysidro, males aged 18 to 24 years and females aged 16 and 17 years are the age groups that are most secure financially, with 100.0% of males and 100.0% of females in these age groups living above the poverty line.
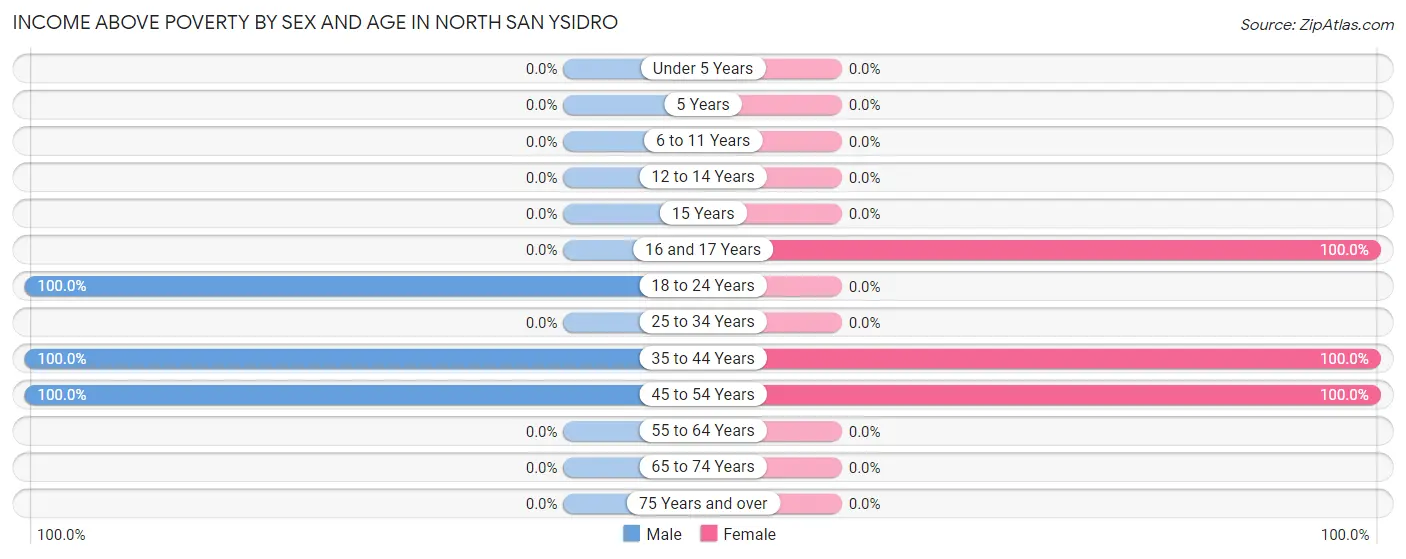
| Age Bracket | Male | Female |
| Under 5 Years | 0 (0.0%) | 0 (0.0%) |
| 5 Years | 0 (0.0%) | 0 (0.0%) |
| 6 to 11 Years | 0 (0.0%) | 0 (0.0%) |
| 12 to 14 Years | 0 (0.0%) | 0 (0.0%) |
| 15 Years | 0 (0.0%) | 0 (0.0%) |
| 16 and 17 Years | 0 (0.0%) | 62 (100.0%) |
| 18 to 24 Years | 27 (100.0%) | 0 (0.0%) |
| 25 to 34 Years | 0 (0.0%) | 0 (0.0%) |
| 35 to 44 Years | 27 (100.0%) | 34 (100.0%) |
| 45 to 54 Years | 31 (100.0%) | 33 (100.0%) |
| 55 to 64 Years | 0 (0.0%) | 0 (0.0%) |
| 65 to 74 Years | 0 (0.0%) | 0 (0.0%) |
| 75 Years and over | 0 (0.0%) | 0 (0.0%) |
| Total | 85 (100.0%) | 129 (100.0%) |
Income Below Poverty Among Married-Couple Families in North San Ysidro
| Children | Above Poverty | Below Poverty |
| No Children | 0 (0.0%) | 0 (0.0%) |
| 1 or 2 Children | 0 (0.0%) | 0 (0.0%) |
| 3 or 4 Children | 0 (0.0%) | 0 (0.0%) |
| 5 or more Children | 0 (0.0%) | 0 (0.0%) |
| Total | 0 (0.0%) | 0 (0.0%) |
Income Below Poverty Among Single-Parent Households in North San Ysidro
| Children | Single Father | Single Mother |
| No Children | 0 (0.0%) | 0 (0.0%) |
| 1 or 2 Children | 0 (0.0%) | 0 (0.0%) |
| 3 or 4 Children | 0 (0.0%) | 0 (0.0%) |
| 5 or more Children | 0 (0.0%) | 0 (0.0%) |
| Total | 0 (0.0%) | 0 (0.0%) |
Income Below Poverty Among Married-Couple vs Single-Parent Households in North San Ysidro
| Children | Married-Couple Families | Single-Parent Households |
| No Children | 0 (0.0%) | 0 (0.0%) |
| 1 or 2 Children | 0 (0.0%) | 0 (0.0%) |
| 3 or 4 Children | 0 (0.0%) | 0 (0.0%) |
| 5 or more Children | 0 (0.0%) | 0 (0.0%) |
| Total | 0 (0.0%) | 0 (0.0%) |
Race in North San Ysidro
The most populous races in North San Ysidro are Two or more Races (153 | 71.5%), and White / Caucasian (61 | 28.5%).
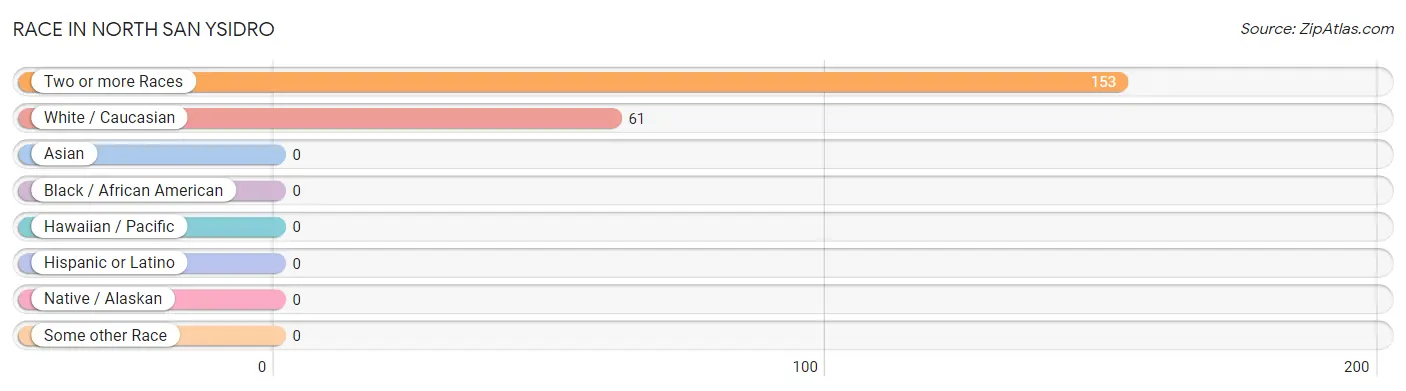
| Race | # Population | % Population |
| Asian | 0 | 0.0% |
| Black / African American | 0 | 0.0% |
| Hawaiian / Pacific | 0 | 0.0% |
| Hispanic or Latino | 0 | 0.0% |
| Native / Alaskan | 0 | 0.0% |
| White / Caucasian | 61 | 28.5% |
| Two or more Races | 153 | 71.5% |
| Some other Race | 0 | 0.0% |
| Total | 214 | 100.0% |
Ancestry in North San Ysidro
The most populous ancestries reported in North San Ysidro are , and European (27 | 12.6%), together accounting for 12.6% of all North San Ysidro residents.

| Ancestry | # Population | % Population |
| European | 27 | 12.6% | View All 1 Rows |
Immigrants in North San Ysidro

| Immigration Origin | # Population | % Population | View All 0 Rows |
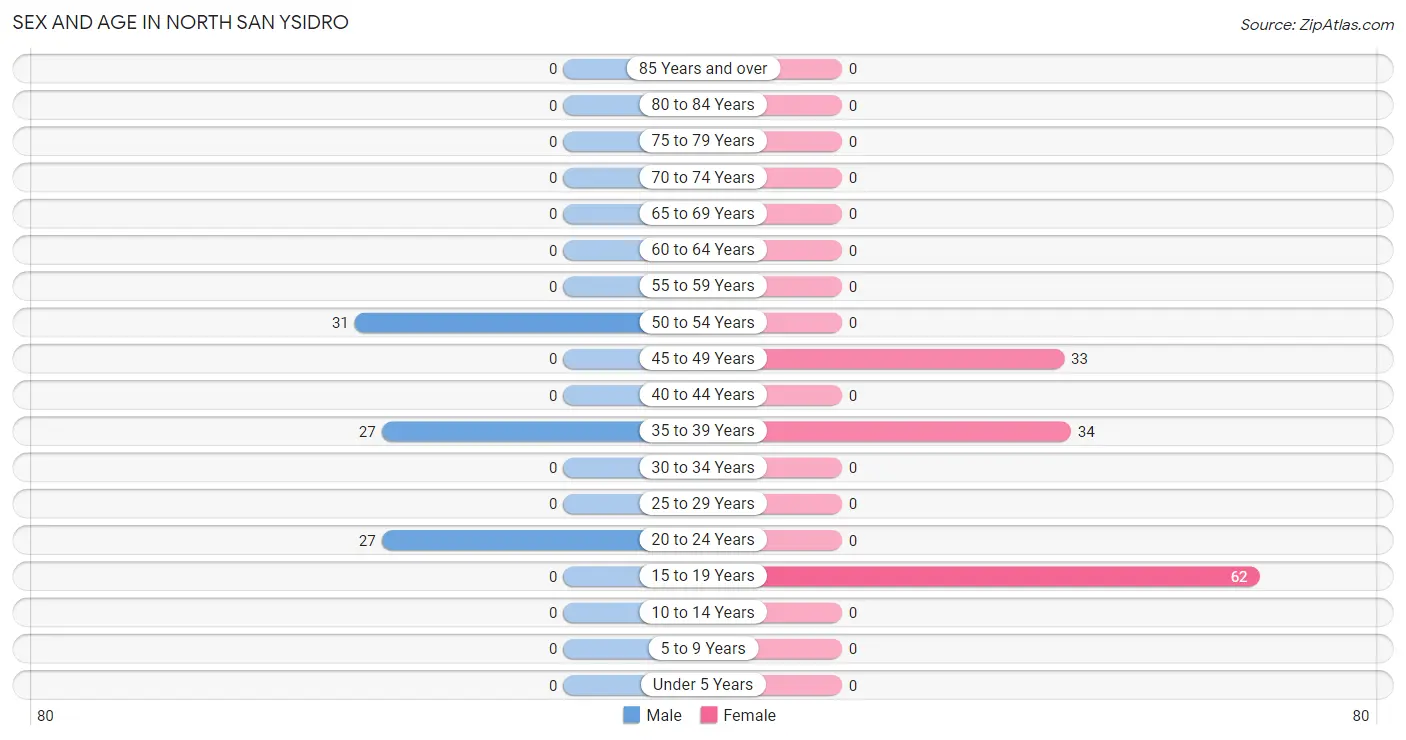
Sex and Age in North San Ysidro
Sex and Age in North San Ysidro
The most populous age groups in North San Ysidro are 50 to 54 Years (31 | 36.5%) for men and 15 to 19 Years (62 | 48.1%) for women.
| Age Bracket | Male | Female |
| Under 5 Years | 0 (0.0%) | 0 (0.0%) |
| 5 to 9 Years | 0 (0.0%) | 0 (0.0%) |
| 10 to 14 Years | 0 (0.0%) | 0 (0.0%) |
| 15 to 19 Years | 0 (0.0%) | 62 (48.1%) |
| 20 to 24 Years | 27 (31.8%) | 0 (0.0%) |
| 25 to 29 Years | 0 (0.0%) | 0 (0.0%) |
| 30 to 34 Years | 0 (0.0%) | 0 (0.0%) |
| 35 to 39 Years | 27 (31.8%) | 34 (26.4%) |
| 40 to 44 Years | 0 (0.0%) | 0 (0.0%) |
| 45 to 49 Years | 0 (0.0%) | 33 (25.6%) |
| 50 to 54 Years | 31 (36.5%) | 0 (0.0%) |
| 55 to 59 Years | 0 (0.0%) | 0 (0.0%) |
| 60 to 64 Years | 0 (0.0%) | 0 (0.0%) |
| 65 to 69 Years | 0 (0.0%) | 0 (0.0%) |
| 70 to 74 Years | 0 (0.0%) | 0 (0.0%) |
| 75 to 79 Years | 0 (0.0%) | 0 (0.0%) |
| 80 to 84 Years | 0 (0.0%) | 0 (0.0%) |
| 85 Years and over | 0 (0.0%) | 0 (0.0%) |
| Total | 85 (100.0%) | 129 (100.0%) |
Families and Households in North San Ysidro
Median Family Size in North San Ysidro
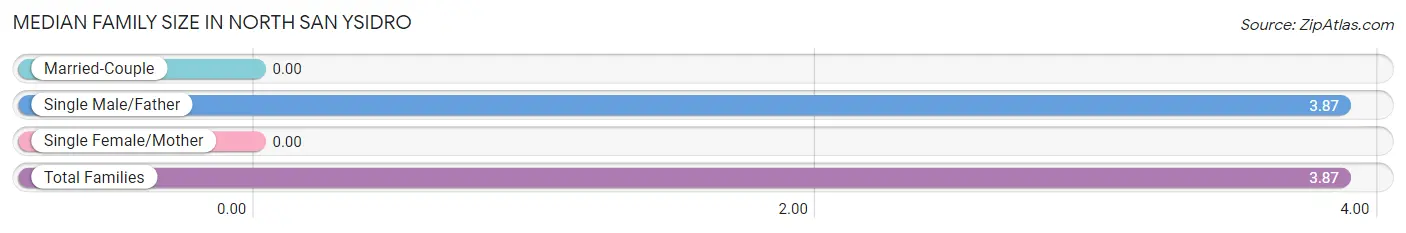
| Family Type | # Families | Family Size |
| Married-Couple | 0 (0.0%) | - |
| Single Male/Father | 31 (100.0%) | 3.87 |
| Single Female/Mother | 0 (0.0%) | - |
| Total Families | 31 (100.0%) | 3.87 |
Median Household Size in North San Ysidro
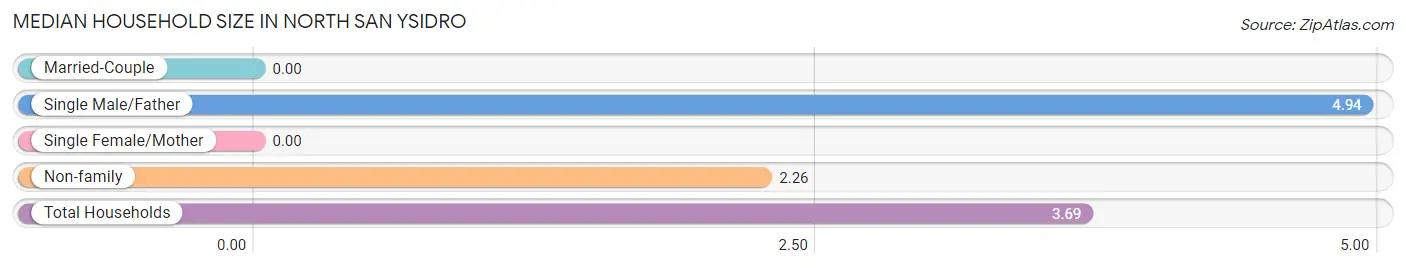
| Household Type | # Households | Household Size |
| Married-Couple | 0 (0.0%) | - |
| Single Male/Father | 31 (53.4%) | 4.94 |
| Single Female/Mother | 0 (0.0%) | - |
| Non-family | 27 (46.6%) | 2.26 |
| Total Households | 58 (100.0%) | 3.69 |
Household Size by Marriage Status in North San Ysidro
Out of a total of 58 households in North San Ysidro, 31 (53.4%) are family households, while 27 (46.6%) are nonfamily households. The most numerous type of family households are 4-person households, comprising 31, and the most common type of nonfamily households are 2-person households, comprising 27.
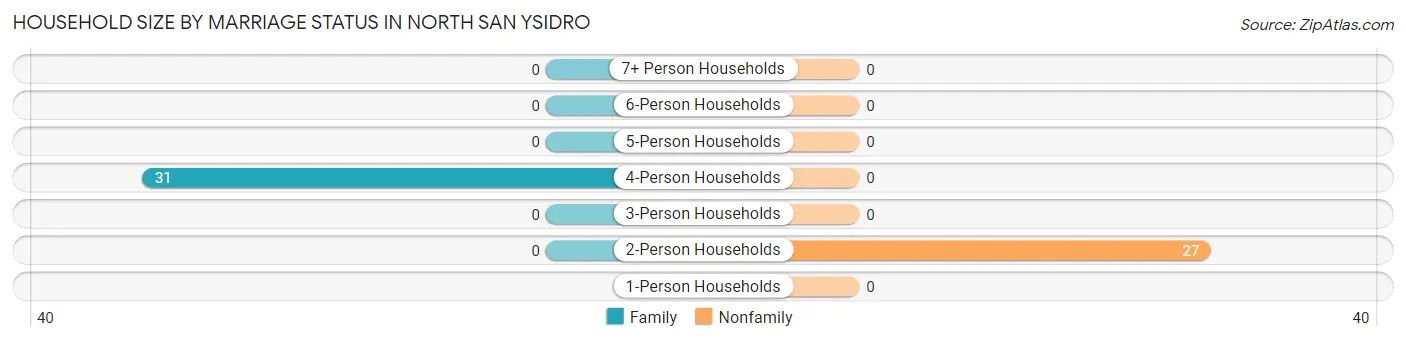
| Household Size | Family Households | Nonfamily Households |
| 1-Person Households | - | 0 (0.0%) |
| 2-Person Households | 0 (0.0%) | 27 (46.6%) |
| 3-Person Households | 0 (0.0%) | 0 (0.0%) |
| 4-Person Households | 31 (53.4%) | 0 (0.0%) |
| 5-Person Households | 0 (0.0%) | 0 (0.0%) |
| 6-Person Households | 0 (0.0%) | 0 (0.0%) |
| 7+ Person Households | 0 (0.0%) | 0 (0.0%) |
| Total | 31 (53.4%) | 27 (46.6%) |
Female Fertility in North San Ysidro
Fertility by Age in North San Ysidro
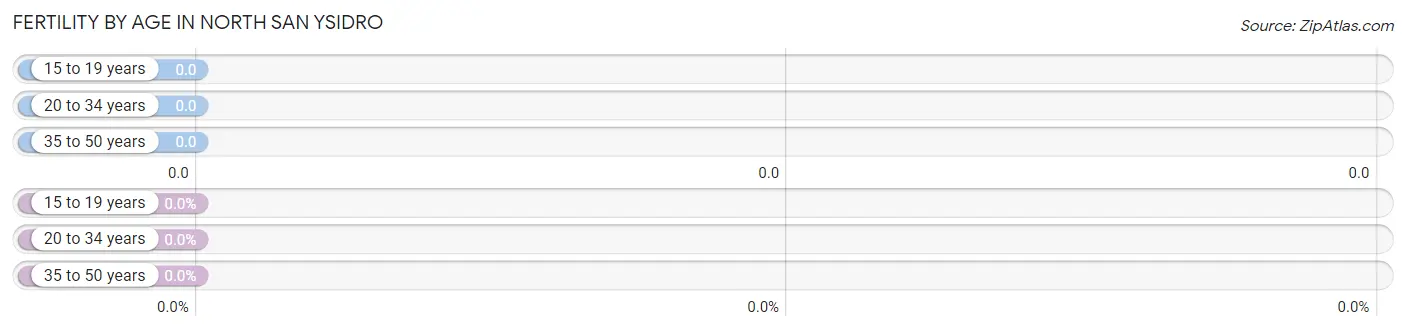
| Age Bracket | Women with Births | Births / 1,000 Women |
| 15 to 19 years | 0 (0.0%) | 0.0 |
| 20 to 34 years | 0 (0.0%) | 0.0 |
| 35 to 50 years | 0 (0.0%) | 0.0 |
| Total | 0 (0.0%) | 0.0 |
Fertility by Age by Marriage Status in North San Ysidro
| Age Bracket | Married | Unmarried |
| 15 to 19 years | 0 (0.0%) | 0 (0.0%) |
| 20 to 34 years | 0 (0.0%) | 0 (0.0%) |
| 35 to 50 years | 0 (0.0%) | 0 (0.0%) |
| Total | 0 (0.0%) | 0 (0.0%) |
Fertility by Education in North San Ysidro
| Educational Attainment | Women with Births | Births / 1,000 Women |
| Less than High School | 0 (0.0%) | 0.0 |
| High School Diploma | 0 (0.0%) | 0.0 |
| College or Associate's Degree | 0 (0.0%) | 0.0 |
| Bachelor's Degree | 0 (0.0%) | 0.0 |
| Graduate Degree | 0 (0.0%) | 0.0 |
| Total | 0 (0.0%) | 0.0 |
Fertility by Education by Marriage Status in North San Ysidro
| Educational Attainment | Married | Unmarried |
| Less than High School | 0 (0.0%) | 0 (0.0%) |
| High School Diploma | 0 (0.0%) | 0 (0.0%) |
| College or Associate's Degree | 0 (0.0%) | 0 (0.0%) |
| Bachelor's Degree | 0 (0.0%) | 0 (0.0%) |
| Graduate Degree | 0 (0.0%) | 0 (0.0%) |
| Total | 0 (0.0%) | 0 (0.0%) |
Employment Characteristics in North San Ysidro
Employment by Class of Employer in North San Ysidro
Among the 125 employed individuals in North San Ysidro, not-for-profit organizations (67 | 53.6%), and private company employees (58 | 46.4%) make up the most common classes of employment.
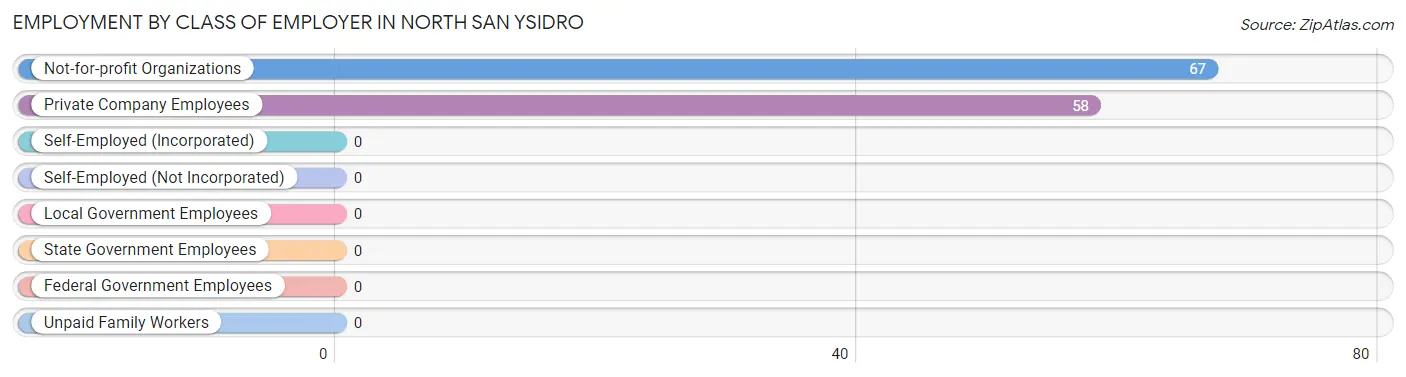
| Employer Class | # Employees | % Employees |
| Private Company Employees | 58 | 46.4% |
| Self-Employed (Incorporated) | 0 | 0.0% |
| Self-Employed (Not Incorporated) | 0 | 0.0% |
| Not-for-profit Organizations | 67 | 53.6% |
| Local Government Employees | 0 | 0.0% |
| State Government Employees | 0 | 0.0% |
| Federal Government Employees | 0 | 0.0% |
| Unpaid Family Workers | 0 | 0.0% |
| Total | 125 | 100.0% |
Employment Status by Age in North San Ysidro
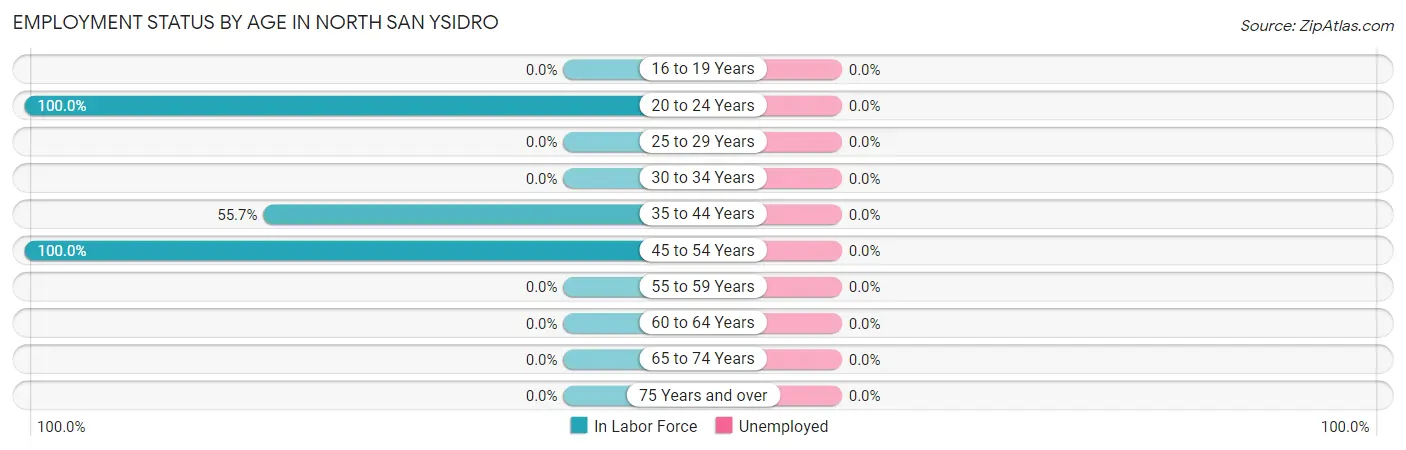
| Age Bracket | In Labor Force | Unemployed |
| 16 to 19 Years | 0 (0.0%) | 0 (0.0%) |
| 20 to 24 Years | 27 (100.0%) | 0 (0.0%) |
| 25 to 29 Years | 0 (0.0%) | 0 (0.0%) |
| 30 to 34 Years | 0 (0.0%) | 0 (0.0%) |
| 35 to 44 Years | 34 (55.7%) | 0 (0.0%) |
| 45 to 54 Years | 64 (100.0%) | 0 (0.0%) |
| 55 to 59 Years | 0 (0.0%) | 0 (0.0%) |
| 60 to 64 Years | 0 (0.0%) | 0 (0.0%) |
| 65 to 74 Years | 0 (0.0%) | 0 (0.0%) |
| 75 Years and over | 0 (0.0%) | 0 (0.0%) |
| Total | 125 (58.4%) | 0 (0.0%) |
Employment Status by Educational Attainment in North San Ysidro
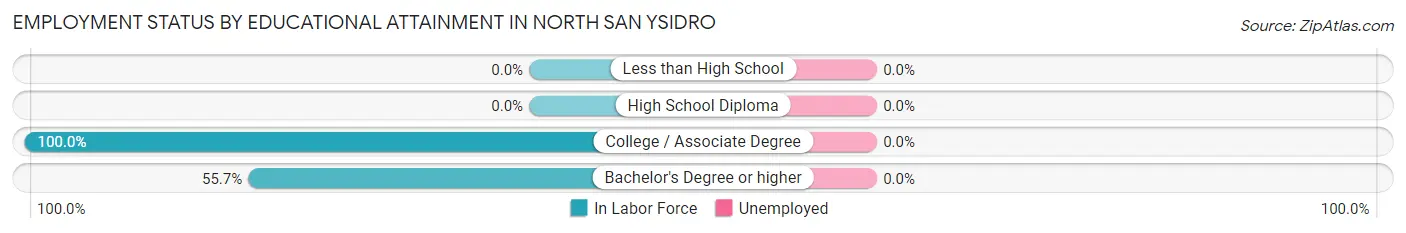
| Educational Attainment | In Labor Force | Unemployed |
| Less than High School | 0 (0.0%) | 0 (0.0%) |
| High School Diploma | 0 (0.0%) | 0 (0.0%) |
| College / Associate Degree | 64 (100.0%) | 0 (0.0%) |
| Bachelor's Degree or higher | 34 (55.7%) | 0 (0.0%) |
| Total | 98 (78.4%) | 0 (0.0%) |
Employment Occupations by Sex in North San Ysidro
Management, Business, Science and Arts Occupations
The most common Management, Business, Science and Arts occupations in North San Ysidro are Community & Social Service (33 | 26.4%), Education Instruction & Library (33 | 26.4%), and Management (31 | 24.8%).
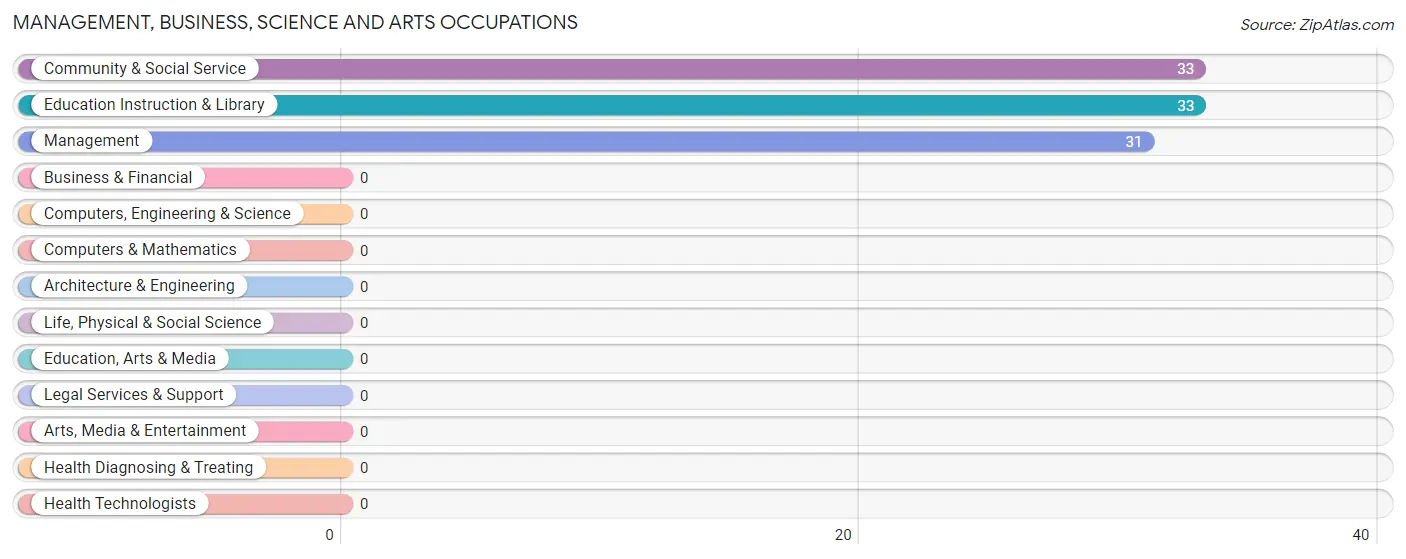
Management, Business, Science and Arts Occupations by Sex
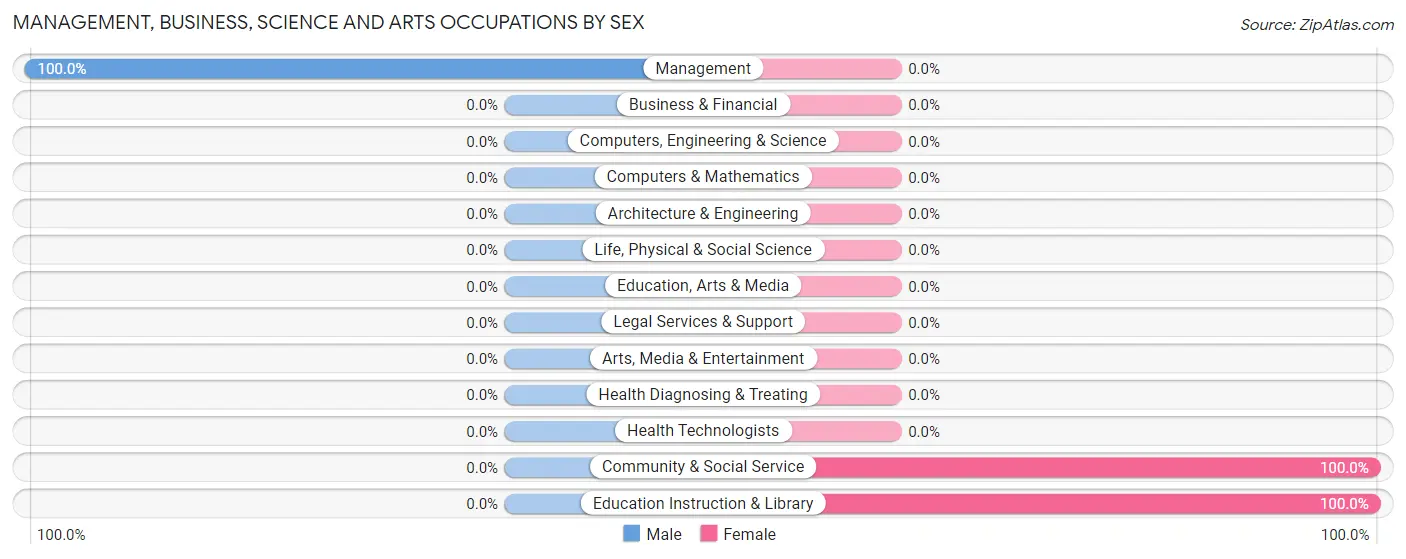
| Occupation | Male | Female |
| Management | 31 (100.0%) | 0 (0.0%) |
| Business & Financial | 0 (0.0%) | 0 (0.0%) |
| Computers, Engineering & Science | 0 (0.0%) | 0 (0.0%) |
| Computers & Mathematics | 0 (0.0%) | 0 (0.0%) |
| Architecture & Engineering | 0 (0.0%) | 0 (0.0%) |
| Life, Physical & Social Science | 0 (0.0%) | 0 (0.0%) |
| Community & Social Service | 0 (0.0%) | 33 (100.0%) |
| Education, Arts & Media | 0 (0.0%) | 0 (0.0%) |
| Legal Services & Support | 0 (0.0%) | 0 (0.0%) |
| Education Instruction & Library | 0 (0.0%) | 33 (100.0%) |
| Arts, Media & Entertainment | 0 (0.0%) | 0 (0.0%) |
| Health Diagnosing & Treating | 0 (0.0%) | 0 (0.0%) |
| Health Technologists | 0 (0.0%) | 0 (0.0%) |
| Total (Category) | 31 (48.4%) | 33 (51.6%) |
| Total (Overall) | 58 (46.4%) | 67 (53.6%) |
Services Occupations
The most common Services occupations in North San Ysidro are , and Personal Care & Service (34 | 27.2%).
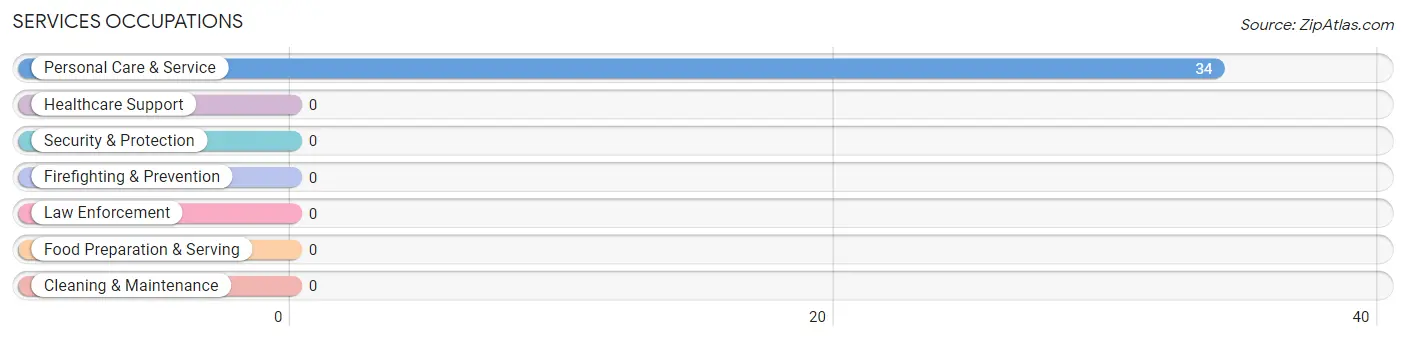
Services Occupations by Sex
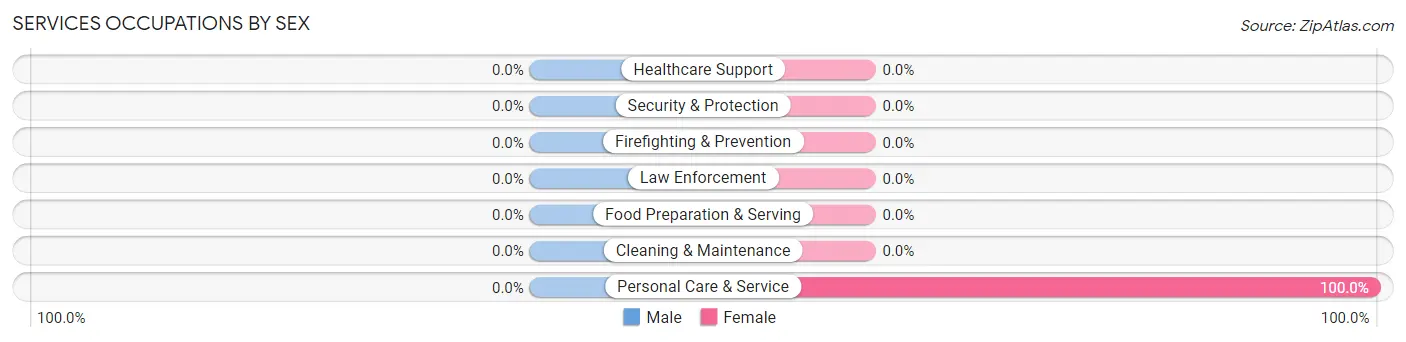
| Occupation | Male | Female |
| Healthcare Support | 0 (0.0%) | 0 (0.0%) |
| Security & Protection | 0 (0.0%) | 0 (0.0%) |
| Firefighting & Prevention | 0 (0.0%) | 0 (0.0%) |
| Law Enforcement | 0 (0.0%) | 0 (0.0%) |
| Food Preparation & Serving | 0 (0.0%) | 0 (0.0%) |
| Cleaning & Maintenance | 0 (0.0%) | 0 (0.0%) |
| Personal Care & Service | 0 (0.0%) | 34 (100.0%) |
| Total (Category) | 0 (0.0%) | 34 (100.0%) |
| Total (Overall) | 58 (46.4%) | 67 (53.6%) |
Sales and Office Occupations
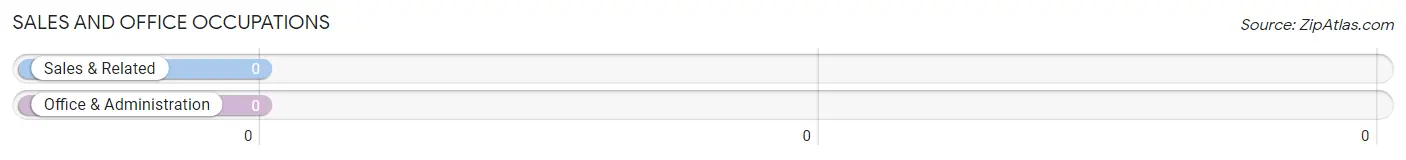
Sales and Office Occupations by Sex
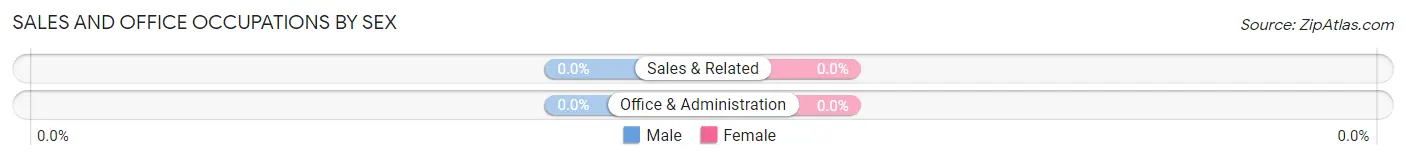
| Occupation | Male | Female |
| Sales & Related | 0 (0.0%) | 0 (0.0%) |
| Office & Administration | 0 (0.0%) | 0 (0.0%) |
| Total (Category) | 0 (0.0%) | 0 (0.0%) |
| Total (Overall) | 58 (46.4%) | 67 (53.6%) |
Natural Resources, Construction and Maintenance Occupations
Natural Resources, Construction and Maintenance Occupations by Sex
| Occupation | Male | Female |
| Farming, Fishing & Forestry | 0 (0.0%) | 0 (0.0%) |
| Construction & Extraction | 0 (0.0%) | 0 (0.0%) |
| Installation, Maintenance & Repair | 0 (0.0%) | 0 (0.0%) |
| Total (Category) | 0 (0.0%) | 0 (0.0%) |
| Total (Overall) | 58 (46.4%) | 67 (53.6%) |
Production, Transportation and Moving Occupations
The most common Production, Transportation and Moving occupations in North San Ysidro are , and Material Moving (27 | 21.6%).
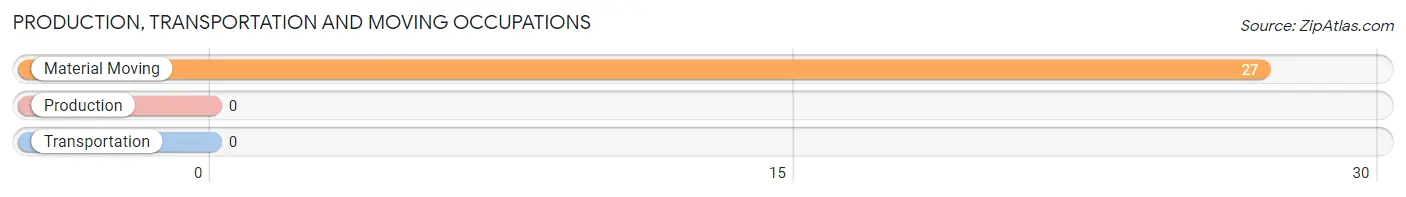
Production, Transportation and Moving Occupations by Sex
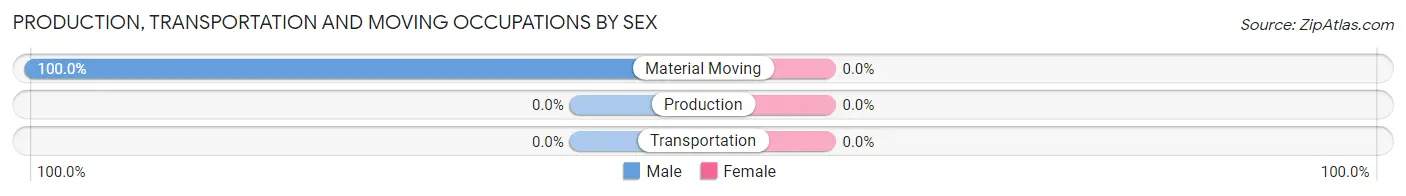
| Occupation | Male | Female |
| Production | 0 (0.0%) | 0 (0.0%) |
| Transportation | 0 (0.0%) | 0 (0.0%) |
| Material Moving | 27 (100.0%) | 0 (0.0%) |
| Total (Category) | 27 (100.0%) | 0 (0.0%) |
| Total (Overall) | 58 (46.4%) | 67 (53.6%) |
Employment Industries by Sex in North San Ysidro
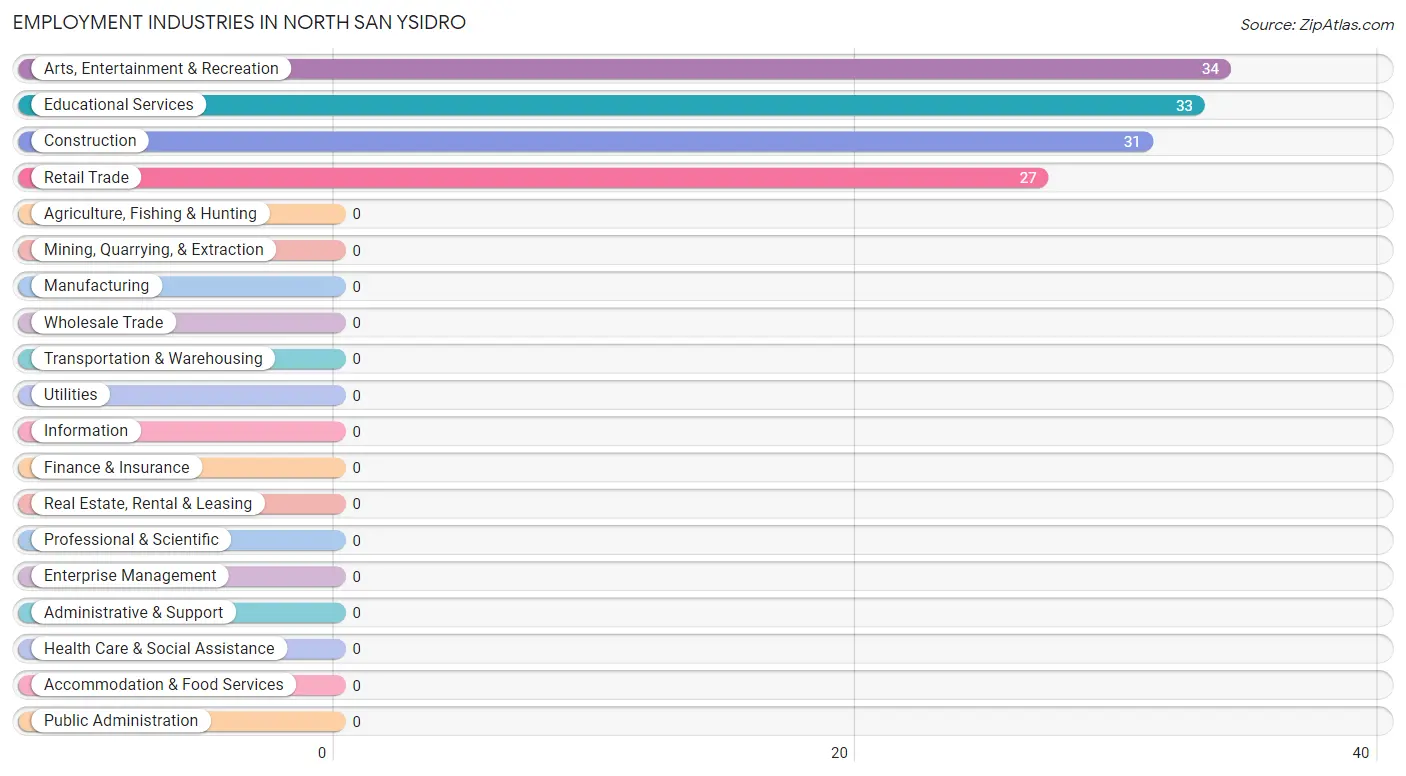
Employment Industries in North San Ysidro
The major employment industries in North San Ysidro include Arts, Entertainment & Recreation (34 | 27.2%), Educational Services (33 | 26.4%), Construction (31 | 24.8%), and Retail Trade (27 | 21.6%).
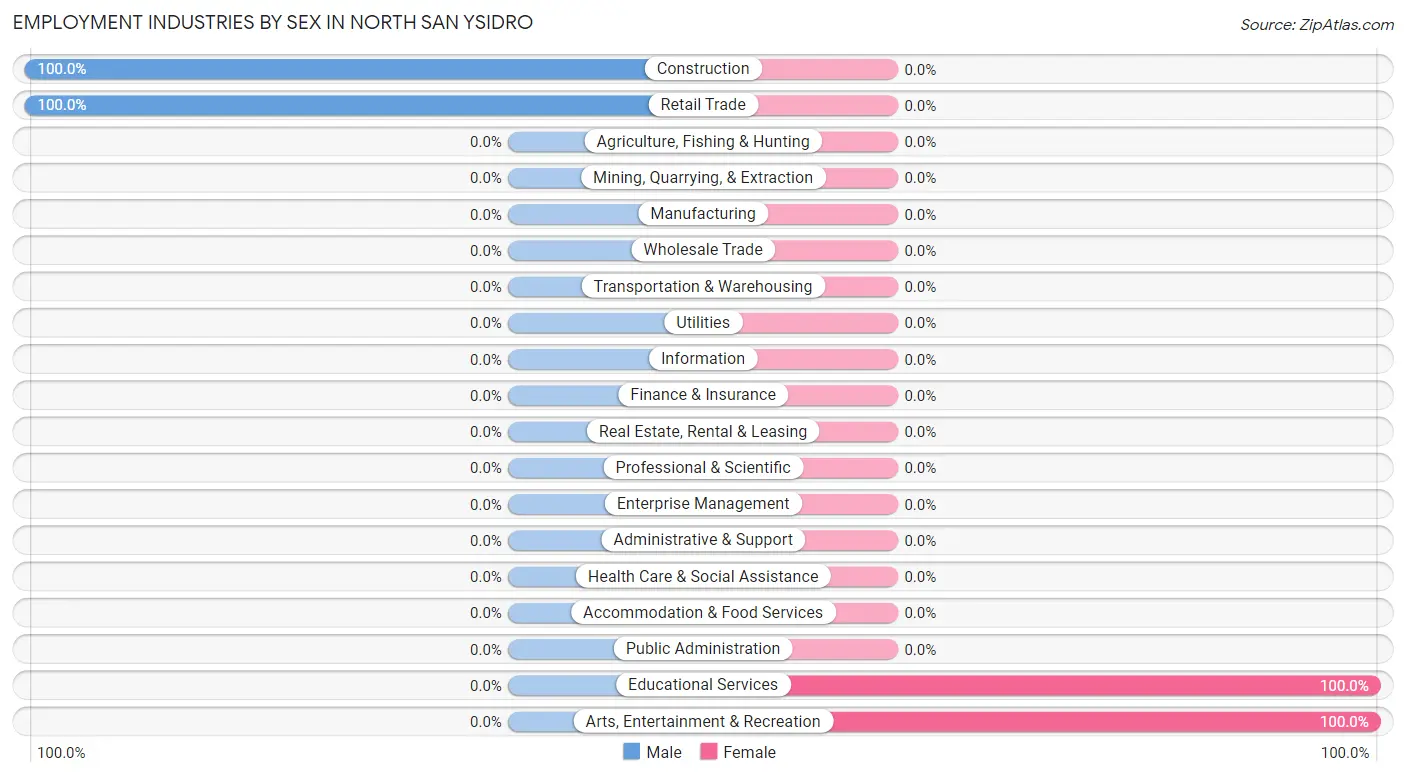
Employment Industries by Sex in North San Ysidro
The North San Ysidro industries that see more men than women are Construction (100.0%), and Retail Trade (100.0%), whereas the industries that tend to have a higher number of women are Educational Services (100.0%), and Arts, Entertainment & Recreation (100.0%).
| Industry | Male | Female |
| Agriculture, Fishing & Hunting | 0 (0.0%) | 0 (0.0%) |
| Mining, Quarrying, & Extraction | 0 (0.0%) | 0 (0.0%) |
| Construction | 31 (100.0%) | 0 (0.0%) |
| Manufacturing | 0 (0.0%) | 0 (0.0%) |
| Wholesale Trade | 0 (0.0%) | 0 (0.0%) |
| Retail Trade | 27 (100.0%) | 0 (0.0%) |
| Transportation & Warehousing | 0 (0.0%) | 0 (0.0%) |
| Utilities | 0 (0.0%) | 0 (0.0%) |
| Information | 0 (0.0%) | 0 (0.0%) |
| Finance & Insurance | 0 (0.0%) | 0 (0.0%) |
| Real Estate, Rental & Leasing | 0 (0.0%) | 0 (0.0%) |
| Professional & Scientific | 0 (0.0%) | 0 (0.0%) |
| Enterprise Management | 0 (0.0%) | 0 (0.0%) |
| Administrative & Support | 0 (0.0%) | 0 (0.0%) |
| Educational Services | 0 (0.0%) | 33 (100.0%) |
| Health Care & Social Assistance | 0 (0.0%) | 0 (0.0%) |
| Arts, Entertainment & Recreation | 0 (0.0%) | 34 (100.0%) |
| Accommodation & Food Services | 0 (0.0%) | 0 (0.0%) |
| Public Administration | 0 (0.0%) | 0 (0.0%) |
| Total | 58 (46.4%) | 67 (53.6%) |
Education in North San Ysidro
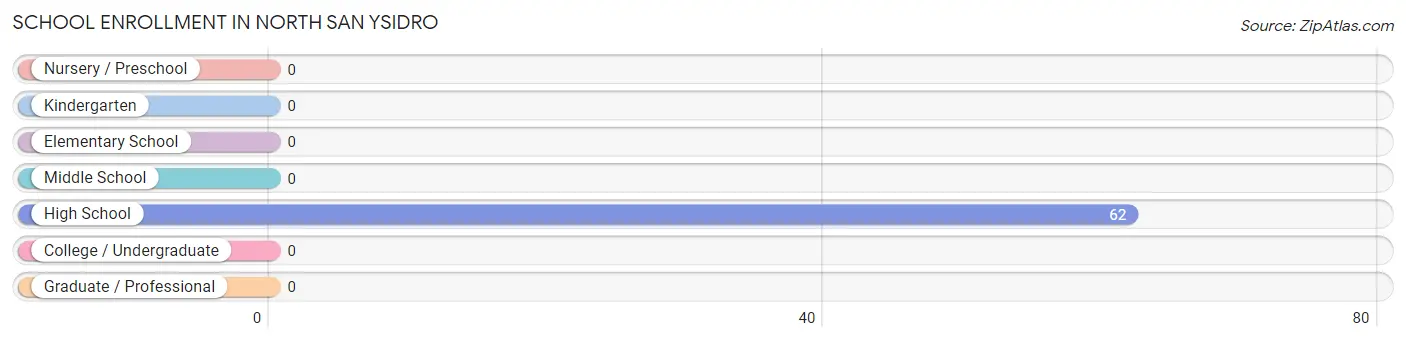
School Enrollment in North San Ysidro
| School Level | # Students | % Students |
| Nursery / Preschool | 0 | 0.0% |
| Kindergarten | 0 | 0.0% |
| Elementary School | 0 | 0.0% |
| Middle School | 0 | 0.0% |
| High School | 62 | 100.0% |
| College / Undergraduate | 0 | 0.0% |
| Graduate / Professional | 0 | 0.0% |
| Total | 62 | 100.0% |
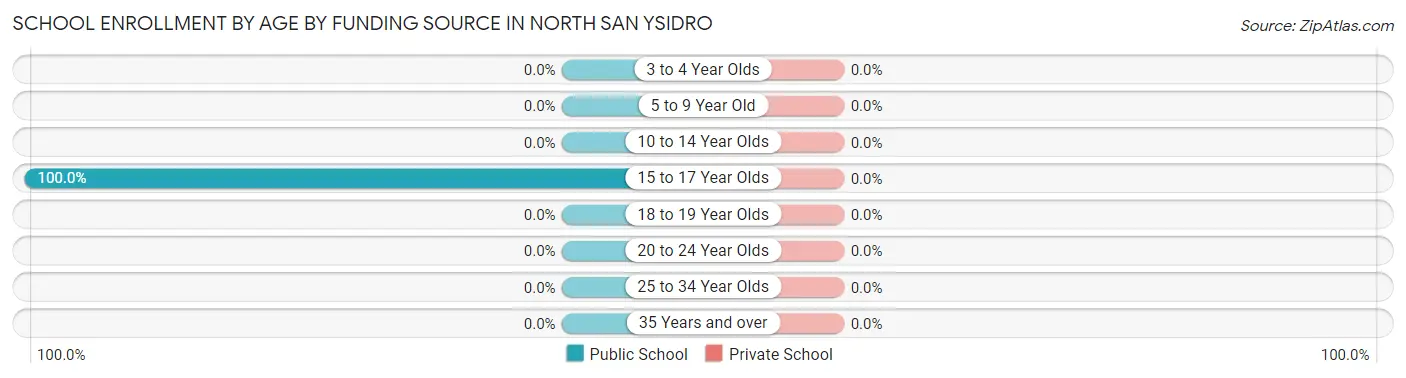
School Enrollment by Age by Funding Source in North San Ysidro
| Age Bracket | Public School | Private School |
| 3 to 4 Year Olds | 0 (0.0%) | 0 (0.0%) |
| 5 to 9 Year Old | 0 (0.0%) | 0 (0.0%) |
| 10 to 14 Year Olds | 0 (0.0%) | 0 (0.0%) |
| 15 to 17 Year Olds | 62 (100.0%) | 0 (0.0%) |
| 18 to 19 Year Olds | 0 (0.0%) | 0 (0.0%) |
| 20 to 24 Year Olds | 0 (0.0%) | 0 (0.0%) |
| 25 to 34 Year Olds | 0 (0.0%) | 0 (0.0%) |
| 35 Years and over | 0 (0.0%) | 0 (0.0%) |
| Total | 62 (100.0%) | 0 (0.0%) |
Educational Attainment by Field of Study in North San Ysidro
Arts & humanities (34 | 55.7%), and computers & mathematics (27 | 44.3%) are the most common fields of study among 61 individuals in North San Ysidro who have obtained a bachelor's degree or higher.
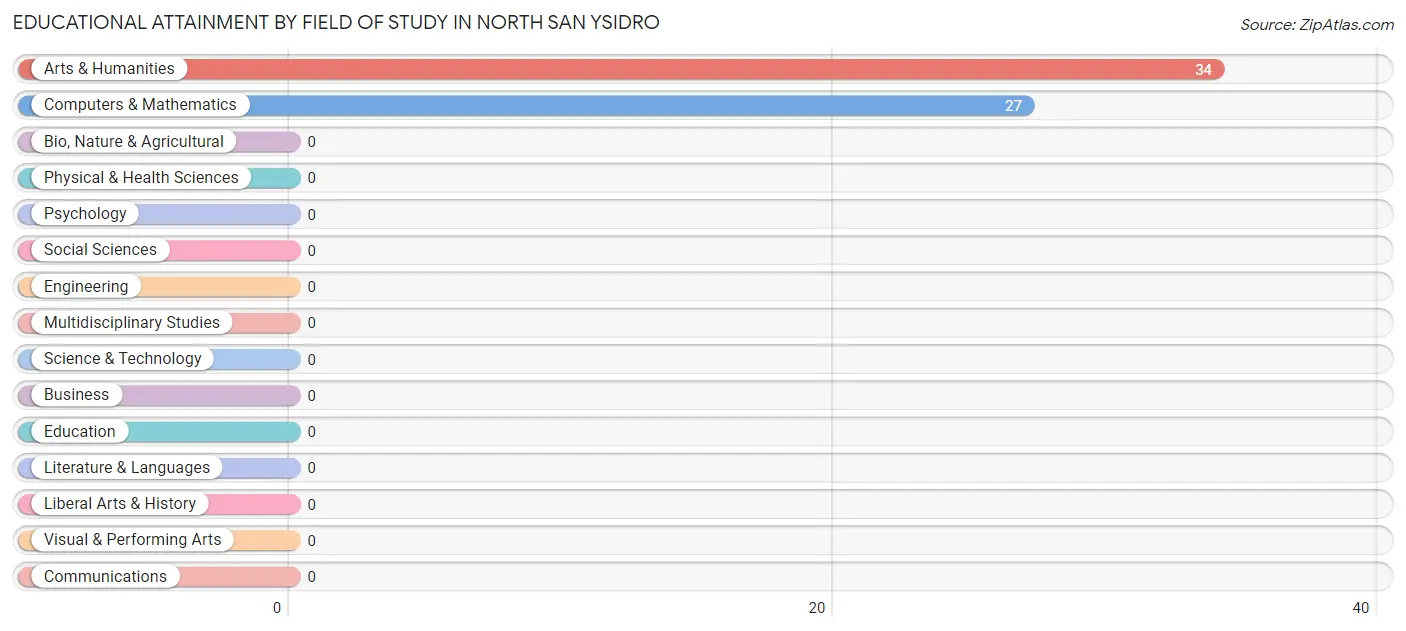
| Field of Study | # Graduates | % Graduates |
| Computers & Mathematics | 27 | 44.3% |
| Bio, Nature & Agricultural | 0 | 0.0% |
| Physical & Health Sciences | 0 | 0.0% |
| Psychology | 0 | 0.0% |
| Social Sciences | 0 | 0.0% |
| Engineering | 0 | 0.0% |
| Multidisciplinary Studies | 0 | 0.0% |
| Science & Technology | 0 | 0.0% |
| Business | 0 | 0.0% |
| Education | 0 | 0.0% |
| Literature & Languages | 0 | 0.0% |
| Liberal Arts & History | 0 | 0.0% |
| Visual & Performing Arts | 0 | 0.0% |
| Communications | 0 | 0.0% |
| Arts & Humanities | 34 | 55.7% |
| Total | 61 | 100.0% |
Transportation & Commute in North San Ysidro
Vehicle Availability by Sex in North San Ysidro
The most prevalent vehicle ownership categories in North San Ysidro are males with 4 vehicles (58, accounting for 100.0%) and females with 4 vehicles (33, making up 86.6%).
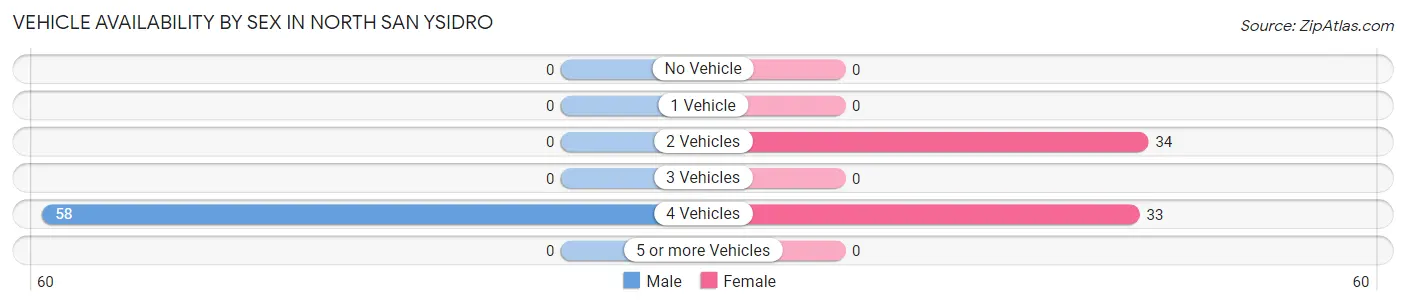
| Vehicles Available | Male | Female |
| No Vehicle | 0 (0.0%) | 0 (0.0%) |
| 1 Vehicle | 0 (0.0%) | 0 (0.0%) |
| 2 Vehicles | 0 (0.0%) | 34 (50.7%) |
| 3 Vehicles | 0 (0.0%) | 0 (0.0%) |
| 4 Vehicles | 58 (100.0%) | 33 (49.2%) |
| 5 or more Vehicles | 0 (0.0%) | 0 (0.0%) |
| Total | 58 (100.0%) | 67 (100.0%) |
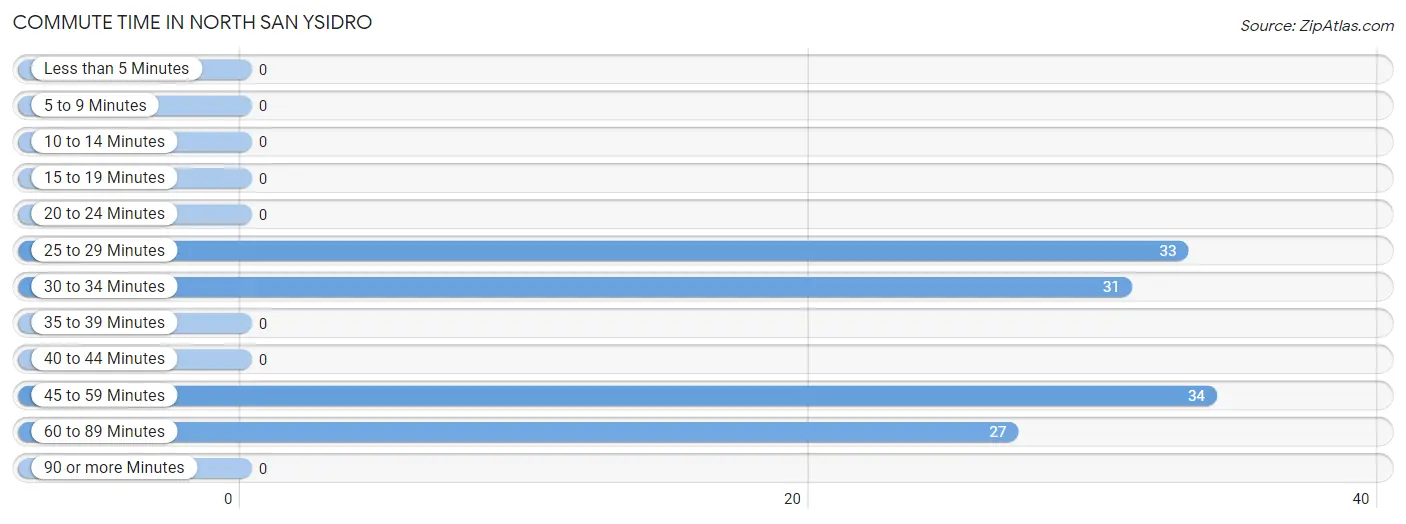
Commute Time in North San Ysidro
The most frequently occuring commute durations in North San Ysidro are 45 to 59 minutes (34 commuters, 27.2%), 25 to 29 minutes (33 commuters, 26.4%), and 30 to 34 minutes (31 commuters, 24.8%).
| Commute Time | # Commuters | % Commuters |
| Less than 5 Minutes | 0 | 0.0% |
| 5 to 9 Minutes | 0 | 0.0% |
| 10 to 14 Minutes | 0 | 0.0% |
| 15 to 19 Minutes | 0 | 0.0% |
| 20 to 24 Minutes | 0 | 0.0% |
| 25 to 29 Minutes | 33 | 26.4% |
| 30 to 34 Minutes | 31 | 24.8% |
| 35 to 39 Minutes | 0 | 0.0% |
| 40 to 44 Minutes | 0 | 0.0% |
| 45 to 59 Minutes | 34 | 27.2% |
| 60 to 89 Minutes | 27 | 21.6% |
| 90 or more Minutes | 0 | 0.0% |
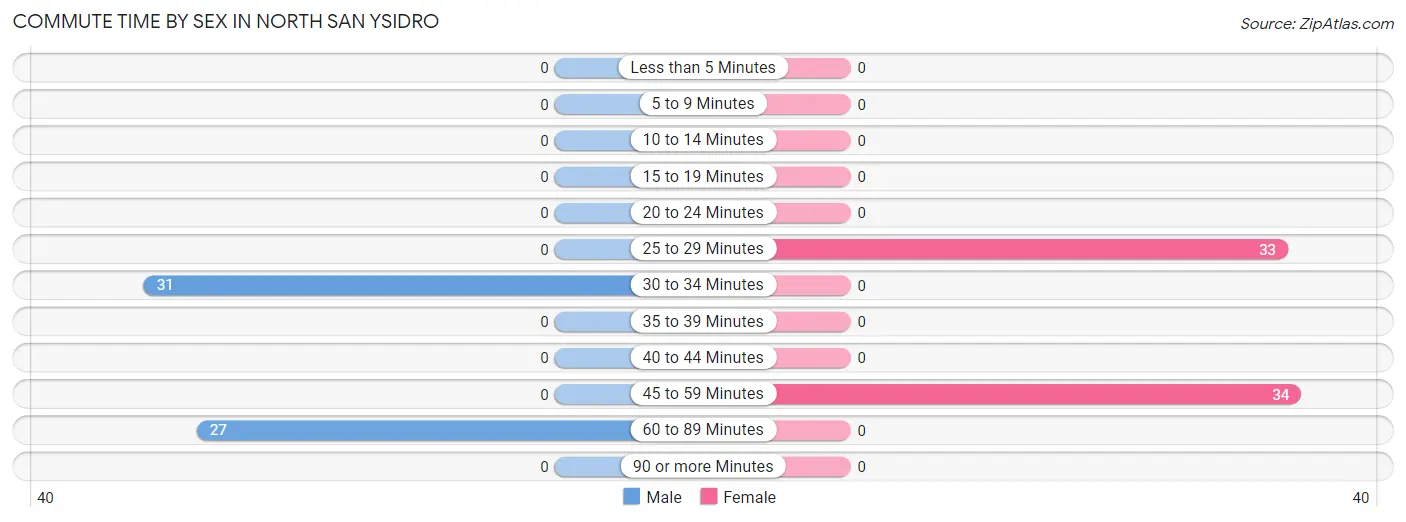
Commute Time by Sex in North San Ysidro
The most common commute times in North San Ysidro are 30 to 34 minutes (31 commuters, 53.4%) for males and 45 to 59 minutes (34 commuters, 50.7%) for females.
| Commute Time | Male | Female |
| Less than 5 Minutes | 0 (0.0%) | 0 (0.0%) |
| 5 to 9 Minutes | 0 (0.0%) | 0 (0.0%) |
| 10 to 14 Minutes | 0 (0.0%) | 0 (0.0%) |
| 15 to 19 Minutes | 0 (0.0%) | 0 (0.0%) |
| 20 to 24 Minutes | 0 (0.0%) | 0 (0.0%) |
| 25 to 29 Minutes | 0 (0.0%) | 33 (49.2%) |
| 30 to 34 Minutes | 31 (53.4%) | 0 (0.0%) |
| 35 to 39 Minutes | 0 (0.0%) | 0 (0.0%) |
| 40 to 44 Minutes | 0 (0.0%) | 0 (0.0%) |
| 45 to 59 Minutes | 0 (0.0%) | 34 (50.7%) |
| 60 to 89 Minutes | 27 (46.6%) | 0 (0.0%) |
| 90 or more Minutes | 0 (0.0%) | 0 (0.0%) |
Time of Departure to Work by Sex in North San Ysidro
The most frequent times of departure to work in North San Ysidro are 7:00 AM to 7:29 AM (31, 53.4%) for males and 9:00 AM to 9:59 AM (34, 50.7%) for females.
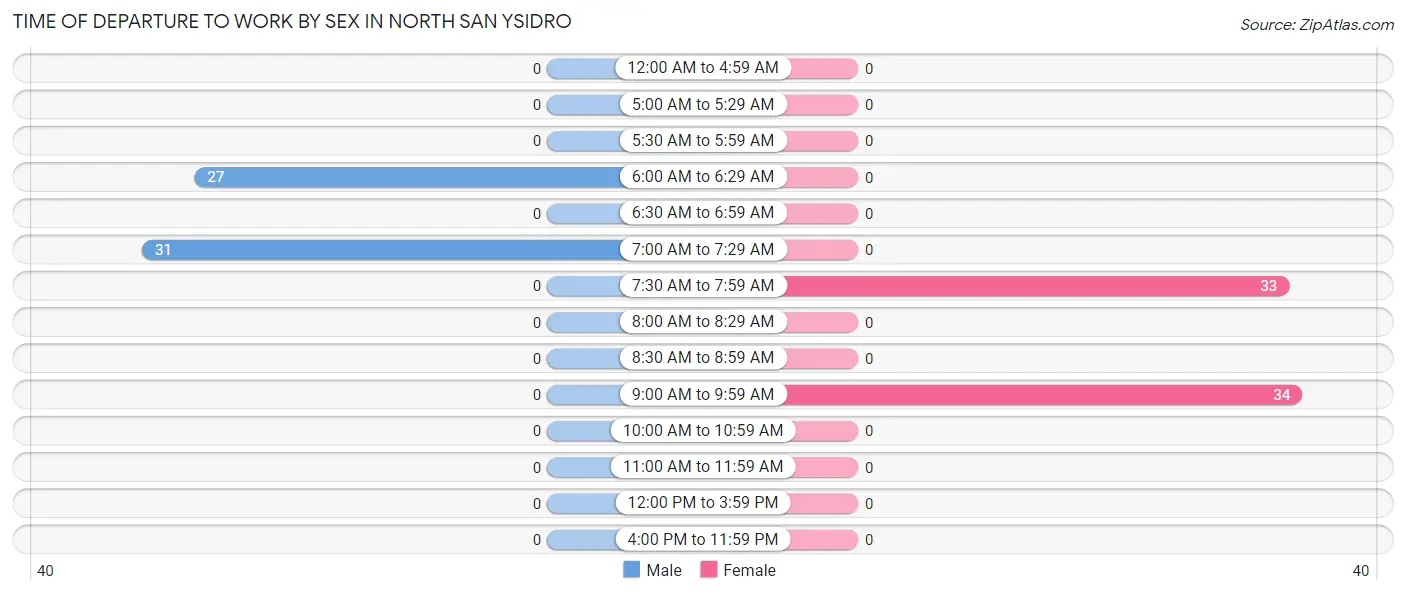
| Time of Departure | Male | Female |
| 12:00 AM to 4:59 AM | 0 (0.0%) | 0 (0.0%) |
| 5:00 AM to 5:29 AM | 0 (0.0%) | 0 (0.0%) |
| 5:30 AM to 5:59 AM | 0 (0.0%) | 0 (0.0%) |
| 6:00 AM to 6:29 AM | 27 (46.6%) | 0 (0.0%) |
| 6:30 AM to 6:59 AM | 0 (0.0%) | 0 (0.0%) |
| 7:00 AM to 7:29 AM | 31 (53.4%) | 0 (0.0%) |
| 7:30 AM to 7:59 AM | 0 (0.0%) | 33 (49.2%) |
| 8:00 AM to 8:29 AM | 0 (0.0%) | 0 (0.0%) |
| 8:30 AM to 8:59 AM | 0 (0.0%) | 0 (0.0%) |
| 9:00 AM to 9:59 AM | 0 (0.0%) | 34 (50.7%) |
| 10:00 AM to 10:59 AM | 0 (0.0%) | 0 (0.0%) |
| 11:00 AM to 11:59 AM | 0 (0.0%) | 0 (0.0%) |
| 12:00 PM to 3:59 PM | 0 (0.0%) | 0 (0.0%) |
| 4:00 PM to 11:59 PM | 0 (0.0%) | 0 (0.0%) |
| Total | 58 (100.0%) | 67 (100.0%) |
Housing Occupancy in North San Ysidro
Occupancy by Ownership in North San Ysidro
Of the total 58 dwellings in North San Ysidro, owner-occupied units account for 58 (100.0%), while renter-occupied units make up 0 (0.0%).
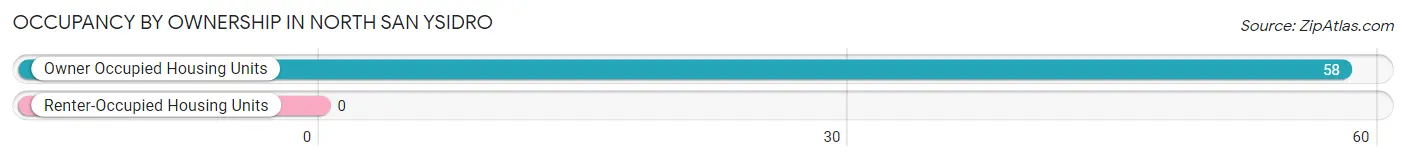
| Occupancy | # Housing Units | % Housing Units |
| Owner Occupied Housing Units | 58 | 100.0% |
| Renter-Occupied Housing Units | 0 | 0.0% |
| Total Occupied Housing Units | 58 | 100.0% |
Occupancy by Household Size in North San Ysidro
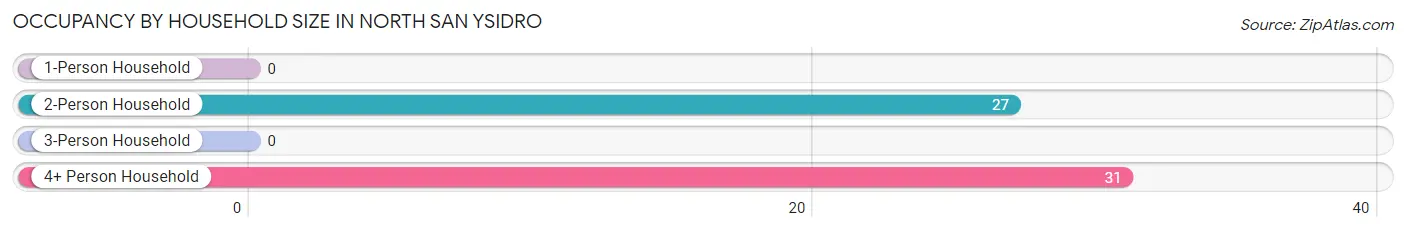
| Household Size | # Housing Units | % Housing Units |
| 1-Person Household | 0 | 0.0% |
| 2-Person Household | 27 | 46.6% |
| 3-Person Household | 0 | 0.0% |
| 4+ Person Household | 31 | 53.4% |
| Total Housing Units | 58 | 100.0% |
Occupancy by Ownership by Household Size in North San Ysidro
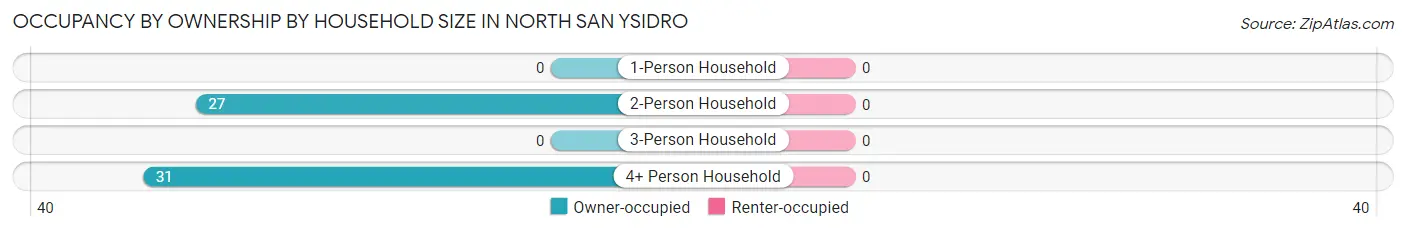
| Household Size | Owner-occupied | Renter-occupied |
| 1-Person Household | 0 (0.0%) | 0 (0.0%) |
| 2-Person Household | 27 (100.0%) | 0 (0.0%) |
| 3-Person Household | 0 (0.0%) | 0 (0.0%) |
| 4+ Person Household | 31 (100.0%) | 0 (0.0%) |
| Total Housing Units | 58 (100.0%) | 0 (0.0%) |
Occupancy by Educational Attainment in North San Ysidro
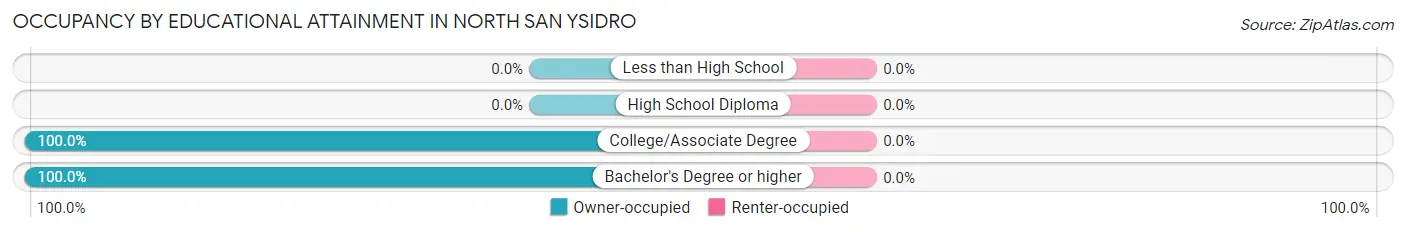
| Household Size | Owner-occupied | Renter-occupied |
| Less than High School | 0 (0.0%) | 0 (0.0%) |
| High School Diploma | 0 (0.0%) | 0 (0.0%) |
| College/Associate Degree | 31 (100.0%) | 0 (0.0%) |
| Bachelor's Degree or higher | 27 (100.0%) | 0 (0.0%) |
Occupancy by Age of Householder in North San Ysidro
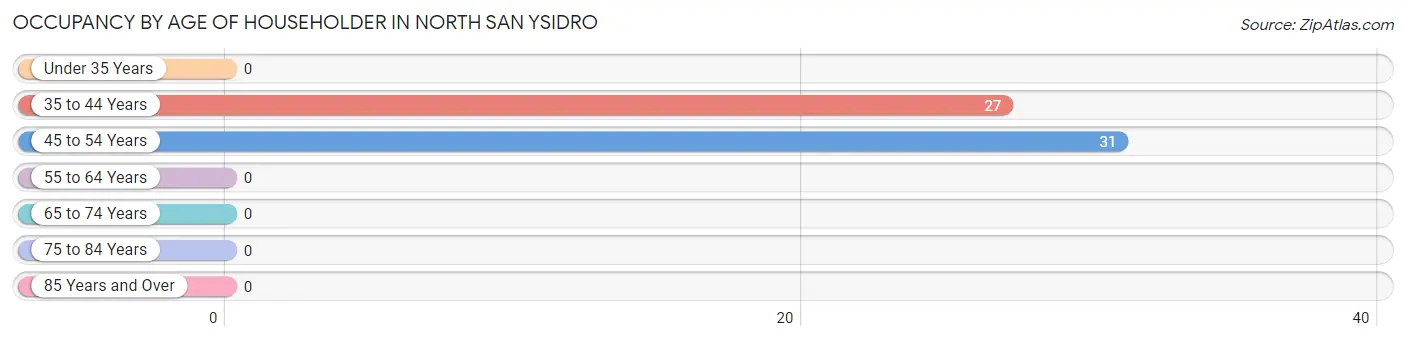
| Age Bracket | # Households | % Households |
| Under 35 Years | 0 | 0.0% |
| 35 to 44 Years | 27 | 46.6% |
| 45 to 54 Years | 31 | 53.4% |
| 55 to 64 Years | 0 | 0.0% |
| 65 to 74 Years | 0 | 0.0% |
| 75 to 84 Years | 0 | 0.0% |
| 85 Years and Over | 0 | 0.0% |
| Total | 58 | 100.0% |
Housing Finances in North San Ysidro
Median Income by Occupancy in North San Ysidro
| Occupancy Type | # Households | Median Income |
| Owner-Occupied | 58 (100.0%) | $0 |
| Renter-Occupied | 0 (0.0%) | $0 |
| Average | 58 (100.0%) | $0 |
Occupancy by Householder Income Bracket in North San Ysidro
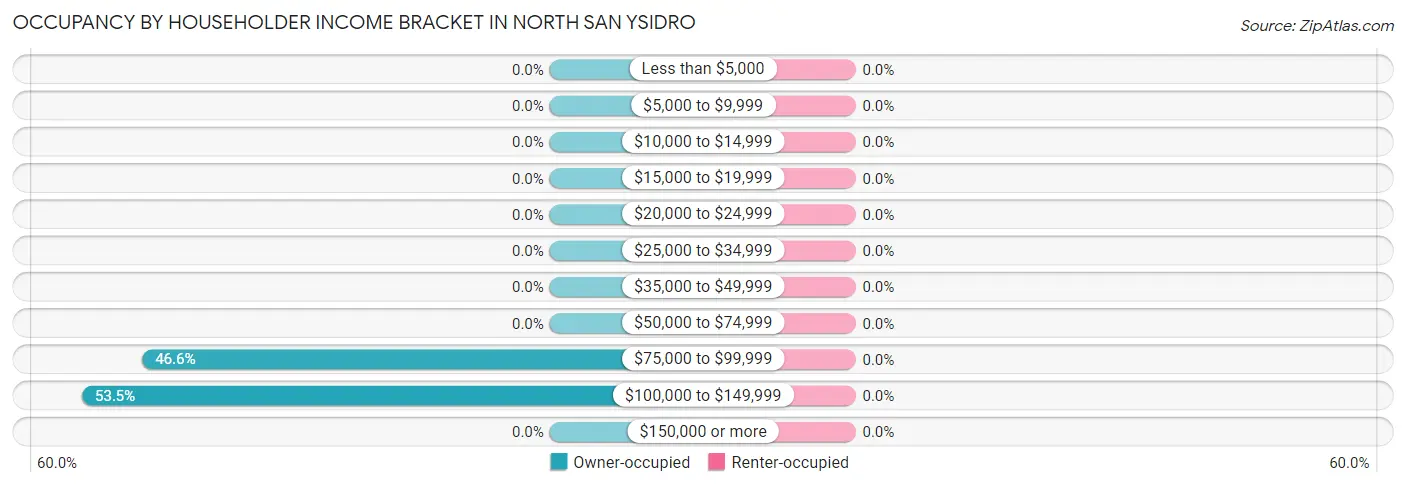
| Income Bracket | Owner-occupied | Renter-occupied |
| Less than $5,000 | 0 (0.0%) | 0 (0.0%) |
| $5,000 to $9,999 | 0 (0.0%) | 0 (0.0%) |
| $10,000 to $14,999 | 0 (0.0%) | 0 (0.0%) |
| $15,000 to $19,999 | 0 (0.0%) | 0 (0.0%) |
| $20,000 to $24,999 | 0 (0.0%) | 0 (0.0%) |
| $25,000 to $34,999 | 0 (0.0%) | 0 (0.0%) |
| $35,000 to $49,999 | 0 (0.0%) | 0 (0.0%) |
| $50,000 to $74,999 | 0 (0.0%) | 0 (0.0%) |
| $75,000 to $99,999 | 27 (46.6%) | 0 (0.0%) |
| $100,000 to $149,999 | 31 (53.4%) | 0 (0.0%) |
| $150,000 or more | 0 (0.0%) | 0 (0.0%) |
| Total | 58 (100.0%) | 0 (0.0%) |
Monthly Housing Cost Tiers in North San Ysidro
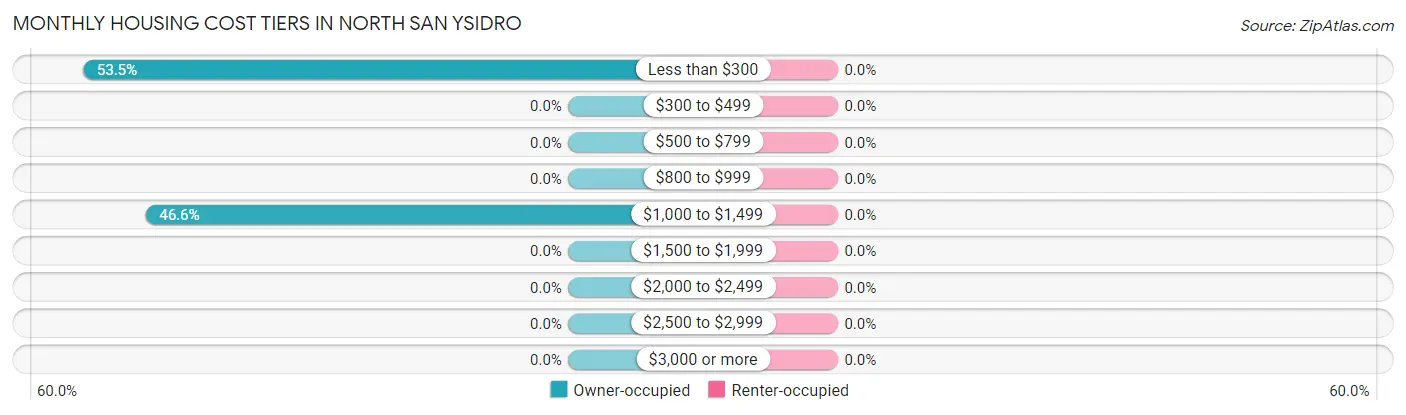
| Monthly Cost | Owner-occupied | Renter-occupied |
| Less than $300 | 31 (53.4%) | 0 (0.0%) |
| $300 to $499 | 0 (0.0%) | 0 (0.0%) |
| $500 to $799 | 0 (0.0%) | 0 (0.0%) |
| $800 to $999 | 0 (0.0%) | 0 (0.0%) |
| $1,000 to $1,499 | 27 (46.6%) | 0 (0.0%) |
| $1,500 to $1,999 | 0 (0.0%) | 0 (0.0%) |
| $2,000 to $2,499 | 0 (0.0%) | 0 (0.0%) |
| $2,500 to $2,999 | 0 (0.0%) | 0 (0.0%) |
| $3,000 or more | 0 (0.0%) | 0 (0.0%) |
| Total | 58 (100.0%) | 0 (0.0%) |
Physical Housing Characteristics in North San Ysidro
Housing Structures in North San Ysidro
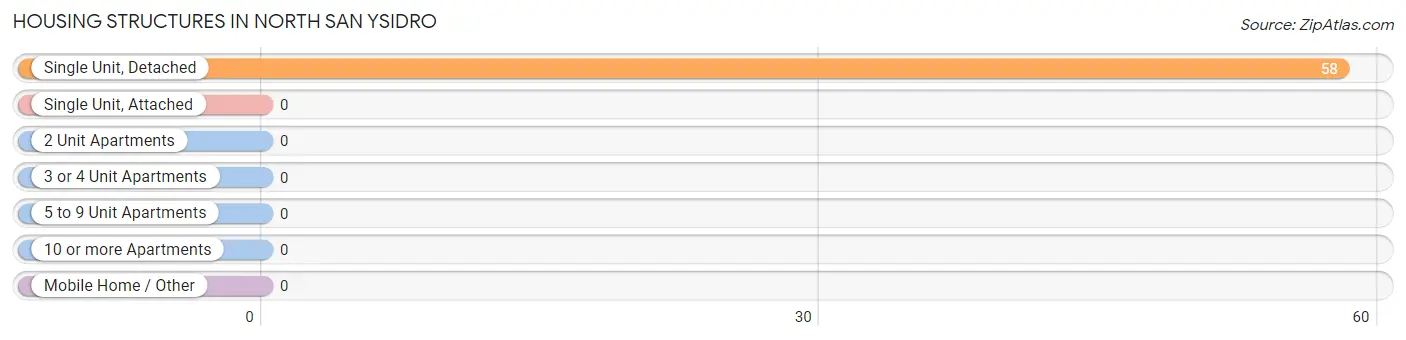
| Structure Type | # Housing Units | % Housing Units |
| Single Unit, Detached | 58 | 100.0% |
| Single Unit, Attached | 0 | 0.0% |
| 2 Unit Apartments | 0 | 0.0% |
| 3 or 4 Unit Apartments | 0 | 0.0% |
| 5 to 9 Unit Apartments | 0 | 0.0% |
| 10 or more Apartments | 0 | 0.0% |
| Mobile Home / Other | 0 | 0.0% |
| Total | 58 | 100.0% |
Housing Structures by Occupancy in North San Ysidro
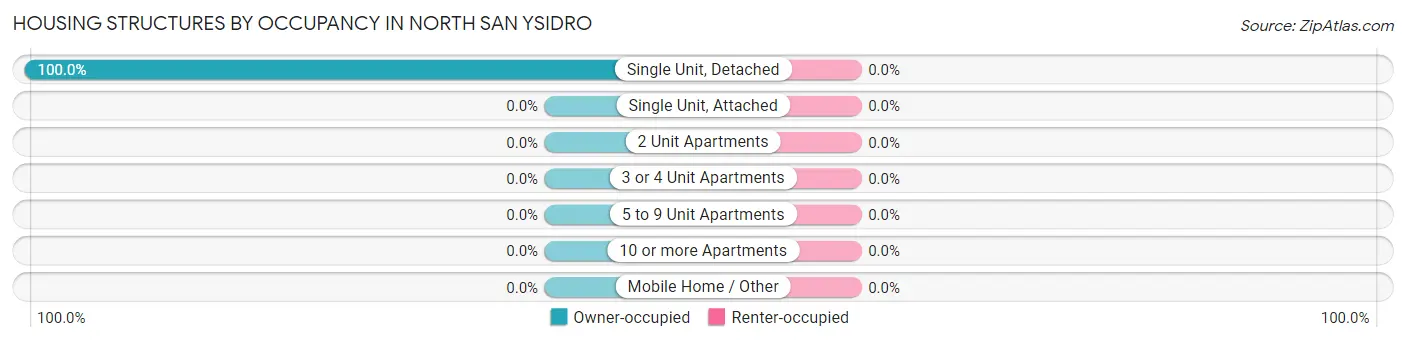
| Structure Type | Owner-occupied | Renter-occupied |
| Single Unit, Detached | 58 (100.0%) | 0 (0.0%) |
| Single Unit, Attached | 0 (0.0%) | 0 (0.0%) |
| 2 Unit Apartments | 0 (0.0%) | 0 (0.0%) |
| 3 or 4 Unit Apartments | 0 (0.0%) | 0 (0.0%) |
| 5 to 9 Unit Apartments | 0 (0.0%) | 0 (0.0%) |
| 10 or more Apartments | 0 (0.0%) | 0 (0.0%) |
| Mobile Home / Other | 0 (0.0%) | 0 (0.0%) |
| Total | 58 (100.0%) | 0 (0.0%) |
Housing Structures by Number of Rooms in North San Ysidro
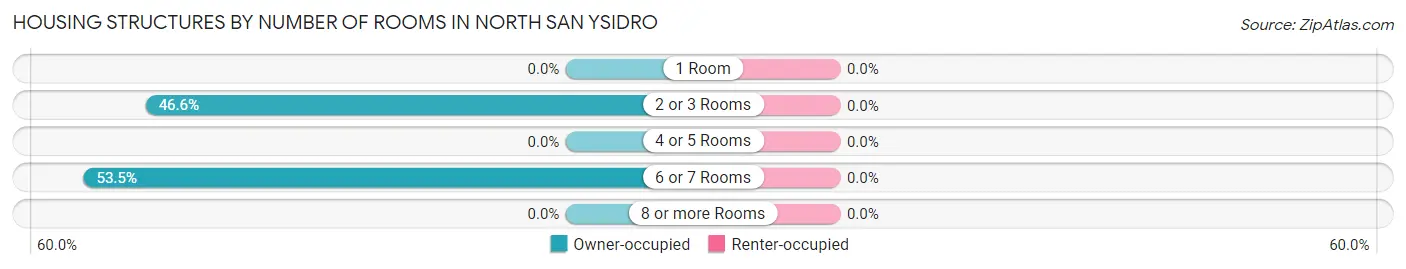
| Number of Rooms | Owner-occupied | Renter-occupied |
| 1 Room | 0 (0.0%) | 0 (0.0%) |
| 2 or 3 Rooms | 27 (46.6%) | 0 (0.0%) |
| 4 or 5 Rooms | 0 (0.0%) | 0 (0.0%) |
| 6 or 7 Rooms | 31 (53.4%) | 0 (0.0%) |
| 8 or more Rooms | 0 (0.0%) | 0 (0.0%) |
| Total | 58 (100.0%) | 0 (0.0%) |
Housing Structure by Heating Type in North San Ysidro
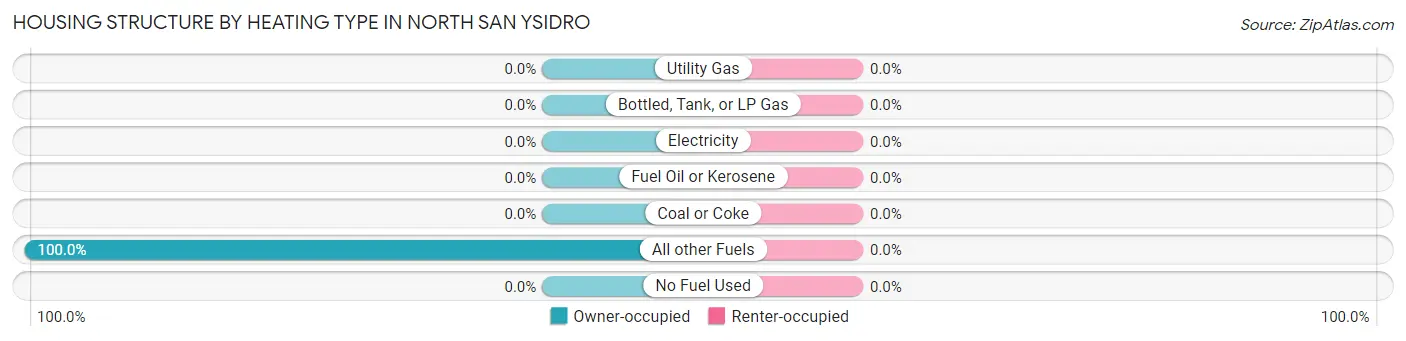
| Heating Type | Owner-occupied | Renter-occupied |
| Utility Gas | 0 (0.0%) | 0 (0.0%) |
| Bottled, Tank, or LP Gas | 0 (0.0%) | 0 (0.0%) |
| Electricity | 0 (0.0%) | 0 (0.0%) |
| Fuel Oil or Kerosene | 0 (0.0%) | 0 (0.0%) |
| Coal or Coke | 0 (0.0%) | 0 (0.0%) |
| All other Fuels | 58 (100.0%) | 0 (0.0%) |
| No Fuel Used | 0 (0.0%) | 0 (0.0%) |
| Total | 58 (100.0%) | 0 (0.0%) |
Household Vehicle Usage in North San Ysidro
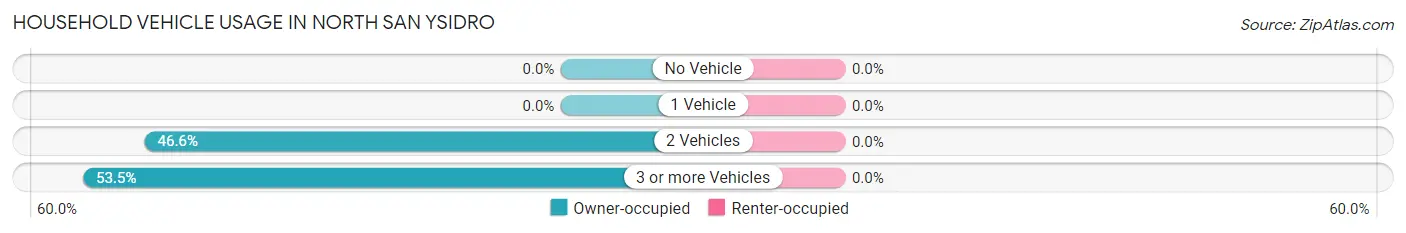
| Vehicles per Household | Owner-occupied | Renter-occupied |
| No Vehicle | 0 (0.0%) | 0 (0.0%) |
| 1 Vehicle | 0 (0.0%) | 0 (0.0%) |
| 2 Vehicles | 27 (46.6%) | 0 (0.0%) |
| 3 or more Vehicles | 31 (53.4%) | 0 (0.0%) |
| Total | 58 (100.0%) | 0 (0.0%) |
Real Estate & Mortgages in North San Ysidro
Real Estate and Mortgage Overview in North San Ysidro
| Characteristic | Without Mortgage | With Mortgage |
| Housing Units | 31 | 27 |
| Median Property Value | - | - |
| Median Household Income | - | - |
| Monthly Housing Costs | - | - |
| Real Estate Taxes | - | - |
Property Value by Mortgage Status in North San Ysidro
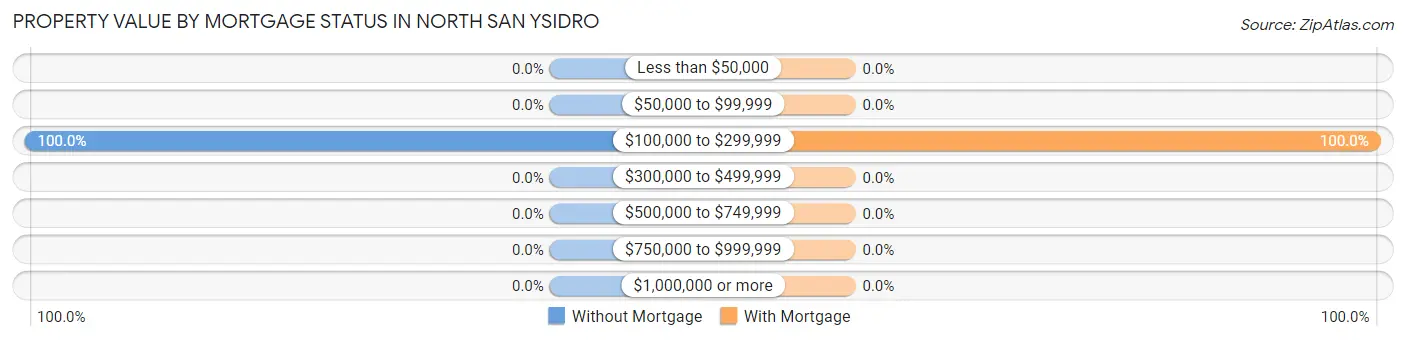
| Property Value | Without Mortgage | With Mortgage |
| Less than $50,000 | 0 (0.0%) | 0 (0.0%) |
| $50,000 to $99,999 | 0 (0.0%) | 0 (0.0%) |
| $100,000 to $299,999 | 31 (100.0%) | 27 (100.0%) |
| $300,000 to $499,999 | 0 (0.0%) | 0 (0.0%) |
| $500,000 to $749,999 | 0 (0.0%) | 0 (0.0%) |
| $750,000 to $999,999 | 0 (0.0%) | 0 (0.0%) |
| $1,000,000 or more | 0 (0.0%) | 0 (0.0%) |
| Total | 31 (100.0%) | 27 (100.0%) |
Household Income by Mortgage Status in North San Ysidro
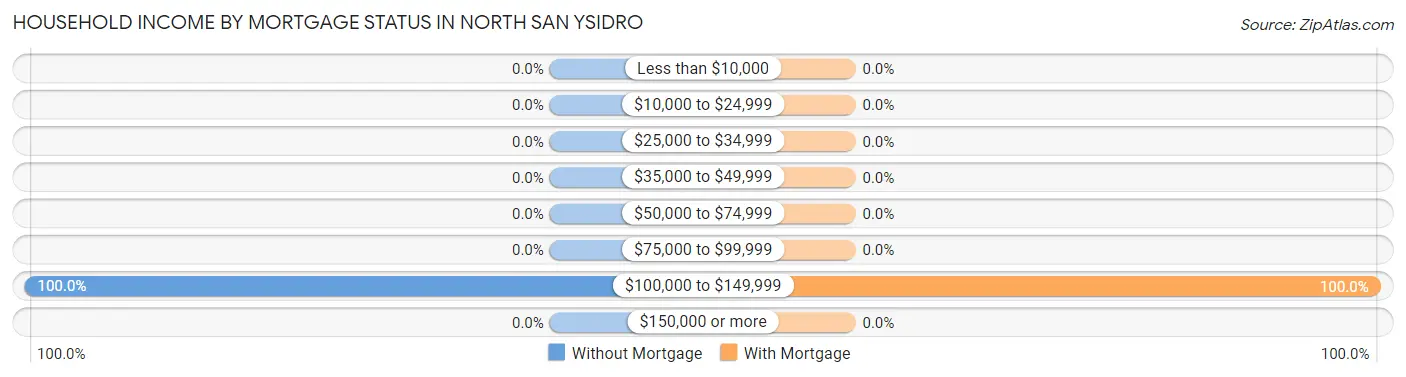
| Household Income | Without Mortgage | With Mortgage |
| Less than $10,000 | 0 (0.0%) | 0 (0.0%) |
| $10,000 to $24,999 | 0 (0.0%) | 0 (0.0%) |
| $25,000 to $34,999 | 0 (0.0%) | 0 (0.0%) |
| $35,000 to $49,999 | 0 (0.0%) | 0 (0.0%) |
| $50,000 to $74,999 | 0 (0.0%) | 0 (0.0%) |
| $75,000 to $99,999 | 0 (0.0%) | 0 (0.0%) |
| $100,000 to $149,999 | 31 (100.0%) | 27 (100.0%) |
| $150,000 or more | 0 (0.0%) | 0 (0.0%) |
| Total | 31 (100.0%) | 27 (100.0%) |
Property Value to Household Income Ratio in North San Ysidro
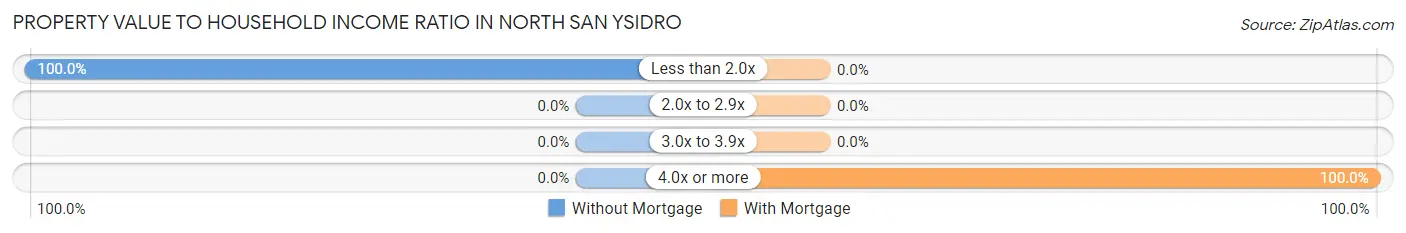
| Value-to-Income Ratio | Without Mortgage | With Mortgage |
| Less than 2.0x | 31 (100.0%) | 0 (0.0%) |
| 2.0x to 2.9x | 0 (0.0%) | 0 (0.0%) |
| 3.0x to 3.9x | 0 (0.0%) | 0 (0.0%) |
| 4.0x or more | 0 (0.0%) | 27 (100.0%) |
| Total | 31 (100.0%) | 27 (100.0%) |
Real Estate Taxes by Mortgage Status in North San Ysidro
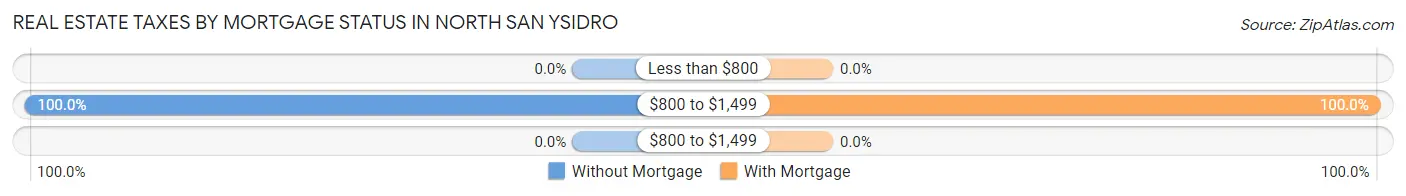
| Property Taxes | Without Mortgage | With Mortgage |
| Less than $800 | 0 (0.0%) | 0 (0.0%) |
| $800 to $1,499 | 31 (100.0%) | 27 (100.0%) |
| $800 to $1,499 | 0 (0.0%) | 0 (0.0%) |
| Total | 31 (100.0%) | 27 (100.0%) |
Health & Disability in North San Ysidro
Health Insurance Coverage by Age in North San Ysidro
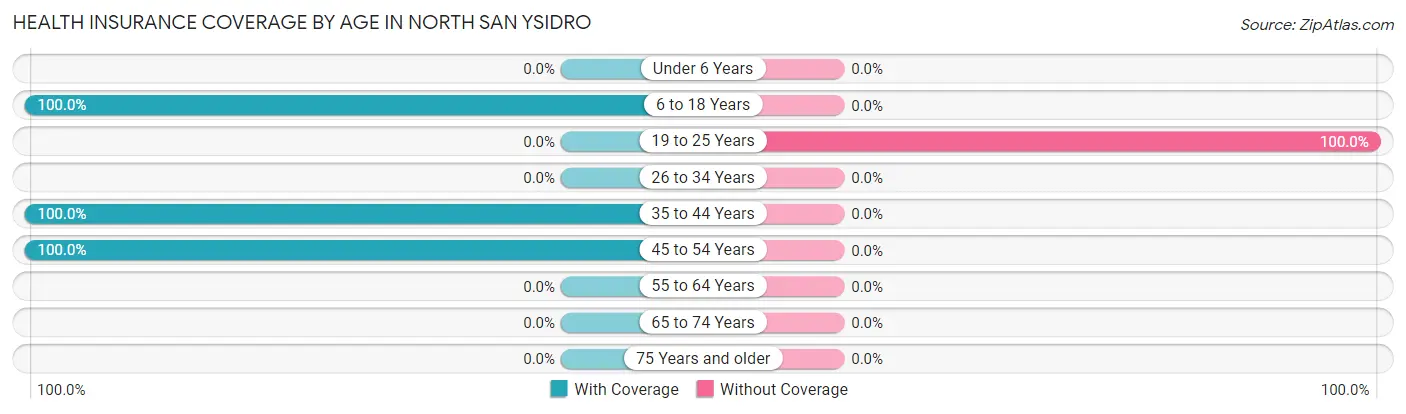
| Age Bracket | With Coverage | Without Coverage |
| Under 6 Years | 0 (0.0%) | 0 (0.0%) |
| 6 to 18 Years | 62 (100.0%) | 0 (0.0%) |
| 19 to 25 Years | 0 (0.0%) | 27 (100.0%) |
| 26 to 34 Years | 0 (0.0%) | 0 (0.0%) |
| 35 to 44 Years | 61 (100.0%) | 0 (0.0%) |
| 45 to 54 Years | 64 (100.0%) | 0 (0.0%) |
| 55 to 64 Years | 0 (0.0%) | 0 (0.0%) |
| 65 to 74 Years | 0 (0.0%) | 0 (0.0%) |
| 75 Years and older | 0 (0.0%) | 0 (0.0%) |
| Total | 187 (87.4%) | 27 (12.6%) |
Health Insurance Coverage by Citizenship Status in North San Ysidro

| Citizenship Status | With Coverage | Without Coverage |
| Native Born | 0 (0.0%) | 0 (0.0%) |
| Foreign Born, Citizen | 62 (100.0%) | 0 (0.0%) |
| Foreign Born, not a Citizen | 0 (0.0%) | 27 (100.0%) |
Health Insurance Coverage by Household Income in North San Ysidro
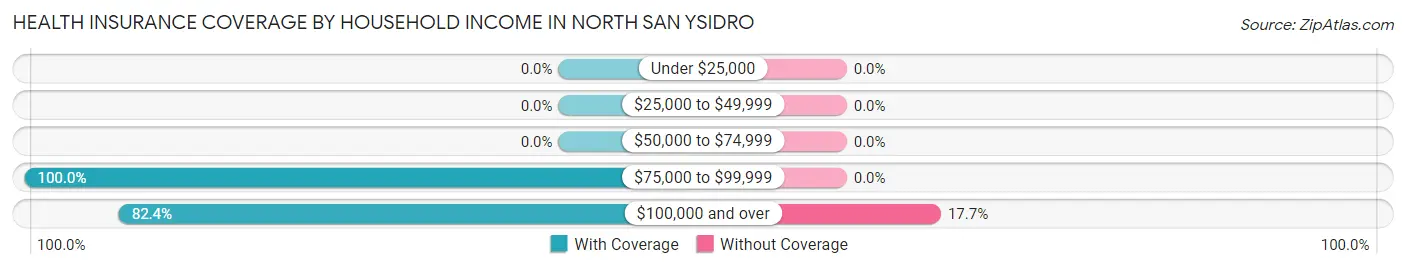
| Household Income | With Coverage | Without Coverage |
| Under $25,000 | 0 (0.0%) | 0 (0.0%) |
| $25,000 to $49,999 | 0 (0.0%) | 0 (0.0%) |
| $50,000 to $74,999 | 0 (0.0%) | 0 (0.0%) |
| $75,000 to $99,999 | 61 (100.0%) | 0 (0.0%) |
| $100,000 and over | 126 (82.4%) | 27 (17.6%) |
Public vs Private Health Insurance Coverage by Age in North San Ysidro
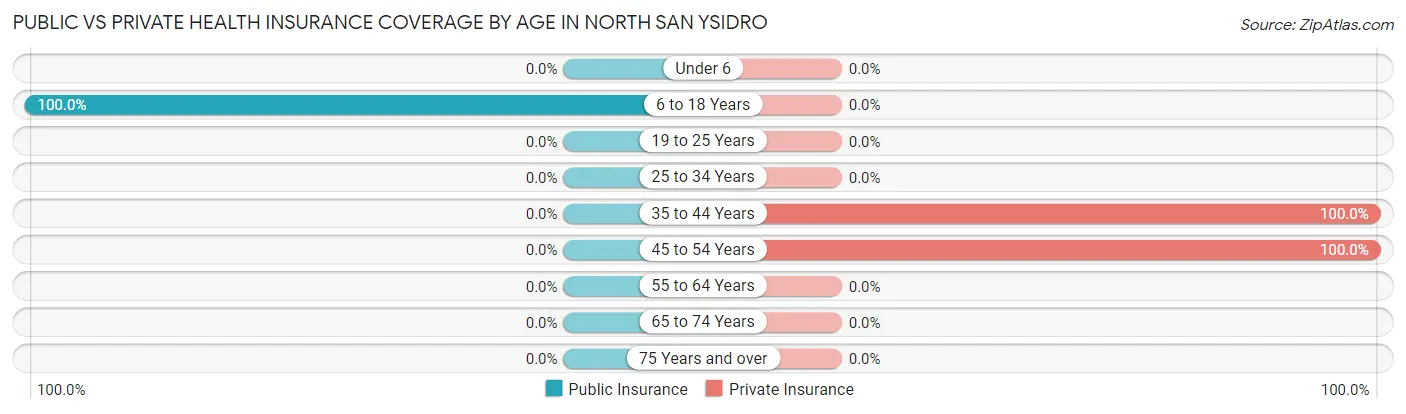
| Age Bracket | Public Insurance | Private Insurance |
| Under 6 | 0 (0.0%) | 0 (0.0%) |
| 6 to 18 Years | 62 (100.0%) | 0 (0.0%) |
| 19 to 25 Years | 0 (0.0%) | 0 (0.0%) |
| 25 to 34 Years | 0 (0.0%) | 0 (0.0%) |
| 35 to 44 Years | 0 (0.0%) | 61 (100.0%) |
| 45 to 54 Years | 0 (0.0%) | 64 (100.0%) |
| 55 to 64 Years | 0 (0.0%) | 0 (0.0%) |
| 65 to 74 Years | 0 (0.0%) | 0 (0.0%) |
| 75 Years and over | 0 (0.0%) | 0 (0.0%) |
| Total | 62 (29.0%) | 125 (58.4%) |
Disability Status by Sex by Age in North San Ysidro
| Age Bracket | Male | Female |
| Under 5 Years | 0 (0.0%) | 0 (0.0%) |
| 5 to 17 Years | 0 (0.0%) | 0 (0.0%) |
| 18 to 34 Years | 0 (0.0%) | 0 (0.0%) |
| 35 to 64 Years | 0 (0.0%) | 0 (0.0%) |
| 65 to 74 Years | 0 (0.0%) | 0 (0.0%) |
| 75 Years and over | 0 (0.0%) | 0 (0.0%) |
Disability Class by Sex by Age in North San Ysidro
Disability Class: Hearing Difficulty
| Age Bracket | Male | Female |
| Under 5 Years | 0 (0.0%) | 0 (0.0%) |
| 5 to 17 Years | 0 (0.0%) | 0 (0.0%) |
| 18 to 34 Years | 0 (0.0%) | 0 (0.0%) |
| 35 to 64 Years | 0 (0.0%) | 0 (0.0%) |
| 65 to 74 Years | 0 (0.0%) | 0 (0.0%) |
| 75 Years and over | 0 (0.0%) | 0 (0.0%) |
Disability Class: Vision Difficulty
| Age Bracket | Male | Female |
| Under 5 Years | 0 (0.0%) | 0 (0.0%) |
| 5 to 17 Years | 0 (0.0%) | 0 (0.0%) |
| 18 to 34 Years | 0 (0.0%) | 0 (0.0%) |
| 35 to 64 Years | 0 (0.0%) | 0 (0.0%) |
| 65 to 74 Years | 0 (0.0%) | 0 (0.0%) |
| 75 Years and over | 0 (0.0%) | 0 (0.0%) |
Disability Class: Cognitive Difficulty
| Age Bracket | Male | Female |
| 5 to 17 Years | 0 (0.0%) | 0 (0.0%) |
| 18 to 34 Years | 0 (0.0%) | 0 (0.0%) |
| 35 to 64 Years | 0 (0.0%) | 0 (0.0%) |
| 65 to 74 Years | 0 (0.0%) | 0 (0.0%) |
| 75 Years and over | 0 (0.0%) | 0 (0.0%) |
Disability Class: Ambulatory Difficulty
| Age Bracket | Male | Female |
| 5 to 17 Years | 0 (0.0%) | 0 (0.0%) |
| 18 to 34 Years | 0 (0.0%) | 0 (0.0%) |
| 35 to 64 Years | 0 (0.0%) | 0 (0.0%) |
| 65 to 74 Years | 0 (0.0%) | 0 (0.0%) |
| 75 Years and over | 0 (0.0%) | 0 (0.0%) |
Disability Class: Self-Care Difficulty
| Age Bracket | Male | Female |
| 5 to 17 Years | 0 (0.0%) | 0 (0.0%) |
| 18 to 34 Years | 0 (0.0%) | 0 (0.0%) |
| 35 to 64 Years | 0 (0.0%) | 0 (0.0%) |
| 65 to 74 Years | 0 (0.0%) | 0 (0.0%) |
| 75 Years and over | 0 (0.0%) | 0 (0.0%) |
Technology Access in North San Ysidro
Computing Device Access in North San Ysidro
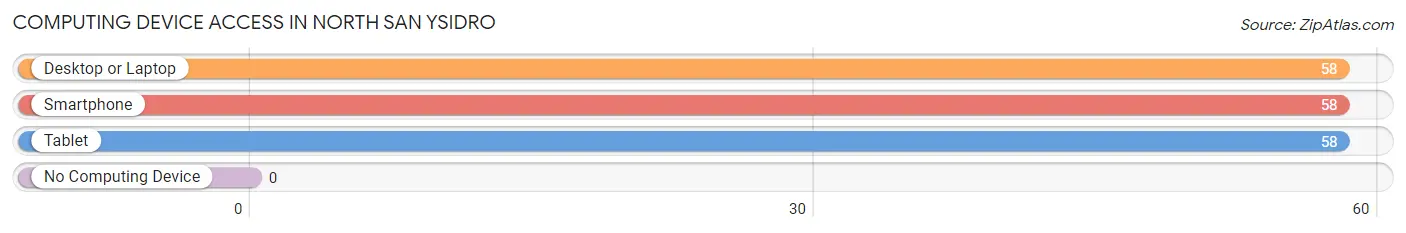
| Device Type | # Households | % Households |
| Desktop or Laptop | 58 | 100.0% |
| Smartphone | 58 | 100.0% |
| Tablet | 58 | 100.0% |
| No Computing Device | 0 | 0.0% |
| Total | 58 | 100.0% |
Internet Access in North San Ysidro
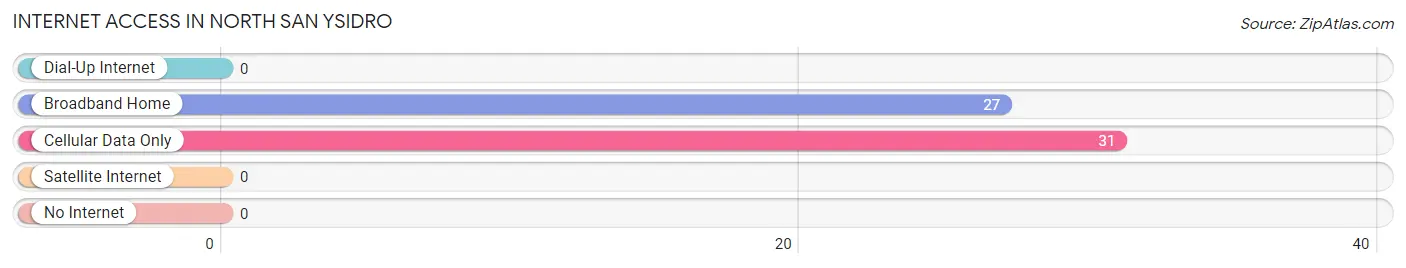
| Internet Type | # Households | % Households |
| Dial-Up Internet | 0 | 0.0% |
| Broadband Home | 27 | 46.6% |
| Cellular Data Only | 31 | 53.4% |
| Satellite Internet | 0 | 0.0% |
| No Internet | 0 | 0.0% |
| Total | 58 | 100.0% |
North San Ysidro Summary
San Ysidro is a small unincorporated community located in the northern part of San Miguel County, New Mexico. It is situated in the foothills of the Sangre de Cristo Mountains, approximately 25 miles north of Las Vegas, New Mexico. The community is located along the historic El Camino Real de Tierra Adentro, a trade route that connected Mexico City to Santa Fe.
History
San Ysidro was founded in the late 1800s by settlers from Mexico. The community was named after Saint Isidore, the patron saint of farmers. The settlers were attracted to the area due to its fertile soil and abundant water sources. The community was initially a farming and ranching community, with the main crops being corn, beans, and wheat.
In the early 1900s, the community began to grow and develop. The first school was built in 1910, and the first post office was established in 1912. The community also had a general store, a blacksmith shop, and a saloon.
Geography
San Ysidro is located in the northern part of San Miguel County, New Mexico. It is situated in the foothills of the Sangre de Cristo Mountains, approximately 25 miles north of Las Vegas, New Mexico. The community is located along the historic El Camino Real de Tierra Adentro, a trade route that connected Mexico City to Santa Fe.
The climate in San Ysidro is semi-arid, with hot summers and cold winters. The average annual temperature is approximately 55°F, with an average high of 79°F in the summer and an average low of 32°F in the winter. The average annual precipitation is approximately 12 inches.
Economy
San Ysidro is a small, rural community with a population of approximately 500 people. The economy is primarily based on agriculture, with the main crops being corn, beans, and wheat. The community also has a few small businesses, including a general store, a blacksmith shop, and a saloon.
Demographics
As of the 2010 census, the population of San Ysidro was 498 people. The racial makeup of the community was 94.4% Hispanic or Latino, 4.2% White, and 1.4% Native American. The median household income was $25,000, and the median age was 36 years. The unemployment rate was 8.3%.
Common Questions
What is Per Capita Income in North San Ysidro?
Per Capita income in North San Ysidro is $33,560.
What is Inequality or Gini Index in North San Ysidro?
Inequality or Gini Index in North San Ysidro is 0.12.
What is the Total Population of North San Ysidro?
Total Population of North San Ysidro is 214.
What is the Total Male Population of North San Ysidro?
Total Male Population of North San Ysidro is 85.
What is the Total Female Population of North San Ysidro?
Total Female Population of North San Ysidro is 129.
What is the Ratio of Males per 100 Females in North San Ysidro?
There are 65.89 Males per 100 Females in North San Ysidro.
What is the Ratio of Females per 100 Males in North San Ysidro?
There are 151.76 Females per 100 Males in North San Ysidro.
What is the Median Population Age in North San Ysidro?
Median Population Age in North San Ysidro is 38.5 Years.
What is the Average Family Size in North San Ysidro
Average Family Size in North San Ysidro is 3.9 People.
What is the Average Household Size in North San Ysidro
Average Household Size in North San Ysidro is 3.7 People.
How Large is the Labor Force in North San Ysidro?
There are 125 People in the Labor Forcein in North San Ysidro.
What is the Percentage of People in the Labor Force in North San Ysidro?
58.4% of People are in the Labor Force in North San Ysidro.