Twin Forks, NM Map & Demographics
Twin Forks Map
Twin Forks Overview
$27,338
PER CAPITA INCOME
0.47
INEQUALITY / GINI INDEX
237
TOTAL POPULATION
65
MALE POPULATION
172
FEMALE POPULATION
37.79
MALES / 100 FEMALES
264.62
FEMALES / 100 MALES
58.8
MEDIAN AGE
7.7
AVG FAMILY SIZE
2.4
AVG HOUSEHOLD SIZE
25
LABOR FORCE [ PEOPLE ]
10.5%
PERCENT IN LABOR FORCE
Income in Twin Forks
Income Overview in Twin Forks
| Characteristic | Number | Measure |
| Per Capita Income | 237 | $27,338 |
| Median Family Income | 21 | $0 |
| Mean Family Income | 21 | $72,890 |
| Median Household Income | 97 | $0 |
| Mean Household Income | 97 | $66,289 |
| Income Deficit | 21 | $0 |
| Wage / Income Gap (%) | 237 | 0.00% |
| Wage / Income Gap ($) | 237 | 100.00¢ per $1 |
| Gini / Inequality Index | 237 | 0.47 |
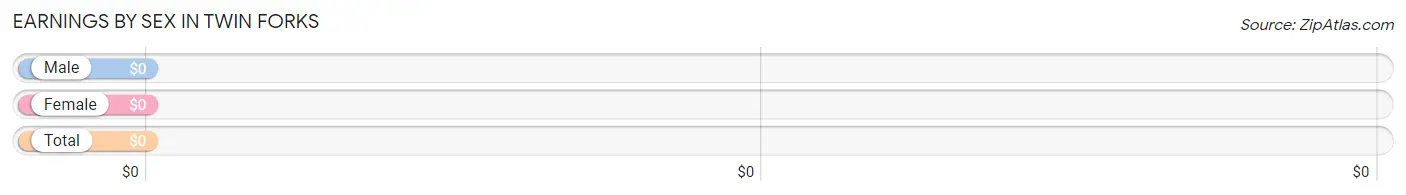
Earnings by Sex in Twin Forks
| Sex | Number | Average Earnings |
| Male | 56 (100.0%) | $0 |
| Female | 0 (0.0%) | $0 |
| Total | 56 (100.0%) | $0 |
Earnings by Sex by Income Bracket in Twin Forks
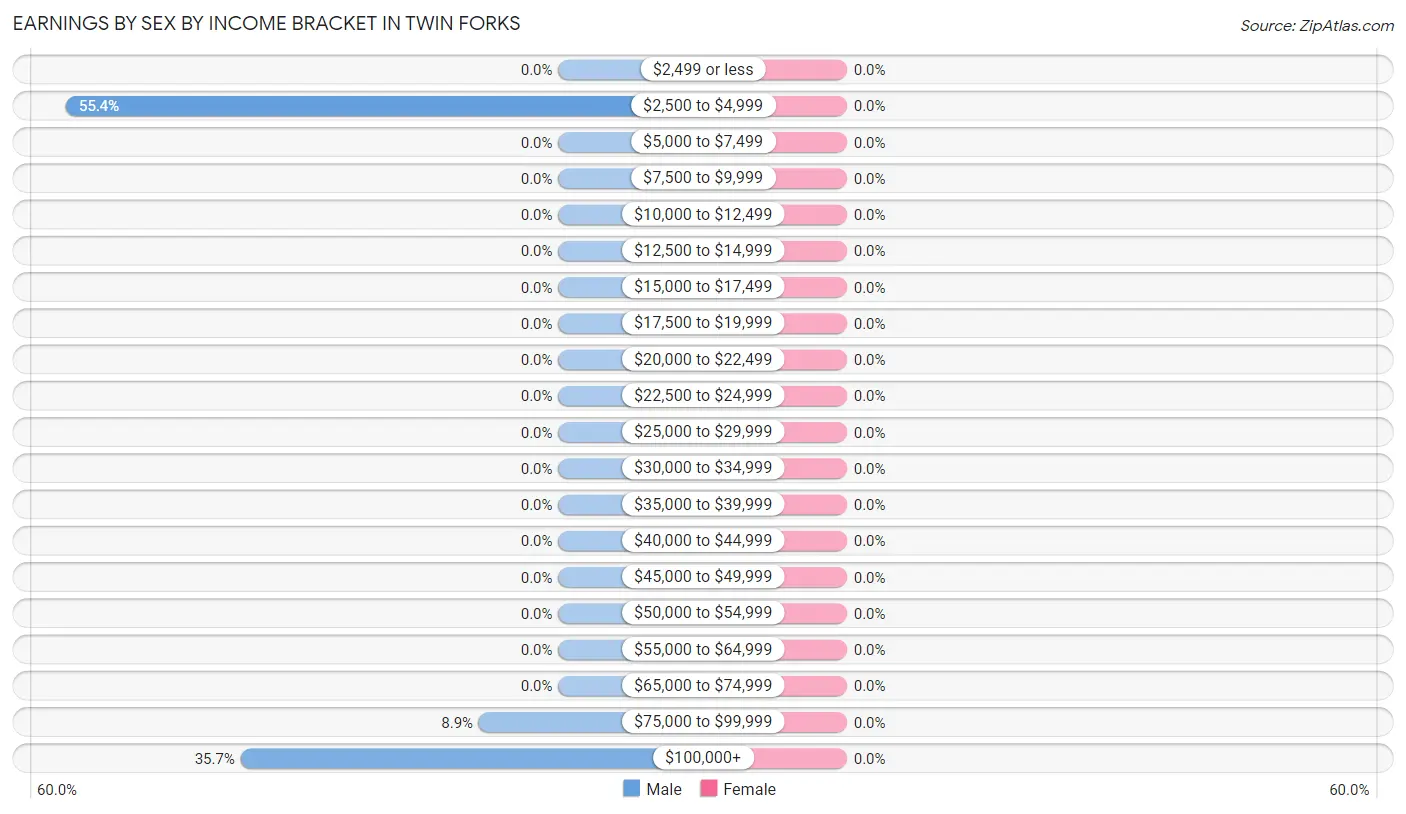
| Income | Male | Female |
| $2,499 or less | 0 (0.0%) | 0 (0.0%) |
| $2,500 to $4,999 | 31 (55.4%) | 0 (0.0%) |
| $5,000 to $7,499 | 0 (0.0%) | 0 (0.0%) |
| $7,500 to $9,999 | 0 (0.0%) | 0 (0.0%) |
| $10,000 to $12,499 | 0 (0.0%) | 0 (0.0%) |
| $12,500 to $14,999 | 0 (0.0%) | 0 (0.0%) |
| $15,000 to $17,499 | 0 (0.0%) | 0 (0.0%) |
| $17,500 to $19,999 | 0 (0.0%) | 0 (0.0%) |
| $20,000 to $22,499 | 0 (0.0%) | 0 (0.0%) |
| $22,500 to $24,999 | 0 (0.0%) | 0 (0.0%) |
| $25,000 to $29,999 | 0 (0.0%) | 0 (0.0%) |
| $30,000 to $34,999 | 0 (0.0%) | 0 (0.0%) |
| $35,000 to $39,999 | 0 (0.0%) | 0 (0.0%) |
| $40,000 to $44,999 | 0 (0.0%) | 0 (0.0%) |
| $45,000 to $49,999 | 0 (0.0%) | 0 (0.0%) |
| $50,000 to $54,999 | 0 (0.0%) | 0 (0.0%) |
| $55,000 to $64,999 | 0 (0.0%) | 0 (0.0%) |
| $65,000 to $74,999 | 0 (0.0%) | 0 (0.0%) |
| $75,000 to $99,999 | 5 (8.9%) | 0 (0.0%) |
| $100,000+ | 20 (35.7%) | 0 (0.0%) |
| Total | 56 (100.0%) | 0 (0.0%) |
Earnings by Sex by Educational Attainment in Twin Forks
| Educational Attainment | Male Income | Female Income |
| Less than High School | - | - |
| High School Diploma | - | - |
| College or Associate's Degree | - | - |
| Bachelor's Degree | - | - |
| Graduate Degree | - | - |
| Total | - | - |
Family Income in Twin Forks
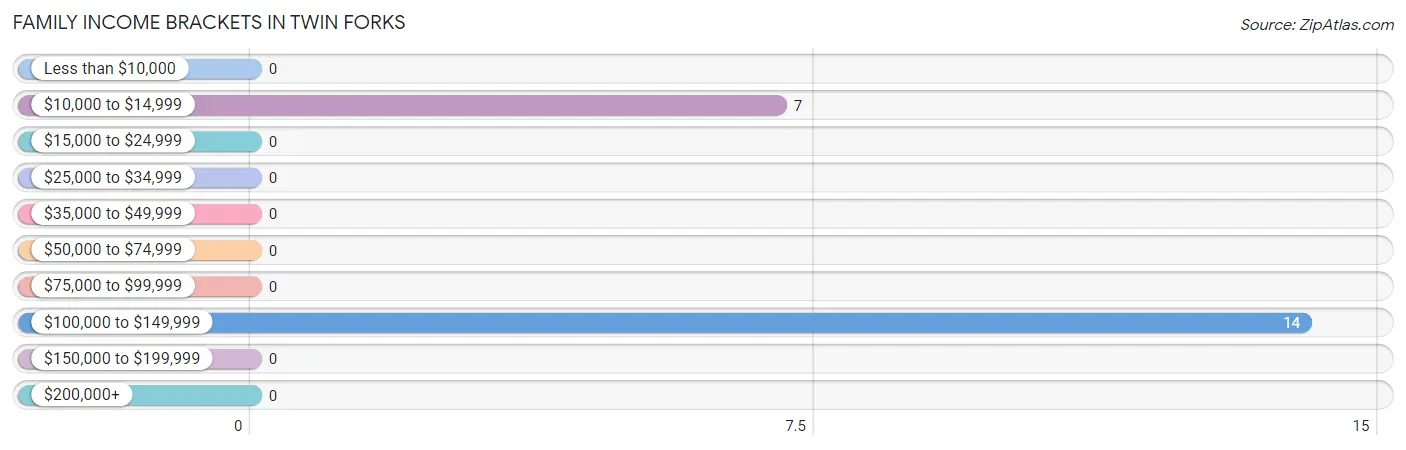
Family Income Brackets in Twin Forks
According to the Twin Forks family income data, there are 14 families falling into the $100,000 to $149,999 income range, which is the most common income bracket and makes up 66.7% of all families.
| Income Bracket | # Families | % Families |
| Less than $10,000 | 0 | 0.0% |
| $10,000 to $14,999 | 7 | 33.3% |
| $15,000 to $24,999 | 0 | 0.0% |
| $25,000 to $34,999 | 0 | 0.0% |
| $35,000 to $49,999 | 0 | 0.0% |
| $50,000 to $74,999 | 0 | 0.0% |
| $75,000 to $99,999 | 0 | 0.0% |
| $100,000 to $149,999 | 14 | 66.7% |
| $150,000 to $199,999 | 0 | 0.0% |
| $200,000+ | 0 | 0.0% |
Family Income by Famaliy Size in Twin Forks
| Income Bracket | # Families | Median Income |
| 2-Person Families | 21 (100.0%) | $0 |
| 3-Person Families | 0 (0.0%) | $0 |
| 4-Person Families | 0 (0.0%) | $0 |
| 5-Person Families | 0 (0.0%) | $0 |
| 6-Person Families | 0 (0.0%) | $0 |
| 7+ Person Families | 0 (0.0%) | $0 |
| Total | 21 (100.0%) | $0 |
Family Income by Number of Earners in Twin Forks
| Number of Earners | # Families | Median Income |
| No Earners | 16 (76.2%) | $0 |
| 1 Earner | 5 (23.8%) | $0 |
| 2 Earners | 0 (0.0%) | $0 |
| 3+ Earners | 0 (0.0%) | $0 |
| Total | 21 (100.0%) | $0 |
Household Income in Twin Forks
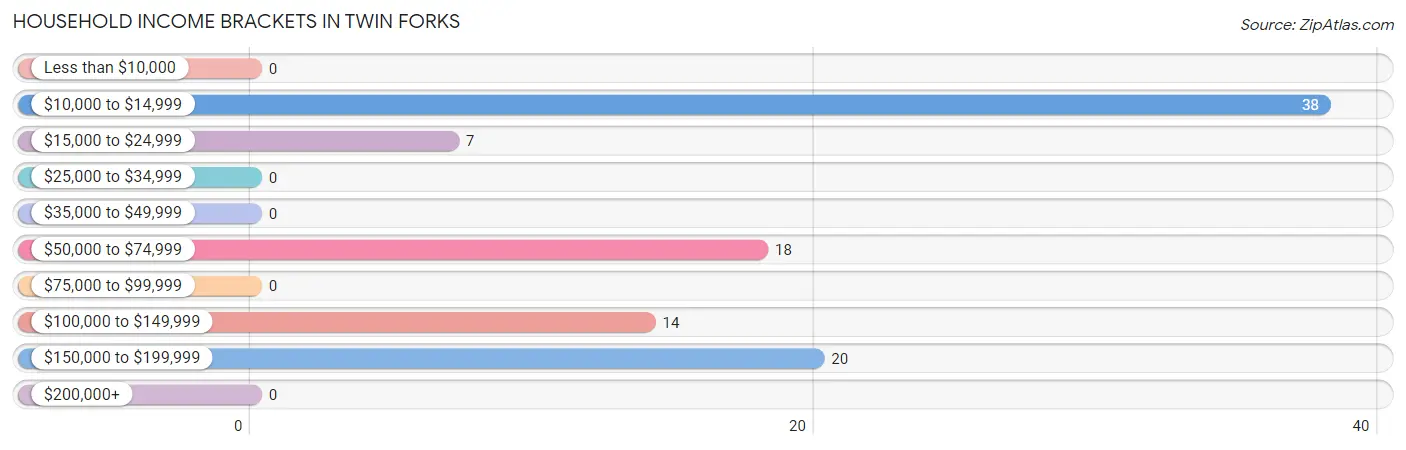
Household Income Brackets in Twin Forks
With 38 households falling in the category, the $10,000 to $14,999 income range is the most frequent in Twin Forks, accounting for 39.2% of all households.
| Income Bracket | # Households | % Households |
| Less than $10,000 | 0 | 0.0% |
| $10,000 to $14,999 | 38 | 39.2% |
| $15,000 to $24,999 | 7 | 7.2% |
| $25,000 to $34,999 | 0 | 0.0% |
| $35,000 to $49,999 | 0 | 0.0% |
| $50,000 to $74,999 | 18 | 18.6% |
| $75,000 to $99,999 | 0 | 0.0% |
| $100,000 to $149,999 | 14 | 14.4% |
| $150,000 to $199,999 | 20 | 20.6% |
| $200,000+ | 0 | 0.0% |
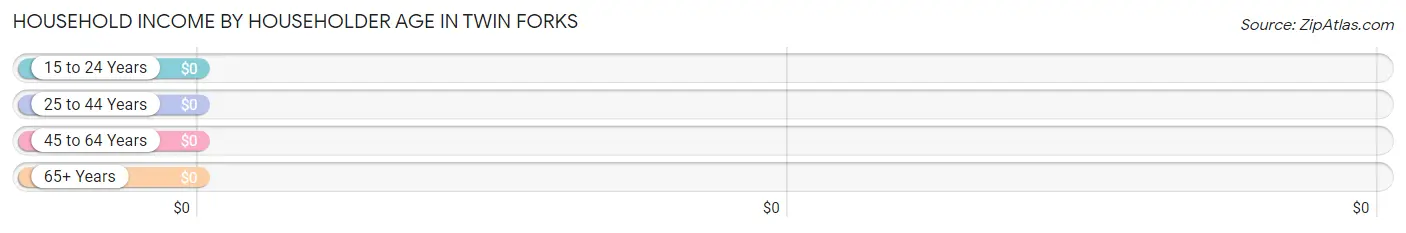
Household Income by Householder Age in Twin Forks
| Income Bracket | # Households | Median Income |
| 15 to 24 Years | 0 (0.0%) | $0 |
| 25 to 44 Years | 20 (20.6%) | $0 |
| 45 to 64 Years | 0 (0.0%) | $0 |
| 65+ Years | 77 (79.4%) | $0 |
| Total | 97 (100.0%) | $0 |
Poverty in Twin Forks
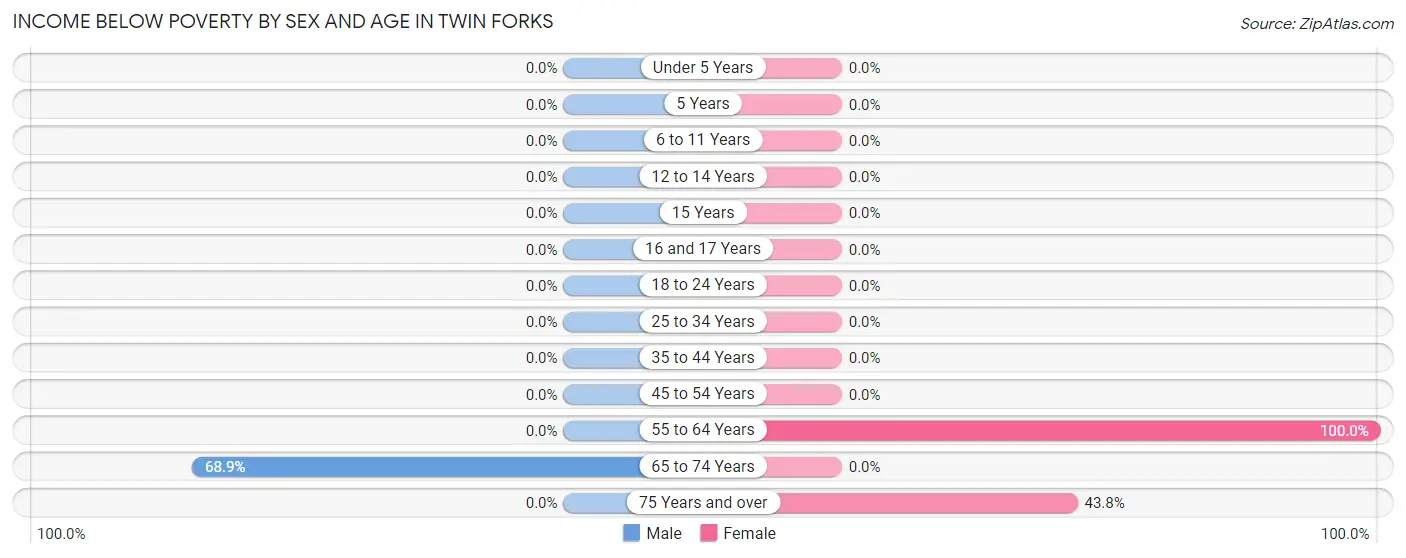
Income Below Poverty by Sex and Age in Twin Forks
With 47.7% poverty level for males and 76.7% for females among the residents of Twin Forks, 65 to 74 year old males and 55 to 64 year old females are the most vulnerable to poverty, with 31 males (68.9%) and 125 females (100.0%) in their respective age groups living below the poverty level.
| Age Bracket | Male | Female |
| Under 5 Years | 0 (0.0%) | 0 (0.0%) |
| 5 Years | 0 (0.0%) | 0 (0.0%) |
| 6 to 11 Years | 0 (0.0%) | 0 (0.0%) |
| 12 to 14 Years | 0 (0.0%) | 0 (0.0%) |
| 15 Years | 0 (0.0%) | 0 (0.0%) |
| 16 and 17 Years | 0 (0.0%) | 0 (0.0%) |
| 18 to 24 Years | 0 (0.0%) | 0 (0.0%) |
| 25 to 34 Years | 0 (0.0%) | 0 (0.0%) |
| 35 to 44 Years | 0 (0.0%) | 0 (0.0%) |
| 45 to 54 Years | 0 (0.0%) | 0 (0.0%) |
| 55 to 64 Years | 0 (0.0%) | 125 (100.0%) |
| 65 to 74 Years | 31 (68.9%) | 0 (0.0%) |
| 75 Years and over | 0 (0.0%) | 7 (43.8%) |
| Total | 31 (47.7%) | 132 (76.7%) |
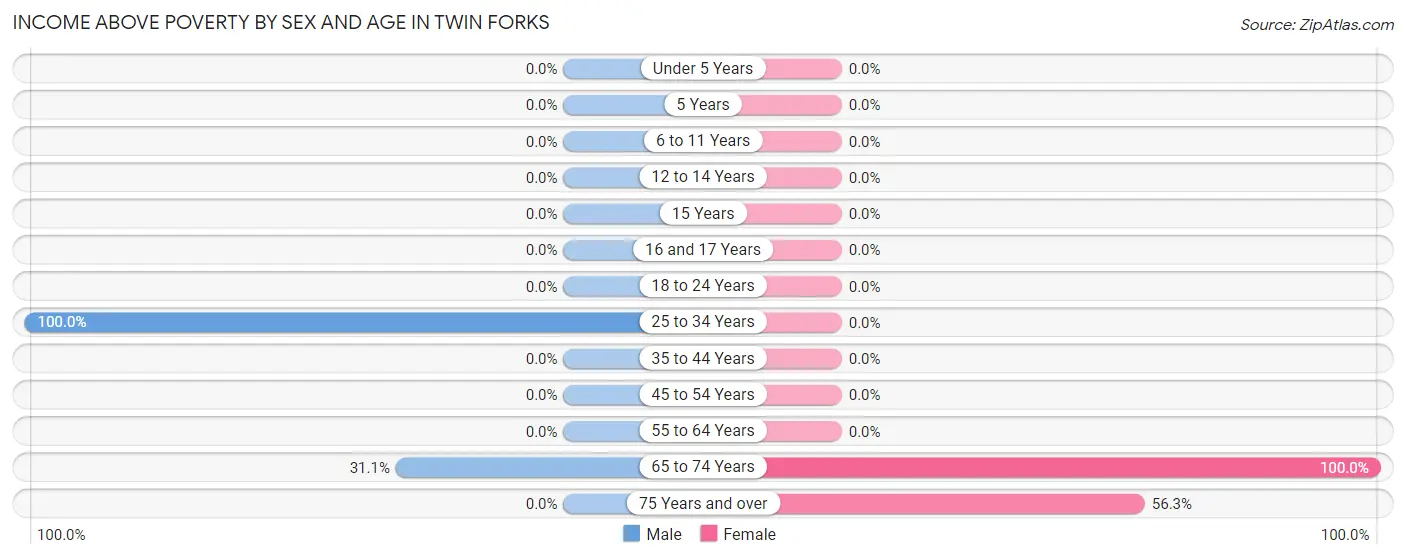
Income Above Poverty by Sex and Age in Twin Forks
According to the poverty statistics in Twin Forks, males aged 25 to 34 years and females aged 65 to 74 years are the age groups that are most secure financially, with 100.0% of males and 100.0% of females in these age groups living above the poverty line.
| Age Bracket | Male | Female |
| Under 5 Years | 0 (0.0%) | 0 (0.0%) |
| 5 Years | 0 (0.0%) | 0 (0.0%) |
| 6 to 11 Years | 0 (0.0%) | 0 (0.0%) |
| 12 to 14 Years | 0 (0.0%) | 0 (0.0%) |
| 15 Years | 0 (0.0%) | 0 (0.0%) |
| 16 and 17 Years | 0 (0.0%) | 0 (0.0%) |
| 18 to 24 Years | 0 (0.0%) | 0 (0.0%) |
| 25 to 34 Years | 20 (100.0%) | 0 (0.0%) |
| 35 to 44 Years | 0 (0.0%) | 0 (0.0%) |
| 45 to 54 Years | 0 (0.0%) | 0 (0.0%) |
| 55 to 64 Years | 0 (0.0%) | 0 (0.0%) |
| 65 to 74 Years | 14 (31.1%) | 31 (100.0%) |
| 75 Years and over | 0 (0.0%) | 9 (56.2%) |
| Total | 34 (52.3%) | 40 (23.3%) |
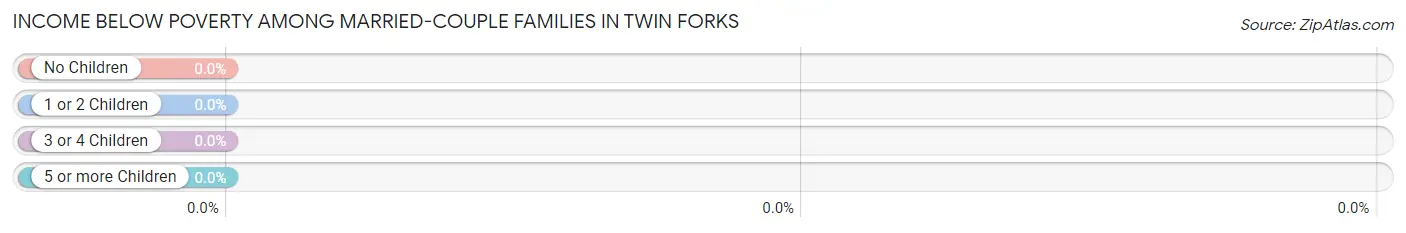
Income Below Poverty Among Married-Couple Families in Twin Forks
| Children | Above Poverty | Below Poverty |
| No Children | 14 (100.0%) | 0 (0.0%) |
| 1 or 2 Children | 0 (0.0%) | 0 (0.0%) |
| 3 or 4 Children | 0 (0.0%) | 0 (0.0%) |
| 5 or more Children | 0 (0.0%) | 0 (0.0%) |
| Total | 14 (100.0%) | 0 (0.0%) |
Income Below Poverty Among Single-Parent Households in Twin Forks
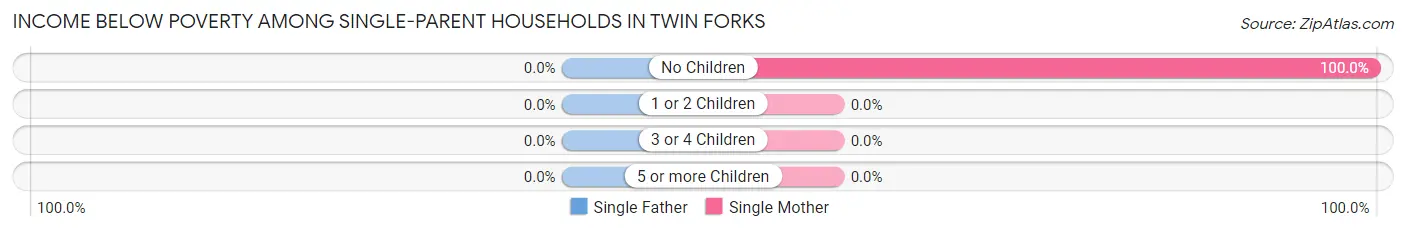
| Children | Single Father | Single Mother |
| No Children | 0 (0.0%) | 7 (100.0%) |
| 1 or 2 Children | 0 (0.0%) | 0 (0.0%) |
| 3 or 4 Children | 0 (0.0%) | 0 (0.0%) |
| 5 or more Children | 0 (0.0%) | 0 (0.0%) |
| Total | 0 (0.0%) | 7 (100.0%) |
Income Below Poverty Among Married-Couple vs Single-Parent Households in Twin Forks
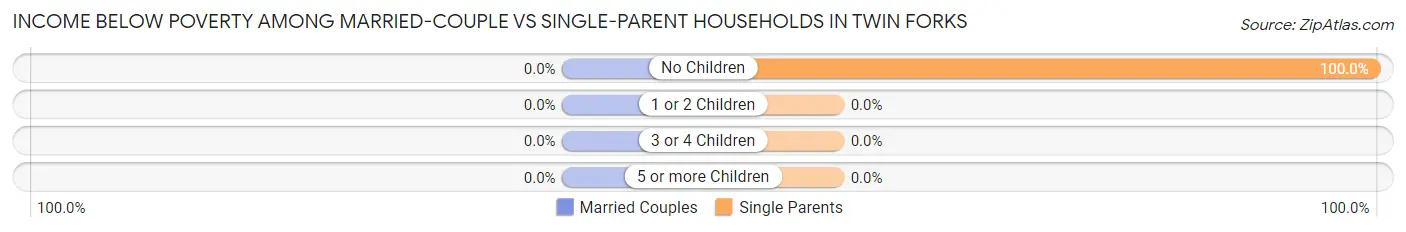
| Children | Married-Couple Families | Single-Parent Households |
| No Children | 0 (0.0%) | 7 (100.0%) |
| 1 or 2 Children | 0 (0.0%) | 0 (0.0%) |
| 3 or 4 Children | 0 (0.0%) | 0 (0.0%) |
| 5 or more Children | 0 (0.0%) | 0 (0.0%) |
| Total | 0 (0.0%) | 7 (100.0%) |
Race in Twin Forks
The most populous races in Twin Forks are White / Caucasian (211 | 89.0%), Some other Race (19 | 8.0%), and Two or more Races (7 | 2.9%).
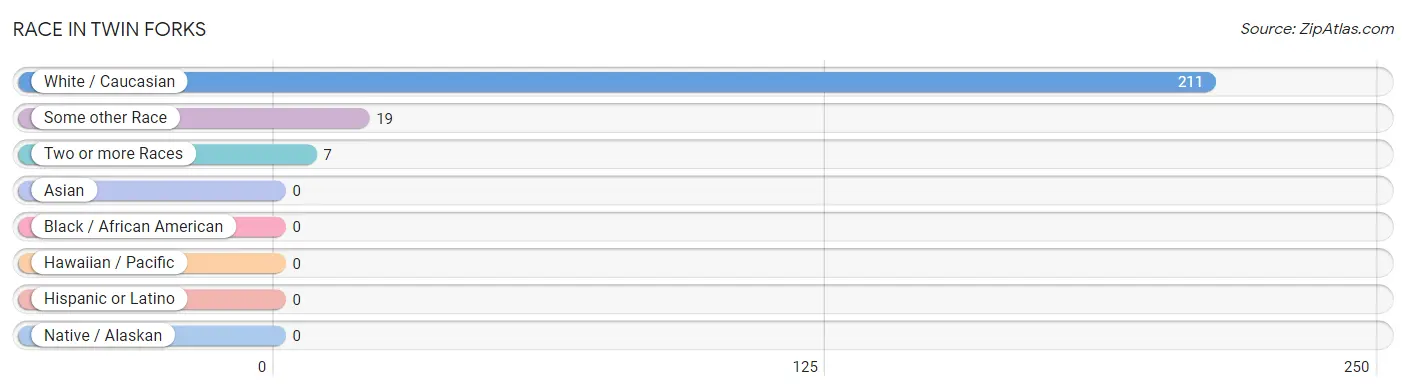
| Race | # Population | % Population |
| Asian | 0 | 0.0% |
| Black / African American | 0 | 0.0% |
| Hawaiian / Pacific | 0 | 0.0% |
| Hispanic or Latino | 0 | 0.0% |
| Native / Alaskan | 0 | 0.0% |
| White / Caucasian | 211 | 89.0% |
| Two or more Races | 7 | 2.9% |
| Some other Race | 19 | 8.0% |
| Total | 237 | 100.0% |
Ancestry in Twin Forks
The most populous ancestries reported in Twin Forks are Finnish (132 | 55.7%), Italian (31 | 13.1%), German (25 | 10.5%), Scotch-Irish (20 | 8.4%), and English (19 | 8.0%), together accounting for 95.8% of all Twin Forks residents.
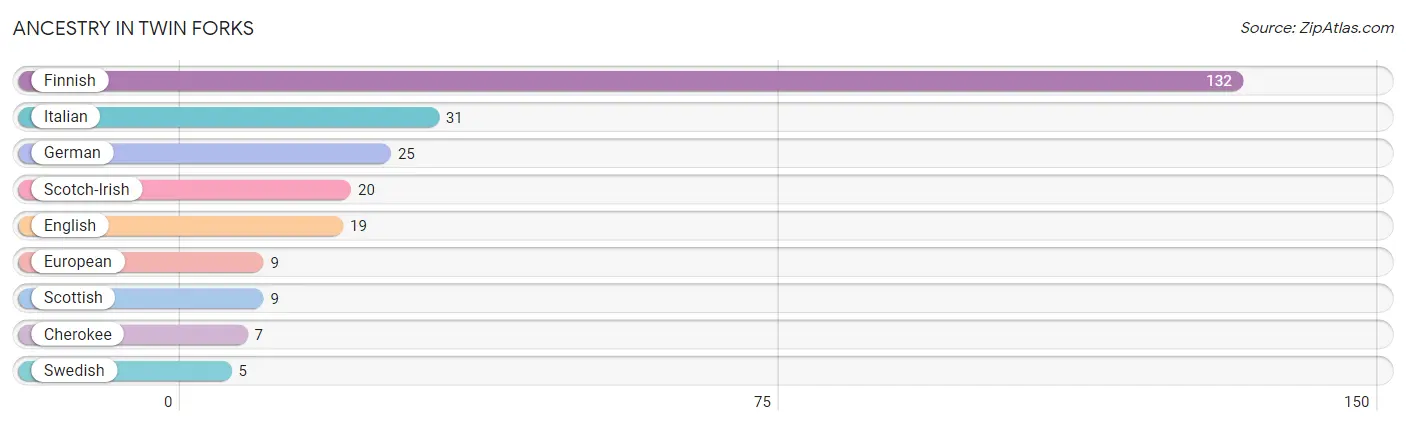
| Ancestry | # Population | % Population |
| Cherokee | 7 | 2.9% |
| English | 19 | 8.0% |
| European | 9 | 3.8% |
| Finnish | 132 | 55.7% |
| German | 25 | 10.5% |
| Italian | 31 | 13.1% |
| Scotch-Irish | 20 | 8.4% |
| Scottish | 9 | 3.8% |
| Swedish | 5 | 2.1% | View All 9 Rows |
Immigrants in Twin Forks

| Immigration Origin | # Population | % Population | View All 0 Rows |
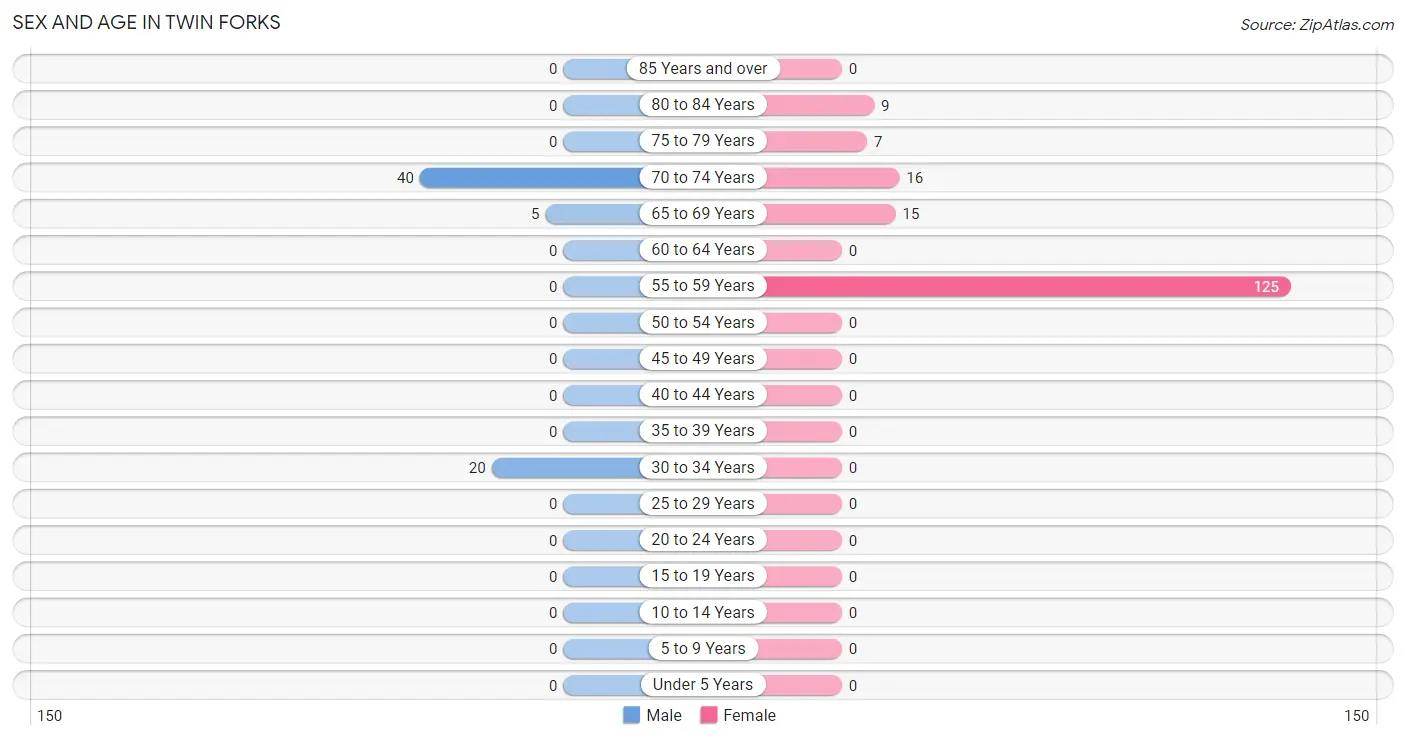
Sex and Age in Twin Forks
Sex and Age in Twin Forks
The most populous age groups in Twin Forks are 70 to 74 Years (40 | 61.5%) for men and 55 to 59 Years (125 | 72.7%) for women.
| Age Bracket | Male | Female |
| Under 5 Years | 0 (0.0%) | 0 (0.0%) |
| 5 to 9 Years | 0 (0.0%) | 0 (0.0%) |
| 10 to 14 Years | 0 (0.0%) | 0 (0.0%) |
| 15 to 19 Years | 0 (0.0%) | 0 (0.0%) |
| 20 to 24 Years | 0 (0.0%) | 0 (0.0%) |
| 25 to 29 Years | 0 (0.0%) | 0 (0.0%) |
| 30 to 34 Years | 20 (30.8%) | 0 (0.0%) |
| 35 to 39 Years | 0 (0.0%) | 0 (0.0%) |
| 40 to 44 Years | 0 (0.0%) | 0 (0.0%) |
| 45 to 49 Years | 0 (0.0%) | 0 (0.0%) |
| 50 to 54 Years | 0 (0.0%) | 0 (0.0%) |
| 55 to 59 Years | 0 (0.0%) | 125 (72.7%) |
| 60 to 64 Years | 0 (0.0%) | 0 (0.0%) |
| 65 to 69 Years | 5 (7.7%) | 15 (8.7%) |
| 70 to 74 Years | 40 (61.5%) | 16 (9.3%) |
| 75 to 79 Years | 0 (0.0%) | 7 (4.1%) |
| 80 to 84 Years | 0 (0.0%) | 9 (5.2%) |
| 85 Years and over | 0 (0.0%) | 0 (0.0%) |
| Total | 65 (100.0%) | 172 (100.0%) |
Families and Households in Twin Forks
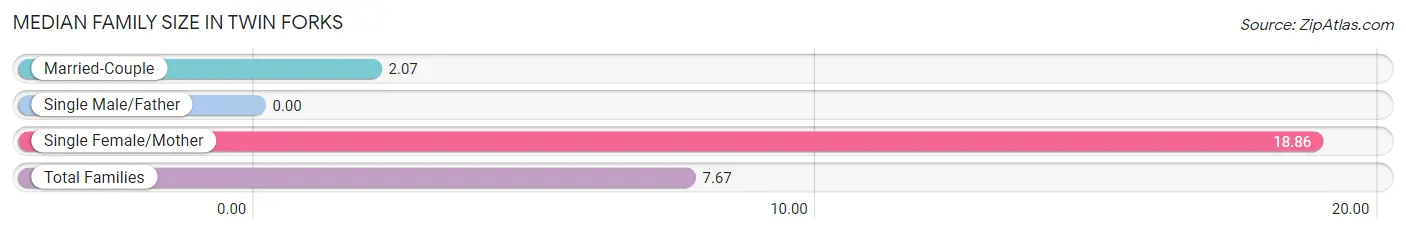
Median Family Size in Twin Forks
| Family Type | # Families | Family Size |
| Married-Couple | 14 (66.7%) | 2.07 |
| Single Male/Father | 0 (0.0%) | - |
| Single Female/Mother | 7 (33.3%) | 18.86 |
| Total Families | 21 (100.0%) | 7.67 |
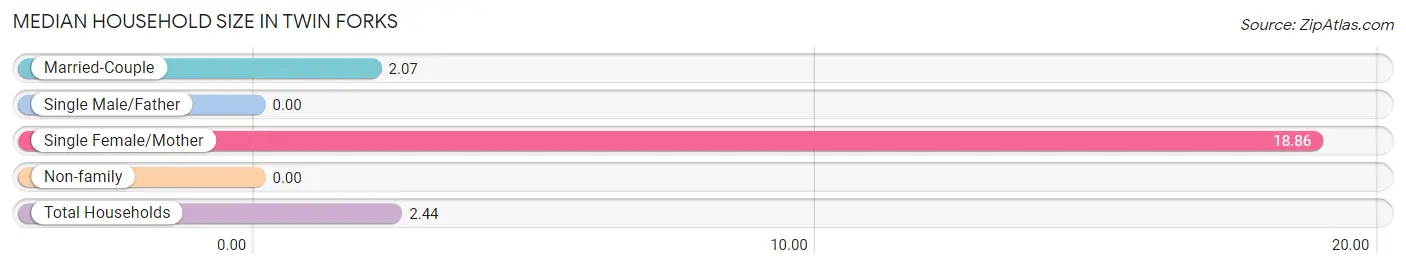
Median Household Size in Twin Forks
| Household Type | # Households | Household Size |
| Married-Couple | 14 (14.4%) | 2.07 |
| Single Male/Father | 0 (0.0%) | - |
| Single Female/Mother | 7 (7.2%) | 18.86 |
| Non-family | 76 (78.3%) | - |
| Total Households | 97 (100.0%) | 2.44 |
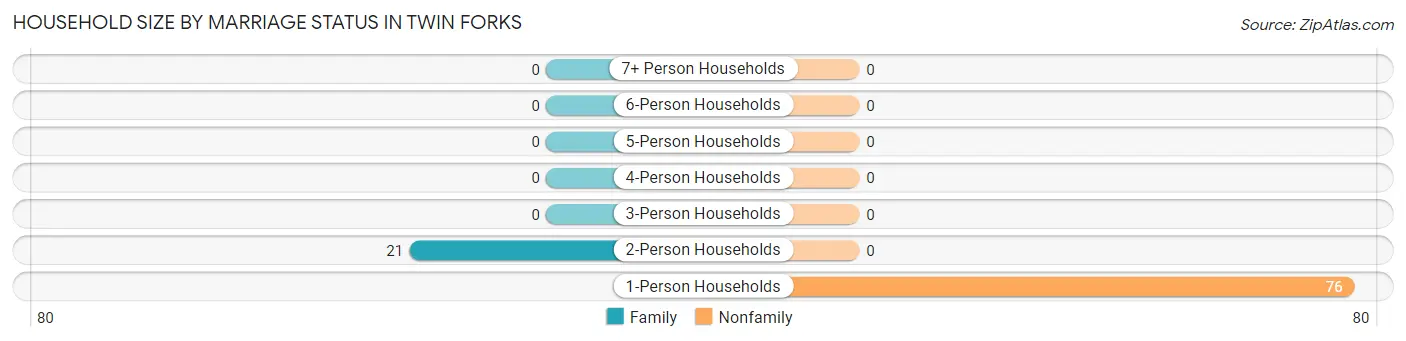
Household Size by Marriage Status in Twin Forks
Out of a total of 97 households in Twin Forks, 21 (21.6%) are family households, while 76 (78.3%) are nonfamily households. The most numerous type of family households are 2-person households, comprising 21, and the most common type of nonfamily households are 1-person households, comprising 76.
| Household Size | Family Households | Nonfamily Households |
| 1-Person Households | - | 76 (78.3%) |
| 2-Person Households | 21 (21.6%) | 0 (0.0%) |
| 3-Person Households | 0 (0.0%) | 0 (0.0%) |
| 4-Person Households | 0 (0.0%) | 0 (0.0%) |
| 5-Person Households | 0 (0.0%) | 0 (0.0%) |
| 6-Person Households | 0 (0.0%) | 0 (0.0%) |
| 7+ Person Households | 0 (0.0%) | 0 (0.0%) |
| Total | 21 (21.6%) | 76 (78.3%) |
Female Fertility in Twin Forks
Fertility by Age in Twin Forks
| Age Bracket | Women with Births | Births / 1,000 Women |
| 15 to 19 years | 0 (0.0%) | 0.0 |
| 20 to 34 years | 0 (0.0%) | 0.0 |
| 35 to 50 years | 0 (0.0%) | 0.0 |
| Total | 0 (0.0%) | 0.0 |
Fertility by Age by Marriage Status in Twin Forks
| Age Bracket | Married | Unmarried |
| 15 to 19 years | 0 (0.0%) | 0 (0.0%) |
| 20 to 34 years | 0 (0.0%) | 0 (0.0%) |
| 35 to 50 years | 0 (0.0%) | 0 (0.0%) |
| Total | 0 (0.0%) | 0 (0.0%) |
Fertility by Education in Twin Forks
| Educational Attainment | Women with Births | Births / 1,000 Women |
| Less than High School | 0 (0.0%) | 0.0 |
| High School Diploma | 0 (0.0%) | 0.0 |
| College or Associate's Degree | 0 (0.0%) | 0.0 |
| Bachelor's Degree | 0 (0.0%) | 0.0 |
| Graduate Degree | 0 (0.0%) | 0.0 |
| Total | 0 (0.0%) | 0.0 |
Fertility by Education by Marriage Status in Twin Forks
| Educational Attainment | Married | Unmarried |
| Less than High School | 0 (0.0%) | 0 (0.0%) |
| High School Diploma | 0 (0.0%) | 0 (0.0%) |
| College or Associate's Degree | 0 (0.0%) | 0 (0.0%) |
| Bachelor's Degree | 0 (0.0%) | 0 (0.0%) |
| Graduate Degree | 0 (0.0%) | 0 (0.0%) |
| Total | 0 (0.0%) | 0 (0.0%) |
Employment Characteristics in Twin Forks
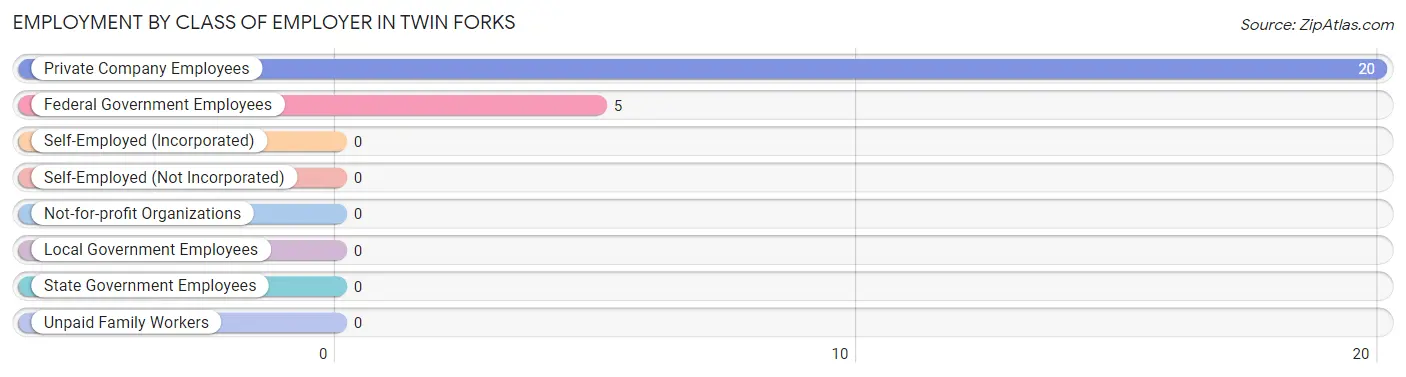
Employment by Class of Employer in Twin Forks
Among the 25 employed individuals in Twin Forks, private company employees (20 | 80.0%), and federal government employees (5 | 20.0%) make up the most common classes of employment.
| Employer Class | # Employees | % Employees |
| Private Company Employees | 20 | 80.0% |
| Self-Employed (Incorporated) | 0 | 0.0% |
| Self-Employed (Not Incorporated) | 0 | 0.0% |
| Not-for-profit Organizations | 0 | 0.0% |
| Local Government Employees | 0 | 0.0% |
| State Government Employees | 0 | 0.0% |
| Federal Government Employees | 5 | 20.0% |
| Unpaid Family Workers | 0 | 0.0% |
| Total | 25 | 100.0% |
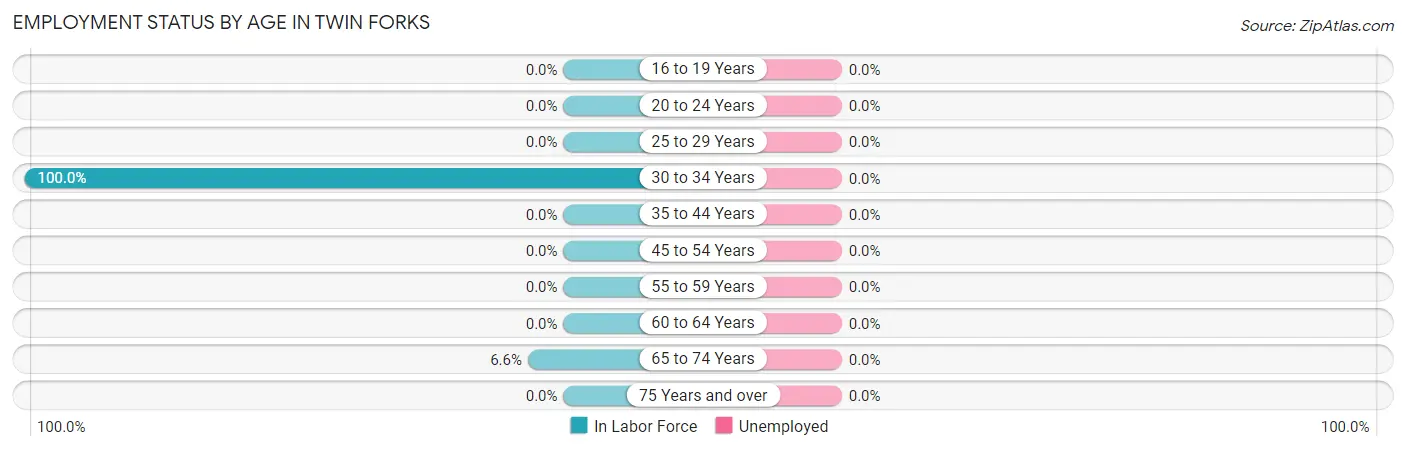
Employment Status by Age in Twin Forks
| Age Bracket | In Labor Force | Unemployed |
| 16 to 19 Years | 0 (0.0%) | 0 (0.0%) |
| 20 to 24 Years | 0 (0.0%) | 0 (0.0%) |
| 25 to 29 Years | 0 (0.0%) | 0 (0.0%) |
| 30 to 34 Years | 20 (100.0%) | 0 (0.0%) |
| 35 to 44 Years | 0 (0.0%) | 0 (0.0%) |
| 45 to 54 Years | 0 (0.0%) | 0 (0.0%) |
| 55 to 59 Years | 0 (0.0%) | 0 (0.0%) |
| 60 to 64 Years | 0 (0.0%) | 0 (0.0%) |
| 65 to 74 Years | 5 (6.6%) | 0 (0.0%) |
| 75 Years and over | 0 (0.0%) | 0 (0.0%) |
| Total | 25 (10.5%) | 0 (0.0%) |
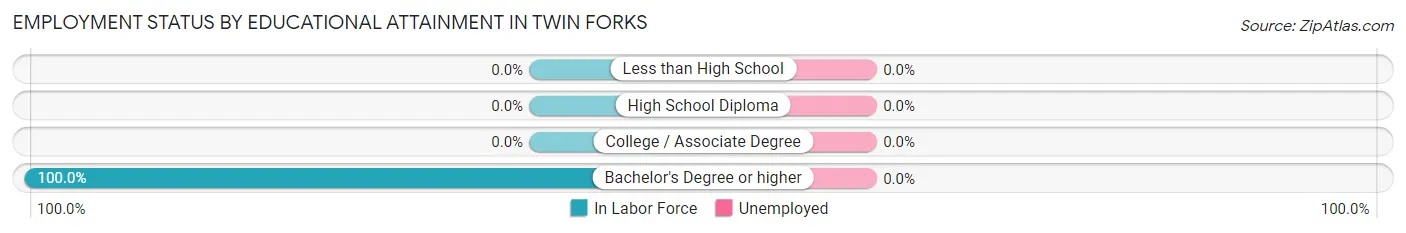
Employment Status by Educational Attainment in Twin Forks
| Educational Attainment | In Labor Force | Unemployed |
| Less than High School | 0 (0.0%) | 0 (0.0%) |
| High School Diploma | 0 (0.0%) | 0 (0.0%) |
| College / Associate Degree | 0 (0.0%) | 0 (0.0%) |
| Bachelor's Degree or higher | 20 (100.0%) | 0 (0.0%) |
| Total | 20 (13.8%) | 0 (0.0%) |
Employment Occupations by Sex in Twin Forks
Management, Business, Science and Arts Occupations
The most common Management, Business, Science and Arts occupations in Twin Forks are , and Management (5 | 20.0%).
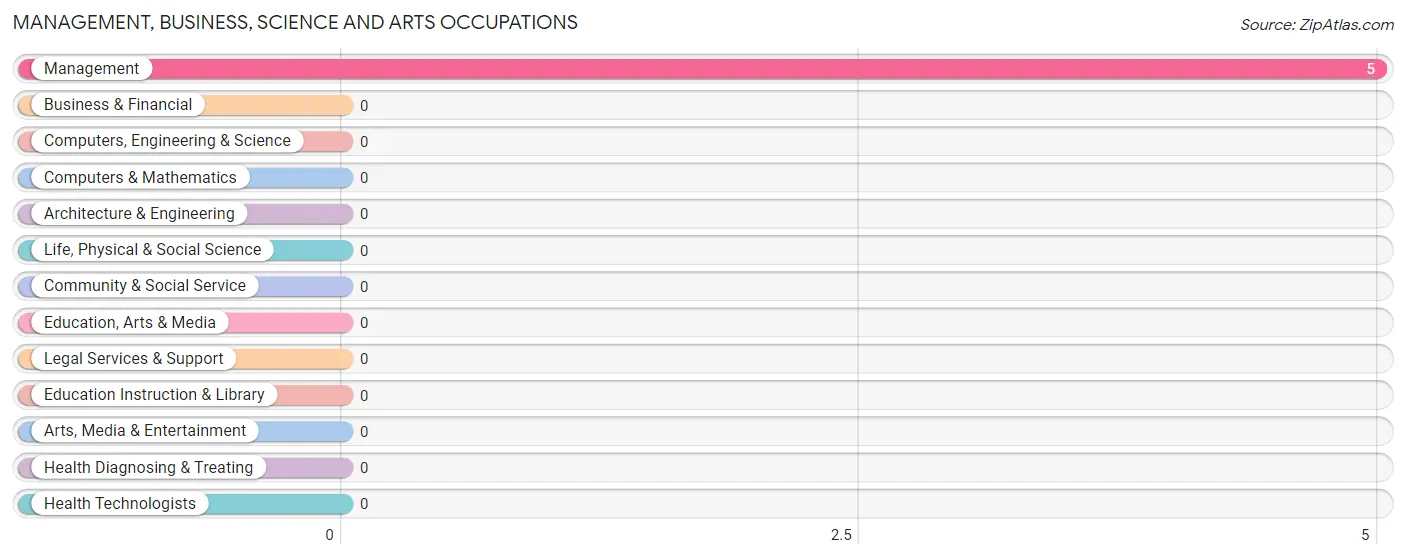
Management, Business, Science and Arts Occupations by Sex
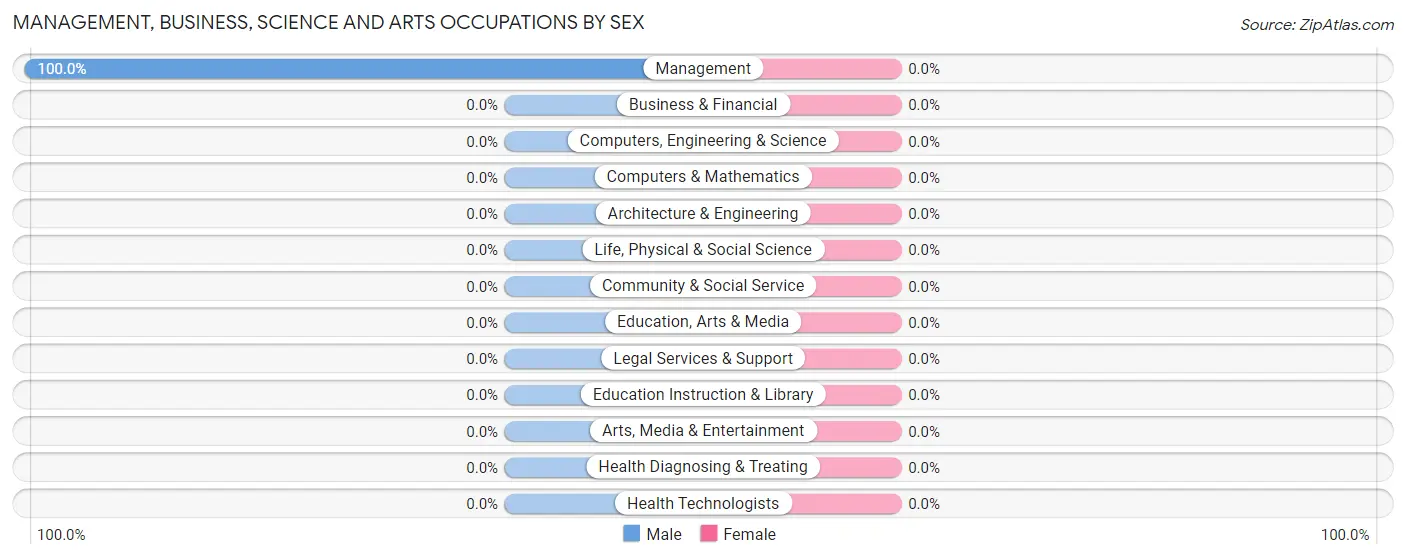
| Occupation | Male | Female |
| Management | 5 (100.0%) | 0 (0.0%) |
| Business & Financial | 0 (0.0%) | 0 (0.0%) |
| Computers, Engineering & Science | 0 (0.0%) | 0 (0.0%) |
| Computers & Mathematics | 0 (0.0%) | 0 (0.0%) |
| Architecture & Engineering | 0 (0.0%) | 0 (0.0%) |
| Life, Physical & Social Science | 0 (0.0%) | 0 (0.0%) |
| Community & Social Service | 0 (0.0%) | 0 (0.0%) |
| Education, Arts & Media | 0 (0.0%) | 0 (0.0%) |
| Legal Services & Support | 0 (0.0%) | 0 (0.0%) |
| Education Instruction & Library | 0 (0.0%) | 0 (0.0%) |
| Arts, Media & Entertainment | 0 (0.0%) | 0 (0.0%) |
| Health Diagnosing & Treating | 0 (0.0%) | 0 (0.0%) |
| Health Technologists | 0 (0.0%) | 0 (0.0%) |
| Total (Category) | 5 (100.0%) | 0 (0.0%) |
| Total (Overall) | 25 (100.0%) | 0 (0.0%) |
Services Occupations
Services Occupations by Sex
| Occupation | Male | Female |
| Healthcare Support | 0 (0.0%) | 0 (0.0%) |
| Security & Protection | 0 (0.0%) | 0 (0.0%) |
| Firefighting & Prevention | 0 (0.0%) | 0 (0.0%) |
| Law Enforcement | 0 (0.0%) | 0 (0.0%) |
| Food Preparation & Serving | 0 (0.0%) | 0 (0.0%) |
| Cleaning & Maintenance | 0 (0.0%) | 0 (0.0%) |
| Personal Care & Service | 0 (0.0%) | 0 (0.0%) |
| Total (Category) | 0 (0.0%) | 0 (0.0%) |
| Total (Overall) | 25 (100.0%) | 0 (0.0%) |
Sales and Office Occupations
The most common Sales and Office occupations in Twin Forks are , and Sales & Related (20 | 80.0%).
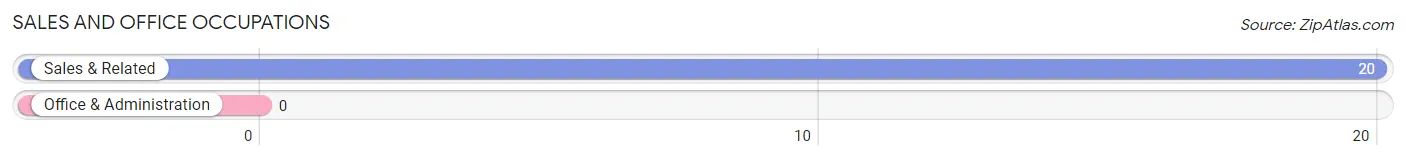
Sales and Office Occupations by Sex
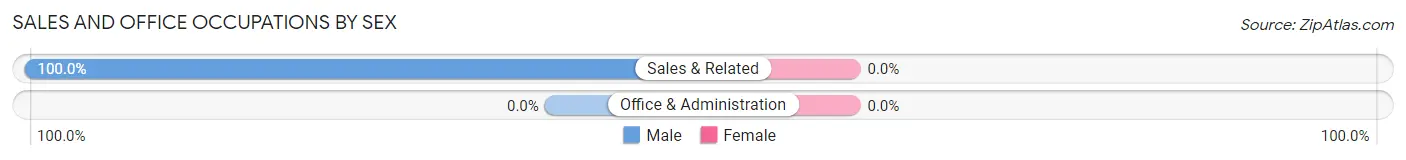
| Occupation | Male | Female |
| Sales & Related | 20 (100.0%) | 0 (0.0%) |
| Office & Administration | 0 (0.0%) | 0 (0.0%) |
| Total (Category) | 20 (100.0%) | 0 (0.0%) |
| Total (Overall) | 25 (100.0%) | 0 (0.0%) |
Natural Resources, Construction and Maintenance Occupations
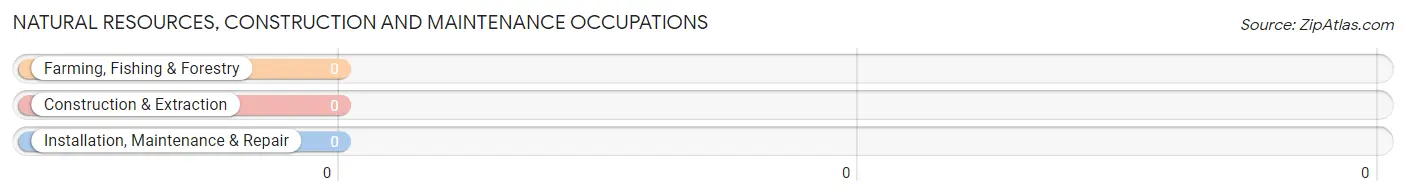
Natural Resources, Construction and Maintenance Occupations by Sex
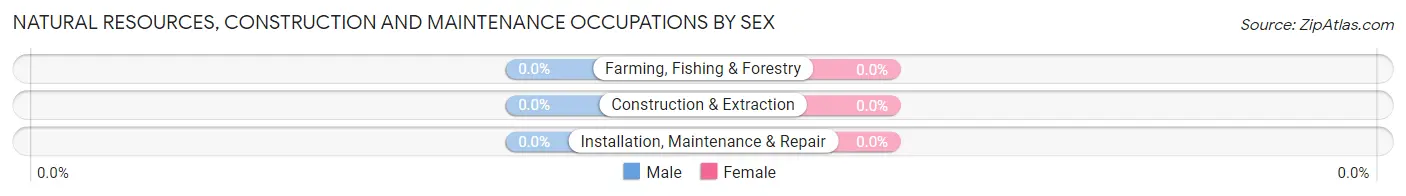
| Occupation | Male | Female |
| Farming, Fishing & Forestry | 0 (0.0%) | 0 (0.0%) |
| Construction & Extraction | 0 (0.0%) | 0 (0.0%) |
| Installation, Maintenance & Repair | 0 (0.0%) | 0 (0.0%) |
| Total (Category) | 0 (0.0%) | 0 (0.0%) |
| Total (Overall) | 25 (100.0%) | 0 (0.0%) |
Production, Transportation and Moving Occupations
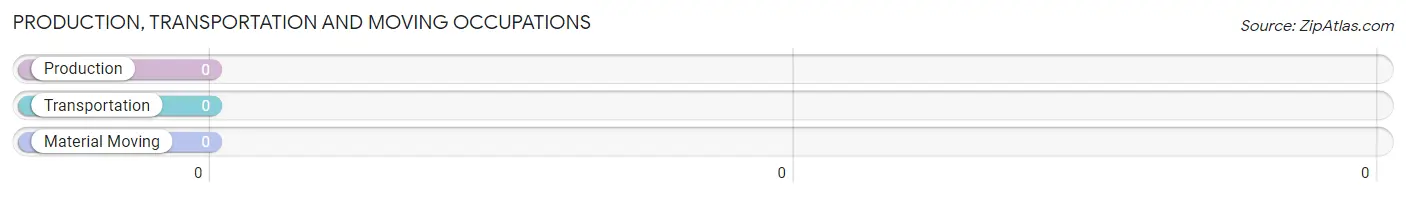
Production, Transportation and Moving Occupations by Sex
| Occupation | Male | Female |
| Production | 0 (0.0%) | 0 (0.0%) |
| Transportation | 0 (0.0%) | 0 (0.0%) |
| Material Moving | 0 (0.0%) | 0 (0.0%) |
| Total (Category) | 0 (0.0%) | 0 (0.0%) |
| Total (Overall) | 25 (100.0%) | 0 (0.0%) |
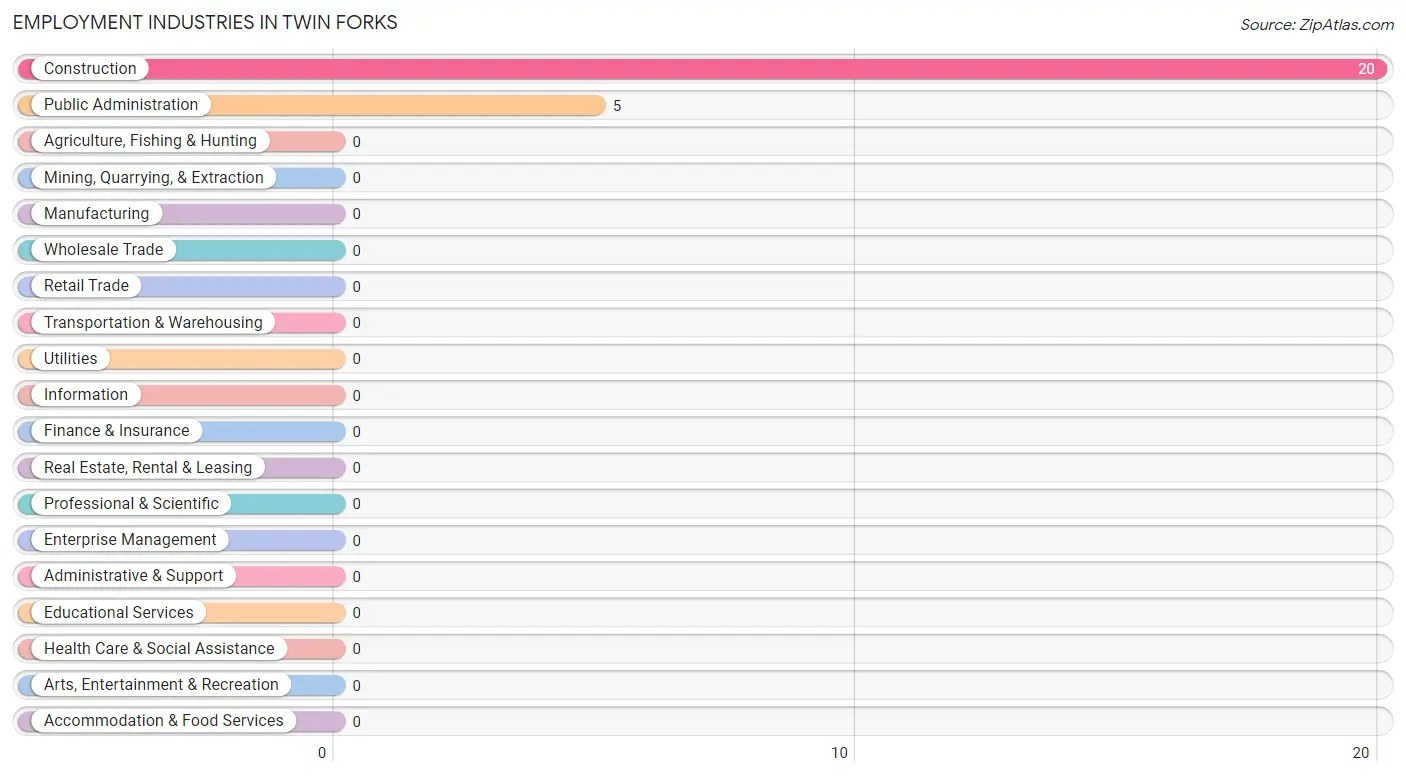
Employment Industries by Sex in Twin Forks
Employment Industries in Twin Forks
The major employment industries in Twin Forks include Construction (20 | 80.0%), and Public Administration (5 | 20.0%).
Employment Industries by Sex in Twin Forks
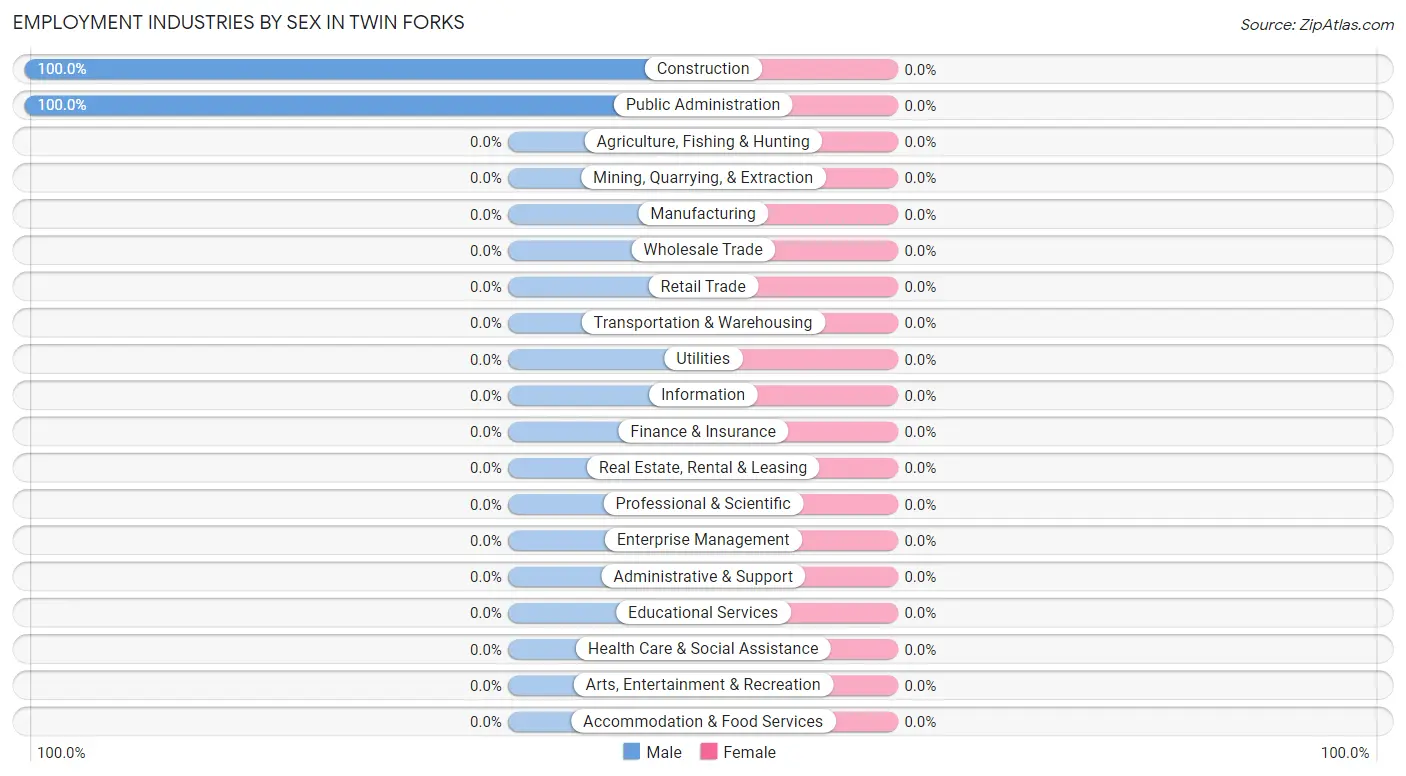
| Industry | Male | Female |
| Agriculture, Fishing & Hunting | 0 (0.0%) | 0 (0.0%) |
| Mining, Quarrying, & Extraction | 0 (0.0%) | 0 (0.0%) |
| Construction | 20 (100.0%) | 0 (0.0%) |
| Manufacturing | 0 (0.0%) | 0 (0.0%) |
| Wholesale Trade | 0 (0.0%) | 0 (0.0%) |
| Retail Trade | 0 (0.0%) | 0 (0.0%) |
| Transportation & Warehousing | 0 (0.0%) | 0 (0.0%) |
| Utilities | 0 (0.0%) | 0 (0.0%) |
| Information | 0 (0.0%) | 0 (0.0%) |
| Finance & Insurance | 0 (0.0%) | 0 (0.0%) |
| Real Estate, Rental & Leasing | 0 (0.0%) | 0 (0.0%) |
| Professional & Scientific | 0 (0.0%) | 0 (0.0%) |
| Enterprise Management | 0 (0.0%) | 0 (0.0%) |
| Administrative & Support | 0 (0.0%) | 0 (0.0%) |
| Educational Services | 0 (0.0%) | 0 (0.0%) |
| Health Care & Social Assistance | 0 (0.0%) | 0 (0.0%) |
| Arts, Entertainment & Recreation | 0 (0.0%) | 0 (0.0%) |
| Accommodation & Food Services | 0 (0.0%) | 0 (0.0%) |
| Public Administration | 5 (100.0%) | 0 (0.0%) |
| Total | 25 (100.0%) | 0 (0.0%) |
Education in Twin Forks
School Enrollment in Twin Forks
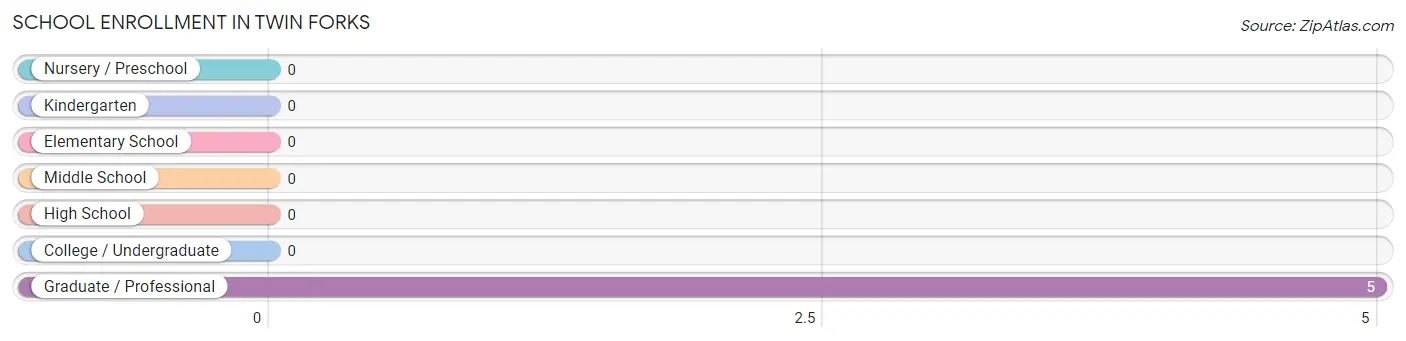
| School Level | # Students | % Students |
| Nursery / Preschool | 0 | 0.0% |
| Kindergarten | 0 | 0.0% |
| Elementary School | 0 | 0.0% |
| Middle School | 0 | 0.0% |
| High School | 0 | 0.0% |
| College / Undergraduate | 0 | 0.0% |
| Graduate / Professional | 5 | 100.0% |
| Total | 5 | 100.0% |
School Enrollment by Age by Funding Source in Twin Forks
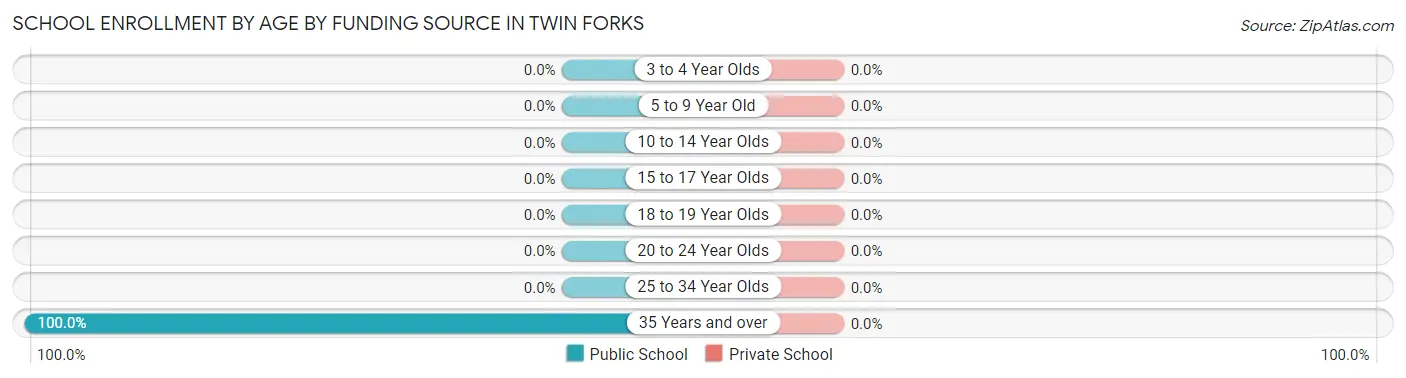
| Age Bracket | Public School | Private School |
| 3 to 4 Year Olds | 0 (0.0%) | 0 (0.0%) |
| 5 to 9 Year Old | 0 (0.0%) | 0 (0.0%) |
| 10 to 14 Year Olds | 0 (0.0%) | 0 (0.0%) |
| 15 to 17 Year Olds | 0 (0.0%) | 0 (0.0%) |
| 18 to 19 Year Olds | 0 (0.0%) | 0 (0.0%) |
| 20 to 24 Year Olds | 0 (0.0%) | 0 (0.0%) |
| 25 to 34 Year Olds | 0 (0.0%) | 0 (0.0%) |
| 35 Years and over | 5 (100.0%) | 0 (0.0%) |
| Total | 5 (100.0%) | 0 (0.0%) |
Educational Attainment by Field of Study in Twin Forks
Computers & mathematics (31 | 39.2%), arts & humanities (20 | 25.3%), physical & health sciences (9 | 11.4%), liberal arts & history (9 | 11.4%), and psychology (5 | 6.3%) are the most common fields of study among 79 individuals in Twin Forks who have obtained a bachelor's degree or higher.
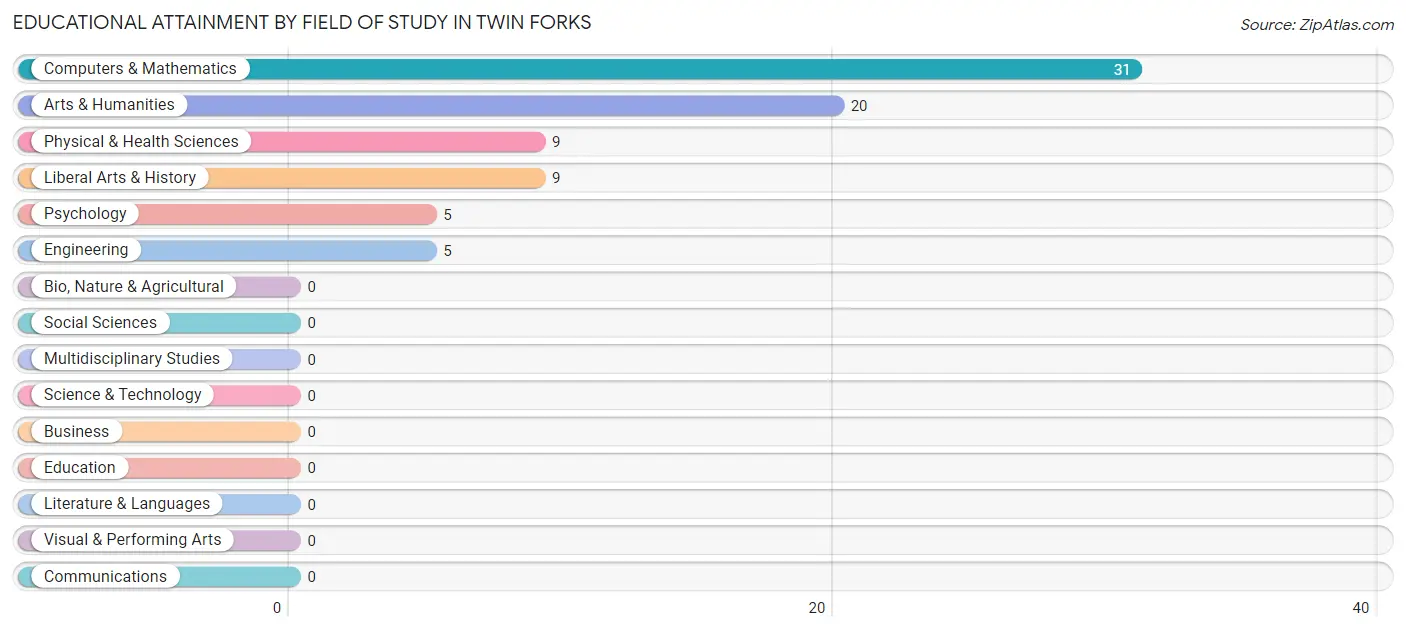
| Field of Study | # Graduates | % Graduates |
| Computers & Mathematics | 31 | 39.2% |
| Bio, Nature & Agricultural | 0 | 0.0% |
| Physical & Health Sciences | 9 | 11.4% |
| Psychology | 5 | 6.3% |
| Social Sciences | 0 | 0.0% |
| Engineering | 5 | 6.3% |
| Multidisciplinary Studies | 0 | 0.0% |
| Science & Technology | 0 | 0.0% |
| Business | 0 | 0.0% |
| Education | 0 | 0.0% |
| Literature & Languages | 0 | 0.0% |
| Liberal Arts & History | 9 | 11.4% |
| Visual & Performing Arts | 0 | 0.0% |
| Communications | 0 | 0.0% |
| Arts & Humanities | 20 | 25.3% |
| Total | 79 | 100.0% |
Transportation & Commute in Twin Forks
Vehicle Availability by Sex in Twin Forks
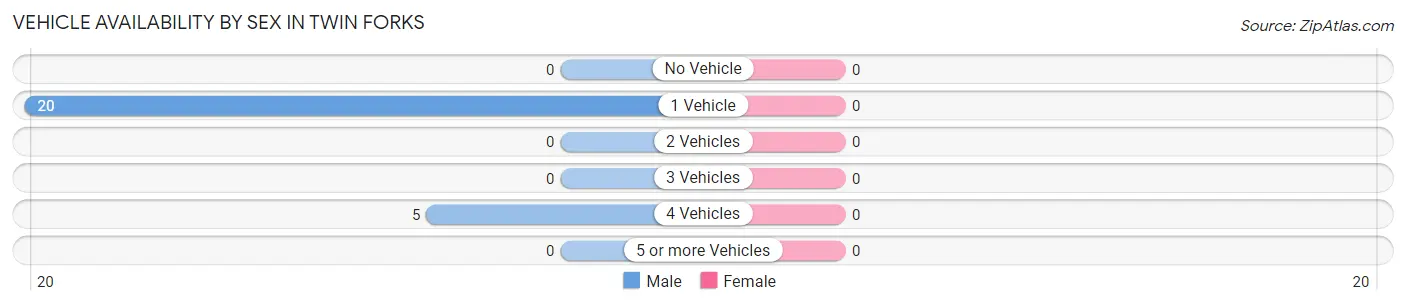
| Vehicles Available | Male | Female |
| No Vehicle | 0 (0.0%) | 0 (0.0%) |
| 1 Vehicle | 20 (80.0%) | 0 (0.0%) |
| 2 Vehicles | 0 (0.0%) | 0 (0.0%) |
| 3 Vehicles | 0 (0.0%) | 0 (0.0%) |
| 4 Vehicles | 5 (20.0%) | 0 (0.0%) |
| 5 or more Vehicles | 0 (0.0%) | 0 (0.0%) |
| Total | 25 (100.0%) | 0 (0.0%) |
Commute Time in Twin Forks
The most frequently occuring commute durations in Twin Forks are 60 to 89 minutes (20 commuters, 80.0%), 45 to 59 minutes (5 commuters, 20.0%), and less than 5 minutes (0 commuters, 0.0%).
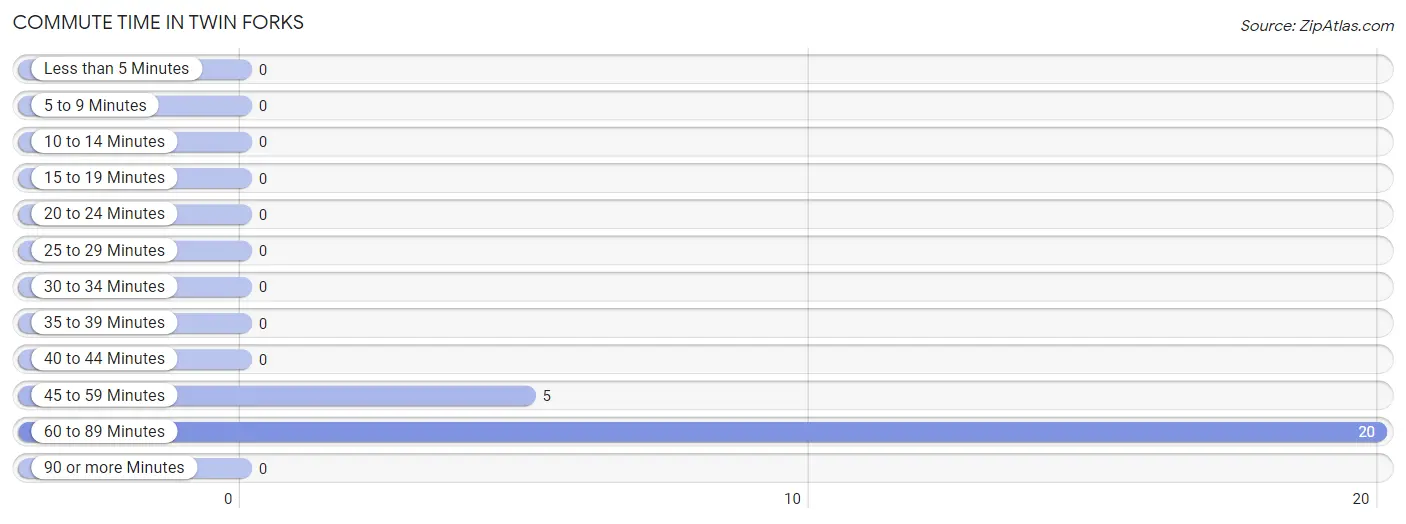
| Commute Time | # Commuters | % Commuters |
| Less than 5 Minutes | 0 | 0.0% |
| 5 to 9 Minutes | 0 | 0.0% |
| 10 to 14 Minutes | 0 | 0.0% |
| 15 to 19 Minutes | 0 | 0.0% |
| 20 to 24 Minutes | 0 | 0.0% |
| 25 to 29 Minutes | 0 | 0.0% |
| 30 to 34 Minutes | 0 | 0.0% |
| 35 to 39 Minutes | 0 | 0.0% |
| 40 to 44 Minutes | 0 | 0.0% |
| 45 to 59 Minutes | 5 | 20.0% |
| 60 to 89 Minutes | 20 | 80.0% |
| 90 or more Minutes | 0 | 0.0% |
Commute Time by Sex in Twin Forks
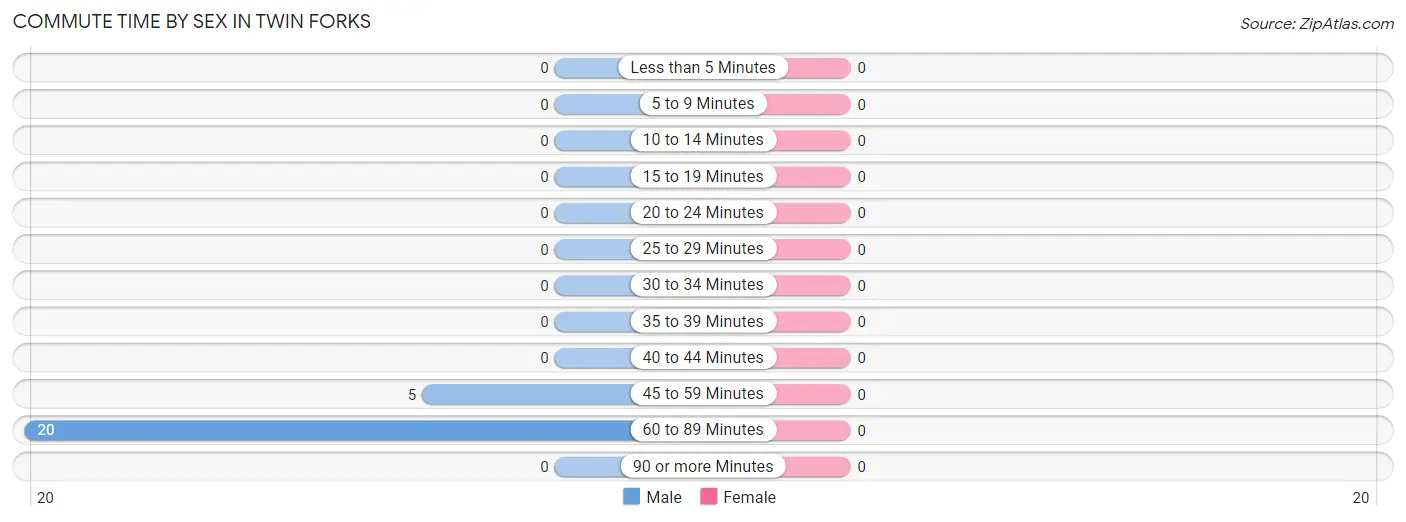
| Commute Time | Male | Female |
| Less than 5 Minutes | 0 (0.0%) | 0 (0.0%) |
| 5 to 9 Minutes | 0 (0.0%) | 0 (0.0%) |
| 10 to 14 Minutes | 0 (0.0%) | 0 (0.0%) |
| 15 to 19 Minutes | 0 (0.0%) | 0 (0.0%) |
| 20 to 24 Minutes | 0 (0.0%) | 0 (0.0%) |
| 25 to 29 Minutes | 0 (0.0%) | 0 (0.0%) |
| 30 to 34 Minutes | 0 (0.0%) | 0 (0.0%) |
| 35 to 39 Minutes | 0 (0.0%) | 0 (0.0%) |
| 40 to 44 Minutes | 0 (0.0%) | 0 (0.0%) |
| 45 to 59 Minutes | 5 (20.0%) | 0 (0.0%) |
| 60 to 89 Minutes | 20 (80.0%) | 0 (0.0%) |
| 90 or more Minutes | 0 (0.0%) | 0 (0.0%) |
Time of Departure to Work by Sex in Twin Forks
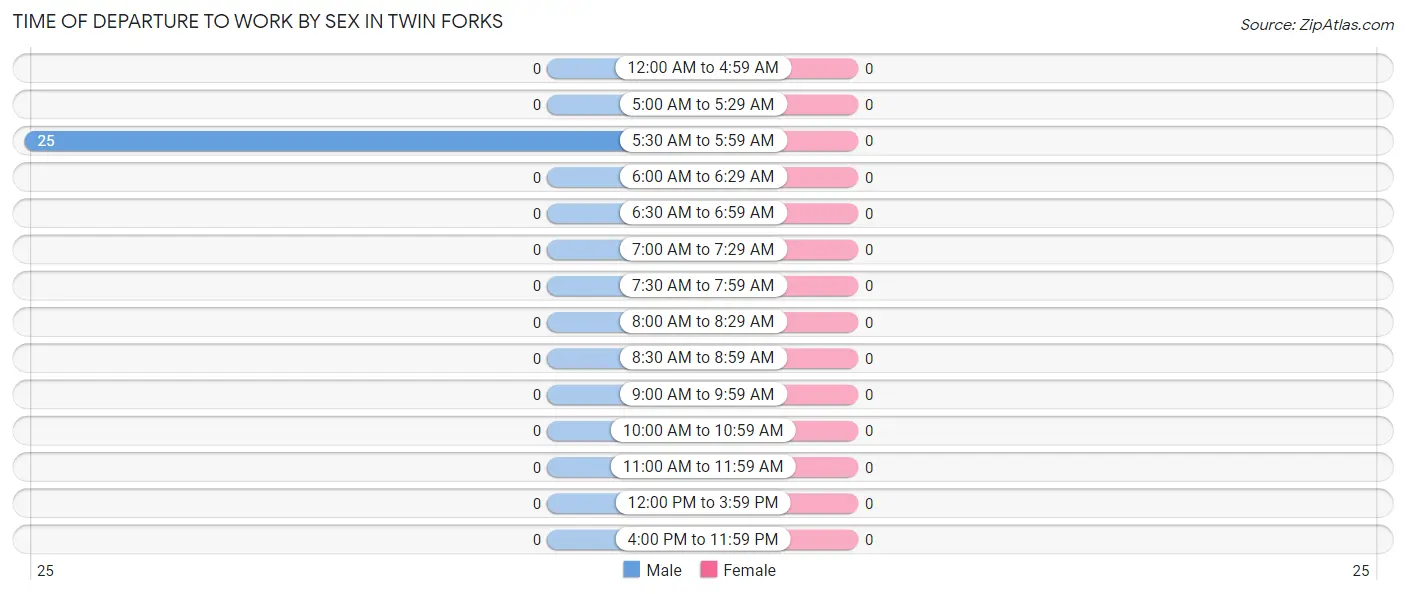
| Time of Departure | Male | Female |
| 12:00 AM to 4:59 AM | 0 (0.0%) | 0 (0.0%) |
| 5:00 AM to 5:29 AM | 0 (0.0%) | 0 (0.0%) |
| 5:30 AM to 5:59 AM | 25 (100.0%) | 0 (0.0%) |
| 6:00 AM to 6:29 AM | 0 (0.0%) | 0 (0.0%) |
| 6:30 AM to 6:59 AM | 0 (0.0%) | 0 (0.0%) |
| 7:00 AM to 7:29 AM | 0 (0.0%) | 0 (0.0%) |
| 7:30 AM to 7:59 AM | 0 (0.0%) | 0 (0.0%) |
| 8:00 AM to 8:29 AM | 0 (0.0%) | 0 (0.0%) |
| 8:30 AM to 8:59 AM | 0 (0.0%) | 0 (0.0%) |
| 9:00 AM to 9:59 AM | 0 (0.0%) | 0 (0.0%) |
| 10:00 AM to 10:59 AM | 0 (0.0%) | 0 (0.0%) |
| 11:00 AM to 11:59 AM | 0 (0.0%) | 0 (0.0%) |
| 12:00 PM to 3:59 PM | 0 (0.0%) | 0 (0.0%) |
| 4:00 PM to 11:59 PM | 0 (0.0%) | 0 (0.0%) |
| Total | 25 (100.0%) | 0 (0.0%) |
Housing Occupancy in Twin Forks
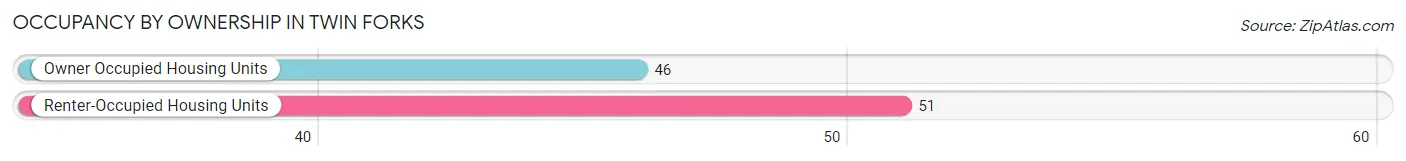
Occupancy by Ownership in Twin Forks
Of the total 97 dwellings in Twin Forks, owner-occupied units account for 46 (47.4%), while renter-occupied units make up 51 (52.6%).
| Occupancy | # Housing Units | % Housing Units |
| Owner Occupied Housing Units | 46 | 47.4% |
| Renter-Occupied Housing Units | 51 | 52.6% |
| Total Occupied Housing Units | 97 | 100.0% |
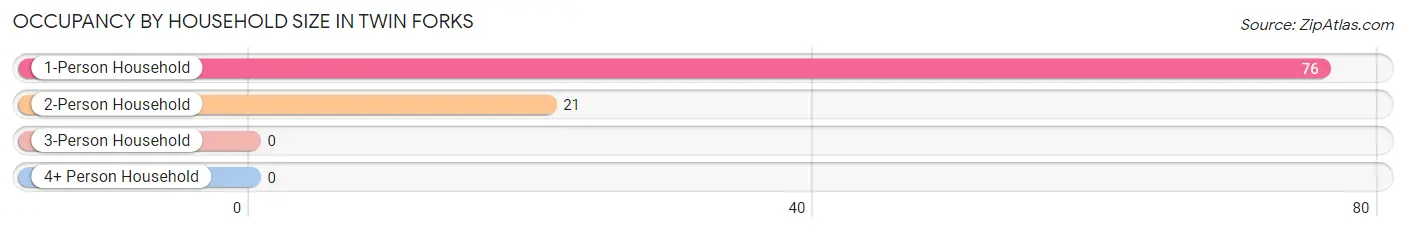
Occupancy by Household Size in Twin Forks
| Household Size | # Housing Units | % Housing Units |
| 1-Person Household | 76 | 78.3% |
| 2-Person Household | 21 | 21.6% |
| 3-Person Household | 0 | 0.0% |
| 4+ Person Household | 0 | 0.0% |
| Total Housing Units | 97 | 100.0% |
Occupancy by Ownership by Household Size in Twin Forks
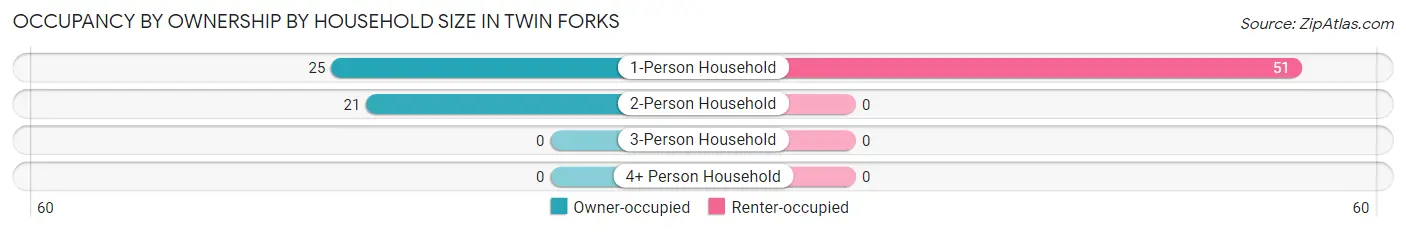
| Household Size | Owner-occupied | Renter-occupied |
| 1-Person Household | 25 (32.9%) | 51 (67.1%) |
| 2-Person Household | 21 (100.0%) | 0 (0.0%) |
| 3-Person Household | 0 (0.0%) | 0 (0.0%) |
| 4+ Person Household | 0 (0.0%) | 0 (0.0%) |
| Total Housing Units | 46 (47.4%) | 51 (52.6%) |
Occupancy by Educational Attainment in Twin Forks
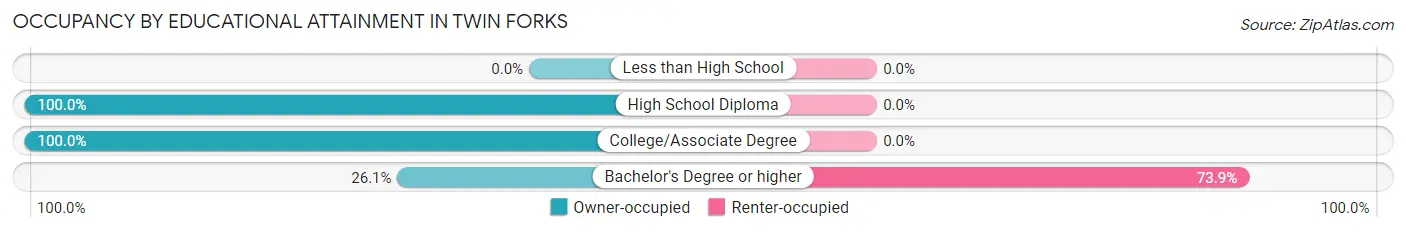
| Household Size | Owner-occupied | Renter-occupied |
| Less than High School | 0 (0.0%) | 0 (0.0%) |
| High School Diploma | 7 (100.0%) | 0 (0.0%) |
| College/Associate Degree | 21 (100.0%) | 0 (0.0%) |
| Bachelor's Degree or higher | 18 (26.1%) | 51 (73.9%) |
Occupancy by Age of Householder in Twin Forks
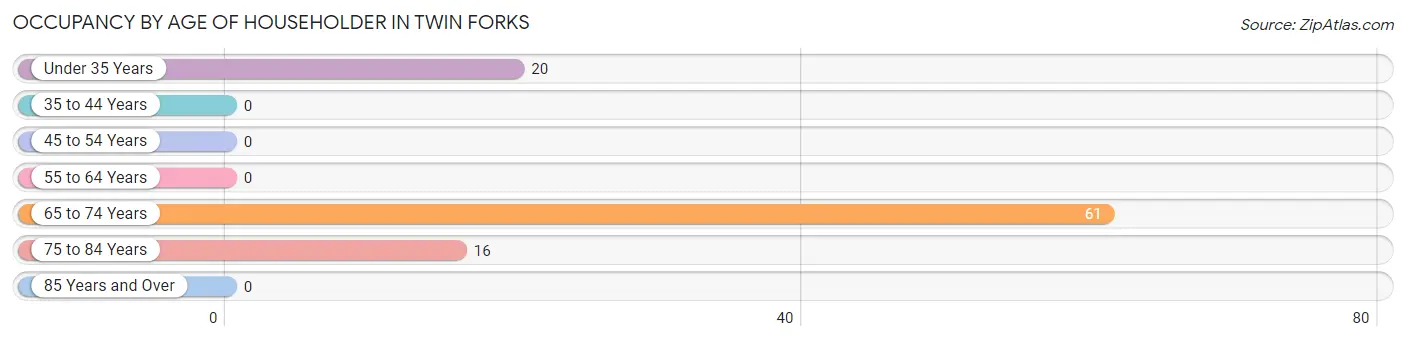
| Age Bracket | # Households | % Households |
| Under 35 Years | 20 | 20.6% |
| 35 to 44 Years | 0 | 0.0% |
| 45 to 54 Years | 0 | 0.0% |
| 55 to 64 Years | 0 | 0.0% |
| 65 to 74 Years | 61 | 62.9% |
| 75 to 84 Years | 16 | 16.5% |
| 85 Years and Over | 0 | 0.0% |
| Total | 97 | 100.0% |
Housing Finances in Twin Forks
Median Income by Occupancy in Twin Forks
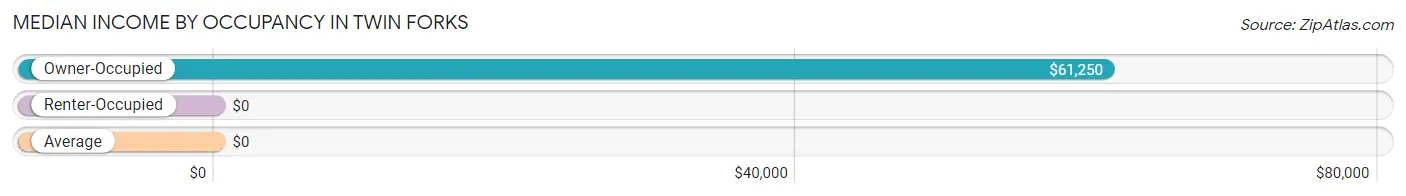
| Occupancy Type | # Households | Median Income |
| Owner-Occupied | 46 (47.4%) | $61,250 |
| Renter-Occupied | 51 (52.6%) | $0 |
| Average | 97 (100.0%) | $0 |
Occupancy by Householder Income Bracket in Twin Forks
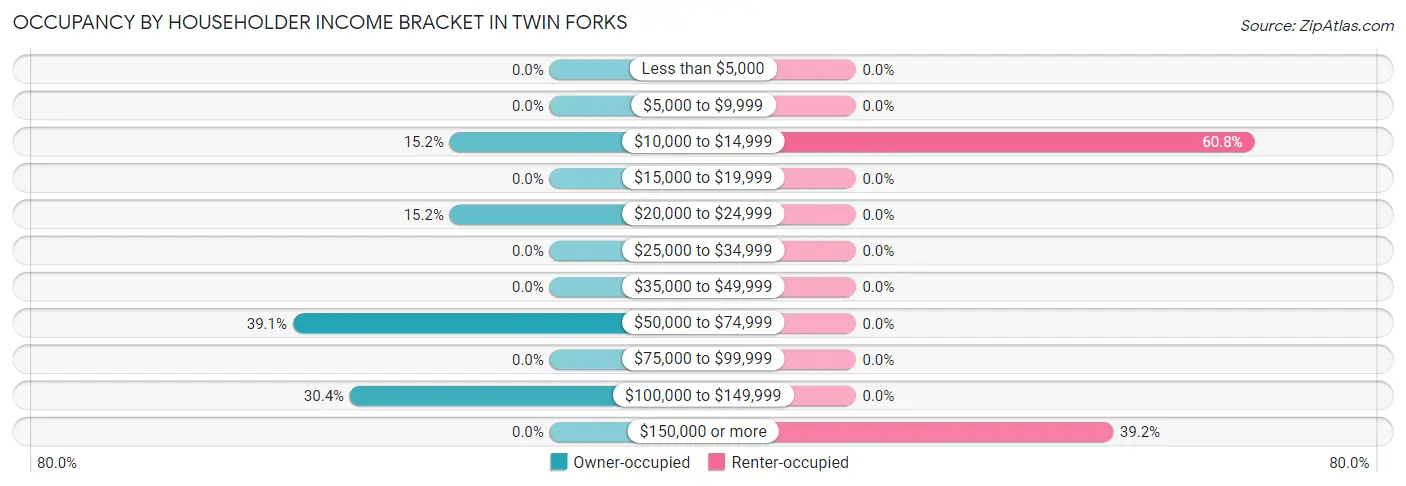
| Income Bracket | Owner-occupied | Renter-occupied |
| Less than $5,000 | 0 (0.0%) | 0 (0.0%) |
| $5,000 to $9,999 | 0 (0.0%) | 0 (0.0%) |
| $10,000 to $14,999 | 7 (15.2%) | 31 (60.8%) |
| $15,000 to $19,999 | 0 (0.0%) | 0 (0.0%) |
| $20,000 to $24,999 | 7 (15.2%) | 0 (0.0%) |
| $25,000 to $34,999 | 0 (0.0%) | 0 (0.0%) |
| $35,000 to $49,999 | 0 (0.0%) | 0 (0.0%) |
| $50,000 to $74,999 | 18 (39.1%) | 0 (0.0%) |
| $75,000 to $99,999 | 0 (0.0%) | 0 (0.0%) |
| $100,000 to $149,999 | 14 (30.4%) | 0 (0.0%) |
| $150,000 or more | 0 (0.0%) | 20 (39.2%) |
| Total | 46 (100.0%) | 51 (100.0%) |
Monthly Housing Cost Tiers in Twin Forks
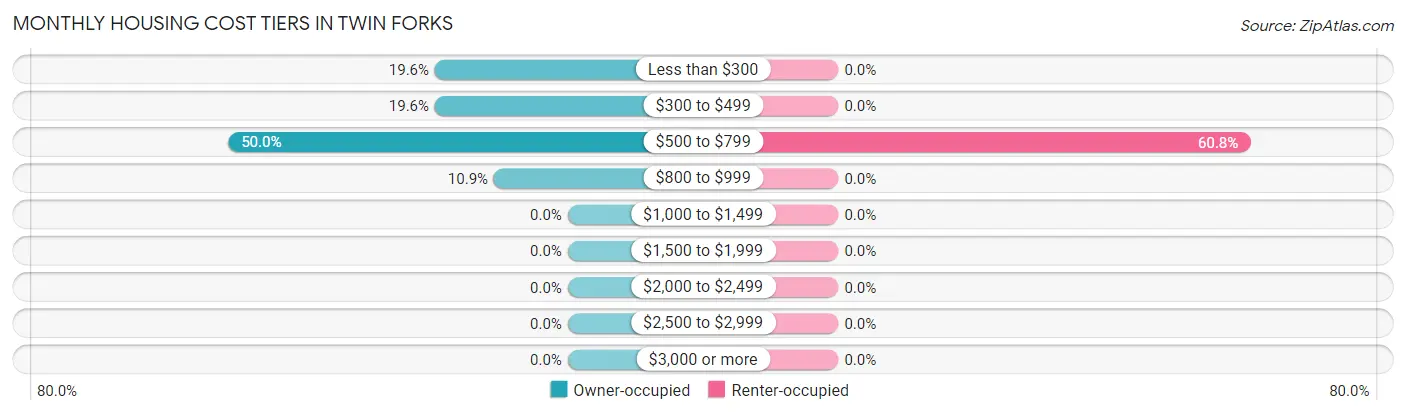
| Monthly Cost | Owner-occupied | Renter-occupied |
| Less than $300 | 9 (19.6%) | 0 (0.0%) |
| $300 to $499 | 9 (19.6%) | 0 (0.0%) |
| $500 to $799 | 23 (50.0%) | 31 (60.8%) |
| $800 to $999 | 5 (10.9%) | 0 (0.0%) |
| $1,000 to $1,499 | 0 (0.0%) | 0 (0.0%) |
| $1,500 to $1,999 | 0 (0.0%) | 0 (0.0%) |
| $2,000 to $2,499 | 0 (0.0%) | 0 (0.0%) |
| $2,500 to $2,999 | 0 (0.0%) | 0 (0.0%) |
| $3,000 or more | 0 (0.0%) | 0 (0.0%) |
| Total | 46 (100.0%) | 51 (100.0%) |
Physical Housing Characteristics in Twin Forks
Housing Structures in Twin Forks
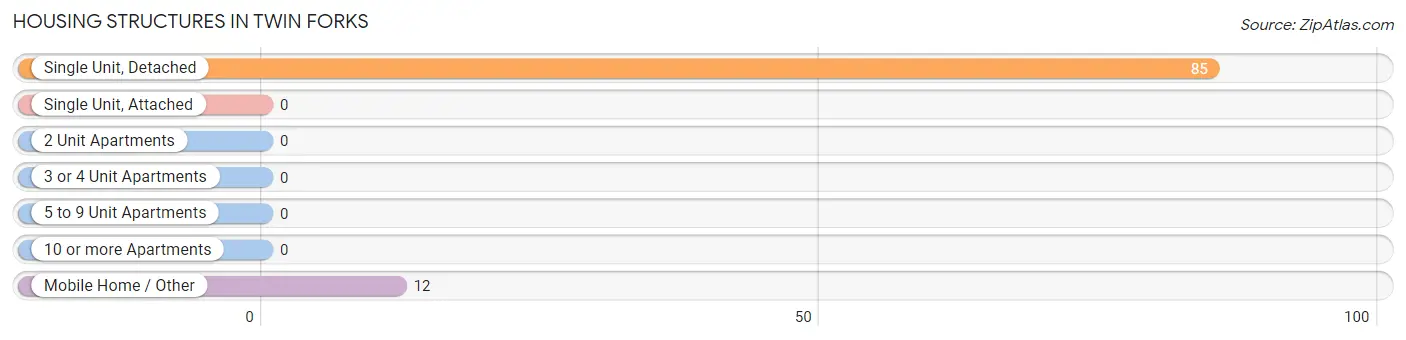
| Structure Type | # Housing Units | % Housing Units |
| Single Unit, Detached | 85 | 87.6% |
| Single Unit, Attached | 0 | 0.0% |
| 2 Unit Apartments | 0 | 0.0% |
| 3 or 4 Unit Apartments | 0 | 0.0% |
| 5 to 9 Unit Apartments | 0 | 0.0% |
| 10 or more Apartments | 0 | 0.0% |
| Mobile Home / Other | 12 | 12.4% |
| Total | 97 | 100.0% |
Housing Structures by Occupancy in Twin Forks
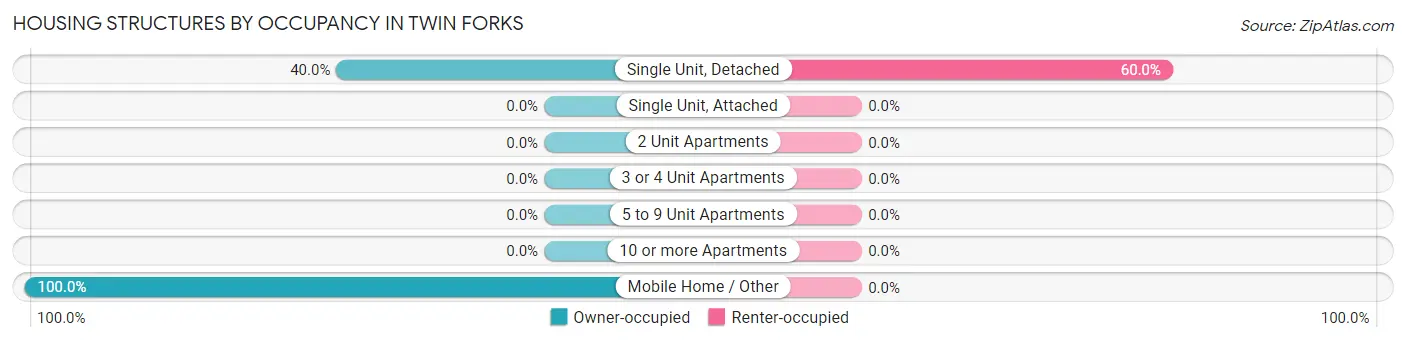
| Structure Type | Owner-occupied | Renter-occupied |
| Single Unit, Detached | 34 (40.0%) | 51 (60.0%) |
| Single Unit, Attached | 0 (0.0%) | 0 (0.0%) |
| 2 Unit Apartments | 0 (0.0%) | 0 (0.0%) |
| 3 or 4 Unit Apartments | 0 (0.0%) | 0 (0.0%) |
| 5 to 9 Unit Apartments | 0 (0.0%) | 0 (0.0%) |
| 10 or more Apartments | 0 (0.0%) | 0 (0.0%) |
| Mobile Home / Other | 12 (100.0%) | 0 (0.0%) |
| Total | 46 (47.4%) | 51 (52.6%) |
Housing Structures by Number of Rooms in Twin Forks
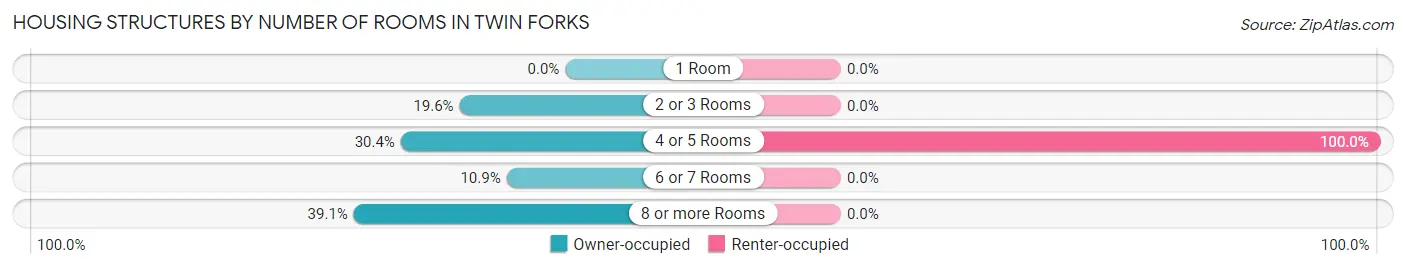
| Number of Rooms | Owner-occupied | Renter-occupied |
| 1 Room | 0 (0.0%) | 0 (0.0%) |
| 2 or 3 Rooms | 9 (19.6%) | 0 (0.0%) |
| 4 or 5 Rooms | 14 (30.4%) | 51 (100.0%) |
| 6 or 7 Rooms | 5 (10.9%) | 0 (0.0%) |
| 8 or more Rooms | 18 (39.1%) | 0 (0.0%) |
| Total | 46 (100.0%) | 51 (100.0%) |
Housing Structure by Heating Type in Twin Forks
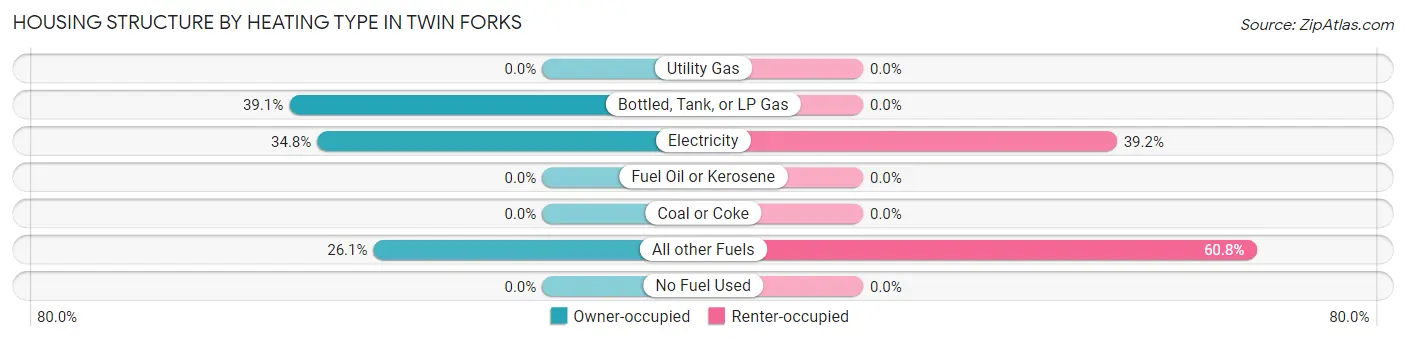
| Heating Type | Owner-occupied | Renter-occupied |
| Utility Gas | 0 (0.0%) | 0 (0.0%) |
| Bottled, Tank, or LP Gas | 18 (39.1%) | 0 (0.0%) |
| Electricity | 16 (34.8%) | 20 (39.2%) |
| Fuel Oil or Kerosene | 0 (0.0%) | 0 (0.0%) |
| Coal or Coke | 0 (0.0%) | 0 (0.0%) |
| All other Fuels | 12 (26.1%) | 31 (60.8%) |
| No Fuel Used | 0 (0.0%) | 0 (0.0%) |
| Total | 46 (100.0%) | 51 (100.0%) |
Household Vehicle Usage in Twin Forks
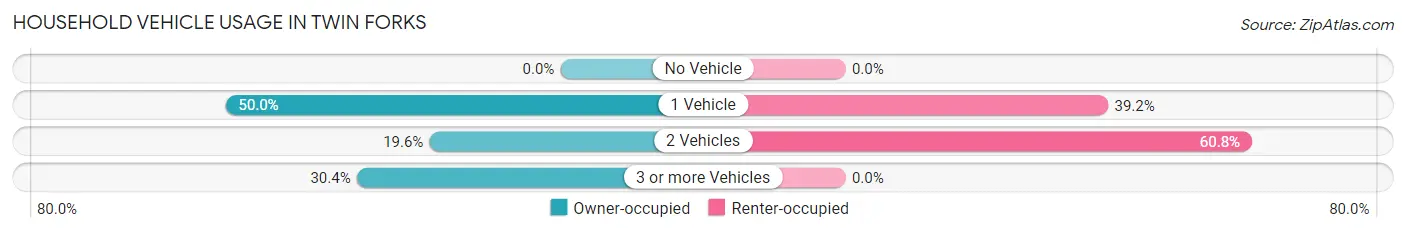
| Vehicles per Household | Owner-occupied | Renter-occupied |
| No Vehicle | 0 (0.0%) | 0 (0.0%) |
| 1 Vehicle | 23 (50.0%) | 20 (39.2%) |
| 2 Vehicles | 9 (19.6%) | 31 (60.8%) |
| 3 or more Vehicles | 14 (30.4%) | 0 (0.0%) |
| Total | 46 (100.0%) | 51 (100.0%) |
Real Estate & Mortgages in Twin Forks
Real Estate and Mortgage Overview in Twin Forks
| Characteristic | Without Mortgage | With Mortgage |
| Housing Units | 39 | 7 |
| Median Property Value | $234,700 | $0 |
| Median Household Income | $70,972 | $0 |
| Monthly Housing Costs | $517 | $0 |
| Real Estate Taxes | $639 | $0 |
Property Value by Mortgage Status in Twin Forks
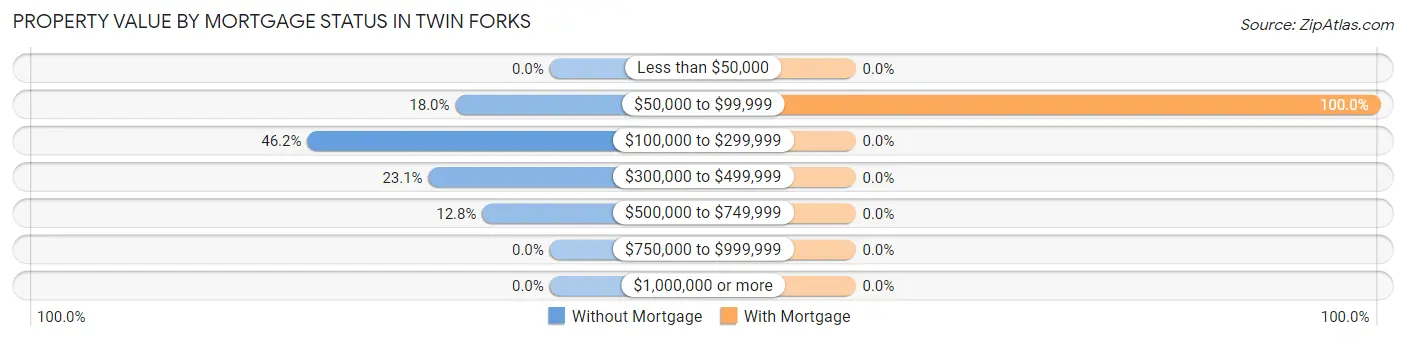
| Property Value | Without Mortgage | With Mortgage |
| Less than $50,000 | 0 (0.0%) | 0 (0.0%) |
| $50,000 to $99,999 | 7 (17.9%) | 7 (100.0%) |
| $100,000 to $299,999 | 18 (46.2%) | 0 (0.0%) |
| $300,000 to $499,999 | 9 (23.1%) | 0 (0.0%) |
| $500,000 to $749,999 | 5 (12.8%) | 0 (0.0%) |
| $750,000 to $999,999 | 0 (0.0%) | 0 (0.0%) |
| $1,000,000 or more | 0 (0.0%) | 0 (0.0%) |
| Total | 39 (100.0%) | 7 (100.0%) |
Household Income by Mortgage Status in Twin Forks
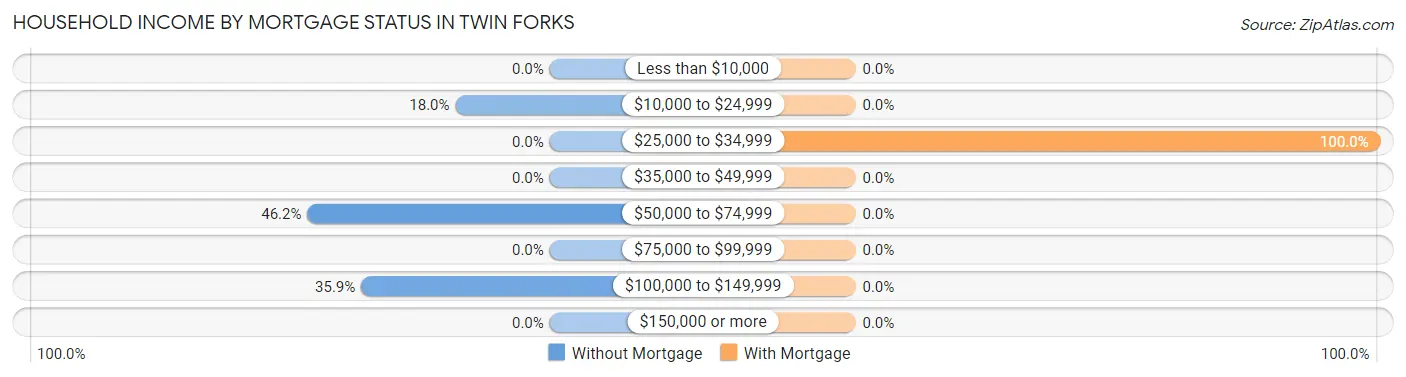
| Household Income | Without Mortgage | With Mortgage |
| Less than $10,000 | 0 (0.0%) | 0 (0.0%) |
| $10,000 to $24,999 | 7 (17.9%) | 0 (0.0%) |
| $25,000 to $34,999 | 0 (0.0%) | 7 (100.0%) |
| $35,000 to $49,999 | 0 (0.0%) | 0 (0.0%) |
| $50,000 to $74,999 | 18 (46.2%) | 0 (0.0%) |
| $75,000 to $99,999 | 0 (0.0%) | 0 (0.0%) |
| $100,000 to $149,999 | 14 (35.9%) | 0 (0.0%) |
| $150,000 or more | 0 (0.0%) | 0 (0.0%) |
| Total | 39 (100.0%) | 7 (100.0%) |
Property Value to Household Income Ratio in Twin Forks
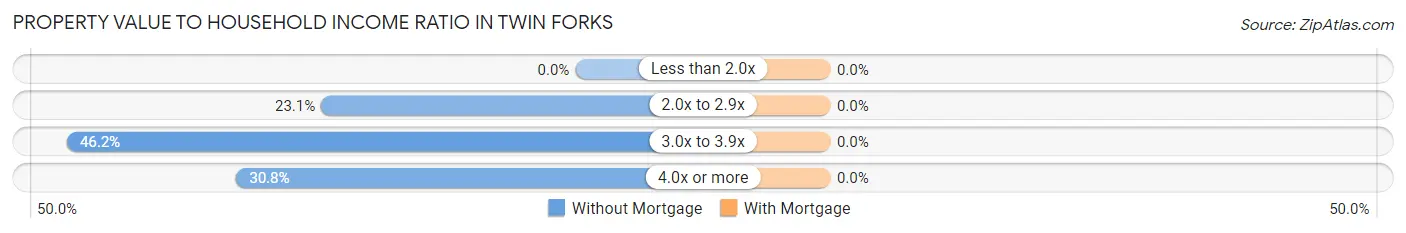
| Value-to-Income Ratio | Without Mortgage | With Mortgage |
| Less than 2.0x | 0 (0.0%) | 0 (0.0%) |
| 2.0x to 2.9x | 9 (23.1%) | 0 (0.0%) |
| 3.0x to 3.9x | 18 (46.2%) | 0 (0.0%) |
| 4.0x or more | 12 (30.8%) | 0 (0.0%) |
| Total | 39 (100.0%) | 7 (100.0%) |
Real Estate Taxes by Mortgage Status in Twin Forks
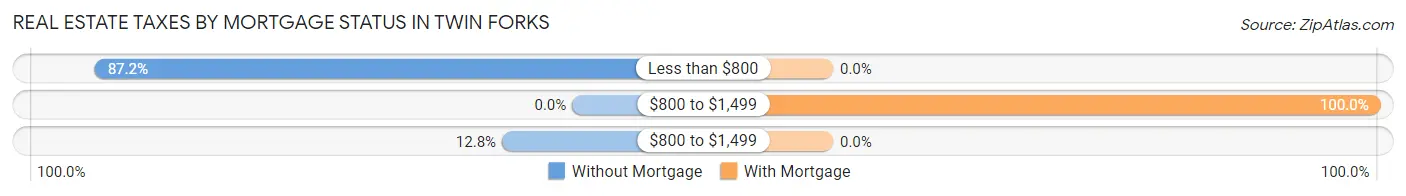
| Property Taxes | Without Mortgage | With Mortgage |
| Less than $800 | 34 (87.2%) | 0 (0.0%) |
| $800 to $1,499 | 0 (0.0%) | 7 (100.0%) |
| $800 to $1,499 | 5 (12.8%) | 0 (0.0%) |
| Total | 39 (100.0%) | 7 (100.0%) |
Health & Disability in Twin Forks
Health Insurance Coverage by Age in Twin Forks
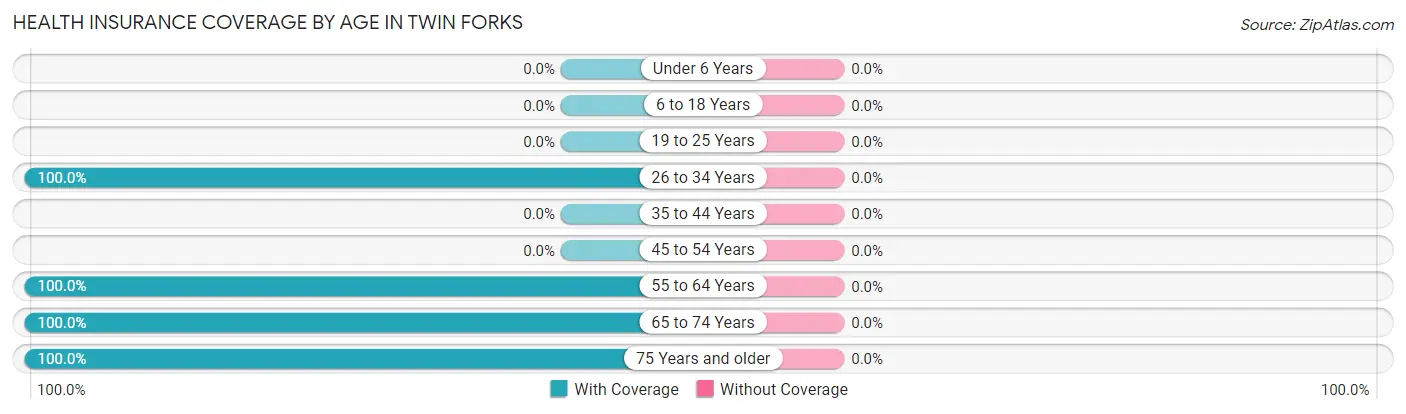
| Age Bracket | With Coverage | Without Coverage |
| Under 6 Years | 0 (0.0%) | 0 (0.0%) |
| 6 to 18 Years | 0 (0.0%) | 0 (0.0%) |
| 19 to 25 Years | 0 (0.0%) | 0 (0.0%) |
| 26 to 34 Years | 20 (100.0%) | 0 (0.0%) |
| 35 to 44 Years | 0 (0.0%) | 0 (0.0%) |
| 45 to 54 Years | 0 (0.0%) | 0 (0.0%) |
| 55 to 64 Years | 125 (100.0%) | 0 (0.0%) |
| 65 to 74 Years | 76 (100.0%) | 0 (0.0%) |
| 75 Years and older | 16 (100.0%) | 0 (0.0%) |
| Total | 237 (100.0%) | 0 (0.0%) |
Health Insurance Coverage by Citizenship Status in Twin Forks
| Citizenship Status | With Coverage | Without Coverage |
| Native Born | 0 (0.0%) | 0 (0.0%) |
| Foreign Born, Citizen | 0 (0.0%) | 0 (0.0%) |
| Foreign Born, not a Citizen | 0 (0.0%) | 0 (0.0%) |
Health Insurance Coverage by Household Income in Twin Forks
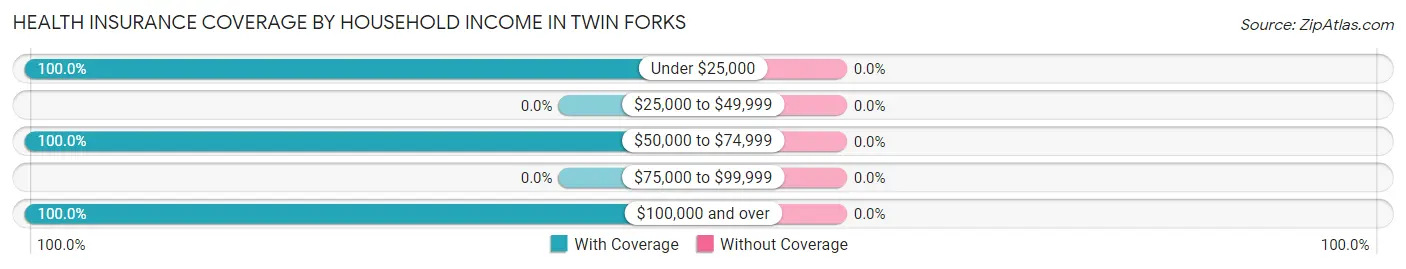
| Household Income | With Coverage | Without Coverage |
| Under $25,000 | 170 (100.0%) | 0 (0.0%) |
| $25,000 to $49,999 | 0 (0.0%) | 0 (0.0%) |
| $50,000 to $74,999 | 18 (100.0%) | 0 (0.0%) |
| $75,000 to $99,999 | 0 (0.0%) | 0 (0.0%) |
| $100,000 and over | 49 (100.0%) | 0 (0.0%) |
Public vs Private Health Insurance Coverage by Age in Twin Forks
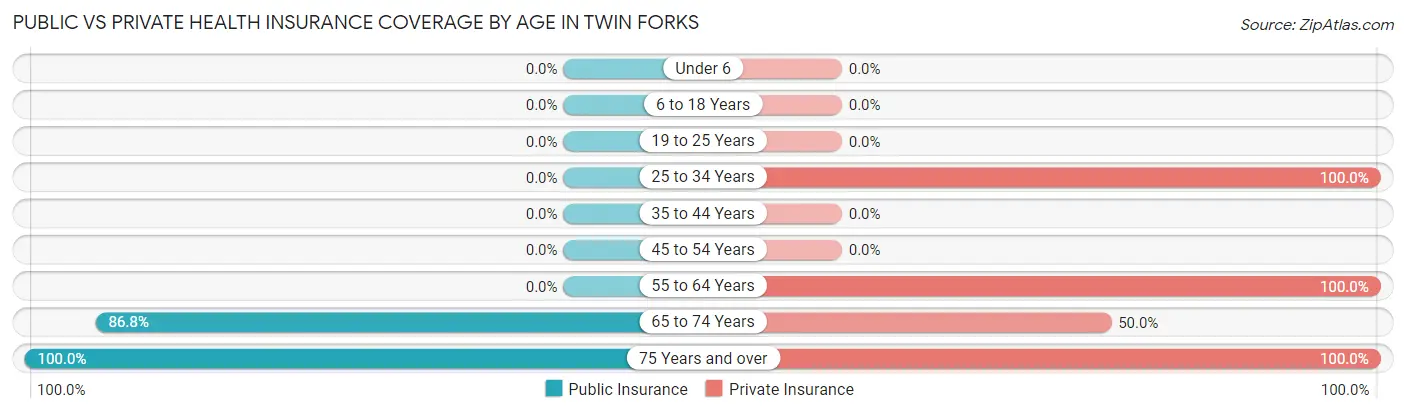
| Age Bracket | Public Insurance | Private Insurance |
| Under 6 | 0 (0.0%) | 0 (0.0%) |
| 6 to 18 Years | 0 (0.0%) | 0 (0.0%) |
| 19 to 25 Years | 0 (0.0%) | 0 (0.0%) |
| 25 to 34 Years | 0 (0.0%) | 20 (100.0%) |
| 35 to 44 Years | 0 (0.0%) | 0 (0.0%) |
| 45 to 54 Years | 0 (0.0%) | 0 (0.0%) |
| 55 to 64 Years | 0 (0.0%) | 125 (100.0%) |
| 65 to 74 Years | 66 (86.8%) | 38 (50.0%) |
| 75 Years and over | 16 (100.0%) | 16 (100.0%) |
| Total | 82 (34.6%) | 199 (84.0%) |
Disability Status by Sex by Age in Twin Forks
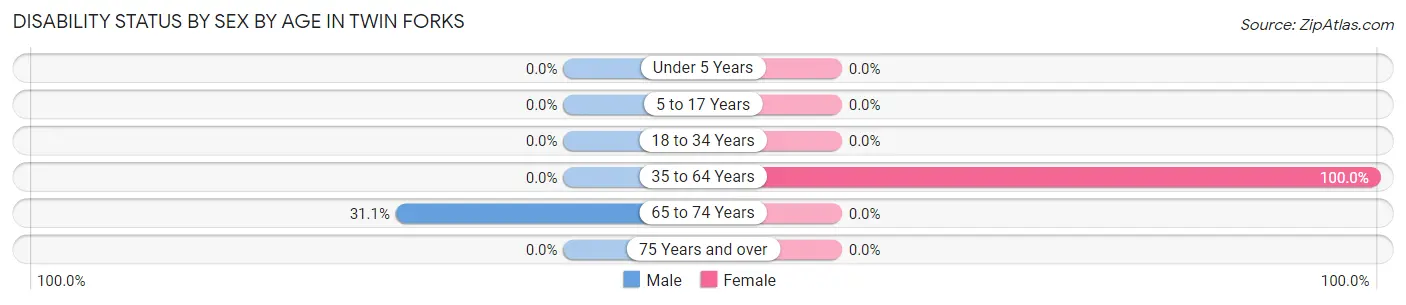
| Age Bracket | Male | Female |
| Under 5 Years | 0 (0.0%) | 0 (0.0%) |
| 5 to 17 Years | 0 (0.0%) | 0 (0.0%) |
| 18 to 34 Years | 0 (0.0%) | 0 (0.0%) |
| 35 to 64 Years | 0 (0.0%) | 125 (100.0%) |
| 65 to 74 Years | 14 (31.1%) | 0 (0.0%) |
| 75 Years and over | 0 (0.0%) | 0 (0.0%) |
Disability Class by Sex by Age in Twin Forks
Disability Class: Hearing Difficulty
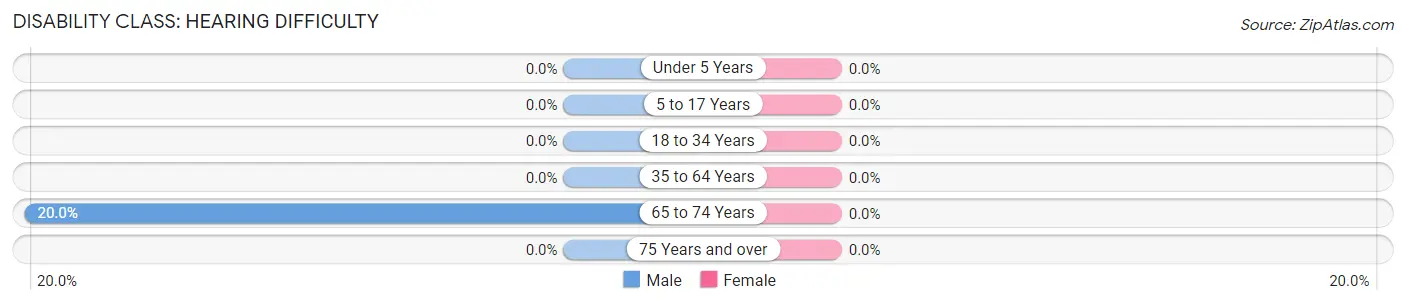
| Age Bracket | Male | Female |
| Under 5 Years | 0 (0.0%) | 0 (0.0%) |
| 5 to 17 Years | 0 (0.0%) | 0 (0.0%) |
| 18 to 34 Years | 0 (0.0%) | 0 (0.0%) |
| 35 to 64 Years | 0 (0.0%) | 0 (0.0%) |
| 65 to 74 Years | 9 (20.0%) | 0 (0.0%) |
| 75 Years and over | 0 (0.0%) | 0 (0.0%) |
Disability Class: Vision Difficulty
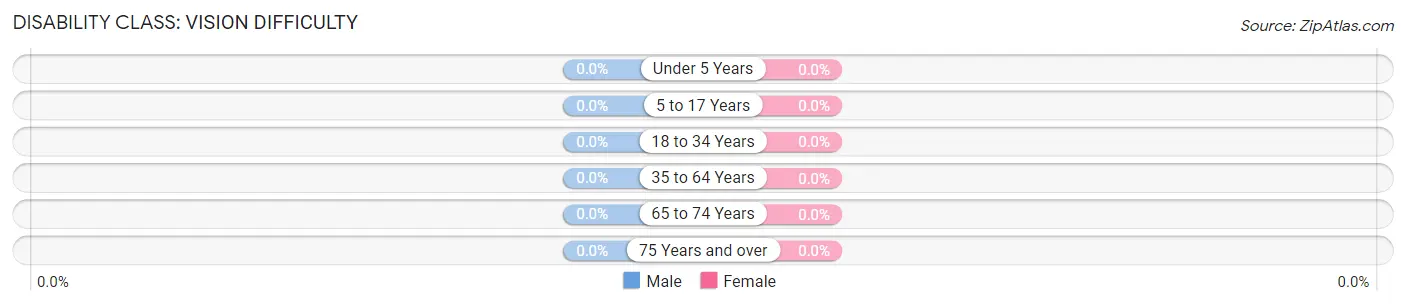
| Age Bracket | Male | Female |
| Under 5 Years | 0 (0.0%) | 0 (0.0%) |
| 5 to 17 Years | 0 (0.0%) | 0 (0.0%) |
| 18 to 34 Years | 0 (0.0%) | 0 (0.0%) |
| 35 to 64 Years | 0 (0.0%) | 0 (0.0%) |
| 65 to 74 Years | 0 (0.0%) | 0 (0.0%) |
| 75 Years and over | 0 (0.0%) | 0 (0.0%) |
Disability Class: Cognitive Difficulty
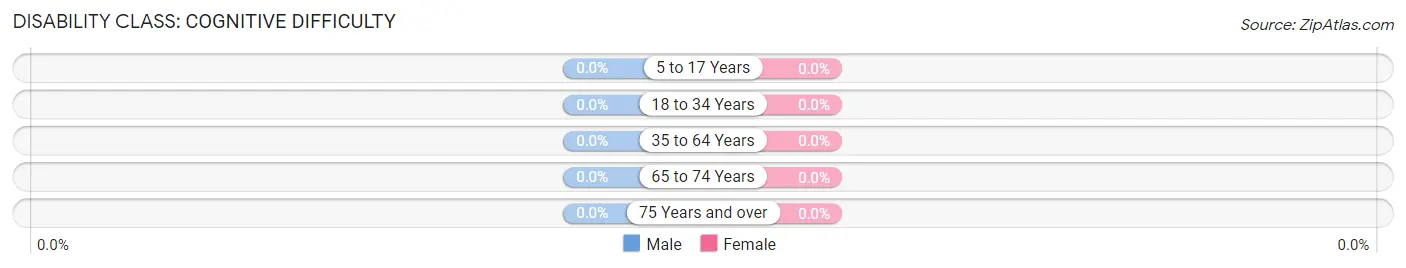
| Age Bracket | Male | Female |
| 5 to 17 Years | 0 (0.0%) | 0 (0.0%) |
| 18 to 34 Years | 0 (0.0%) | 0 (0.0%) |
| 35 to 64 Years | 0 (0.0%) | 0 (0.0%) |
| 65 to 74 Years | 0 (0.0%) | 0 (0.0%) |
| 75 Years and over | 0 (0.0%) | 0 (0.0%) |
Disability Class: Ambulatory Difficulty
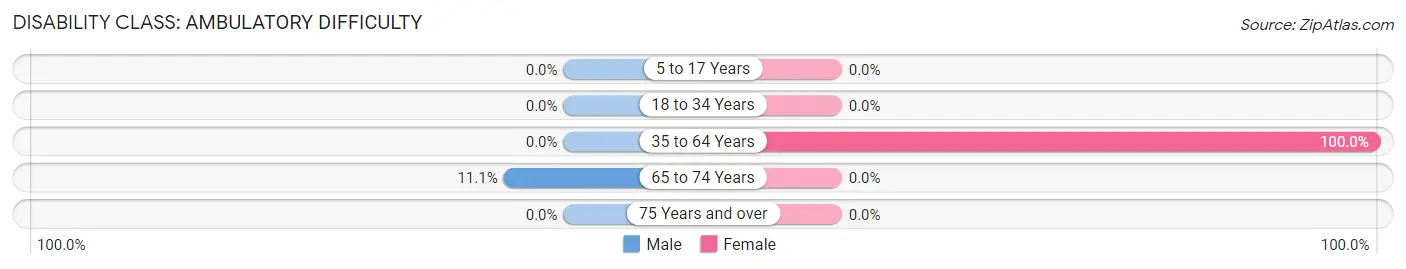
| Age Bracket | Male | Female |
| 5 to 17 Years | 0 (0.0%) | 0 (0.0%) |
| 18 to 34 Years | 0 (0.0%) | 0 (0.0%) |
| 35 to 64 Years | 0 (0.0%) | 125 (100.0%) |
| 65 to 74 Years | 5 (11.1%) | 0 (0.0%) |
| 75 Years and over | 0 (0.0%) | 0 (0.0%) |
Disability Class: Self-Care Difficulty
| Age Bracket | Male | Female |
| 5 to 17 Years | 0 (0.0%) | 0 (0.0%) |
| 18 to 34 Years | 0 (0.0%) | 0 (0.0%) |
| 35 to 64 Years | 0 (0.0%) | 0 (0.0%) |
| 65 to 74 Years | 0 (0.0%) | 0 (0.0%) |
| 75 Years and over | 0 (0.0%) | 0 (0.0%) |
Technology Access in Twin Forks
Computing Device Access in Twin Forks
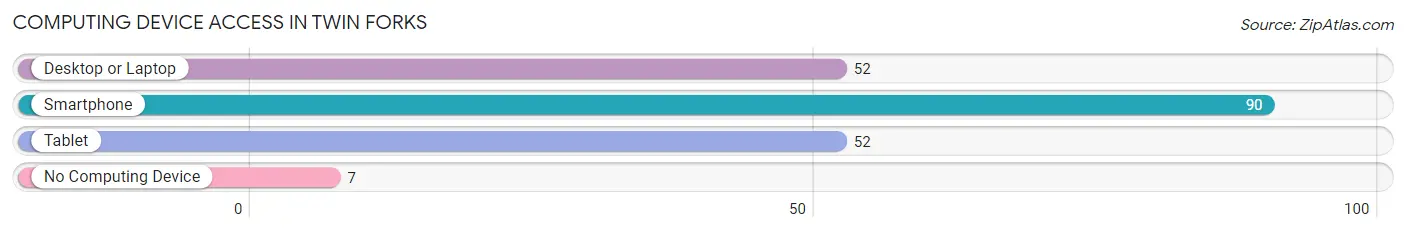
| Device Type | # Households | % Households |
| Desktop or Laptop | 52 | 53.6% |
| Smartphone | 90 | 92.8% |
| Tablet | 52 | 53.6% |
| No Computing Device | 7 | 7.2% |
| Total | 97 | 100.0% |
Internet Access in Twin Forks
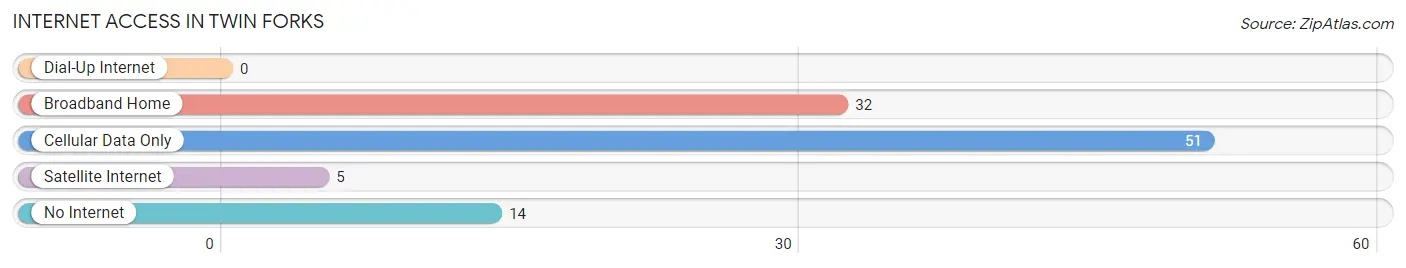
| Internet Type | # Households | % Households |
| Dial-Up Internet | 0 | 0.0% |
| Broadband Home | 32 | 33.0% |
| Cellular Data Only | 51 | 52.6% |
| Satellite Internet | 5 | 5.1% |
| No Internet | 14 | 14.4% |
| Total | 97 | 100.0% |
Twin Forks Summary
Twin Forks, New Mexico is a small town located in the southeastern corner of the state. It is situated in the foothills of the Sangre de Cristo Mountains, and is surrounded by the vast expanse of the Chihuahuan Desert. The town is home to a population of just over 1,000 people, and is known for its unique blend of cultures, including Native American, Hispanic, and Anglo-American.
Geography
Twin Forks is located in the southeastern corner of New Mexico, in the foothills of the Sangre de Cristo Mountains. The town is situated at an elevation of 4,800 feet, and is surrounded by the vast expanse of the Chihuahuan Desert. The town is located approximately 30 miles from the Texas border, and is approximately 100 miles from El Paso, Texas.
The town is situated in a semi-arid climate, with hot summers and mild winters. The average annual temperature is approximately 65 degrees Fahrenheit, with an average annual precipitation of approximately 12 inches.
Economy
Twin Forks is a small, rural town, and the economy is largely based on agriculture and ranching. The town is home to several small farms and ranches, which produce a variety of crops, including alfalfa, corn, wheat, and hay. The town is also home to several small businesses, including a grocery store, a hardware store, and a few restaurants.
The town is also home to a small tourism industry, which is largely based on the nearby Gila National Forest. The forest is home to a variety of wildlife, including elk, deer, and bighorn sheep, and is a popular destination for hikers, campers, and hunters.
Demographics
As of the 2010 census, the population of Twin Forks was 1,072. The town is approximately 70% Hispanic, 20% Native American, and 10% Anglo-American. The median household income is approximately $30,000, and the median age is approximately 35 years old.
The town is home to a variety of religious denominations, including Catholic, Protestant, and Mormon. The town is also home to a variety of cultural events, including the annual Twin Forks Fiesta, which celebrates the town's unique blend of cultures.
Conclusion
Twin Forks, New Mexico is a small, rural town located in the southeastern corner of the state. The town is home to a population of just over 1,000 people, and is known for its unique blend of cultures, including Native American, Hispanic, and Anglo-American. The town is situated in a semi-arid climate, and the economy is largely based on agriculture and ranching. The town is also home to a small tourism industry, which is largely based on the nearby Gila National Forest. The town is approximately 70% Hispanic, 20% Native American, and 10% Anglo-American, and is home to a variety of religious denominations. The town is also home to a variety of cultural events, including the annual Twin Forks Fiesta, which celebrates the town's unique blend of cultures.
Common Questions
What is Per Capita Income in Twin Forks?
Per Capita income in Twin Forks is $27,338.
What is Inequality or Gini Index in Twin Forks?
Inequality or Gini Index in Twin Forks is 0.47.
What is the Total Population of Twin Forks?
Total Population of Twin Forks is 237.
What is the Total Male Population of Twin Forks?
Total Male Population of Twin Forks is 65.
What is the Total Female Population of Twin Forks?
Total Female Population of Twin Forks is 172.
What is the Ratio of Males per 100 Females in Twin Forks?
There are 37.79 Males per 100 Females in Twin Forks.
What is the Ratio of Females per 100 Males in Twin Forks?
There are 264.62 Females per 100 Males in Twin Forks.
What is the Median Population Age in Twin Forks?
Median Population Age in Twin Forks is 58.8 Years.
What is the Average Family Size in Twin Forks
Average Family Size in Twin Forks is 7.7 People.
What is the Average Household Size in Twin Forks
Average Household Size in Twin Forks is 2.4 People.
How Large is the Labor Force in Twin Forks?
There are 25 People in the Labor Forcein in Twin Forks.
What is the Percentage of People in the Labor Force in Twin Forks?
10.5% of People are in the Labor Force in Twin Forks.