House, NM Map & Demographics
House Map
House Overview
$19,472
PER CAPITA INCOME
0.50
INEQUALITY / GINI INDEX
57
TOTAL POPULATION
26
MALE POPULATION
31
FEMALE POPULATION
83.87
MALES / 100 FEMALES
119.23
FEMALES / 100 MALES
60.5
MEDIAN AGE
3.0
AVG FAMILY SIZE
2.0
AVG HOUSEHOLD SIZE
9
LABOR FORCE [ PEOPLE ]
17.0%
PERCENT IN LABOR FORCE
House Zip Codes
House Area Codes
Income in House
Income Overview in House
| Characteristic | Number | Measure |
| Per Capita Income | 57 | $19,472 |
| Median Family Income | 14 | $0 |
| Mean Family Income | 14 | $42,686 |
| Median Household Income | 29 | $0 |
| Mean Household Income | 29 | $32,972 |
| Income Deficit | 14 | $0 |
| Wage / Income Gap (%) | 57 | 0.00% |
| Wage / Income Gap ($) | 57 | 100.00¢ per $1 |
| Gini / Inequality Index | 57 | 0.50 |
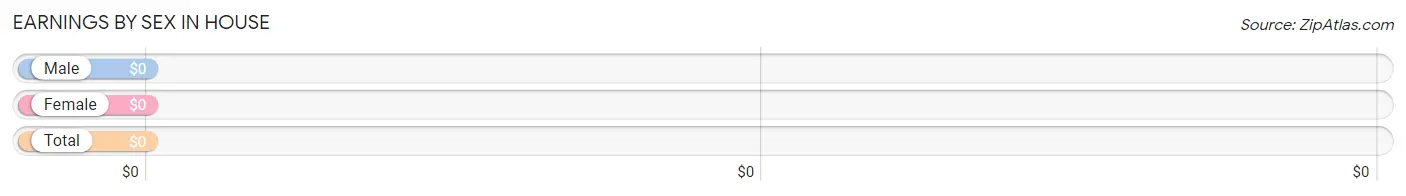
Earnings by Sex in House
| Sex | Number | Average Earnings |
| Male | 12 (70.6%) | $0 |
| Female | 5 (29.4%) | $0 |
| Total | 17 (100.0%) | $0 |
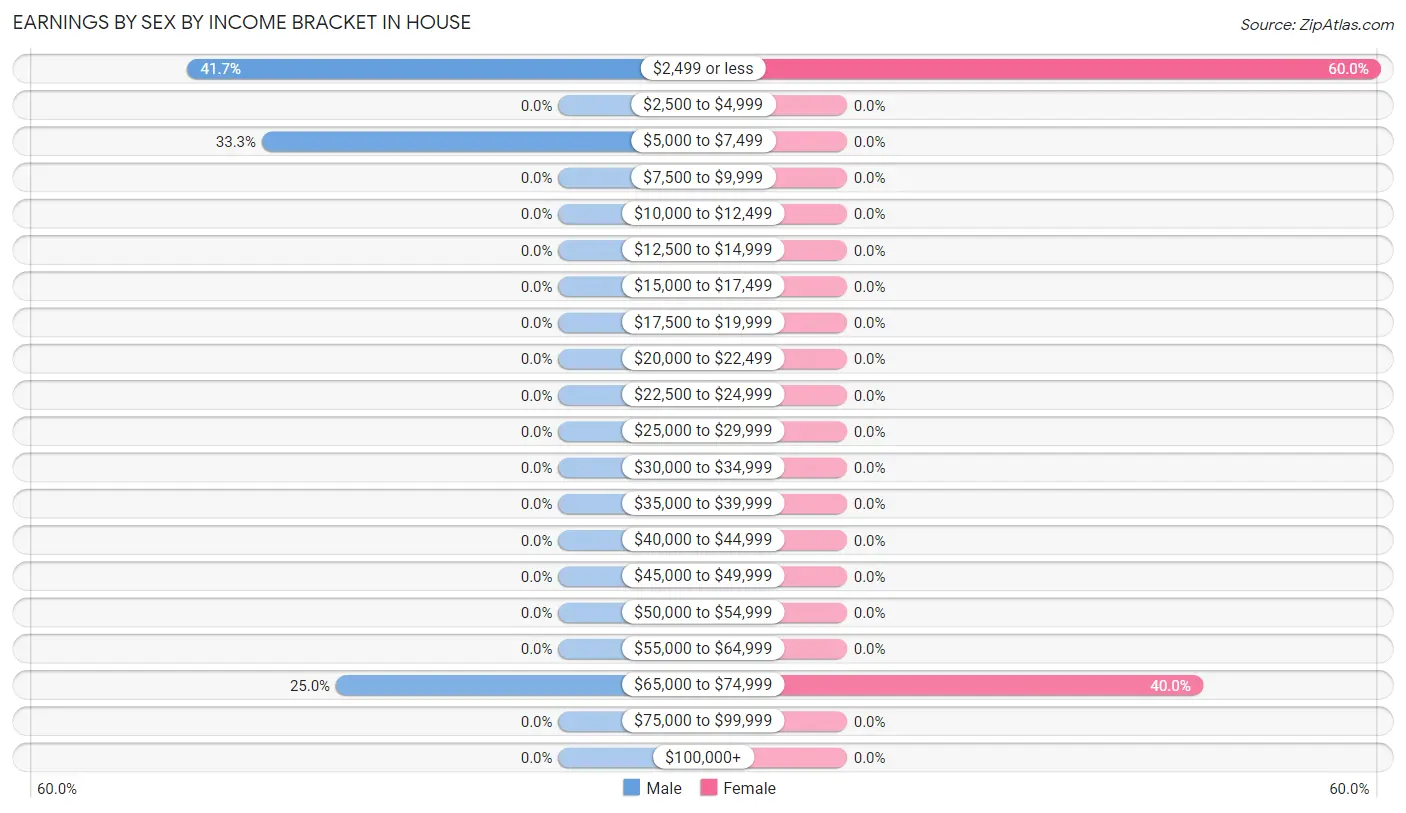
Earnings by Sex by Income Bracket in House
The most common earnings brackets in House are $2,499 or less for men (5 | 41.7%) and $2,499 or less for women (3 | 60.0%).
| Income | Male | Female |
| $2,499 or less | 5 (41.7%) | 3 (60.0%) |
| $2,500 to $4,999 | 0 (0.0%) | 0 (0.0%) |
| $5,000 to $7,499 | 4 (33.3%) | 0 (0.0%) |
| $7,500 to $9,999 | 0 (0.0%) | 0 (0.0%) |
| $10,000 to $12,499 | 0 (0.0%) | 0 (0.0%) |
| $12,500 to $14,999 | 0 (0.0%) | 0 (0.0%) |
| $15,000 to $17,499 | 0 (0.0%) | 0 (0.0%) |
| $17,500 to $19,999 | 0 (0.0%) | 0 (0.0%) |
| $20,000 to $22,499 | 0 (0.0%) | 0 (0.0%) |
| $22,500 to $24,999 | 0 (0.0%) | 0 (0.0%) |
| $25,000 to $29,999 | 0 (0.0%) | 0 (0.0%) |
| $30,000 to $34,999 | 0 (0.0%) | 0 (0.0%) |
| $35,000 to $39,999 | 0 (0.0%) | 0 (0.0%) |
| $40,000 to $44,999 | 0 (0.0%) | 0 (0.0%) |
| $45,000 to $49,999 | 0 (0.0%) | 0 (0.0%) |
| $50,000 to $54,999 | 0 (0.0%) | 0 (0.0%) |
| $55,000 to $64,999 | 0 (0.0%) | 0 (0.0%) |
| $65,000 to $74,999 | 3 (25.0%) | 2 (40.0%) |
| $75,000 to $99,999 | 0 (0.0%) | 0 (0.0%) |
| $100,000+ | 0 (0.0%) | 0 (0.0%) |
| Total | 12 (100.0%) | 5 (100.0%) |
Earnings by Sex by Educational Attainment in House
| Educational Attainment | Male Income | Female Income |
| Less than High School | - | - |
| High School Diploma | - | - |
| College or Associate's Degree | - | - |
| Bachelor's Degree | - | - |
| Graduate Degree | - | - |
| Total | - | - |
Family Income in House
Family Income Brackets in House
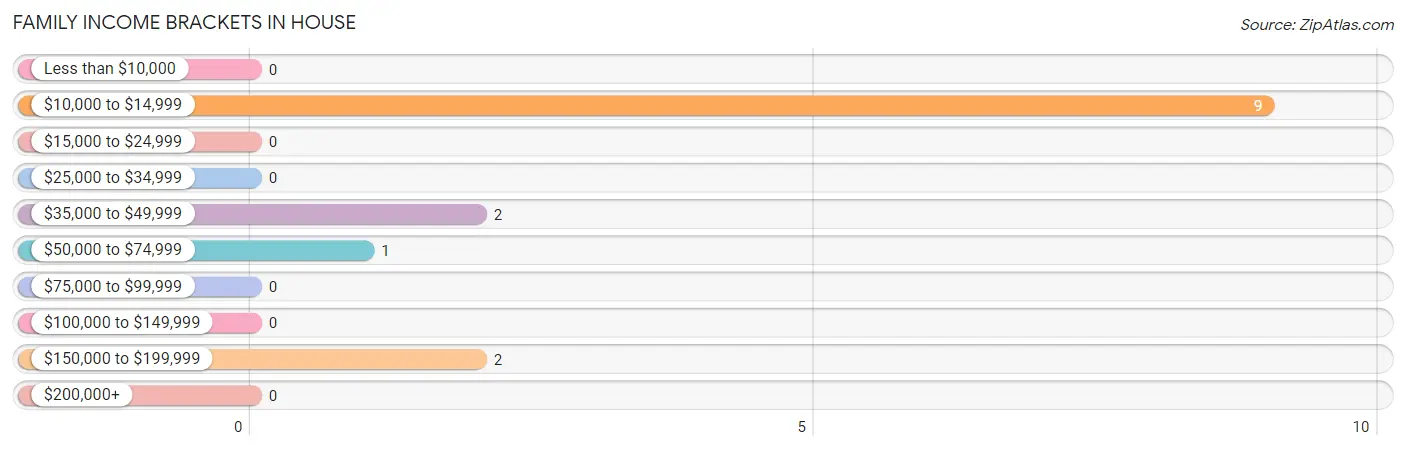
According to the House family income data, there are 9 families falling into the $10,000 to $14,999 income range, which is the most common income bracket and makes up 64.3% of all families.
| Income Bracket | # Families | % Families |
| Less than $10,000 | 0 | 0.0% |
| $10,000 to $14,999 | 9 | 64.3% |
| $15,000 to $24,999 | 0 | 0.0% |
| $25,000 to $34,999 | 0 | 0.0% |
| $35,000 to $49,999 | 2 | 14.3% |
| $50,000 to $74,999 | 1 | 7.1% |
| $75,000 to $99,999 | 0 | 0.0% |
| $100,000 to $149,999 | 0 | 0.0% |
| $150,000 to $199,999 | 2 | 14.3% |
| $200,000+ | 0 | 0.0% |
Family Income by Famaliy Size in House
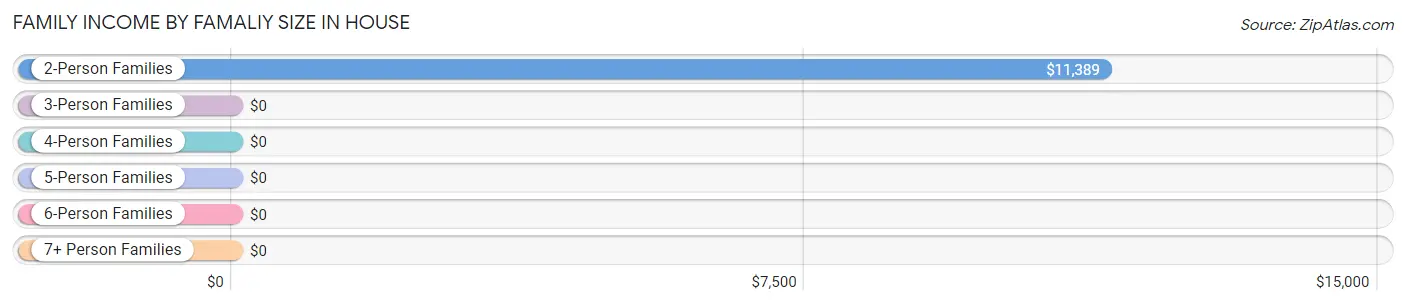
2-person families (10 | 71.4%) account for the highest median family income in House with $11,389 per family, while 2-person families (10 | 71.4%) have the highest median income of $5,694 per family member.
| Income Bracket | # Families | Median Income |
| 2-Person Families | 10 (71.4%) | $11,389 |
| 3-Person Families | 4 (28.6%) | $0 |
| 4-Person Families | 0 (0.0%) | $0 |
| 5-Person Families | 0 (0.0%) | $0 |
| 6-Person Families | 0 (0.0%) | $0 |
| 7+ Person Families | 0 (0.0%) | $0 |
| Total | 14 (100.0%) | $0 |
Family Income by Number of Earners in House
| Number of Earners | # Families | Median Income |
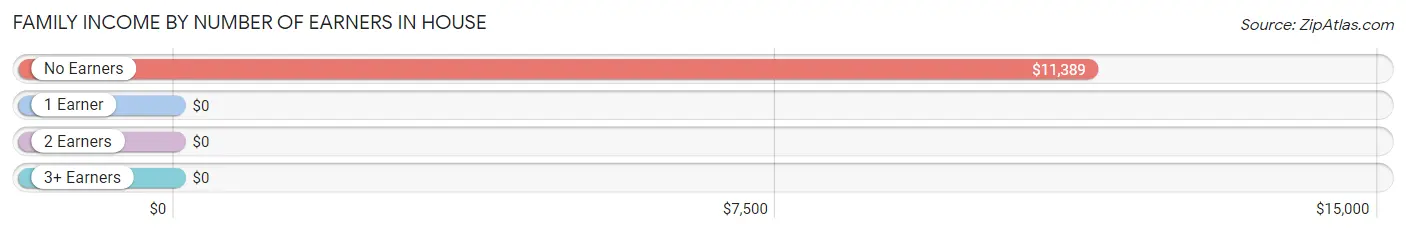
| No Earners | 10 (71.4%) | $11,389 |
| 1 Earner | 0 (0.0%) | $0 |
| 2 Earners | 4 (28.6%) | $0 |
| 3+ Earners | 0 (0.0%) | $0 |
| Total | 14 (100.0%) | $0 |
Household Income in House
Household Income Brackets in House
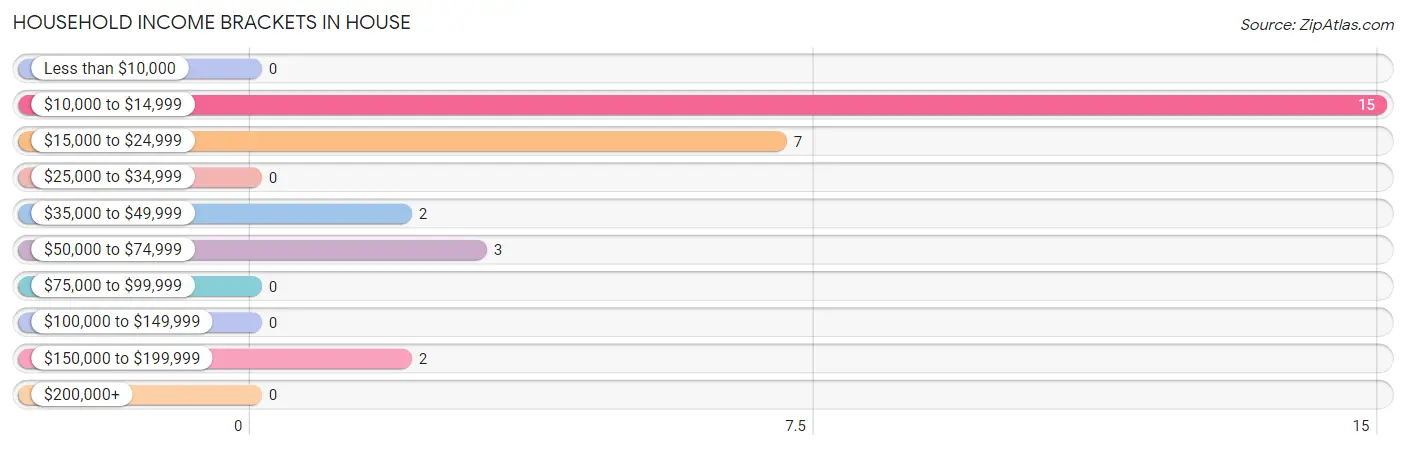
With 15 households falling in the category, the $10,000 to $14,999 income range is the most frequent in House, accounting for 51.7% of all households.
| Income Bracket | # Households | % Households |
| Less than $10,000 | 0 | 0.0% |
| $10,000 to $14,999 | 15 | 51.7% |
| $15,000 to $24,999 | 7 | 24.1% |
| $25,000 to $34,999 | 0 | 0.0% |
| $35,000 to $49,999 | 2 | 6.9% |
| $50,000 to $74,999 | 3 | 10.3% |
| $75,000 to $99,999 | 0 | 0.0% |
| $100,000 to $149,999 | 0 | 0.0% |
| $150,000 to $199,999 | 2 | 6.9% |
| $200,000+ | 0 | 0.0% |
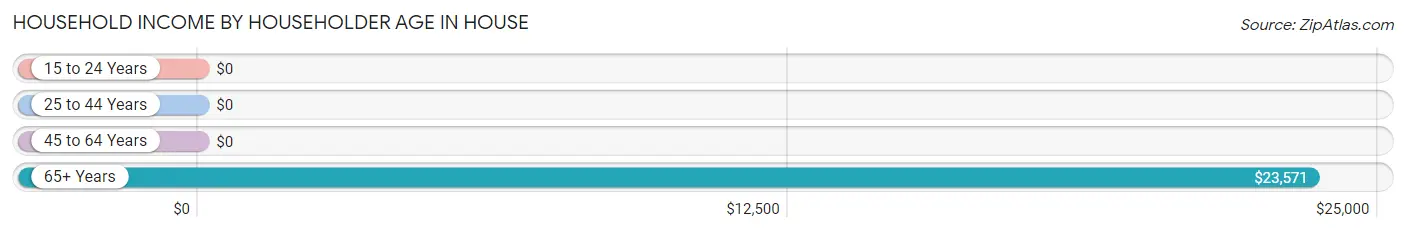
Household Income by Householder Age in House
The median household income in House is $0, with the highest median household income of $23,571 found in the 65+ years age bracket for the primary householder. A total of 18 households (62.1%) fall into this category.
| Income Bracket | # Households | Median Income |
| 15 to 24 Years | 0 (0.0%) | $0 |
| 25 to 44 Years | 0 (0.0%) | $0 |
| 45 to 64 Years | 11 (37.9%) | $0 |
| 65+ Years | 18 (62.1%) | $23,571 |
| Total | 29 (100.0%) | $0 |
Poverty in House
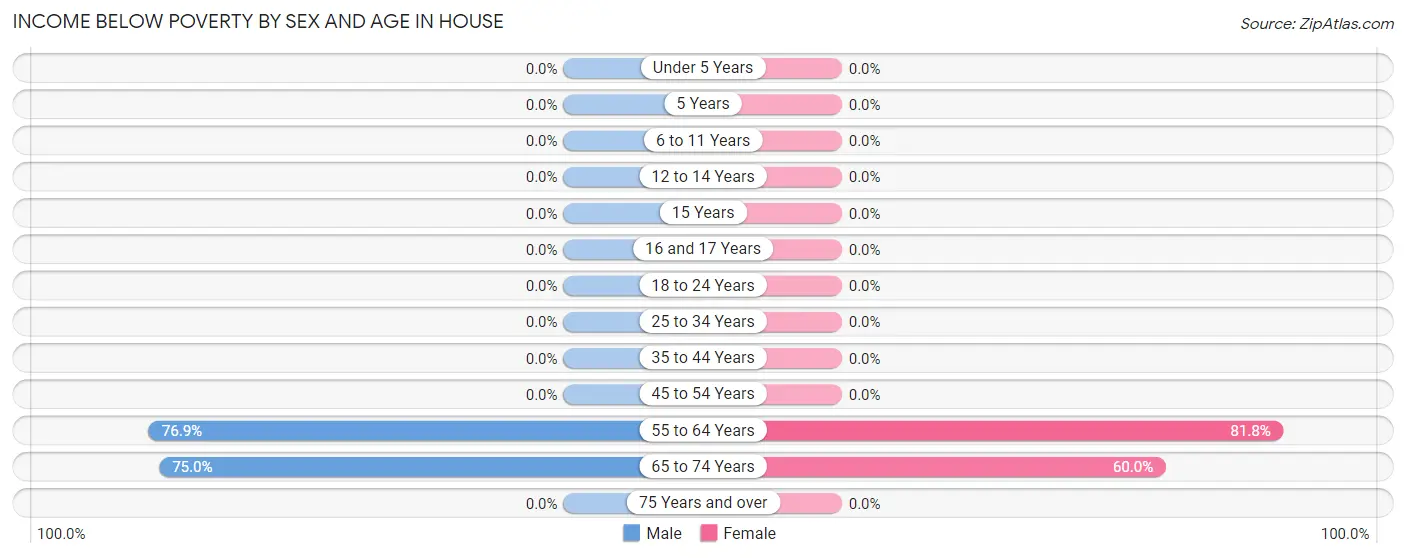
Income Below Poverty by Sex and Age in House
With 50.0% poverty level for males and 38.7% for females among the residents of House, 55 to 64 year old males and 55 to 64 year old females are the most vulnerable to poverty, with 10 males (76.9%) and 9 females (81.8%) in their respective age groups living below the poverty level.
| Age Bracket | Male | Female |
| Under 5 Years | 0 (0.0%) | 0 (0.0%) |
| 5 Years | 0 (0.0%) | 0 (0.0%) |
| 6 to 11 Years | 0 (0.0%) | 0 (0.0%) |
| 12 to 14 Years | 0 (0.0%) | 0 (0.0%) |
| 15 Years | 0 (0.0%) | 0 (0.0%) |
| 16 and 17 Years | 0 (0.0%) | 0 (0.0%) |
| 18 to 24 Years | 0 (0.0%) | 0 (0.0%) |
| 25 to 34 Years | 0 (0.0%) | 0 (0.0%) |
| 35 to 44 Years | 0 (0.0%) | 0 (0.0%) |
| 45 to 54 Years | 0 (0.0%) | 0 (0.0%) |
| 55 to 64 Years | 10 (76.9%) | 9 (81.8%) |
| 65 to 74 Years | 3 (75.0%) | 3 (60.0%) |
| 75 Years and over | 0 (0.0%) | 0 (0.0%) |
| Total | 13 (50.0%) | 12 (38.7%) |
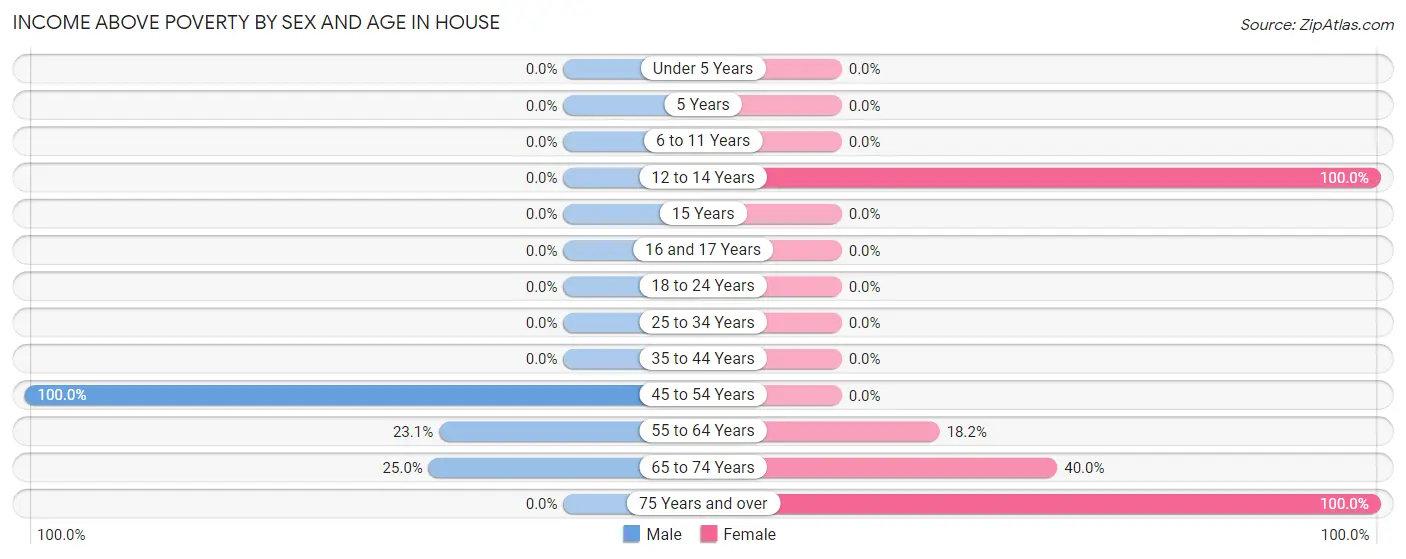
Income Above Poverty by Sex and Age in House
According to the poverty statistics in House, males aged 45 to 54 years and females aged 12 to 14 years are the age groups that are most secure financially, with 100.0% of males and 100.0% of females in these age groups living above the poverty line.
| Age Bracket | Male | Female |
| Under 5 Years | 0 (0.0%) | 0 (0.0%) |
| 5 Years | 0 (0.0%) | 0 (0.0%) |
| 6 to 11 Years | 0 (0.0%) | 0 (0.0%) |
| 12 to 14 Years | 0 (0.0%) | 4 (100.0%) |
| 15 Years | 0 (0.0%) | 0 (0.0%) |
| 16 and 17 Years | 0 (0.0%) | 0 (0.0%) |
| 18 to 24 Years | 0 (0.0%) | 0 (0.0%) |
| 25 to 34 Years | 0 (0.0%) | 0 (0.0%) |
| 35 to 44 Years | 0 (0.0%) | 0 (0.0%) |
| 45 to 54 Years | 9 (100.0%) | 0 (0.0%) |
| 55 to 64 Years | 3 (23.1%) | 2 (18.2%) |
| 65 to 74 Years | 1 (25.0%) | 2 (40.0%) |
| 75 Years and over | 0 (0.0%) | 11 (100.0%) |
| Total | 13 (50.0%) | 19 (61.3%) |
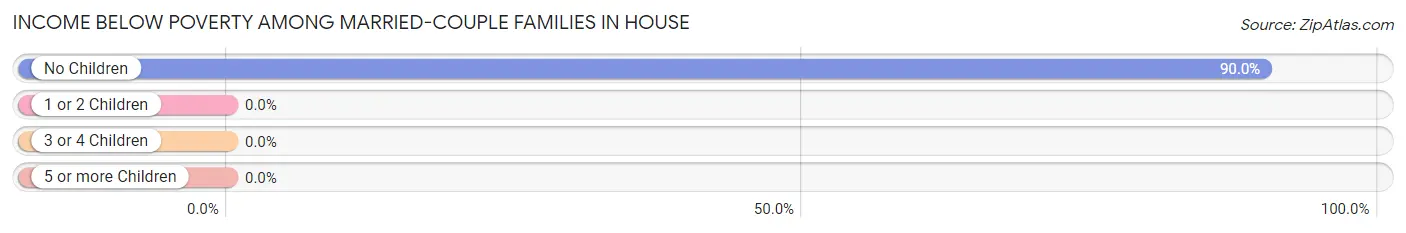
Income Below Poverty Among Married-Couple Families in House
The poverty statistics for married-couple families in House show that 75.0% or 9 of the total 12 families live below the poverty line. Families with no children have the highest poverty rate of 90.0%, comprising of 9 families. On the other hand, families with 1 or 2 children have the lowest poverty rate of 0.0%, which includes 0 families.
| Children | Above Poverty | Below Poverty |
| No Children | 1 (10.0%) | 9 (90.0%) |
| 1 or 2 Children | 2 (100.0%) | 0 (0.0%) |
| 3 or 4 Children | 0 (0.0%) | 0 (0.0%) |
| 5 or more Children | 0 (0.0%) | 0 (0.0%) |
| Total | 3 (25.0%) | 9 (75.0%) |
Income Below Poverty Among Single-Parent Households in House
| Children | Single Father | Single Mother |
| No Children | 0 (0.0%) | 0 (0.0%) |
| 1 or 2 Children | 0 (0.0%) | 0 (0.0%) |
| 3 or 4 Children | 0 (0.0%) | 0 (0.0%) |
| 5 or more Children | 0 (0.0%) | 0 (0.0%) |
| Total | 0 (0.0%) | 0 (0.0%) |
Income Below Poverty Among Married-Couple vs Single-Parent Households in House
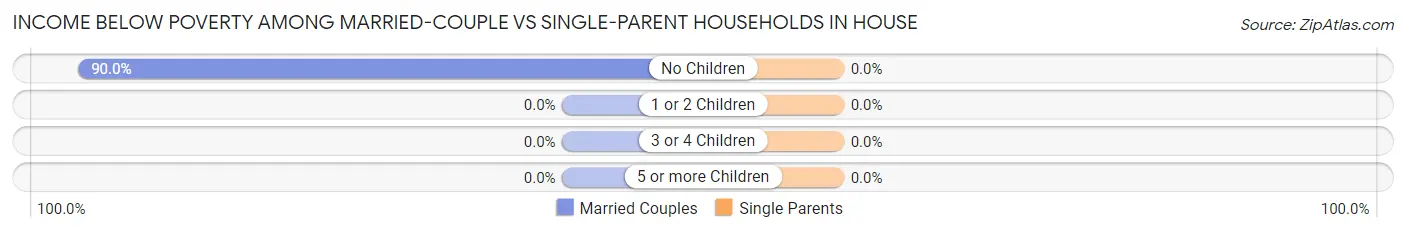
| Children | Married-Couple Families | Single-Parent Households |
| No Children | 9 (90.0%) | 0 (0.0%) |
| 1 or 2 Children | 0 (0.0%) | 0 (0.0%) |
| 3 or 4 Children | 0 (0.0%) | 0 (0.0%) |
| 5 or more Children | 0 (0.0%) | 0 (0.0%) |
| Total | 9 (75.0%) | 0 (0.0%) |
Race in House
The most populous races in House are White / Caucasian (57 | 100.0%), and Hispanic or Latino (3 | 5.3%).
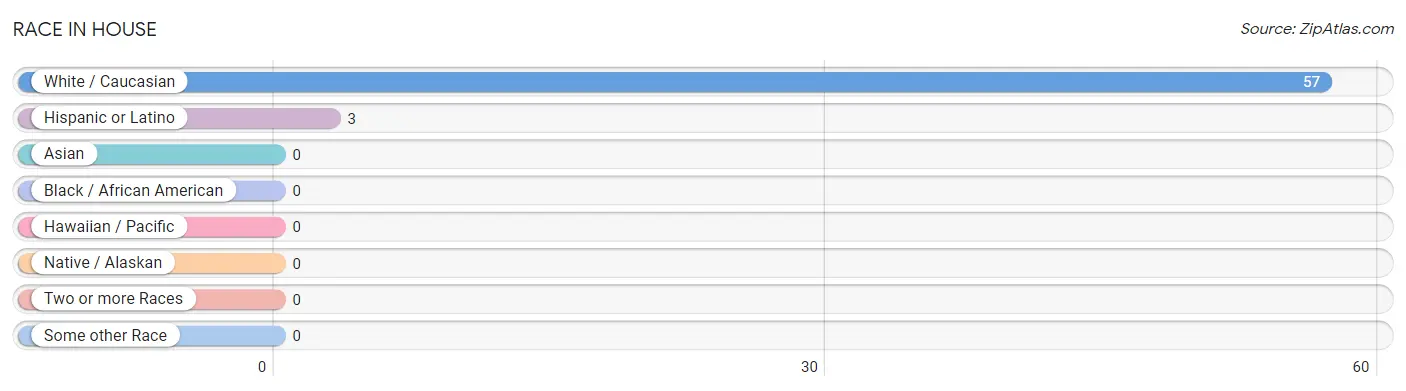
| Race | # Population | % Population |
| Asian | 0 | 0.0% |
| Black / African American | 0 | 0.0% |
| Hawaiian / Pacific | 0 | 0.0% |
| Hispanic or Latino | 3 | 5.3% |
| Native / Alaskan | 0 | 0.0% |
| White / Caucasian | 57 | 100.0% |
| Two or more Races | 0 | 0.0% |
| Some other Race | 0 | 0.0% |
| Total | 57 | 100.0% |
Ancestry in House
The most populous ancestries reported in House are German (25 | 43.9%), American (20 | 35.1%), Irish (17 | 29.8%), English (5 | 8.8%), and Mexican (3 | 5.3%), together accounting for 122.8% of all House residents.
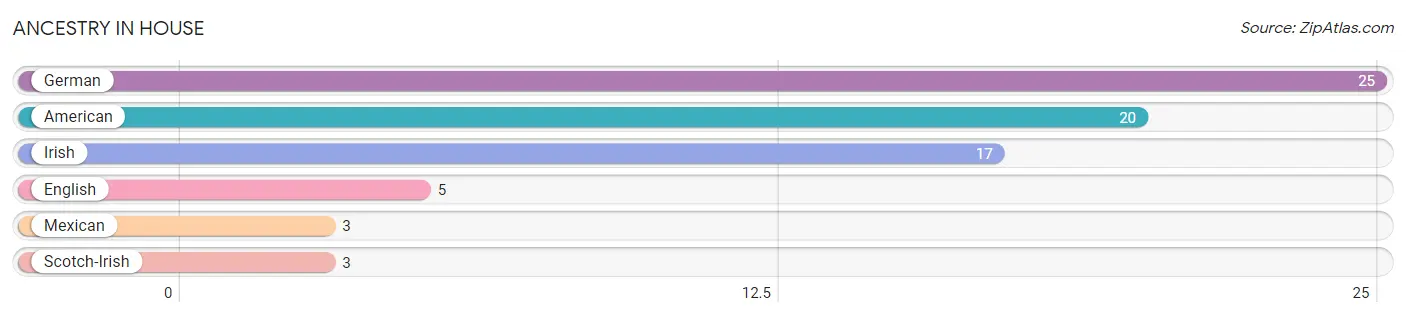
| Ancestry | # Population | % Population |
| American | 20 | 35.1% |
| English | 5 | 8.8% |
| German | 25 | 43.9% |
| Irish | 17 | 29.8% |
| Mexican | 3 | 5.3% |
| Scotch-Irish | 3 | 5.3% | View All 6 Rows |
Immigrants in House

| Immigration Origin | # Population | % Population | View All 0 Rows |
Sex and Age in House
Sex and Age in House
The most populous age groups in House are 60 to 64 Years (7 | 26.9%) for men and 60 to 64 Years (9 | 29.0%) for women.
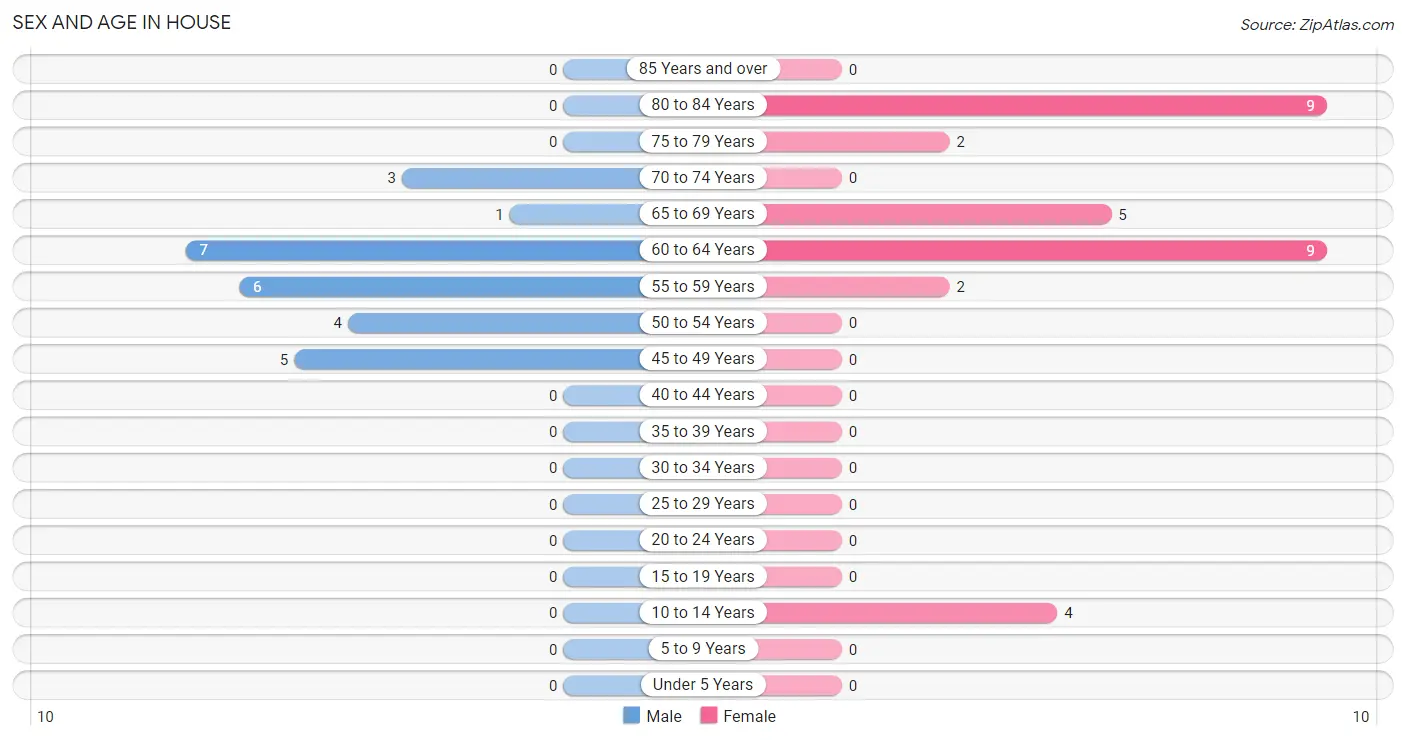
| Age Bracket | Male | Female |
| Under 5 Years | 0 (0.0%) | 0 (0.0%) |
| 5 to 9 Years | 0 (0.0%) | 0 (0.0%) |
| 10 to 14 Years | 0 (0.0%) | 4 (12.9%) |
| 15 to 19 Years | 0 (0.0%) | 0 (0.0%) |
| 20 to 24 Years | 0 (0.0%) | 0 (0.0%) |
| 25 to 29 Years | 0 (0.0%) | 0 (0.0%) |
| 30 to 34 Years | 0 (0.0%) | 0 (0.0%) |
| 35 to 39 Years | 0 (0.0%) | 0 (0.0%) |
| 40 to 44 Years | 0 (0.0%) | 0 (0.0%) |
| 45 to 49 Years | 5 (19.2%) | 0 (0.0%) |
| 50 to 54 Years | 4 (15.4%) | 0 (0.0%) |
| 55 to 59 Years | 6 (23.1%) | 2 (6.5%) |
| 60 to 64 Years | 7 (26.9%) | 9 (29.0%) |
| 65 to 69 Years | 1 (3.8%) | 5 (16.1%) |
| 70 to 74 Years | 3 (11.5%) | 0 (0.0%) |
| 75 to 79 Years | 0 (0.0%) | 2 (6.5%) |
| 80 to 84 Years | 0 (0.0%) | 9 (29.0%) |
| 85 Years and over | 0 (0.0%) | 0 (0.0%) |
| Total | 26 (100.0%) | 31 (100.0%) |
Families and Households in House
Median Family Size in House
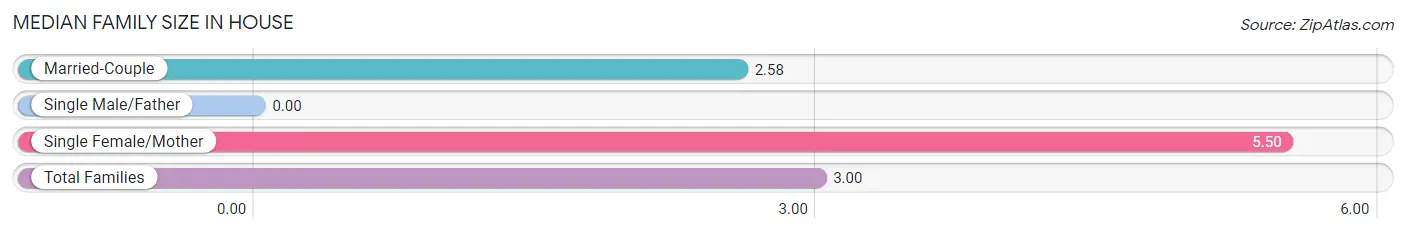
| Family Type | # Families | Family Size |
| Married-Couple | 12 (85.7%) | 2.58 |
| Single Male/Father | 0 (0.0%) | - |
| Single Female/Mother | 2 (14.3%) | 5.50 |
| Total Families | 14 (100.0%) | 3.00 |
Median Household Size in House
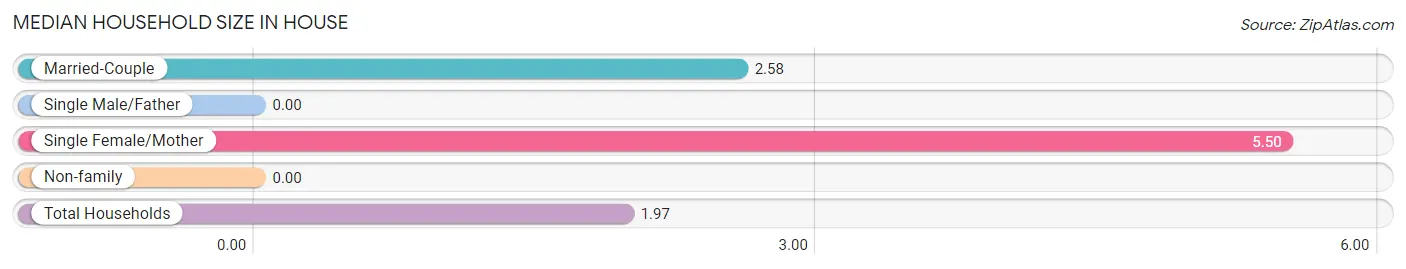
| Household Type | # Households | Household Size |
| Married-Couple | 12 (41.4%) | 2.58 |
| Single Male/Father | 0 (0.0%) | - |
| Single Female/Mother | 2 (6.9%) | 5.50 |
| Non-family | 15 (51.7%) | - |
| Total Households | 29 (100.0%) | 1.97 |
Household Size by Marriage Status in House
Out of a total of 29 households in House, 14 (48.3%) are family households, while 15 (51.7%) are nonfamily households. The most numerous type of family households are 2-person households, comprising 10, and the most common type of nonfamily households are 1-person households, comprising 15.
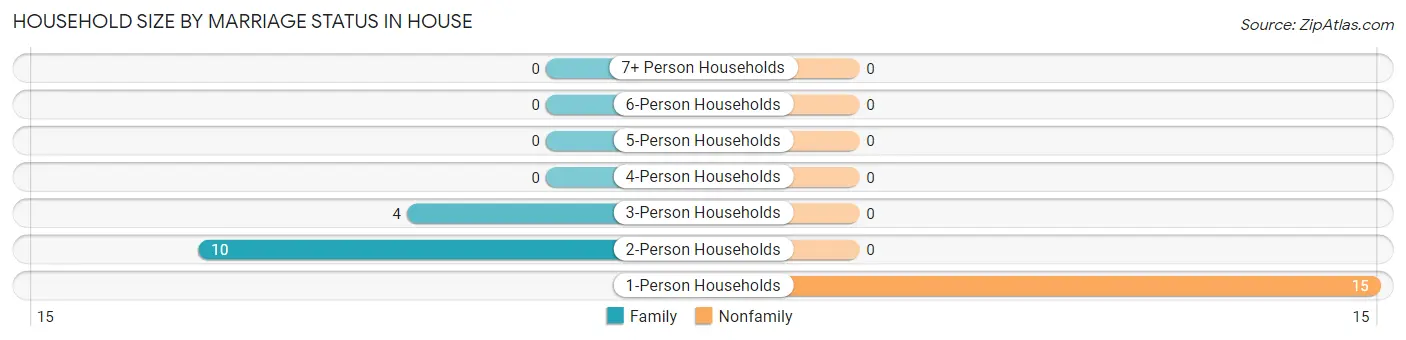
| Household Size | Family Households | Nonfamily Households |
| 1-Person Households | - | 15 (51.7%) |
| 2-Person Households | 10 (34.5%) | 0 (0.0%) |
| 3-Person Households | 4 (13.8%) | 0 (0.0%) |
| 4-Person Households | 0 (0.0%) | 0 (0.0%) |
| 5-Person Households | 0 (0.0%) | 0 (0.0%) |
| 6-Person Households | 0 (0.0%) | 0 (0.0%) |
| 7+ Person Households | 0 (0.0%) | 0 (0.0%) |
| Total | 14 (48.3%) | 15 (51.7%) |
Female Fertility in House
Fertility by Age in House
| Age Bracket | Women with Births | Births / 1,000 Women |
| 15 to 19 years | 0 (0.0%) | 0.0 |
| 20 to 34 years | 0 (0.0%) | 0.0 |
| 35 to 50 years | 0 (0.0%) | 0.0 |
| Total | 0 (0.0%) | 0.0 |
Fertility by Age by Marriage Status in House
| Age Bracket | Married | Unmarried |
| 15 to 19 years | 0 (0.0%) | 0 (0.0%) |
| 20 to 34 years | 0 (0.0%) | 0 (0.0%) |
| 35 to 50 years | 0 (0.0%) | 0 (0.0%) |
| Total | 0 (0.0%) | 0 (0.0%) |
Fertility by Education in House
| Educational Attainment | Women with Births | Births / 1,000 Women |
| Less than High School | 0 (0.0%) | 0.0 |
| High School Diploma | 0 (0.0%) | 0.0 |
| College or Associate's Degree | 0 (0.0%) | 0.0 |
| Bachelor's Degree | 0 (0.0%) | 0.0 |
| Graduate Degree | 0 (0.0%) | 0.0 |
| Total | 0 (0.0%) | 0.0 |
Fertility by Education by Marriage Status in House
| Educational Attainment | Married | Unmarried |
| Less than High School | 0 (0.0%) | 0 (0.0%) |
| High School Diploma | 0 (0.0%) | 0 (0.0%) |
| College or Associate's Degree | 0 (0.0%) | 0 (0.0%) |
| Bachelor's Degree | 0 (0.0%) | 0 (0.0%) |
| Graduate Degree | 0 (0.0%) | 0 (0.0%) |
| Total | 0 (0.0%) | 0 (0.0%) |
Employment Characteristics in House
Employment by Class of Employer in House
Among the 9 employed individuals in House, local government employees (5 | 55.6%), and private company employees (4 | 44.4%) make up the most common classes of employment.
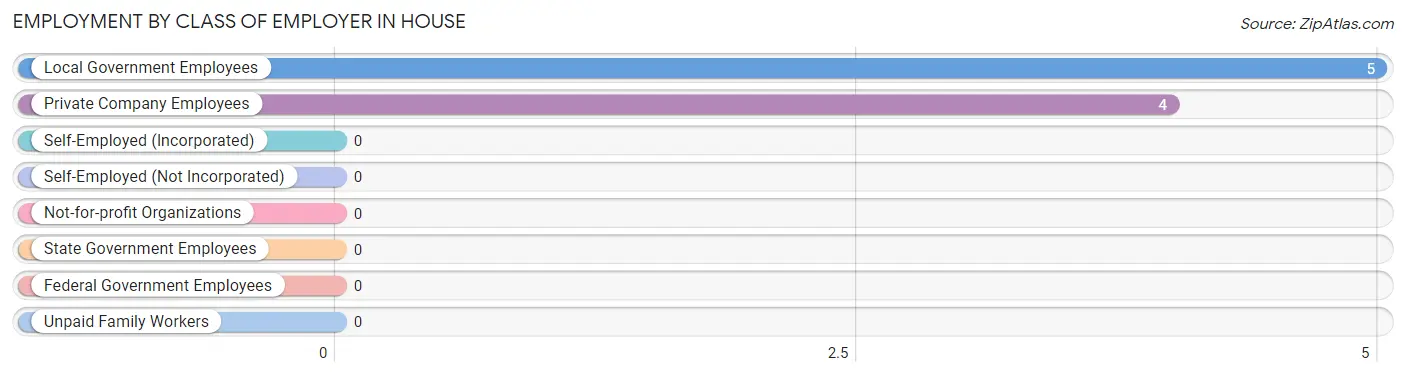
| Employer Class | # Employees | % Employees |
| Private Company Employees | 4 | 44.4% |
| Self-Employed (Incorporated) | 0 | 0.0% |
| Self-Employed (Not Incorporated) | 0 | 0.0% |
| Not-for-profit Organizations | 0 | 0.0% |
| Local Government Employees | 5 | 55.6% |
| State Government Employees | 0 | 0.0% |
| Federal Government Employees | 0 | 0.0% |
| Unpaid Family Workers | 0 | 0.0% |
| Total | 9 | 100.0% |
Employment Status by Age in House
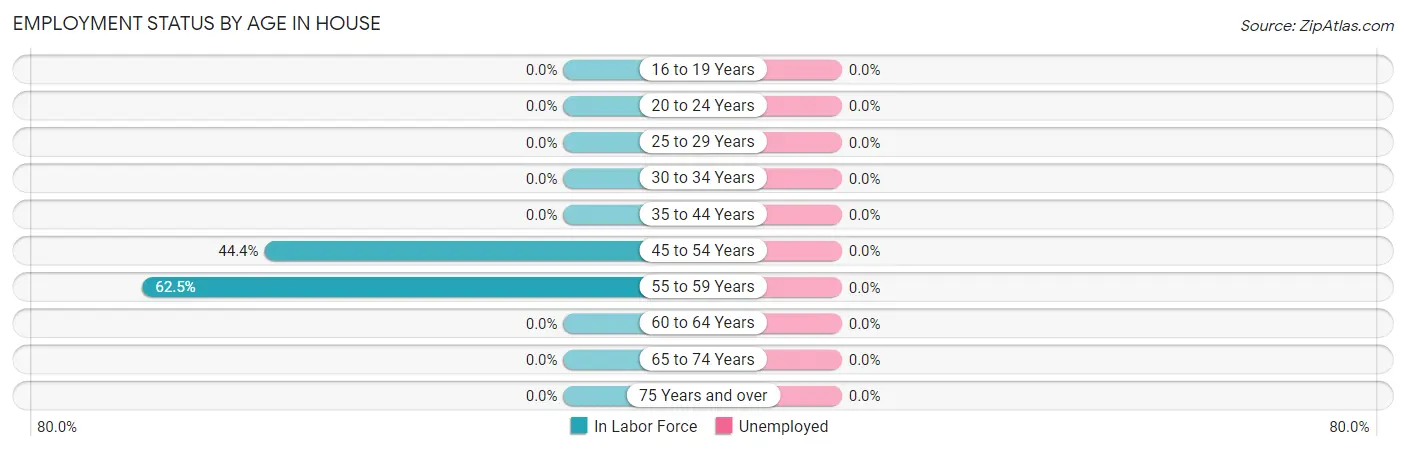
| Age Bracket | In Labor Force | Unemployed |
| 16 to 19 Years | 0 (0.0%) | 0 (0.0%) |
| 20 to 24 Years | 0 (0.0%) | 0 (0.0%) |
| 25 to 29 Years | 0 (0.0%) | 0 (0.0%) |
| 30 to 34 Years | 0 (0.0%) | 0 (0.0%) |
| 35 to 44 Years | 0 (0.0%) | 0 (0.0%) |
| 45 to 54 Years | 4 (44.4%) | 0 (0.0%) |
| 55 to 59 Years | 5 (62.5%) | 0 (0.0%) |
| 60 to 64 Years | 0 (0.0%) | 0 (0.0%) |
| 65 to 74 Years | 0 (0.0%) | 0 (0.0%) |
| 75 Years and over | 0 (0.0%) | 0 (0.0%) |
| Total | 9 (17.0%) | 0 (0.0%) |
Employment Status by Educational Attainment in House
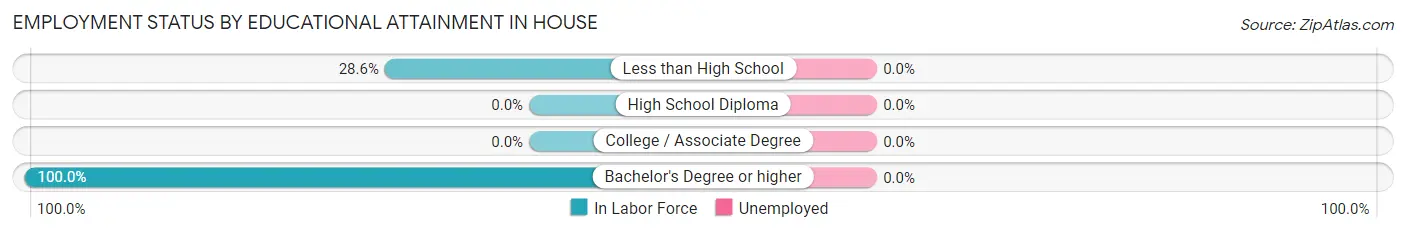
| Educational Attainment | In Labor Force | Unemployed |
| Less than High School | 4 (28.6%) | 0 (0.0%) |
| High School Diploma | 0 (0.0%) | 0 (0.0%) |
| College / Associate Degree | 0 (0.0%) | 0 (0.0%) |
| Bachelor's Degree or higher | 5 (100.0%) | 0 (0.0%) |
| Total | 9 (27.3%) | 0 (0.0%) |
Employment Occupations by Sex in House
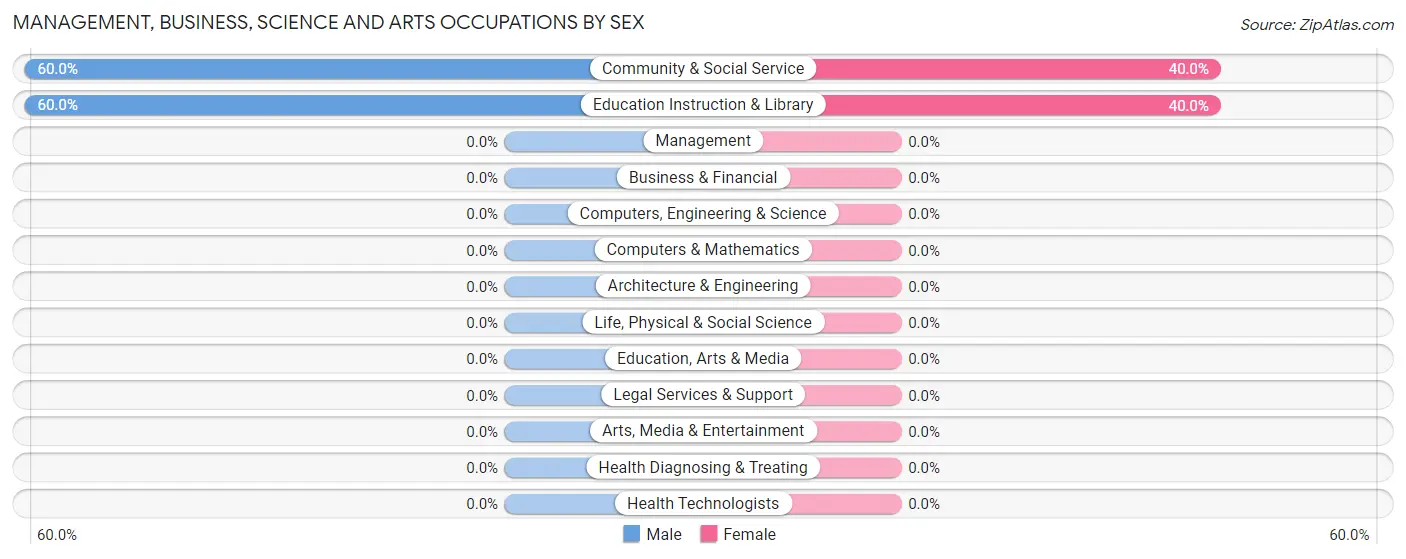
Management, Business, Science and Arts Occupations
The most common Management, Business, Science and Arts occupations in House are Community & Social Service (5 | 55.6%), and Education Instruction & Library (5 | 55.6%).
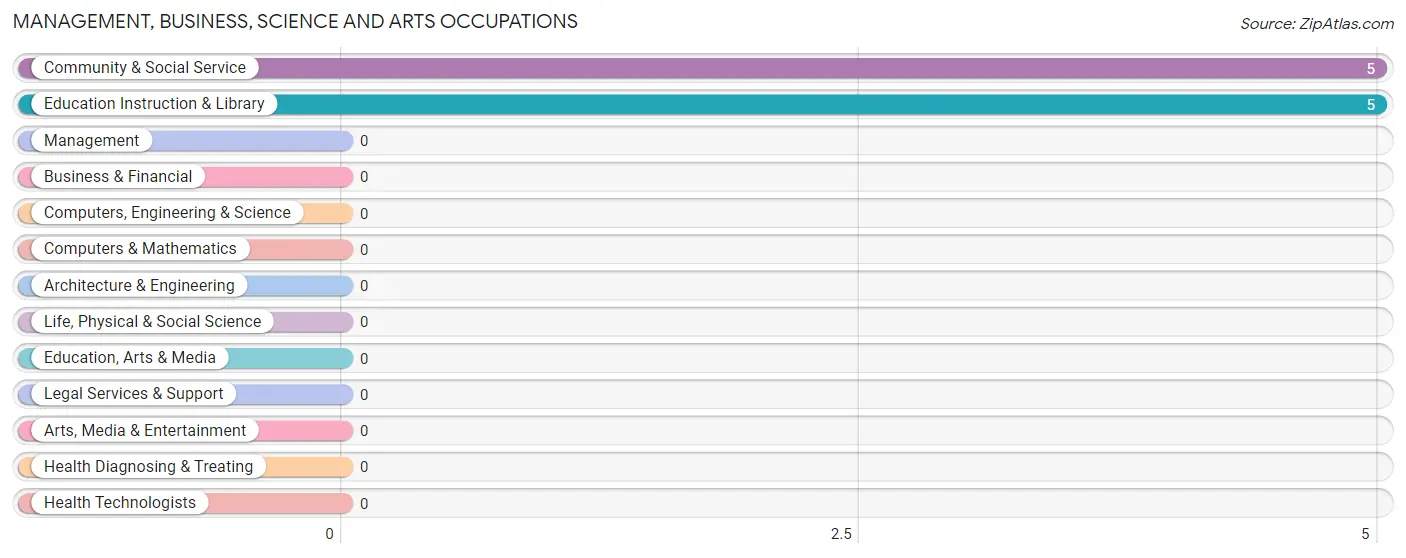
Management, Business, Science and Arts Occupations by Sex
Within the Management, Business, Science and Arts occupations in House, the most male-oriented occupations are Community & Social Service (60.0%), and Education Instruction & Library (60.0%), while the most female-oriented occupations are Community & Social Service (40.0%), and Education Instruction & Library (40.0%).
| Occupation | Male | Female |
| Management | 0 (0.0%) | 0 (0.0%) |
| Business & Financial | 0 (0.0%) | 0 (0.0%) |
| Computers, Engineering & Science | 0 (0.0%) | 0 (0.0%) |
| Computers & Mathematics | 0 (0.0%) | 0 (0.0%) |
| Architecture & Engineering | 0 (0.0%) | 0 (0.0%) |
| Life, Physical & Social Science | 0 (0.0%) | 0 (0.0%) |
| Community & Social Service | 3 (60.0%) | 2 (40.0%) |
| Education, Arts & Media | 0 (0.0%) | 0 (0.0%) |
| Legal Services & Support | 0 (0.0%) | 0 (0.0%) |
| Education Instruction & Library | 3 (60.0%) | 2 (40.0%) |
| Arts, Media & Entertainment | 0 (0.0%) | 0 (0.0%) |
| Health Diagnosing & Treating | 0 (0.0%) | 0 (0.0%) |
| Health Technologists | 0 (0.0%) | 0 (0.0%) |
| Total (Category) | 3 (60.0%) | 2 (40.0%) |
| Total (Overall) | 7 (77.8%) | 2 (22.2%) |
Services Occupations
Services Occupations by Sex
| Occupation | Male | Female |
| Healthcare Support | 0 (0.0%) | 0 (0.0%) |
| Security & Protection | 0 (0.0%) | 0 (0.0%) |
| Firefighting & Prevention | 0 (0.0%) | 0 (0.0%) |
| Law Enforcement | 0 (0.0%) | 0 (0.0%) |
| Food Preparation & Serving | 0 (0.0%) | 0 (0.0%) |
| Cleaning & Maintenance | 0 (0.0%) | 0 (0.0%) |
| Personal Care & Service | 0 (0.0%) | 0 (0.0%) |
| Total (Category) | 0 (0.0%) | 0 (0.0%) |
| Total (Overall) | 7 (77.8%) | 2 (22.2%) |
Sales and Office Occupations
Sales and Office Occupations by Sex
| Occupation | Male | Female |
| Sales & Related | 0 (0.0%) | 0 (0.0%) |
| Office & Administration | 0 (0.0%) | 0 (0.0%) |
| Total (Category) | 0 (0.0%) | 0 (0.0%) |
| Total (Overall) | 7 (77.8%) | 2 (22.2%) |
Natural Resources, Construction and Maintenance Occupations
The most common Natural Resources, Construction and Maintenance occupations in House are , and Construction & Extraction (4 | 44.4%).
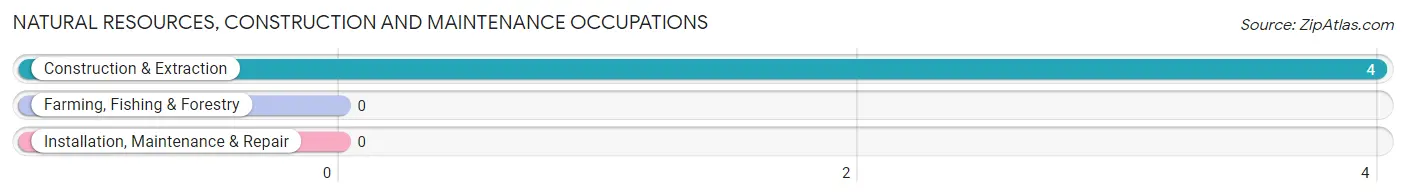
Natural Resources, Construction and Maintenance Occupations by Sex
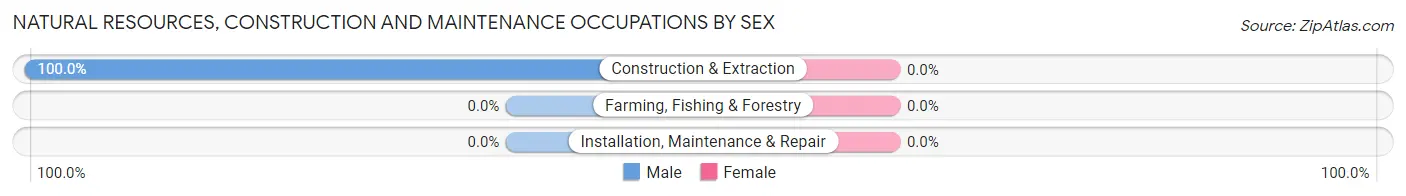
| Occupation | Male | Female |
| Farming, Fishing & Forestry | 0 (0.0%) | 0 (0.0%) |
| Construction & Extraction | 4 (100.0%) | 0 (0.0%) |
| Installation, Maintenance & Repair | 0 (0.0%) | 0 (0.0%) |
| Total (Category) | 4 (100.0%) | 0 (0.0%) |
| Total (Overall) | 7 (77.8%) | 2 (22.2%) |
Production, Transportation and Moving Occupations
Production, Transportation and Moving Occupations by Sex
| Occupation | Male | Female |
| Production | 0 (0.0%) | 0 (0.0%) |
| Transportation | 0 (0.0%) | 0 (0.0%) |
| Material Moving | 0 (0.0%) | 0 (0.0%) |
| Total (Category) | 0 (0.0%) | 0 (0.0%) |
| Total (Overall) | 7 (77.8%) | 2 (22.2%) |
Employment Industries by Sex in House
Employment Industries in House
The major employment industries in House include Educational Services (5 | 55.6%), and Construction (4 | 44.4%).
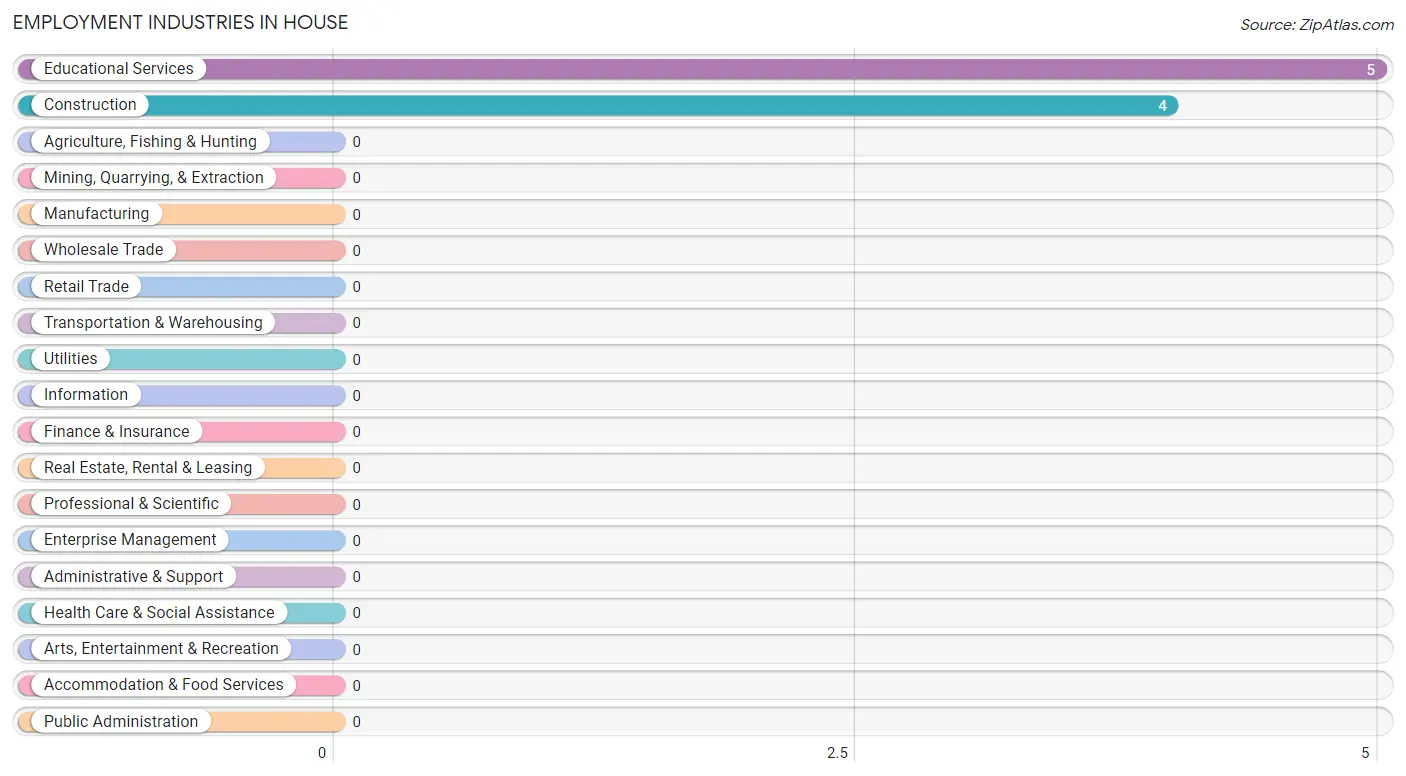
Employment Industries by Sex in House
| Industry | Male | Female |
| Agriculture, Fishing & Hunting | 0 (0.0%) | 0 (0.0%) |
| Mining, Quarrying, & Extraction | 0 (0.0%) | 0 (0.0%) |
| Construction | 4 (100.0%) | 0 (0.0%) |
| Manufacturing | 0 (0.0%) | 0 (0.0%) |
| Wholesale Trade | 0 (0.0%) | 0 (0.0%) |
| Retail Trade | 0 (0.0%) | 0 (0.0%) |
| Transportation & Warehousing | 0 (0.0%) | 0 (0.0%) |
| Utilities | 0 (0.0%) | 0 (0.0%) |
| Information | 0 (0.0%) | 0 (0.0%) |
| Finance & Insurance | 0 (0.0%) | 0 (0.0%) |
| Real Estate, Rental & Leasing | 0 (0.0%) | 0 (0.0%) |
| Professional & Scientific | 0 (0.0%) | 0 (0.0%) |
| Enterprise Management | 0 (0.0%) | 0 (0.0%) |
| Administrative & Support | 0 (0.0%) | 0 (0.0%) |
| Educational Services | 3 (60.0%) | 2 (40.0%) |
| Health Care & Social Assistance | 0 (0.0%) | 0 (0.0%) |
| Arts, Entertainment & Recreation | 0 (0.0%) | 0 (0.0%) |
| Accommodation & Food Services | 0 (0.0%) | 0 (0.0%) |
| Public Administration | 0 (0.0%) | 0 (0.0%) |
| Total | 7 (77.8%) | 2 (22.2%) |
Education in House
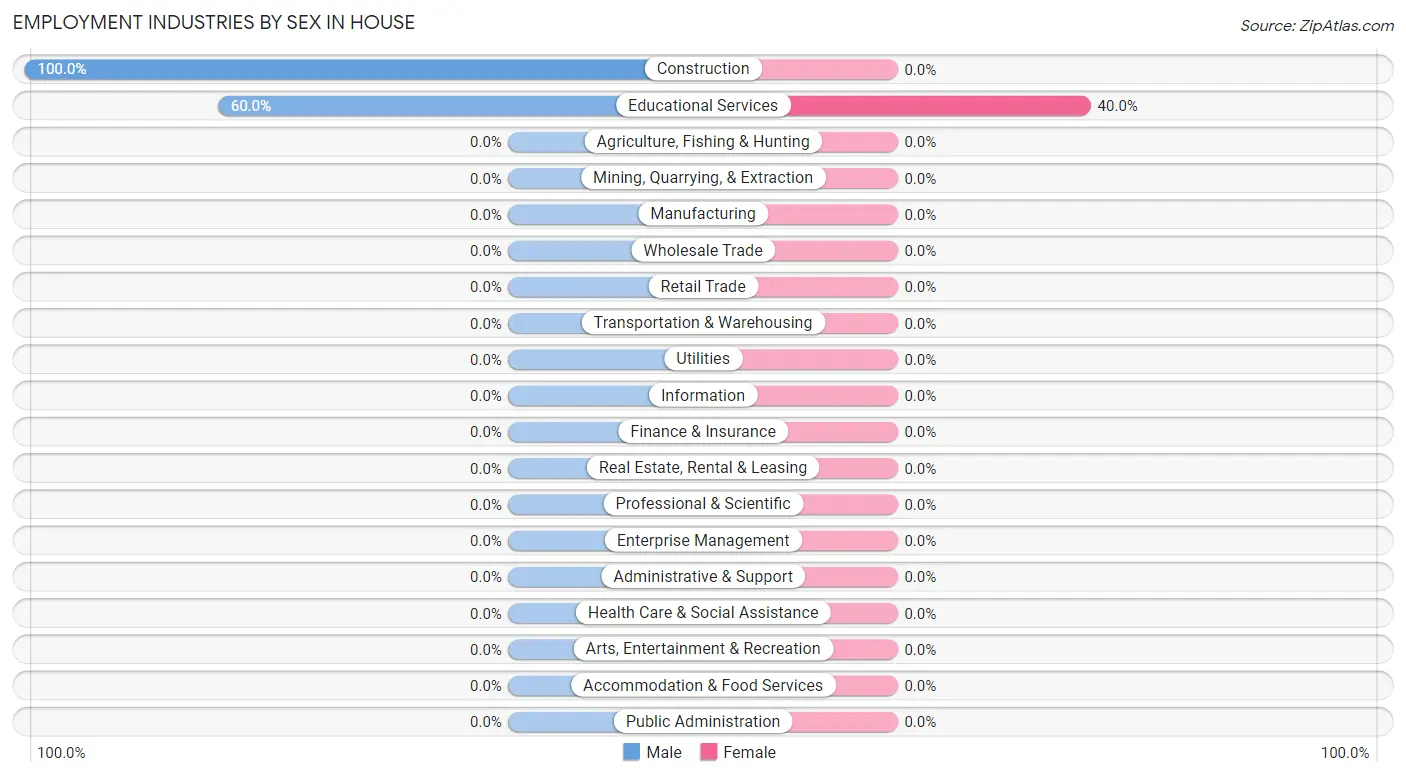
School Enrollment in House
| School Level | # Students | % Students |
| Nursery / Preschool | 0 | 0.0% |
| Kindergarten | 0 | 0.0% |
| Elementary School | 0 | 0.0% |
| Middle School | 4 | 100.0% |
| High School | 0 | 0.0% |
| College / Undergraduate | 0 | 0.0% |
| Graduate / Professional | 0 | 0.0% |
| Total | 4 | 100.0% |
School Enrollment by Age by Funding Source in House
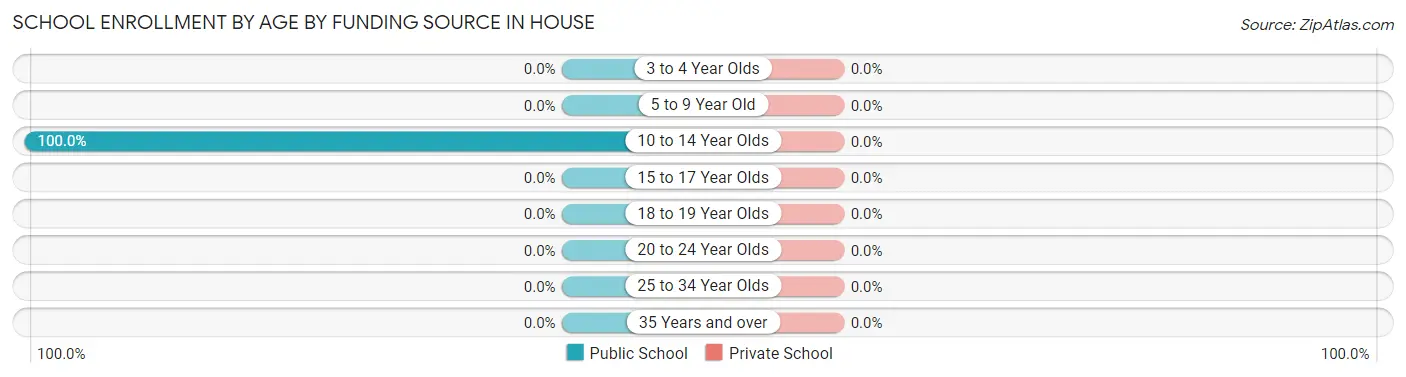
| Age Bracket | Public School | Private School |
| 3 to 4 Year Olds | 0 (0.0%) | 0 (0.0%) |
| 5 to 9 Year Old | 0 (0.0%) | 0 (0.0%) |
| 10 to 14 Year Olds | 4 (100.0%) | 0 (0.0%) |
| 15 to 17 Year Olds | 0 (0.0%) | 0 (0.0%) |
| 18 to 19 Year Olds | 0 (0.0%) | 0 (0.0%) |
| 20 to 24 Year Olds | 0 (0.0%) | 0 (0.0%) |
| 25 to 34 Year Olds | 0 (0.0%) | 0 (0.0%) |
| 35 Years and over | 0 (0.0%) | 0 (0.0%) |
| Total | 4 (100.0%) | 0 (0.0%) |
Educational Attainment by Field of Study in House
Business (3 | 50.0%), education (2 | 33.3%), and computers & mathematics (1 | 16.7%) are the most common fields of study among 6 individuals in House who have obtained a bachelor's degree or higher.
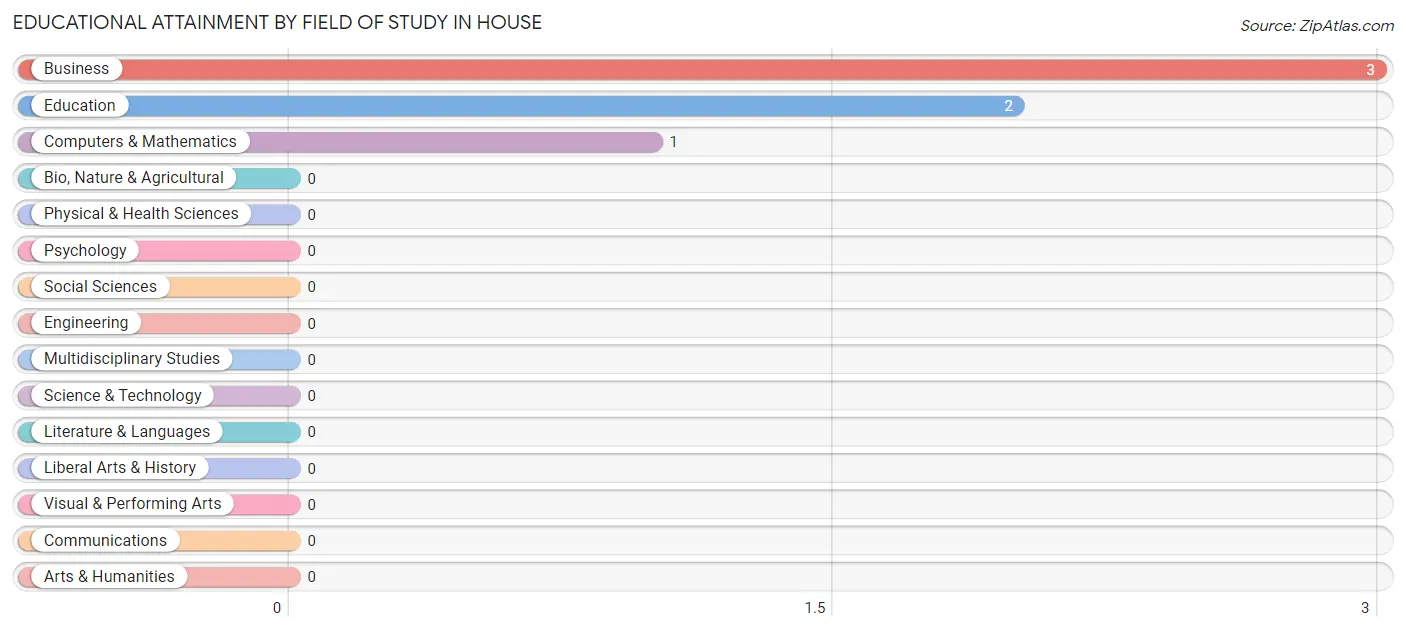
| Field of Study | # Graduates | % Graduates |
| Computers & Mathematics | 1 | 16.7% |
| Bio, Nature & Agricultural | 0 | 0.0% |
| Physical & Health Sciences | 0 | 0.0% |
| Psychology | 0 | 0.0% |
| Social Sciences | 0 | 0.0% |
| Engineering | 0 | 0.0% |
| Multidisciplinary Studies | 0 | 0.0% |
| Science & Technology | 0 | 0.0% |
| Business | 3 | 50.0% |
| Education | 2 | 33.3% |
| Literature & Languages | 0 | 0.0% |
| Liberal Arts & History | 0 | 0.0% |
| Visual & Performing Arts | 0 | 0.0% |
| Communications | 0 | 0.0% |
| Arts & Humanities | 0 | 0.0% |
| Total | 6 | 100.0% |
Transportation & Commute in House
Vehicle Availability by Sex in House
The most prevalent vehicle ownership categories in House are males with 3 vehicles (4, accounting for 57.1%) and females with 3 vehicles (0, making up 200.0%).
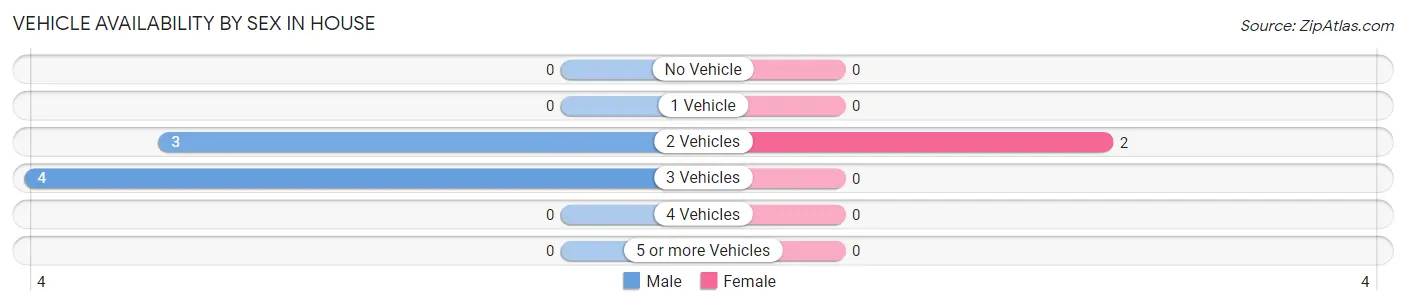
| Vehicles Available | Male | Female |
| No Vehicle | 0 (0.0%) | 0 (0.0%) |
| 1 Vehicle | 0 (0.0%) | 0 (0.0%) |
| 2 Vehicles | 3 (42.9%) | 2 (100.0%) |
| 3 Vehicles | 4 (57.1%) | 0 (0.0%) |
| 4 Vehicles | 0 (0.0%) | 0 (0.0%) |
| 5 or more Vehicles | 0 (0.0%) | 0 (0.0%) |
| Total | 7 (100.0%) | 2 (100.0%) |
Commute Time in House
The most frequently occuring commute durations in House are less than 5 minutes (5 commuters, 55.6%), 15 to 19 minutes (4 commuters, 44.4%), and 5 to 9 minutes (0 commuters, 0.0%).
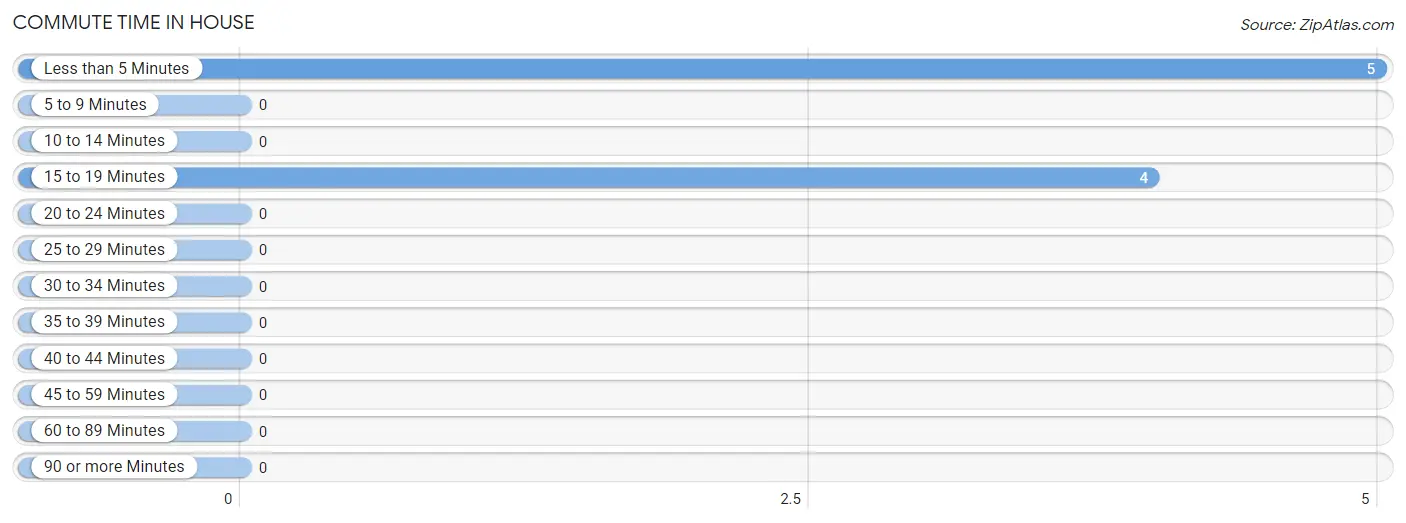
| Commute Time | # Commuters | % Commuters |
| Less than 5 Minutes | 5 | 55.6% |
| 5 to 9 Minutes | 0 | 0.0% |
| 10 to 14 Minutes | 0 | 0.0% |
| 15 to 19 Minutes | 4 | 44.4% |
| 20 to 24 Minutes | 0 | 0.0% |
| 25 to 29 Minutes | 0 | 0.0% |
| 30 to 34 Minutes | 0 | 0.0% |
| 35 to 39 Minutes | 0 | 0.0% |
| 40 to 44 Minutes | 0 | 0.0% |
| 45 to 59 Minutes | 0 | 0.0% |
| 60 to 89 Minutes | 0 | 0.0% |
| 90 or more Minutes | 0 | 0.0% |
Commute Time by Sex in House
The most common commute times in House are 15 to 19 minutes (4 commuters, 57.1%) for males and less than 5 minutes (2 commuters, 100.0%) for females.
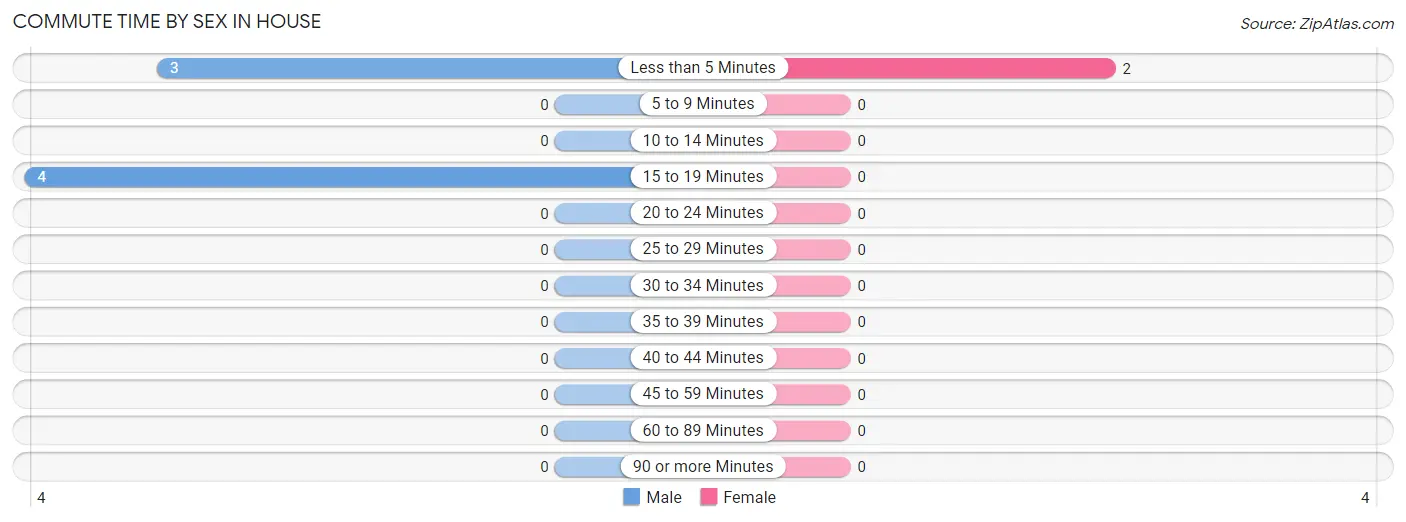
| Commute Time | Male | Female |
| Less than 5 Minutes | 3 (42.9%) | 2 (100.0%) |
| 5 to 9 Minutes | 0 (0.0%) | 0 (0.0%) |
| 10 to 14 Minutes | 0 (0.0%) | 0 (0.0%) |
| 15 to 19 Minutes | 4 (57.1%) | 0 (0.0%) |
| 20 to 24 Minutes | 0 (0.0%) | 0 (0.0%) |
| 25 to 29 Minutes | 0 (0.0%) | 0 (0.0%) |
| 30 to 34 Minutes | 0 (0.0%) | 0 (0.0%) |
| 35 to 39 Minutes | 0 (0.0%) | 0 (0.0%) |
| 40 to 44 Minutes | 0 (0.0%) | 0 (0.0%) |
| 45 to 59 Minutes | 0 (0.0%) | 0 (0.0%) |
| 60 to 89 Minutes | 0 (0.0%) | 0 (0.0%) |
| 90 or more Minutes | 0 (0.0%) | 0 (0.0%) |
Time of Departure to Work by Sex in House
The most frequent times of departure to work in House are 8:00 AM to 8:29 AM (4, 57.1%) for males and 7:30 AM to 7:59 AM (2, 100.0%) for females.
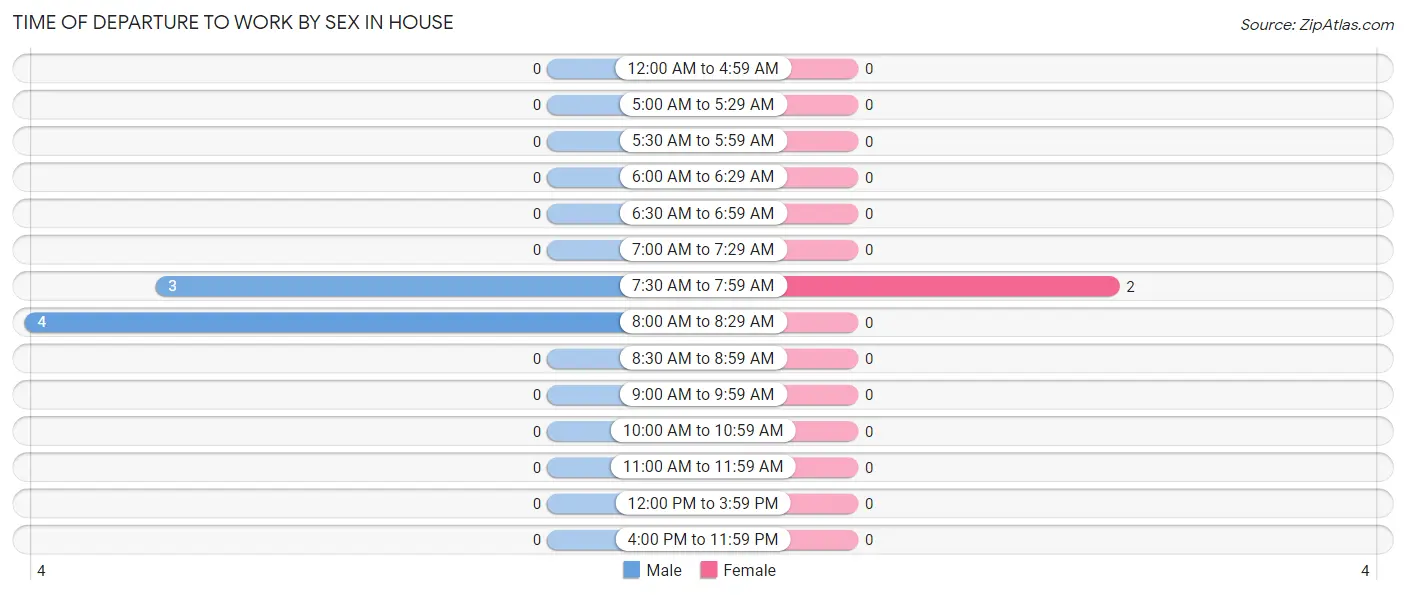
| Time of Departure | Male | Female |
| 12:00 AM to 4:59 AM | 0 (0.0%) | 0 (0.0%) |
| 5:00 AM to 5:29 AM | 0 (0.0%) | 0 (0.0%) |
| 5:30 AM to 5:59 AM | 0 (0.0%) | 0 (0.0%) |
| 6:00 AM to 6:29 AM | 0 (0.0%) | 0 (0.0%) |
| 6:30 AM to 6:59 AM | 0 (0.0%) | 0 (0.0%) |
| 7:00 AM to 7:29 AM | 0 (0.0%) | 0 (0.0%) |
| 7:30 AM to 7:59 AM | 3 (42.9%) | 2 (100.0%) |
| 8:00 AM to 8:29 AM | 4 (57.1%) | 0 (0.0%) |
| 8:30 AM to 8:59 AM | 0 (0.0%) | 0 (0.0%) |
| 9:00 AM to 9:59 AM | 0 (0.0%) | 0 (0.0%) |
| 10:00 AM to 10:59 AM | 0 (0.0%) | 0 (0.0%) |
| 11:00 AM to 11:59 AM | 0 (0.0%) | 0 (0.0%) |
| 12:00 PM to 3:59 PM | 0 (0.0%) | 0 (0.0%) |
| 4:00 PM to 11:59 PM | 0 (0.0%) | 0 (0.0%) |
| Total | 7 (100.0%) | 2 (100.0%) |
Housing Occupancy in House
Occupancy by Ownership in House
Of the total 29 dwellings in House, owner-occupied units account for 26 (89.7%), while renter-occupied units make up 3 (10.3%).
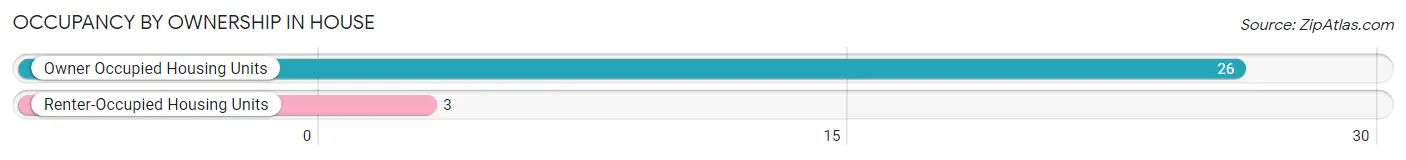
| Occupancy | # Housing Units | % Housing Units |
| Owner Occupied Housing Units | 26 | 89.7% |
| Renter-Occupied Housing Units | 3 | 10.3% |
| Total Occupied Housing Units | 29 | 100.0% |
Occupancy by Household Size in House
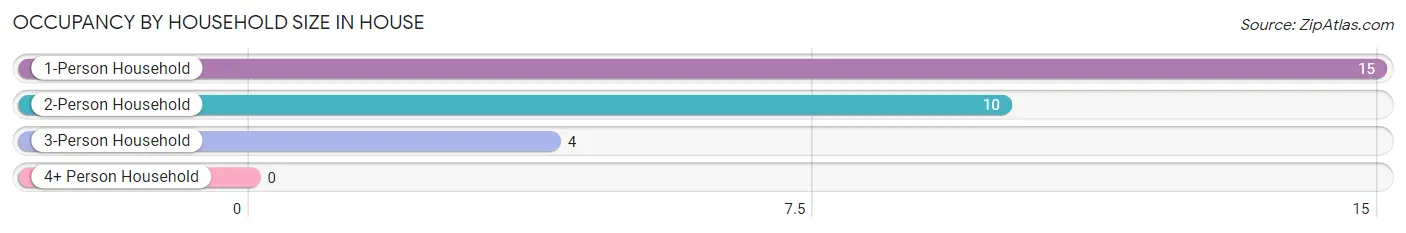
| Household Size | # Housing Units | % Housing Units |
| 1-Person Household | 15 | 51.7% |
| 2-Person Household | 10 | 34.5% |
| 3-Person Household | 4 | 13.8% |
| 4+ Person Household | 0 | 0.0% |
| Total Housing Units | 29 | 100.0% |
Occupancy by Ownership by Household Size in House
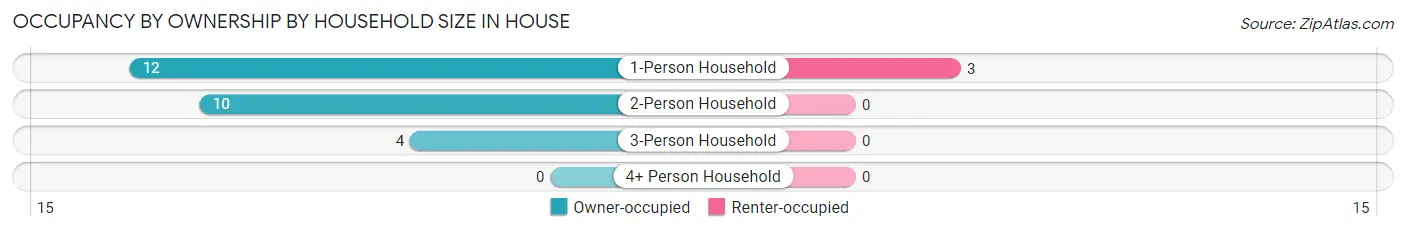
| Household Size | Owner-occupied | Renter-occupied |
| 1-Person Household | 12 (80.0%) | 3 (20.0%) |
| 2-Person Household | 10 (100.0%) | 0 (0.0%) |
| 3-Person Household | 4 (100.0%) | 0 (0.0%) |
| 4+ Person Household | 0 (0.0%) | 0 (0.0%) |
| Total Housing Units | 26 (89.7%) | 3 (10.3%) |
Occupancy by Educational Attainment in House
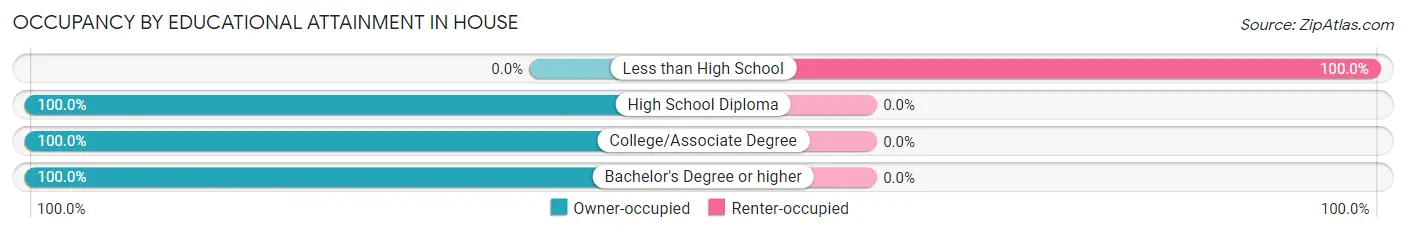
| Household Size | Owner-occupied | Renter-occupied |
| Less than High School | 0 (0.0%) | 3 (100.0%) |
| High School Diploma | 2 (100.0%) | 0 (0.0%) |
| College/Associate Degree | 21 (100.0%) | 0 (0.0%) |
| Bachelor's Degree or higher | 3 (100.0%) | 0 (0.0%) |
Occupancy by Age of Householder in House
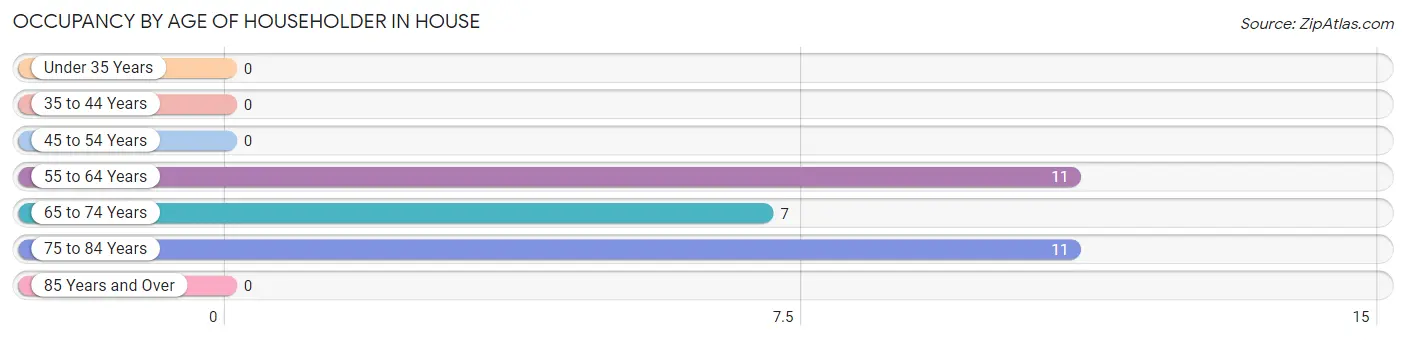
| Age Bracket | # Households | % Households |
| Under 35 Years | 0 | 0.0% |
| 35 to 44 Years | 0 | 0.0% |
| 45 to 54 Years | 0 | 0.0% |
| 55 to 64 Years | 11 | 37.9% |
| 65 to 74 Years | 7 | 24.1% |
| 75 to 84 Years | 11 | 37.9% |
| 85 Years and Over | 0 | 0.0% |
| Total | 29 | 100.0% |
Housing Finances in House
Median Income by Occupancy in House
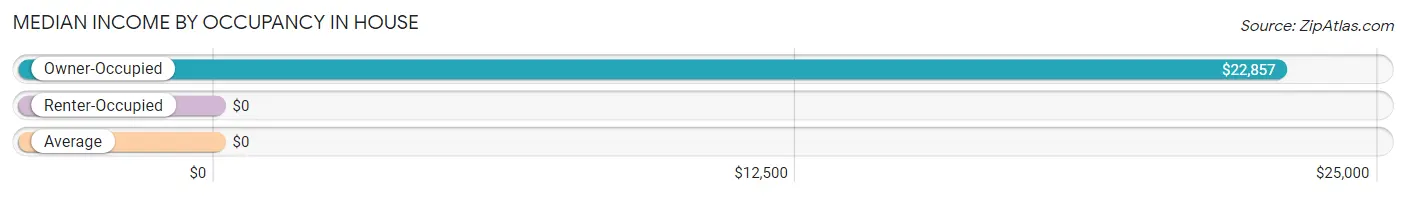
| Occupancy Type | # Households | Median Income |
| Owner-Occupied | 26 (89.7%) | $22,857 |
| Renter-Occupied | 3 (10.3%) | $0 |
| Average | 29 (100.0%) | $0 |
Occupancy by Householder Income Bracket in House
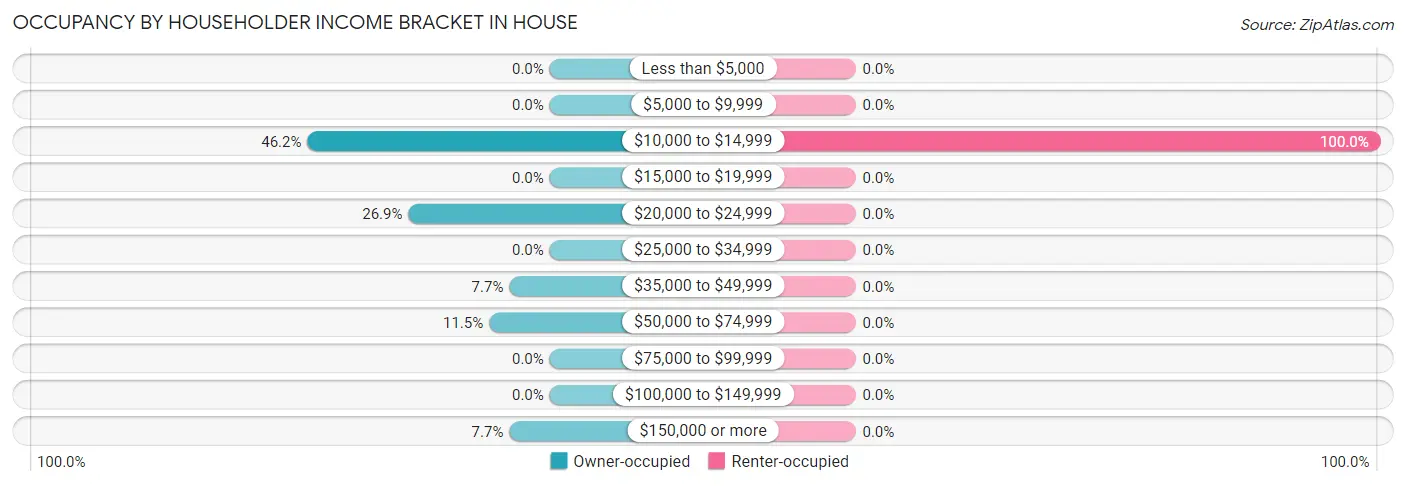
| Income Bracket | Owner-occupied | Renter-occupied |
| Less than $5,000 | 0 (0.0%) | 0 (0.0%) |
| $5,000 to $9,999 | 0 (0.0%) | 0 (0.0%) |
| $10,000 to $14,999 | 12 (46.2%) | 3 (100.0%) |
| $15,000 to $19,999 | 0 (0.0%) | 0 (0.0%) |
| $20,000 to $24,999 | 7 (26.9%) | 0 (0.0%) |
| $25,000 to $34,999 | 0 (0.0%) | 0 (0.0%) |
| $35,000 to $49,999 | 2 (7.7%) | 0 (0.0%) |
| $50,000 to $74,999 | 3 (11.5%) | 0 (0.0%) |
| $75,000 to $99,999 | 0 (0.0%) | 0 (0.0%) |
| $100,000 to $149,999 | 0 (0.0%) | 0 (0.0%) |
| $150,000 or more | 2 (7.7%) | 0 (0.0%) |
| Total | 26 (100.0%) | 3 (100.0%) |
Monthly Housing Cost Tiers in House
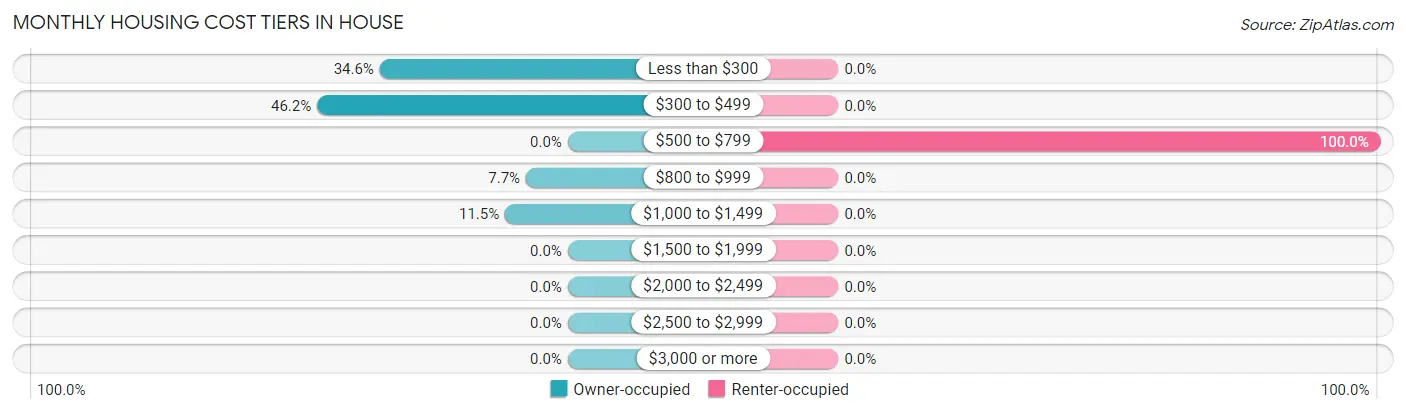
| Monthly Cost | Owner-occupied | Renter-occupied |
| Less than $300 | 9 (34.6%) | 0 (0.0%) |
| $300 to $499 | 12 (46.2%) | 0 (0.0%) |
| $500 to $799 | 0 (0.0%) | 3 (100.0%) |
| $800 to $999 | 2 (7.7%) | 0 (0.0%) |
| $1,000 to $1,499 | 3 (11.5%) | 0 (0.0%) |
| $1,500 to $1,999 | 0 (0.0%) | 0 (0.0%) |
| $2,000 to $2,499 | 0 (0.0%) | 0 (0.0%) |
| $2,500 to $2,999 | 0 (0.0%) | 0 (0.0%) |
| $3,000 or more | 0 (0.0%) | 0 (0.0%) |
| Total | 26 (100.0%) | 3 (100.0%) |
Physical Housing Characteristics in House
Housing Structures in House
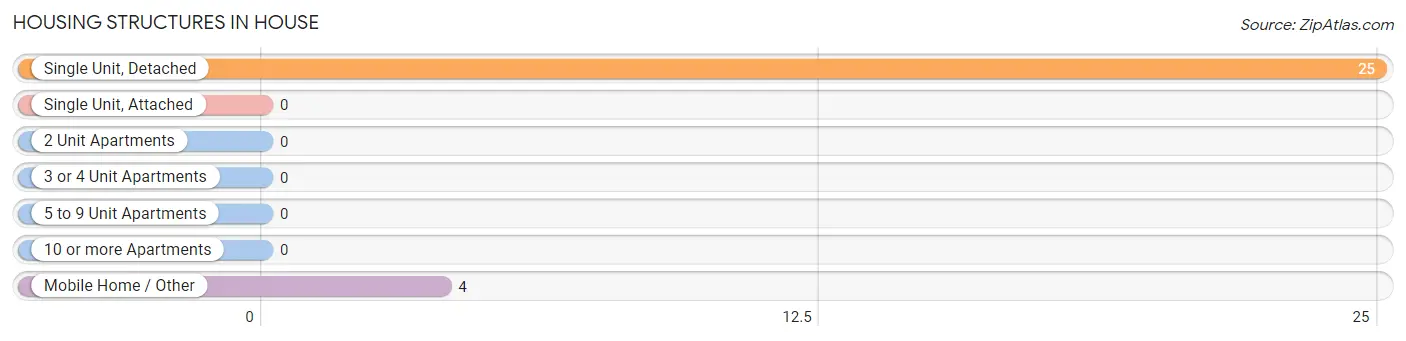
| Structure Type | # Housing Units | % Housing Units |
| Single Unit, Detached | 25 | 86.2% |
| Single Unit, Attached | 0 | 0.0% |
| 2 Unit Apartments | 0 | 0.0% |
| 3 or 4 Unit Apartments | 0 | 0.0% |
| 5 to 9 Unit Apartments | 0 | 0.0% |
| 10 or more Apartments | 0 | 0.0% |
| Mobile Home / Other | 4 | 13.8% |
| Total | 29 | 100.0% |
Housing Structures by Occupancy in House
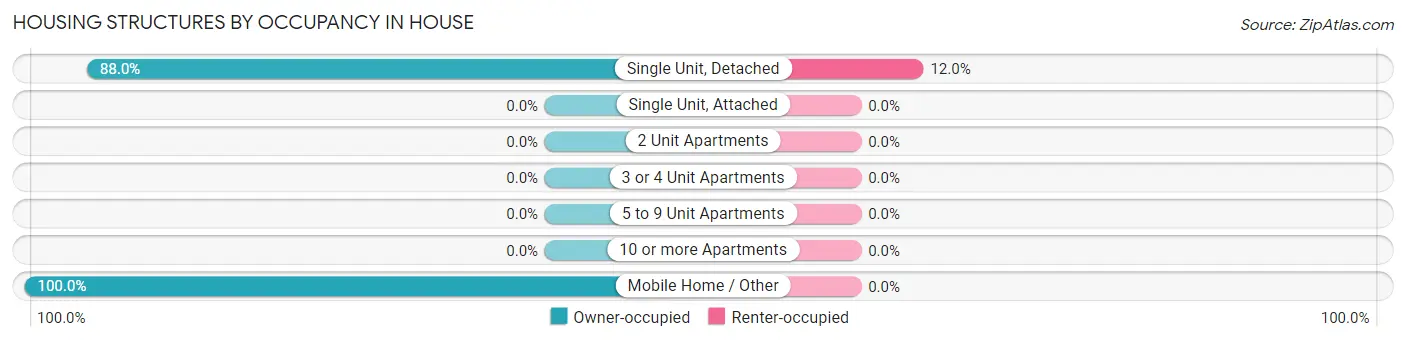
| Structure Type | Owner-occupied | Renter-occupied |
| Single Unit, Detached | 22 (88.0%) | 3 (12.0%) |
| Single Unit, Attached | 0 (0.0%) | 0 (0.0%) |
| 2 Unit Apartments | 0 (0.0%) | 0 (0.0%) |
| 3 or 4 Unit Apartments | 0 (0.0%) | 0 (0.0%) |
| 5 to 9 Unit Apartments | 0 (0.0%) | 0 (0.0%) |
| 10 or more Apartments | 0 (0.0%) | 0 (0.0%) |
| Mobile Home / Other | 4 (100.0%) | 0 (0.0%) |
| Total | 26 (89.7%) | 3 (10.3%) |
Housing Structures by Number of Rooms in House
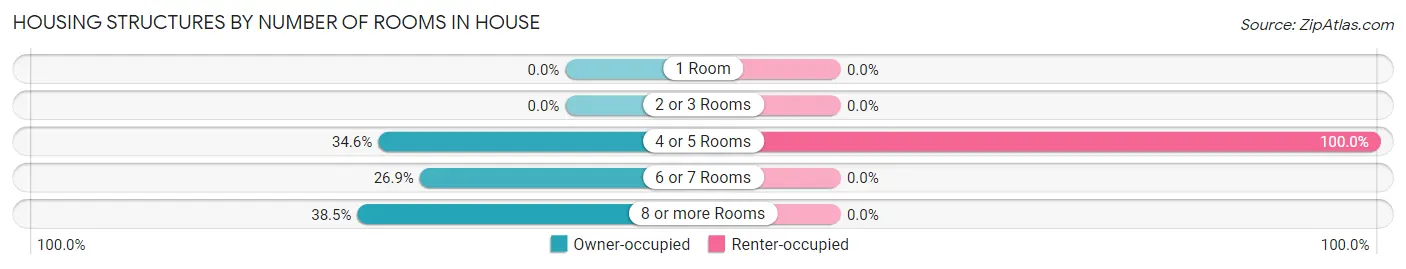
| Number of Rooms | Owner-occupied | Renter-occupied |
| 1 Room | 0 (0.0%) | 0 (0.0%) |
| 2 or 3 Rooms | 0 (0.0%) | 0 (0.0%) |
| 4 or 5 Rooms | 9 (34.6%) | 3 (100.0%) |
| 6 or 7 Rooms | 7 (26.9%) | 0 (0.0%) |
| 8 or more Rooms | 10 (38.5%) | 0 (0.0%) |
| Total | 26 (100.0%) | 3 (100.0%) |
Housing Structure by Heating Type in House
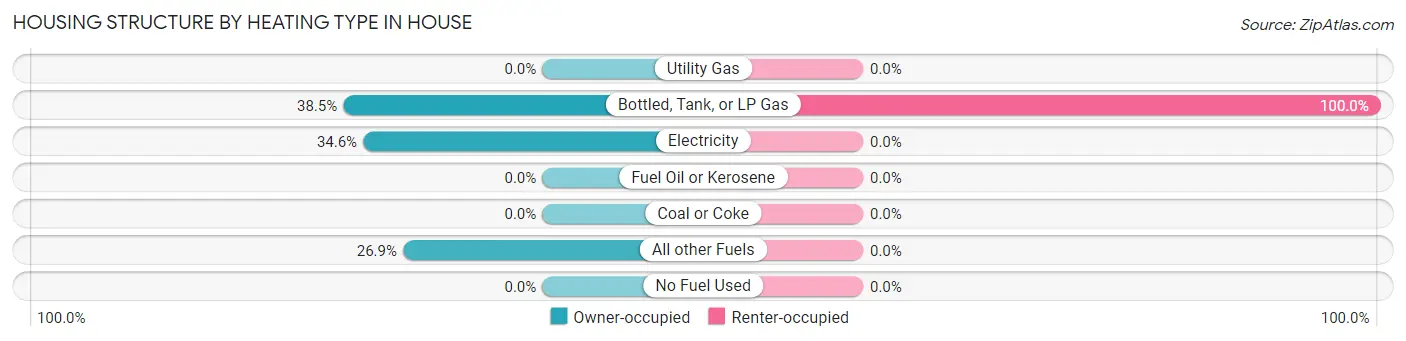
| Heating Type | Owner-occupied | Renter-occupied |
| Utility Gas | 0 (0.0%) | 0 (0.0%) |
| Bottled, Tank, or LP Gas | 10 (38.5%) | 3 (100.0%) |
| Electricity | 9 (34.6%) | 0 (0.0%) |
| Fuel Oil or Kerosene | 0 (0.0%) | 0 (0.0%) |
| Coal or Coke | 0 (0.0%) | 0 (0.0%) |
| All other Fuels | 7 (26.9%) | 0 (0.0%) |
| No Fuel Used | 0 (0.0%) | 0 (0.0%) |
| Total | 26 (100.0%) | 3 (100.0%) |
Household Vehicle Usage in House
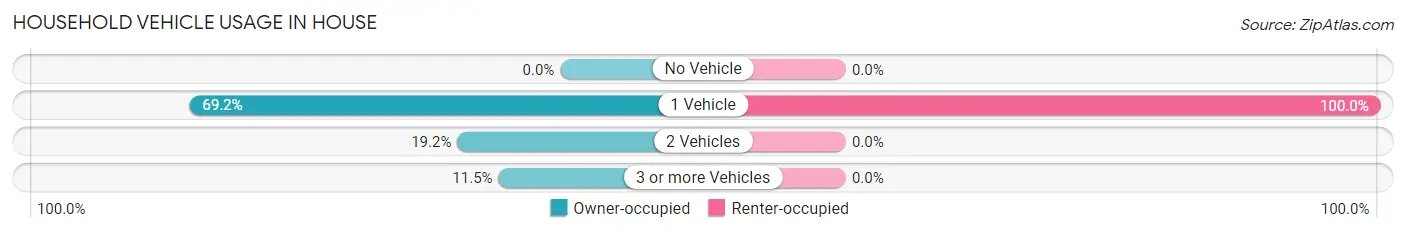
| Vehicles per Household | Owner-occupied | Renter-occupied |
| No Vehicle | 0 (0.0%) | 0 (0.0%) |
| 1 Vehicle | 18 (69.2%) | 3 (100.0%) |
| 2 Vehicles | 5 (19.2%) | 0 (0.0%) |
| 3 or more Vehicles | 3 (11.5%) | 0 (0.0%) |
| Total | 26 (100.0%) | 3 (100.0%) |
Real Estate & Mortgages in House
Real Estate and Mortgage Overview in House
| Characteristic | Without Mortgage | With Mortgage |
| Housing Units | 21 | 5 |
| Median Property Value | $112,500 | $129,200 |
| Median Household Income | - | - |
| Monthly Housing Costs | $306 | $0 |
| Real Estate Taxes | - | - |
Property Value by Mortgage Status in House
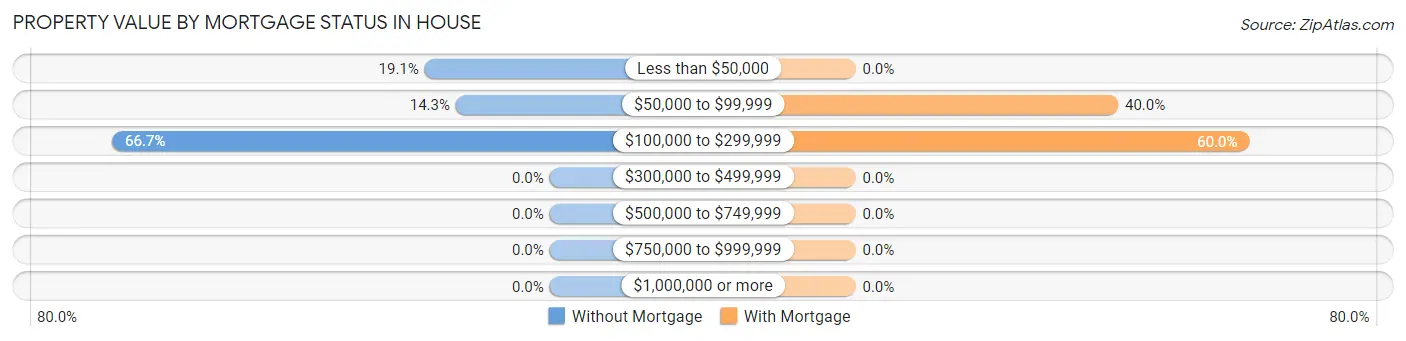
| Property Value | Without Mortgage | With Mortgage |
| Less than $50,000 | 4 (19.1%) | 0 (0.0%) |
| $50,000 to $99,999 | 3 (14.3%) | 2 (40.0%) |
| $100,000 to $299,999 | 14 (66.7%) | 3 (60.0%) |
| $300,000 to $499,999 | 0 (0.0%) | 0 (0.0%) |
| $500,000 to $749,999 | 0 (0.0%) | 0 (0.0%) |
| $750,000 to $999,999 | 0 (0.0%) | 0 (0.0%) |
| $1,000,000 or more | 0 (0.0%) | 0 (0.0%) |
| Total | 21 (100.0%) | 5 (100.0%) |
Household Income by Mortgage Status in House
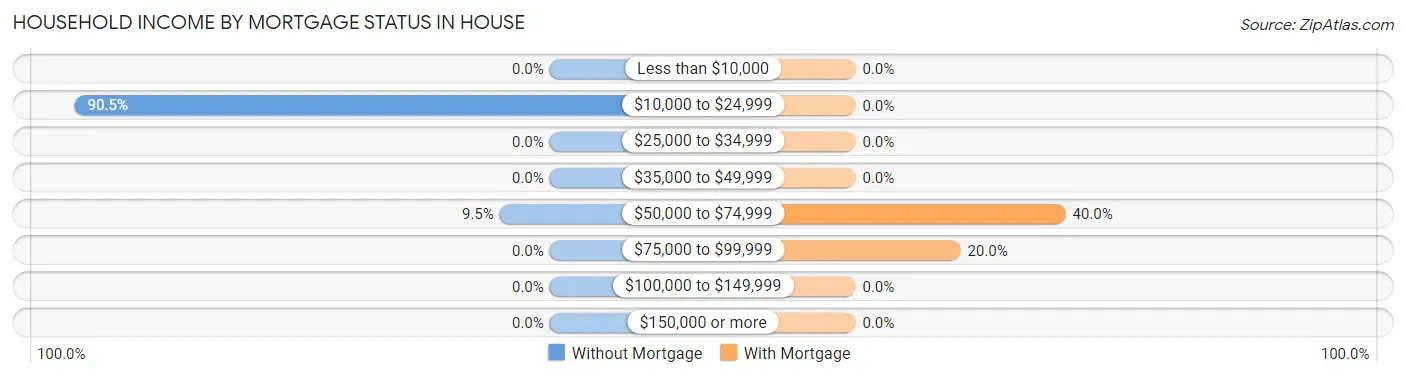
| Household Income | Without Mortgage | With Mortgage |
| Less than $10,000 | 0 (0.0%) | 0 (0.0%) |
| $10,000 to $24,999 | 19 (90.5%) | 0 (0.0%) |
| $25,000 to $34,999 | 0 (0.0%) | 0 (0.0%) |
| $35,000 to $49,999 | 0 (0.0%) | 0 (0.0%) |
| $50,000 to $74,999 | 2 (9.5%) | 2 (40.0%) |
| $75,000 to $99,999 | 0 (0.0%) | 1 (20.0%) |
| $100,000 to $149,999 | 0 (0.0%) | 0 (0.0%) |
| $150,000 or more | 0 (0.0%) | 0 (0.0%) |
| Total | 21 (100.0%) | 5 (100.0%) |
Property Value to Household Income Ratio in House
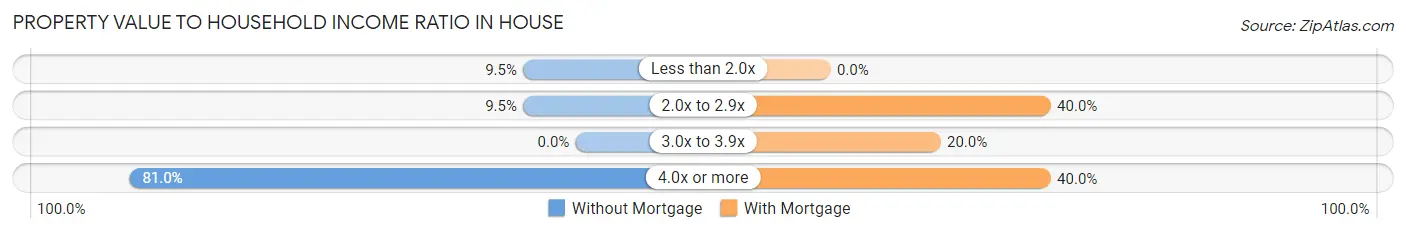
| Value-to-Income Ratio | Without Mortgage | With Mortgage |
| Less than 2.0x | 2 (9.5%) | 0 (0.0%) |
| 2.0x to 2.9x | 2 (9.5%) | 2 (40.0%) |
| 3.0x to 3.9x | 0 (0.0%) | 1 (20.0%) |
| 4.0x or more | 17 (80.9%) | 2 (40.0%) |
| Total | 21 (100.0%) | 5 (100.0%) |
Real Estate Taxes by Mortgage Status in House
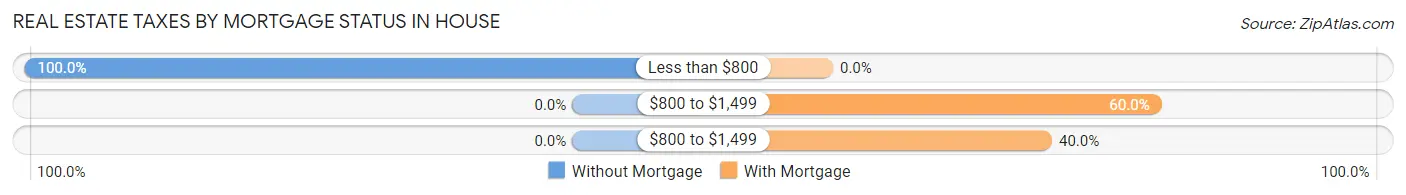
| Property Taxes | Without Mortgage | With Mortgage |
| Less than $800 | 21 (100.0%) | 0 (0.0%) |
| $800 to $1,499 | 0 (0.0%) | 3 (60.0%) |
| $800 to $1,499 | 0 (0.0%) | 2 (40.0%) |
| Total | 21 (100.0%) | 5 (100.0%) |
Health & Disability in House
Health Insurance Coverage by Age in House
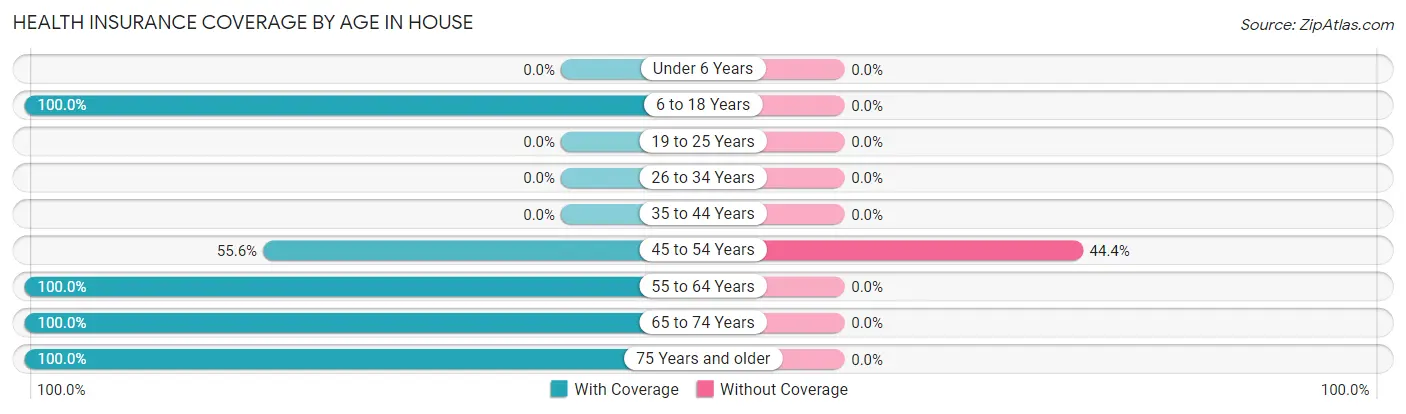
| Age Bracket | With Coverage | Without Coverage |
| Under 6 Years | 0 (0.0%) | 0 (0.0%) |
| 6 to 18 Years | 4 (100.0%) | 0 (0.0%) |
| 19 to 25 Years | 0 (0.0%) | 0 (0.0%) |
| 26 to 34 Years | 0 (0.0%) | 0 (0.0%) |
| 35 to 44 Years | 0 (0.0%) | 0 (0.0%) |
| 45 to 54 Years | 5 (55.6%) | 4 (44.4%) |
| 55 to 64 Years | 24 (100.0%) | 0 (0.0%) |
| 65 to 74 Years | 9 (100.0%) | 0 (0.0%) |
| 75 Years and older | 11 (100.0%) | 0 (0.0%) |
| Total | 53 (93.0%) | 4 (7.0%) |
Health Insurance Coverage by Citizenship Status in House
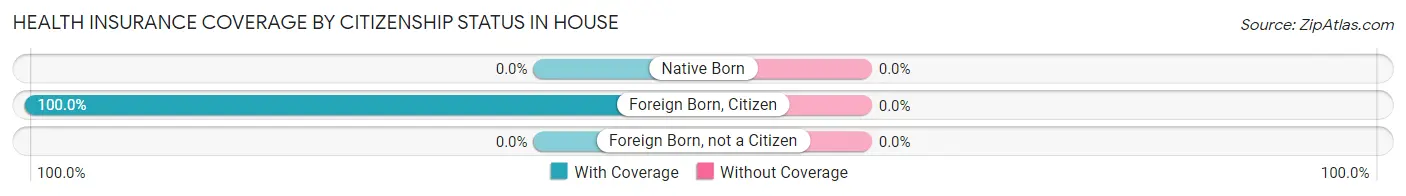
| Citizenship Status | With Coverage | Without Coverage |
| Native Born | 0 (0.0%) | 0 (0.0%) |
| Foreign Born, Citizen | 4 (100.0%) | 0 (0.0%) |
| Foreign Born, not a Citizen | 0 (0.0%) | 0 (0.0%) |
Health Insurance Coverage by Household Income in House
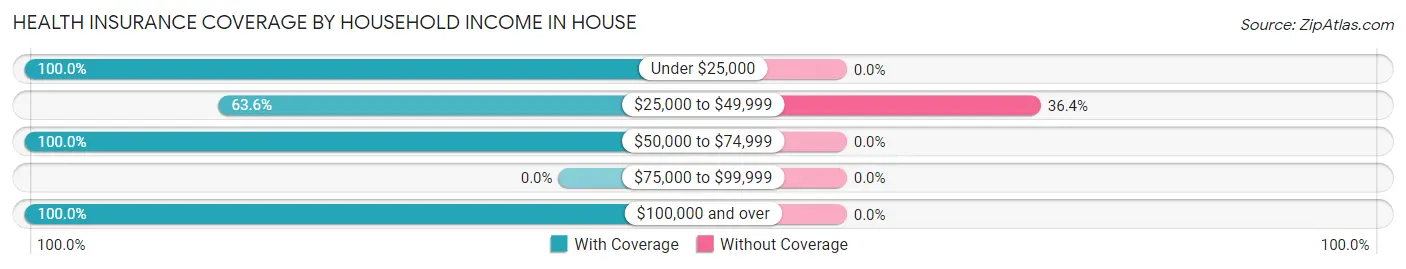
| Household Income | With Coverage | Without Coverage |
| Under $25,000 | 32 (100.0%) | 0 (0.0%) |
| $25,000 to $49,999 | 7 (63.6%) | 4 (36.4%) |
| $50,000 to $74,999 | 5 (100.0%) | 0 (0.0%) |
| $75,000 to $99,999 | 0 (0.0%) | 0 (0.0%) |
| $100,000 and over | 9 (100.0%) | 0 (0.0%) |
Public vs Private Health Insurance Coverage by Age in House
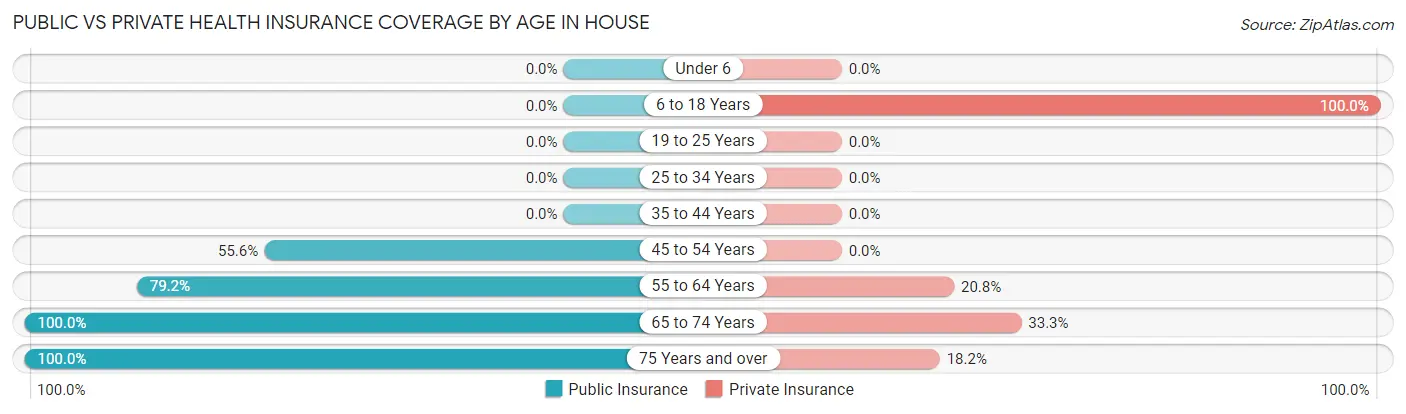
| Age Bracket | Public Insurance | Private Insurance |
| Under 6 | 0 (0.0%) | 0 (0.0%) |
| 6 to 18 Years | 0 (0.0%) | 4 (100.0%) |
| 19 to 25 Years | 0 (0.0%) | 0 (0.0%) |
| 25 to 34 Years | 0 (0.0%) | 0 (0.0%) |
| 35 to 44 Years | 0 (0.0%) | 0 (0.0%) |
| 45 to 54 Years | 5 (55.6%) | 0 (0.0%) |
| 55 to 64 Years | 19 (79.2%) | 5 (20.8%) |
| 65 to 74 Years | 9 (100.0%) | 3 (33.3%) |
| 75 Years and over | 11 (100.0%) | 2 (18.2%) |
| Total | 44 (77.2%) | 14 (24.6%) |
Disability Status by Sex by Age in House
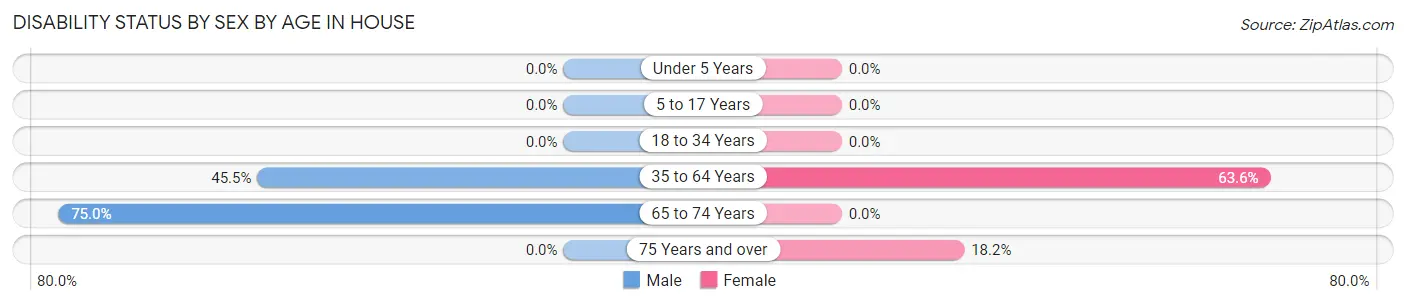
| Age Bracket | Male | Female |
| Under 5 Years | 0 (0.0%) | 0 (0.0%) |
| 5 to 17 Years | 0 (0.0%) | 0 (0.0%) |
| 18 to 34 Years | 0 (0.0%) | 0 (0.0%) |
| 35 to 64 Years | 10 (45.5%) | 7 (63.6%) |
| 65 to 74 Years | 3 (75.0%) | 0 (0.0%) |
| 75 Years and over | 0 (0.0%) | 2 (18.2%) |
Disability Class by Sex by Age in House
Disability Class: Hearing Difficulty
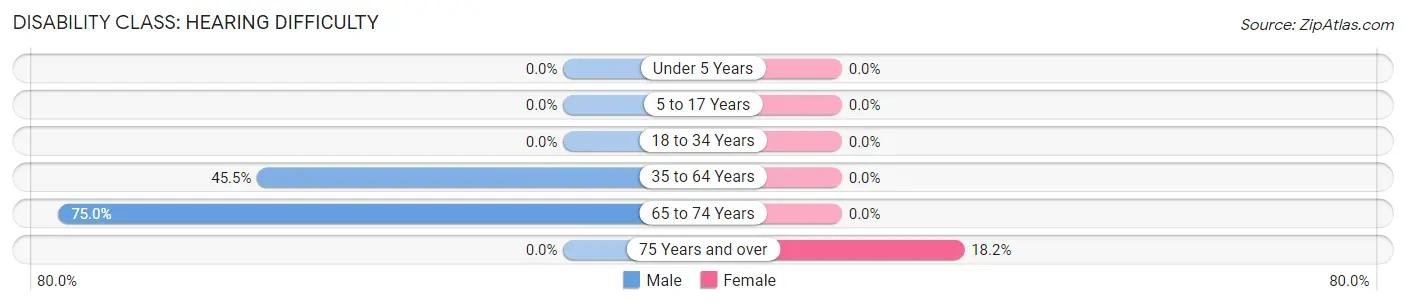
| Age Bracket | Male | Female |
| Under 5 Years | 0 (0.0%) | 0 (0.0%) |
| 5 to 17 Years | 0 (0.0%) | 0 (0.0%) |
| 18 to 34 Years | 0 (0.0%) | 0 (0.0%) |
| 35 to 64 Years | 10 (45.5%) | 0 (0.0%) |
| 65 to 74 Years | 3 (75.0%) | 0 (0.0%) |
| 75 Years and over | 0 (0.0%) | 2 (18.2%) |
Disability Class: Vision Difficulty
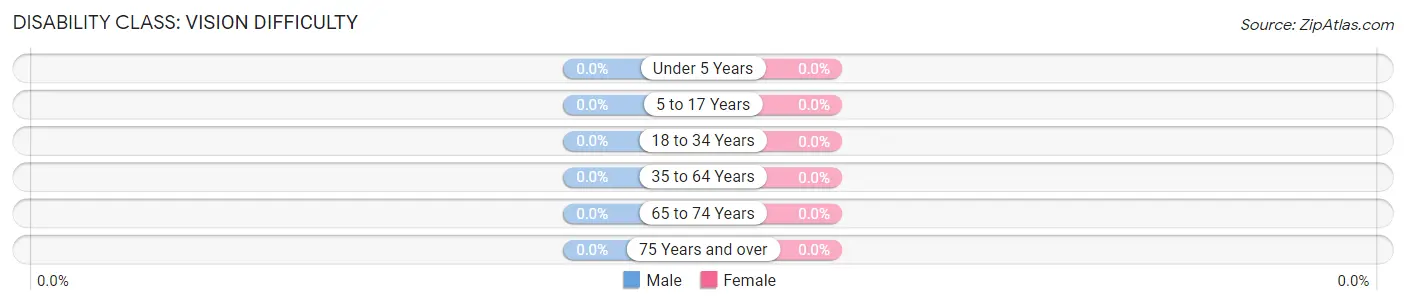
| Age Bracket | Male | Female |
| Under 5 Years | 0 (0.0%) | 0 (0.0%) |
| 5 to 17 Years | 0 (0.0%) | 0 (0.0%) |
| 18 to 34 Years | 0 (0.0%) | 0 (0.0%) |
| 35 to 64 Years | 0 (0.0%) | 0 (0.0%) |
| 65 to 74 Years | 0 (0.0%) | 0 (0.0%) |
| 75 Years and over | 0 (0.0%) | 0 (0.0%) |
Disability Class: Cognitive Difficulty
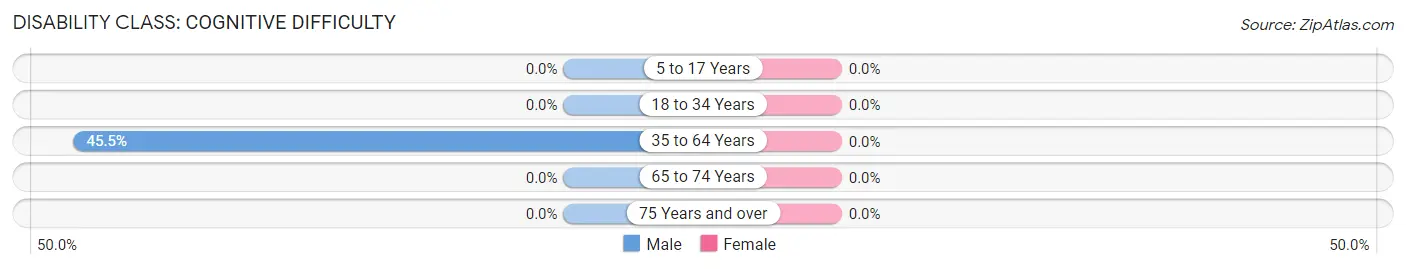
| Age Bracket | Male | Female |
| 5 to 17 Years | 0 (0.0%) | 0 (0.0%) |
| 18 to 34 Years | 0 (0.0%) | 0 (0.0%) |
| 35 to 64 Years | 10 (45.5%) | 0 (0.0%) |
| 65 to 74 Years | 0 (0.0%) | 0 (0.0%) |
| 75 Years and over | 0 (0.0%) | 0 (0.0%) |
Disability Class: Ambulatory Difficulty
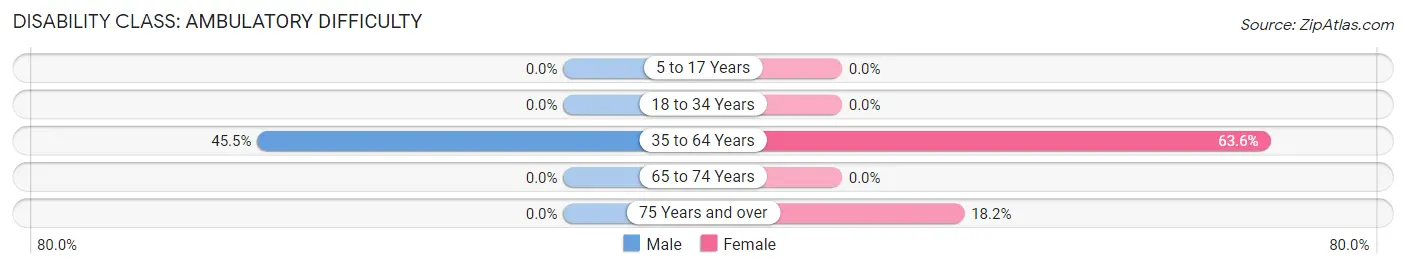
| Age Bracket | Male | Female |
| 5 to 17 Years | 0 (0.0%) | 0 (0.0%) |
| 18 to 34 Years | 0 (0.0%) | 0 (0.0%) |
| 35 to 64 Years | 10 (45.5%) | 7 (63.6%) |
| 65 to 74 Years | 0 (0.0%) | 0 (0.0%) |
| 75 Years and over | 0 (0.0%) | 2 (18.2%) |
Disability Class: Self-Care Difficulty
| Age Bracket | Male | Female |
| 5 to 17 Years | 0 (0.0%) | 0 (0.0%) |
| 18 to 34 Years | 0 (0.0%) | 0 (0.0%) |
| 35 to 64 Years | 0 (0.0%) | 0 (0.0%) |
| 65 to 74 Years | 0 (0.0%) | 0 (0.0%) |
| 75 Years and over | 0 (0.0%) | 0 (0.0%) |
Technology Access in House
Computing Device Access in House
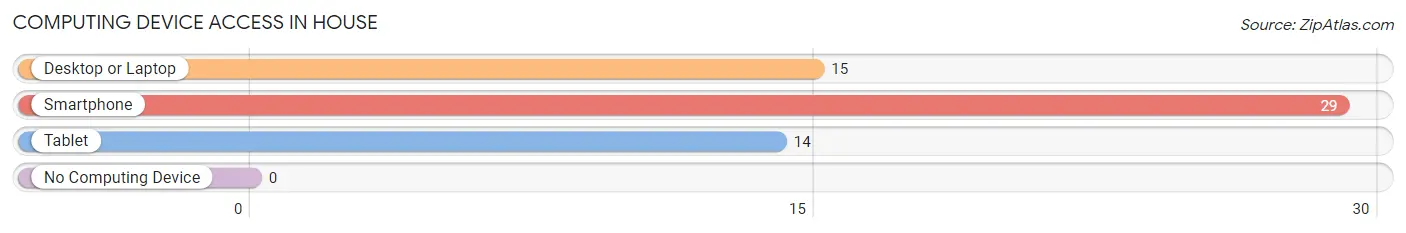
| Device Type | # Households | % Households |
| Desktop or Laptop | 15 | 51.7% |
| Smartphone | 29 | 100.0% |
| Tablet | 14 | 48.3% |
| No Computing Device | 0 | 0.0% |
| Total | 29 | 100.0% |
Internet Access in House
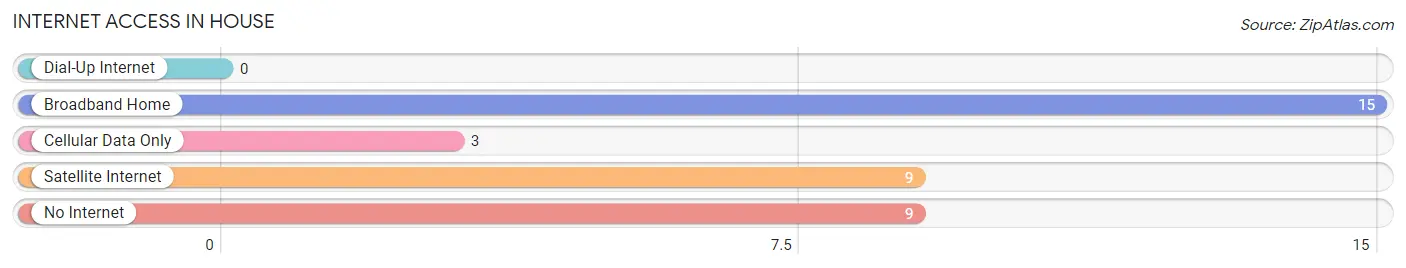
| Internet Type | # Households | % Households |
| Dial-Up Internet | 0 | 0.0% |
| Broadband Home | 15 | 51.7% |
| Cellular Data Only | 3 | 10.3% |
| Satellite Internet | 9 | 31.0% |
| No Internet | 9 | 31.0% |
| Total | 29 | 100.0% |
House Summary
House is a small unincorporated community located in the state of New Mexico. It is situated in the southeastern corner of the state, in the county of Eddy. The community is located on the banks of the Pecos River, and is surrounded by the Chihuahuan Desert. The nearest major city is Carlsbad, which is located about 25 miles to the south.
History
The area around House was first settled by the Mescalero Apache in the late 1700s. The Mescalero Apache were a nomadic tribe that roamed the area, hunting and gathering food. In the early 1800s, the area was settled by Spanish settlers, who established a small village near the Pecos River. The village was named House, after the nearby House Mountains.
In the late 1800s, the area around House was settled by ranchers and farmers. The ranchers raised cattle and sheep, while the farmers grew crops such as corn, wheat, and alfalfa. The area was also home to a number of small mining operations, which produced copper, lead, and zinc.
In the early 1900s, the area around House was connected to the rest of the state by the Atchison, Topeka and Santa Fe Railway. This allowed for the development of the town, and it soon became a popular stop for travelers.
Geography
House is located in the southeastern corner of New Mexico, in the county of Eddy. The community is situated on the banks of the Pecos River, and is surrounded by the Chihuahuan Desert. The area is characterized by flat, arid terrain, with occasional hills and mesas. The climate is semi-arid, with hot summers and mild winters.
Economy
The economy of House is largely based on agriculture and ranching. The area is home to a number of small farms and ranches, which produce crops such as corn, wheat, and alfalfa. The area is also home to a number of small mining operations, which produce copper, lead, and zinc.
In addition to agriculture and mining, the area is also home to a number of small businesses, such as restaurants, stores, and gas stations. The town is also home to a number of tourist attractions, such as the House Mountains National Monument and the Pecos River.
Demographics
As of the 2010 census, the population of House was 1,845. The racial makeup of the town was 94.3% White, 0.7% African American, 0.3% Native American, 0.2% Asian, 0.1% Pacific Islander, and 4.4% from other races. The median household income was $30,938, and the median family income was $35,625. The per capita income was $14,945.
Common Questions
What is Per Capita Income in House?
Per Capita income in House is $19,472.
What is Inequality or Gini Index in House?
Inequality or Gini Index in House is 0.50.
What is the Total Population of House?
Total Population of House is 57.
What is the Total Male Population of House?
Total Male Population of House is 26.
What is the Total Female Population of House?
Total Female Population of House is 31.
What is the Ratio of Males per 100 Females in House?
There are 83.87 Males per 100 Females in House.
What is the Ratio of Females per 100 Males in House?
There are 119.23 Females per 100 Males in House.
What is the Median Population Age in House?
Median Population Age in House is 60.5 Years.
What is the Average Family Size in House
Average Family Size in House is 3.0 People.
What is the Average Household Size in House
Average Household Size in House is 2.0 People.
How Large is the Labor Force in House?
There are 9 People in the Labor Forcein in House.
What is the Percentage of People in the Labor Force in House?
17.0% of People are in the Labor Force in House.