Zip Codes with the Highest Percentage of Population Employed in Administrative & Support Services in Roswell, NM
RELATED REPORTS & OPTIONS
Administrative & Support Services
Roswell
Compare Zip Codes
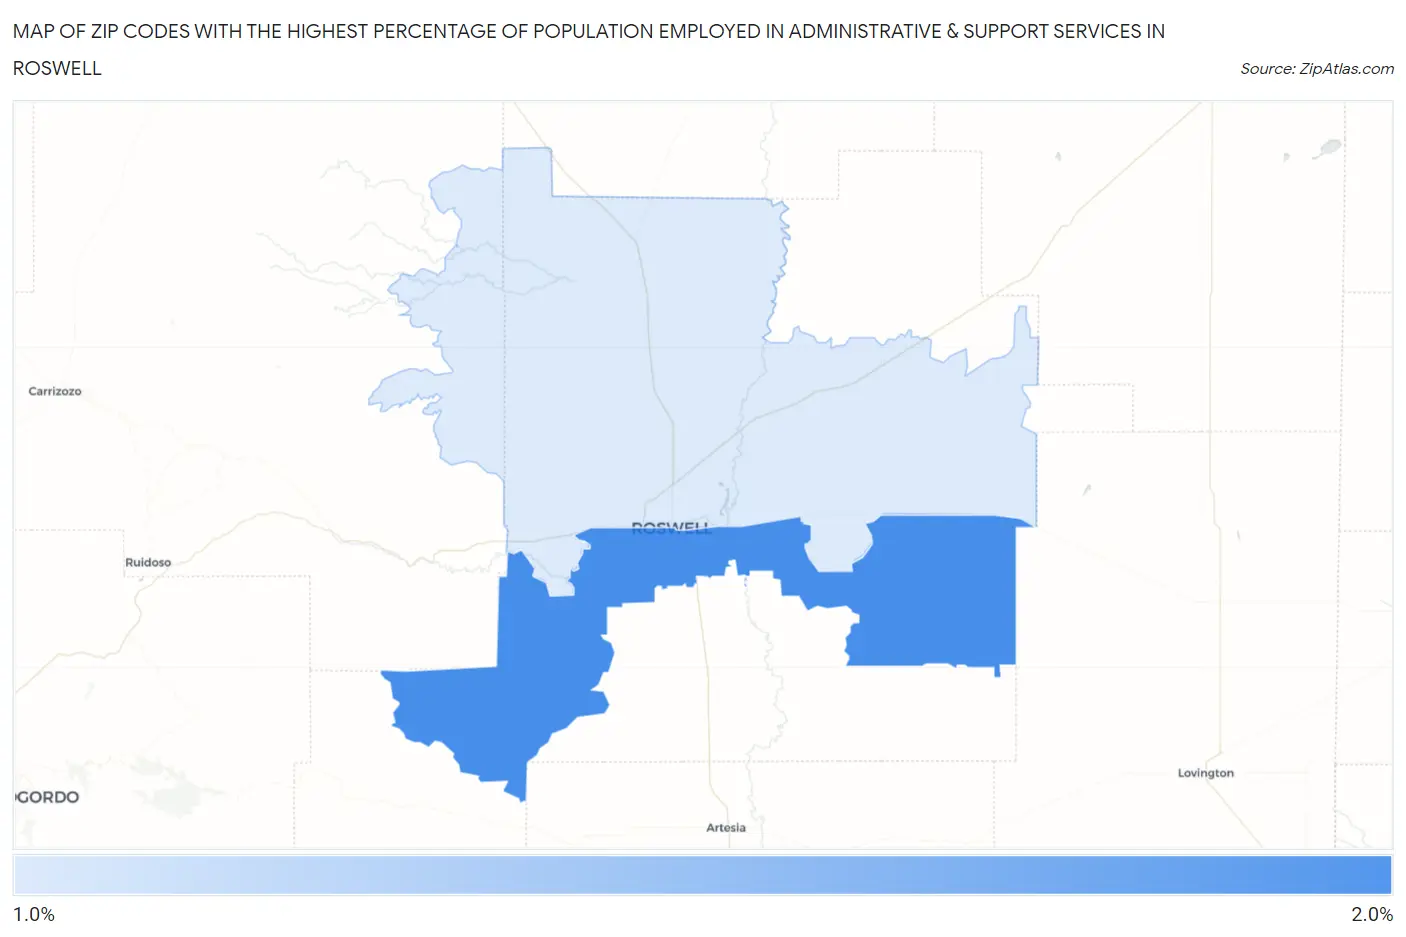
Map of Zip Codes with the Highest Percentage of Population Employed in Administrative & Support Services in Roswell
1.6%
1.7%
Zip Codes with the Highest Percentage of Population Employed in Administrative & Support Services in Roswell, NM
| Zip Code | % Employed | vs State | vs National | |
| 1. | 88203 | 1.7% | 3.9%(-2.24)#144 | 4.1%(-2.44)#21,913 |
| 2. | 88201 | 1.6% | 3.9%(-2.30)#146 | 4.1%(-2.50)#22,179 |
1
Common Questions
What are the Top Zip Codes with the Highest Percentage of Population Employed in Administrative & Support Services in Roswell, NM?
Top Zip Codes with the Highest Percentage of Population Employed in Administrative & Support Services in Roswell, NM are:
What zip code has the Highest Percentage of Population Employed in Administrative & Support Services in Roswell, NM?
88203 has the Highest Percentage of Population Employed in Administrative & Support Services in Roswell, NM with 1.7%.
What is the Percentage of Population Employed in Administrative & Support Services in Roswell, NM?
Percentage of Population Employed in Administrative & Support Services in Roswell is 1.9%.
What is the Percentage of Population Employed in Administrative & Support Services in New Mexico?
Percentage of Population Employed in Administrative & Support Services in New Mexico is 3.9%.
What is the Percentage of Population Employed in Administrative & Support Services in the United States?
Percentage of Population Employed in Administrative & Support Services in the United States is 4.1%.