Monterey Park, NM Map & Demographics
Monterey Park Map
Monterey Park Overview
$9,739
PER CAPITA INCOME
$25,357
AVG HOUSEHOLD INCOME
0.19
INEQUALITY / GINI INDEX
584
TOTAL POPULATION
331
MALE POPULATION
253
FEMALE POPULATION
130.83
MALES / 100 FEMALES
76.44
FEMALES / 100 MALES
29.9
MEDIAN AGE
4.1
AVG FAMILY SIZE
3.1
AVG HOUSEHOLD SIZE
215
LABOR FORCE [ PEOPLE ]
56.3%
PERCENT IN LABOR FORCE
24.7%
UNEMPLOYMENT RATE
Income in Monterey Park
Income Overview in Monterey Park
| Characteristic | Number | Measure |
| Per Capita Income | 584 | $9,739 |
| Median Family Income | 121 | $0 |
| Mean Family Income | 121 | $31,647 |
| Median Household Income | 188 | $25,357 |
| Mean Household Income | 188 | $29,897 |
| Income Deficit | 121 | $0 |
| Wage / Income Gap (%) | 584 | 0.00% |
| Wage / Income Gap ($) | 584 | 100.00¢ per $1 |
| Gini / Inequality Index | 584 | 0.19 |
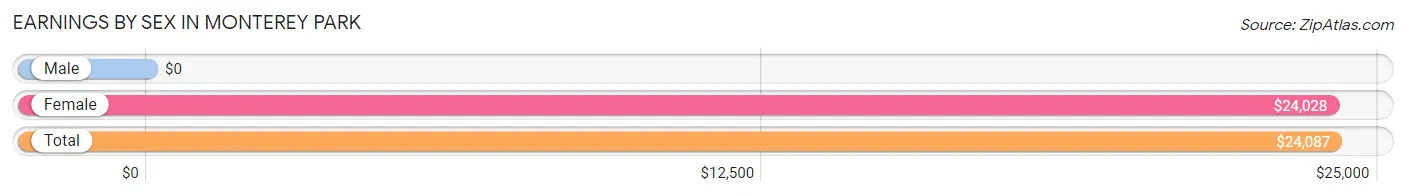
Earnings by Sex in Monterey Park
| Sex | Number | Average Earnings |
| Male | 73 (41.9%) | $0 |
| Female | 101 (58.1%) | $24,028 |
| Total | 174 (100.0%) | $24,087 |
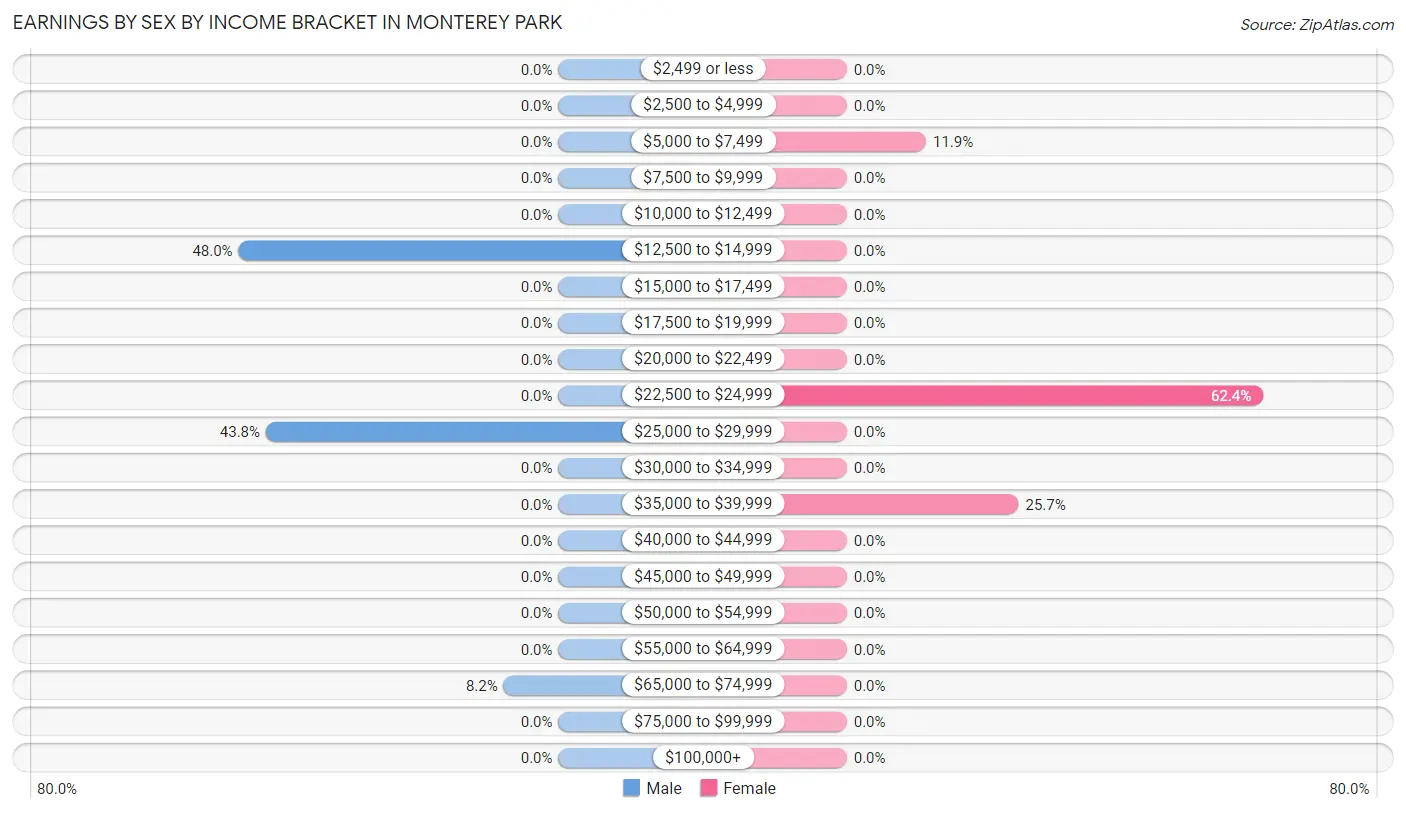
Earnings by Sex by Income Bracket in Monterey Park
The most common earnings brackets in Monterey Park are $12,500 to $14,999 for men (35 | 47.9%) and $22,500 to $24,999 for women (63 | 62.4%).
| Income | Male | Female |
| $2,499 or less | 0 (0.0%) | 0 (0.0%) |
| $2,500 to $4,999 | 0 (0.0%) | 0 (0.0%) |
| $5,000 to $7,499 | 0 (0.0%) | 12 (11.9%) |
| $7,500 to $9,999 | 0 (0.0%) | 0 (0.0%) |
| $10,000 to $12,499 | 0 (0.0%) | 0 (0.0%) |
| $12,500 to $14,999 | 35 (47.9%) | 0 (0.0%) |
| $15,000 to $17,499 | 0 (0.0%) | 0 (0.0%) |
| $17,500 to $19,999 | 0 (0.0%) | 0 (0.0%) |
| $20,000 to $22,499 | 0 (0.0%) | 0 (0.0%) |
| $22,500 to $24,999 | 0 (0.0%) | 63 (62.4%) |
| $25,000 to $29,999 | 32 (43.8%) | 0 (0.0%) |
| $30,000 to $34,999 | 0 (0.0%) | 0 (0.0%) |
| $35,000 to $39,999 | 0 (0.0%) | 26 (25.7%) |
| $40,000 to $44,999 | 0 (0.0%) | 0 (0.0%) |
| $45,000 to $49,999 | 0 (0.0%) | 0 (0.0%) |
| $50,000 to $54,999 | 0 (0.0%) | 0 (0.0%) |
| $55,000 to $64,999 | 0 (0.0%) | 0 (0.0%) |
| $65,000 to $74,999 | 6 (8.2%) | 0 (0.0%) |
| $75,000 to $99,999 | 0 (0.0%) | 0 (0.0%) |
| $100,000+ | 0 (0.0%) | 0 (0.0%) |
| Total | 73 (100.0%) | 101 (100.0%) |
Earnings by Sex by Educational Attainment in Monterey Park
| Educational Attainment | Male Income | Female Income |
| Less than High School | - | - |
| High School Diploma | - | - |
| College or Associate's Degree | - | - |
| Bachelor's Degree | - | - |
| Graduate Degree | - | - |
| Total | - | - |
Family Income in Monterey Park
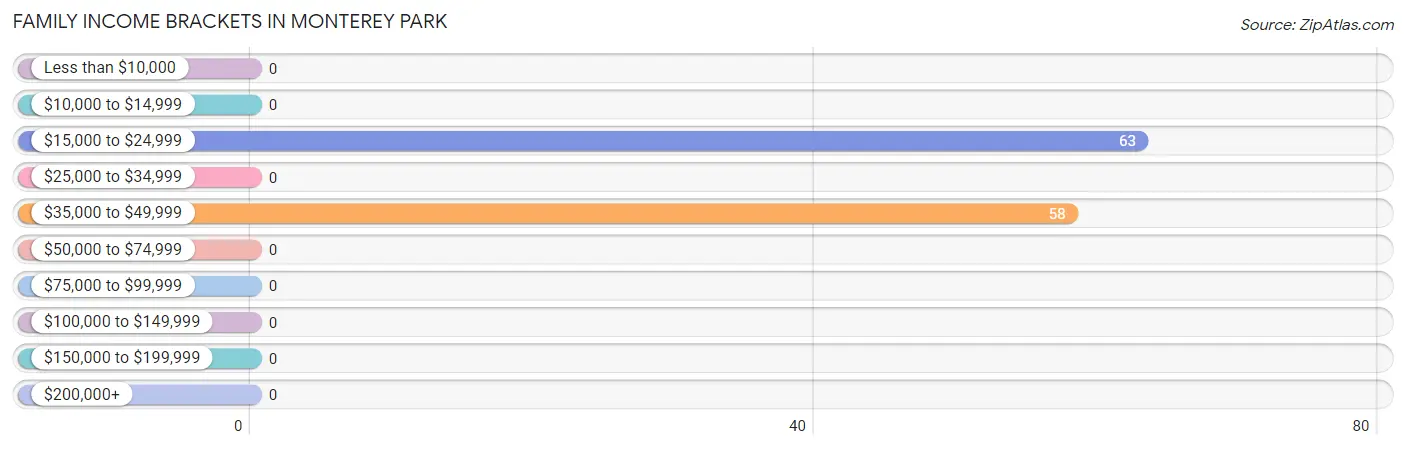
Family Income Brackets in Monterey Park
According to the Monterey Park family income data, there are 63 families falling into the $15,000 to $24,999 income range, which is the most common income bracket and makes up 52.1% of all families.
| Income Bracket | # Families | % Families |
| Less than $10,000 | 0 | 0.0% |
| $10,000 to $14,999 | 0 | 0.0% |
| $15,000 to $24,999 | 63 | 52.1% |
| $25,000 to $34,999 | 0 | 0.0% |
| $35,000 to $49,999 | 58 | 47.9% |
| $50,000 to $74,999 | 0 | 0.0% |
| $75,000 to $99,999 | 0 | 0.0% |
| $100,000 to $149,999 | 0 | 0.0% |
| $150,000 to $199,999 | 0 | 0.0% |
| $200,000+ | 0 | 0.0% |
Family Income by Famaliy Size in Monterey Park
| Income Bracket | # Families | Median Income |
| 2-Person Families | 32 (26.5%) | $0 |
| 3-Person Families | 0 (0.0%) | $0 |
| 4-Person Families | 63 (52.1%) | $0 |
| 5-Person Families | 0 (0.0%) | $0 |
| 6-Person Families | 0 (0.0%) | $0 |
| 7+ Person Families | 26 (21.5%) | $0 |
| Total | 121 (100.0%) | $0 |
Family Income by Number of Earners in Monterey Park
| Number of Earners | # Families | Median Income |
| No Earners | 0 (0.0%) | $0 |
| 1 Earner | 121 (100.0%) | $0 |
| 2 Earners | 0 (0.0%) | $0 |
| 3+ Earners | 0 (0.0%) | $0 |
| Total | 121 (100.0%) | $0 |
Household Income in Monterey Park
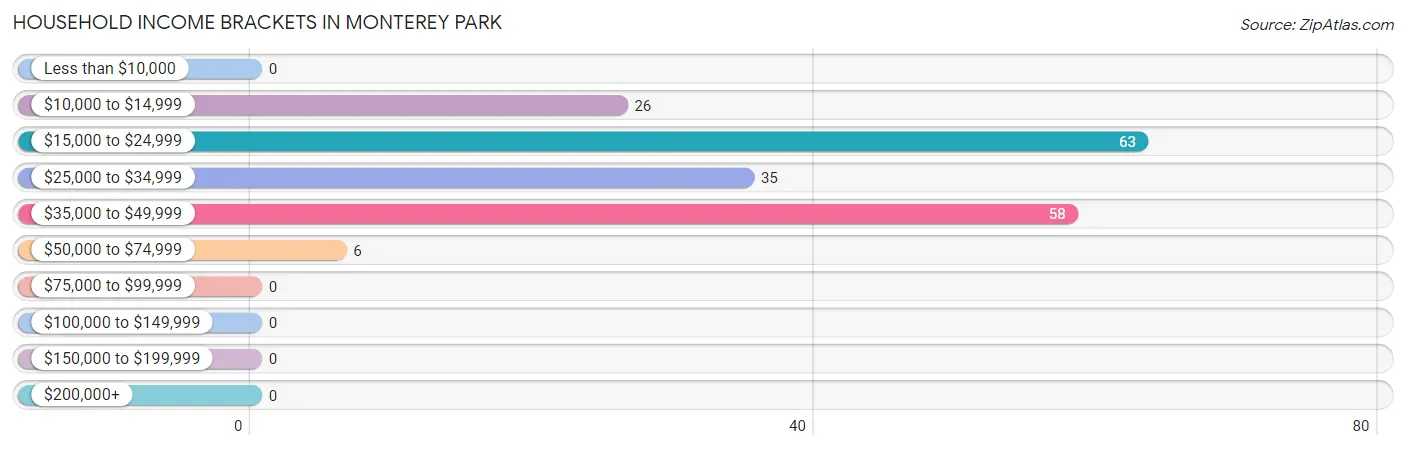
Household Income Brackets in Monterey Park
With 63 households falling in the category, the $15,000 to $24,999 income range is the most frequent in Monterey Park, accounting for 33.5% of all households.
| Income Bracket | # Households | % Households |
| Less than $10,000 | 0 | 0.0% |
| $10,000 to $14,999 | 26 | 13.8% |
| $15,000 to $24,999 | 63 | 33.5% |
| $25,000 to $34,999 | 35 | 18.6% |
| $35,000 to $49,999 | 58 | 30.9% |
| $50,000 to $74,999 | 6 | 3.2% |
| $75,000 to $99,999 | 0 | 0.0% |
| $100,000 to $149,999 | 0 | 0.0% |
| $150,000 to $199,999 | 0 | 0.0% |
| $200,000+ | 0 | 0.0% |
Household Income by Householder Age in Monterey Park
The median household income in Monterey Park is $25,357, with the highest median household income of $24,385 found in the 25 to 44 years age bracket for the primary householder. A total of 95 households (50.5%) fall into this category.
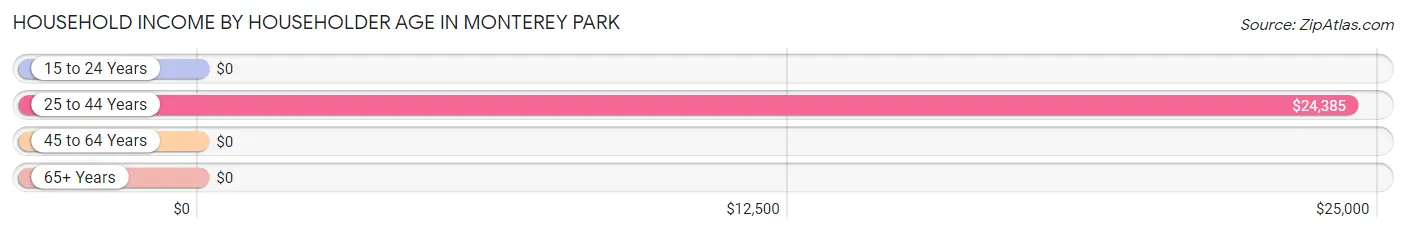
| Income Bracket | # Households | Median Income |
| 15 to 24 Years | 0 (0.0%) | $0 |
| 25 to 44 Years | 95 (50.5%) | $24,385 |
| 45 to 64 Years | 26 (13.8%) | $0 |
| 65+ Years | 67 (35.6%) | $0 |
| Total | 188 (100.0%) | $25,357 |
Poverty in Monterey Park
Income Below Poverty by Sex and Age in Monterey Park
With 77.5% poverty level for males and 82.5% for females among the residents of Monterey Park, under 5 year old males and under 5 year old females are the most vulnerable to poverty, with 21 males (100.0%) and 29 females (100.0%) in their respective age groups living below the poverty level.
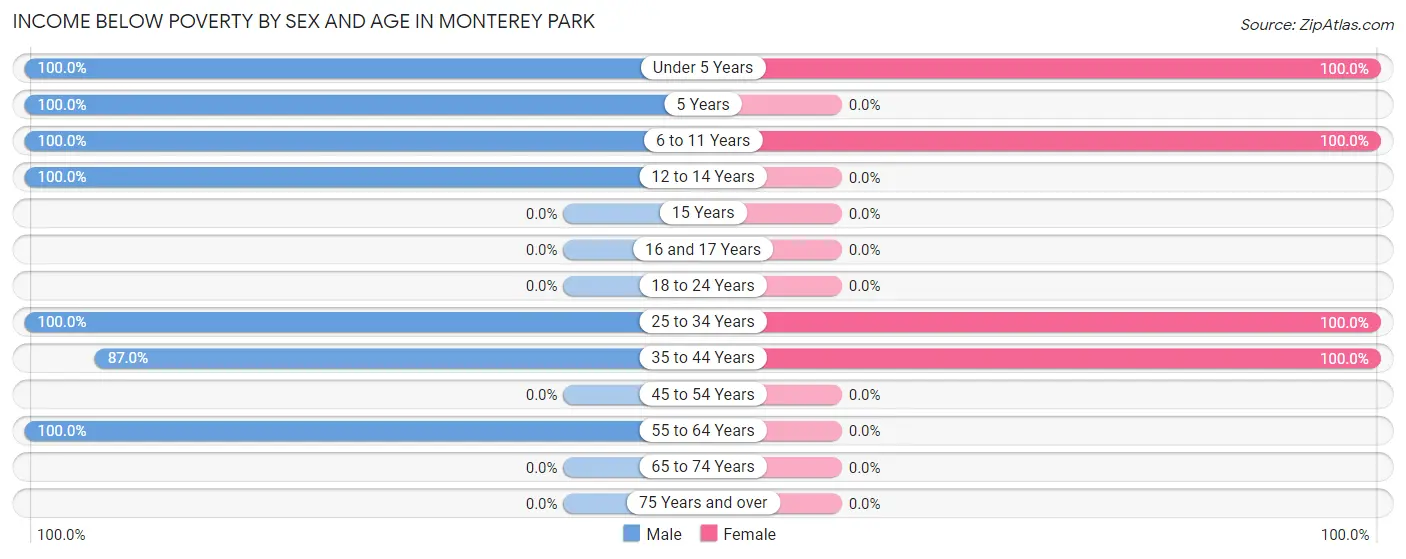
| Age Bracket | Male | Female |
| Under 5 Years | 21 (100.0%) | 29 (100.0%) |
| 5 Years | 45 (100.0%) | 0 (0.0%) |
| 6 to 11 Years | 21 (100.0%) | 26 (100.0%) |
| 12 to 14 Years | 46 (100.0%) | 0 (0.0%) |
| 15 Years | 0 (0.0%) | 0 (0.0%) |
| 16 and 17 Years | 0 (0.0%) | 0 (0.0%) |
| 18 to 24 Years | 0 (0.0%) | 0 (0.0%) |
| 25 to 34 Years | 53 (100.0%) | 58 (100.0%) |
| 35 to 44 Years | 40 (87.0%) | 89 (100.0%) |
| 45 to 54 Years | 0 (0.0%) | 0 (0.0%) |
| 55 to 64 Years | 26 (100.0%) | 0 (0.0%) |
| 65 to 74 Years | 0 (0.0%) | 0 (0.0%) |
| 75 Years and over | 0 (0.0%) | 0 (0.0%) |
| Total | 252 (77.5%) | 202 (82.5%) |
Income Above Poverty by Sex and Age in Monterey Park
According to the poverty statistics in Monterey Park, males aged 65 to 74 years and females aged 65 to 74 years are the age groups that are most secure financially, with 100.0% of males and 100.0% of females in these age groups living above the poverty line.
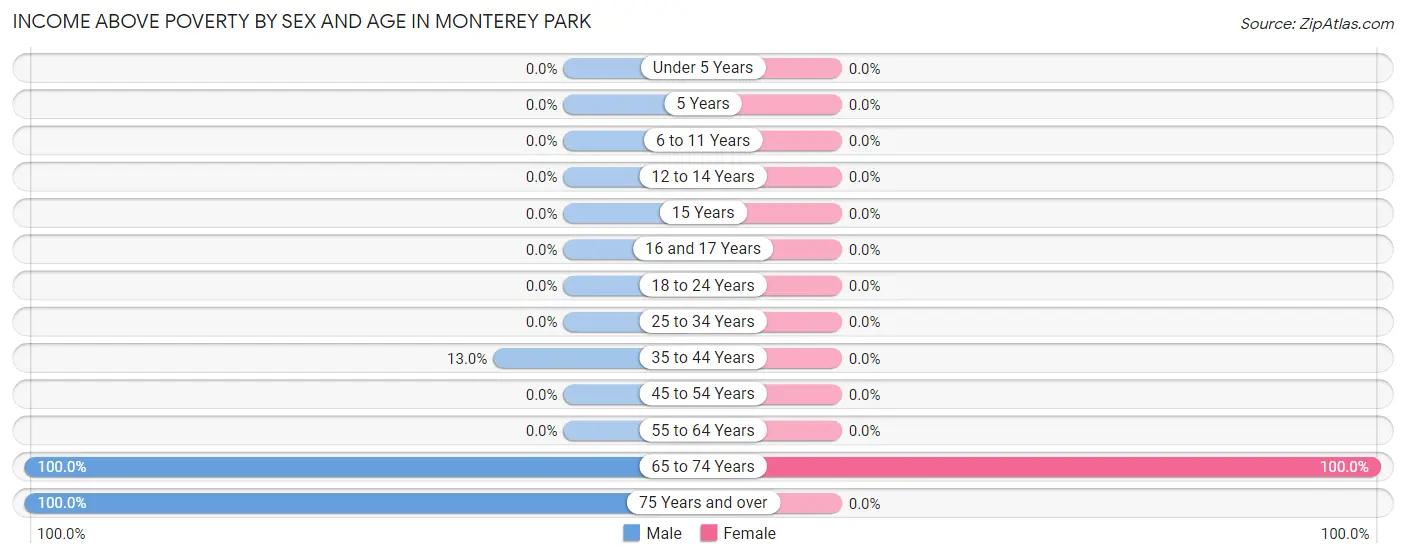
| Age Bracket | Male | Female |
| Under 5 Years | 0 (0.0%) | 0 (0.0%) |
| 5 Years | 0 (0.0%) | 0 (0.0%) |
| 6 to 11 Years | 0 (0.0%) | 0 (0.0%) |
| 12 to 14 Years | 0 (0.0%) | 0 (0.0%) |
| 15 Years | 0 (0.0%) | 0 (0.0%) |
| 16 and 17 Years | 0 (0.0%) | 0 (0.0%) |
| 18 to 24 Years | 0 (0.0%) | 0 (0.0%) |
| 25 to 34 Years | 0 (0.0%) | 0 (0.0%) |
| 35 to 44 Years | 6 (13.0%) | 0 (0.0%) |
| 45 to 54 Years | 0 (0.0%) | 0 (0.0%) |
| 55 to 64 Years | 0 (0.0%) | 0 (0.0%) |
| 65 to 74 Years | 35 (100.0%) | 43 (100.0%) |
| 75 Years and over | 32 (100.0%) | 0 (0.0%) |
| Total | 73 (22.5%) | 43 (17.5%) |
Income Below Poverty Among Married-Couple Families in Monterey Park
The poverty statistics for married-couple families in Monterey Park show that 66.3% or 63 of the total 95 families live below the poverty line. Families with 1 or 2 children have the highest poverty rate of 100.0%, comprising of 63 families. On the other hand, families with no children have the lowest poverty rate of 0.0%, which includes 0 families.
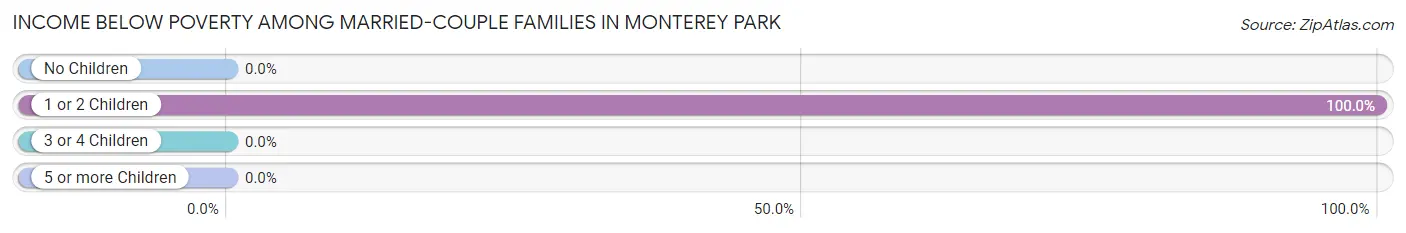
| Children | Above Poverty | Below Poverty |
| No Children | 32 (100.0%) | 0 (0.0%) |
| 1 or 2 Children | 0 (0.0%) | 63 (100.0%) |
| 3 or 4 Children | 0 (0.0%) | 0 (0.0%) |
| 5 or more Children | 0 (0.0%) | 0 (0.0%) |
| Total | 32 (33.7%) | 63 (66.3%) |
Income Below Poverty Among Single-Parent Households in Monterey Park
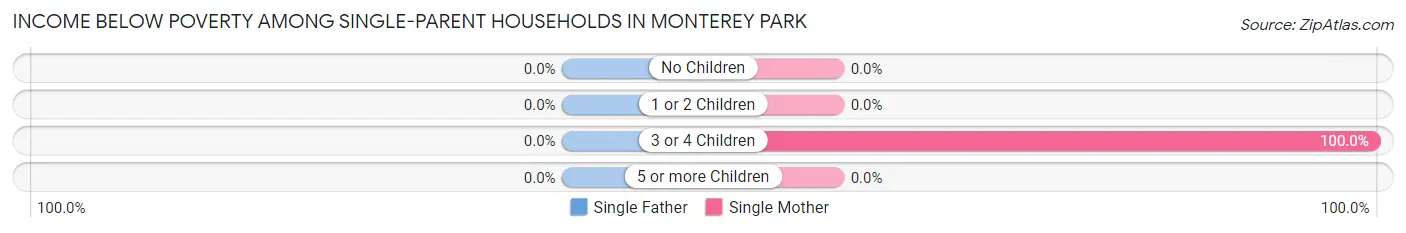
| Children | Single Father | Single Mother |
| No Children | 0 (0.0%) | 0 (0.0%) |
| 1 or 2 Children | 0 (0.0%) | 0 (0.0%) |
| 3 or 4 Children | 0 (0.0%) | 26 (100.0%) |
| 5 or more Children | 0 (0.0%) | 0 (0.0%) |
| Total | 0 (0.0%) | 26 (100.0%) |
Income Below Poverty Among Married-Couple vs Single-Parent Households in Monterey Park
The poverty data for Monterey Park shows that 63 of the married-couple family households (66.3%) and 26 of the single-parent households (100.0%) are living below the poverty level. Within the married-couple family households, those with 1 or 2 children have the highest poverty rate, with 63 households (100.0%) falling below the poverty line. Among the single-parent households, those with 3 or 4 children have the highest poverty rate, with 26 household (100.0%) living below poverty.
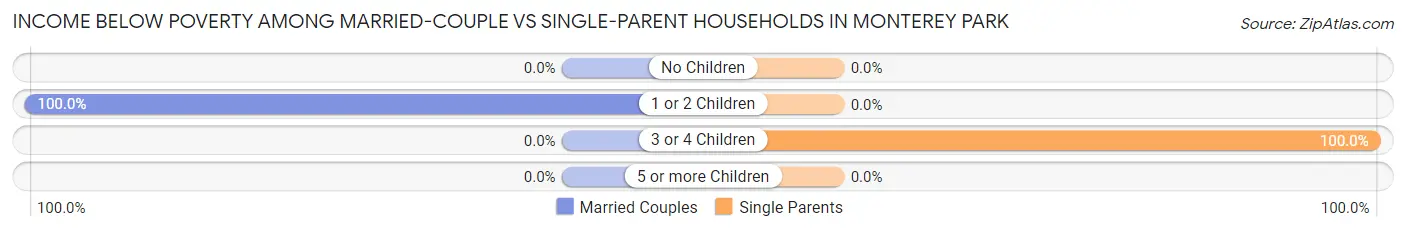
| Children | Married-Couple Families | Single-Parent Households |
| No Children | 0 (0.0%) | 0 (0.0%) |
| 1 or 2 Children | 63 (100.0%) | 0 (0.0%) |
| 3 or 4 Children | 0 (0.0%) | 26 (100.0%) |
| 5 or more Children | 0 (0.0%) | 0 (0.0%) |
| Total | 63 (66.3%) | 26 (100.0%) |
Race in Monterey Park
The most populous races in Monterey Park are Hispanic or Latino (521 | 89.2%), White / Caucasian (486 | 83.2%), and Two or more Races (98 | 16.8%).
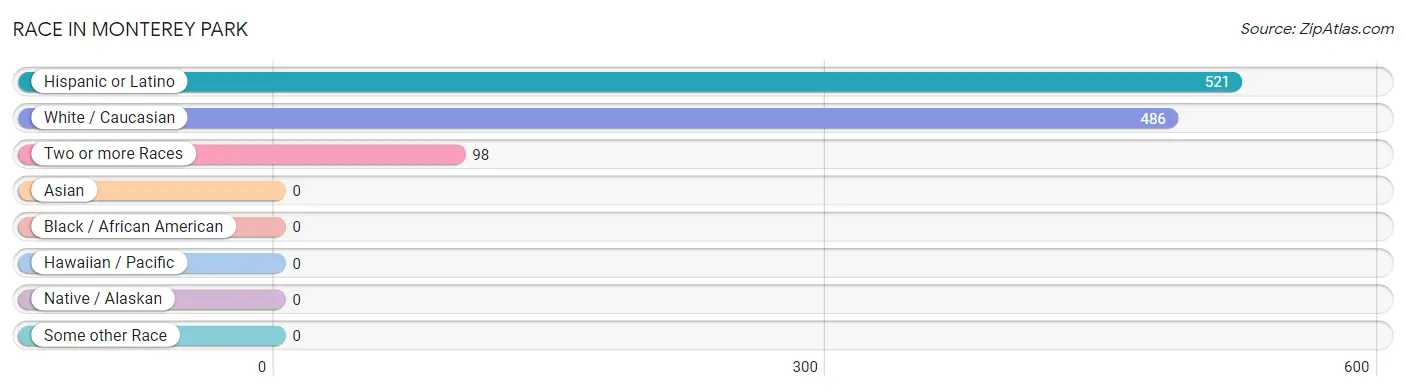
| Race | # Population | % Population |
| Asian | 0 | 0.0% |
| Black / African American | 0 | 0.0% |
| Hawaiian / Pacific | 0 | 0.0% |
| Hispanic or Latino | 521 | 89.2% |
| Native / Alaskan | 0 | 0.0% |
| White / Caucasian | 486 | 83.2% |
| Two or more Races | 98 | 16.8% |
| Some other Race | 0 | 0.0% |
| Total | 584 | 100.0% |
Ancestry in Monterey Park
The most populous ancestries reported in Monterey Park are Mexican (521 | 89.2%), Cherokee (63 | 10.8%), German (63 | 10.8%), Irish (63 | 10.8%), and American (26 | 4.4%), together accounting for 126.0% of all Monterey Park residents.
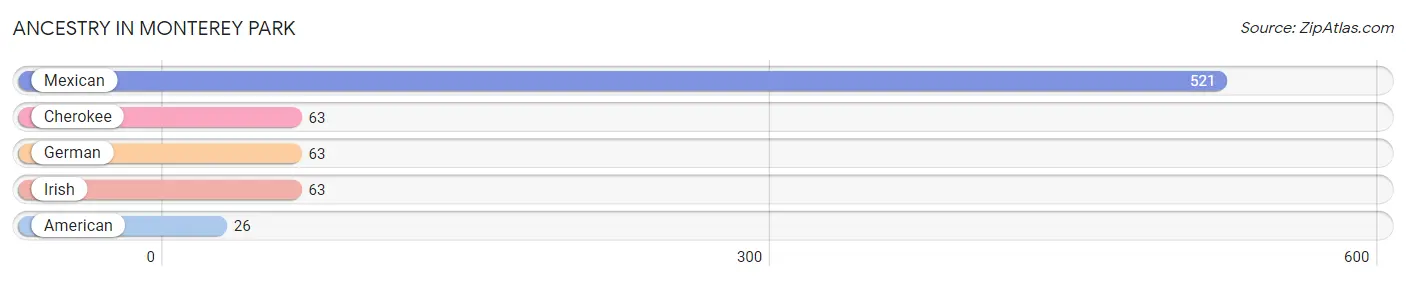
| Ancestry | # Population | % Population |
| American | 26 | 4.4% |
| Cherokee | 63 | 10.8% |
| German | 63 | 10.8% |
| Irish | 63 | 10.8% |
| Mexican | 521 | 89.2% | View All 5 Rows |
Immigrants in Monterey Park
The most numerous immigrant groups reported in Monterey Park came from Central America (122 | 20.9%), Latin America (122 | 20.9%), and Mexico (122 | 20.9%), together accounting for 62.7% of all Monterey Park residents.
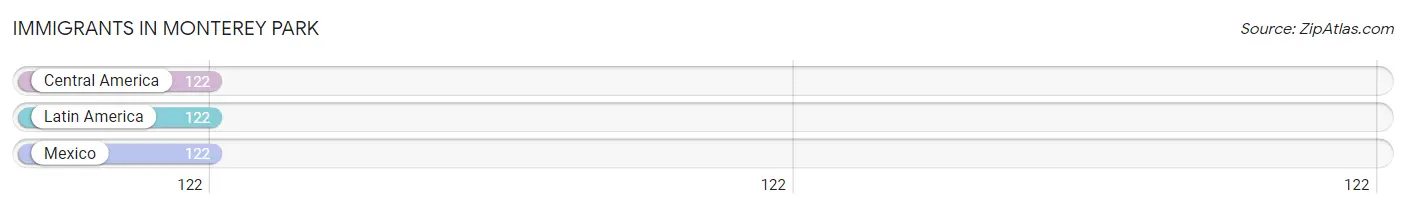
| Immigration Origin | # Population | % Population |
| Central America | 122 | 20.9% |
| Latin America | 122 | 20.9% |
| Mexico | 122 | 20.9% | View All 3 Rows |
Sex and Age in Monterey Park
Sex and Age in Monterey Park
The most populous age groups in Monterey Park are 5 to 9 Years (66 | 19.9%) for men and 40 to 44 Years (89 | 35.2%) for women.
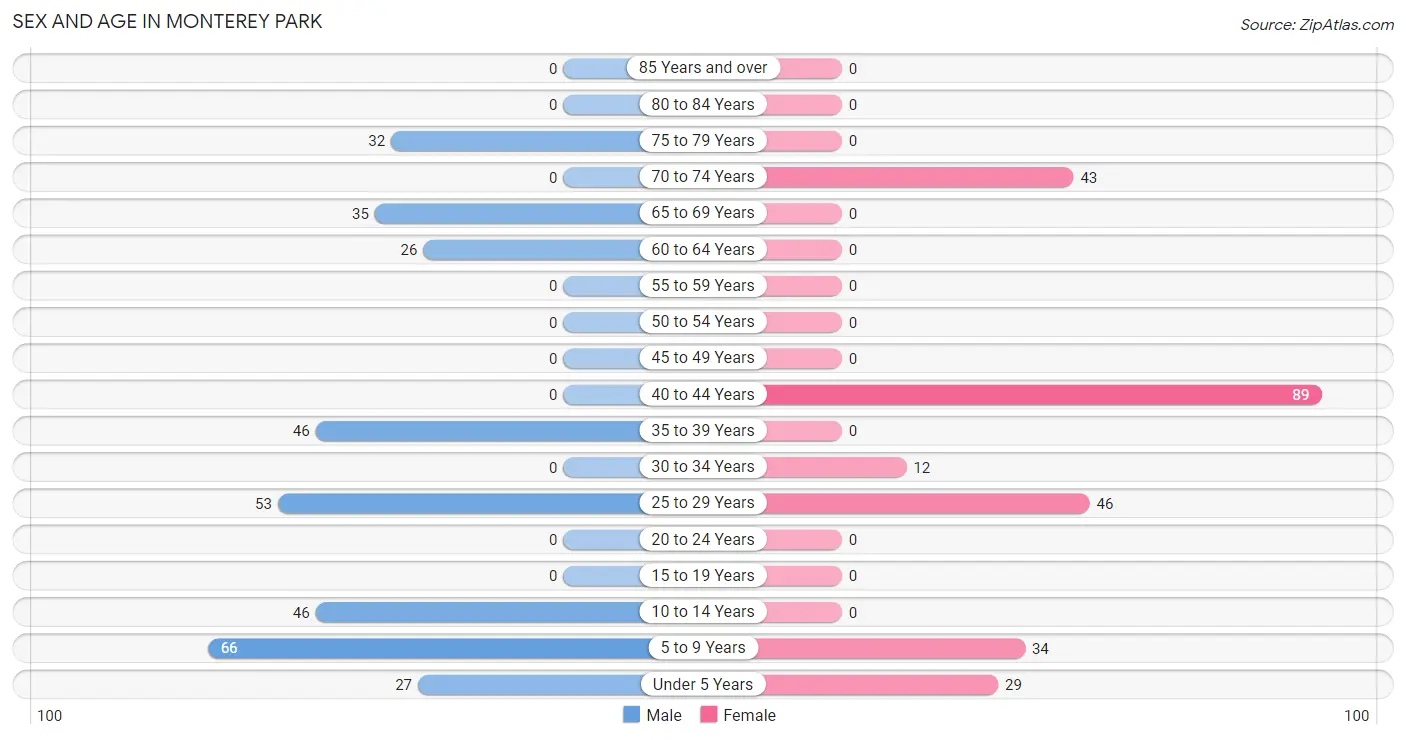
| Age Bracket | Male | Female |
| Under 5 Years | 27 (8.2%) | 29 (11.5%) |
| 5 to 9 Years | 66 (19.9%) | 34 (13.4%) |
| 10 to 14 Years | 46 (13.9%) | 0 (0.0%) |
| 15 to 19 Years | 0 (0.0%) | 0 (0.0%) |
| 20 to 24 Years | 0 (0.0%) | 0 (0.0%) |
| 25 to 29 Years | 53 (16.0%) | 46 (18.2%) |
| 30 to 34 Years | 0 (0.0%) | 12 (4.7%) |
| 35 to 39 Years | 46 (13.9%) | 0 (0.0%) |
| 40 to 44 Years | 0 (0.0%) | 89 (35.2%) |
| 45 to 49 Years | 0 (0.0%) | 0 (0.0%) |
| 50 to 54 Years | 0 (0.0%) | 0 (0.0%) |
| 55 to 59 Years | 0 (0.0%) | 0 (0.0%) |
| 60 to 64 Years | 26 (7.9%) | 0 (0.0%) |
| 65 to 69 Years | 35 (10.6%) | 0 (0.0%) |
| 70 to 74 Years | 0 (0.0%) | 43 (17.0%) |
| 75 to 79 Years | 32 (9.7%) | 0 (0.0%) |
| 80 to 84 Years | 0 (0.0%) | 0 (0.0%) |
| 85 Years and over | 0 (0.0%) | 0 (0.0%) |
| Total | 331 (100.0%) | 253 (100.0%) |
Families and Households in Monterey Park
Median Family Size in Monterey Park
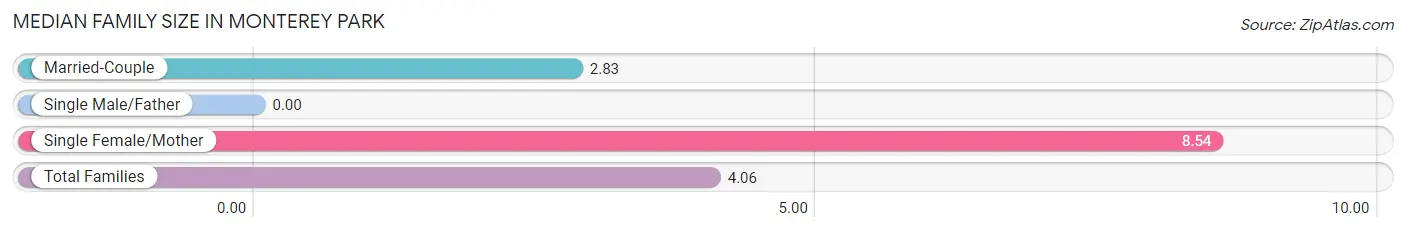
| Family Type | # Families | Family Size |
| Married-Couple | 95 (78.5%) | 2.83 |
| Single Male/Father | 0 (0.0%) | - |
| Single Female/Mother | 26 (21.5%) | 8.54 |
| Total Families | 121 (100.0%) | 4.06 |
Median Household Size in Monterey Park
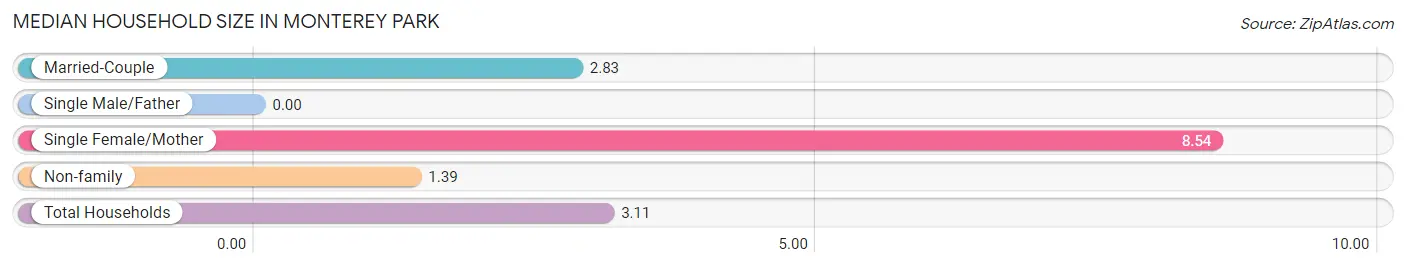
| Household Type | # Households | Household Size |
| Married-Couple | 95 (50.5%) | 2.83 |
| Single Male/Father | 0 (0.0%) | - |
| Single Female/Mother | 26 (13.8%) | 8.54 |
| Non-family | 67 (35.6%) | 1.39 |
| Total Households | 188 (100.0%) | 3.11 |
Household Size by Marriage Status in Monterey Park
Out of a total of 188 households in Monterey Park, 121 (64.4%) are family households, while 67 (35.6%) are nonfamily households. The most numerous type of family households are 4-person households, comprising 63, and the most common type of nonfamily households are 1-person households, comprising 61.
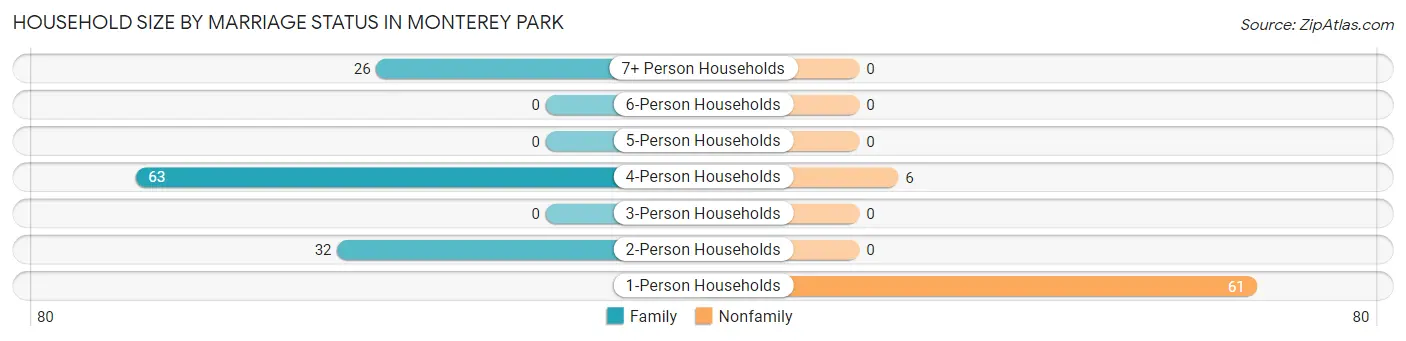
| Household Size | Family Households | Nonfamily Households |
| 1-Person Households | - | 61 (32.5%) |
| 2-Person Households | 32 (17.0%) | 0 (0.0%) |
| 3-Person Households | 0 (0.0%) | 0 (0.0%) |
| 4-Person Households | 63 (33.5%) | 6 (3.2%) |
| 5-Person Households | 0 (0.0%) | 0 (0.0%) |
| 6-Person Households | 0 (0.0%) | 0 (0.0%) |
| 7+ Person Households | 26 (13.8%) | 0 (0.0%) |
| Total | 121 (64.4%) | 67 (35.6%) |
Female Fertility in Monterey Park
Fertility by Age in Monterey Park
Average fertility rate in Monterey Park is 313.0 births per 1,000 women. Women in the age bracket of 20 to 34 years have the highest fertility rate with 793.0 births per 1,000 women. Women in the age bracket of 20 to 34 years acount for 100.0% of all women with births.
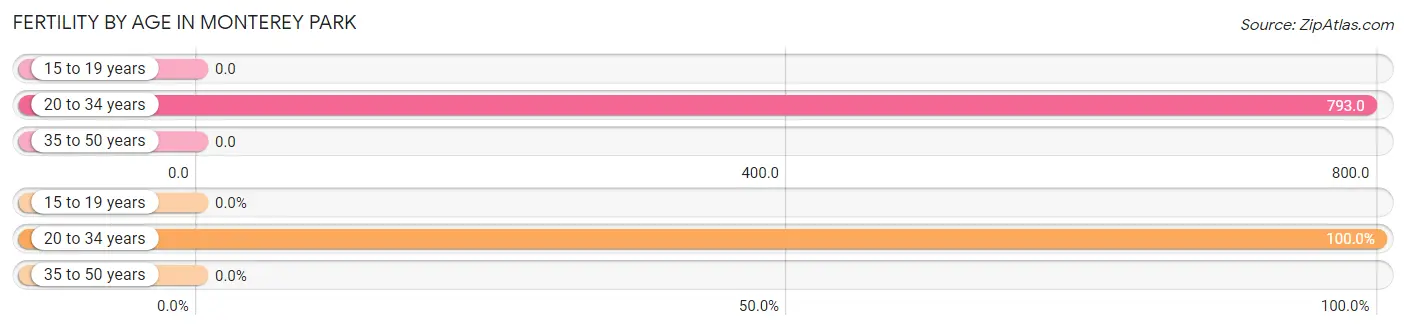
| Age Bracket | Women with Births | Births / 1,000 Women |
| 15 to 19 years | 0 (0.0%) | 0.0 |
| 20 to 34 years | 46 (100.0%) | 793.0 |
| 35 to 50 years | 0 (0.0%) | 0.0 |
| Total | 46 (100.0%) | 313.0 |
Fertility by Age by Marriage Status in Monterey Park
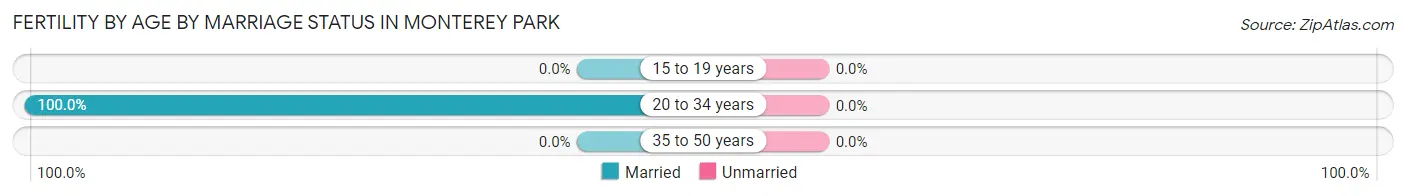
| Age Bracket | Married | Unmarried |
| 15 to 19 years | 0 (0.0%) | 0 (0.0%) |
| 20 to 34 years | 46 (100.0%) | 0 (0.0%) |
| 35 to 50 years | 0 (0.0%) | 0 (0.0%) |
| Total | 46 (100.0%) | 0 (0.0%) |
Fertility by Education in Monterey Park
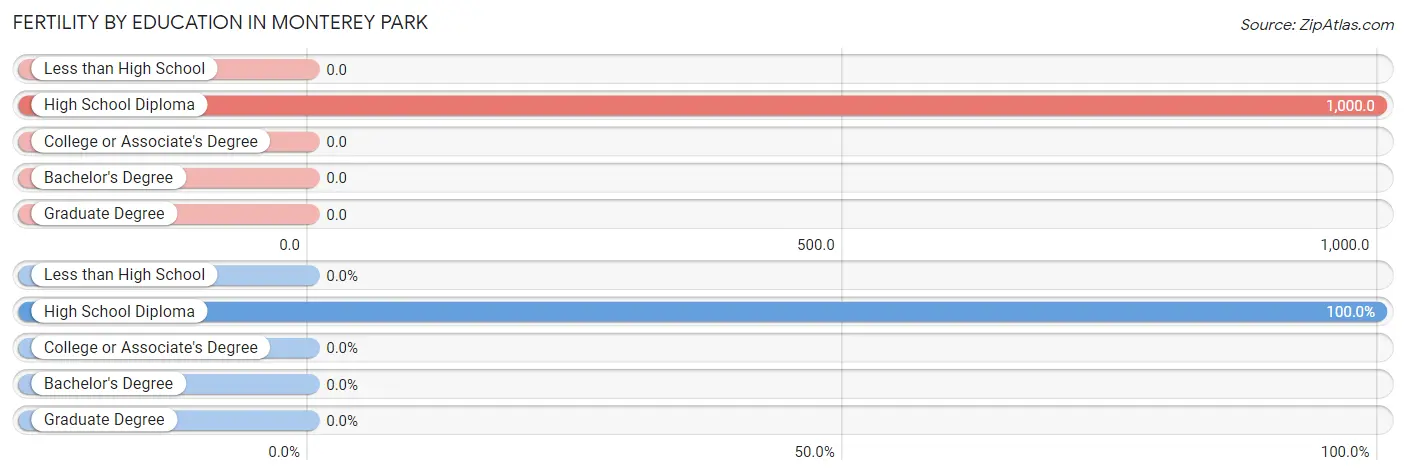
| Educational Attainment | Women with Births | Births / 1,000 Women |
| Less than High School | 0 (0.0%) | 0.0 |
| High School Diploma | 46 (100.0%) | 1,000.0 |
| College or Associate's Degree | 0 (0.0%) | 0.0 |
| Bachelor's Degree | 0 (0.0%) | 0.0 |
| Graduate Degree | 0 (0.0%) | 0.0 |
| Total | 46 (100.0%) | 313.0 |
Fertility by Education by Marriage Status in Monterey Park
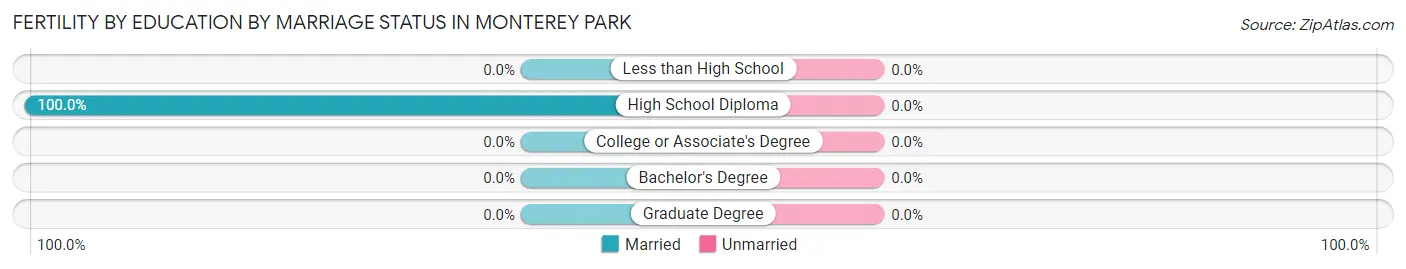
| Educational Attainment | Married | Unmarried |
| Less than High School | 0 (0.0%) | 0 (0.0%) |
| High School Diploma | 46 (100.0%) | 0 (0.0%) |
| College or Associate's Degree | 0 (0.0%) | 0 (0.0%) |
| Bachelor's Degree | 0 (0.0%) | 0 (0.0%) |
| Graduate Degree | 0 (0.0%) | 0 (0.0%) |
| Total | 46 (100.0%) | 0 (0.0%) |
Employment Characteristics in Monterey Park
Employment by Class of Employer in Monterey Park
Among the 162 employed individuals in Monterey Park, private company employees (130 | 80.2%), and self-employed (not incorporated) (32 | 19.8%) make up the most common classes of employment.
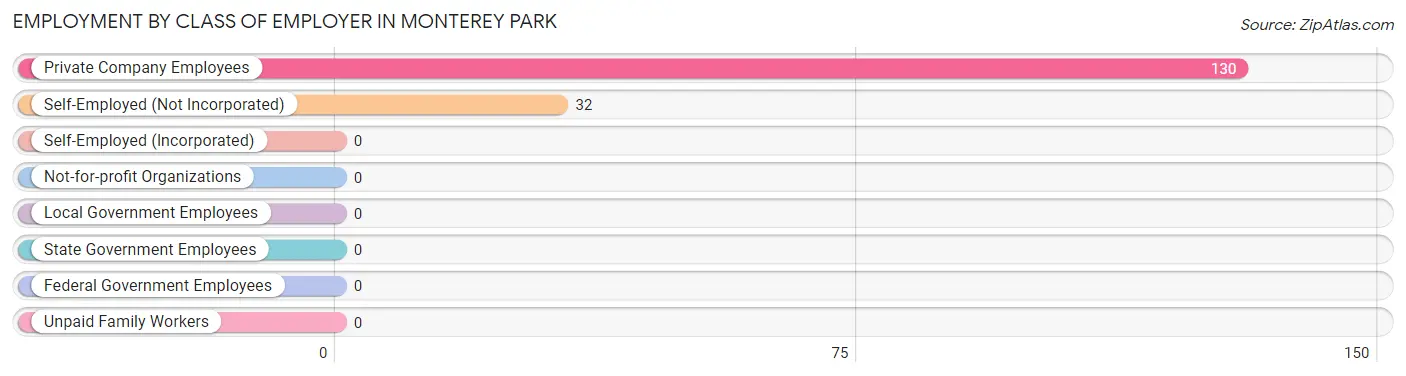
| Employer Class | # Employees | % Employees |
| Private Company Employees | 130 | 80.2% |
| Self-Employed (Incorporated) | 0 | 0.0% |
| Self-Employed (Not Incorporated) | 32 | 19.8% |
| Not-for-profit Organizations | 0 | 0.0% |
| Local Government Employees | 0 | 0.0% |
| State Government Employees | 0 | 0.0% |
| Federal Government Employees | 0 | 0.0% |
| Unpaid Family Workers | 0 | 0.0% |
| Total | 162 | 100.0% |
Employment Status by Age in Monterey Park
According to the labor force statistics for Monterey Park, out of the total population over 16 years of age (382), 56.3% or 215 individuals are in the labor force, with 24.7% or 53 of them unemployed. The age group with the highest labor force participation rate is 75 years and over, with 100.0% or 32 individuals in the labor force. Within the labor force, the 25 to 29 years age range has the highest percentage of unemployed individuals, with 100.0% or 53 of them being unemployed.
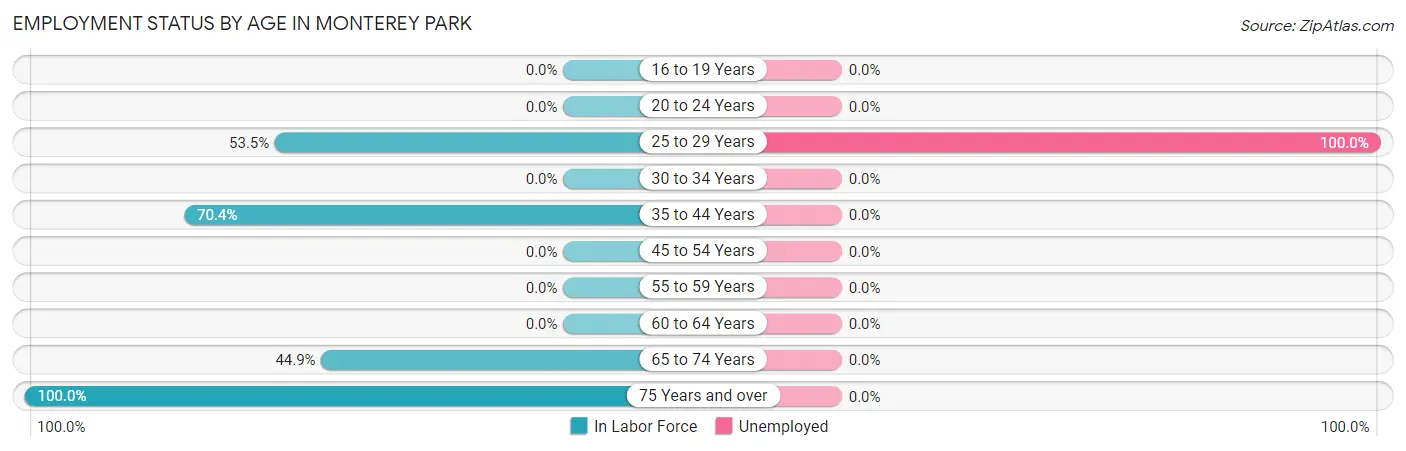
| Age Bracket | In Labor Force | Unemployed |
| 16 to 19 Years | 0 (0.0%) | 0 (0.0%) |
| 20 to 24 Years | 0 (0.0%) | 0 (0.0%) |
| 25 to 29 Years | 53 (53.5%) | 53 (100.0%) |
| 30 to 34 Years | 0 (0.0%) | 0 (0.0%) |
| 35 to 44 Years | 95 (70.4%) | 0 (0.0%) |
| 45 to 54 Years | 0 (0.0%) | 0 (0.0%) |
| 55 to 59 Years | 0 (0.0%) | 0 (0.0%) |
| 60 to 64 Years | 0 (0.0%) | 0 (0.0%) |
| 65 to 74 Years | 35 (44.9%) | 0 (0.0%) |
| 75 Years and over | 32 (100.0%) | 0 (0.0%) |
| Total | 215 (56.3%) | 53 (24.7%) |
Employment Status by Educational Attainment in Monterey Park
According to labor force statistics for Monterey Park, 54.4% of individuals (148) out of the total population between 25 and 64 years of age (272) are in the labor force, with 35.8% or 53 of them being unemployed. The group with the highest labor force participation rate are those with the educational attainment of college / associate degree, with 100.0% or 89 individuals in the labor force. Within the labor force, individuals with high school diploma education have the highest percentage of unemployment, with 89.8% or 53 of them being unemployed.
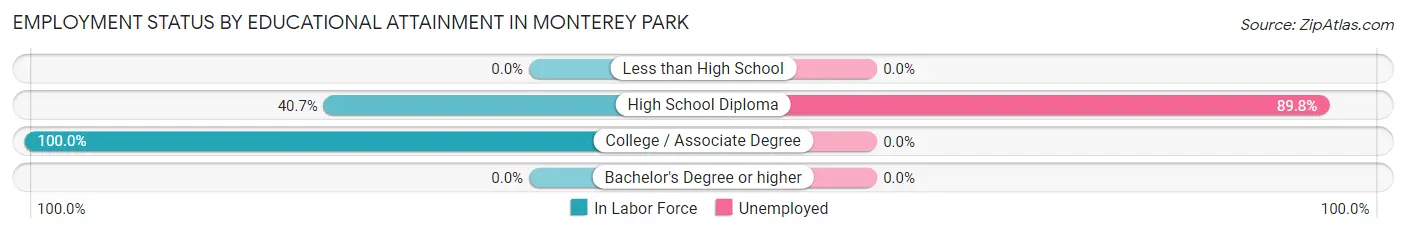
| Educational Attainment | In Labor Force | Unemployed |
| Less than High School | 0 (0.0%) | 0 (0.0%) |
| High School Diploma | 59 (40.7%) | 130 (89.8%) |
| College / Associate Degree | 89 (100.0%) | 0 (0.0%) |
| Bachelor's Degree or higher | 0 (0.0%) | 0 (0.0%) |
| Total | 148 (54.4%) | 97 (35.8%) |
Employment Occupations by Sex in Monterey Park
Management, Business, Science and Arts Occupations
Management, Business, Science and Arts Occupations by Sex
| Occupation | Male | Female |
| Management | 0 (0.0%) | 0 (0.0%) |
| Business & Financial | 0 (0.0%) | 0 (0.0%) |
| Computers, Engineering & Science | 0 (0.0%) | 0 (0.0%) |
| Computers & Mathematics | 0 (0.0%) | 0 (0.0%) |
| Architecture & Engineering | 0 (0.0%) | 0 (0.0%) |
| Life, Physical & Social Science | 0 (0.0%) | 0 (0.0%) |
| Community & Social Service | 0 (0.0%) | 0 (0.0%) |
| Education, Arts & Media | 0 (0.0%) | 0 (0.0%) |
| Legal Services & Support | 0 (0.0%) | 0 (0.0%) |
| Education Instruction & Library | 0 (0.0%) | 0 (0.0%) |
| Arts, Media & Entertainment | 0 (0.0%) | 0 (0.0%) |
| Health Diagnosing & Treating | 0 (0.0%) | 0 (0.0%) |
| Health Technologists | 0 (0.0%) | 0 (0.0%) |
| Total (Category) | 0 (0.0%) | 0 (0.0%) |
| Total (Overall) | 73 (45.1%) | 89 (54.9%) |
Services Occupations
The most common Services occupations in Monterey Park are , and Healthcare Support (89 | 54.9%).
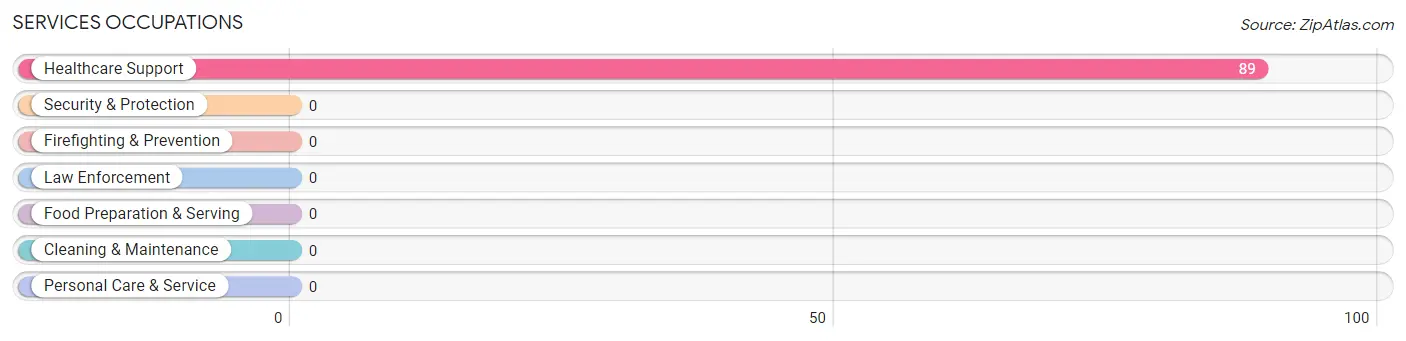
Services Occupations by Sex
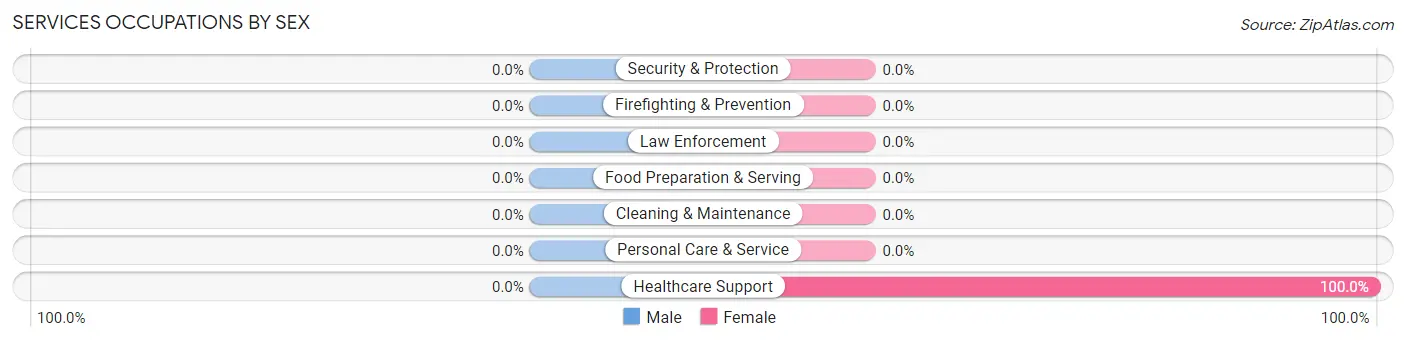
| Occupation | Male | Female |
| Healthcare Support | 0 (0.0%) | 89 (100.0%) |
| Security & Protection | 0 (0.0%) | 0 (0.0%) |
| Firefighting & Prevention | 0 (0.0%) | 0 (0.0%) |
| Law Enforcement | 0 (0.0%) | 0 (0.0%) |
| Food Preparation & Serving | 0 (0.0%) | 0 (0.0%) |
| Cleaning & Maintenance | 0 (0.0%) | 0 (0.0%) |
| Personal Care & Service | 0 (0.0%) | 0 (0.0%) |
| Total (Category) | 0 (0.0%) | 89 (100.0%) |
| Total (Overall) | 73 (45.1%) | 89 (54.9%) |
Sales and Office Occupations
Sales and Office Occupations by Sex
| Occupation | Male | Female |
| Sales & Related | 0 (0.0%) | 0 (0.0%) |
| Office & Administration | 0 (0.0%) | 0 (0.0%) |
| Total (Category) | 0 (0.0%) | 0 (0.0%) |
| Total (Overall) | 73 (45.1%) | 89 (54.9%) |
Natural Resources, Construction and Maintenance Occupations
The most common Natural Resources, Construction and Maintenance occupations in Monterey Park are Installation, Maintenance & Repair (35 | 21.6%), and Construction & Extraction (6 | 3.7%).
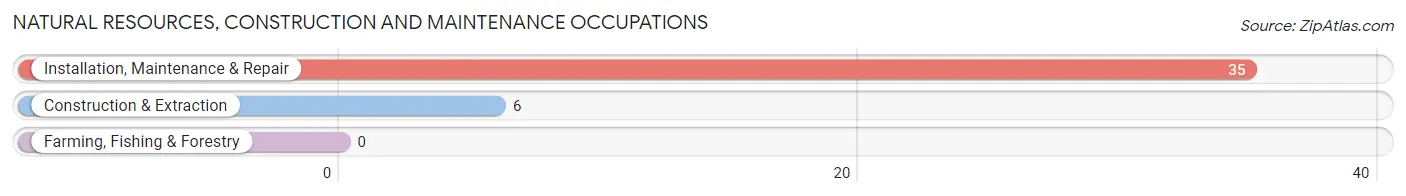
Natural Resources, Construction and Maintenance Occupations by Sex
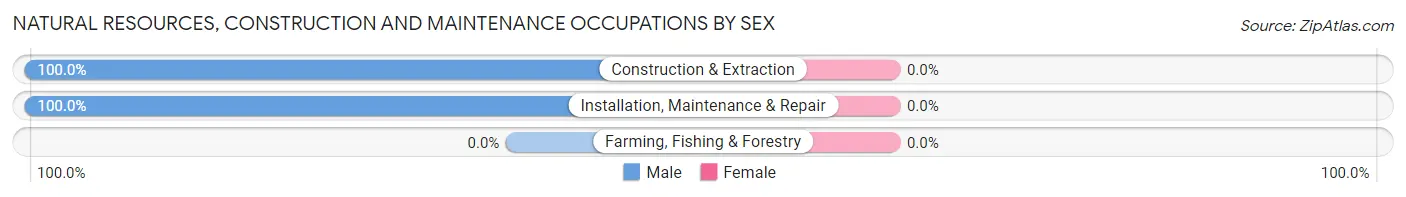
| Occupation | Male | Female |
| Farming, Fishing & Forestry | 0 (0.0%) | 0 (0.0%) |
| Construction & Extraction | 6 (100.0%) | 0 (0.0%) |
| Installation, Maintenance & Repair | 35 (100.0%) | 0 (0.0%) |
| Total (Category) | 41 (100.0%) | 0 (0.0%) |
| Total (Overall) | 73 (45.1%) | 89 (54.9%) |
Production, Transportation and Moving Occupations
The most common Production, Transportation and Moving occupations in Monterey Park are , and Production (32 | 19.8%).
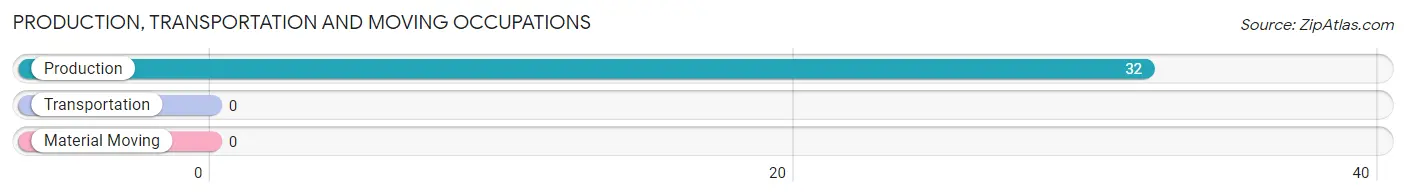
Production, Transportation and Moving Occupations by Sex
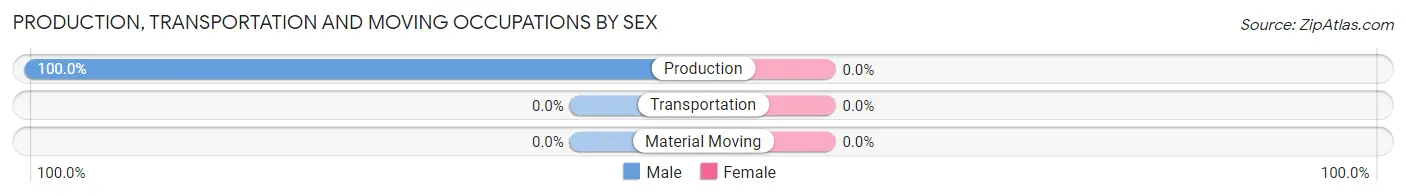
| Occupation | Male | Female |
| Production | 32 (100.0%) | 0 (0.0%) |
| Transportation | 0 (0.0%) | 0 (0.0%) |
| Material Moving | 0 (0.0%) | 0 (0.0%) |
| Total (Category) | 32 (100.0%) | 0 (0.0%) |
| Total (Overall) | 73 (45.1%) | 89 (54.9%) |
Employment Industries by Sex in Monterey Park
Employment Industries in Monterey Park
The major employment industries in Monterey Park include Health Care & Social Assistance (89 | 54.9%), Administrative & Support (35 | 21.6%), Accommodation & Food Services (32 | 19.8%), and Construction (6 | 3.7%).
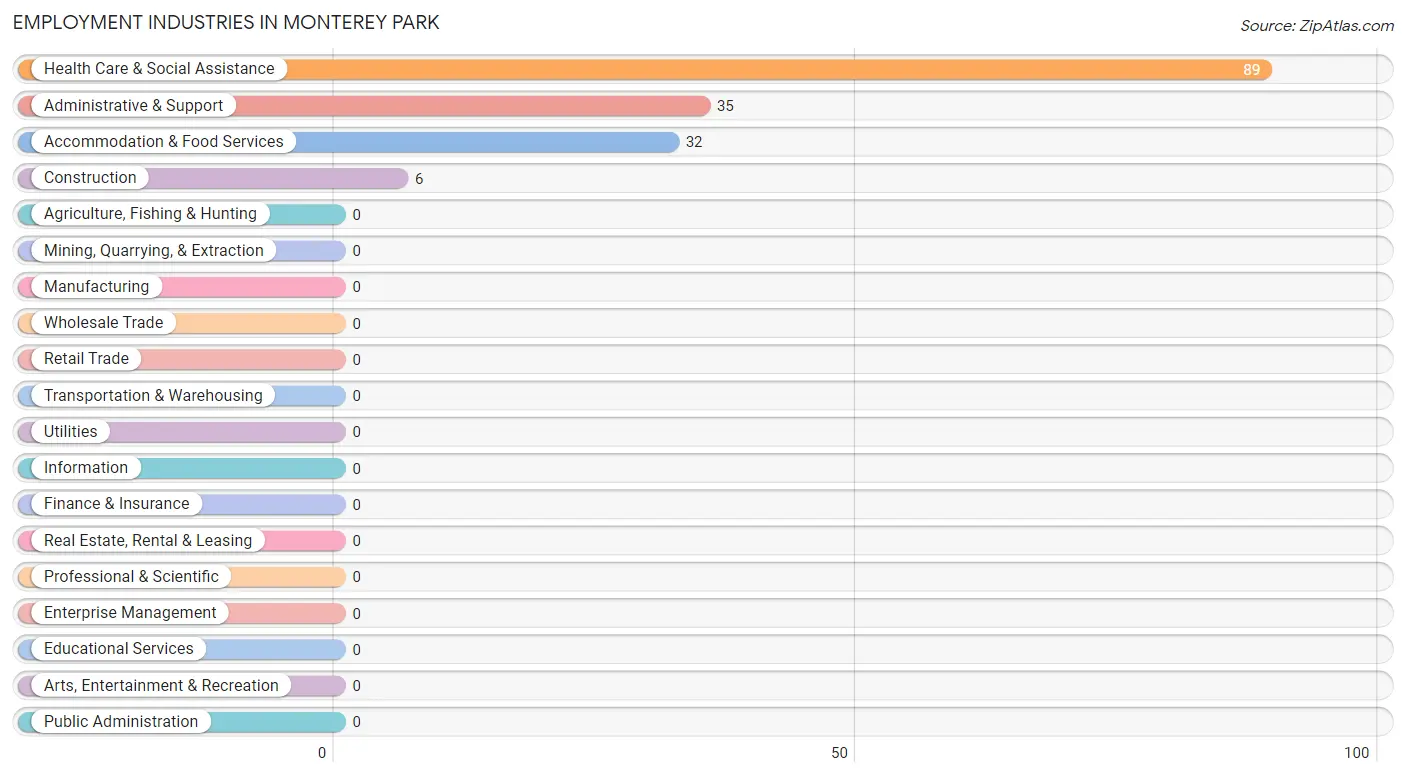
Employment Industries by Sex in Monterey Park
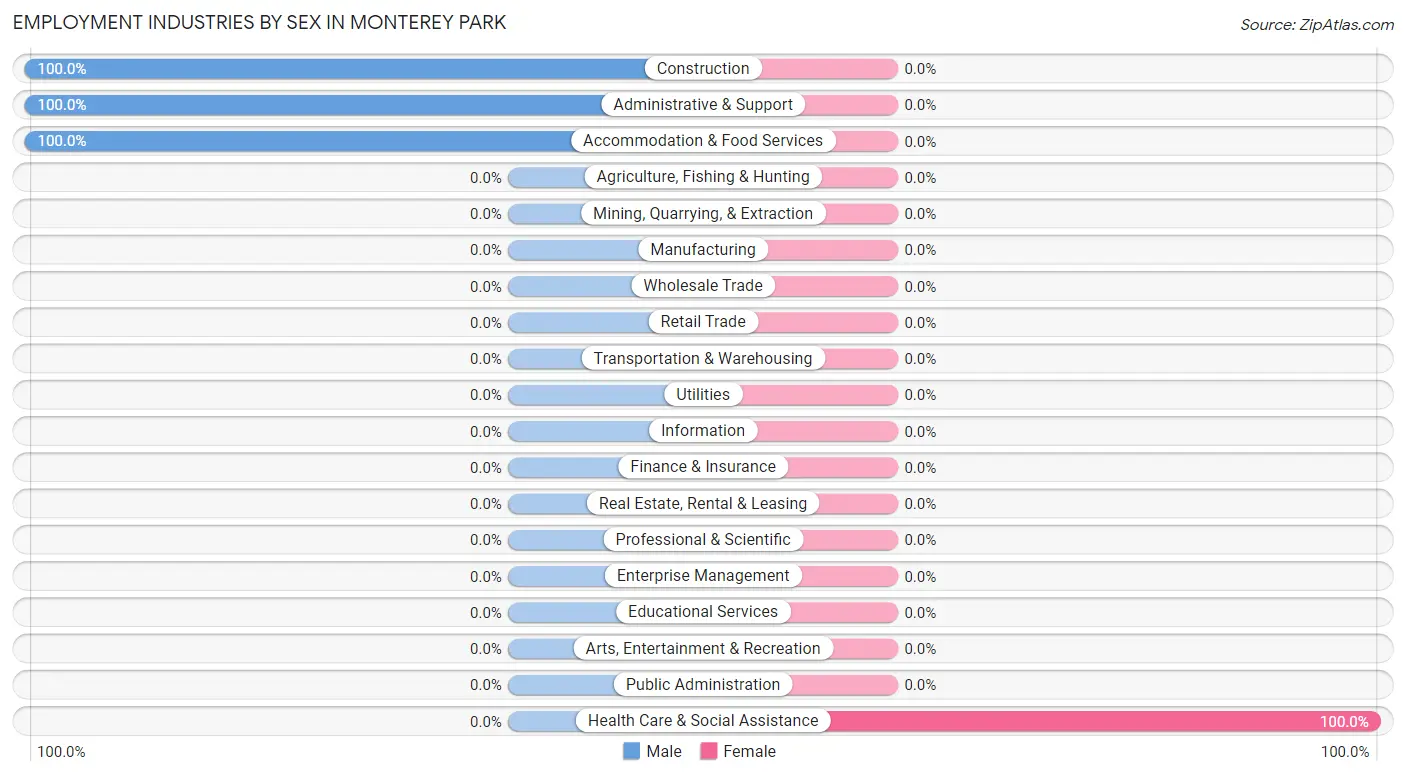
| Industry | Male | Female |
| Agriculture, Fishing & Hunting | 0 (0.0%) | 0 (0.0%) |
| Mining, Quarrying, & Extraction | 0 (0.0%) | 0 (0.0%) |
| Construction | 6 (100.0%) | 0 (0.0%) |
| Manufacturing | 0 (0.0%) | 0 (0.0%) |
| Wholesale Trade | 0 (0.0%) | 0 (0.0%) |
| Retail Trade | 0 (0.0%) | 0 (0.0%) |
| Transportation & Warehousing | 0 (0.0%) | 0 (0.0%) |
| Utilities | 0 (0.0%) | 0 (0.0%) |
| Information | 0 (0.0%) | 0 (0.0%) |
| Finance & Insurance | 0 (0.0%) | 0 (0.0%) |
| Real Estate, Rental & Leasing | 0 (0.0%) | 0 (0.0%) |
| Professional & Scientific | 0 (0.0%) | 0 (0.0%) |
| Enterprise Management | 0 (0.0%) | 0 (0.0%) |
| Administrative & Support | 35 (100.0%) | 0 (0.0%) |
| Educational Services | 0 (0.0%) | 0 (0.0%) |
| Health Care & Social Assistance | 0 (0.0%) | 89 (100.0%) |
| Arts, Entertainment & Recreation | 0 (0.0%) | 0 (0.0%) |
| Accommodation & Food Services | 32 (100.0%) | 0 (0.0%) |
| Public Administration | 0 (0.0%) | 0 (0.0%) |
| Total | 73 (45.1%) | 89 (54.9%) |
Education in Monterey Park
School Enrollment in Monterey Park
The most common levels of schooling among the 167 students in Monterey Park are elementary school (55 | 32.9%), middle school (46 | 27.5%), and kindergarten (45 | 27.0%).
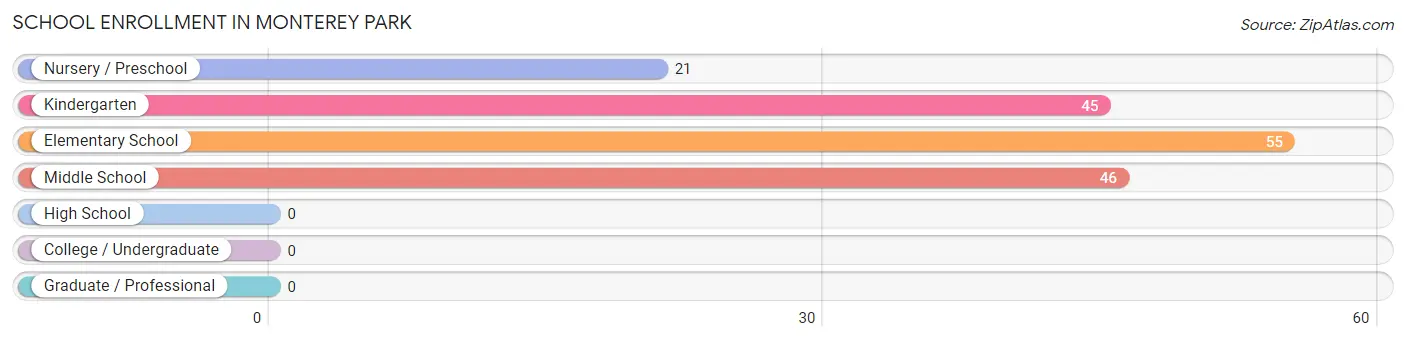
| School Level | # Students | % Students |
| Nursery / Preschool | 21 | 12.6% |
| Kindergarten | 45 | 27.0% |
| Elementary School | 55 | 32.9% |
| Middle School | 46 | 27.5% |
| High School | 0 | 0.0% |
| College / Undergraduate | 0 | 0.0% |
| Graduate / Professional | 0 | 0.0% |
| Total | 167 | 100.0% |
School Enrollment by Age by Funding Source in Monterey Park
Out of a total of 167 students who are enrolled in schools in Monterey Park, 91 (54.5%) attend a private institution, while the remaining 76 (45.5%) are enrolled in public schools. The age group of 10 to 14 year olds has the highest likelihood of being enrolled in private schools, with 46 (100.0% in the age bracket) enrolled. Conversely, the age group of 3 to 4 year olds has the lowest likelihood of being enrolled in a private school, with 21 (100.0% in the age bracket) attending a public institution.
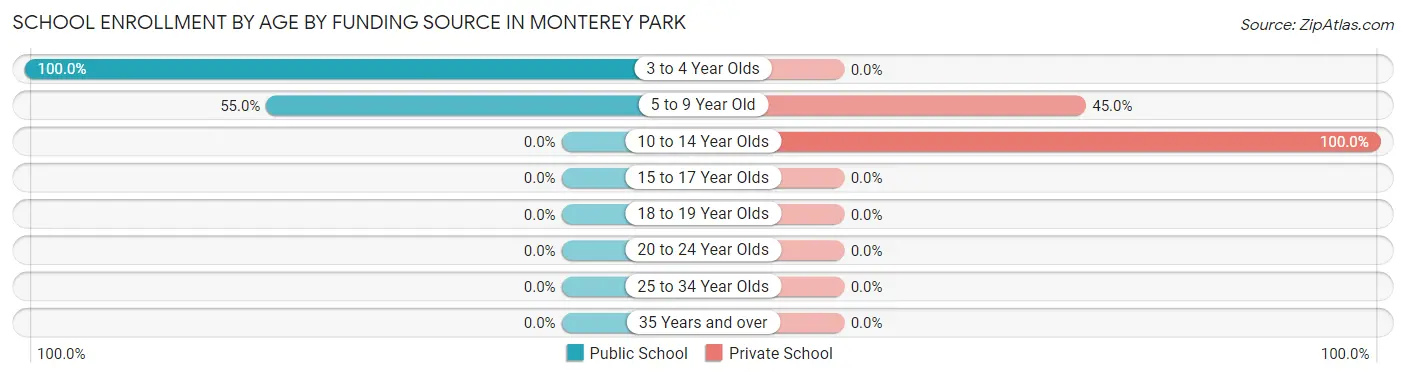
| Age Bracket | Public School | Private School |
| 3 to 4 Year Olds | 21 (100.0%) | 0 (0.0%) |
| 5 to 9 Year Old | 55 (55.0%) | 45 (45.0%) |
| 10 to 14 Year Olds | 0 (0.0%) | 46 (100.0%) |
| 15 to 17 Year Olds | 0 (0.0%) | 0 (0.0%) |
| 18 to 19 Year Olds | 0 (0.0%) | 0 (0.0%) |
| 20 to 24 Year Olds | 0 (0.0%) | 0 (0.0%) |
| 25 to 34 Year Olds | 0 (0.0%) | 0 (0.0%) |
| 35 Years and over | 0 (0.0%) | 0 (0.0%) |
| Total | 76 (45.5%) | 91 (54.5%) |
Educational Attainment by Field of Study in Monterey Park
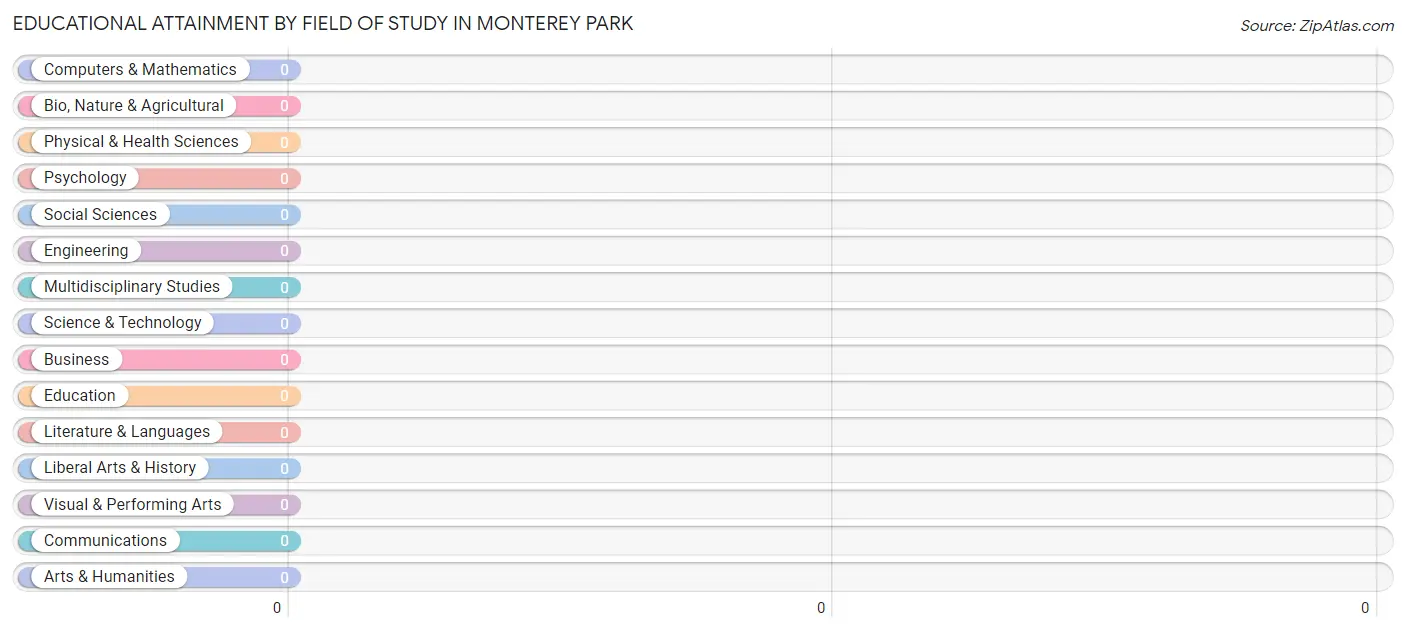
| Field of Study | # Graduates | % Graduates |
| Computers & Mathematics | 0 | 0.0% |
| Bio, Nature & Agricultural | 0 | 0.0% |
| Physical & Health Sciences | 0 | 0.0% |
| Psychology | 0 | 0.0% |
| Social Sciences | 0 | 0.0% |
| Engineering | 0 | 0.0% |
| Multidisciplinary Studies | 0 | 0.0% |
| Science & Technology | 0 | 0.0% |
| Business | 0 | 0.0% |
| Education | 0 | 0.0% |
| Literature & Languages | 0 | 0.0% |
| Liberal Arts & History | 0 | 0.0% |
| Visual & Performing Arts | 0 | 0.0% |
| Communications | 0 | 0.0% |
| Arts & Humanities | 0 | 0.0% |
| Total | 0 | 0.0% |
Transportation & Commute in Monterey Park
Vehicle Availability by Sex in Monterey Park
The most prevalent vehicle ownership categories in Monterey Park are males with 2 vehicles (38, accounting for 52.0%) and females with 2 vehicles (0, making up 42.7%).
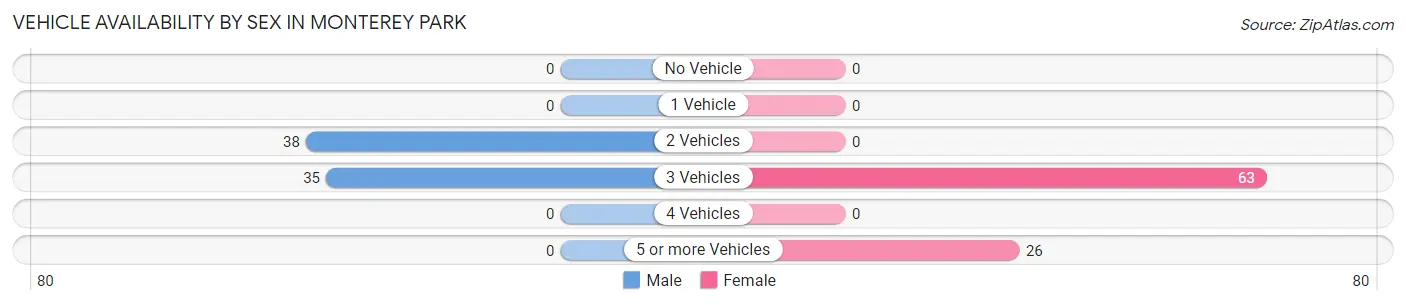
| Vehicles Available | Male | Female |
| No Vehicle | 0 (0.0%) | 0 (0.0%) |
| 1 Vehicle | 0 (0.0%) | 0 (0.0%) |
| 2 Vehicles | 38 (52.0%) | 0 (0.0%) |
| 3 Vehicles | 35 (47.9%) | 63 (70.8%) |
| 4 Vehicles | 0 (0.0%) | 0 (0.0%) |
| 5 or more Vehicles | 0 (0.0%) | 26 (29.2%) |
| Total | 73 (100.0%) | 89 (100.0%) |
Commute Time in Monterey Park
The most frequently occuring commute durations in Monterey Park are 45 to 59 minutes (64 commuters, 64.6%), 30 to 34 minutes (35 commuters, 35.3%), and less than 5 minutes (0 commuters, 0.0%).
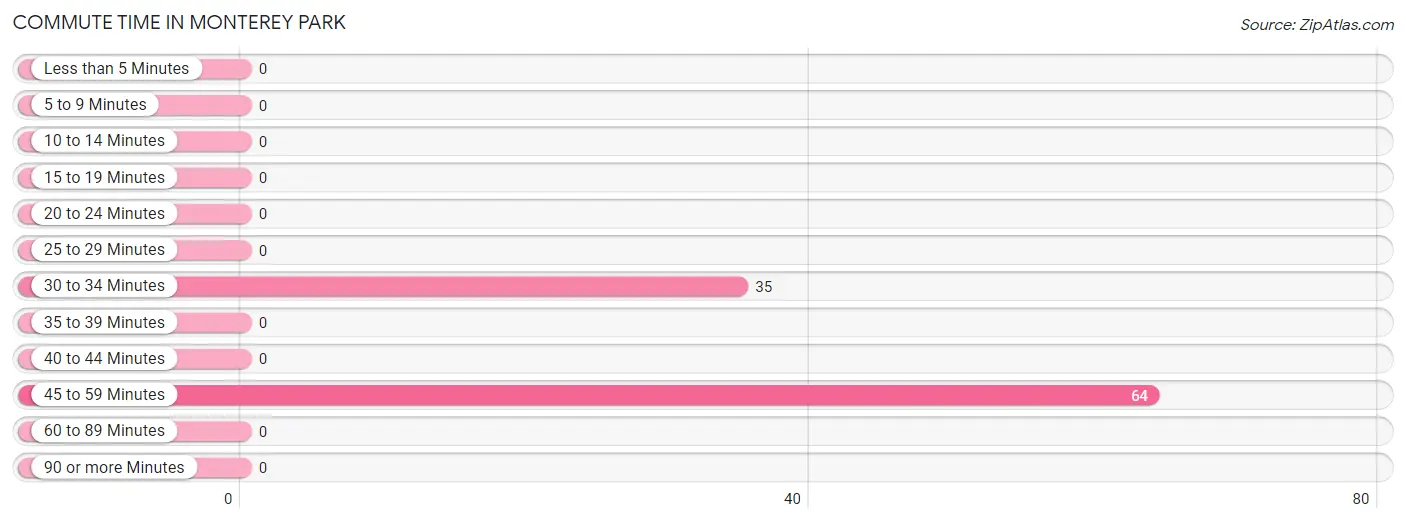
| Commute Time | # Commuters | % Commuters |
| Less than 5 Minutes | 0 | 0.0% |
| 5 to 9 Minutes | 0 | 0.0% |
| 10 to 14 Minutes | 0 | 0.0% |
| 15 to 19 Minutes | 0 | 0.0% |
| 20 to 24 Minutes | 0 | 0.0% |
| 25 to 29 Minutes | 0 | 0.0% |
| 30 to 34 Minutes | 35 | 35.3% |
| 35 to 39 Minutes | 0 | 0.0% |
| 40 to 44 Minutes | 0 | 0.0% |
| 45 to 59 Minutes | 64 | 64.6% |
| 60 to 89 Minutes | 0 | 0.0% |
| 90 or more Minutes | 0 | 0.0% |
Commute Time by Sex in Monterey Park
The most common commute times in Monterey Park are 45 to 59 minutes (38 commuters, 52.0%) for males and 45 to 59 minutes (26 commuters, 100.0%) for females.
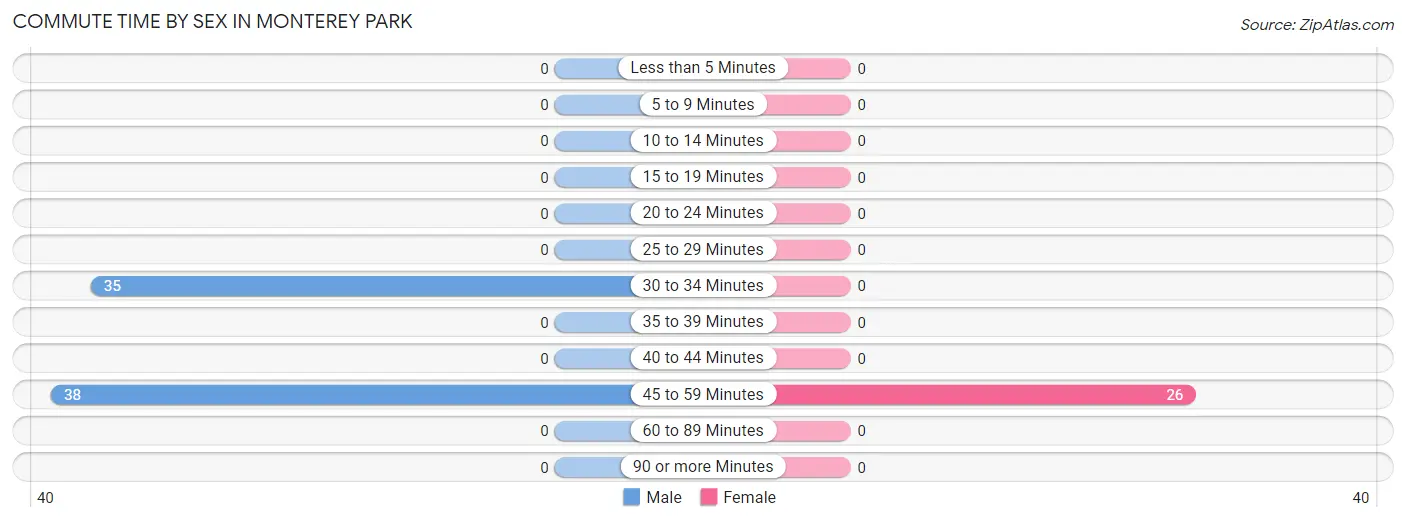
| Commute Time | Male | Female |
| Less than 5 Minutes | 0 (0.0%) | 0 (0.0%) |
| 5 to 9 Minutes | 0 (0.0%) | 0 (0.0%) |
| 10 to 14 Minutes | 0 (0.0%) | 0 (0.0%) |
| 15 to 19 Minutes | 0 (0.0%) | 0 (0.0%) |
| 20 to 24 Minutes | 0 (0.0%) | 0 (0.0%) |
| 25 to 29 Minutes | 0 (0.0%) | 0 (0.0%) |
| 30 to 34 Minutes | 35 (47.9%) | 0 (0.0%) |
| 35 to 39 Minutes | 0 (0.0%) | 0 (0.0%) |
| 40 to 44 Minutes | 0 (0.0%) | 0 (0.0%) |
| 45 to 59 Minutes | 38 (52.0%) | 26 (100.0%) |
| 60 to 89 Minutes | 0 (0.0%) | 0 (0.0%) |
| 90 or more Minutes | 0 (0.0%) | 0 (0.0%) |
Time of Departure to Work by Sex in Monterey Park
The most frequent times of departure to work in Monterey Park are 7:30 AM to 7:59 AM (67, 91.8%) for males and 6:00 AM to 6:29 AM (26, 100.0%) for females.
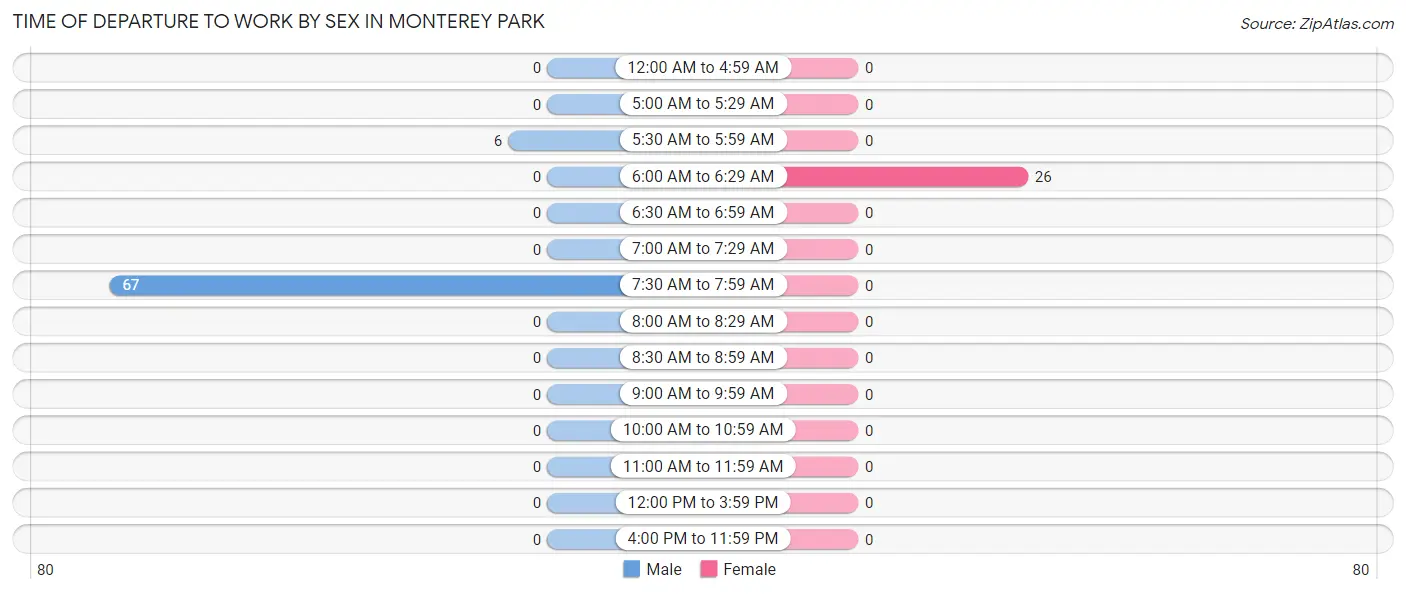
| Time of Departure | Male | Female |
| 12:00 AM to 4:59 AM | 0 (0.0%) | 0 (0.0%) |
| 5:00 AM to 5:29 AM | 0 (0.0%) | 0 (0.0%) |
| 5:30 AM to 5:59 AM | 6 (8.2%) | 0 (0.0%) |
| 6:00 AM to 6:29 AM | 0 (0.0%) | 26 (100.0%) |
| 6:30 AM to 6:59 AM | 0 (0.0%) | 0 (0.0%) |
| 7:00 AM to 7:29 AM | 0 (0.0%) | 0 (0.0%) |
| 7:30 AM to 7:59 AM | 67 (91.8%) | 0 (0.0%) |
| 8:00 AM to 8:29 AM | 0 (0.0%) | 0 (0.0%) |
| 8:30 AM to 8:59 AM | 0 (0.0%) | 0 (0.0%) |
| 9:00 AM to 9:59 AM | 0 (0.0%) | 0 (0.0%) |
| 10:00 AM to 10:59 AM | 0 (0.0%) | 0 (0.0%) |
| 11:00 AM to 11:59 AM | 0 (0.0%) | 0 (0.0%) |
| 12:00 PM to 3:59 PM | 0 (0.0%) | 0 (0.0%) |
| 4:00 PM to 11:59 PM | 0 (0.0%) | 0 (0.0%) |
| Total | 73 (100.0%) | 26 (100.0%) |
Housing Occupancy in Monterey Park
Occupancy by Ownership in Monterey Park
Of the total 188 dwellings in Monterey Park, owner-occupied units account for 162 (86.2%), while renter-occupied units make up 26 (13.8%).
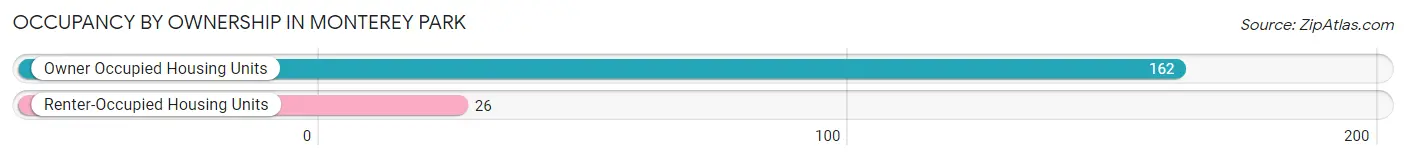
| Occupancy | # Housing Units | % Housing Units |
| Owner Occupied Housing Units | 162 | 86.2% |
| Renter-Occupied Housing Units | 26 | 13.8% |
| Total Occupied Housing Units | 188 | 100.0% |
Occupancy by Household Size in Monterey Park
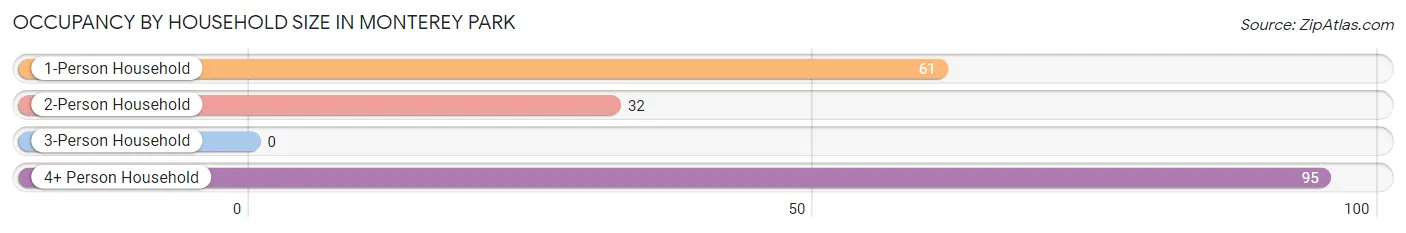
| Household Size | # Housing Units | % Housing Units |
| 1-Person Household | 61 | 32.5% |
| 2-Person Household | 32 | 17.0% |
| 3-Person Household | 0 | 0.0% |
| 4+ Person Household | 95 | 50.5% |
| Total Housing Units | 188 | 100.0% |
Occupancy by Ownership by Household Size in Monterey Park
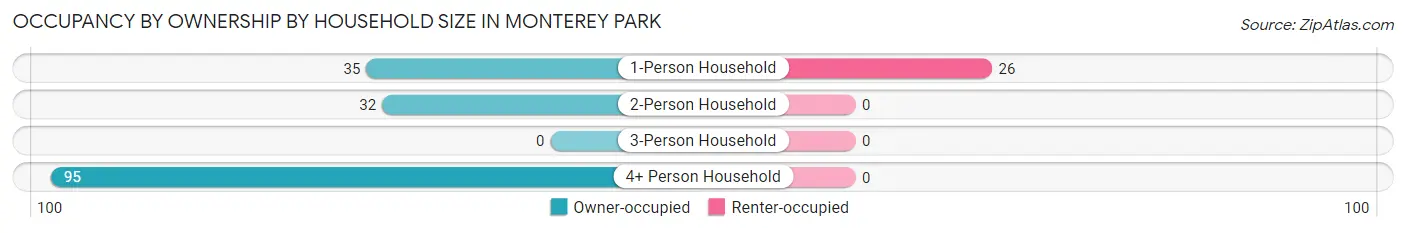
| Household Size | Owner-occupied | Renter-occupied |
| 1-Person Household | 35 (57.4%) | 26 (42.6%) |
| 2-Person Household | 32 (100.0%) | 0 (0.0%) |
| 3-Person Household | 0 (0.0%) | 0 (0.0%) |
| 4+ Person Household | 95 (100.0%) | 0 (0.0%) |
| Total Housing Units | 162 (86.2%) | 26 (13.8%) |
Occupancy by Educational Attainment in Monterey Park
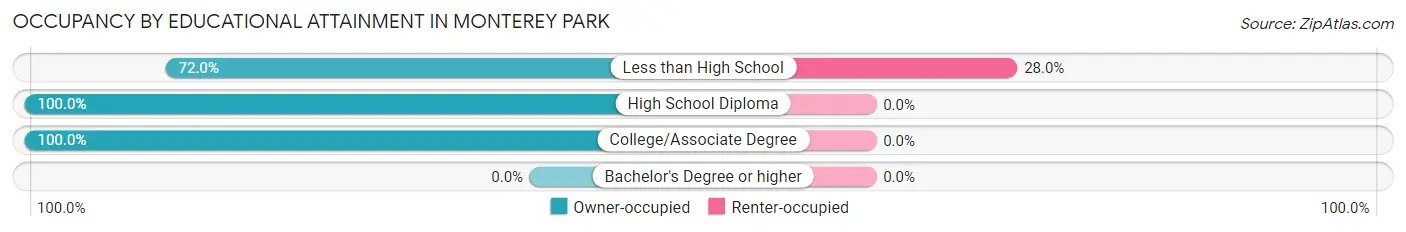
| Household Size | Owner-occupied | Renter-occupied |
| Less than High School | 67 (72.0%) | 26 (28.0%) |
| High School Diploma | 6 (100.0%) | 0 (0.0%) |
| College/Associate Degree | 89 (100.0%) | 0 (0.0%) |
| Bachelor's Degree or higher | 0 (0.0%) | 0 (0.0%) |
Occupancy by Age of Householder in Monterey Park
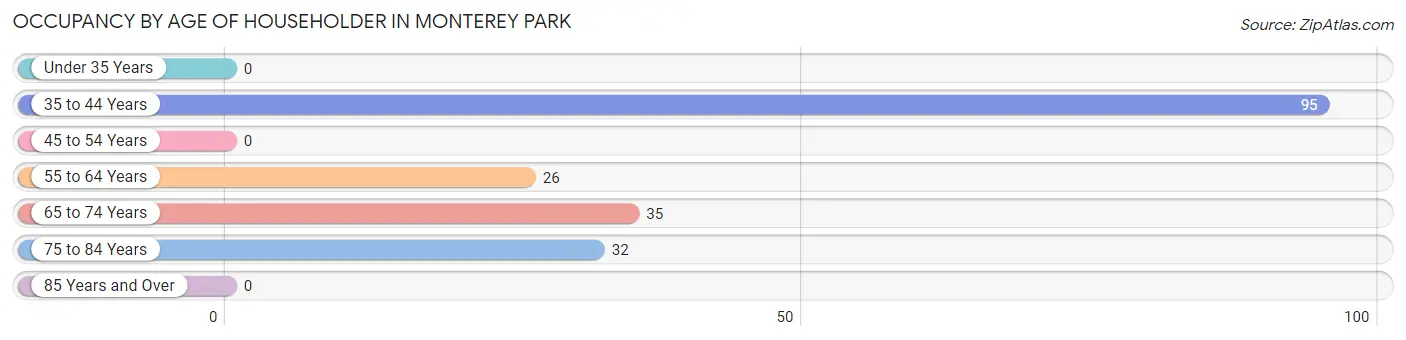
| Age Bracket | # Households | % Households |
| Under 35 Years | 0 | 0.0% |
| 35 to 44 Years | 95 | 50.5% |
| 45 to 54 Years | 0 | 0.0% |
| 55 to 64 Years | 26 | 13.8% |
| 65 to 74 Years | 35 | 18.6% |
| 75 to 84 Years | 32 | 17.0% |
| 85 Years and Over | 0 | 0.0% |
| Total | 188 | 100.0% |
Housing Finances in Monterey Park
Median Income by Occupancy in Monterey Park
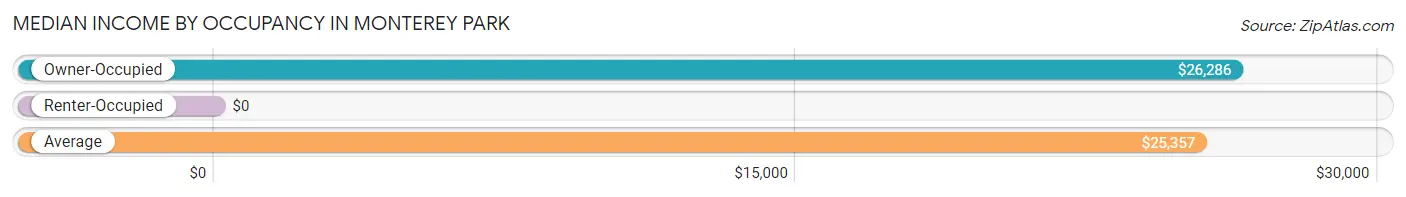
| Occupancy Type | # Households | Median Income |
| Owner-Occupied | 162 (86.2%) | $26,286 |
| Renter-Occupied | 26 (13.8%) | $0 |
| Average | 188 (100.0%) | $25,357 |
Occupancy by Householder Income Bracket in Monterey Park
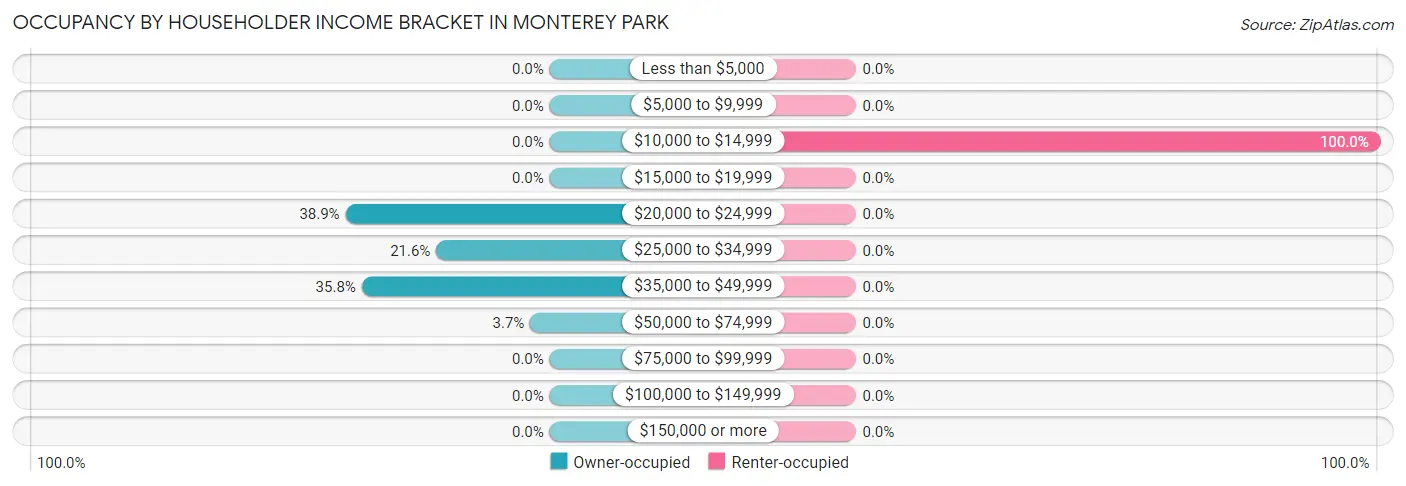
| Income Bracket | Owner-occupied | Renter-occupied |
| Less than $5,000 | 0 (0.0%) | 0 (0.0%) |
| $5,000 to $9,999 | 0 (0.0%) | 0 (0.0%) |
| $10,000 to $14,999 | 0 (0.0%) | 26 (100.0%) |
| $15,000 to $19,999 | 0 (0.0%) | 0 (0.0%) |
| $20,000 to $24,999 | 63 (38.9%) | 0 (0.0%) |
| $25,000 to $34,999 | 35 (21.6%) | 0 (0.0%) |
| $35,000 to $49,999 | 58 (35.8%) | 0 (0.0%) |
| $50,000 to $74,999 | 6 (3.7%) | 0 (0.0%) |
| $75,000 to $99,999 | 0 (0.0%) | 0 (0.0%) |
| $100,000 to $149,999 | 0 (0.0%) | 0 (0.0%) |
| $150,000 or more | 0 (0.0%) | 0 (0.0%) |
| Total | 162 (100.0%) | 26 (100.0%) |
Monthly Housing Cost Tiers in Monterey Park
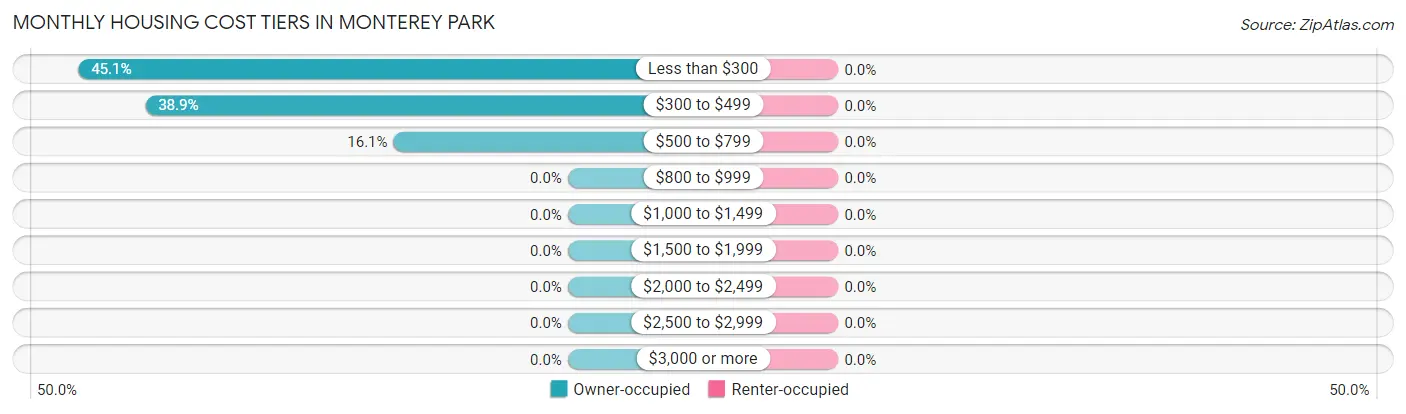
| Monthly Cost | Owner-occupied | Renter-occupied |
| Less than $300 | 73 (45.1%) | 0 (0.0%) |
| $300 to $499 | 63 (38.9%) | 0 (0.0%) |
| $500 to $799 | 26 (16.1%) | 0 (0.0%) |
| $800 to $999 | 0 (0.0%) | 0 (0.0%) |
| $1,000 to $1,499 | 0 (0.0%) | 0 (0.0%) |
| $1,500 to $1,999 | 0 (0.0%) | 0 (0.0%) |
| $2,000 to $2,499 | 0 (0.0%) | 0 (0.0%) |
| $2,500 to $2,999 | 0 (0.0%) | 0 (0.0%) |
| $3,000 or more | 0 (0.0%) | 0 (0.0%) |
| Total | 162 (100.0%) | 26 (100.0%) |
Physical Housing Characteristics in Monterey Park
Housing Structures in Monterey Park
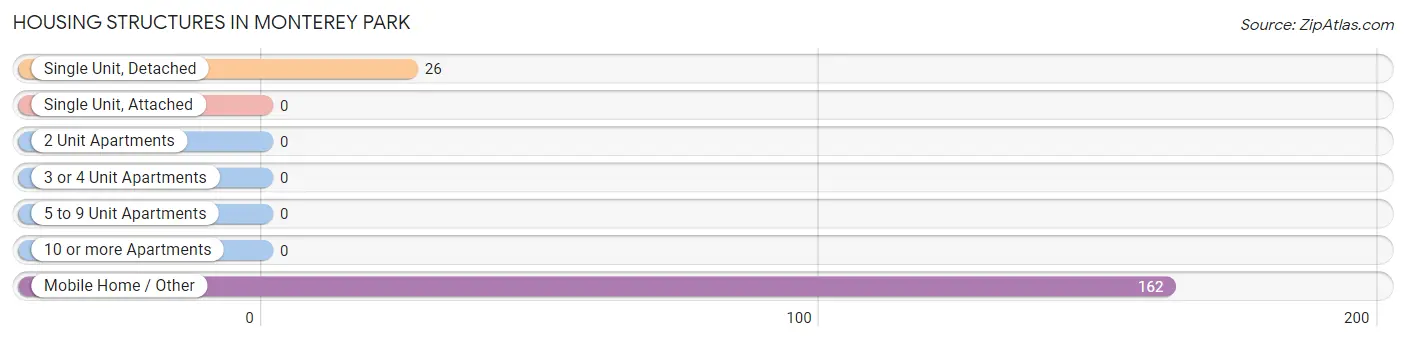
| Structure Type | # Housing Units | % Housing Units |
| Single Unit, Detached | 26 | 13.8% |
| Single Unit, Attached | 0 | 0.0% |
| 2 Unit Apartments | 0 | 0.0% |
| 3 or 4 Unit Apartments | 0 | 0.0% |
| 5 to 9 Unit Apartments | 0 | 0.0% |
| 10 or more Apartments | 0 | 0.0% |
| Mobile Home / Other | 162 | 86.2% |
| Total | 188 | 100.0% |
Housing Structures by Occupancy in Monterey Park
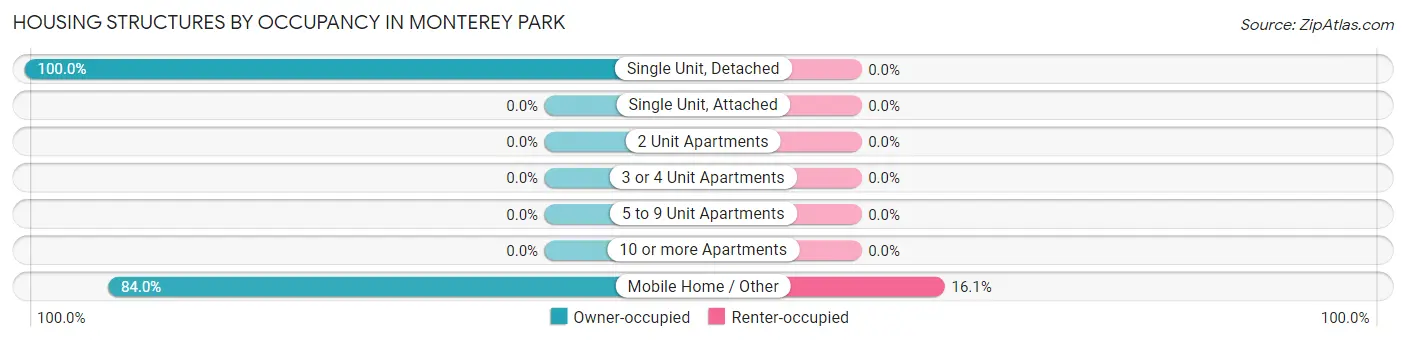
| Structure Type | Owner-occupied | Renter-occupied |
| Single Unit, Detached | 26 (100.0%) | 0 (0.0%) |
| Single Unit, Attached | 0 (0.0%) | 0 (0.0%) |
| 2 Unit Apartments | 0 (0.0%) | 0 (0.0%) |
| 3 or 4 Unit Apartments | 0 (0.0%) | 0 (0.0%) |
| 5 to 9 Unit Apartments | 0 (0.0%) | 0 (0.0%) |
| 10 or more Apartments | 0 (0.0%) | 0 (0.0%) |
| Mobile Home / Other | 136 (84.0%) | 26 (16.1%) |
| Total | 162 (86.2%) | 26 (13.8%) |
Housing Structures by Number of Rooms in Monterey Park
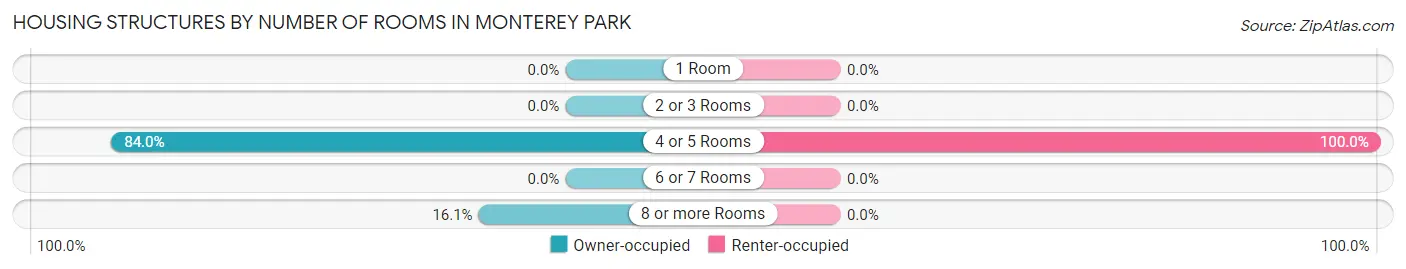
| Number of Rooms | Owner-occupied | Renter-occupied |
| 1 Room | 0 (0.0%) | 0 (0.0%) |
| 2 or 3 Rooms | 0 (0.0%) | 0 (0.0%) |
| 4 or 5 Rooms | 136 (84.0%) | 26 (100.0%) |
| 6 or 7 Rooms | 0 (0.0%) | 0 (0.0%) |
| 8 or more Rooms | 26 (16.1%) | 0 (0.0%) |
| Total | 162 (100.0%) | 26 (100.0%) |
Housing Structure by Heating Type in Monterey Park
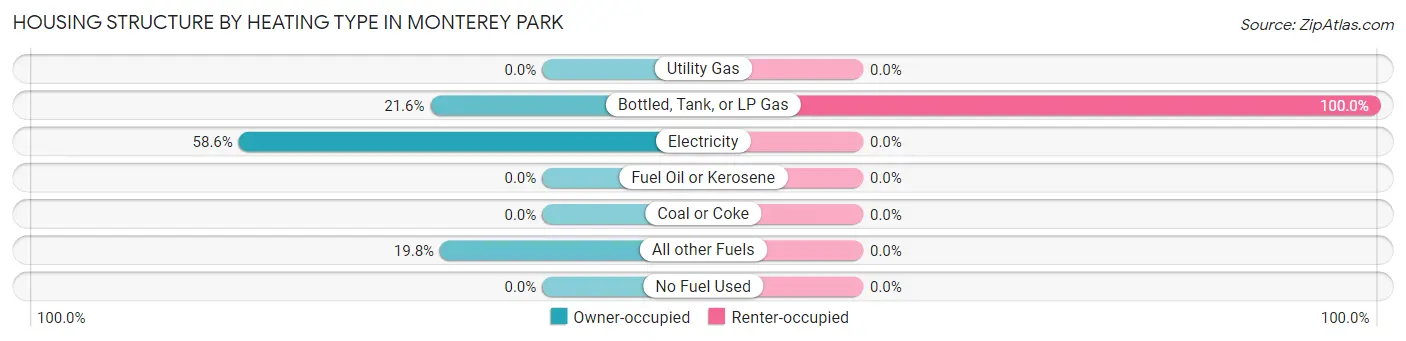
| Heating Type | Owner-occupied | Renter-occupied |
| Utility Gas | 0 (0.0%) | 0 (0.0%) |
| Bottled, Tank, or LP Gas | 35 (21.6%) | 26 (100.0%) |
| Electricity | 95 (58.6%) | 0 (0.0%) |
| Fuel Oil or Kerosene | 0 (0.0%) | 0 (0.0%) |
| Coal or Coke | 0 (0.0%) | 0 (0.0%) |
| All other Fuels | 32 (19.8%) | 0 (0.0%) |
| No Fuel Used | 0 (0.0%) | 0 (0.0%) |
| Total | 162 (100.0%) | 26 (100.0%) |
Household Vehicle Usage in Monterey Park
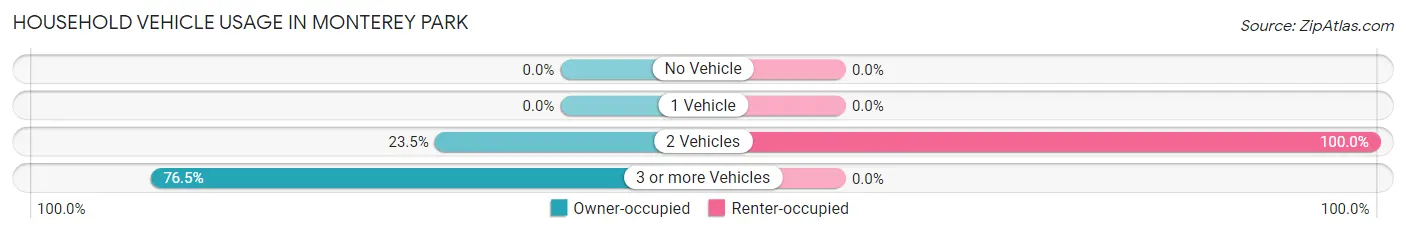
| Vehicles per Household | Owner-occupied | Renter-occupied |
| No Vehicle | 0 (0.0%) | 0 (0.0%) |
| 1 Vehicle | 0 (0.0%) | 0 (0.0%) |
| 2 Vehicles | 38 (23.5%) | 26 (100.0%) |
| 3 or more Vehicles | 124 (76.5%) | 0 (0.0%) |
| Total | 162 (100.0%) | 26 (100.0%) |
Real Estate & Mortgages in Monterey Park
Real Estate and Mortgage Overview in Monterey Park
| Characteristic | Without Mortgage | With Mortgage |
| Housing Units | 162 | 0 |
| Median Property Value | $130,600 | $0 |
| Median Household Income | $26,286 | $0 |
| Monthly Housing Costs | $356 | $0 |
| Real Estate Taxes | $553 | $0 |
Property Value by Mortgage Status in Monterey Park
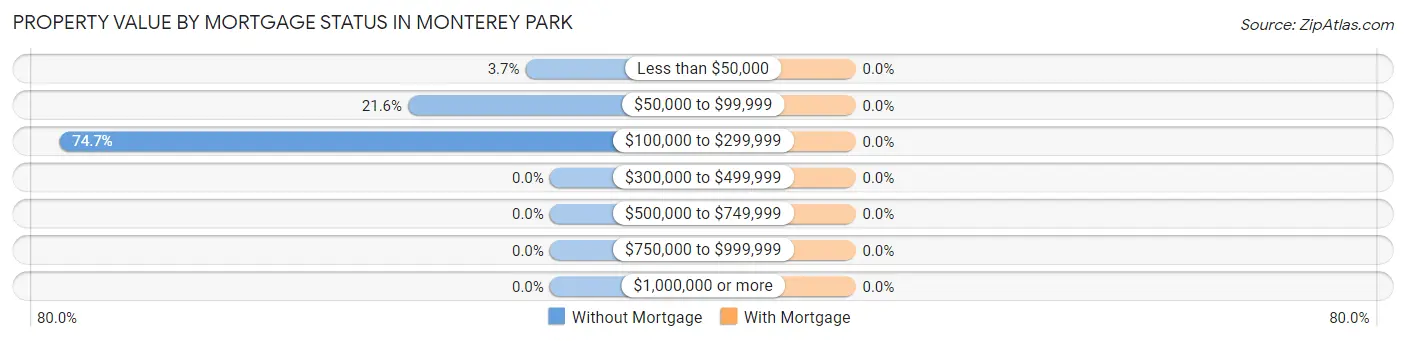
| Property Value | Without Mortgage | With Mortgage |
| Less than $50,000 | 6 (3.7%) | 0 (0.0%) |
| $50,000 to $99,999 | 35 (21.6%) | 0 (0.0%) |
| $100,000 to $299,999 | 121 (74.7%) | 0 (0.0%) |
| $300,000 to $499,999 | 0 (0.0%) | 0 (0.0%) |
| $500,000 to $749,999 | 0 (0.0%) | 0 (0.0%) |
| $750,000 to $999,999 | 0 (0.0%) | 0 (0.0%) |
| $1,000,000 or more | 0 (0.0%) | 0 (0.0%) |
| Total | 162 (100.0%) | 0 (0.0%) |
Household Income by Mortgage Status in Monterey Park
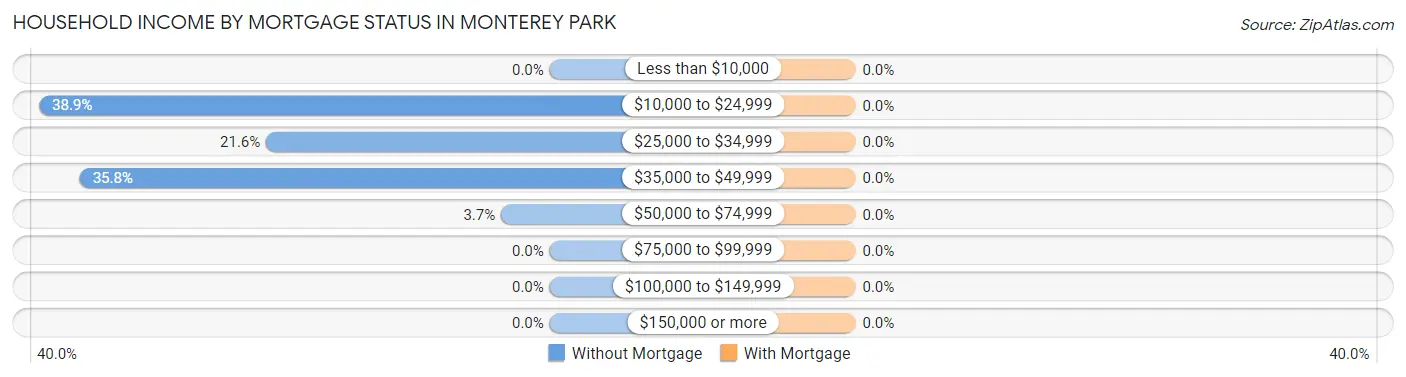
| Household Income | Without Mortgage | With Mortgage |
| Less than $10,000 | 0 (0.0%) | 0 (0.0%) |
| $10,000 to $24,999 | 63 (38.9%) | 0 (0.0%) |
| $25,000 to $34,999 | 35 (21.6%) | 0 (0.0%) |
| $35,000 to $49,999 | 58 (35.8%) | 0 (0.0%) |
| $50,000 to $74,999 | 6 (3.7%) | 0 (0.0%) |
| $75,000 to $99,999 | 0 (0.0%) | 0 (0.0%) |
| $100,000 to $149,999 | 0 (0.0%) | 0 (0.0%) |
| $150,000 or more | 0 (0.0%) | 0 (0.0%) |
| Total | 162 (100.0%) | 0 (0.0%) |
Property Value to Household Income Ratio in Monterey Park
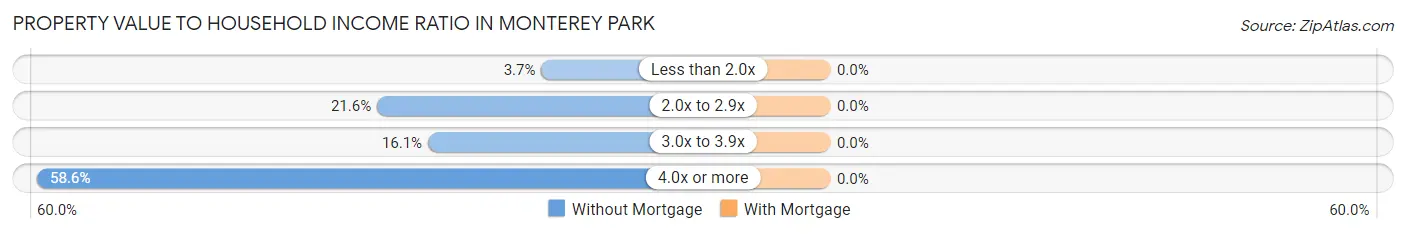
| Value-to-Income Ratio | Without Mortgage | With Mortgage |
| Less than 2.0x | 6 (3.7%) | 0 (0.0%) |
| 2.0x to 2.9x | 35 (21.6%) | 0 (0.0%) |
| 3.0x to 3.9x | 26 (16.1%) | 0 (0.0%) |
| 4.0x or more | 95 (58.6%) | 0 (0.0%) |
| Total | 162 (100.0%) | 0 (0.0%) |
Real Estate Taxes by Mortgage Status in Monterey Park
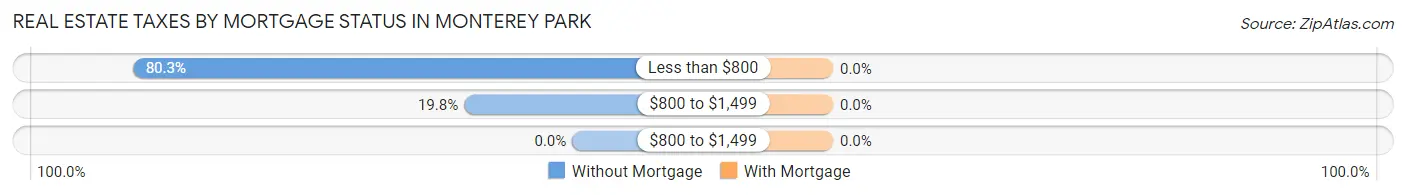
| Property Taxes | Without Mortgage | With Mortgage |
| Less than $800 | 130 (80.2%) | 0 (0.0%) |
| $800 to $1,499 | 32 (19.8%) | 0 (0.0%) |
| $800 to $1,499 | 0 (0.0%) | 0 (0.0%) |
| Total | 162 (100.0%) | 0 (0.0%) |
Health & Disability in Monterey Park
Health Insurance Coverage by Age in Monterey Park
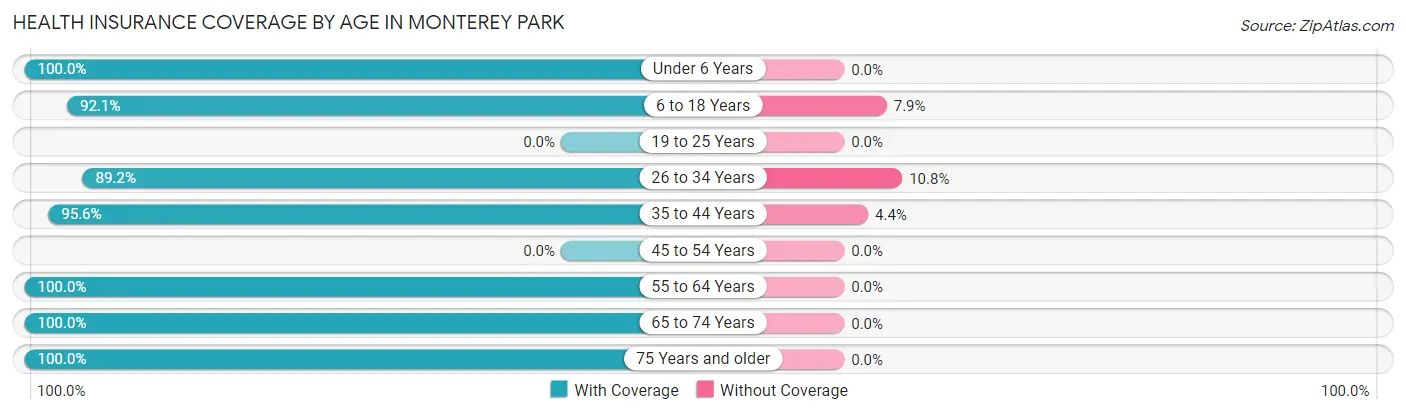
| Age Bracket | With Coverage | Without Coverage |
| Under 6 Years | 101 (100.0%) | 0 (0.0%) |
| 6 to 18 Years | 93 (92.1%) | 8 (7.9%) |
| 19 to 25 Years | 0 (0.0%) | 0 (0.0%) |
| 26 to 34 Years | 99 (89.2%) | 12 (10.8%) |
| 35 to 44 Years | 129 (95.6%) | 6 (4.4%) |
| 45 to 54 Years | 0 (0.0%) | 0 (0.0%) |
| 55 to 64 Years | 26 (100.0%) | 0 (0.0%) |
| 65 to 74 Years | 78 (100.0%) | 0 (0.0%) |
| 75 Years and older | 32 (100.0%) | 0 (0.0%) |
| Total | 558 (95.6%) | 26 (4.4%) |
Health Insurance Coverage by Citizenship Status in Monterey Park
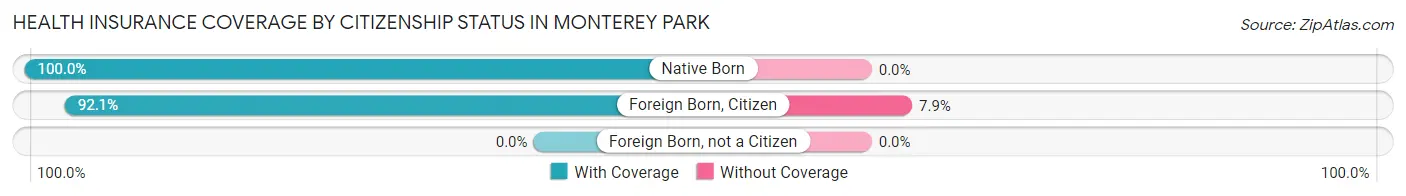
| Citizenship Status | With Coverage | Without Coverage |
| Native Born | 101 (100.0%) | 0 (0.0%) |
| Foreign Born, Citizen | 93 (92.1%) | 8 (7.9%) |
| Foreign Born, not a Citizen | 0 (0.0%) | 0 (0.0%) |
Health Insurance Coverage by Household Income in Monterey Park
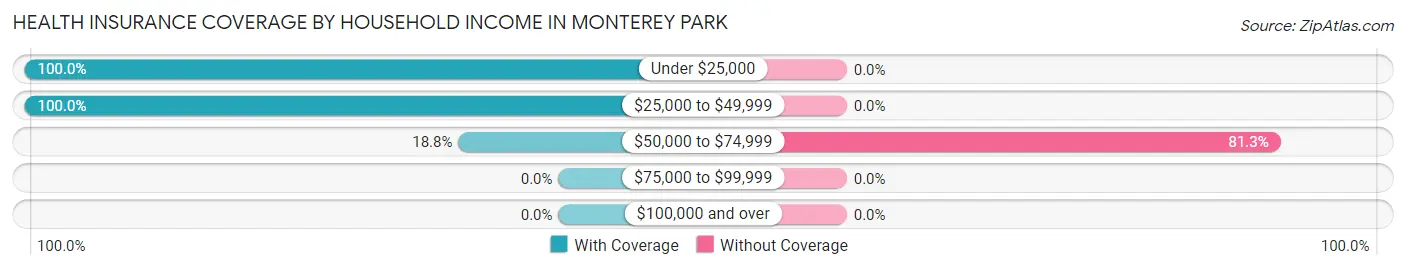
| Household Income | With Coverage | Without Coverage |
| Under $25,000 | 220 (100.0%) | 0 (0.0%) |
| $25,000 to $49,999 | 332 (100.0%) | 0 (0.0%) |
| $50,000 to $74,999 | 6 (18.8%) | 26 (81.2%) |
| $75,000 to $99,999 | 0 (0.0%) | 0 (0.0%) |
| $100,000 and over | 0 (0.0%) | 0 (0.0%) |
Public vs Private Health Insurance Coverage by Age in Monterey Park
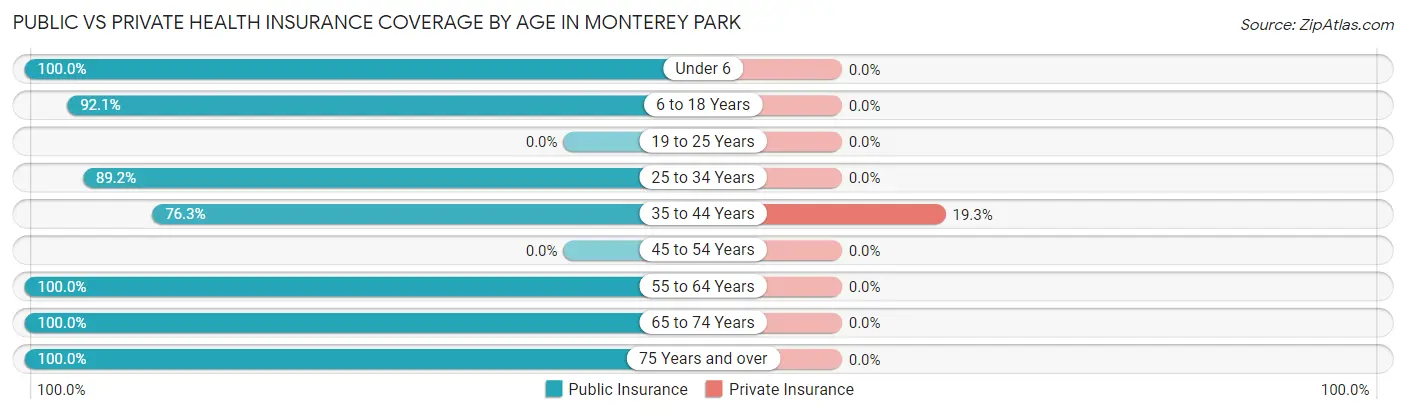
| Age Bracket | Public Insurance | Private Insurance |
| Under 6 | 101 (100.0%) | 0 (0.0%) |
| 6 to 18 Years | 93 (92.1%) | 0 (0.0%) |
| 19 to 25 Years | 0 (0.0%) | 0 (0.0%) |
| 25 to 34 Years | 99 (89.2%) | 0 (0.0%) |
| 35 to 44 Years | 103 (76.3%) | 26 (19.3%) |
| 45 to 54 Years | 0 (0.0%) | 0 (0.0%) |
| 55 to 64 Years | 26 (100.0%) | 0 (0.0%) |
| 65 to 74 Years | 78 (100.0%) | 0 (0.0%) |
| 75 Years and over | 32 (100.0%) | 0 (0.0%) |
| Total | 532 (91.1%) | 26 (4.4%) |
Disability Status by Sex by Age in Monterey Park
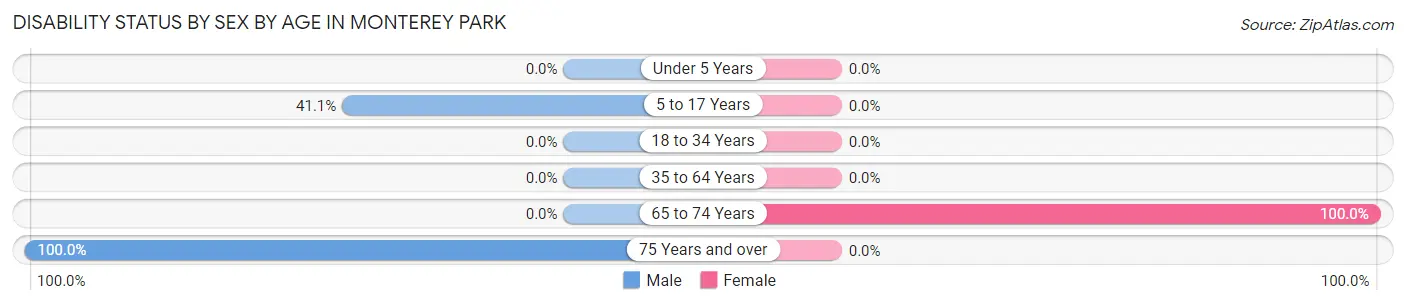
| Age Bracket | Male | Female |
| Under 5 Years | 0 (0.0%) | 0 (0.0%) |
| 5 to 17 Years | 46 (41.1%) | 0 (0.0%) |
| 18 to 34 Years | 0 (0.0%) | 0 (0.0%) |
| 35 to 64 Years | 0 (0.0%) | 0 (0.0%) |
| 65 to 74 Years | 0 (0.0%) | 43 (100.0%) |
| 75 Years and over | 32 (100.0%) | 0 (0.0%) |
Disability Class by Sex by Age in Monterey Park
Disability Class: Hearing Difficulty
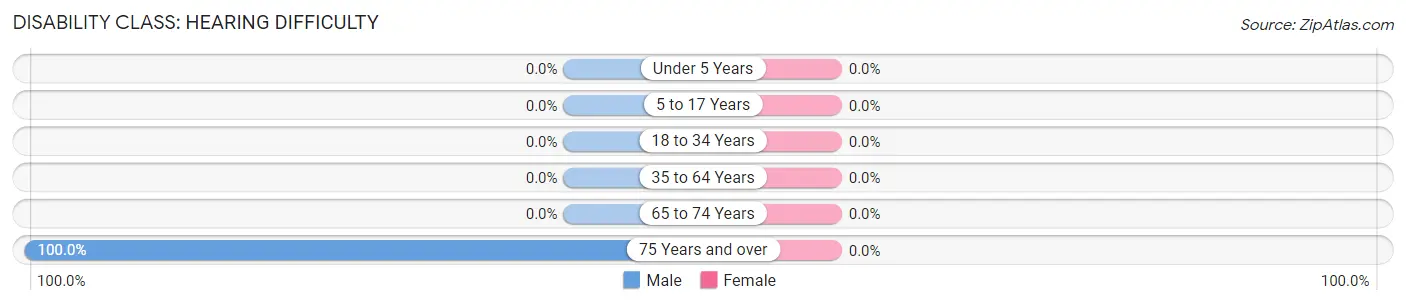
| Age Bracket | Male | Female |
| Under 5 Years | 0 (0.0%) | 0 (0.0%) |
| 5 to 17 Years | 0 (0.0%) | 0 (0.0%) |
| 18 to 34 Years | 0 (0.0%) | 0 (0.0%) |
| 35 to 64 Years | 0 (0.0%) | 0 (0.0%) |
| 65 to 74 Years | 0 (0.0%) | 0 (0.0%) |
| 75 Years and over | 32 (100.0%) | 0 (0.0%) |
Disability Class: Vision Difficulty
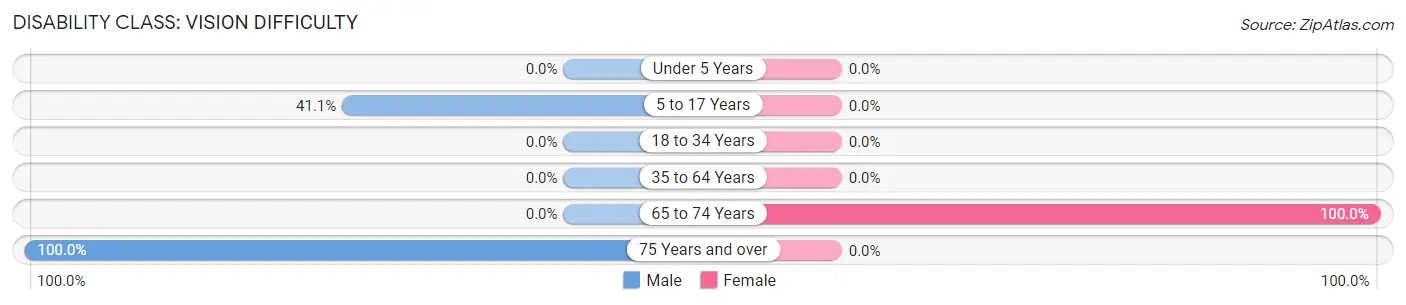
| Age Bracket | Male | Female |
| Under 5 Years | 0 (0.0%) | 0 (0.0%) |
| 5 to 17 Years | 46 (41.1%) | 0 (0.0%) |
| 18 to 34 Years | 0 (0.0%) | 0 (0.0%) |
| 35 to 64 Years | 0 (0.0%) | 0 (0.0%) |
| 65 to 74 Years | 0 (0.0%) | 43 (100.0%) |
| 75 Years and over | 32 (100.0%) | 0 (0.0%) |
Disability Class: Cognitive Difficulty
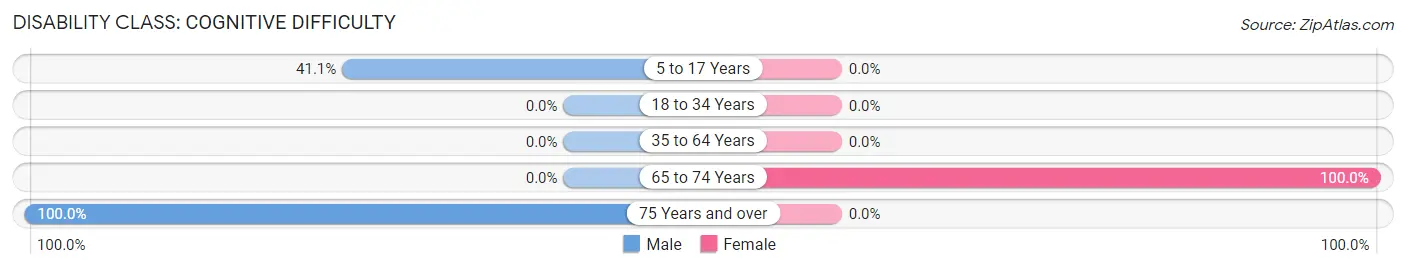
| Age Bracket | Male | Female |
| 5 to 17 Years | 46 (41.1%) | 0 (0.0%) |
| 18 to 34 Years | 0 (0.0%) | 0 (0.0%) |
| 35 to 64 Years | 0 (0.0%) | 0 (0.0%) |
| 65 to 74 Years | 0 (0.0%) | 43 (100.0%) |
| 75 Years and over | 32 (100.0%) | 0 (0.0%) |
Disability Class: Ambulatory Difficulty
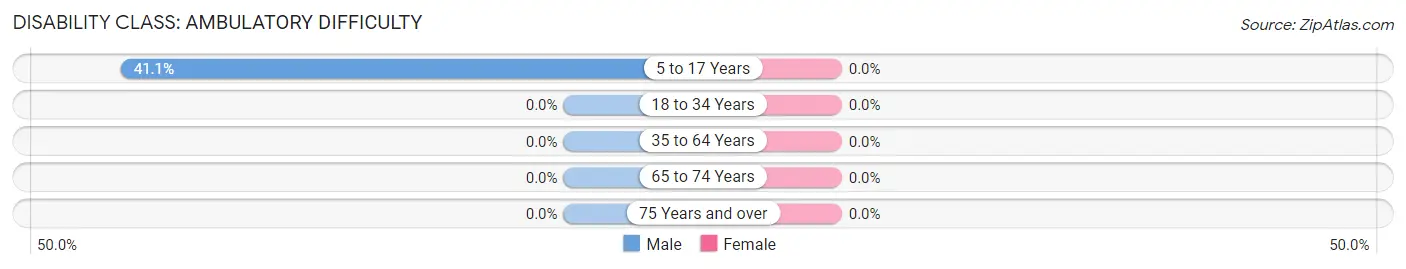
| Age Bracket | Male | Female |
| 5 to 17 Years | 46 (41.1%) | 0 (0.0%) |
| 18 to 34 Years | 0 (0.0%) | 0 (0.0%) |
| 35 to 64 Years | 0 (0.0%) | 0 (0.0%) |
| 65 to 74 Years | 0 (0.0%) | 0 (0.0%) |
| 75 Years and over | 0 (0.0%) | 0 (0.0%) |
Disability Class: Self-Care Difficulty
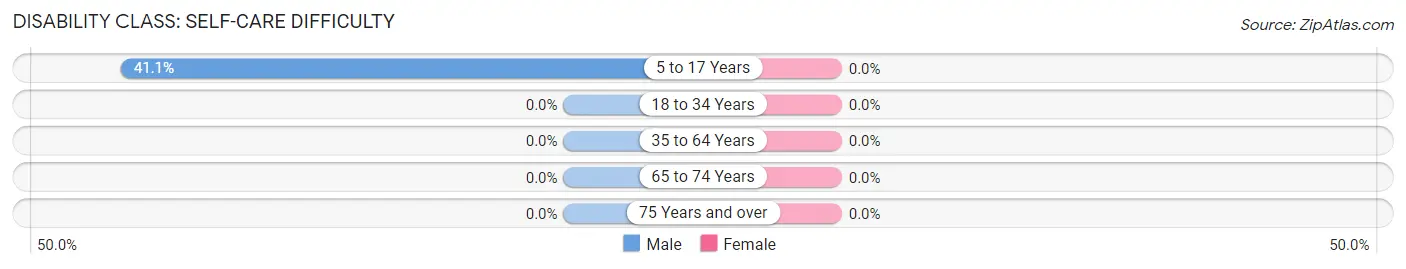
| Age Bracket | Male | Female |
| 5 to 17 Years | 46 (41.1%) | 0 (0.0%) |
| 18 to 34 Years | 0 (0.0%) | 0 (0.0%) |
| 35 to 64 Years | 0 (0.0%) | 0 (0.0%) |
| 65 to 74 Years | 0 (0.0%) | 0 (0.0%) |
| 75 Years and over | 0 (0.0%) | 0 (0.0%) |
Technology Access in Monterey Park
Computing Device Access in Monterey Park
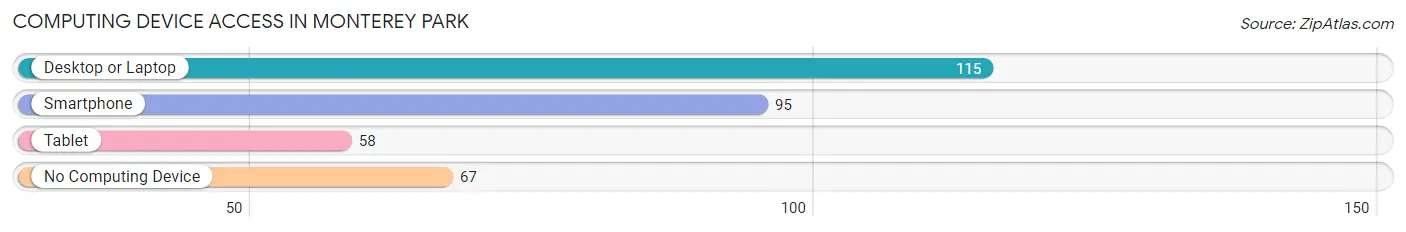
| Device Type | # Households | % Households |
| Desktop or Laptop | 115 | 61.2% |
| Smartphone | 95 | 50.5% |
| Tablet | 58 | 30.8% |
| No Computing Device | 67 | 35.6% |
| Total | 188 | 100.0% |
Internet Access in Monterey Park
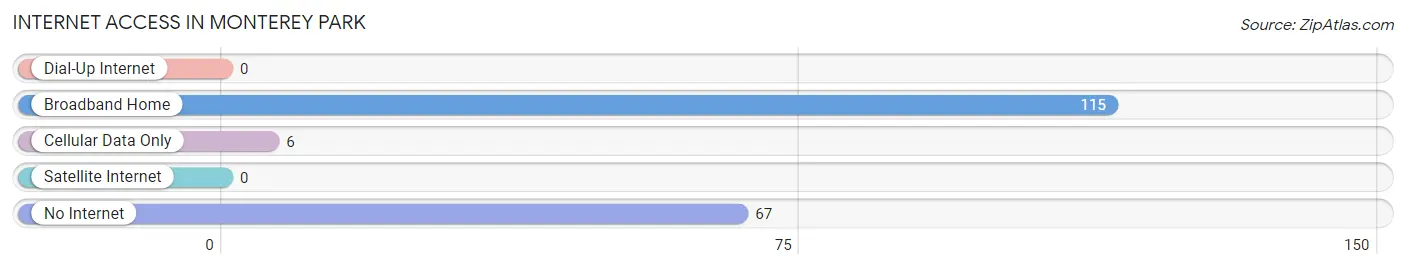
| Internet Type | # Households | % Households |
| Dial-Up Internet | 0 | 0.0% |
| Broadband Home | 115 | 61.2% |
| Cellular Data Only | 6 | 3.2% |
| Satellite Internet | 0 | 0.0% |
| No Internet | 67 | 35.6% |
| Total | 188 | 100.0% |
Monterey Park Summary
Monterey Park, New Mexico is a small town located in the southeastern corner of the state. It is situated in the foothills of the Sangre de Cristo Mountains, and is part of the larger Taos County. The town has a population of just over 1,000 people, and is known for its rural charm and scenic beauty.
History
Monterey Park was founded in 1876 by a group of settlers from the nearby town of Taos. The settlers were looking for a place to settle and raise their families, and they chose the area because of its natural beauty and abundant resources. The town was originally called “Monterey”, but the name was changed to “Monterey Park” in 1882.
The town grew slowly over the years, and by the early 1900s it had become a popular destination for tourists and outdoor enthusiasts. The town was also home to a number of small businesses, including a general store, a blacksmith shop, and a saloon.
In the 1950s, the town began to experience a period of growth and development. The population increased, and new businesses began to open. The town also became a popular destination for retirees, and the population continued to grow.
Geography
Monterey Park is located in the southeastern corner of New Mexico, in the foothills of the Sangre de Cristo Mountains. The town is situated at an elevation of 6,000 feet, and is surrounded by rolling hills and lush forests. The town is located near the Rio Grande River, and is just a short drive from the larger cities of Santa Fe and Albuquerque.
The climate in Monterey Park is semi-arid, with hot summers and cold winters. The average annual temperature is around 60 degrees Fahrenheit, and the average annual precipitation is around 12 inches.
Economy
The economy of Monterey Park is largely based on tourism and outdoor recreation. The town is home to a number of small businesses, including restaurants, shops, and galleries. The town is also home to a number of outdoor recreation activities, including hiking, camping, fishing, and hunting.
The town is also home to a number of small manufacturing businesses, including a furniture factory and a woodworking shop. The town is also home to a number of small farms, which produce a variety of fruits and vegetables.
Demographics
As of the 2010 census, the population of Monterey Park was 1,072. The population is largely made up of white (83.3%) and Hispanic (14.2%) residents. The median household income is $37,500, and the median age is 44.
The town is home to a number of churches, including the Monterey Park Baptist Church and the Monterey Park United Methodist Church. The town is also home to a number of schools, including the Monterey Park Elementary School and the Monterey Park High School.
Conclusion
Monterey Park, New Mexico is a small town located in the southeastern corner of the state. It is situated in the foothills of the Sangre de Cristo Mountains, and is part of the larger Taos County. The town has a population of just over 1,000 people, and is known for its rural charm and scenic beauty. The economy of Monterey Park is largely based on tourism and outdoor recreation, and the population is largely made up of white and Hispanic residents. The town is home to a number of churches, schools, and small businesses, and is a popular destination for retirees and outdoor enthusiasts.
Common Questions
What is Per Capita Income in Monterey Park?
Per Capita income in Monterey Park is $9,739.
What is the Median Household income in Monterey Park?
Median Household Income in Monterey Park is $25,357.
What is Inequality or Gini Index in Monterey Park?
Inequality or Gini Index in Monterey Park is 0.19.
What is the Total Population of Monterey Park?
Total Population of Monterey Park is 584.
What is the Total Male Population of Monterey Park?
Total Male Population of Monterey Park is 331.
What is the Total Female Population of Monterey Park?
Total Female Population of Monterey Park is 253.
What is the Ratio of Males per 100 Females in Monterey Park?
There are 130.83 Males per 100 Females in Monterey Park.
What is the Ratio of Females per 100 Males in Monterey Park?
There are 76.44 Females per 100 Males in Monterey Park.
What is the Median Population Age in Monterey Park?
Median Population Age in Monterey Park is 29.9 Years.
What is the Average Family Size in Monterey Park
Average Family Size in Monterey Park is 4.1 People.
What is the Average Household Size in Monterey Park
Average Household Size in Monterey Park is 3.1 People.
How Large is the Labor Force in Monterey Park?
There are 215 People in the Labor Forcein in Monterey Park.
What is the Percentage of People in the Labor Force in Monterey Park?
56.3% of People are in the Labor Force in Monterey Park.
What is the Unemployment Rate in Monterey Park?
Unemployment Rate in Monterey Park is 24.7%.