Midway, NM Map & Demographics
Midway Map
Midway Overview
$23,140
PER CAPITA INCOME
$40,568
AVG FAMILY INCOME
$35,708
AVG HOUSEHOLD INCOME
0.39
INEQUALITY / GINI INDEX
645
TOTAL POPULATION
309
MALE POPULATION
336
FEMALE POPULATION
91.96
MALES / 100 FEMALES
108.74
FEMALES / 100 MALES
57.2
MEDIAN AGE
2.5
AVG FAMILY SIZE
2.1
AVG HOUSEHOLD SIZE
184
LABOR FORCE [ PEOPLE ]
31.7%
PERCENT IN LABOR FORCE
Income in Midway
Income Overview in Midway
Per Capita Income in Midway is $23,140, while median incomes of families and households are $40,568 and $35,708 respectively.
| Characteristic | Number | Measure |
| Per Capita Income | 645 | $23,140 |
| Median Family Income | 186 | $40,568 |
| Mean Family Income | 186 | $52,399 |
| Median Household Income | 303 | $35,708 |
| Mean Household Income | 303 | $41,774 |
| Income Deficit | 186 | $0 |
| Wage / Income Gap (%) | 645 | 0.00% |
| Wage / Income Gap ($) | 645 | 100.00¢ per $1 |
| Gini / Inequality Index | 645 | 0.39 |
Earnings by Sex in Midway
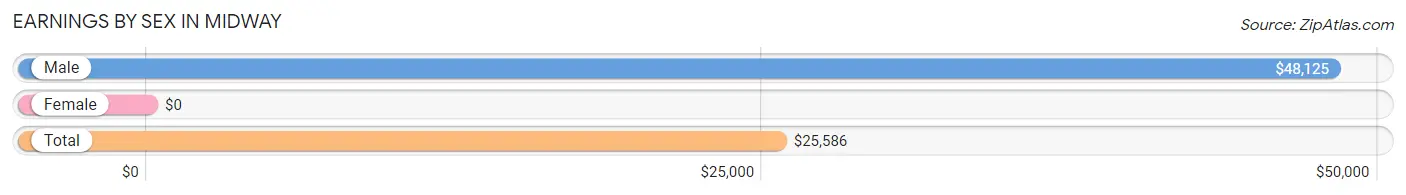
| Sex | Number | Average Earnings |
| Male | 119 (51.5%) | $48,125 |
| Female | 112 (48.5%) | $0 |
| Total | 231 (100.0%) | $25,586 |
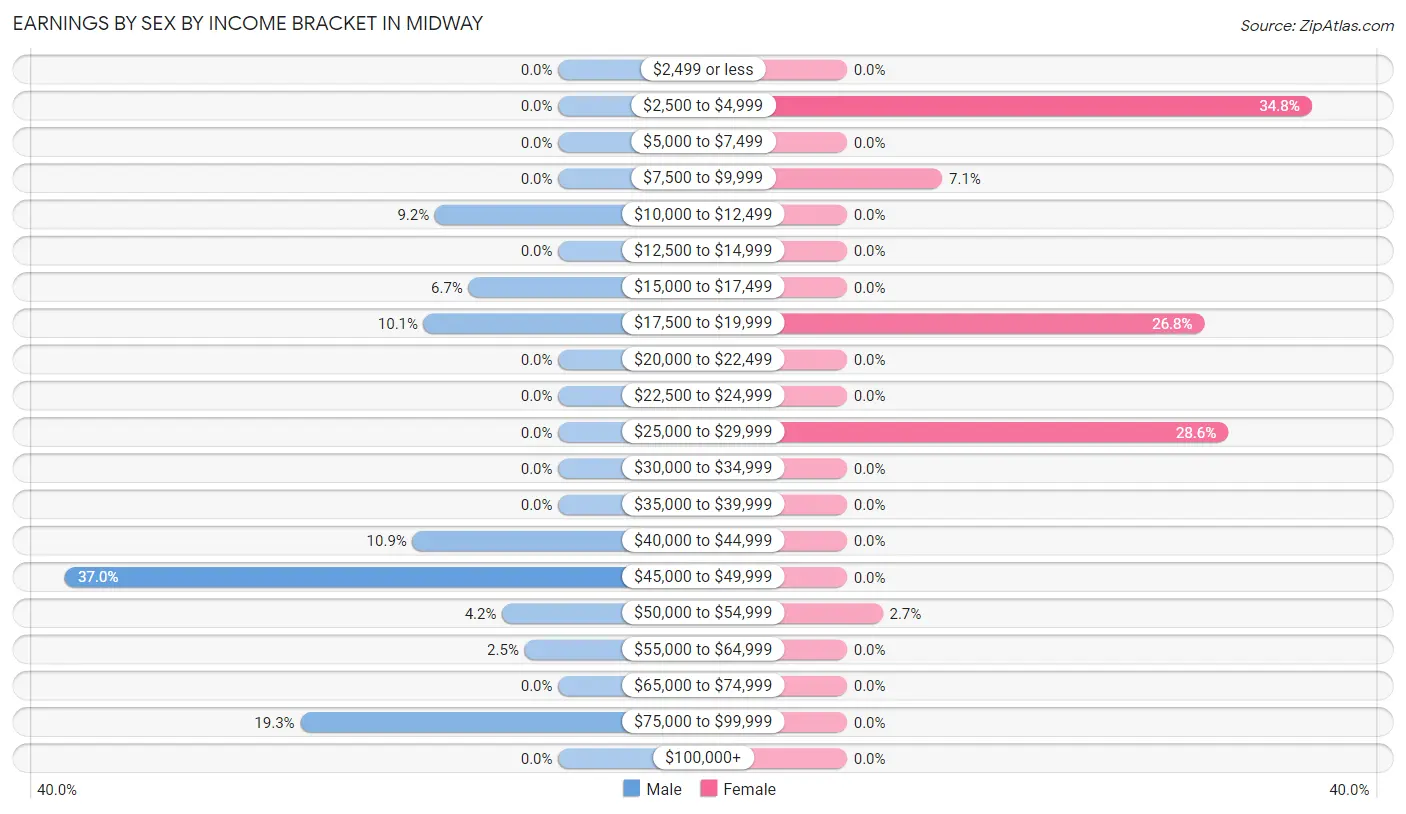
Earnings by Sex by Income Bracket in Midway
The most common earnings brackets in Midway are $45,000 to $49,999 for men (44 | 37.0%) and $2,500 to $4,999 for women (39 | 34.8%).
| Income | Male | Female |
| $2,499 or less | 0 (0.0%) | 0 (0.0%) |
| $2,500 to $4,999 | 0 (0.0%) | 39 (34.8%) |
| $5,000 to $7,499 | 0 (0.0%) | 0 (0.0%) |
| $7,500 to $9,999 | 0 (0.0%) | 8 (7.1%) |
| $10,000 to $12,499 | 11 (9.2%) | 0 (0.0%) |
| $12,500 to $14,999 | 0 (0.0%) | 0 (0.0%) |
| $15,000 to $17,499 | 8 (6.7%) | 0 (0.0%) |
| $17,500 to $19,999 | 12 (10.1%) | 30 (26.8%) |
| $20,000 to $22,499 | 0 (0.0%) | 0 (0.0%) |
| $22,500 to $24,999 | 0 (0.0%) | 0 (0.0%) |
| $25,000 to $29,999 | 0 (0.0%) | 32 (28.6%) |
| $30,000 to $34,999 | 0 (0.0%) | 0 (0.0%) |
| $35,000 to $39,999 | 0 (0.0%) | 0 (0.0%) |
| $40,000 to $44,999 | 13 (10.9%) | 0 (0.0%) |
| $45,000 to $49,999 | 44 (37.0%) | 0 (0.0%) |
| $50,000 to $54,999 | 5 (4.2%) | 3 (2.7%) |
| $55,000 to $64,999 | 3 (2.5%) | 0 (0.0%) |
| $65,000 to $74,999 | 0 (0.0%) | 0 (0.0%) |
| $75,000 to $99,999 | 23 (19.3%) | 0 (0.0%) |
| $100,000+ | 0 (0.0%) | 0 (0.0%) |
| Total | 119 (100.0%) | 112 (100.0%) |
Earnings by Sex by Educational Attainment in Midway
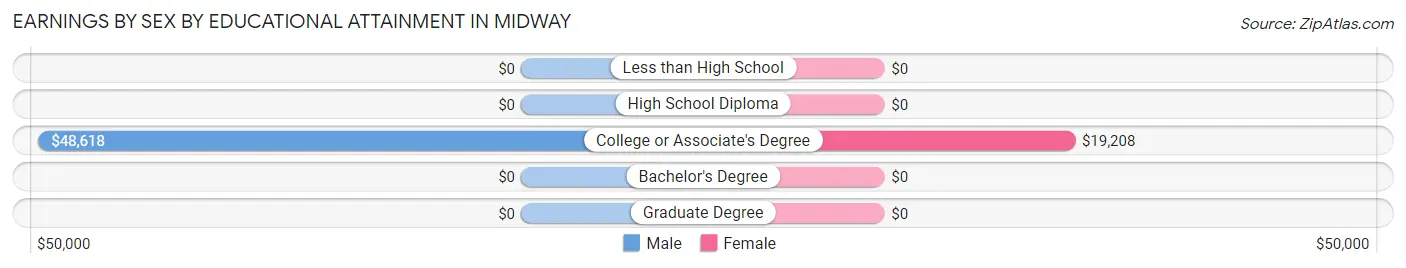
| Educational Attainment | Male Income | Female Income |
| Less than High School | - | - |
| High School Diploma | - | - |
| College or Associate's Degree | $48,618 | $19,208 |
| Bachelor's Degree | - | - |
| Graduate Degree | - | - |
| Total | $48,125 | $0 |
Family Income in Midway
Family Income Brackets in Midway
According to the Midway family income data, there are 74 families falling into the $35,000 to $49,999 income range, which is the most common income bracket and makes up 39.8% of all families.
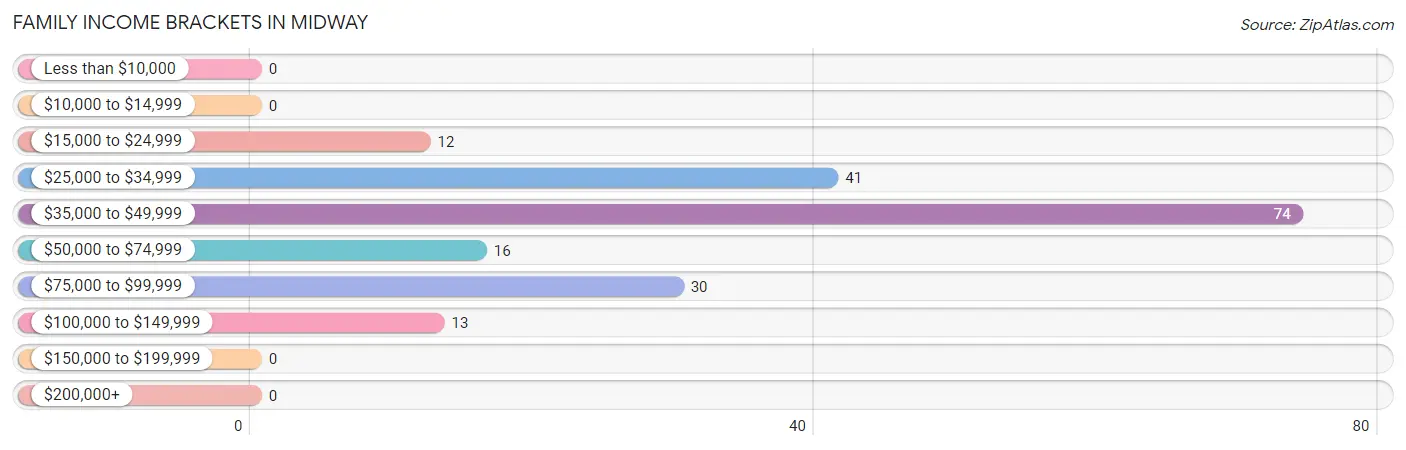
| Income Bracket | # Families | % Families |
| Less than $10,000 | 0 | 0.0% |
| $10,000 to $14,999 | 0 | 0.0% |
| $15,000 to $24,999 | 12 | 6.5% |
| $25,000 to $34,999 | 41 | 22.0% |
| $35,000 to $49,999 | 74 | 39.8% |
| $50,000 to $74,999 | 16 | 8.6% |
| $75,000 to $99,999 | 30 | 16.1% |
| $100,000 to $149,999 | 13 | 7.0% |
| $150,000 to $199,999 | 0 | 0.0% |
| $200,000+ | 0 | 0.0% |
Family Income by Famaliy Size in Midway
3-person families (23 | 12.4%) account for the highest median family income in Midway with $64,250 per family, while 3-person families (23 | 12.4%) have the highest median income of $21,417 per family member.
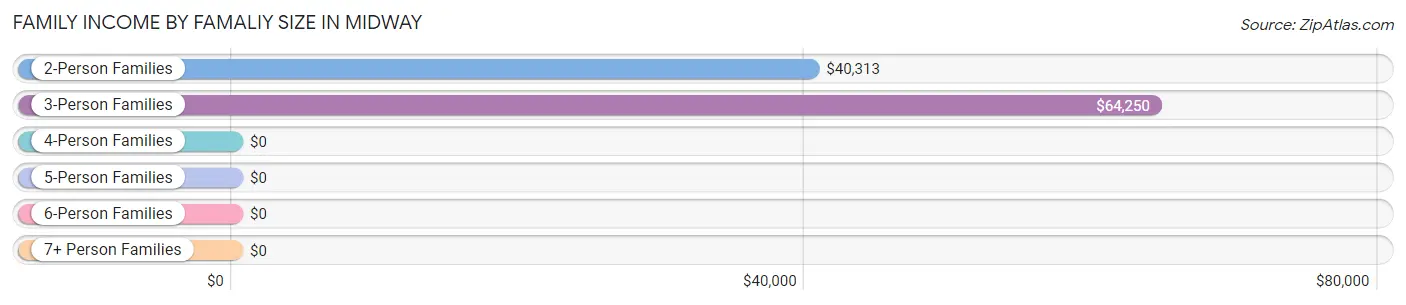
| Income Bracket | # Families | Median Income |
| 2-Person Families | 151 (81.2%) | $40,313 |
| 3-Person Families | 23 (12.4%) | $64,250 |
| 4-Person Families | 12 (6.5%) | $0 |
| 5-Person Families | 0 (0.0%) | $0 |
| 6-Person Families | 0 (0.0%) | $0 |
| 7+ Person Families | 0 (0.0%) | $0 |
| Total | 186 (100.0%) | $40,568 |
Family Income by Number of Earners in Midway
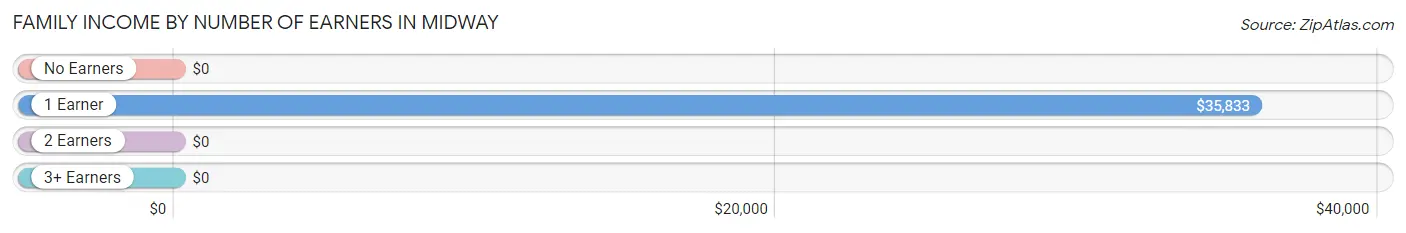
| Number of Earners | # Families | Median Income |
| No Earners | 47 (25.3%) | $0 |
| 1 Earner | 126 (67.7%) | $35,833 |
| 2 Earners | 13 (7.0%) | $0 |
| 3+ Earners | 0 (0.0%) | $0 |
| Total | 186 (100.0%) | $40,568 |
Household Income in Midway
Household Income Brackets in Midway
With 80 households falling in the category, the $35,000 to $49,999 income range is the most frequent in Midway, accounting for 26.4% of all households.
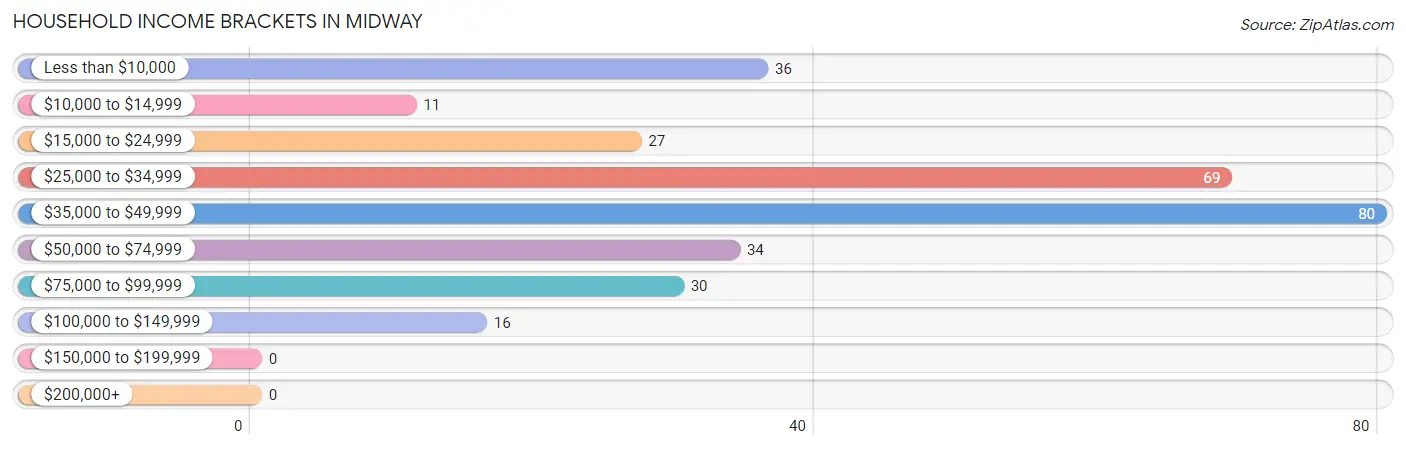
| Income Bracket | # Households | % Households |
| Less than $10,000 | 36 | 11.9% |
| $10,000 to $14,999 | 11 | 3.6% |
| $15,000 to $24,999 | 27 | 8.9% |
| $25,000 to $34,999 | 69 | 22.8% |
| $35,000 to $49,999 | 80 | 26.4% |
| $50,000 to $74,999 | 34 | 11.2% |
| $75,000 to $99,999 | 30 | 9.9% |
| $100,000 to $149,999 | 16 | 5.3% |
| $150,000 to $199,999 | 0 | 0.0% |
| $200,000+ | 0 | 0.0% |
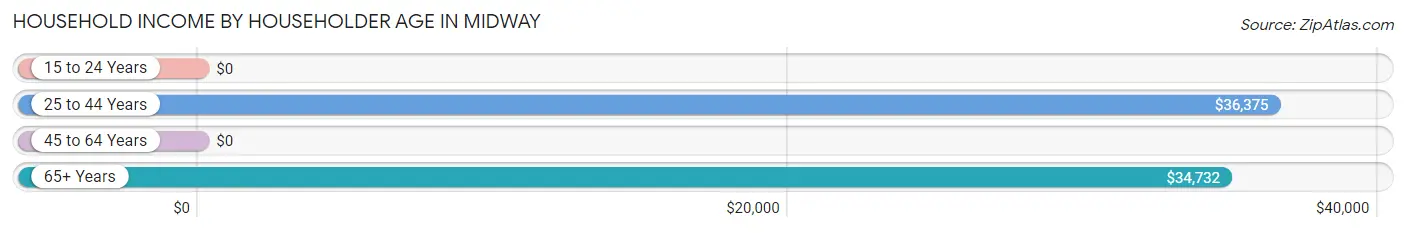
Household Income by Householder Age in Midway
The median household income in Midway is $35,708, with the highest median household income of $36,375 found in the 25 to 44 years age bracket for the primary householder. A total of 57 households (18.8%) fall into this category.
| Income Bracket | # Households | Median Income |
| 15 to 24 Years | 0 (0.0%) | $0 |
| 25 to 44 Years | 57 (18.8%) | $36,375 |
| 45 to 64 Years | 110 (36.3%) | $0 |
| 65+ Years | 136 (44.9%) | $34,732 |
| Total | 303 (100.0%) | $35,708 |
Poverty in Midway
Income Below Poverty by Sex and Age in Midway
With 23.9% poverty level for males and 19.1% for females among the residents of Midway, 6 to 11 year old males and 6 to 11 year old females are the most vulnerable to poverty, with 8 males (100.0%) and 7 females (100.0%) in their respective age groups living below the poverty level.
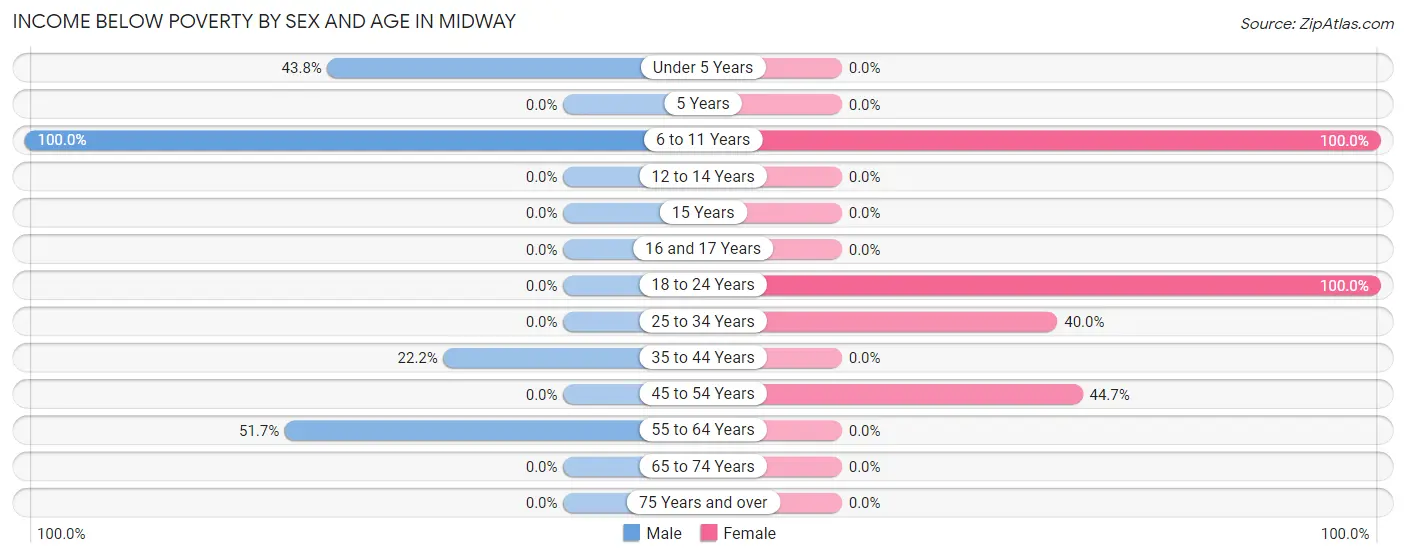
| Age Bracket | Male | Female |
| Under 5 Years | 7 (43.8%) | 0 (0.0%) |
| 5 Years | 0 (0.0%) | 0 (0.0%) |
| 6 to 11 Years | 8 (100.0%) | 7 (100.0%) |
| 12 to 14 Years | 0 (0.0%) | 0 (0.0%) |
| 15 Years | 0 (0.0%) | 0 (0.0%) |
| 16 and 17 Years | 0 (0.0%) | 0 (0.0%) |
| 18 to 24 Years | 0 (0.0%) | 7 (100.0%) |
| 25 to 34 Years | 0 (0.0%) | 8 (40.0%) |
| 35 to 44 Years | 12 (22.2%) | 0 (0.0%) |
| 45 to 54 Years | 0 (0.0%) | 42 (44.7%) |
| 55 to 64 Years | 47 (51.6%) | 0 (0.0%) |
| 65 to 74 Years | 0 (0.0%) | 0 (0.0%) |
| 75 Years and over | 0 (0.0%) | 0 (0.0%) |
| Total | 74 (23.9%) | 64 (19.1%) |
Income Above Poverty by Sex and Age in Midway
According to the poverty statistics in Midway, males aged 25 to 34 years and females aged under 5 years are the age groups that are most secure financially, with 100.0% of males and 100.0% of females in these age groups living above the poverty line.
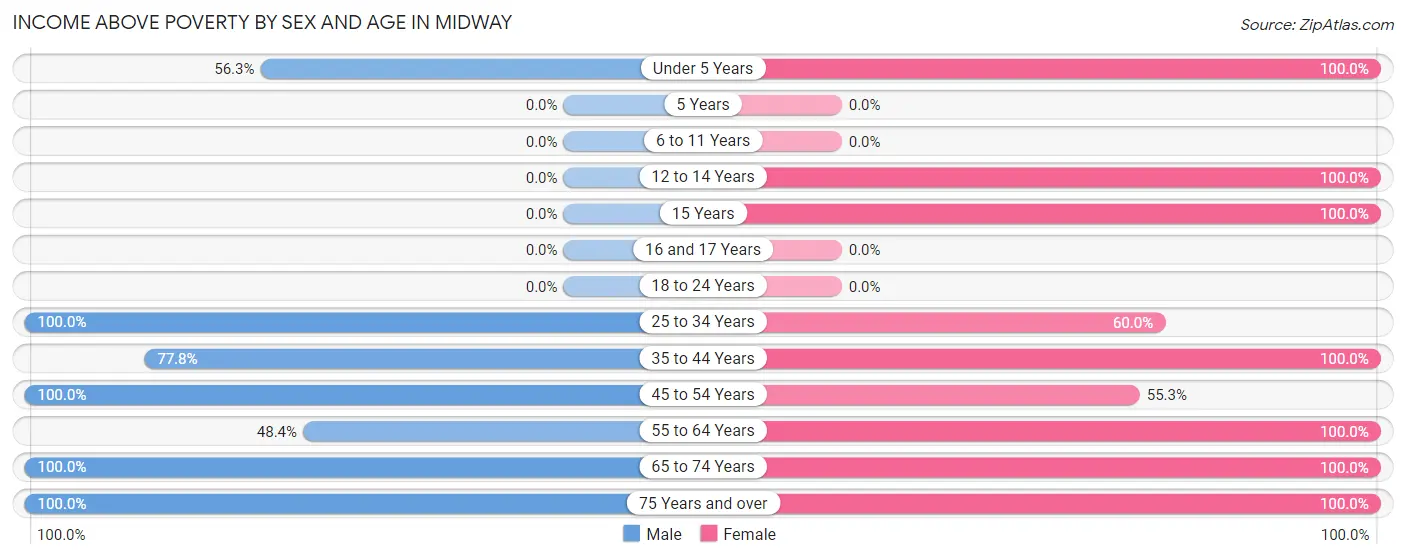
| Age Bracket | Male | Female |
| Under 5 Years | 9 (56.2%) | 10 (100.0%) |
| 5 Years | 0 (0.0%) | 0 (0.0%) |
| 6 to 11 Years | 0 (0.0%) | 0 (0.0%) |
| 12 to 14 Years | 0 (0.0%) | 11 (100.0%) |
| 15 Years | 0 (0.0%) | 13 (100.0%) |
| 16 and 17 Years | 0 (0.0%) | 0 (0.0%) |
| 18 to 24 Years | 0 (0.0%) | 0 (0.0%) |
| 25 to 34 Years | 15 (100.0%) | 12 (60.0%) |
| 35 to 44 Years | 42 (77.8%) | 30 (100.0%) |
| 45 to 54 Years | 29 (100.0%) | 52 (55.3%) |
| 55 to 64 Years | 44 (48.3%) | 20 (100.0%) |
| 65 to 74 Years | 60 (100.0%) | 80 (100.0%) |
| 75 Years and over | 36 (100.0%) | 44 (100.0%) |
| Total | 235 (76.0%) | 272 (80.9%) |
Income Below Poverty Among Married-Couple Families in Midway
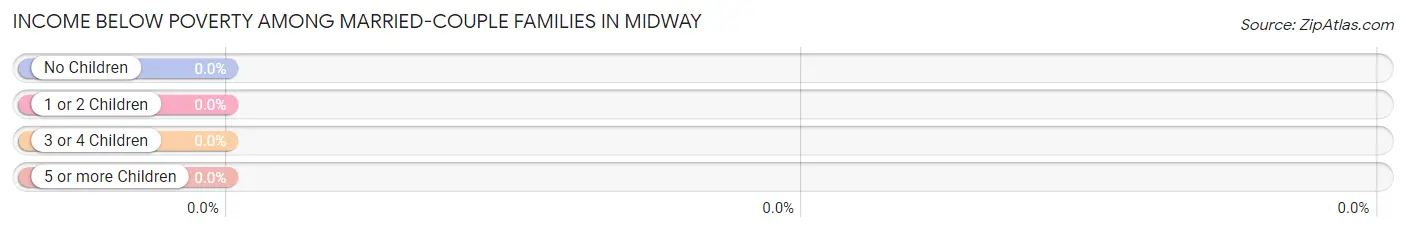
| Children | Above Poverty | Below Poverty |
| No Children | 138 (100.0%) | 0 (0.0%) |
| 1 or 2 Children | 18 (100.0%) | 0 (0.0%) |
| 3 or 4 Children | 0 (0.0%) | 0 (0.0%) |
| 5 or more Children | 0 (0.0%) | 0 (0.0%) |
| Total | 156 (100.0%) | 0 (0.0%) |
Income Below Poverty Among Single-Parent Households in Midway
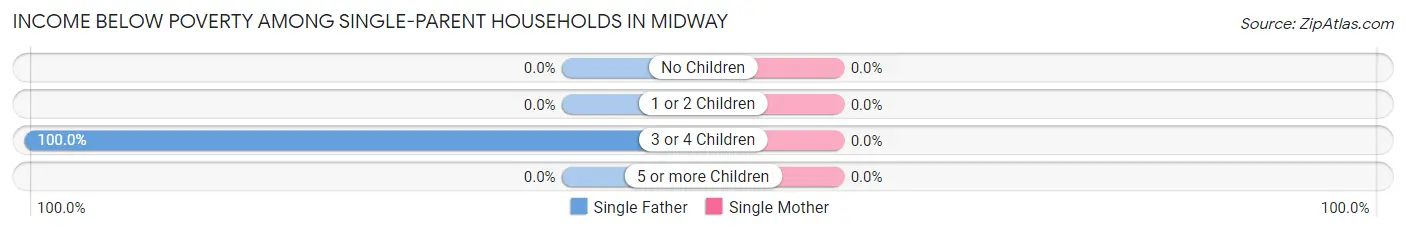
| Children | Single Father | Single Mother |
| No Children | 0 (0.0%) | 0 (0.0%) |
| 1 or 2 Children | 0 (0.0%) | 0 (0.0%) |
| 3 or 4 Children | 12 (100.0%) | 0 (0.0%) |
| 5 or more Children | 0 (0.0%) | 0 (0.0%) |
| Total | 12 (70.6%) | 0 (0.0%) |
Income Below Poverty Among Married-Couple vs Single-Parent Households in Midway
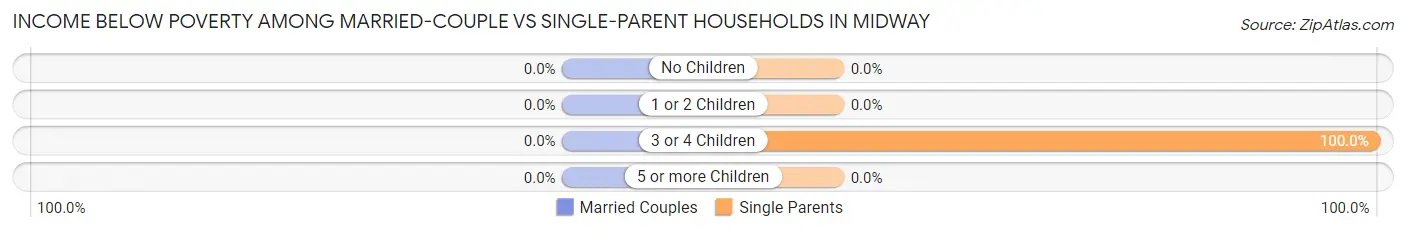
| Children | Married-Couple Families | Single-Parent Households |
| No Children | 0 (0.0%) | 0 (0.0%) |
| 1 or 2 Children | 0 (0.0%) | 0 (0.0%) |
| 3 or 4 Children | 0 (0.0%) | 12 (100.0%) |
| 5 or more Children | 0 (0.0%) | 0 (0.0%) |
| Total | 0 (0.0%) | 12 (40.0%) |
Race in Midway
The most populous races in Midway are White / Caucasian (485 | 75.2%), Hispanic or Latino (377 | 58.5%), and Two or more Races (101 | 15.7%).
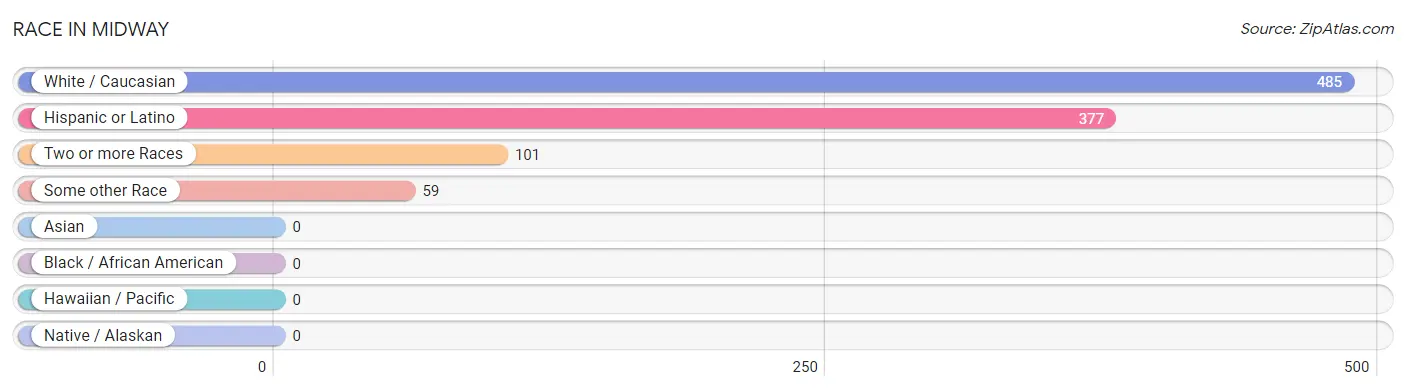
| Race | # Population | % Population |
| Asian | 0 | 0.0% |
| Black / African American | 0 | 0.0% |
| Hawaiian / Pacific | 0 | 0.0% |
| Hispanic or Latino | 377 | 58.5% |
| Native / Alaskan | 0 | 0.0% |
| White / Caucasian | 485 | 75.2% |
| Two or more Races | 101 | 15.7% |
| Some other Race | 59 | 9.1% |
| Total | 645 | 100.0% |
Ancestry in Midway
The most populous ancestries reported in Midway are Mexican (312 | 48.4%), Irish (139 | 21.5%), English (118 | 18.3%), French (47 | 7.3%), and American (26 | 4.0%), together accounting for 99.5% of all Midway residents.
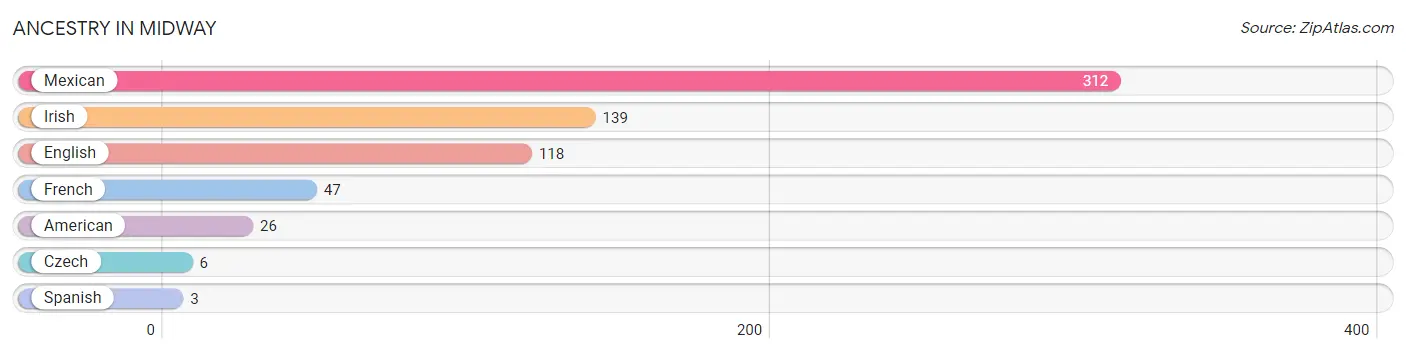
| Ancestry | # Population | % Population |
| American | 26 | 4.0% |
| Czech | 6 | 0.9% |
| English | 118 | 18.3% |
| French | 47 | 7.3% |
| Irish | 139 | 21.5% |
| Mexican | 312 | 48.4% |
| Spanish | 3 | 0.5% | View All 7 Rows |
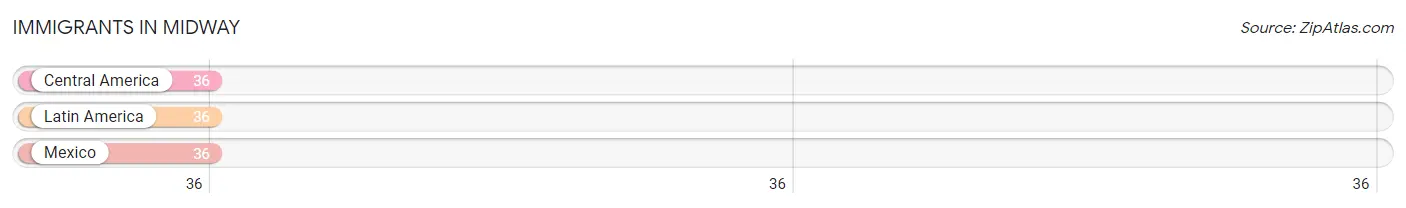
Immigrants in Midway
The most numerous immigrant groups reported in Midway came from Central America (36 | 5.6%), Latin America (36 | 5.6%), and Mexico (36 | 5.6%), together accounting for 16.7% of all Midway residents.
| Immigration Origin | # Population | % Population |
| Central America | 36 | 5.6% |
| Latin America | 36 | 5.6% |
| Mexico | 36 | 5.6% | View All 3 Rows |
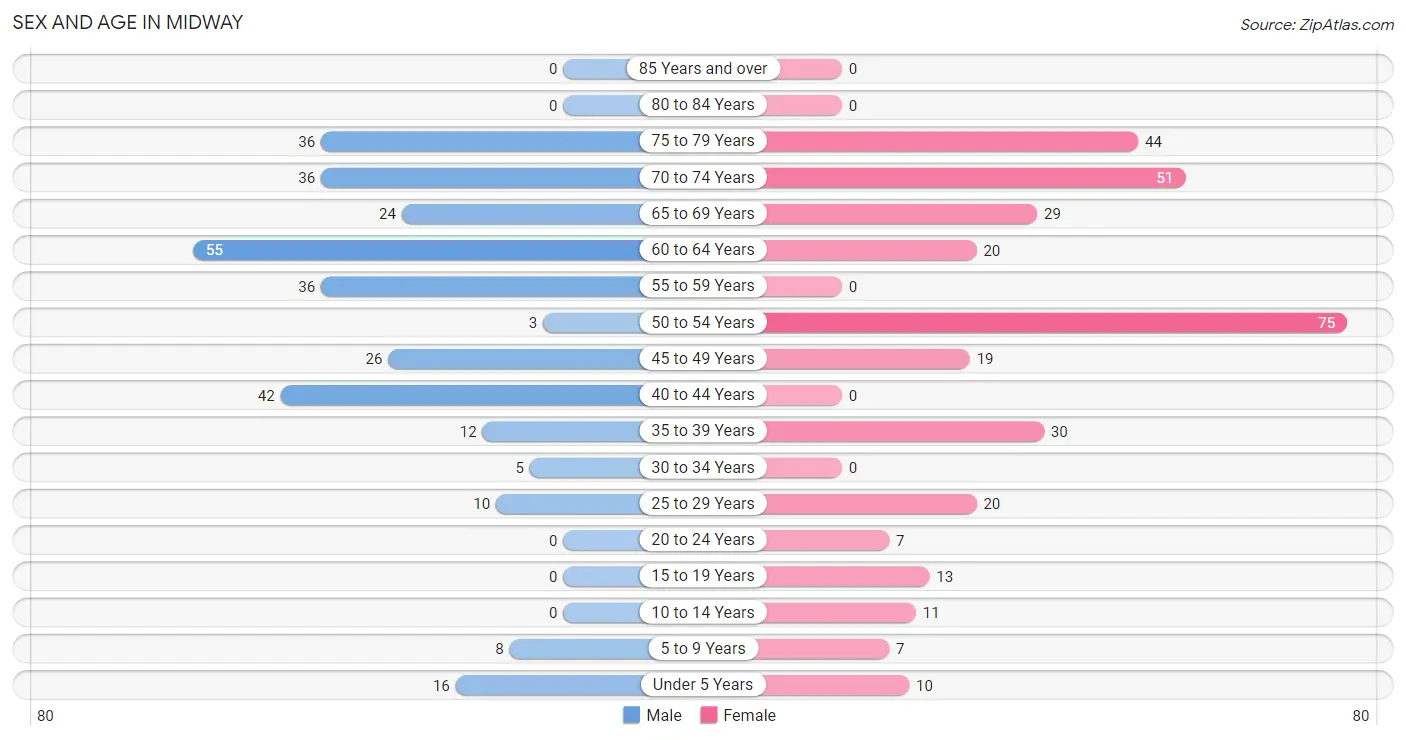
Sex and Age in Midway
Sex and Age in Midway
The most populous age groups in Midway are 60 to 64 Years (55 | 17.8%) for men and 50 to 54 Years (75 | 22.3%) for women.
| Age Bracket | Male | Female |
| Under 5 Years | 16 (5.2%) | 10 (3.0%) |
| 5 to 9 Years | 8 (2.6%) | 7 (2.1%) |
| 10 to 14 Years | 0 (0.0%) | 11 (3.3%) |
| 15 to 19 Years | 0 (0.0%) | 13 (3.9%) |
| 20 to 24 Years | 0 (0.0%) | 7 (2.1%) |
| 25 to 29 Years | 10 (3.2%) | 20 (5.9%) |
| 30 to 34 Years | 5 (1.6%) | 0 (0.0%) |
| 35 to 39 Years | 12 (3.9%) | 30 (8.9%) |
| 40 to 44 Years | 42 (13.6%) | 0 (0.0%) |
| 45 to 49 Years | 26 (8.4%) | 19 (5.7%) |
| 50 to 54 Years | 3 (1.0%) | 75 (22.3%) |
| 55 to 59 Years | 36 (11.7%) | 0 (0.0%) |
| 60 to 64 Years | 55 (17.8%) | 20 (5.9%) |
| 65 to 69 Years | 24 (7.8%) | 29 (8.6%) |
| 70 to 74 Years | 36 (11.7%) | 51 (15.2%) |
| 75 to 79 Years | 36 (11.7%) | 44 (13.1%) |
| 80 to 84 Years | 0 (0.0%) | 0 (0.0%) |
| 85 Years and over | 0 (0.0%) | 0 (0.0%) |
| Total | 309 (100.0%) | 336 (100.0%) |
Families and Households in Midway
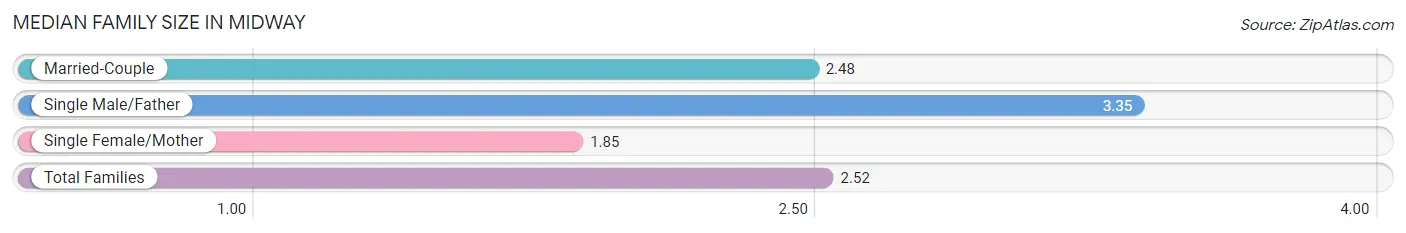
Median Family Size in Midway
The median family size in Midway is 2.52 persons per family, with single male/father families (17 | 9.1%) accounting for the largest median family size of 3.35 persons per family. On the other hand, single female/mother families (13 | 7.0%) represent the smallest median family size with 1.85 persons per family.
| Family Type | # Families | Family Size |
| Married-Couple | 156 (83.9%) | 2.48 |
| Single Male/Father | 17 (9.1%) | 3.35 |
| Single Female/Mother | 13 (7.0%) | 1.85 |
| Total Families | 186 (100.0%) | 2.52 |
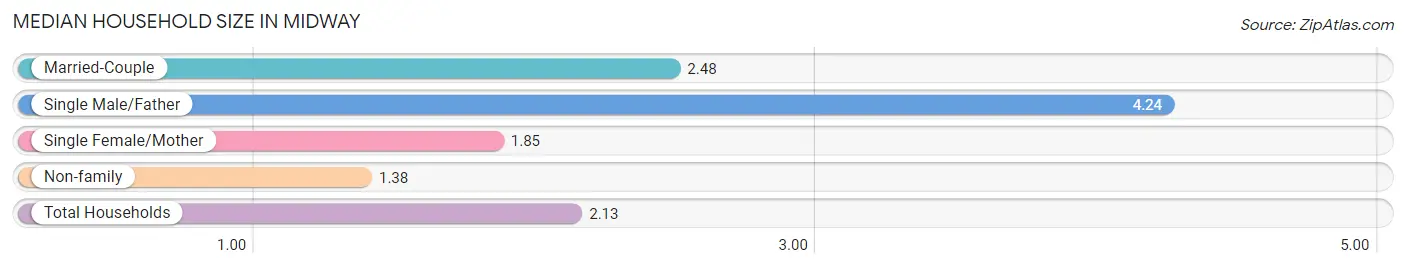
Median Household Size in Midway
The median household size in Midway is 2.13 persons per household, with single male/father households (17 | 5.6%) accounting for the largest median household size of 4.24 persons per household. non-family households (117 | 38.6%) represent the smallest median household size with 1.38 persons per household.
| Household Type | # Households | Household Size |
| Married-Couple | 156 (51.5%) | 2.48 |
| Single Male/Father | 17 (5.6%) | 4.24 |
| Single Female/Mother | 13 (4.3%) | 1.85 |
| Non-family | 117 (38.6%) | 1.38 |
| Total Households | 303 (100.0%) | 2.13 |
Household Size by Marriage Status in Midway
Out of a total of 303 households in Midway, 186 (61.4%) are family households, while 117 (38.6%) are nonfamily households. The most numerous type of family households are 2-person households, comprising 151, and the most common type of nonfamily households are 1-person households, comprising 78.
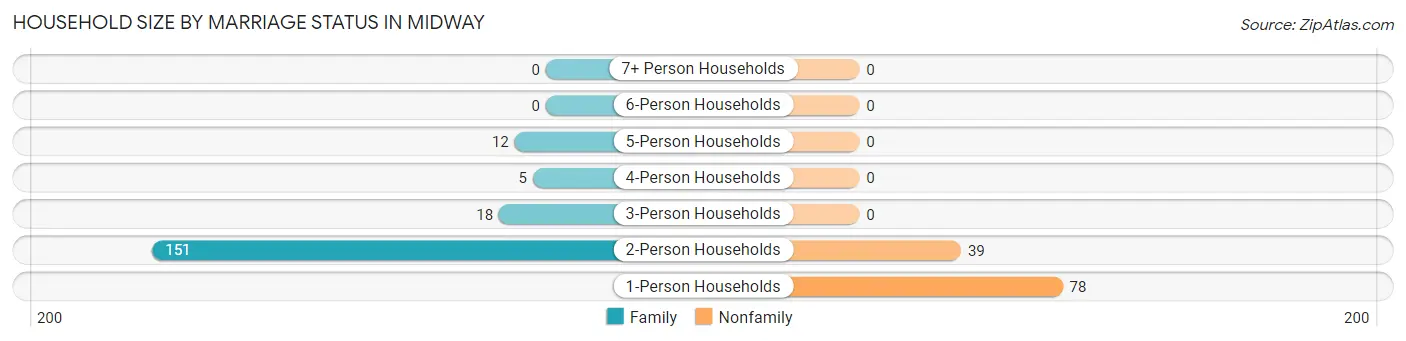
| Household Size | Family Households | Nonfamily Households |
| 1-Person Households | - | 78 (25.7%) |
| 2-Person Households | 151 (49.8%) | 39 (12.9%) |
| 3-Person Households | 18 (5.9%) | 0 (0.0%) |
| 4-Person Households | 5 (1.7%) | 0 (0.0%) |
| 5-Person Households | 12 (4.0%) | 0 (0.0%) |
| 6-Person Households | 0 (0.0%) | 0 (0.0%) |
| 7+ Person Households | 0 (0.0%) | 0 (0.0%) |
| Total | 186 (61.4%) | 117 (38.6%) |
Female Fertility in Midway
Fertility by Age in Midway
| Age Bracket | Women with Births | Births / 1,000 Women |
| 15 to 19 years | 0 (0.0%) | 0.0 |
| 20 to 34 years | 0 (0.0%) | 0.0 |
| 35 to 50 years | 0 (0.0%) | 0.0 |
| Total | 0 (0.0%) | 0.0 |
Fertility by Age by Marriage Status in Midway
| Age Bracket | Married | Unmarried |
| 15 to 19 years | 0 (0.0%) | 0 (0.0%) |
| 20 to 34 years | 0 (0.0%) | 0 (0.0%) |
| 35 to 50 years | 0 (0.0%) | 0 (0.0%) |
| Total | 0 (0.0%) | 0 (0.0%) |
Fertility by Education in Midway
| Educational Attainment | Women with Births | Births / 1,000 Women |
| Less than High School | 0 (0.0%) | 0.0 |
| High School Diploma | 0 (0.0%) | 0.0 |
| College or Associate's Degree | 0 (0.0%) | 0.0 |
| Bachelor's Degree | 0 (0.0%) | 0.0 |
| Graduate Degree | 0 (0.0%) | 0.0 |
| Total | 0 (0.0%) | 0.0 |
Fertility by Education by Marriage Status in Midway
| Educational Attainment | Married | Unmarried |
| Less than High School | 0 (0.0%) | 0 (0.0%) |
| High School Diploma | 0 (0.0%) | 0 (0.0%) |
| College or Associate's Degree | 0 (0.0%) | 0 (0.0%) |
| Bachelor's Degree | 0 (0.0%) | 0 (0.0%) |
| Graduate Degree | 0 (0.0%) | 0 (0.0%) |
| Total | 0 (0.0%) | 0 (0.0%) |
Employment Characteristics in Midway
Employment by Class of Employer in Midway
Among the 184 employed individuals in Midway, private company employees (134 | 72.8%), self-employed (not incorporated) (23 | 12.5%), and not-for-profit organizations (16 | 8.7%) make up the most common classes of employment.
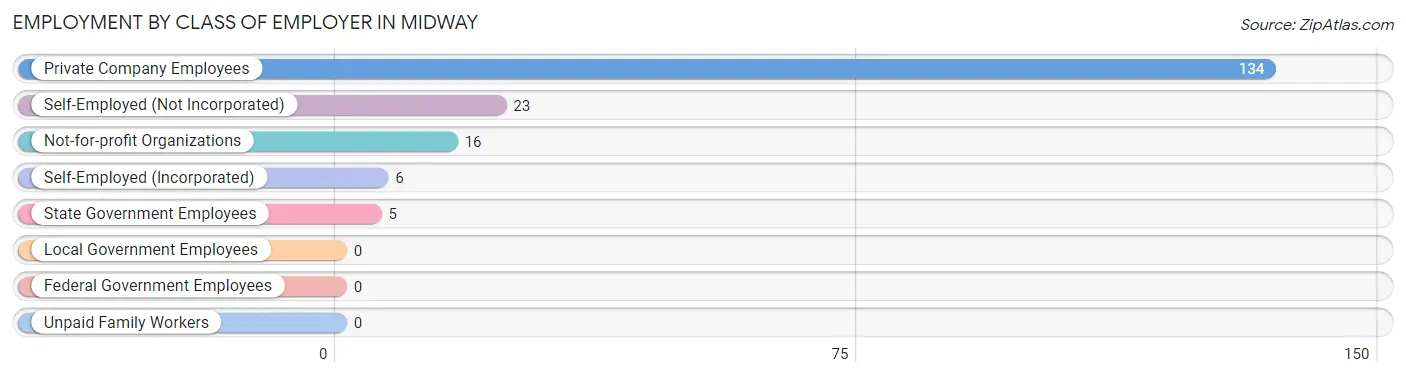
| Employer Class | # Employees | % Employees |
| Private Company Employees | 134 | 72.8% |
| Self-Employed (Incorporated) | 6 | 3.3% |
| Self-Employed (Not Incorporated) | 23 | 12.5% |
| Not-for-profit Organizations | 16 | 8.7% |
| Local Government Employees | 0 | 0.0% |
| State Government Employees | 5 | 2.7% |
| Federal Government Employees | 0 | 0.0% |
| Unpaid Family Workers | 0 | 0.0% |
| Total | 184 | 100.0% |
Employment Status by Age in Midway
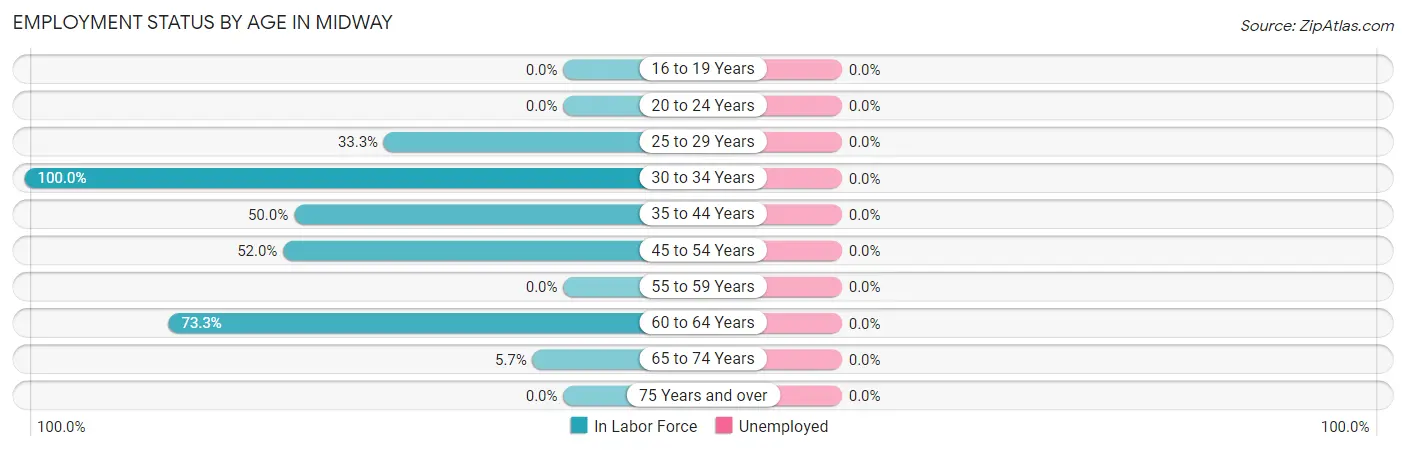
| Age Bracket | In Labor Force | Unemployed |
| 16 to 19 Years | 0 (0.0%) | 0 (0.0%) |
| 20 to 24 Years | 0 (0.0%) | 0 (0.0%) |
| 25 to 29 Years | 10 (33.3%) | 0 (0.0%) |
| 30 to 34 Years | 5 (100.0%) | 0 (0.0%) |
| 35 to 44 Years | 42 (50.0%) | 0 (0.0%) |
| 45 to 54 Years | 64 (52.0%) | 0 (0.0%) |
| 55 to 59 Years | 0 (0.0%) | 0 (0.0%) |
| 60 to 64 Years | 55 (73.3%) | 0 (0.0%) |
| 65 to 74 Years | 8 (5.7%) | 0 (0.0%) |
| 75 Years and over | 0 (0.0%) | 0 (0.0%) |
| Total | 184 (31.7%) | 0 (0.0%) |
Employment Status by Educational Attainment in Midway
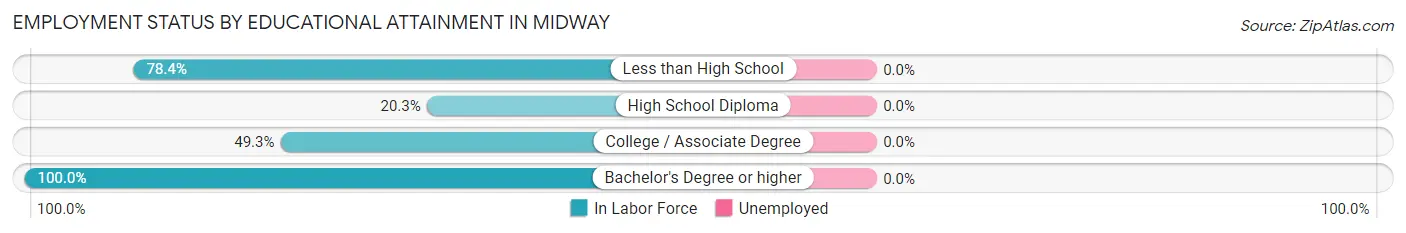
| Educational Attainment | In Labor Force | Unemployed |
| Less than High School | 29 (78.4%) | 0 (0.0%) |
| High School Diploma | 16 (20.3%) | 0 (0.0%) |
| College / Associate Degree | 103 (49.3%) | 0 (0.0%) |
| Bachelor's Degree or higher | 28 (100.0%) | 0 (0.0%) |
| Total | 176 (49.9%) | 0 (0.0%) |
Employment Occupations by Sex in Midway
Management, Business, Science and Arts Occupations
The most common Management, Business, Science and Arts occupations in Midway are Management (38 | 20.6%), Community & Social Service (13 | 7.1%), Education, Arts & Media (13 | 7.1%), and Business & Financial (3 | 1.6%).
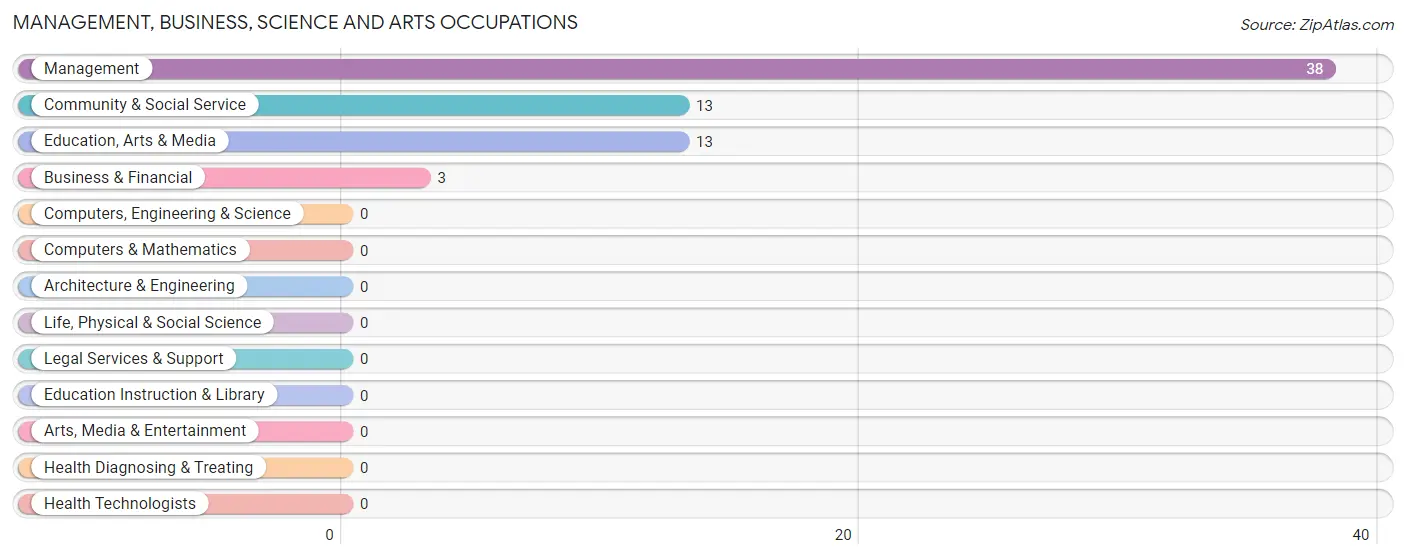
Management, Business, Science and Arts Occupations by Sex
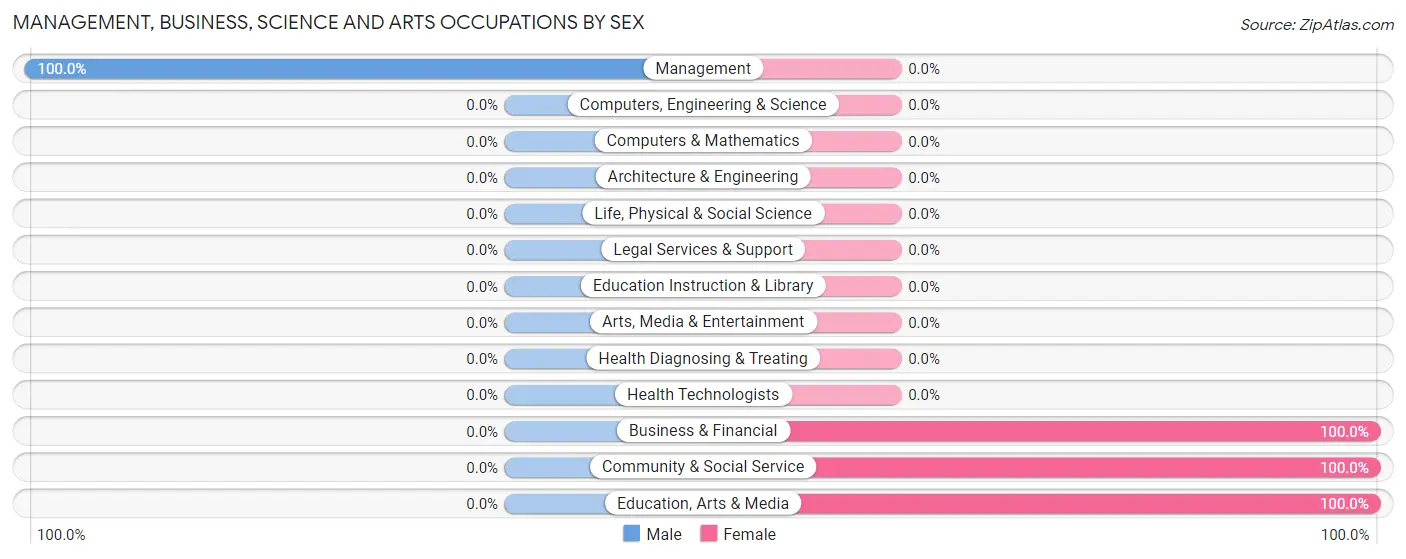
| Occupation | Male | Female |
| Management | 38 (100.0%) | 0 (0.0%) |
| Business & Financial | 0 (0.0%) | 3 (100.0%) |
| Computers, Engineering & Science | 0 (0.0%) | 0 (0.0%) |
| Computers & Mathematics | 0 (0.0%) | 0 (0.0%) |
| Architecture & Engineering | 0 (0.0%) | 0 (0.0%) |
| Life, Physical & Social Science | 0 (0.0%) | 0 (0.0%) |
| Community & Social Service | 0 (0.0%) | 13 (100.0%) |
| Education, Arts & Media | 0 (0.0%) | 13 (100.0%) |
| Legal Services & Support | 0 (0.0%) | 0 (0.0%) |
| Education Instruction & Library | 0 (0.0%) | 0 (0.0%) |
| Arts, Media & Entertainment | 0 (0.0%) | 0 (0.0%) |
| Health Diagnosing & Treating | 0 (0.0%) | 0 (0.0%) |
| Health Technologists | 0 (0.0%) | 0 (0.0%) |
| Total (Category) | 38 (70.4%) | 16 (29.6%) |
| Total (Overall) | 119 (64.7%) | 65 (35.3%) |
Services Occupations
The most common Services occupations in Midway are Security & Protection (5 | 2.7%), and Law Enforcement (5 | 2.7%).
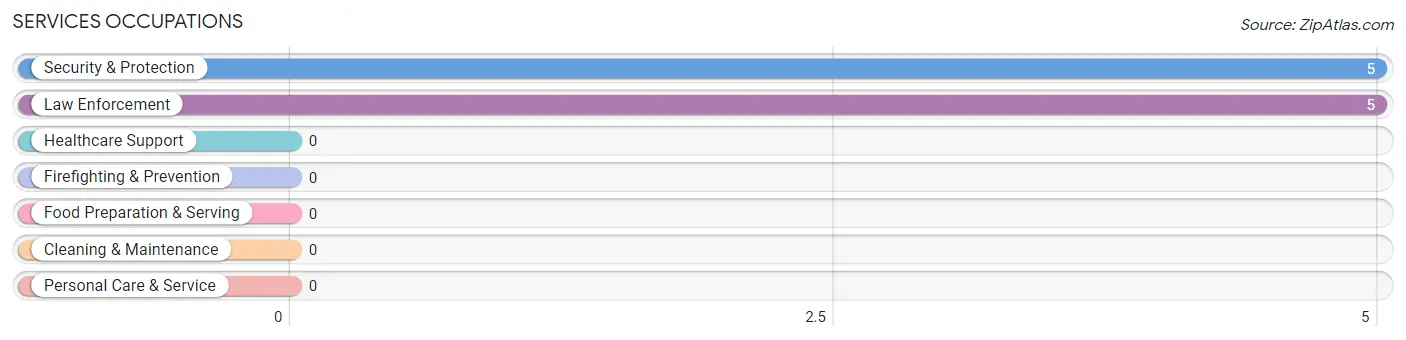
Services Occupations by Sex
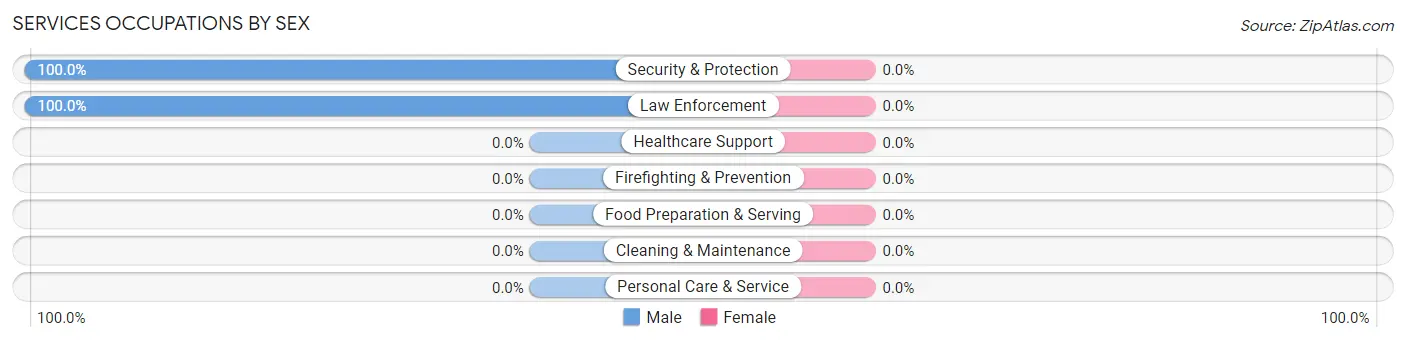
| Occupation | Male | Female |
| Healthcare Support | 0 (0.0%) | 0 (0.0%) |
| Security & Protection | 5 (100.0%) | 0 (0.0%) |
| Firefighting & Prevention | 0 (0.0%) | 0 (0.0%) |
| Law Enforcement | 5 (100.0%) | 0 (0.0%) |
| Food Preparation & Serving | 0 (0.0%) | 0 (0.0%) |
| Cleaning & Maintenance | 0 (0.0%) | 0 (0.0%) |
| Personal Care & Service | 0 (0.0%) | 0 (0.0%) |
| Total (Category) | 5 (100.0%) | 0 (0.0%) |
| Total (Overall) | 119 (64.7%) | 65 (35.3%) |
Sales and Office Occupations
The most common Sales and Office occupations in Midway are , and Office & Administration (60 | 32.6%).

Sales and Office Occupations by Sex

| Occupation | Male | Female |
| Sales & Related | 0 (0.0%) | 0 (0.0%) |
| Office & Administration | 11 (18.3%) | 49 (81.7%) |
| Total (Category) | 11 (18.3%) | 49 (81.7%) |
| Total (Overall) | 119 (64.7%) | 65 (35.3%) |
Natural Resources, Construction and Maintenance Occupations
The most common Natural Resources, Construction and Maintenance occupations in Midway are Farming, Fishing & Forestry (13 | 7.1%), Construction & Extraction (13 | 7.1%), and Installation, Maintenance & Repair (12 | 6.5%).

Natural Resources, Construction and Maintenance Occupations by Sex

| Occupation | Male | Female |
| Farming, Fishing & Forestry | 13 (100.0%) | 0 (0.0%) |
| Construction & Extraction | 13 (100.0%) | 0 (0.0%) |
| Installation, Maintenance & Repair | 12 (100.0%) | 0 (0.0%) |
| Total (Category) | 38 (100.0%) | 0 (0.0%) |
| Total (Overall) | 119 (64.7%) | 65 (35.3%) |
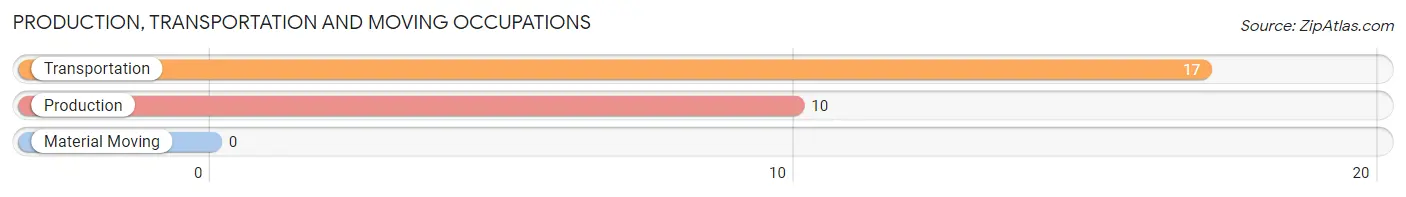
Production, Transportation and Moving Occupations
The most common Production, Transportation and Moving occupations in Midway are Transportation (17 | 9.2%), and Production (10 | 5.4%).
Production, Transportation and Moving Occupations by Sex
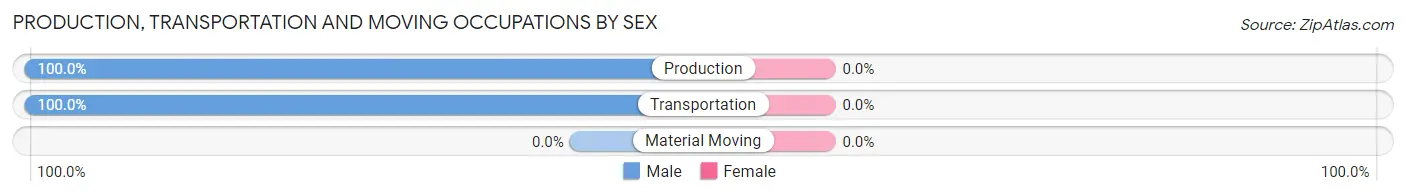
| Occupation | Male | Female |
| Production | 10 (100.0%) | 0 (0.0%) |
| Transportation | 17 (100.0%) | 0 (0.0%) |
| Material Moving | 0 (0.0%) | 0 (0.0%) |
| Total (Category) | 27 (100.0%) | 0 (0.0%) |
| Total (Overall) | 119 (64.7%) | 65 (35.3%) |
Employment Industries by Sex in Midway
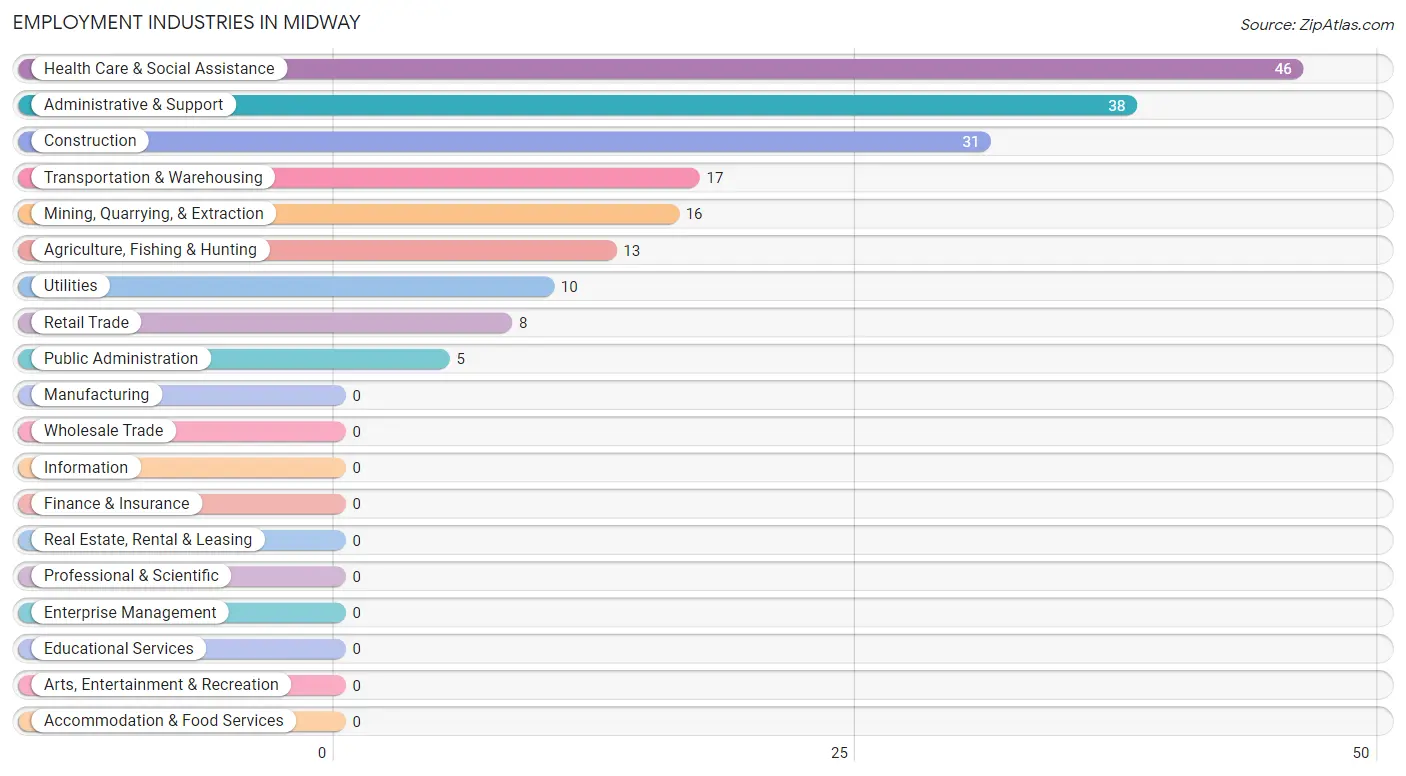
Employment Industries in Midway
The major employment industries in Midway include Health Care & Social Assistance (46 | 25.0%), Administrative & Support (38 | 20.6%), Construction (31 | 16.9%), Transportation & Warehousing (17 | 9.2%), and Mining, Quarrying, & Extraction (16 | 8.7%).
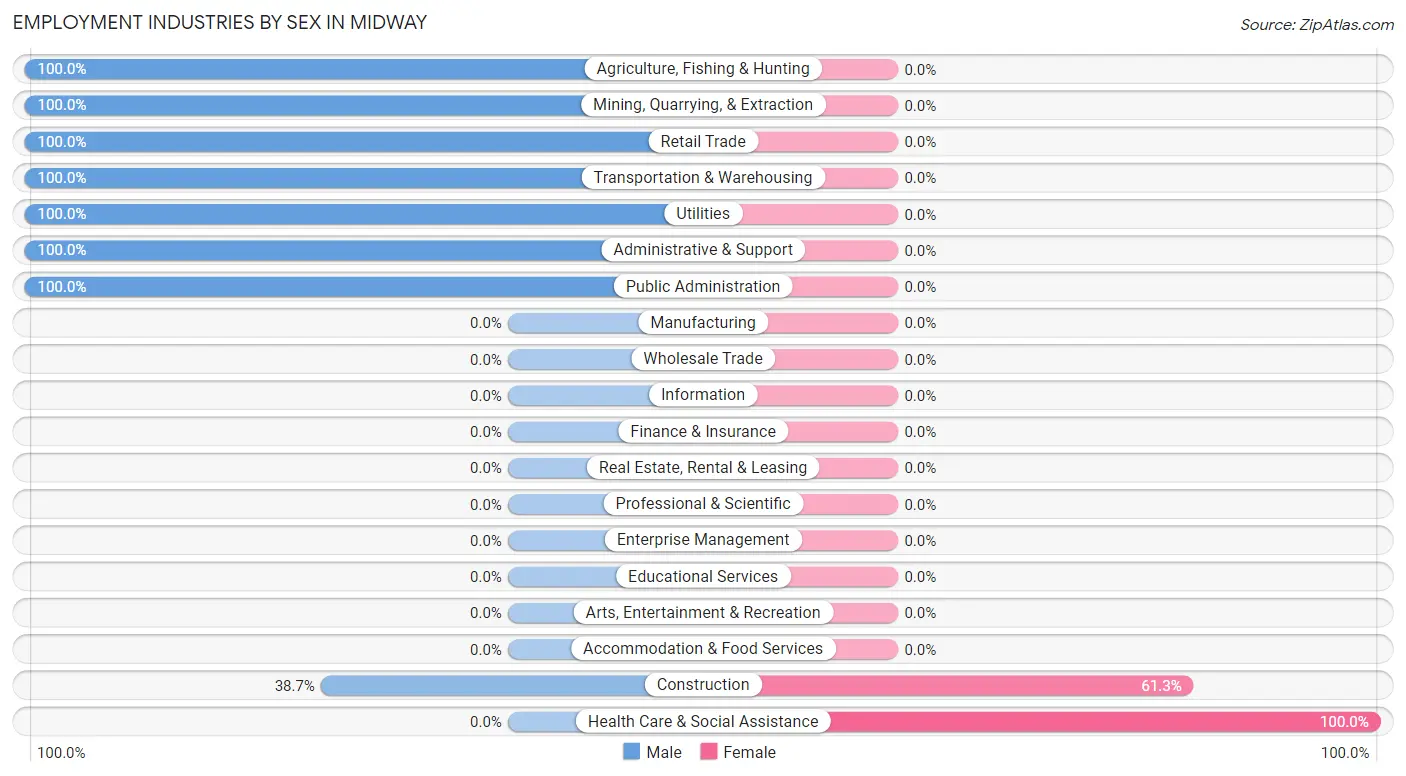
Employment Industries by Sex in Midway
The Midway industries that see more men than women are Agriculture, Fishing & Hunting (100.0%), Mining, Quarrying, & Extraction (100.0%), and Retail Trade (100.0%), whereas the industries that tend to have a higher number of women are Health Care & Social Assistance (100.0%), and Construction (61.3%).
| Industry | Male | Female |
| Agriculture, Fishing & Hunting | 13 (100.0%) | 0 (0.0%) |
| Mining, Quarrying, & Extraction | 16 (100.0%) | 0 (0.0%) |
| Construction | 12 (38.7%) | 19 (61.3%) |
| Manufacturing | 0 (0.0%) | 0 (0.0%) |
| Wholesale Trade | 0 (0.0%) | 0 (0.0%) |
| Retail Trade | 8 (100.0%) | 0 (0.0%) |
| Transportation & Warehousing | 17 (100.0%) | 0 (0.0%) |
| Utilities | 10 (100.0%) | 0 (0.0%) |
| Information | 0 (0.0%) | 0 (0.0%) |
| Finance & Insurance | 0 (0.0%) | 0 (0.0%) |
| Real Estate, Rental & Leasing | 0 (0.0%) | 0 (0.0%) |
| Professional & Scientific | 0 (0.0%) | 0 (0.0%) |
| Enterprise Management | 0 (0.0%) | 0 (0.0%) |
| Administrative & Support | 38 (100.0%) | 0 (0.0%) |
| Educational Services | 0 (0.0%) | 0 (0.0%) |
| Health Care & Social Assistance | 0 (0.0%) | 46 (100.0%) |
| Arts, Entertainment & Recreation | 0 (0.0%) | 0 (0.0%) |
| Accommodation & Food Services | 0 (0.0%) | 0 (0.0%) |
| Public Administration | 5 (100.0%) | 0 (0.0%) |
| Total | 119 (64.7%) | 65 (35.3%) |
Education in Midway
School Enrollment in Midway
The most common levels of schooling among the 59 students in Midway are elementary school (15 | 25.4%), middle school (13 | 22.0%), and college / undergraduate (13 | 22.0%).
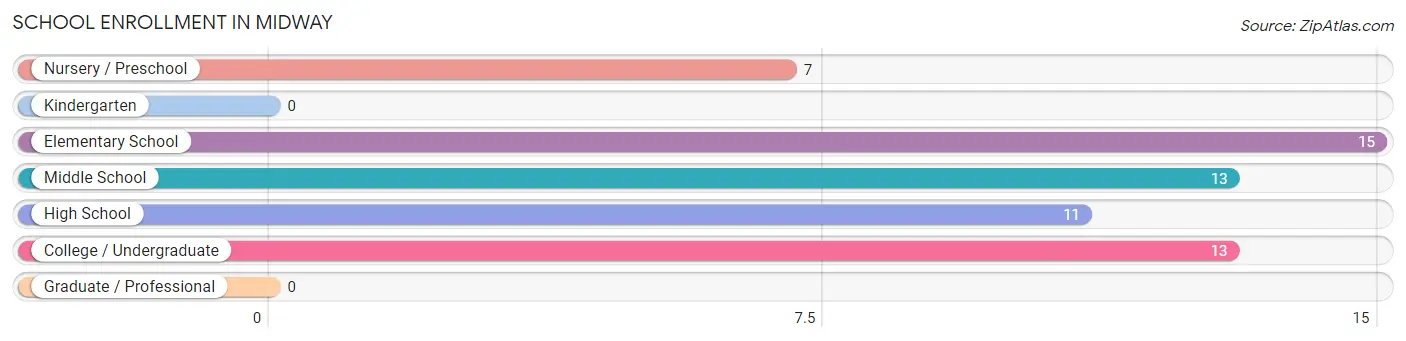
| School Level | # Students | % Students |
| Nursery / Preschool | 7 | 11.9% |
| Kindergarten | 0 | 0.0% |
| Elementary School | 15 | 25.4% |
| Middle School | 13 | 22.0% |
| High School | 11 | 18.6% |
| College / Undergraduate | 13 | 22.0% |
| Graduate / Professional | 0 | 0.0% |
| Total | 59 | 100.0% |
School Enrollment by Age by Funding Source in Midway
Out of a total of 59 students who are enrolled in schools in Midway, 13 (22.0%) attend a private institution, while the remaining 46 (78.0%) are enrolled in public schools. The age group of 35 years and over has the highest likelihood of being enrolled in private schools, with 13 (100.0% in the age bracket) enrolled. Conversely, the age group of 3 to 4 year olds has the lowest likelihood of being enrolled in a private school, with 7 (100.0% in the age bracket) attending a public institution.
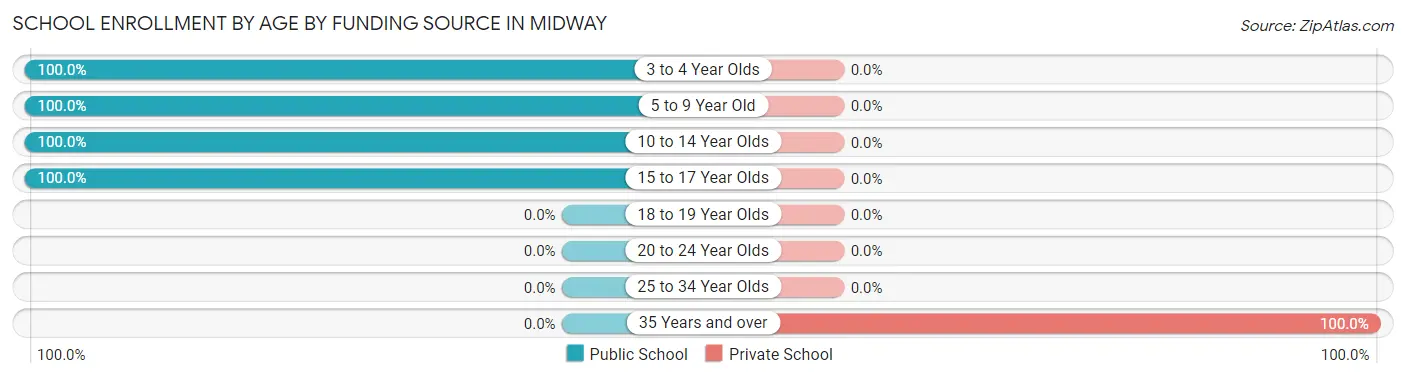
| Age Bracket | Public School | Private School |
| 3 to 4 Year Olds | 7 (100.0%) | 0 (0.0%) |
| 5 to 9 Year Old | 15 (100.0%) | 0 (0.0%) |
| 10 to 14 Year Olds | 11 (100.0%) | 0 (0.0%) |
| 15 to 17 Year Olds | 13 (100.0%) | 0 (0.0%) |
| 18 to 19 Year Olds | 0 (0.0%) | 0 (0.0%) |
| 20 to 24 Year Olds | 0 (0.0%) | 0 (0.0%) |
| 25 to 34 Year Olds | 0 (0.0%) | 0 (0.0%) |
| 35 Years and over | 0 (0.0%) | 13 (100.0%) |
| Total | 46 (78.0%) | 13 (22.0%) |
Educational Attainment by Field of Study in Midway
Visual & performing arts (18 | 31.6%), social sciences (16 | 28.1%), psychology (12 | 21.0%), and liberal arts & history (11 | 19.3%) are the most common fields of study among 57 individuals in Midway who have obtained a bachelor's degree or higher.
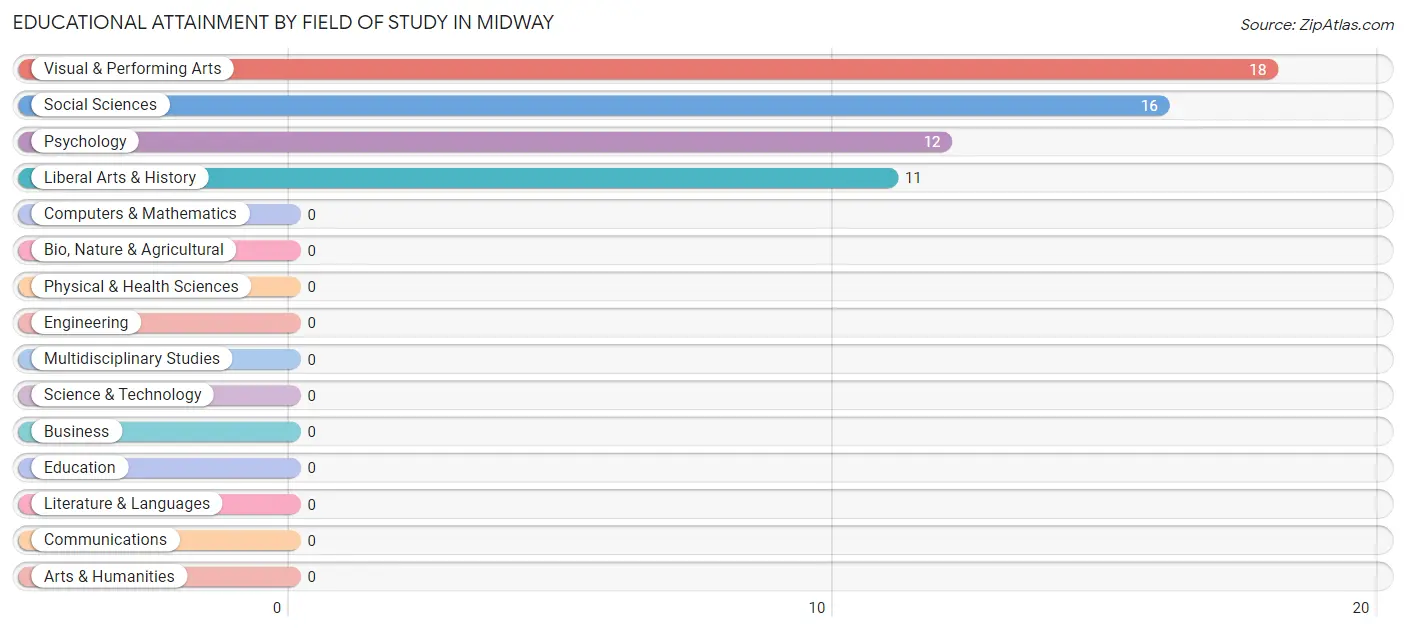
| Field of Study | # Graduates | % Graduates |
| Computers & Mathematics | 0 | 0.0% |
| Bio, Nature & Agricultural | 0 | 0.0% |
| Physical & Health Sciences | 0 | 0.0% |
| Psychology | 12 | 21.0% |
| Social Sciences | 16 | 28.1% |
| Engineering | 0 | 0.0% |
| Multidisciplinary Studies | 0 | 0.0% |
| Science & Technology | 0 | 0.0% |
| Business | 0 | 0.0% |
| Education | 0 | 0.0% |
| Literature & Languages | 0 | 0.0% |
| Liberal Arts & History | 11 | 19.3% |
| Visual & Performing Arts | 18 | 31.6% |
| Communications | 0 | 0.0% |
| Arts & Humanities | 0 | 0.0% |
| Total | 57 | 100.0% |
Transportation & Commute in Midway
Vehicle Availability by Sex in Midway
The most prevalent vehicle ownership categories in Midway are males with 4 vehicles (50, accounting for 42.0%) and females with 4 vehicles (0, making up 76.9%).
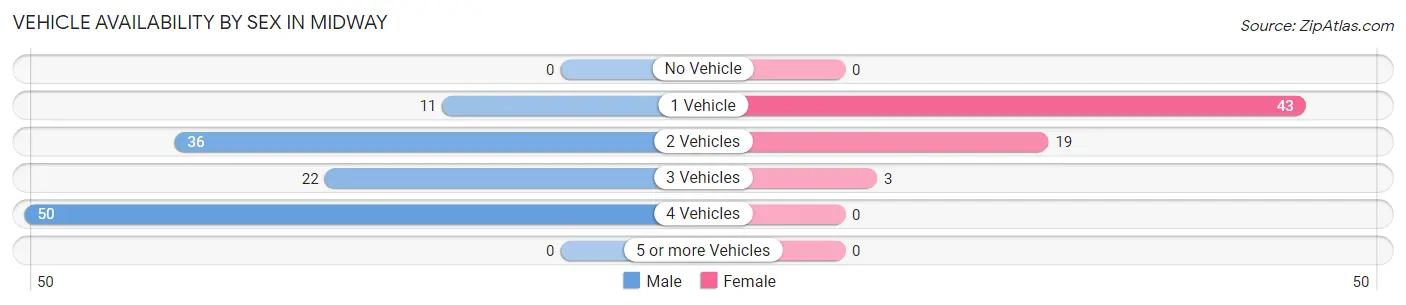
| Vehicles Available | Male | Female |
| No Vehicle | 0 (0.0%) | 0 (0.0%) |
| 1 Vehicle | 11 (9.2%) | 43 (66.1%) |
| 2 Vehicles | 36 (30.2%) | 19 (29.2%) |
| 3 Vehicles | 22 (18.5%) | 3 (4.6%) |
| 4 Vehicles | 50 (42.0%) | 0 (0.0%) |
| 5 or more Vehicles | 0 (0.0%) | 0 (0.0%) |
| Total | 119 (100.0%) | 65 (100.0%) |
Commute Time in Midway
The most frequently occuring commute durations in Midway are 10 to 14 minutes (67 commuters, 36.4%), 20 to 24 minutes (49 commuters, 26.6%), and 15 to 19 minutes (30 commuters, 16.3%).
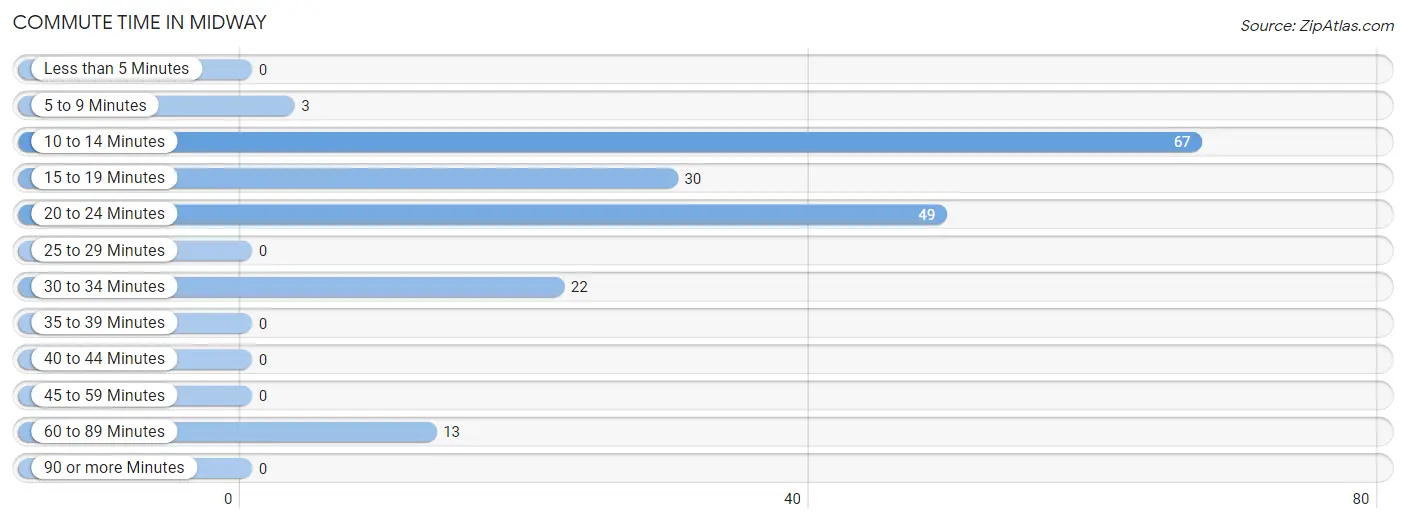
| Commute Time | # Commuters | % Commuters |
| Less than 5 Minutes | 0 | 0.0% |
| 5 to 9 Minutes | 3 | 1.6% |
| 10 to 14 Minutes | 67 | 36.4% |
| 15 to 19 Minutes | 30 | 16.3% |
| 20 to 24 Minutes | 49 | 26.6% |
| 25 to 29 Minutes | 0 | 0.0% |
| 30 to 34 Minutes | 22 | 12.0% |
| 35 to 39 Minutes | 0 | 0.0% |
| 40 to 44 Minutes | 0 | 0.0% |
| 45 to 59 Minutes | 0 | 0.0% |
| 60 to 89 Minutes | 13 | 7.1% |
| 90 or more Minutes | 0 | 0.0% |
Commute Time by Sex in Midway
The most common commute times in Midway are 20 to 24 minutes (46 commuters, 38.7%) for males and 10 to 14 minutes (43 commuters, 66.1%) for females.
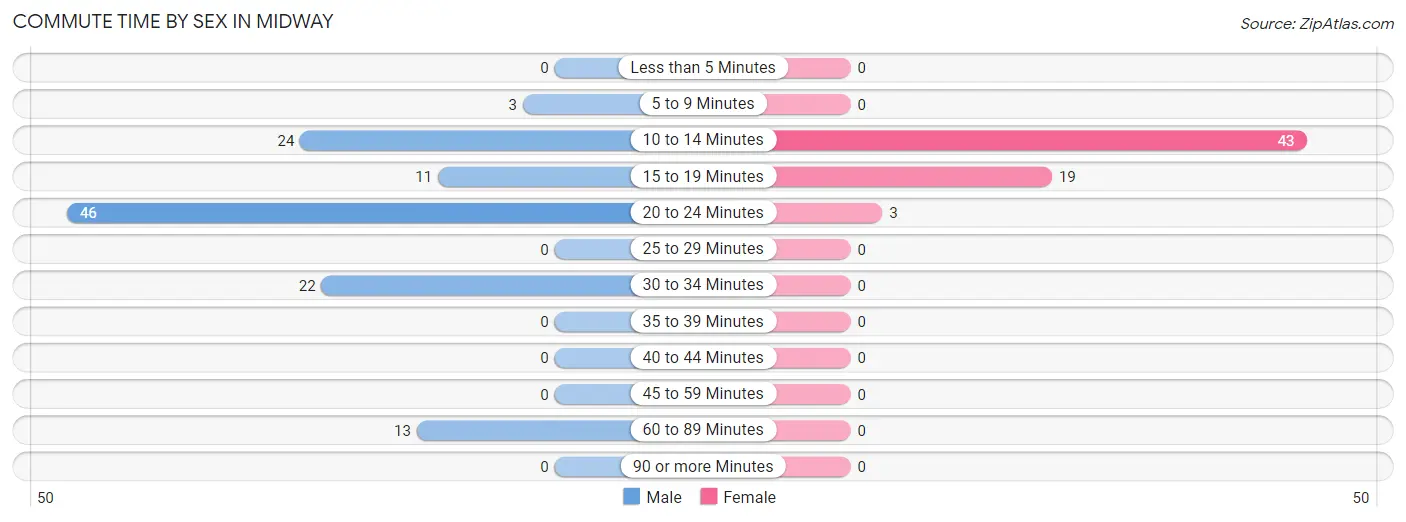
| Commute Time | Male | Female |
| Less than 5 Minutes | 0 (0.0%) | 0 (0.0%) |
| 5 to 9 Minutes | 3 (2.5%) | 0 (0.0%) |
| 10 to 14 Minutes | 24 (20.2%) | 43 (66.1%) |
| 15 to 19 Minutes | 11 (9.2%) | 19 (29.2%) |
| 20 to 24 Minutes | 46 (38.7%) | 3 (4.6%) |
| 25 to 29 Minutes | 0 (0.0%) | 0 (0.0%) |
| 30 to 34 Minutes | 22 (18.5%) | 0 (0.0%) |
| 35 to 39 Minutes | 0 (0.0%) | 0 (0.0%) |
| 40 to 44 Minutes | 0 (0.0%) | 0 (0.0%) |
| 45 to 59 Minutes | 0 (0.0%) | 0 (0.0%) |
| 60 to 89 Minutes | 13 (10.9%) | 0 (0.0%) |
| 90 or more Minutes | 0 (0.0%) | 0 (0.0%) |
Time of Departure to Work by Sex in Midway
The most frequent times of departure to work in Midway are 6:00 AM to 6:29 AM (55, 46.2%) for males and 7:00 AM to 7:29 AM (30, 46.2%) for females.
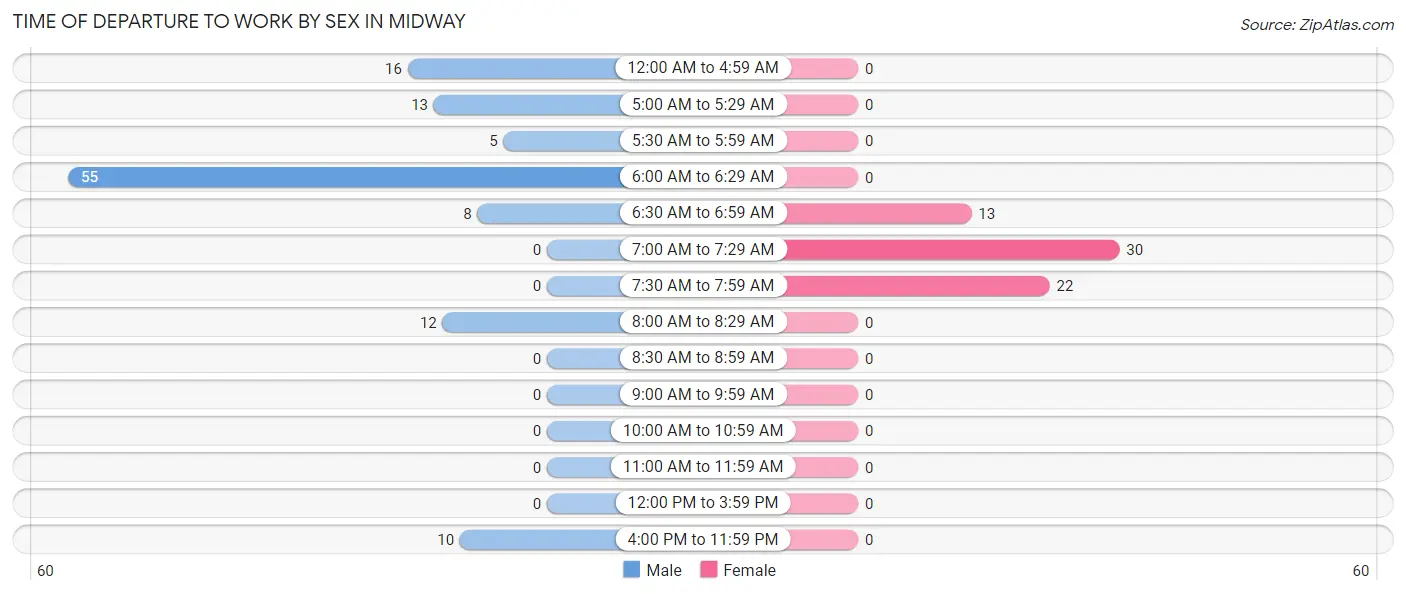
| Time of Departure | Male | Female |
| 12:00 AM to 4:59 AM | 16 (13.5%) | 0 (0.0%) |
| 5:00 AM to 5:29 AM | 13 (10.9%) | 0 (0.0%) |
| 5:30 AM to 5:59 AM | 5 (4.2%) | 0 (0.0%) |
| 6:00 AM to 6:29 AM | 55 (46.2%) | 0 (0.0%) |
| 6:30 AM to 6:59 AM | 8 (6.7%) | 13 (20.0%) |
| 7:00 AM to 7:29 AM | 0 (0.0%) | 30 (46.2%) |
| 7:30 AM to 7:59 AM | 0 (0.0%) | 22 (33.9%) |
| 8:00 AM to 8:29 AM | 12 (10.1%) | 0 (0.0%) |
| 8:30 AM to 8:59 AM | 0 (0.0%) | 0 (0.0%) |
| 9:00 AM to 9:59 AM | 0 (0.0%) | 0 (0.0%) |
| 10:00 AM to 10:59 AM | 0 (0.0%) | 0 (0.0%) |
| 11:00 AM to 11:59 AM | 0 (0.0%) | 0 (0.0%) |
| 12:00 PM to 3:59 PM | 0 (0.0%) | 0 (0.0%) |
| 4:00 PM to 11:59 PM | 10 (8.4%) | 0 (0.0%) |
| Total | 119 (100.0%) | 65 (100.0%) |
Housing Occupancy in Midway
Occupancy by Ownership in Midway
Of the total 303 dwellings in Midway, owner-occupied units account for 218 (72.0%), while renter-occupied units make up 85 (28.1%).
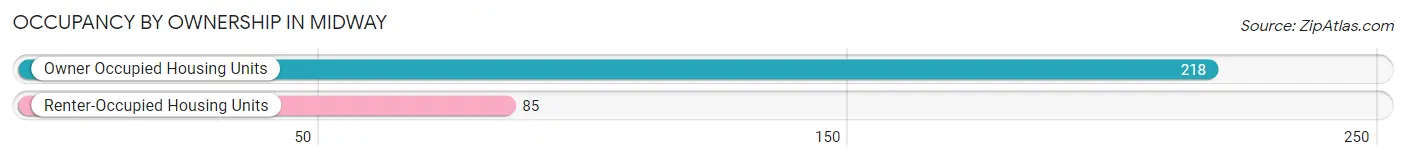
| Occupancy | # Housing Units | % Housing Units |
| Owner Occupied Housing Units | 218 | 72.0% |
| Renter-Occupied Housing Units | 85 | 28.1% |
| Total Occupied Housing Units | 303 | 100.0% |
Occupancy by Household Size in Midway
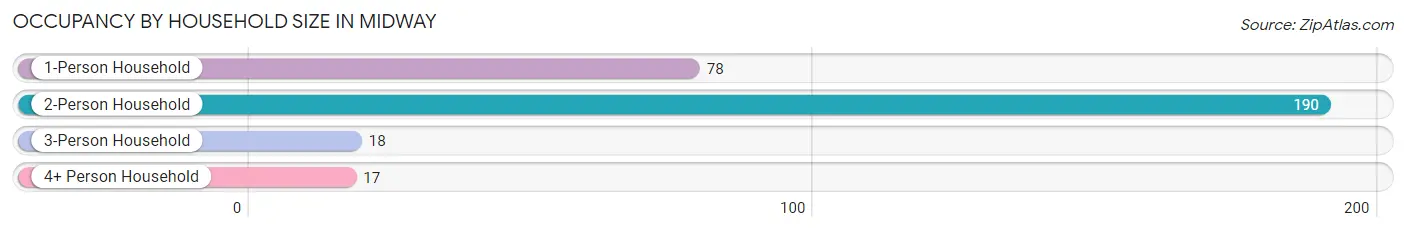
| Household Size | # Housing Units | % Housing Units |
| 1-Person Household | 78 | 25.7% |
| 2-Person Household | 190 | 62.7% |
| 3-Person Household | 18 | 5.9% |
| 4+ Person Household | 17 | 5.6% |
| Total Housing Units | 303 | 100.0% |
Occupancy by Ownership by Household Size in Midway
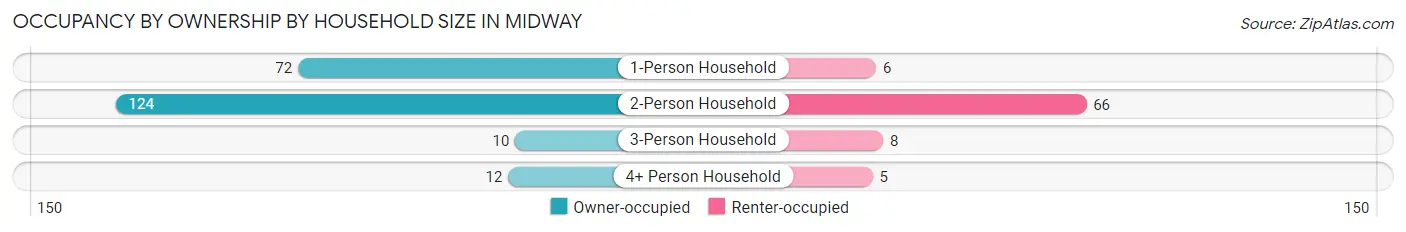
| Household Size | Owner-occupied | Renter-occupied |
| 1-Person Household | 72 (92.3%) | 6 (7.7%) |
| 2-Person Household | 124 (65.3%) | 66 (34.7%) |
| 3-Person Household | 10 (55.6%) | 8 (44.4%) |
| 4+ Person Household | 12 (70.6%) | 5 (29.4%) |
| Total Housing Units | 218 (72.0%) | 85 (28.1%) |
Occupancy by Educational Attainment in Midway
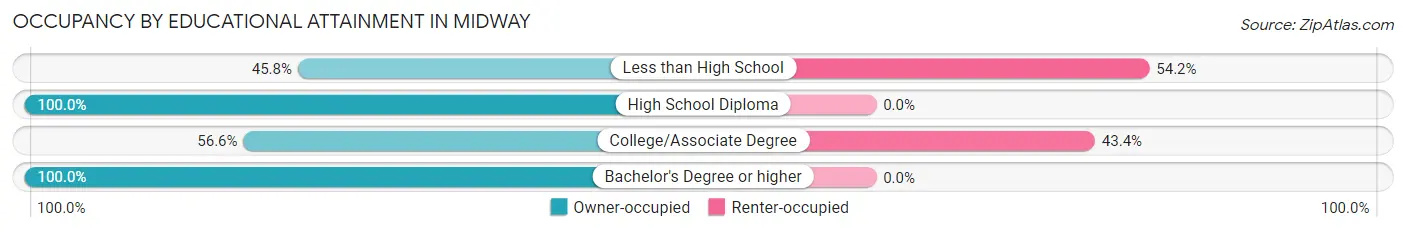
| Household Size | Owner-occupied | Renter-occupied |
| Less than High School | 11 (45.8%) | 13 (54.2%) |
| High School Diploma | 56 (100.0%) | 0 (0.0%) |
| College/Associate Degree | 94 (56.6%) | 72 (43.4%) |
| Bachelor's Degree or higher | 57 (100.0%) | 0 (0.0%) |
Occupancy by Age of Householder in Midway
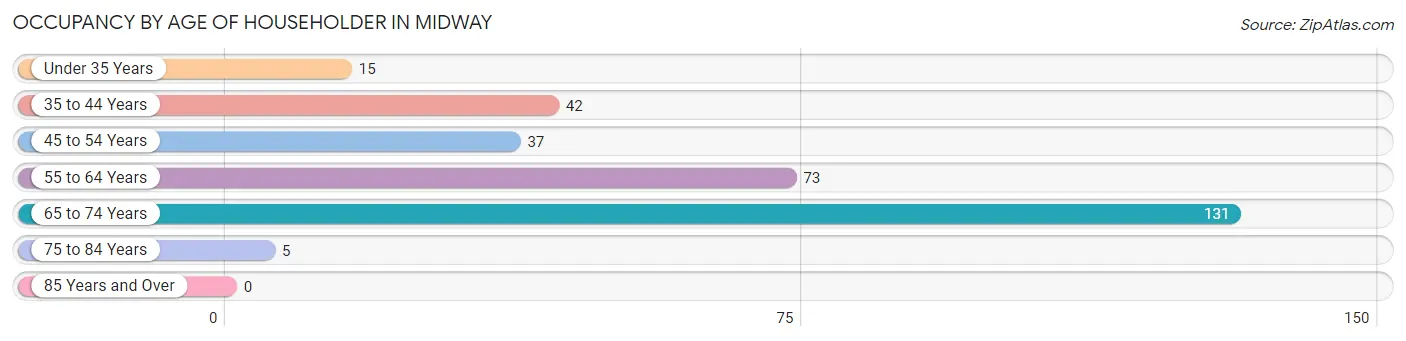
| Age Bracket | # Households | % Households |
| Under 35 Years | 15 | 5.0% |
| 35 to 44 Years | 42 | 13.9% |
| 45 to 54 Years | 37 | 12.2% |
| 55 to 64 Years | 73 | 24.1% |
| 65 to 74 Years | 131 | 43.2% |
| 75 to 84 Years | 5 | 1.7% |
| 85 Years and Over | 0 | 0.0% |
| Total | 303 | 100.0% |
Housing Finances in Midway
Median Income by Occupancy in Midway
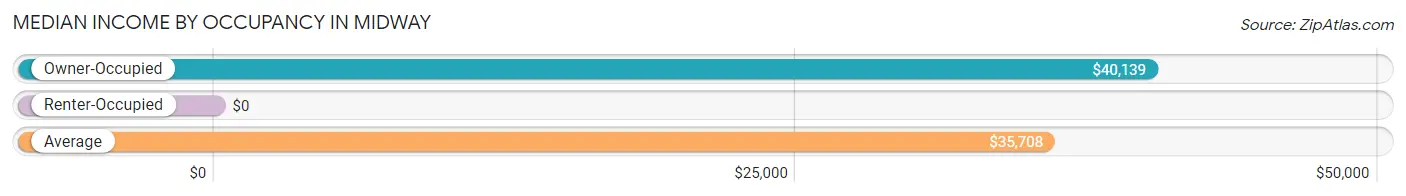
| Occupancy Type | # Households | Median Income |
| Owner-Occupied | 218 (72.0%) | $40,139 |
| Renter-Occupied | 85 (28.1%) | $0 |
| Average | 303 (100.0%) | $35,708 |
Occupancy by Householder Income Bracket in Midway
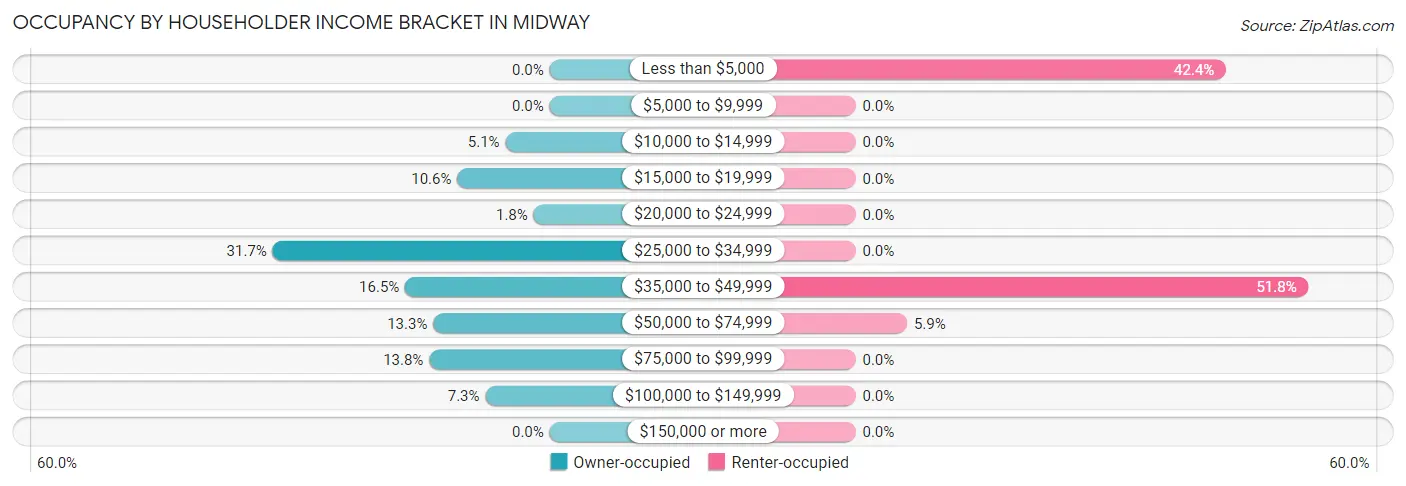
| Income Bracket | Owner-occupied | Renter-occupied |
| Less than $5,000 | 0 (0.0%) | 36 (42.3%) |
| $5,000 to $9,999 | 0 (0.0%) | 0 (0.0%) |
| $10,000 to $14,999 | 11 (5.1%) | 0 (0.0%) |
| $15,000 to $19,999 | 23 (10.5%) | 0 (0.0%) |
| $20,000 to $24,999 | 4 (1.8%) | 0 (0.0%) |
| $25,000 to $34,999 | 69 (31.7%) | 0 (0.0%) |
| $35,000 to $49,999 | 36 (16.5%) | 44 (51.8%) |
| $50,000 to $74,999 | 29 (13.3%) | 5 (5.9%) |
| $75,000 to $99,999 | 30 (13.8%) | 0 (0.0%) |
| $100,000 to $149,999 | 16 (7.3%) | 0 (0.0%) |
| $150,000 or more | 0 (0.0%) | 0 (0.0%) |
| Total | 218 (100.0%) | 85 (100.0%) |
Monthly Housing Cost Tiers in Midway
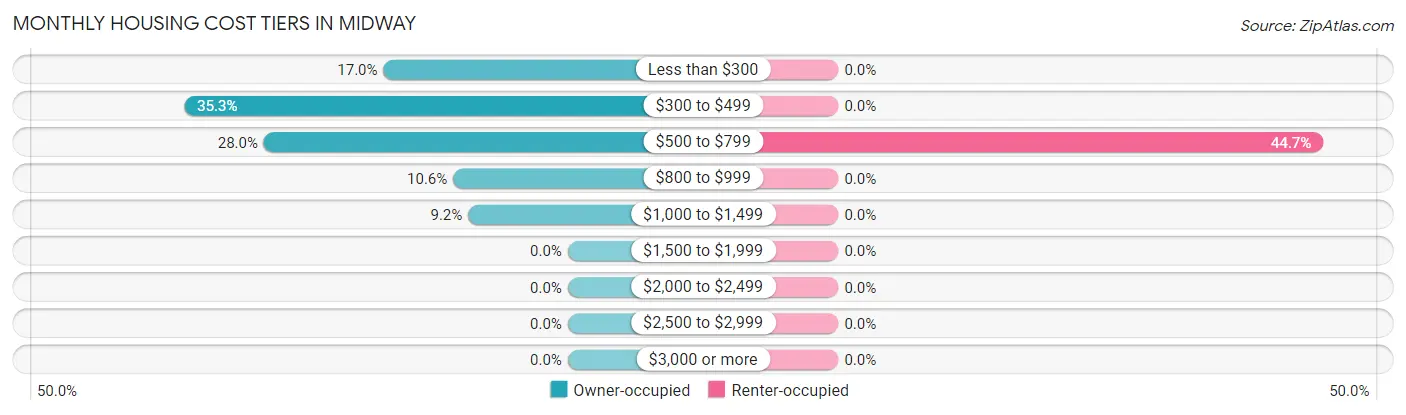
| Monthly Cost | Owner-occupied | Renter-occupied |
| Less than $300 | 37 (17.0%) | 0 (0.0%) |
| $300 to $499 | 77 (35.3%) | 0 (0.0%) |
| $500 to $799 | 61 (28.0%) | 38 (44.7%) |
| $800 to $999 | 23 (10.5%) | 0 (0.0%) |
| $1,000 to $1,499 | 20 (9.2%) | 0 (0.0%) |
| $1,500 to $1,999 | 0 (0.0%) | 0 (0.0%) |
| $2,000 to $2,499 | 0 (0.0%) | 0 (0.0%) |
| $2,500 to $2,999 | 0 (0.0%) | 0 (0.0%) |
| $3,000 or more | 0 (0.0%) | 0 (0.0%) |
| Total | 218 (100.0%) | 85 (100.0%) |
Physical Housing Characteristics in Midway
Housing Structures in Midway
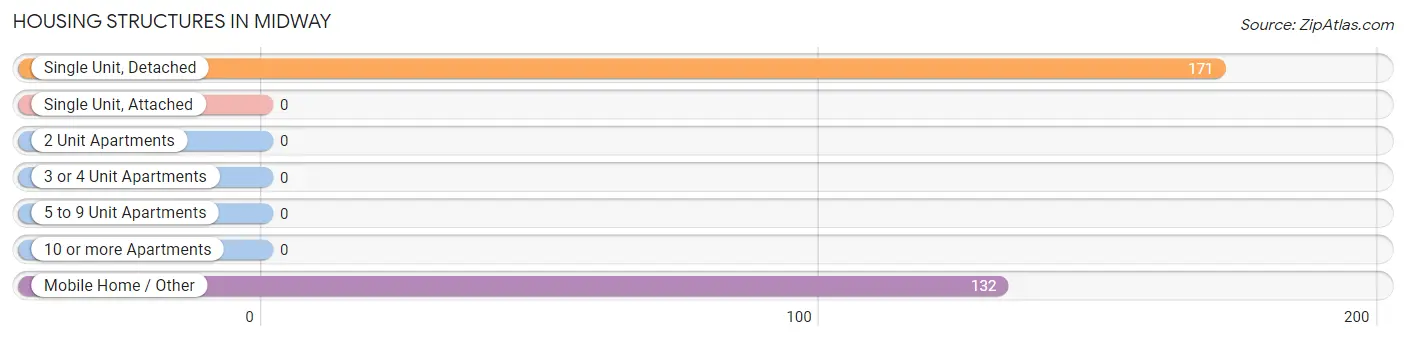
| Structure Type | # Housing Units | % Housing Units |
| Single Unit, Detached | 171 | 56.4% |
| Single Unit, Attached | 0 | 0.0% |
| 2 Unit Apartments | 0 | 0.0% |
| 3 or 4 Unit Apartments | 0 | 0.0% |
| 5 to 9 Unit Apartments | 0 | 0.0% |
| 10 or more Apartments | 0 | 0.0% |
| Mobile Home / Other | 132 | 43.6% |
| Total | 303 | 100.0% |
Housing Structures by Occupancy in Midway
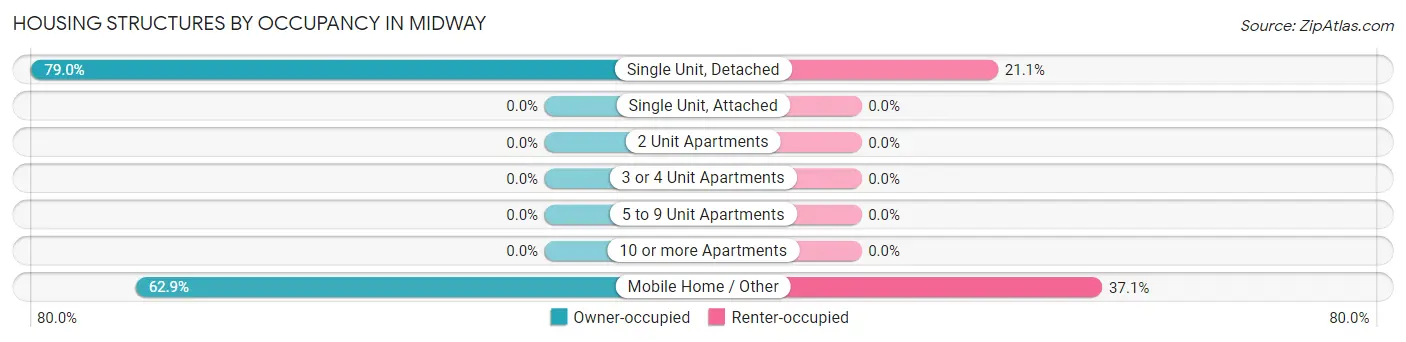
| Structure Type | Owner-occupied | Renter-occupied |
| Single Unit, Detached | 135 (78.9%) | 36 (21.0%) |
| Single Unit, Attached | 0 (0.0%) | 0 (0.0%) |
| 2 Unit Apartments | 0 (0.0%) | 0 (0.0%) |
| 3 or 4 Unit Apartments | 0 (0.0%) | 0 (0.0%) |
| 5 to 9 Unit Apartments | 0 (0.0%) | 0 (0.0%) |
| 10 or more Apartments | 0 (0.0%) | 0 (0.0%) |
| Mobile Home / Other | 83 (62.9%) | 49 (37.1%) |
| Total | 218 (72.0%) | 85 (28.1%) |
Housing Structures by Number of Rooms in Midway
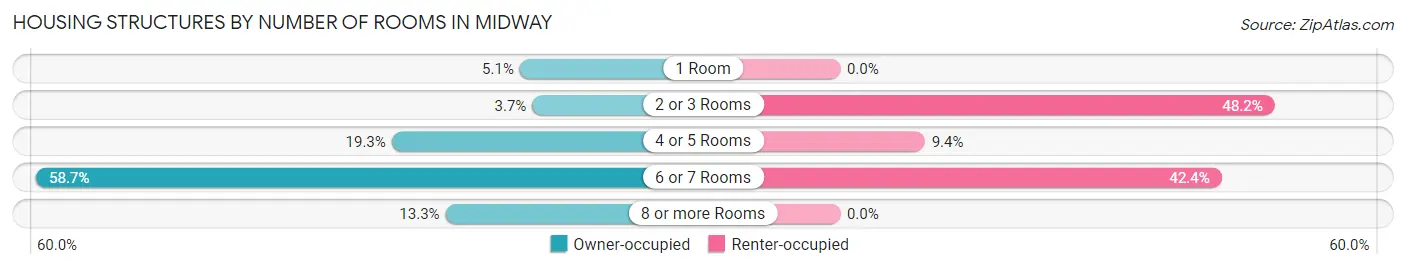
| Number of Rooms | Owner-occupied | Renter-occupied |
| 1 Room | 11 (5.1%) | 0 (0.0%) |
| 2 or 3 Rooms | 8 (3.7%) | 41 (48.2%) |
| 4 or 5 Rooms | 42 (19.3%) | 8 (9.4%) |
| 6 or 7 Rooms | 128 (58.7%) | 36 (42.3%) |
| 8 or more Rooms | 29 (13.3%) | 0 (0.0%) |
| Total | 218 (100.0%) | 85 (100.0%) |
Housing Structure by Heating Type in Midway
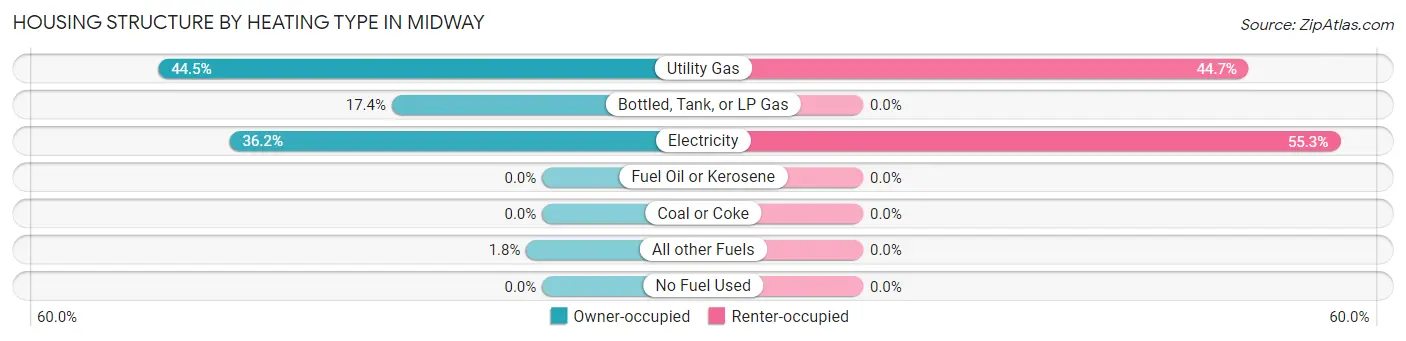
| Heating Type | Owner-occupied | Renter-occupied |
| Utility Gas | 97 (44.5%) | 38 (44.7%) |
| Bottled, Tank, or LP Gas | 38 (17.4%) | 0 (0.0%) |
| Electricity | 79 (36.2%) | 47 (55.3%) |
| Fuel Oil or Kerosene | 0 (0.0%) | 0 (0.0%) |
| Coal or Coke | 0 (0.0%) | 0 (0.0%) |
| All other Fuels | 4 (1.8%) | 0 (0.0%) |
| No Fuel Used | 0 (0.0%) | 0 (0.0%) |
| Total | 218 (100.0%) | 85 (100.0%) |
Household Vehicle Usage in Midway
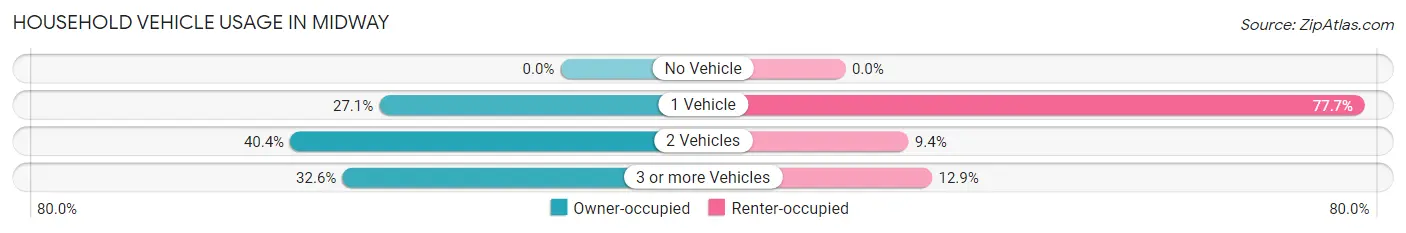
| Vehicles per Household | Owner-occupied | Renter-occupied |
| No Vehicle | 0 (0.0%) | 0 (0.0%) |
| 1 Vehicle | 59 (27.1%) | 66 (77.6%) |
| 2 Vehicles | 88 (40.4%) | 8 (9.4%) |
| 3 or more Vehicles | 71 (32.6%) | 11 (12.9%) |
| Total | 218 (100.0%) | 85 (100.0%) |
Real Estate & Mortgages in Midway
Real Estate and Mortgage Overview in Midway
| Characteristic | Without Mortgage | With Mortgage |
| Housing Units | 162 | 56 |
| Median Property Value | $161,600 | $97,500 |
| Median Household Income | $33,839 | $0 |
| Monthly Housing Costs | $423 | $0 |
| Real Estate Taxes | $694 | $13 |
Property Value by Mortgage Status in Midway
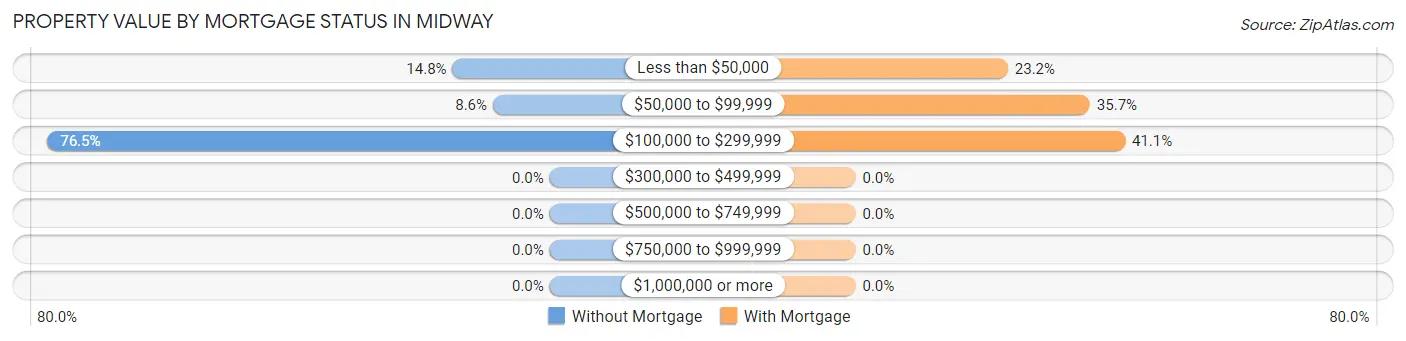
| Property Value | Without Mortgage | With Mortgage |
| Less than $50,000 | 24 (14.8%) | 13 (23.2%) |
| $50,000 to $99,999 | 14 (8.6%) | 20 (35.7%) |
| $100,000 to $299,999 | 124 (76.5%) | 23 (41.1%) |
| $300,000 to $499,999 | 0 (0.0%) | 0 (0.0%) |
| $500,000 to $749,999 | 0 (0.0%) | 0 (0.0%) |
| $750,000 to $999,999 | 0 (0.0%) | 0 (0.0%) |
| $1,000,000 or more | 0 (0.0%) | 0 (0.0%) |
| Total | 162 (100.0%) | 56 (100.0%) |
Household Income by Mortgage Status in Midway
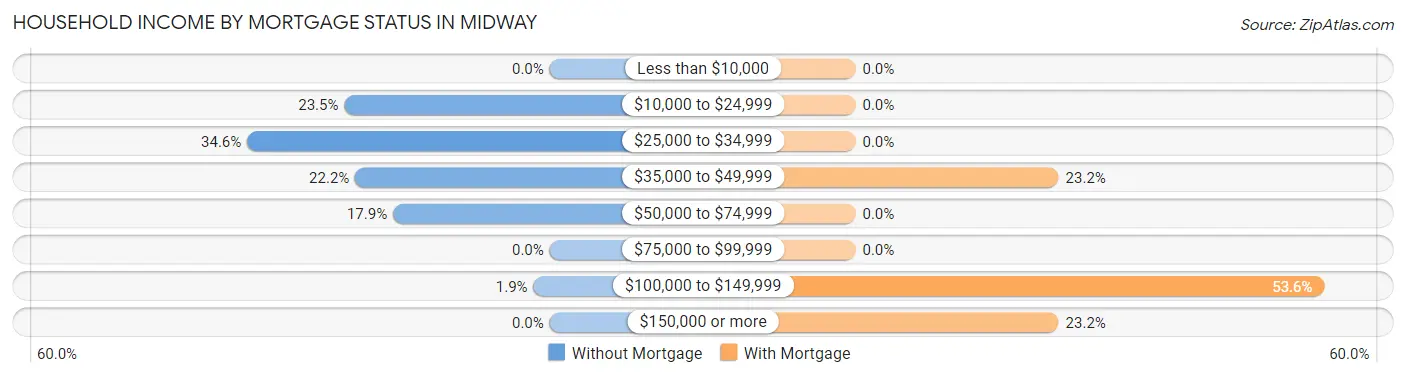
| Household Income | Without Mortgage | With Mortgage |
| Less than $10,000 | 0 (0.0%) | 0 (0.0%) |
| $10,000 to $24,999 | 38 (23.5%) | 0 (0.0%) |
| $25,000 to $34,999 | 56 (34.6%) | 0 (0.0%) |
| $35,000 to $49,999 | 36 (22.2%) | 13 (23.2%) |
| $50,000 to $74,999 | 29 (17.9%) | 0 (0.0%) |
| $75,000 to $99,999 | 0 (0.0%) | 0 (0.0%) |
| $100,000 to $149,999 | 3 (1.8%) | 30 (53.6%) |
| $150,000 or more | 0 (0.0%) | 13 (23.2%) |
| Total | 162 (100.0%) | 56 (100.0%) |
Property Value to Household Income Ratio in Midway
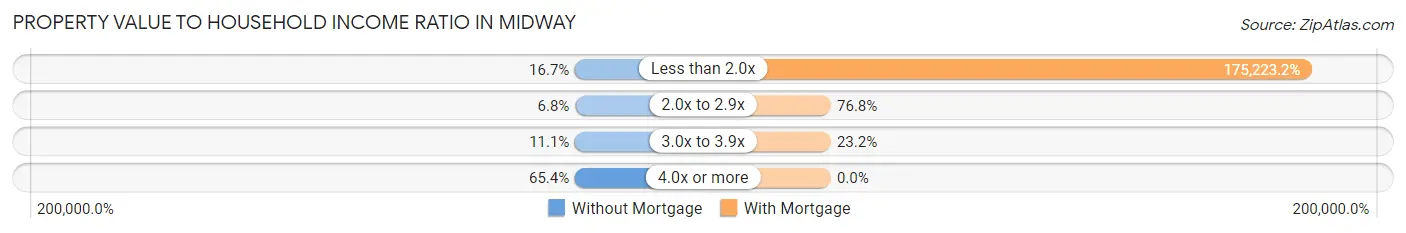
| Value-to-Income Ratio | Without Mortgage | With Mortgage |
| Less than 2.0x | 27 (16.7%) | 98,125 (175,223.2%) |
| 2.0x to 2.9x | 11 (6.8%) | 43 (76.8%) |
| 3.0x to 3.9x | 18 (11.1%) | 13 (23.2%) |
| 4.0x or more | 106 (65.4%) | 0 (0.0%) |
| Total | 162 (100.0%) | 56 (100.0%) |
Real Estate Taxes by Mortgage Status in Midway
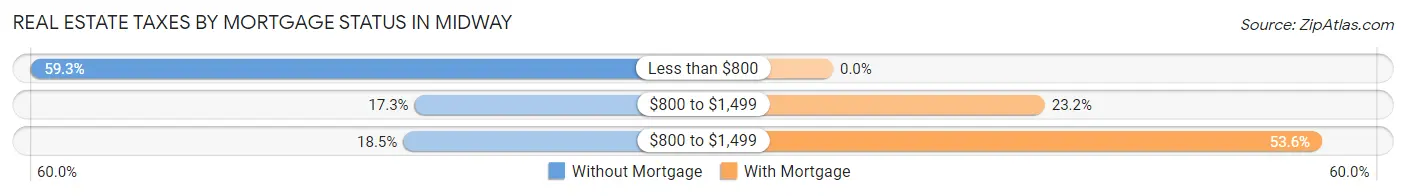
| Property Taxes | Without Mortgage | With Mortgage |
| Less than $800 | 96 (59.3%) | 0 (0.0%) |
| $800 to $1,499 | 28 (17.3%) | 13 (23.2%) |
| $800 to $1,499 | 30 (18.5%) | 30 (53.6%) |
| Total | 162 (100.0%) | 56 (100.0%) |
Health & Disability in Midway
Health Insurance Coverage by Age in Midway
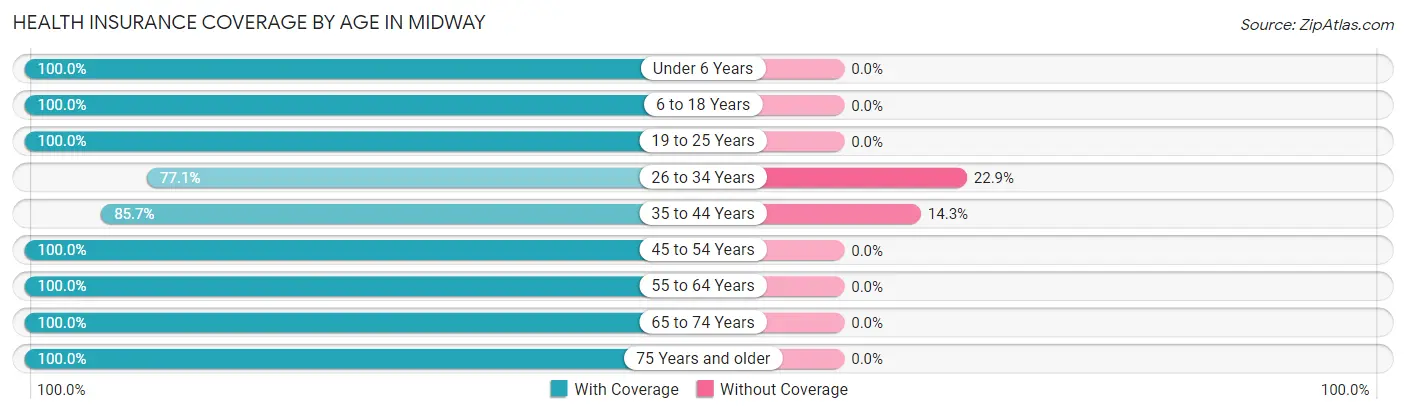
| Age Bracket | With Coverage | Without Coverage |
| Under 6 Years | 26 (100.0%) | 0 (0.0%) |
| 6 to 18 Years | 39 (100.0%) | 0 (0.0%) |
| 19 to 25 Years | 7 (100.0%) | 0 (0.0%) |
| 26 to 34 Years | 27 (77.1%) | 8 (22.9%) |
| 35 to 44 Years | 72 (85.7%) | 12 (14.3%) |
| 45 to 54 Years | 123 (100.0%) | 0 (0.0%) |
| 55 to 64 Years | 111 (100.0%) | 0 (0.0%) |
| 65 to 74 Years | 140 (100.0%) | 0 (0.0%) |
| 75 Years and older | 80 (100.0%) | 0 (0.0%) |
| Total | 625 (96.9%) | 20 (3.1%) |
Health Insurance Coverage by Citizenship Status in Midway
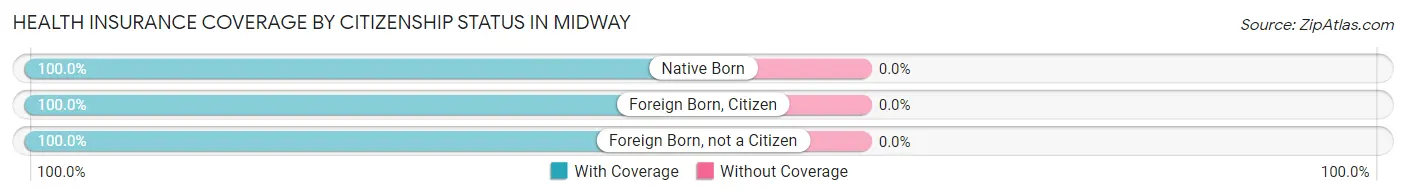
| Citizenship Status | With Coverage | Without Coverage |
| Native Born | 26 (100.0%) | 0 (0.0%) |
| Foreign Born, Citizen | 39 (100.0%) | 0 (0.0%) |
| Foreign Born, not a Citizen | 7 (100.0%) | 0 (0.0%) |
Health Insurance Coverage by Household Income in Midway
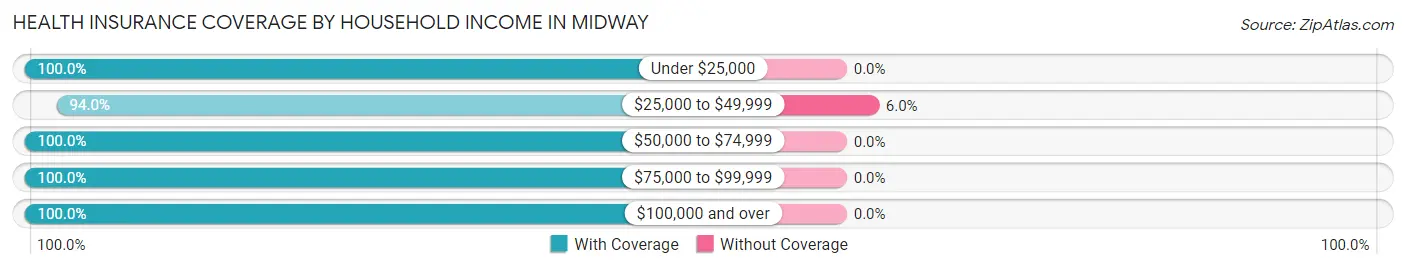
| Household Income | With Coverage | Without Coverage |
| Under $25,000 | 116 (100.0%) | 0 (0.0%) |
| $25,000 to $49,999 | 313 (94.0%) | 20 (6.0%) |
| $50,000 to $74,999 | 68 (100.0%) | 0 (0.0%) |
| $75,000 to $99,999 | 90 (100.0%) | 0 (0.0%) |
| $100,000 and over | 38 (100.0%) | 0 (0.0%) |
Public vs Private Health Insurance Coverage by Age in Midway
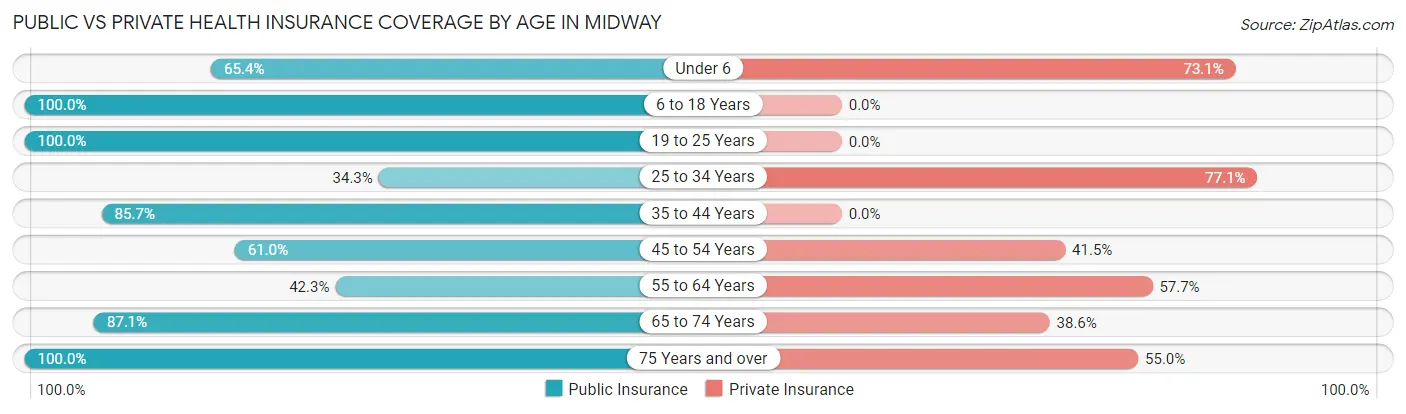
| Age Bracket | Public Insurance | Private Insurance |
| Under 6 | 17 (65.4%) | 19 (73.1%) |
| 6 to 18 Years | 39 (100.0%) | 0 (0.0%) |
| 19 to 25 Years | 7 (100.0%) | 0 (0.0%) |
| 25 to 34 Years | 12 (34.3%) | 27 (77.1%) |
| 35 to 44 Years | 72 (85.7%) | 0 (0.0%) |
| 45 to 54 Years | 75 (61.0%) | 51 (41.5%) |
| 55 to 64 Years | 47 (42.3%) | 64 (57.7%) |
| 65 to 74 Years | 122 (87.1%) | 54 (38.6%) |
| 75 Years and over | 80 (100.0%) | 44 (55.0%) |
| Total | 471 (73.0%) | 259 (40.2%) |
Disability Status by Sex by Age in Midway
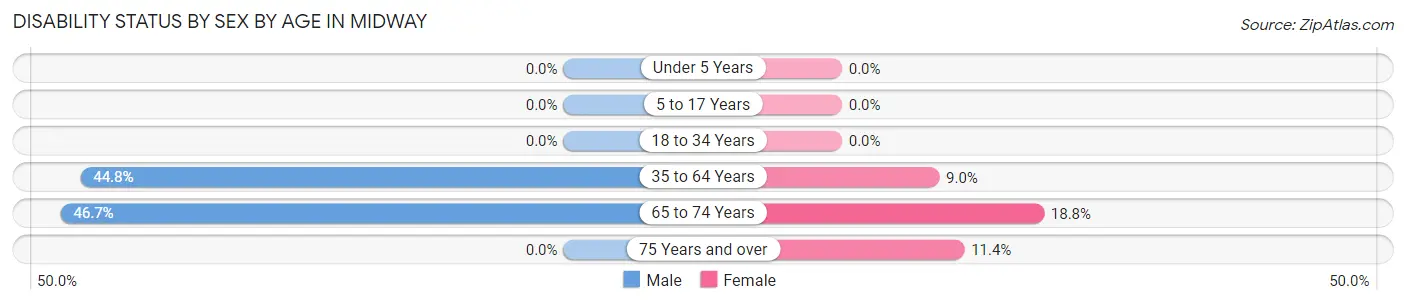
| Age Bracket | Male | Female |
| Under 5 Years | 0 (0.0%) | 0 (0.0%) |
| 5 to 17 Years | 0 (0.0%) | 0 (0.0%) |
| 18 to 34 Years | 0 (0.0%) | 0 (0.0%) |
| 35 to 64 Years | 78 (44.8%) | 13 (9.0%) |
| 65 to 74 Years | 28 (46.7%) | 15 (18.8%) |
| 75 Years and over | 0 (0.0%) | 5 (11.4%) |
Disability Class by Sex by Age in Midway
Disability Class: Hearing Difficulty
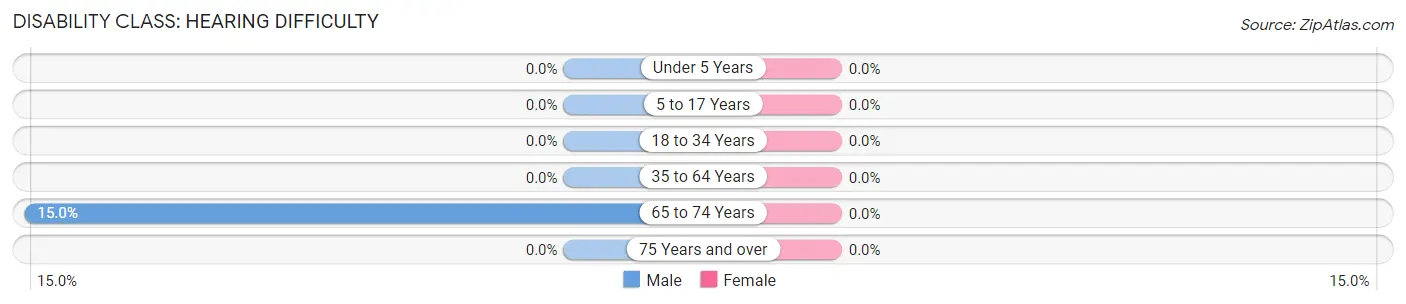
| Age Bracket | Male | Female |
| Under 5 Years | 0 (0.0%) | 0 (0.0%) |
| 5 to 17 Years | 0 (0.0%) | 0 (0.0%) |
| 18 to 34 Years | 0 (0.0%) | 0 (0.0%) |
| 35 to 64 Years | 0 (0.0%) | 0 (0.0%) |
| 65 to 74 Years | 9 (15.0%) | 0 (0.0%) |
| 75 Years and over | 0 (0.0%) | 0 (0.0%) |
Disability Class: Vision Difficulty
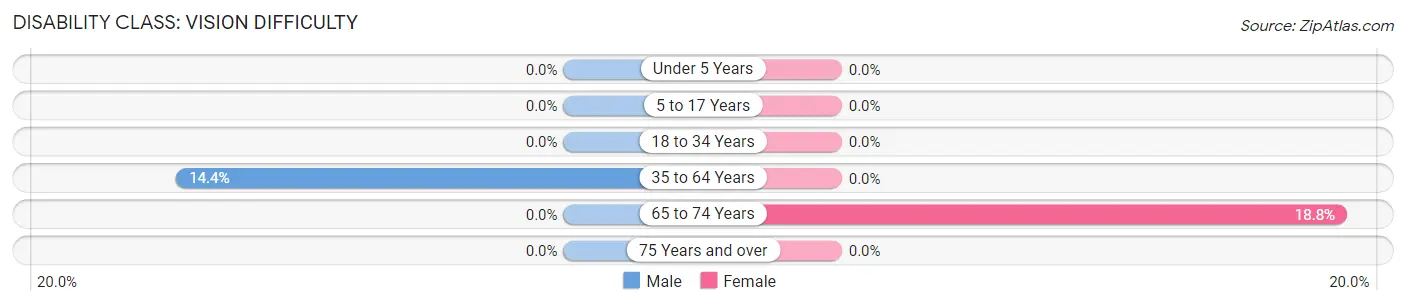
| Age Bracket | Male | Female |
| Under 5 Years | 0 (0.0%) | 0 (0.0%) |
| 5 to 17 Years | 0 (0.0%) | 0 (0.0%) |
| 18 to 34 Years | 0 (0.0%) | 0 (0.0%) |
| 35 to 64 Years | 25 (14.4%) | 0 (0.0%) |
| 65 to 74 Years | 0 (0.0%) | 15 (18.8%) |
| 75 Years and over | 0 (0.0%) | 0 (0.0%) |
Disability Class: Cognitive Difficulty
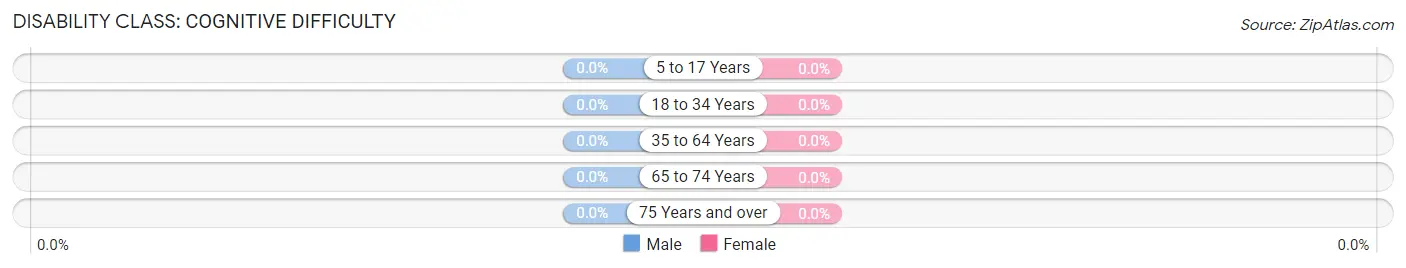
| Age Bracket | Male | Female |
| 5 to 17 Years | 0 (0.0%) | 0 (0.0%) |
| 18 to 34 Years | 0 (0.0%) | 0 (0.0%) |
| 35 to 64 Years | 0 (0.0%) | 0 (0.0%) |
| 65 to 74 Years | 0 (0.0%) | 0 (0.0%) |
| 75 Years and over | 0 (0.0%) | 0 (0.0%) |
Disability Class: Ambulatory Difficulty
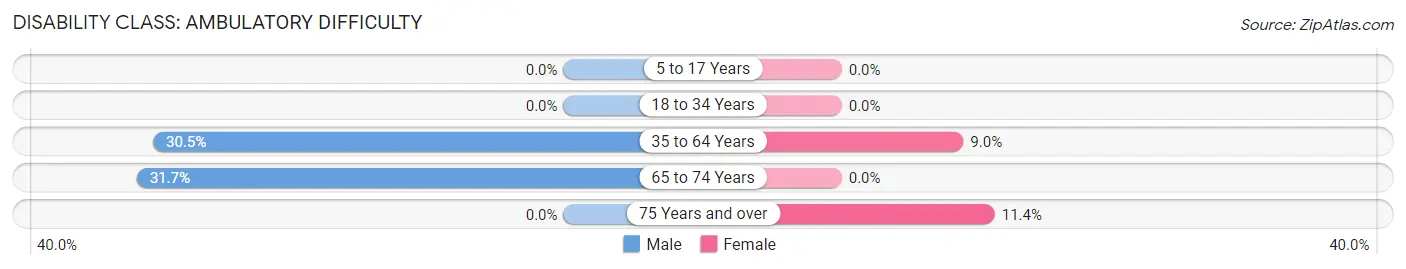
| Age Bracket | Male | Female |
| 5 to 17 Years | 0 (0.0%) | 0 (0.0%) |
| 18 to 34 Years | 0 (0.0%) | 0 (0.0%) |
| 35 to 64 Years | 53 (30.5%) | 13 (9.0%) |
| 65 to 74 Years | 19 (31.7%) | 0 (0.0%) |
| 75 Years and over | 0 (0.0%) | 5 (11.4%) |
Disability Class: Self-Care Difficulty
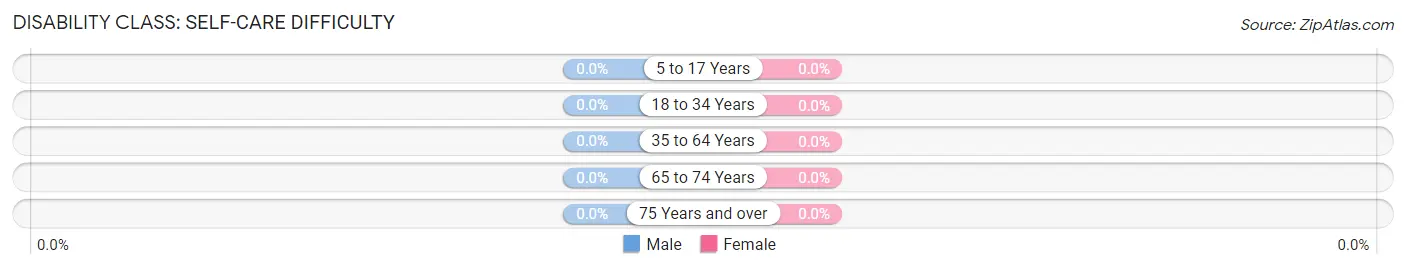
| Age Bracket | Male | Female |
| 5 to 17 Years | 0 (0.0%) | 0 (0.0%) |
| 18 to 34 Years | 0 (0.0%) | 0 (0.0%) |
| 35 to 64 Years | 0 (0.0%) | 0 (0.0%) |
| 65 to 74 Years | 0 (0.0%) | 0 (0.0%) |
| 75 Years and over | 0 (0.0%) | 0 (0.0%) |
Technology Access in Midway
Computing Device Access in Midway
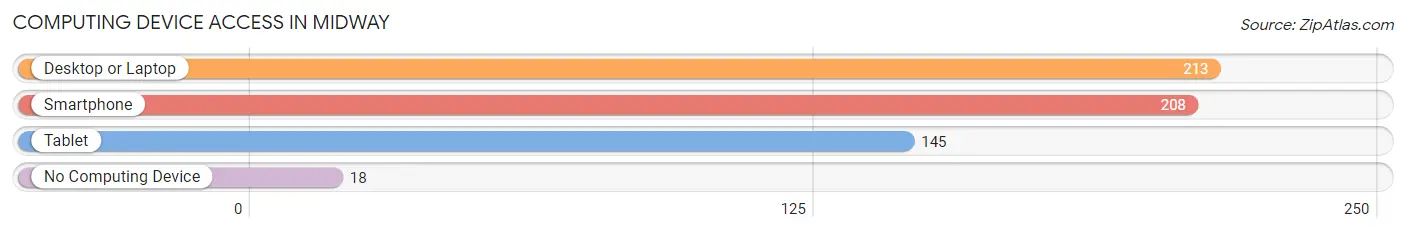
| Device Type | # Households | % Households |
| Desktop or Laptop | 213 | 70.3% |
| Smartphone | 208 | 68.6% |
| Tablet | 145 | 47.8% |
| No Computing Device | 18 | 5.9% |
| Total | 303 | 100.0% |
Internet Access in Midway
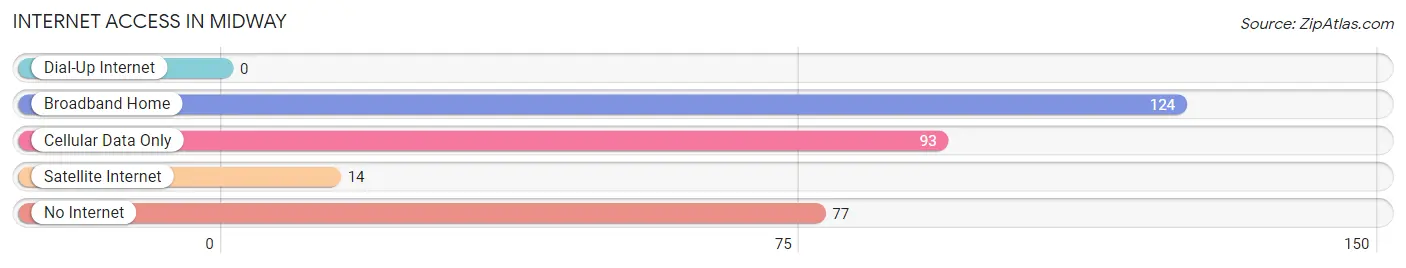
| Internet Type | # Households | % Households |
| Dial-Up Internet | 0 | 0.0% |
| Broadband Home | 124 | 40.9% |
| Cellular Data Only | 93 | 30.7% |
| Satellite Internet | 14 | 4.6% |
| No Internet | 77 | 25.4% |
| Total | 303 | 100.0% |
Midway Summary
Midway is a small unincorporated community located in the state of New Mexico. It is situated in the south-central part of the state, in the county of Chaves. The community is located approximately 20 miles south of Roswell, the county seat. The population of Midway was estimated to be around 200 people in 2020.
History
Midway was founded in the late 1800s by a group of settlers from Texas. The settlers were looking for a place to settle and start a new life. The area was originally known as "Midway Station" because it was located halfway between Roswell and Carlsbad. The settlers built a small store and post office, which served as the center of the community.
In the early 1900s, Midway began to grow and develop. The town was incorporated in 1909 and the first mayor was elected in 1910. The town was named after the nearby Midway Creek.
In the 1920s, Midway experienced a period of growth and prosperity. The town was home to several businesses, including a bank, a hotel, a movie theater, and a general store. The town also had a school, a library, and a hospital.
In the 1940s, Midway experienced a decline in population due to the Great Depression and World War II. The town's population decreased from around 500 people in 1940 to just over 200 people in 1950.
Geography
Midway is located in the south-central part of New Mexico, in the county of Chaves. The town is situated at an elevation of 4,000 feet above sea level. The town is located approximately 20 miles south of Roswell, the county seat.
The town is surrounded by desert and is located near the Pecos River. The climate in Midway is arid and semi-arid, with hot summers and mild winters. The average annual temperature is around 70 degrees Fahrenheit.
Economy
The economy of Midway is largely based on agriculture and ranching. The town is home to several farms and ranches, which produce a variety of crops and livestock. The town is also home to several small businesses, including a gas station, a grocery store, and a restaurant.
Demographics
As of 2020, the population of Midway was estimated to be around 200 people. The town is predominantly white, with a small Hispanic population. The median household income in Midway is around $30,000. The town has a high poverty rate, with around 25% of the population living below the poverty line.
Common Questions
What is Per Capita Income in Midway?
Per Capita income in Midway is $23,140.
What is the Median Family Income in Midway?
Median Family Income in Midway is $40,568.
What is the Median Household income in Midway?
Median Household Income in Midway is $35,708.
What is Inequality or Gini Index in Midway?
Inequality or Gini Index in Midway is 0.39.
What is the Total Population of Midway?
Total Population of Midway is 645.
What is the Total Male Population of Midway?
Total Male Population of Midway is 309.
What is the Total Female Population of Midway?
Total Female Population of Midway is 336.
What is the Ratio of Males per 100 Females in Midway?
There are 91.96 Males per 100 Females in Midway.
What is the Ratio of Females per 100 Males in Midway?
There are 108.74 Females per 100 Males in Midway.
What is the Median Population Age in Midway?
Median Population Age in Midway is 57.2 Years.
What is the Average Family Size in Midway
Average Family Size in Midway is 2.5 People.
What is the Average Household Size in Midway
Average Household Size in Midway is 2.1 People.
How Large is the Labor Force in Midway?
There are 184 People in the Labor Forcein in Midway.
What is the Percentage of People in the Labor Force in Midway?
31.7% of People are in the Labor Force in Midway.