Spencerville, NM Map & Demographics
Spencerville Map
Spencerville Overview
$33,360
PER CAPITA INCOME
$77,629
AVG FAMILY INCOME
$71,705
AVG HOUSEHOLD INCOME
27.5%
WAGE / INCOME GAP [ % ]
72.5¢/ $1
WAGE / INCOME GAP [ $ ]
0.41
INEQUALITY / GINI INDEX
1,174
TOTAL POPULATION
595
MALE POPULATION
579
FEMALE POPULATION
102.76
MALES / 100 FEMALES
97.31
FEMALES / 100 MALES
45.5
MEDIAN AGE
3.0
AVG FAMILY SIZE
2.6
AVG HOUSEHOLD SIZE
499
LABOR FORCE [ PEOPLE ]
45.3%
PERCENT IN LABOR FORCE
3.0%
UNEMPLOYMENT RATE
Income in Spencerville
Income Overview in Spencerville
Per Capita Income in Spencerville is $33,360, while median incomes of families and households are $77,629 and $71,705 respectively.
| Characteristic | Number | Measure |
| Per Capita Income | 1,174 | $33,360 |
| Median Family Income | 311 | $77,629 |
| Mean Family Income | 311 | $76,228 |
| Median Household Income | 449 | $71,705 |
| Mean Household Income | 449 | $84,200 |
| Income Deficit | 311 | $0 |
| Wage / Income Gap (%) | 1,174 | 27.51% |
| Wage / Income Gap ($) | 1,174 | 72.49¢ per $1 |
| Gini / Inequality Index | 1,174 | 0.41 |
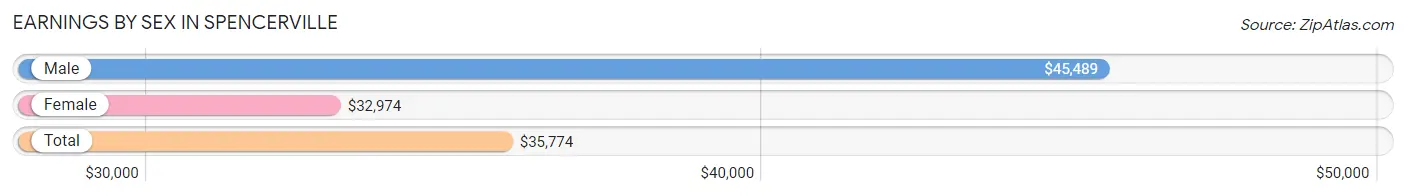
Earnings by Sex in Spencerville
Average Earnings in Spencerville are $35,774, $45,489 for men and $32,974 for women, a difference of 27.5%.
| Sex | Number | Average Earnings |
| Male | 288 (55.5%) | $45,489 |
| Female | 231 (44.5%) | $32,974 |
| Total | 519 (100.0%) | $35,774 |
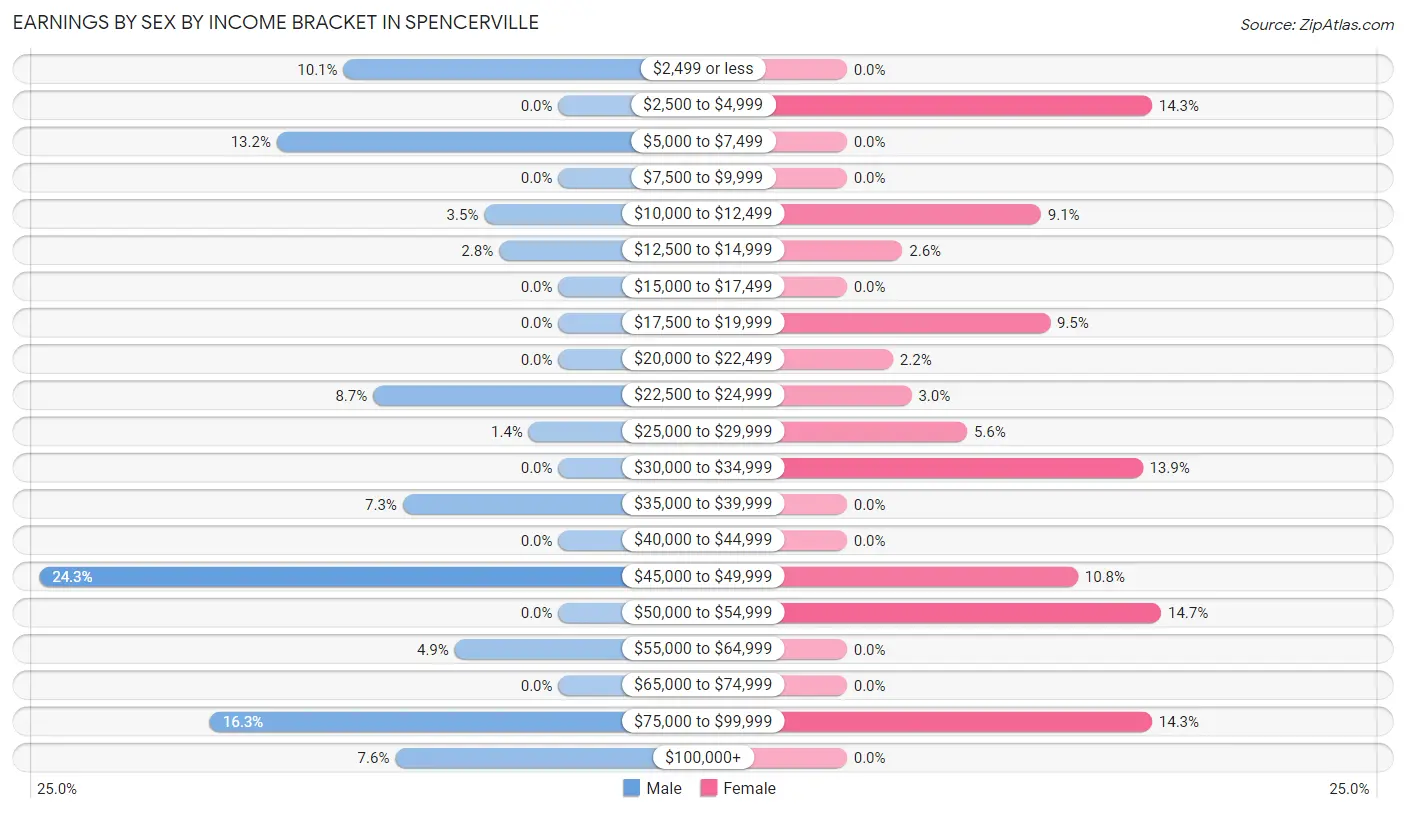
Earnings by Sex by Income Bracket in Spencerville
The most common earnings brackets in Spencerville are $45,000 to $49,999 for men (70 | 24.3%) and $50,000 to $54,999 for women (34 | 14.7%).
| Income | Male | Female |
| $2,499 or less | 29 (10.1%) | 0 (0.0%) |
| $2,500 to $4,999 | 0 (0.0%) | 33 (14.3%) |
| $5,000 to $7,499 | 38 (13.2%) | 0 (0.0%) |
| $7,500 to $9,999 | 0 (0.0%) | 0 (0.0%) |
| $10,000 to $12,499 | 10 (3.5%) | 21 (9.1%) |
| $12,500 to $14,999 | 8 (2.8%) | 6 (2.6%) |
| $15,000 to $17,499 | 0 (0.0%) | 0 (0.0%) |
| $17,500 to $19,999 | 0 (0.0%) | 22 (9.5%) |
| $20,000 to $22,499 | 0 (0.0%) | 5 (2.2%) |
| $22,500 to $24,999 | 25 (8.7%) | 7 (3.0%) |
| $25,000 to $29,999 | 4 (1.4%) | 13 (5.6%) |
| $30,000 to $34,999 | 0 (0.0%) | 32 (13.9%) |
| $35,000 to $39,999 | 21 (7.3%) | 0 (0.0%) |
| $40,000 to $44,999 | 0 (0.0%) | 0 (0.0%) |
| $45,000 to $49,999 | 70 (24.3%) | 25 (10.8%) |
| $50,000 to $54,999 | 0 (0.0%) | 34 (14.7%) |
| $55,000 to $64,999 | 14 (4.9%) | 0 (0.0%) |
| $65,000 to $74,999 | 0 (0.0%) | 0 (0.0%) |
| $75,000 to $99,999 | 47 (16.3%) | 33 (14.3%) |
| $100,000+ | 22 (7.6%) | 0 (0.0%) |
| Total | 288 (100.0%) | 231 (100.0%) |
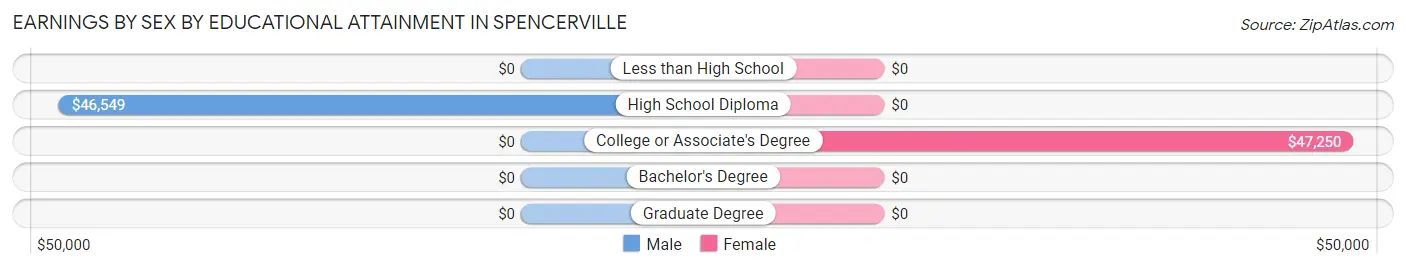
Earnings by Sex by Educational Attainment in Spencerville
Average earnings in Spencerville are $46,087 for men and $45,438 for women, a difference of 1.4%. Men with an educational attainment of high school diploma enjoy the highest average annual earnings of $46,549, while those with high school diploma education earn the least with $46,549. Women with an educational attainment of college or associate's degree earn the most with the average annual earnings of $47,250, while those with college or associate's degree education have the smallest earnings of $47,250.
| Educational Attainment | Male Income | Female Income |
| Less than High School | - | - |
| High School Diploma | $46,549 | $0 |
| College or Associate's Degree | - | - |
| Bachelor's Degree | - | - |
| Graduate Degree | - | - |
| Total | $46,087 | $45,438 |
Family Income in Spencerville
Family Income Brackets in Spencerville
According to the Spencerville family income data, there are 84 families falling into the $75,000 to $99,999 income range, which is the most common income bracket and makes up 27.0% of all families.
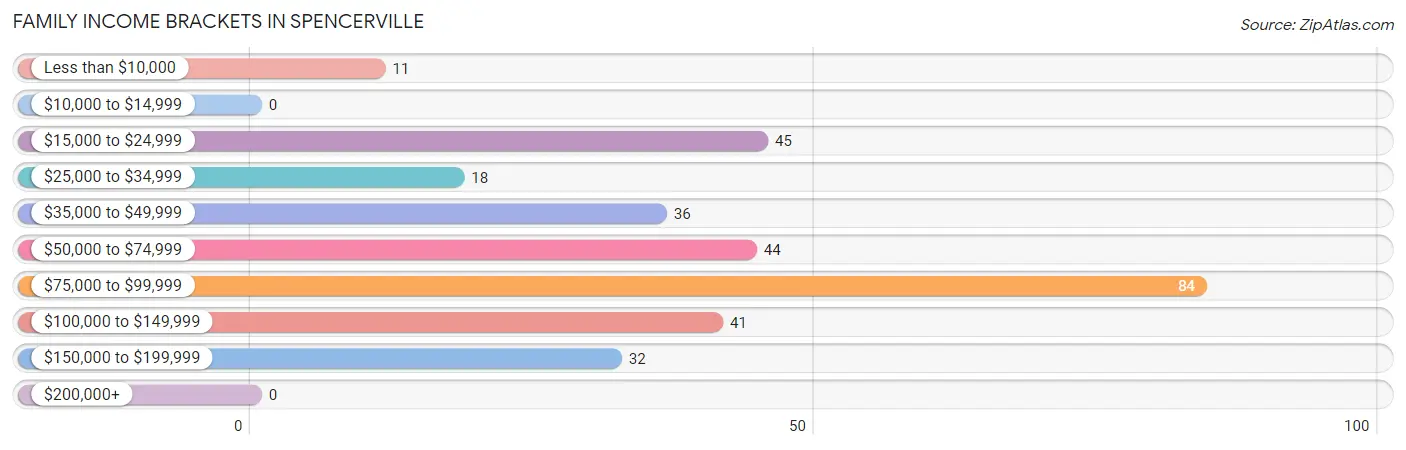
| Income Bracket | # Families | % Families |
| Less than $10,000 | 11 | 3.5% |
| $10,000 to $14,999 | 0 | 0.0% |
| $15,000 to $24,999 | 45 | 14.5% |
| $25,000 to $34,999 | 18 | 5.8% |
| $35,000 to $49,999 | 36 | 11.6% |
| $50,000 to $74,999 | 44 | 14.1% |
| $75,000 to $99,999 | 84 | 27.0% |
| $100,000 to $149,999 | 41 | 13.2% |
| $150,000 to $199,999 | 32 | 10.3% |
| $200,000+ | 0 | 0.0% |
Family Income by Famaliy Size in Spencerville
2-person families (139 | 44.7%) account for the highest median family income in Spencerville with $79,612 per family, while 2-person families (139 | 44.7%) have the highest median income of $39,806 per family member.
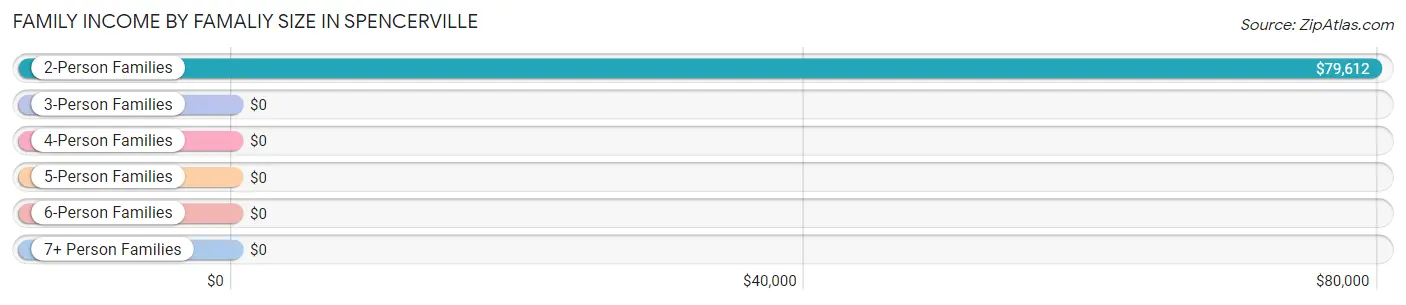
| Income Bracket | # Families | Median Income |
| 2-Person Families | 139 (44.7%) | $79,612 |
| 3-Person Families | 120 (38.6%) | $0 |
| 4-Person Families | 52 (16.7%) | $0 |
| 5-Person Families | 0 (0.0%) | $0 |
| 6-Person Families | 0 (0.0%) | $0 |
| 7+ Person Families | 0 (0.0%) | $0 |
| Total | 311 (100.0%) | $77,629 |
Family Income by Number of Earners in Spencerville
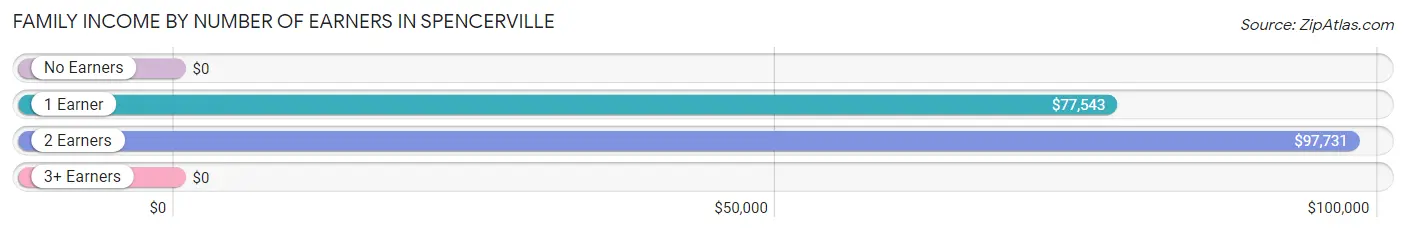
| Number of Earners | # Families | Median Income |
| No Earners | 97 (31.2%) | $0 |
| 1 Earner | 123 (39.6%) | $77,543 |
| 2 Earners | 71 (22.8%) | $97,731 |
| 3+ Earners | 20 (6.4%) | $0 |
| Total | 311 (100.0%) | $77,629 |
Household Income in Spencerville
Household Income Brackets in Spencerville
With 119 households falling in the category, the $75,000 to $99,999 income range is the most frequent in Spencerville, accounting for 26.5% of all households. In contrast, only 11 households (2.5%) fall into the less than $10,000 income bracket, making it the least populous group.
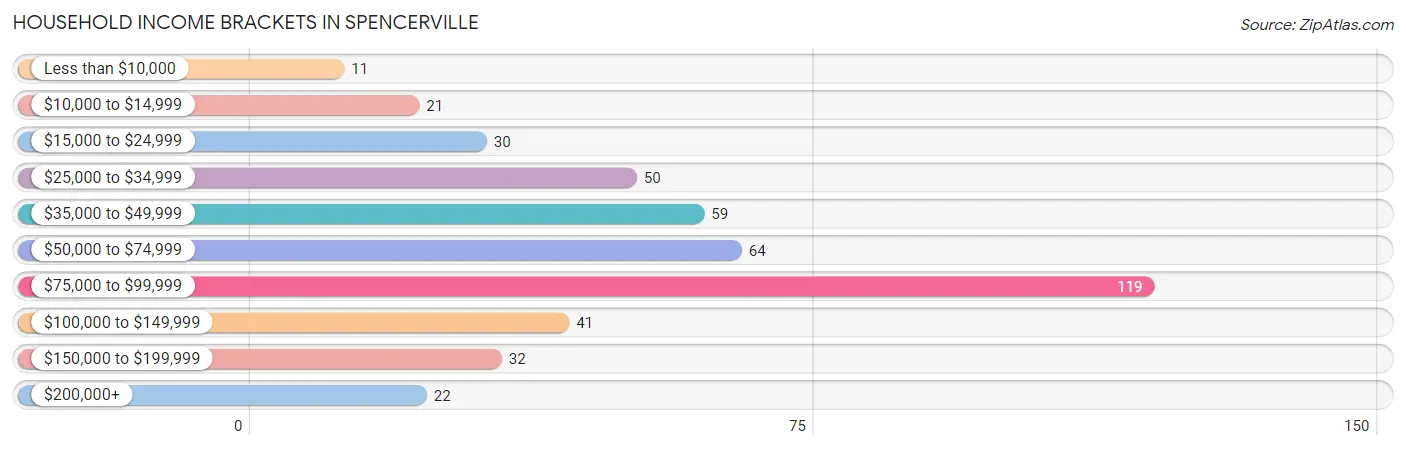
| Income Bracket | # Households | % Households |
| Less than $10,000 | 11 | 2.4% |
| $10,000 to $14,999 | 21 | 4.7% |
| $15,000 to $24,999 | 30 | 6.7% |
| $25,000 to $34,999 | 50 | 11.1% |
| $35,000 to $49,999 | 59 | 13.1% |
| $50,000 to $74,999 | 64 | 14.3% |
| $75,000 to $99,999 | 119 | 26.5% |
| $100,000 to $149,999 | 41 | 9.1% |
| $150,000 to $199,999 | 32 | 7.1% |
| $200,000+ | 22 | 4.9% |
Household Income by Householder Age in Spencerville
The median household income in Spencerville is $71,705, with the highest median household income of $77,845 found in the 45 to 64 years age bracket for the primary householder. A total of 146 households (32.5%) fall into this category. Meanwhile, the 15 to 24 years age bracket for the primary householder has the lowest median household income of $0, with 21 households (4.7%) in this group.
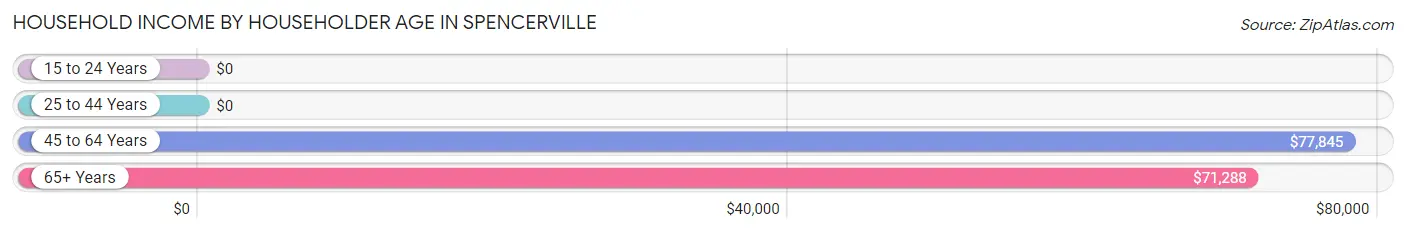
| Income Bracket | # Households | Median Income |
| 15 to 24 Years | 21 (4.7%) | $0 |
| 25 to 44 Years | 84 (18.7%) | $0 |
| 45 to 64 Years | 146 (32.5%) | $77,845 |
| 65+ Years | 198 (44.1%) | $71,288 |
| Total | 449 (100.0%) | $71,705 |
Poverty in Spencerville
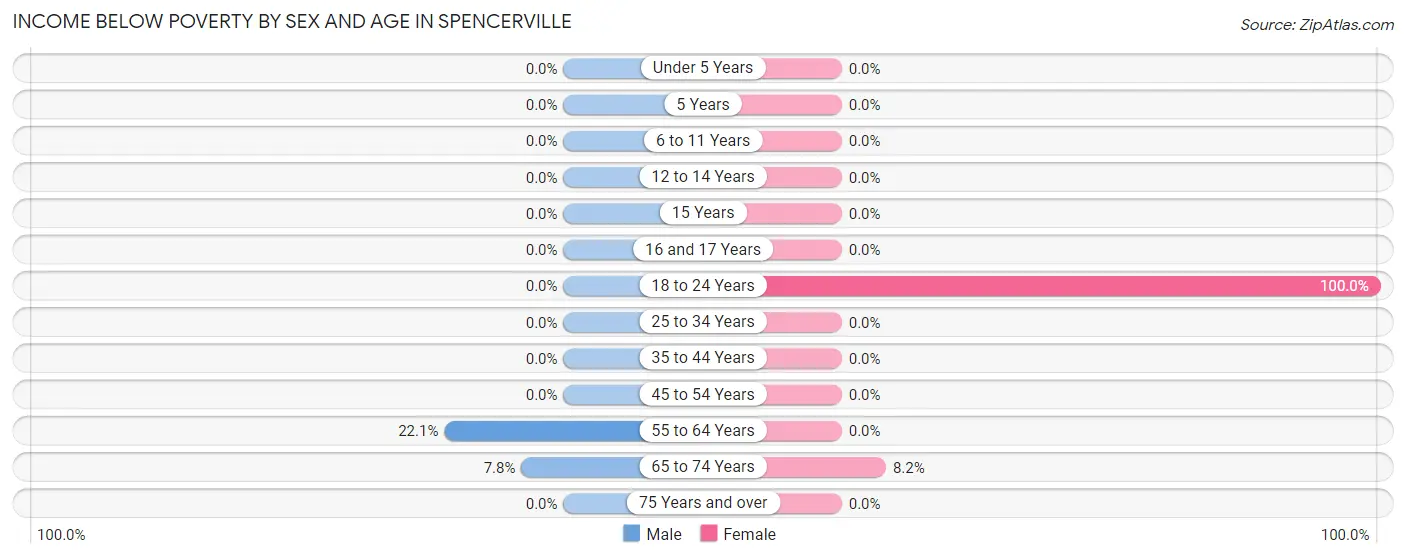
Income Below Poverty by Sex and Age in Spencerville
With 5.4% poverty level for males and 11.1% for females among the residents of Spencerville, 55 to 64 year old males and 18 to 24 year old females are the most vulnerable to poverty, with 21 males (22.1%) and 54 females (100.0%) in their respective age groups living below the poverty level.
| Age Bracket | Male | Female |
| Under 5 Years | 0 (0.0%) | 0 (0.0%) |
| 5 Years | 0 (0.0%) | 0 (0.0%) |
| 6 to 11 Years | 0 (0.0%) | 0 (0.0%) |
| 12 to 14 Years | 0 (0.0%) | 0 (0.0%) |
| 15 Years | 0 (0.0%) | 0 (0.0%) |
| 16 and 17 Years | 0 (0.0%) | 0 (0.0%) |
| 18 to 24 Years | 0 (0.0%) | 54 (100.0%) |
| 25 to 34 Years | 0 (0.0%) | 0 (0.0%) |
| 35 to 44 Years | 0 (0.0%) | 0 (0.0%) |
| 45 to 54 Years | 0 (0.0%) | 0 (0.0%) |
| 55 to 64 Years | 21 (22.1%) | 0 (0.0%) |
| 65 to 74 Years | 11 (7.8%) | 10 (8.2%) |
| 75 Years and over | 0 (0.0%) | 0 (0.0%) |
| Total | 32 (5.4%) | 64 (11.1%) |
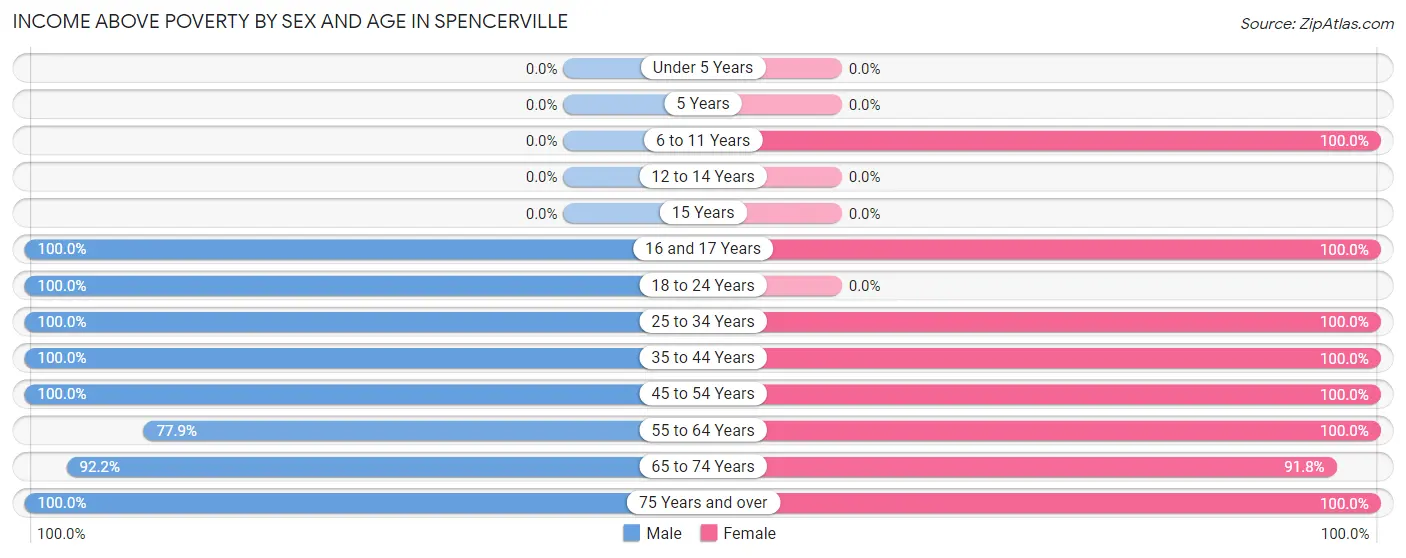
Income Above Poverty by Sex and Age in Spencerville
According to the poverty statistics in Spencerville, males aged 16 and 17 years and females aged 6 to 11 years are the age groups that are most secure financially, with 100.0% of males and 100.0% of females in these age groups living above the poverty line.
| Age Bracket | Male | Female |
| Under 5 Years | 0 (0.0%) | 0 (0.0%) |
| 5 Years | 0 (0.0%) | 0 (0.0%) |
| 6 to 11 Years | 0 (0.0%) | 72 (100.0%) |
| 12 to 14 Years | 0 (0.0%) | 0 (0.0%) |
| 15 Years | 0 (0.0%) | 0 (0.0%) |
| 16 and 17 Years | 49 (100.0%) | 38 (100.0%) |
| 18 to 24 Years | 126 (100.0%) | 0 (0.0%) |
| 25 to 34 Years | 29 (100.0%) | 10 (100.0%) |
| 35 to 44 Years | 86 (100.0%) | 117 (100.0%) |
| 45 to 54 Years | 23 (100.0%) | 70 (100.0%) |
| 55 to 64 Years | 74 (77.9%) | 81 (100.0%) |
| 65 to 74 Years | 130 (92.2%) | 112 (91.8%) |
| 75 Years and over | 46 (100.0%) | 15 (100.0%) |
| Total | 563 (94.6%) | 515 (88.9%) |
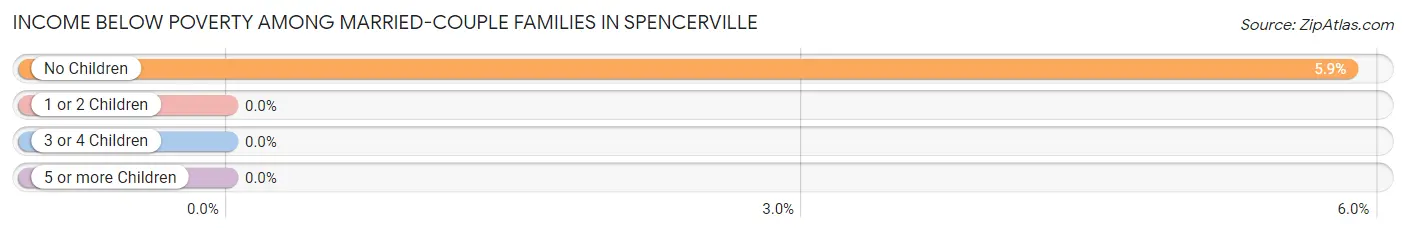
Income Below Poverty Among Married-Couple Families in Spencerville
The poverty statistics for married-couple families in Spencerville show that 4.2% or 11 of the total 263 families live below the poverty line. Families with no children have the highest poverty rate of 5.9%, comprising of 11 families. On the other hand, families with 1 or 2 children have the lowest poverty rate of 0.0%, which includes 0 families.
| Children | Above Poverty | Below Poverty |
| No Children | 177 (94.2%) | 11 (5.9%) |
| 1 or 2 Children | 75 (100.0%) | 0 (0.0%) |
| 3 or 4 Children | 0 (0.0%) | 0 (0.0%) |
| 5 or more Children | 0 (0.0%) | 0 (0.0%) |
| Total | 252 (95.8%) | 11 (4.2%) |
Income Below Poverty Among Single-Parent Households in Spencerville
| Children | Single Father | Single Mother |
| No Children | 0 (0.0%) | 0 (0.0%) |
| 1 or 2 Children | 0 (0.0%) | 0 (0.0%) |
| 3 or 4 Children | 0 (0.0%) | 0 (0.0%) |
| 5 or more Children | 0 (0.0%) | 0 (0.0%) |
| Total | 0 (0.0%) | 0 (0.0%) |
Income Below Poverty Among Married-Couple vs Single-Parent Households in Spencerville
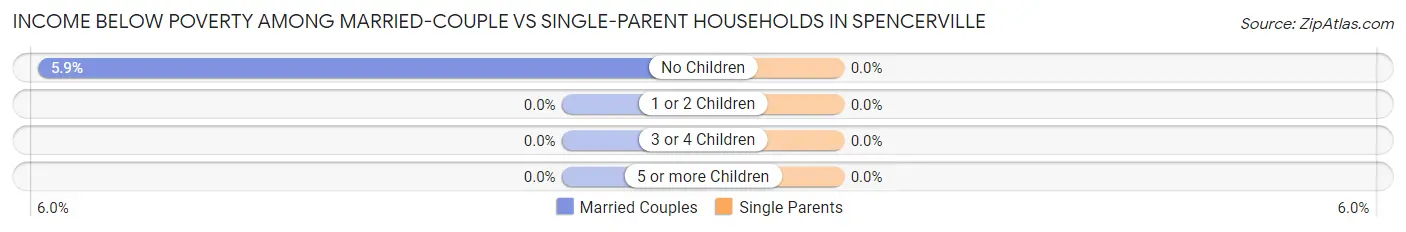
| Children | Married-Couple Families | Single-Parent Households |
| No Children | 11 (5.9%) | 0 (0.0%) |
| 1 or 2 Children | 0 (0.0%) | 0 (0.0%) |
| 3 or 4 Children | 0 (0.0%) | 0 (0.0%) |
| 5 or more Children | 0 (0.0%) | 0 (0.0%) |
| Total | 11 (4.2%) | 0 (0.0%) |
Race in Spencerville
The most populous races in Spencerville are White / Caucasian (1,092 | 93.0%), Hispanic or Latino (174 | 14.8%), and Native / Alaskan (67 | 5.7%).
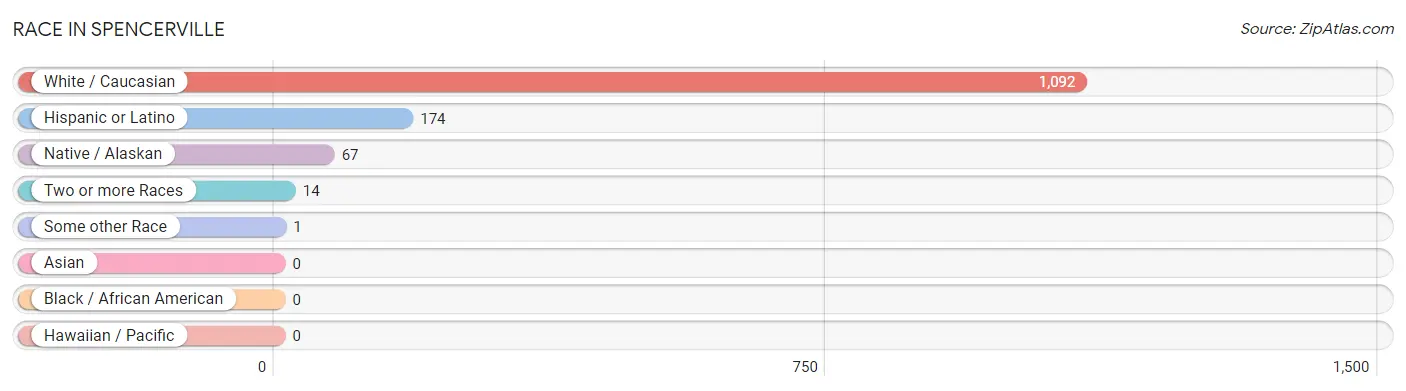
| Race | # Population | % Population |
| Asian | 0 | 0.0% |
| Black / African American | 0 | 0.0% |
| Hawaiian / Pacific | 0 | 0.0% |
| Hispanic or Latino | 174 | 14.8% |
| Native / Alaskan | 67 | 5.7% |
| White / Caucasian | 1,092 | 93.0% |
| Two or more Races | 14 | 1.2% |
| Some other Race | 1 | 0.1% |
| Total | 1,174 | 100.0% |
Ancestry in Spencerville
The most populous ancestries reported in Spencerville are European (166 | 14.1%), German (165 | 14.1%), Irish (128 | 10.9%), American (117 | 10.0%), and Spaniard (94 | 8.0%), together accounting for 57.1% of all Spencerville residents.
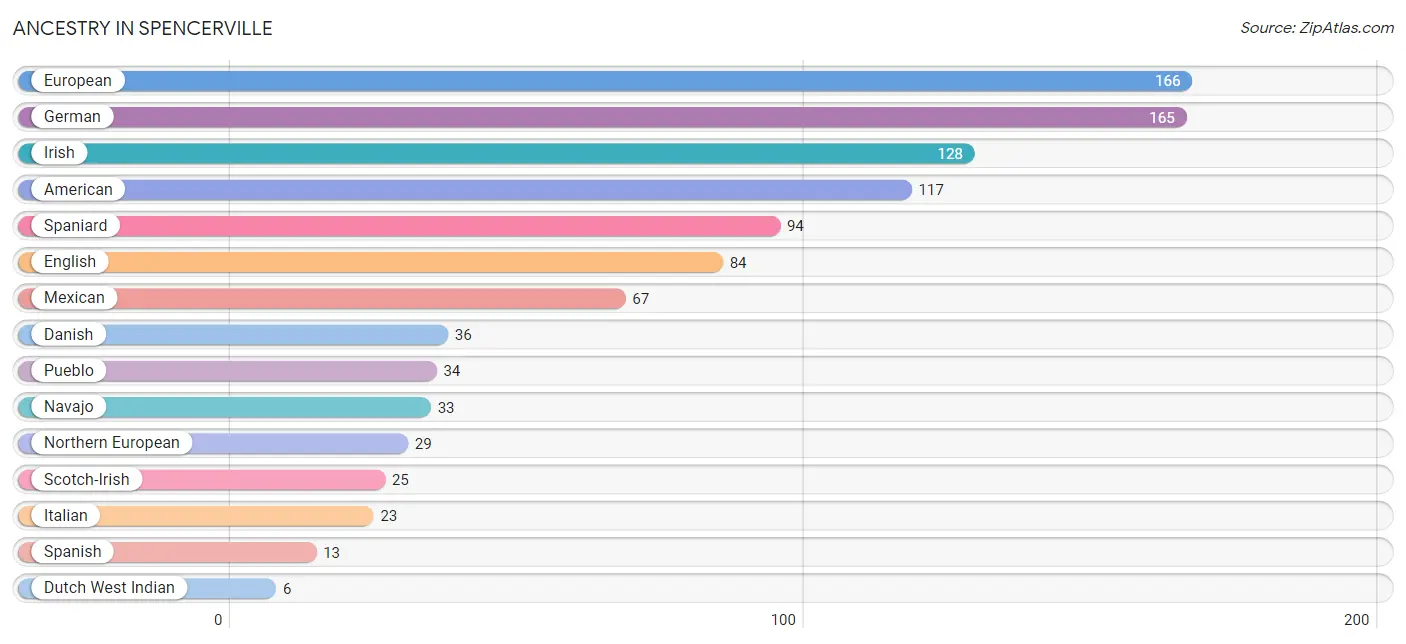
| Ancestry | # Population | % Population |
| American | 117 | 10.0% |
| Danish | 36 | 3.1% |
| Dutch West Indian | 6 | 0.5% |
| English | 84 | 7.2% |
| European | 166 | 14.1% |
| German | 165 | 14.1% |
| Irish | 128 | 10.9% |
| Italian | 23 | 2.0% |
| Mexican | 67 | 5.7% |
| Navajo | 33 | 2.8% |
| Northern European | 29 | 2.5% |
| Pueblo | 34 | 2.9% |
| Scotch-Irish | 25 | 2.1% |
| Spaniard | 94 | 8.0% |
| Spanish | 13 | 1.1% | View All 15 Rows |
Immigrants in Spencerville
The most numerous immigrant groups reported in Spencerville came from , and Canada (27 | 2.3%), together accounting for 2.3% of all Spencerville residents.

| Immigration Origin | # Population | % Population |
| Canada | 27 | 2.3% | View All 1 Rows |
Sex and Age in Spencerville
Sex and Age in Spencerville
The most populous age groups in Spencerville are 15 to 19 Years (109 | 18.3%) for men and 65 to 69 Years (107 | 18.5%) for women.
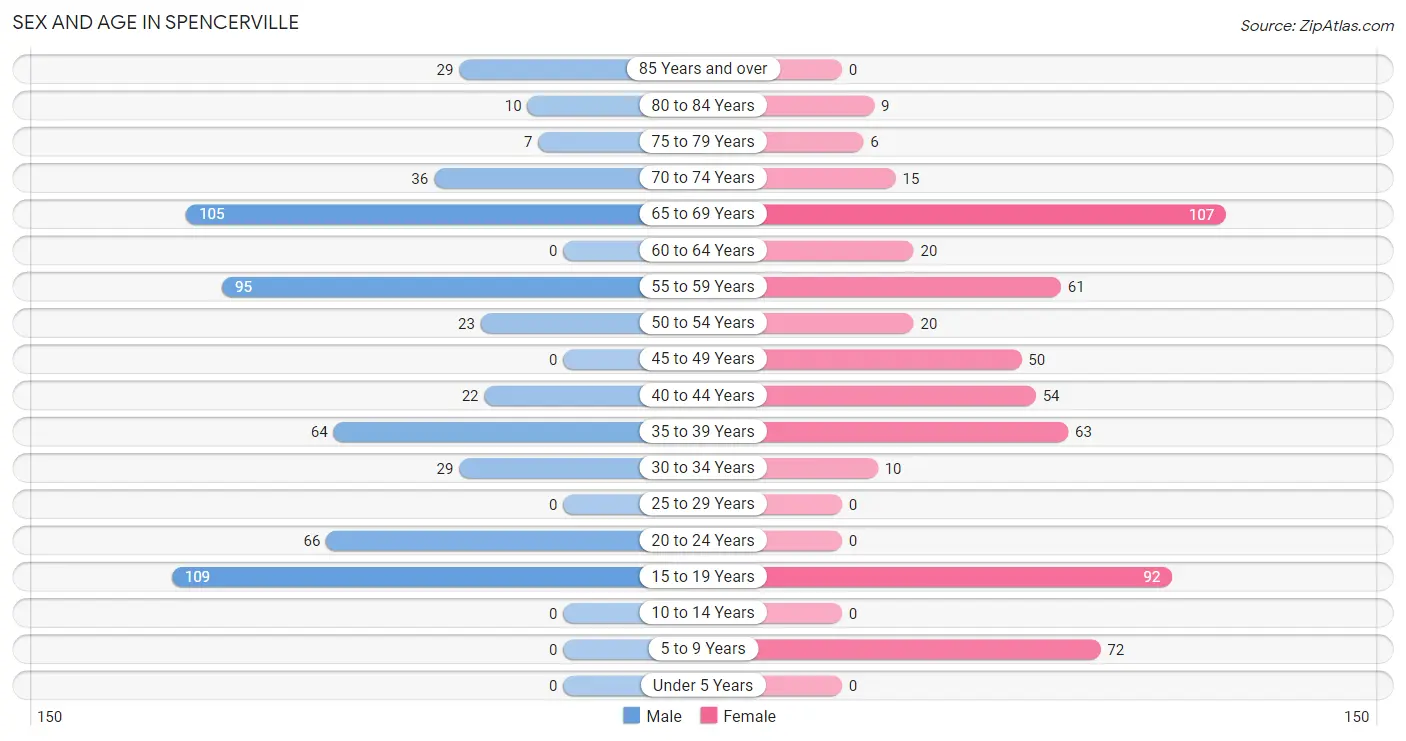
| Age Bracket | Male | Female |
| Under 5 Years | 0 (0.0%) | 0 (0.0%) |
| 5 to 9 Years | 0 (0.0%) | 72 (12.4%) |
| 10 to 14 Years | 0 (0.0%) | 0 (0.0%) |
| 15 to 19 Years | 109 (18.3%) | 92 (15.9%) |
| 20 to 24 Years | 66 (11.1%) | 0 (0.0%) |
| 25 to 29 Years | 0 (0.0%) | 0 (0.0%) |
| 30 to 34 Years | 29 (4.9%) | 10 (1.7%) |
| 35 to 39 Years | 64 (10.8%) | 63 (10.9%) |
| 40 to 44 Years | 22 (3.7%) | 54 (9.3%) |
| 45 to 49 Years | 0 (0.0%) | 50 (8.6%) |
| 50 to 54 Years | 23 (3.9%) | 20 (3.5%) |
| 55 to 59 Years | 95 (16.0%) | 61 (10.5%) |
| 60 to 64 Years | 0 (0.0%) | 20 (3.5%) |
| 65 to 69 Years | 105 (17.6%) | 107 (18.5%) |
| 70 to 74 Years | 36 (6.0%) | 15 (2.6%) |
| 75 to 79 Years | 7 (1.2%) | 6 (1.0%) |
| 80 to 84 Years | 10 (1.7%) | 9 (1.5%) |
| 85 Years and over | 29 (4.9%) | 0 (0.0%) |
| Total | 595 (100.0%) | 579 (100.0%) |
Families and Households in Spencerville
Median Family Size in Spencerville
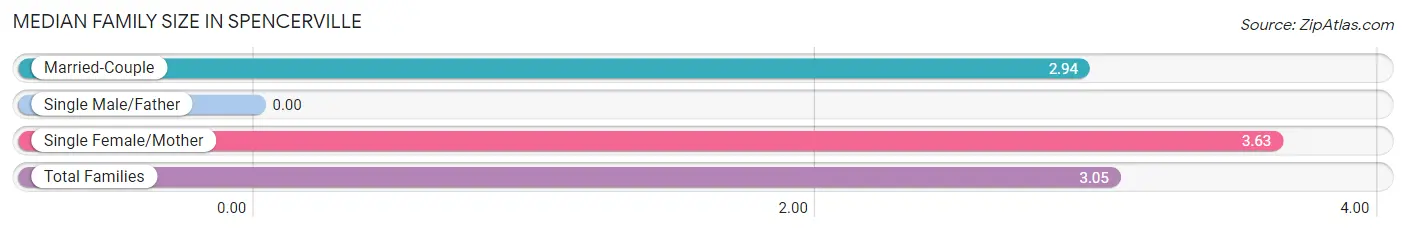
| Family Type | # Families | Family Size |
| Married-Couple | 263 (84.6%) | 2.94 |
| Single Male/Father | 0 (0.0%) | - |
| Single Female/Mother | 48 (15.4%) | 3.63 |
| Total Families | 311 (100.0%) | 3.05 |
Median Household Size in Spencerville
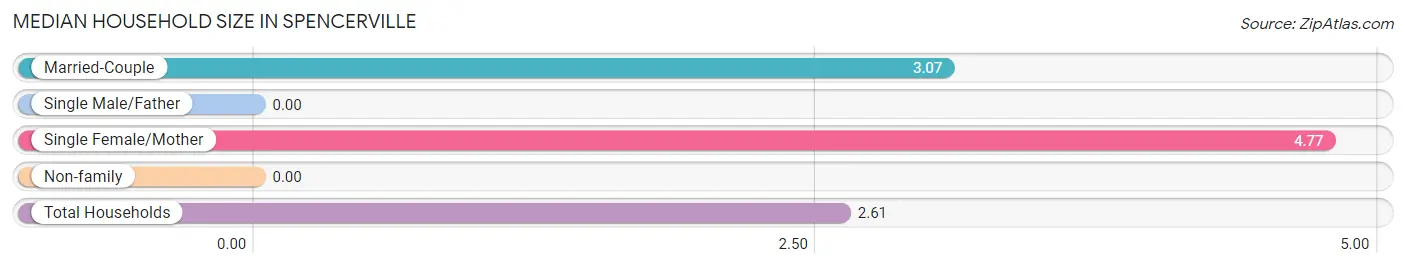
| Household Type | # Households | Household Size |
| Married-Couple | 263 (58.6%) | 3.07 |
| Single Male/Father | 0 (0.0%) | - |
| Single Female/Mother | 48 (10.7%) | 4.77 |
| Non-family | 138 (30.7%) | - |
| Total Households | 449 (100.0%) | 2.61 |
Household Size by Marriage Status in Spencerville
Out of a total of 449 households in Spencerville, 311 (69.3%) are family households, while 138 (30.7%) are nonfamily households. The most numerous type of family households are 2-person households, comprising 139, and the most common type of nonfamily households are 1-person households, comprising 138.
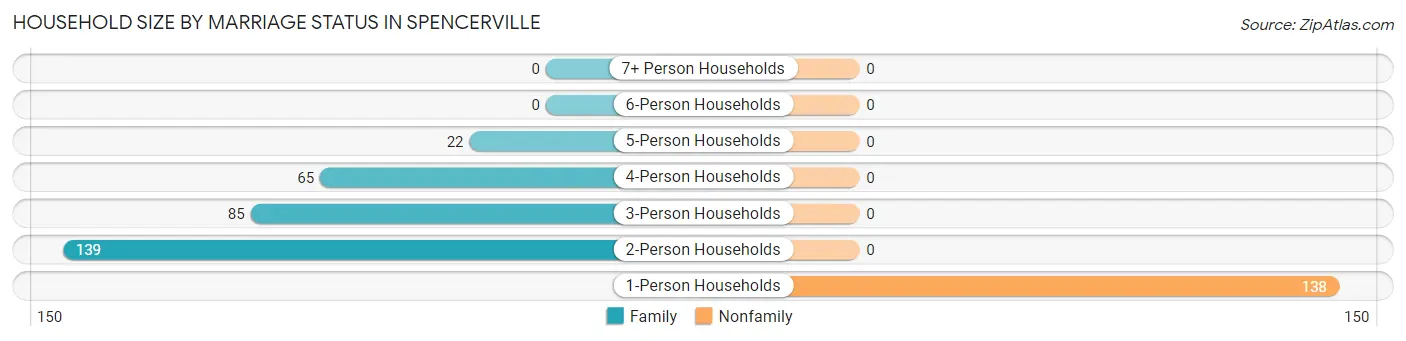
| Household Size | Family Households | Nonfamily Households |
| 1-Person Households | - | 138 (30.7%) |
| 2-Person Households | 139 (31.0%) | 0 (0.0%) |
| 3-Person Households | 85 (18.9%) | 0 (0.0%) |
| 4-Person Households | 65 (14.5%) | 0 (0.0%) |
| 5-Person Households | 22 (4.9%) | 0 (0.0%) |
| 6-Person Households | 0 (0.0%) | 0 (0.0%) |
| 7+ Person Households | 0 (0.0%) | 0 (0.0%) |
| Total | 311 (69.3%) | 138 (30.7%) |
Female Fertility in Spencerville
Fertility by Age in Spencerville
| Age Bracket | Women with Births | Births / 1,000 Women |
| 15 to 19 years | 0 (0.0%) | 0.0 |
| 20 to 34 years | 0 (0.0%) | 0.0 |
| 35 to 50 years | 0 (0.0%) | 0.0 |
| Total | 0 (0.0%) | 0.0 |
Fertility by Age by Marriage Status in Spencerville
| Age Bracket | Married | Unmarried |
| 15 to 19 years | 0 (0.0%) | 0 (0.0%) |
| 20 to 34 years | 0 (0.0%) | 0 (0.0%) |
| 35 to 50 years | 0 (0.0%) | 0 (0.0%) |
| Total | 0 (0.0%) | 0 (0.0%) |
Fertility by Education in Spencerville
| Educational Attainment | Women with Births | Births / 1,000 Women |
| Less than High School | 0 (0.0%) | 0.0 |
| High School Diploma | 0 (0.0%) | 0.0 |
| College or Associate's Degree | 0 (0.0%) | 0.0 |
| Bachelor's Degree | 0 (0.0%) | 0.0 |
| Graduate Degree | 0 (0.0%) | 0.0 |
| Total | 0 (0.0%) | 0.0 |
Fertility by Education by Marriage Status in Spencerville
| Educational Attainment | Married | Unmarried |
| Less than High School | 0 (0.0%) | 0 (0.0%) |
| High School Diploma | 0 (0.0%) | 0 (0.0%) |
| College or Associate's Degree | 0 (0.0%) | 0 (0.0%) |
| Bachelor's Degree | 0 (0.0%) | 0 (0.0%) |
| Graduate Degree | 0 (0.0%) | 0 (0.0%) |
| Total | 0 (0.0%) | 0 (0.0%) |
Employment Characteristics in Spencerville
Employment by Class of Employer in Spencerville
Among the 484 employed individuals in Spencerville, private company employees (292 | 60.3%), local government employees (61 | 12.6%), and self-employed (not incorporated) (50 | 10.3%) make up the most common classes of employment.
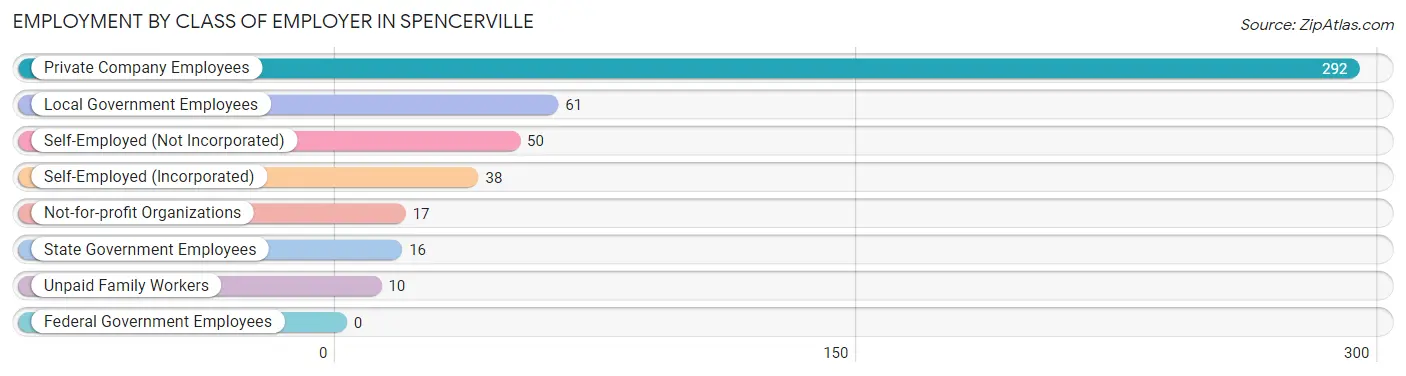
| Employer Class | # Employees | % Employees |
| Private Company Employees | 292 | 60.3% |
| Self-Employed (Incorporated) | 38 | 7.9% |
| Self-Employed (Not Incorporated) | 50 | 10.3% |
| Not-for-profit Organizations | 17 | 3.5% |
| Local Government Employees | 61 | 12.6% |
| State Government Employees | 16 | 3.3% |
| Federal Government Employees | 0 | 0.0% |
| Unpaid Family Workers | 10 | 2.1% |
| Total | 484 | 100.0% |
Employment Status by Age in Spencerville
According to the labor force statistics for Spencerville, out of the total population over 16 years of age (1,102), 45.3% or 499 individuals are in the labor force, with 3.0% or 15 of them unemployed. The age group with the highest labor force participation rate is 60 to 64 years, with 100.0% or 20 individuals in the labor force. Within the labor force, the 65 to 74 years age range has the highest percentage of unemployed individuals, with 38.5% or 10 of them being unemployed.
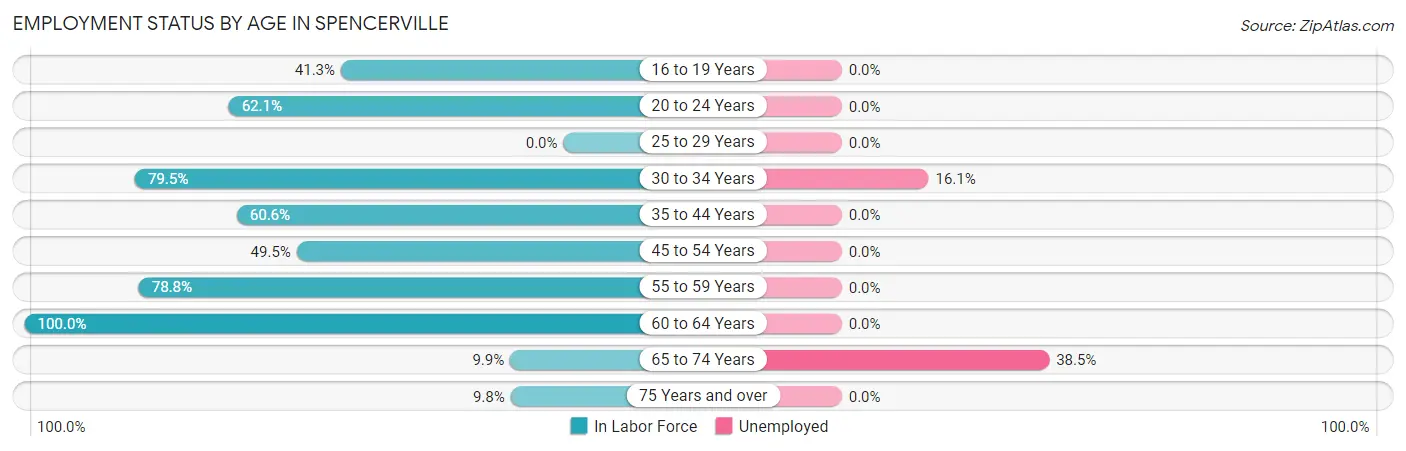
| Age Bracket | In Labor Force | Unemployed |
| 16 to 19 Years | 83 (41.3%) | 0 (0.0%) |
| 20 to 24 Years | 41 (62.1%) | 0 (0.0%) |
| 25 to 29 Years | 0 (0.0%) | 0 (0.0%) |
| 30 to 34 Years | 31 (79.5%) | 5 (16.1%) |
| 35 to 44 Years | 123 (60.6%) | 0 (0.0%) |
| 45 to 54 Years | 46 (49.5%) | 0 (0.0%) |
| 55 to 59 Years | 123 (78.8%) | 0 (0.0%) |
| 60 to 64 Years | 20 (100.0%) | 0 (0.0%) |
| 65 to 74 Years | 26 (9.9%) | 10 (38.5%) |
| 75 Years and over | 6 (9.8%) | 0 (0.0%) |
| Total | 499 (45.3%) | 15 (3.0%) |
Employment Status by Educational Attainment in Spencerville
According to labor force statistics for Spencerville, 67.1% of individuals (343) out of the total population between 25 and 64 years of age (511) are in the labor force, with 1.5% or 5 of them being unemployed. The group with the highest labor force participation rate are those with the educational attainment of college / associate degree, with 72.1% or 178 individuals in the labor force. Within the labor force, individuals with bachelor's degree or higher education have the highest percentage of unemployment, with 8.6% or 5 of them being unemployed.
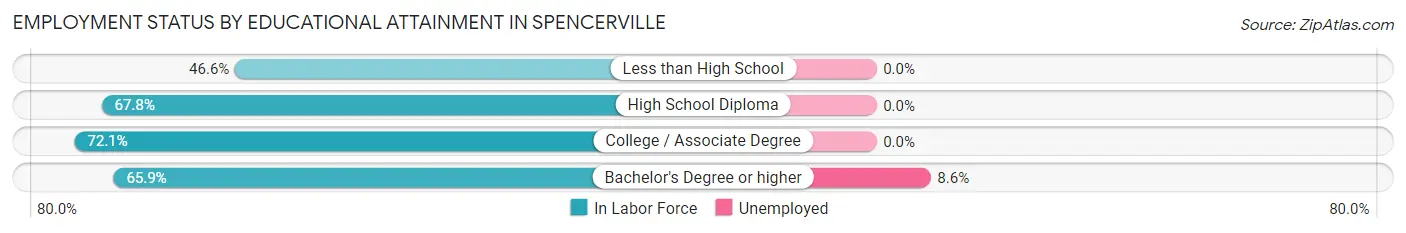
| Educational Attainment | In Labor Force | Unemployed |
| Less than High School | 27 (46.6%) | 0 (0.0%) |
| High School Diploma | 80 (67.8%) | 0 (0.0%) |
| College / Associate Degree | 178 (72.1%) | 0 (0.0%) |
| Bachelor's Degree or higher | 58 (65.9%) | 8 (8.6%) |
| Total | 343 (67.1%) | 8 (1.5%) |
Employment Occupations by Sex in Spencerville
Management, Business, Science and Arts Occupations
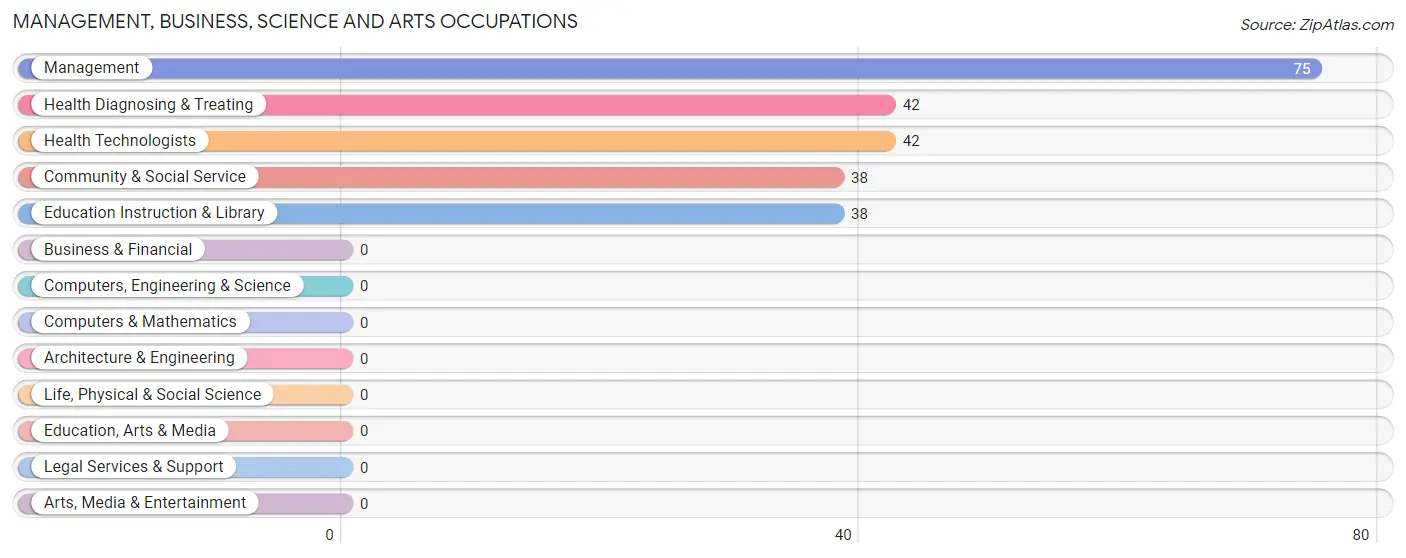
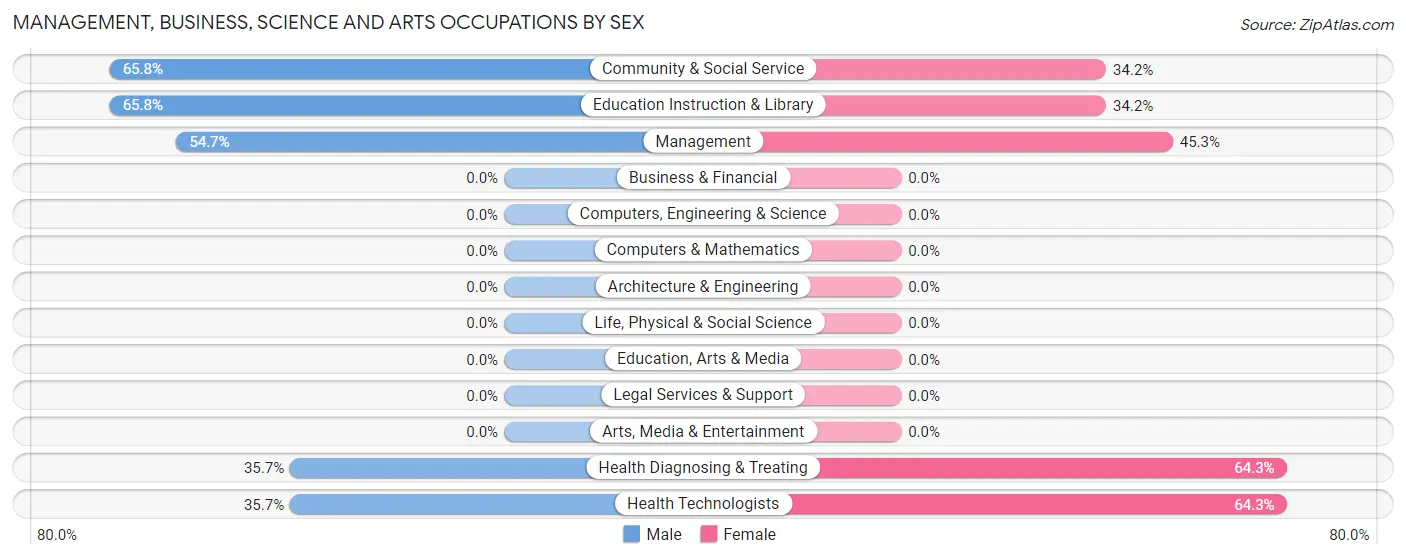
The most common Management, Business, Science and Arts occupations in Spencerville are Management (75 | 15.5%), Health Diagnosing & Treating (42 | 8.7%), Health Technologists (42 | 8.7%), Community & Social Service (38 | 7.9%), and Education Instruction & Library (38 | 7.9%).
Management, Business, Science and Arts Occupations by Sex
Within the Management, Business, Science and Arts occupations in Spencerville, the most male-oriented occupations are Community & Social Service (65.8%), Education Instruction & Library (65.8%), and Management (54.7%), while the most female-oriented occupations are Health Diagnosing & Treating (64.3%), Health Technologists (64.3%), and Management (45.3%).
| Occupation | Male | Female |
| Management | 41 (54.7%) | 34 (45.3%) |
| Business & Financial | 0 (0.0%) | 0 (0.0%) |
| Computers, Engineering & Science | 0 (0.0%) | 0 (0.0%) |
| Computers & Mathematics | 0 (0.0%) | 0 (0.0%) |
| Architecture & Engineering | 0 (0.0%) | 0 (0.0%) |
| Life, Physical & Social Science | 0 (0.0%) | 0 (0.0%) |
| Community & Social Service | 25 (65.8%) | 13 (34.2%) |
| Education, Arts & Media | 0 (0.0%) | 0 (0.0%) |
| Legal Services & Support | 0 (0.0%) | 0 (0.0%) |
| Education Instruction & Library | 25 (65.8%) | 13 (34.2%) |
| Arts, Media & Entertainment | 0 (0.0%) | 0 (0.0%) |
| Health Diagnosing & Treating | 15 (35.7%) | 27 (64.3%) |
| Health Technologists | 15 (35.7%) | 27 (64.3%) |
| Total (Category) | 81 (52.3%) | 74 (47.7%) |
| Total (Overall) | 258 (53.3%) | 226 (46.7%) |
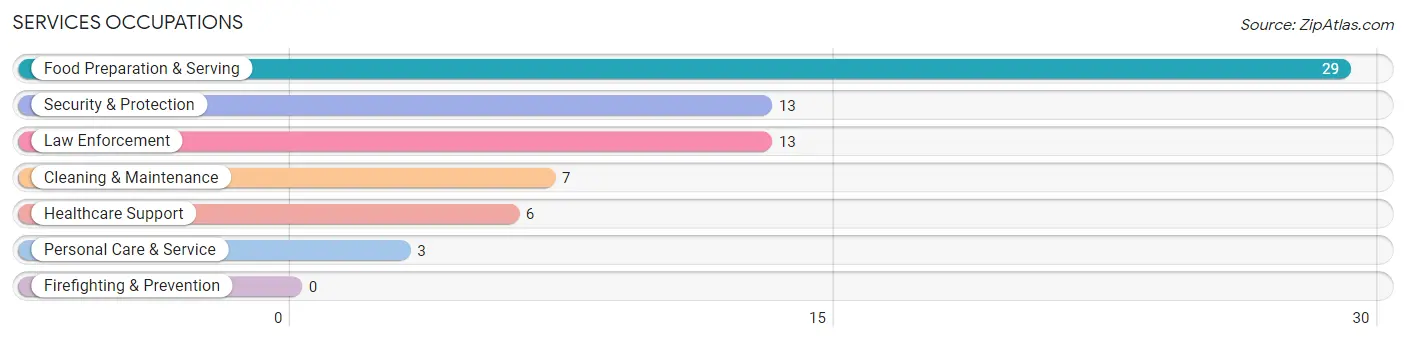
Services Occupations
The most common Services occupations in Spencerville are Food Preparation & Serving (29 | 6.0%), Security & Protection (13 | 2.7%), Law Enforcement (13 | 2.7%), Cleaning & Maintenance (7 | 1.5%), and Healthcare Support (6 | 1.2%).
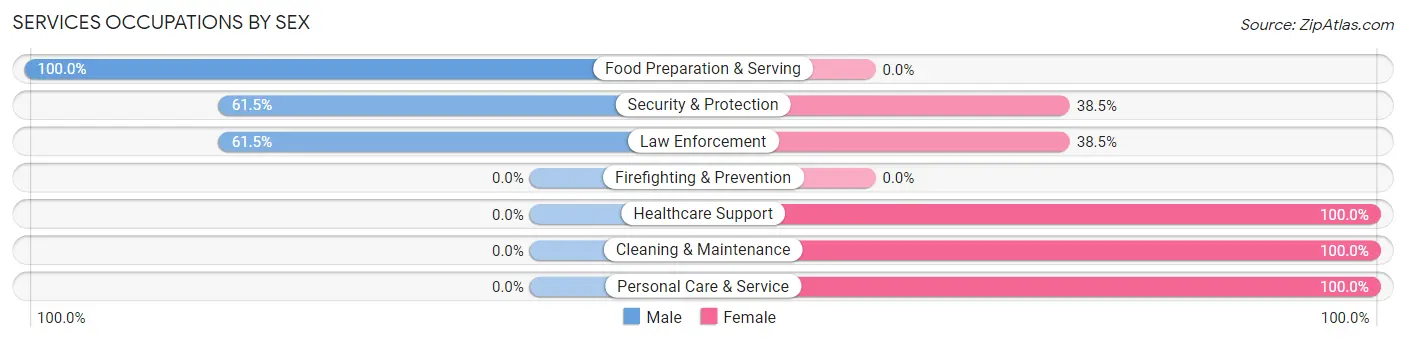
Services Occupations by Sex
Within the Services occupations in Spencerville, the most male-oriented occupations are Food Preparation & Serving (100.0%), Security & Protection (61.5%), and Law Enforcement (61.5%), while the most female-oriented occupations are Healthcare Support (100.0%), Cleaning & Maintenance (100.0%), and Personal Care & Service (100.0%).
| Occupation | Male | Female |
| Healthcare Support | 0 (0.0%) | 6 (100.0%) |
| Security & Protection | 8 (61.5%) | 5 (38.5%) |
| Firefighting & Prevention | 0 (0.0%) | 0 (0.0%) |
| Law Enforcement | 8 (61.5%) | 5 (38.5%) |
| Food Preparation & Serving | 29 (100.0%) | 0 (0.0%) |
| Cleaning & Maintenance | 0 (0.0%) | 7 (100.0%) |
| Personal Care & Service | 0 (0.0%) | 3 (100.0%) |
| Total (Category) | 37 (63.8%) | 21 (36.2%) |
| Total (Overall) | 258 (53.3%) | 226 (46.7%) |
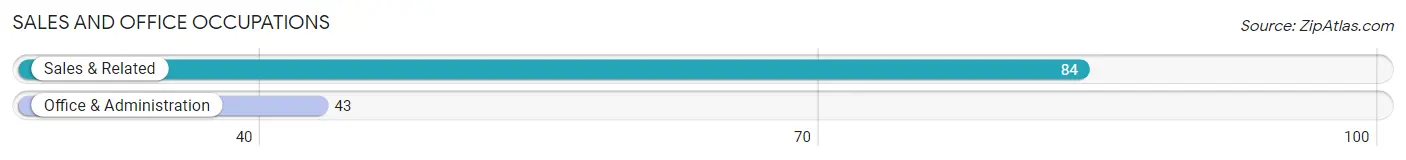
Sales and Office Occupations
The most common Sales and Office occupations in Spencerville are Sales & Related (84 | 17.4%), and Office & Administration (43 | 8.9%).
Sales and Office Occupations by Sex
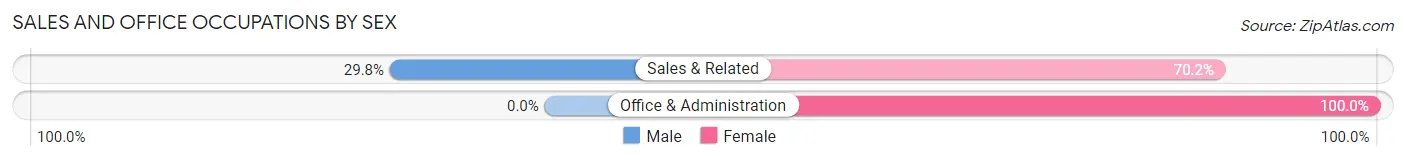
| Occupation | Male | Female |
| Sales & Related | 25 (29.8%) | 59 (70.2%) |
| Office & Administration | 0 (0.0%) | 43 (100.0%) |
| Total (Category) | 25 (19.7%) | 102 (80.3%) |
| Total (Overall) | 258 (53.3%) | 226 (46.7%) |
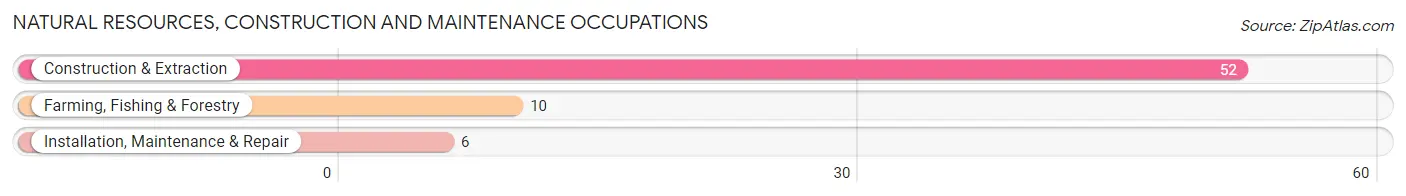
Natural Resources, Construction and Maintenance Occupations
The most common Natural Resources, Construction and Maintenance occupations in Spencerville are Construction & Extraction (52 | 10.7%), Farming, Fishing & Forestry (10 | 2.1%), and Installation, Maintenance & Repair (6 | 1.2%).
Natural Resources, Construction and Maintenance Occupations by Sex
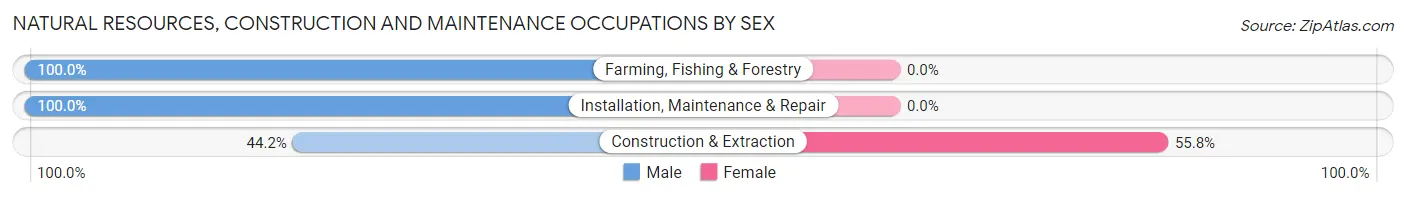
| Occupation | Male | Female |
| Farming, Fishing & Forestry | 10 (100.0%) | 0 (0.0%) |
| Construction & Extraction | 23 (44.2%) | 29 (55.8%) |
| Installation, Maintenance & Repair | 6 (100.0%) | 0 (0.0%) |
| Total (Category) | 39 (57.4%) | 29 (42.6%) |
| Total (Overall) | 258 (53.3%) | 226 (46.7%) |
Production, Transportation and Moving Occupations
The most common Production, Transportation and Moving occupations in Spencerville are Transportation (50 | 10.3%), Production (21 | 4.3%), and Material Moving (5 | 1.0%).
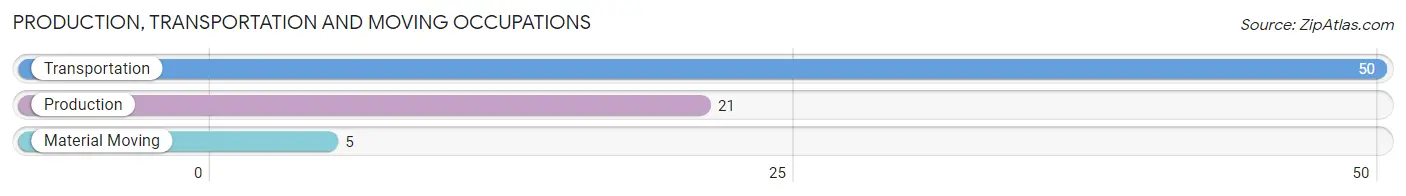
Production, Transportation and Moving Occupations by Sex
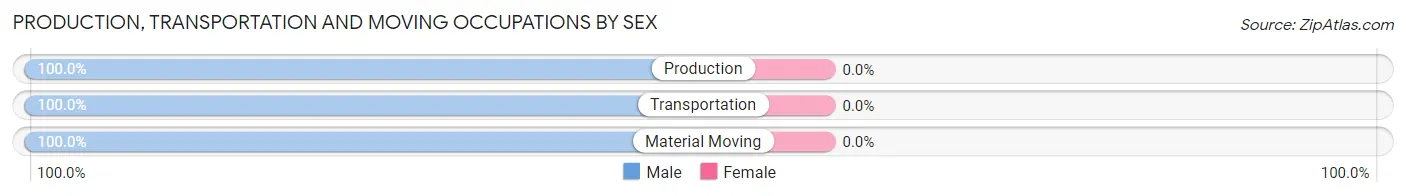
| Occupation | Male | Female |
| Production | 21 (100.0%) | 0 (0.0%) |
| Transportation | 50 (100.0%) | 0 (0.0%) |
| Material Moving | 5 (100.0%) | 0 (0.0%) |
| Total (Category) | 76 (100.0%) | 0 (0.0%) |
| Total (Overall) | 258 (53.3%) | 226 (46.7%) |
Employment Industries by Sex in Spencerville
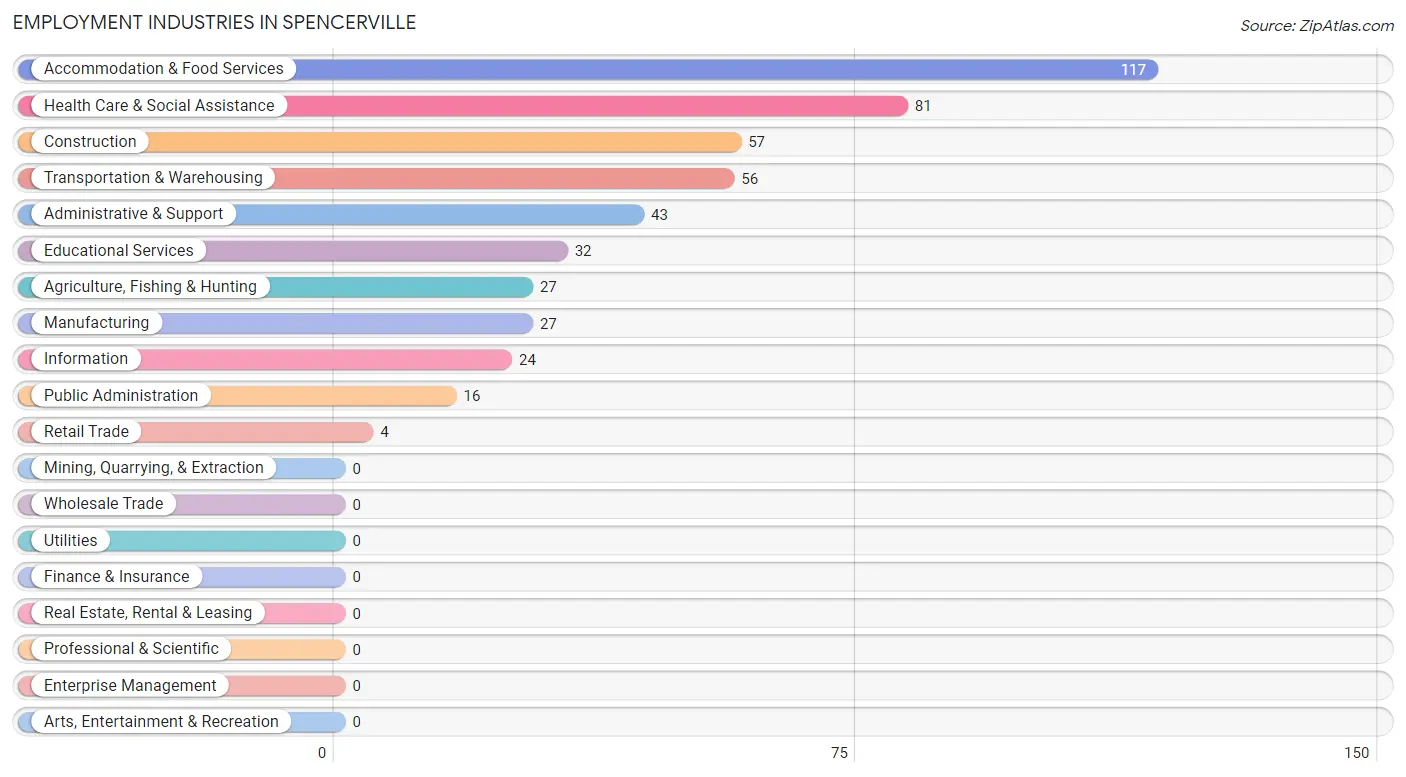
Employment Industries in Spencerville
The major employment industries in Spencerville include Accommodation & Food Services (117 | 24.2%), Health Care & Social Assistance (81 | 16.7%), Construction (57 | 11.8%), Transportation & Warehousing (56 | 11.6%), and Administrative & Support (43 | 8.9%).
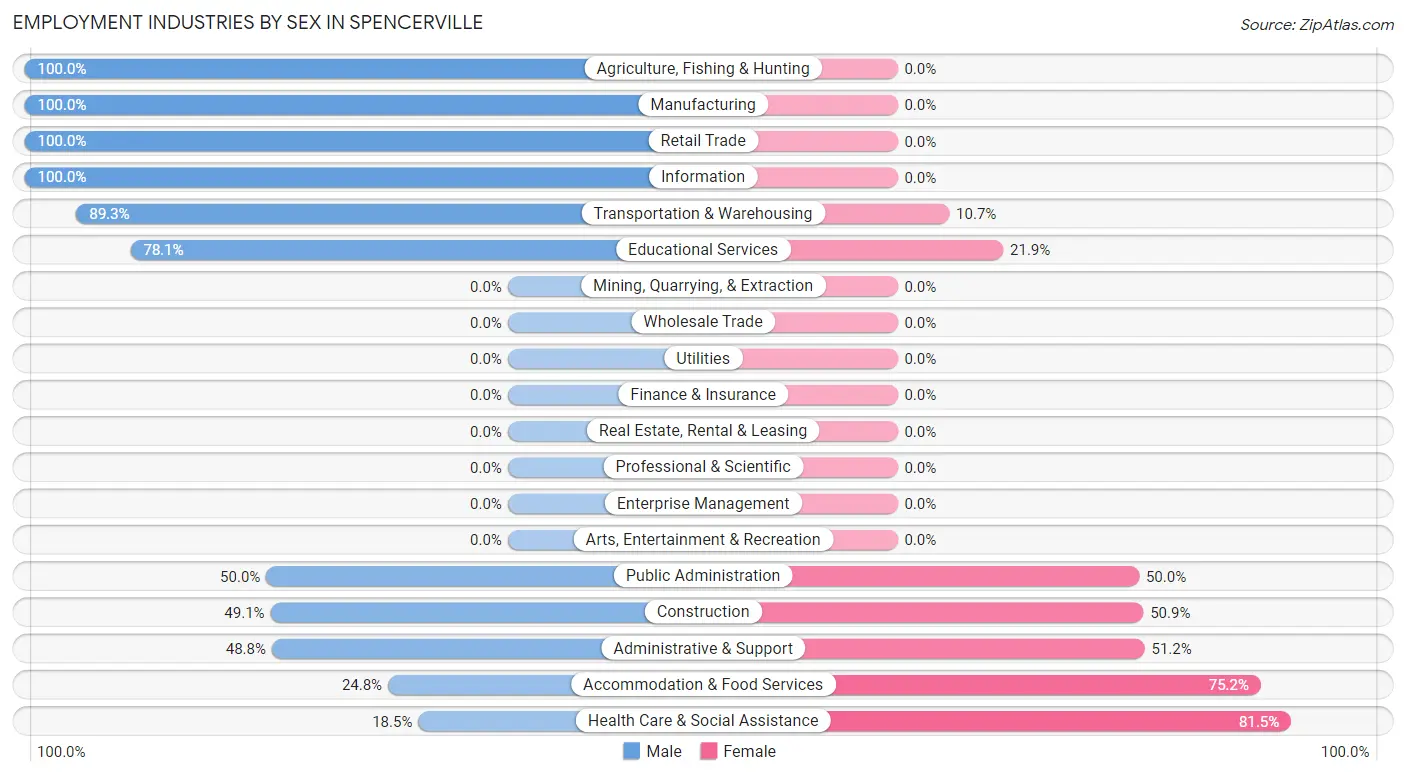
Employment Industries by Sex in Spencerville
The Spencerville industries that see more men than women are Agriculture, Fishing & Hunting (100.0%), Manufacturing (100.0%), and Retail Trade (100.0%), whereas the industries that tend to have a higher number of women are Health Care & Social Assistance (81.5%), Accommodation & Food Services (75.2%), and Administrative & Support (51.2%).
| Industry | Male | Female |
| Agriculture, Fishing & Hunting | 27 (100.0%) | 0 (0.0%) |
| Mining, Quarrying, & Extraction | 0 (0.0%) | 0 (0.0%) |
| Construction | 28 (49.1%) | 29 (50.9%) |
| Manufacturing | 27 (100.0%) | 0 (0.0%) |
| Wholesale Trade | 0 (0.0%) | 0 (0.0%) |
| Retail Trade | 4 (100.0%) | 0 (0.0%) |
| Transportation & Warehousing | 50 (89.3%) | 6 (10.7%) |
| Utilities | 0 (0.0%) | 0 (0.0%) |
| Information | 24 (100.0%) | 0 (0.0%) |
| Finance & Insurance | 0 (0.0%) | 0 (0.0%) |
| Real Estate, Rental & Leasing | 0 (0.0%) | 0 (0.0%) |
| Professional & Scientific | 0 (0.0%) | 0 (0.0%) |
| Enterprise Management | 0 (0.0%) | 0 (0.0%) |
| Administrative & Support | 21 (48.8%) | 22 (51.2%) |
| Educational Services | 25 (78.1%) | 7 (21.9%) |
| Health Care & Social Assistance | 15 (18.5%) | 66 (81.5%) |
| Arts, Entertainment & Recreation | 0 (0.0%) | 0 (0.0%) |
| Accommodation & Food Services | 29 (24.8%) | 88 (75.2%) |
| Public Administration | 8 (50.0%) | 8 (50.0%) |
| Total | 258 (53.3%) | 226 (46.7%) |
Education in Spencerville
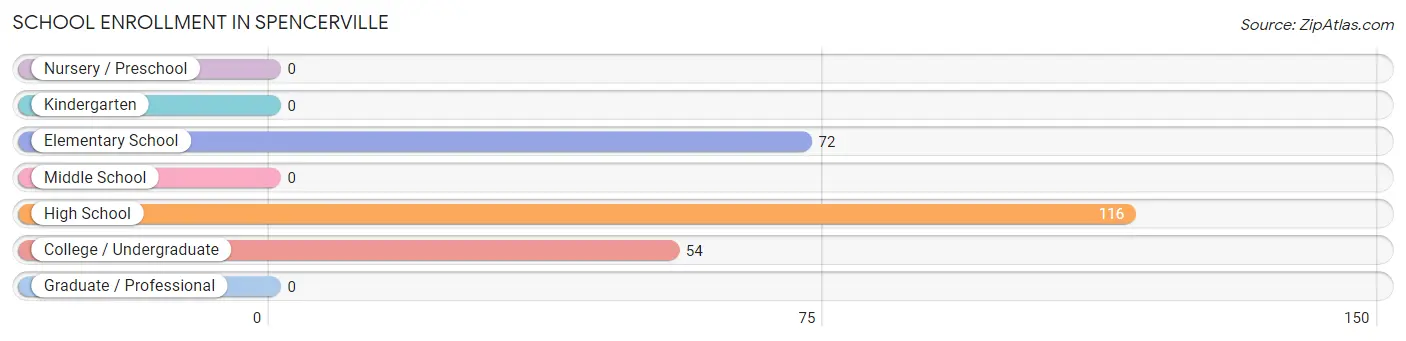
School Enrollment in Spencerville
The most common levels of schooling among the 242 students in Spencerville are high school (116 | 47.9%), elementary school (72 | 29.7%), and college / undergraduate (54 | 22.3%).
| School Level | # Students | % Students |
| Nursery / Preschool | 0 | 0.0% |
| Kindergarten | 0 | 0.0% |
| Elementary School | 72 | 29.7% |
| Middle School | 0 | 0.0% |
| High School | 116 | 47.9% |
| College / Undergraduate | 54 | 22.3% |
| Graduate / Professional | 0 | 0.0% |
| Total | 242 | 100.0% |
School Enrollment by Age by Funding Source in Spencerville
Out of a total of 242 students who are enrolled in schools in Spencerville, 72 (29.8%) attend a private institution, while the remaining 170 (70.2%) are enrolled in public schools. The age group of 5 to 9 year old has the highest likelihood of being enrolled in private schools, with 72 (100.0% in the age bracket) enrolled. Conversely, the age group of 15 to 17 year olds has the lowest likelihood of being enrolled in a private school, with 87 (100.0% in the age bracket) attending a public institution.
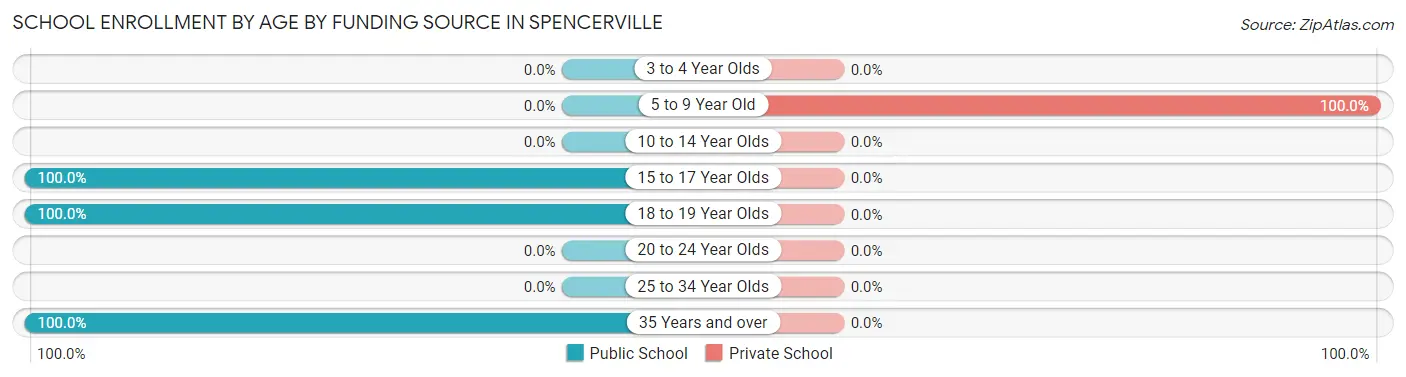
| Age Bracket | Public School | Private School |
| 3 to 4 Year Olds | 0 (0.0%) | 0 (0.0%) |
| 5 to 9 Year Old | 0 (0.0%) | 72 (100.0%) |
| 10 to 14 Year Olds | 0 (0.0%) | 0 (0.0%) |
| 15 to 17 Year Olds | 87 (100.0%) | 0 (0.0%) |
| 18 to 19 Year Olds | 60 (100.0%) | 0 (0.0%) |
| 20 to 24 Year Olds | 0 (0.0%) | 0 (0.0%) |
| 25 to 34 Year Olds | 0 (0.0%) | 0 (0.0%) |
| 35 Years and over | 23 (100.0%) | 0 (0.0%) |
| Total | 170 (70.2%) | 72 (29.8%) |
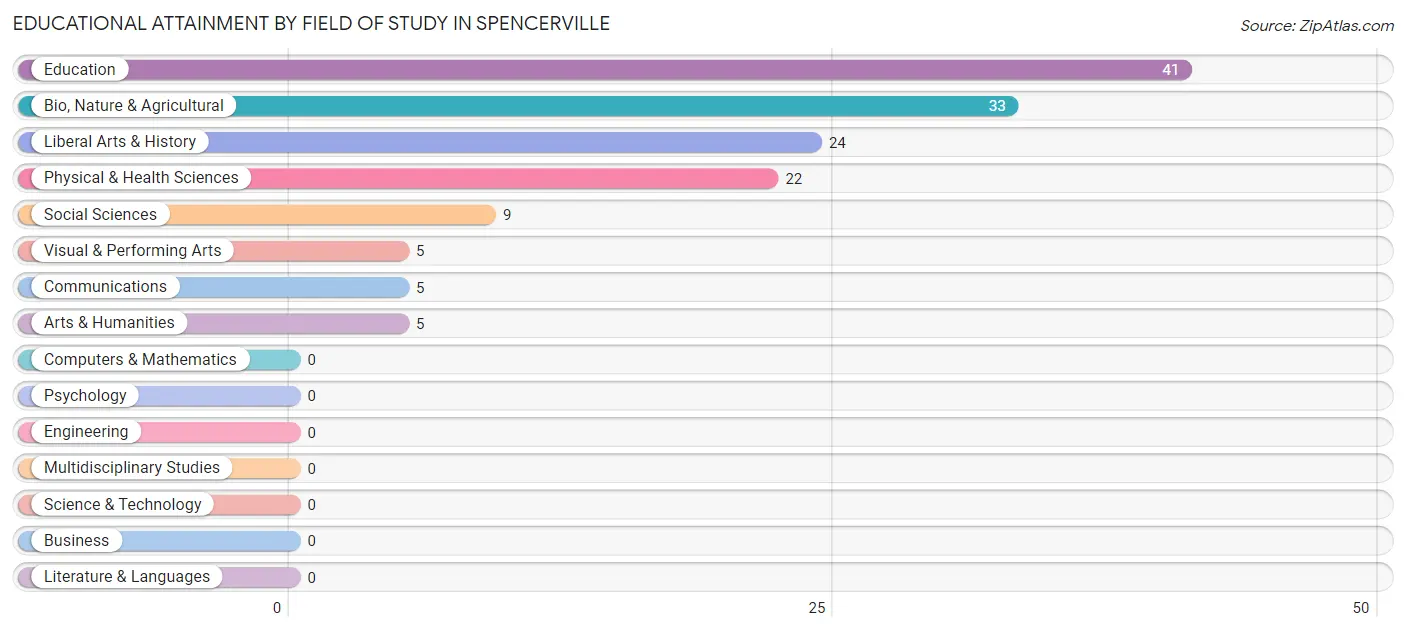
Educational Attainment by Field of Study in Spencerville
Education (41 | 28.5%), bio, nature & agricultural (33 | 22.9%), liberal arts & history (24 | 16.7%), physical & health sciences (22 | 15.3%), and social sciences (9 | 6.2%) are the most common fields of study among 144 individuals in Spencerville who have obtained a bachelor's degree or higher.
| Field of Study | # Graduates | % Graduates |
| Computers & Mathematics | 0 | 0.0% |
| Bio, Nature & Agricultural | 33 | 22.9% |
| Physical & Health Sciences | 22 | 15.3% |
| Psychology | 0 | 0.0% |
| Social Sciences | 9 | 6.2% |
| Engineering | 0 | 0.0% |
| Multidisciplinary Studies | 0 | 0.0% |
| Science & Technology | 0 | 0.0% |
| Business | 0 | 0.0% |
| Education | 41 | 28.5% |
| Literature & Languages | 0 | 0.0% |
| Liberal Arts & History | 24 | 16.7% |
| Visual & Performing Arts | 5 | 3.5% |
| Communications | 5 | 3.5% |
| Arts & Humanities | 5 | 3.5% |
| Total | 144 | 100.0% |
Transportation & Commute in Spencerville
Vehicle Availability by Sex in Spencerville
The most prevalent vehicle ownership categories in Spencerville are males with 3 vehicles (114, accounting for 44.2%) and females with 3 vehicles (87, making up 50.4%).
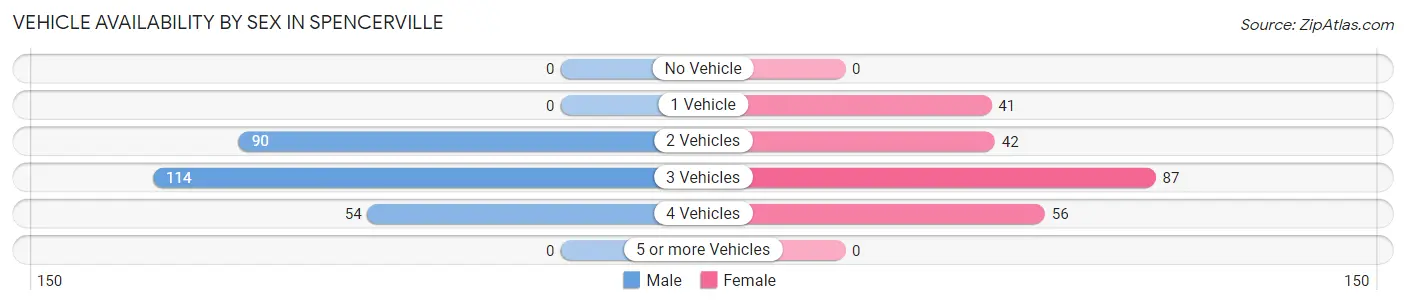
| Vehicles Available | Male | Female |
| No Vehicle | 0 (0.0%) | 0 (0.0%) |
| 1 Vehicle | 0 (0.0%) | 41 (18.1%) |
| 2 Vehicles | 90 (34.9%) | 42 (18.6%) |
| 3 Vehicles | 114 (44.2%) | 87 (38.5%) |
| 4 Vehicles | 54 (20.9%) | 56 (24.8%) |
| 5 or more Vehicles | 0 (0.0%) | 0 (0.0%) |
| Total | 258 (100.0%) | 226 (100.0%) |
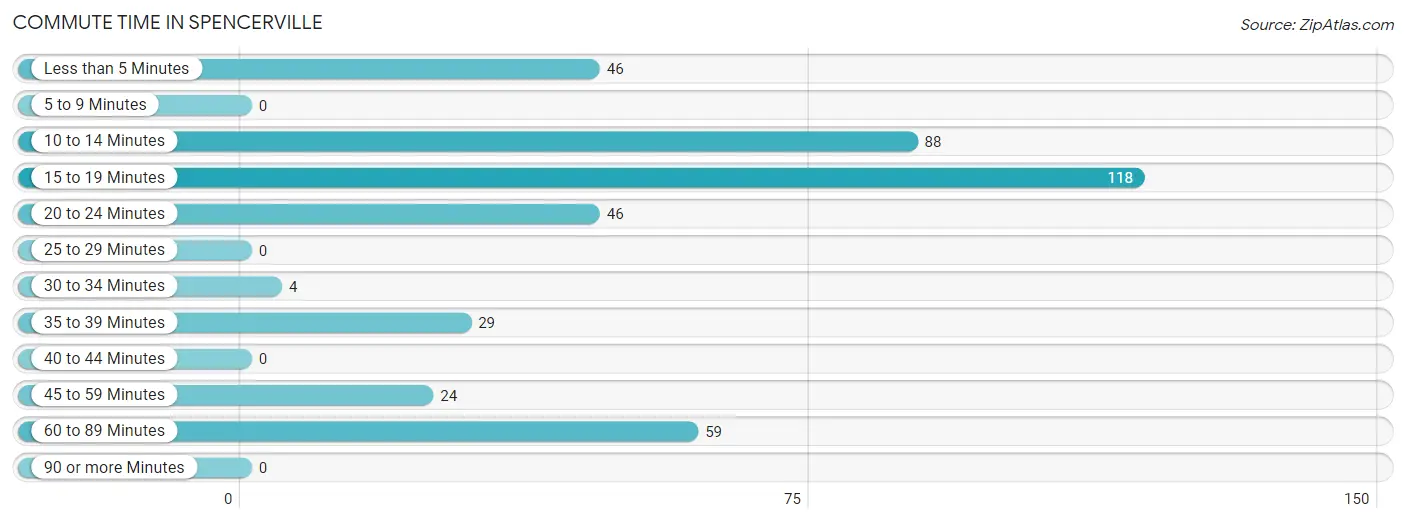
Commute Time in Spencerville
The most frequently occuring commute durations in Spencerville are 15 to 19 minutes (118 commuters, 28.5%), 10 to 14 minutes (88 commuters, 21.3%), and 60 to 89 minutes (59 commuters, 14.2%).
| Commute Time | # Commuters | % Commuters |
| Less than 5 Minutes | 46 | 11.1% |
| 5 to 9 Minutes | 0 | 0.0% |
| 10 to 14 Minutes | 88 | 21.3% |
| 15 to 19 Minutes | 118 | 28.5% |
| 20 to 24 Minutes | 46 | 11.1% |
| 25 to 29 Minutes | 0 | 0.0% |
| 30 to 34 Minutes | 4 | 1.0% |
| 35 to 39 Minutes | 29 | 7.0% |
| 40 to 44 Minutes | 0 | 0.0% |
| 45 to 59 Minutes | 24 | 5.8% |
| 60 to 89 Minutes | 59 | 14.2% |
| 90 or more Minutes | 0 | 0.0% |
Commute Time by Sex in Spencerville
The most common commute times in Spencerville are 10 to 14 minutes (59 commuters, 28.4%) for males and 15 to 19 minutes (88 commuters, 42.7%) for females.
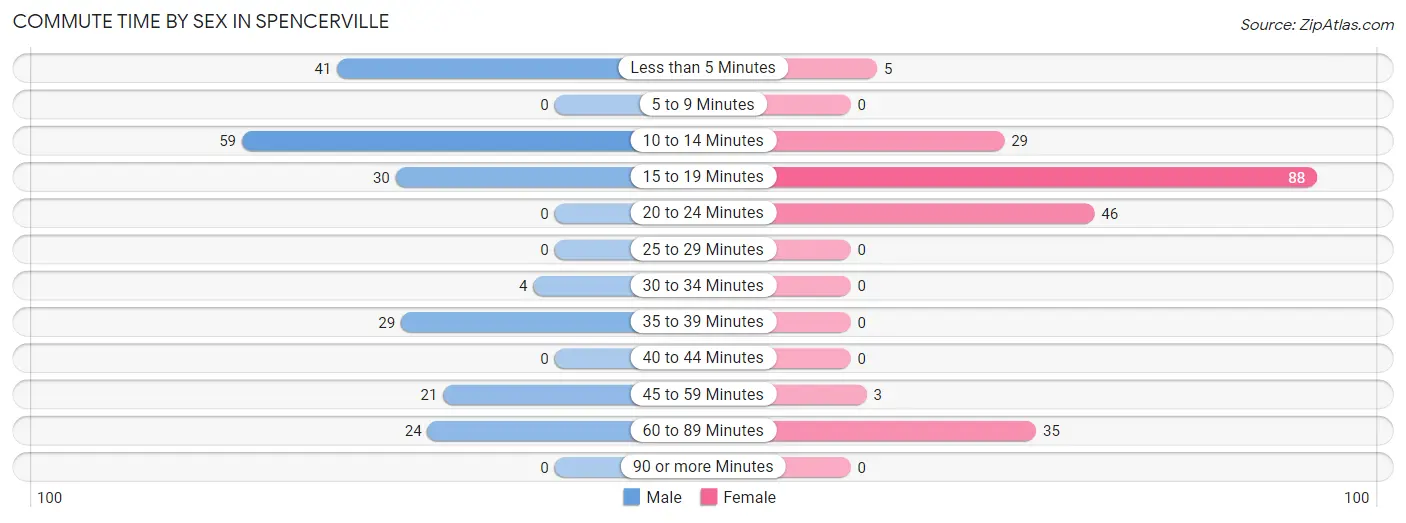
| Commute Time | Male | Female |
| Less than 5 Minutes | 41 (19.7%) | 5 (2.4%) |
| 5 to 9 Minutes | 0 (0.0%) | 0 (0.0%) |
| 10 to 14 Minutes | 59 (28.4%) | 29 (14.1%) |
| 15 to 19 Minutes | 30 (14.4%) | 88 (42.7%) |
| 20 to 24 Minutes | 0 (0.0%) | 46 (22.3%) |
| 25 to 29 Minutes | 0 (0.0%) | 0 (0.0%) |
| 30 to 34 Minutes | 4 (1.9%) | 0 (0.0%) |
| 35 to 39 Minutes | 29 (13.9%) | 0 (0.0%) |
| 40 to 44 Minutes | 0 (0.0%) | 0 (0.0%) |
| 45 to 59 Minutes | 21 (10.1%) | 3 (1.5%) |
| 60 to 89 Minutes | 24 (11.5%) | 35 (17.0%) |
| 90 or more Minutes | 0 (0.0%) | 0 (0.0%) |
Time of Departure to Work by Sex in Spencerville
The most frequent times of departure to work in Spencerville are 7:00 AM to 7:29 AM (48, 23.1%) for males and 6:30 AM to 6:59 AM (67, 32.5%) for females.
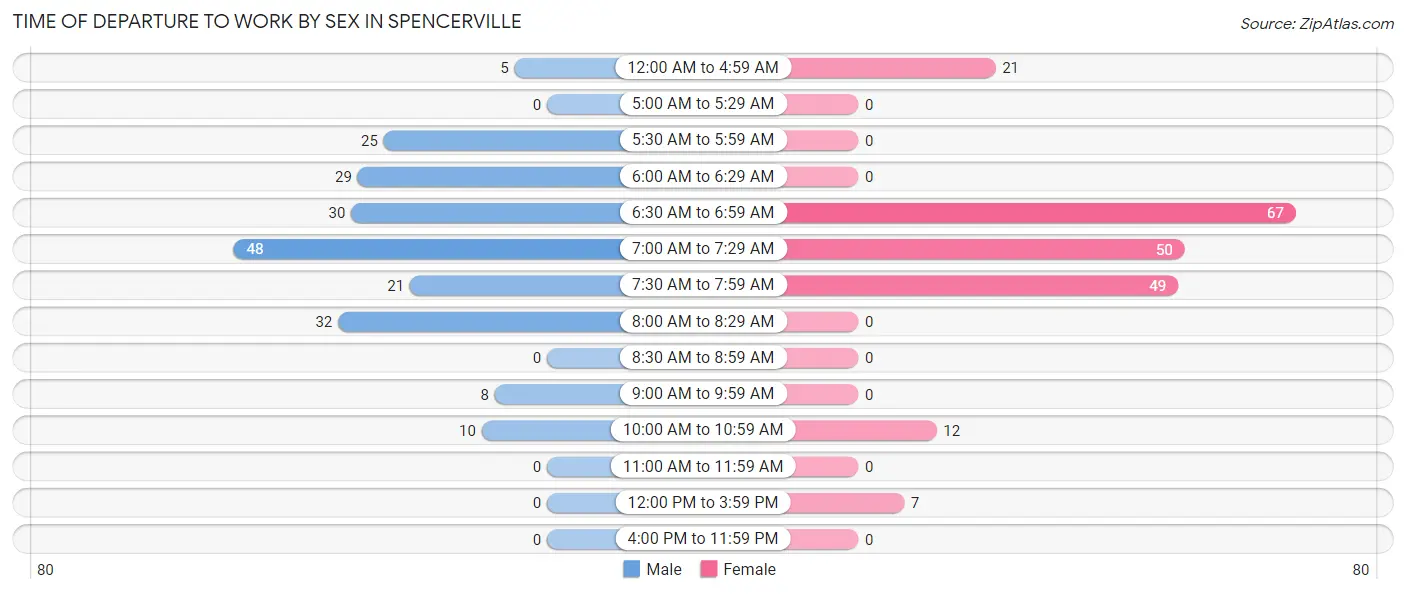
| Time of Departure | Male | Female |
| 12:00 AM to 4:59 AM | 5 (2.4%) | 21 (10.2%) |
| 5:00 AM to 5:29 AM | 0 (0.0%) | 0 (0.0%) |
| 5:30 AM to 5:59 AM | 25 (12.0%) | 0 (0.0%) |
| 6:00 AM to 6:29 AM | 29 (13.9%) | 0 (0.0%) |
| 6:30 AM to 6:59 AM | 30 (14.4%) | 67 (32.5%) |
| 7:00 AM to 7:29 AM | 48 (23.1%) | 50 (24.3%) |
| 7:30 AM to 7:59 AM | 21 (10.1%) | 49 (23.8%) |
| 8:00 AM to 8:29 AM | 32 (15.4%) | 0 (0.0%) |
| 8:30 AM to 8:59 AM | 0 (0.0%) | 0 (0.0%) |
| 9:00 AM to 9:59 AM | 8 (3.8%) | 0 (0.0%) |
| 10:00 AM to 10:59 AM | 10 (4.8%) | 12 (5.8%) |
| 11:00 AM to 11:59 AM | 0 (0.0%) | 0 (0.0%) |
| 12:00 PM to 3:59 PM | 0 (0.0%) | 7 (3.4%) |
| 4:00 PM to 11:59 PM | 0 (0.0%) | 0 (0.0%) |
| Total | 208 (100.0%) | 206 (100.0%) |
Housing Occupancy in Spencerville
Occupancy by Ownership in Spencerville
Of the total 449 dwellings in Spencerville, owner-occupied units account for 338 (75.3%), while renter-occupied units make up 111 (24.7%).
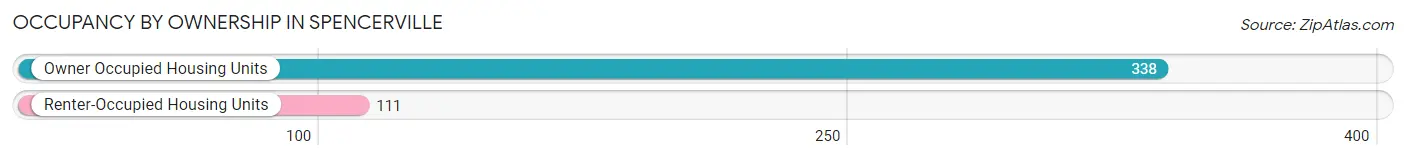
| Occupancy | # Housing Units | % Housing Units |
| Owner Occupied Housing Units | 338 | 75.3% |
| Renter-Occupied Housing Units | 111 | 24.7% |
| Total Occupied Housing Units | 449 | 100.0% |
Occupancy by Household Size in Spencerville
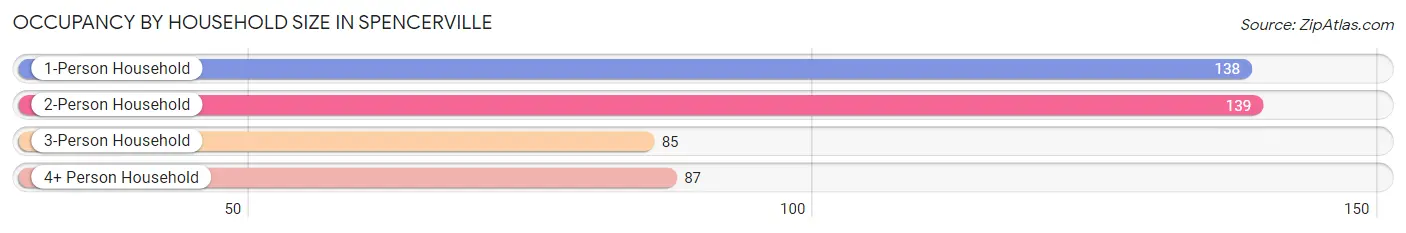
| Household Size | # Housing Units | % Housing Units |
| 1-Person Household | 138 | 30.7% |
| 2-Person Household | 139 | 31.0% |
| 3-Person Household | 85 | 18.9% |
| 4+ Person Household | 87 | 19.4% |
| Total Housing Units | 449 | 100.0% |
Occupancy by Ownership by Household Size in Spencerville
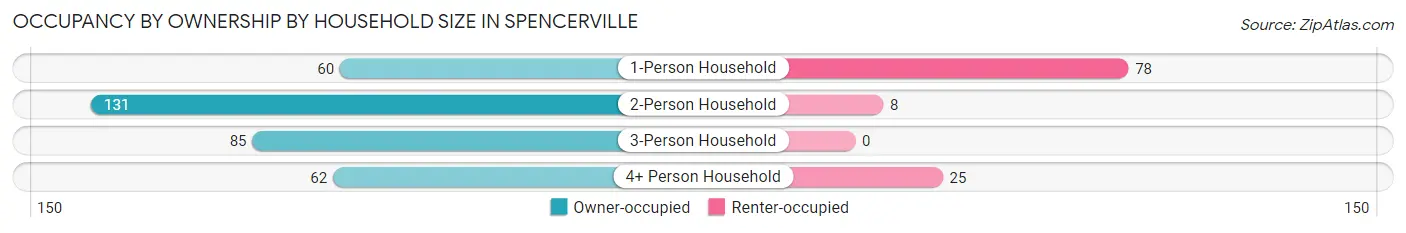
| Household Size | Owner-occupied | Renter-occupied |
| 1-Person Household | 60 (43.5%) | 78 (56.5%) |
| 2-Person Household | 131 (94.2%) | 8 (5.8%) |
| 3-Person Household | 85 (100.0%) | 0 (0.0%) |
| 4+ Person Household | 62 (71.3%) | 25 (28.7%) |
| Total Housing Units | 338 (75.3%) | 111 (24.7%) |
Occupancy by Educational Attainment in Spencerville
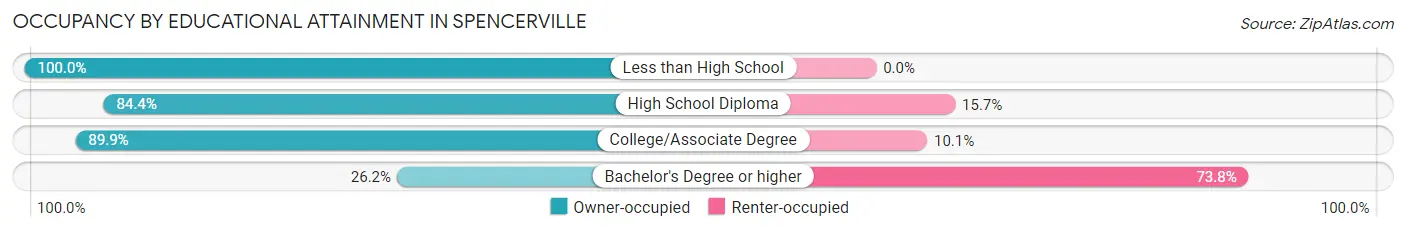
| Household Size | Owner-occupied | Renter-occupied |
| Less than High School | 6 (100.0%) | 0 (0.0%) |
| High School Diploma | 194 (84.4%) | 36 (15.7%) |
| College/Associate Degree | 116 (89.9%) | 13 (10.1%) |
| Bachelor's Degree or higher | 22 (26.2%) | 62 (73.8%) |
Occupancy by Age of Householder in Spencerville
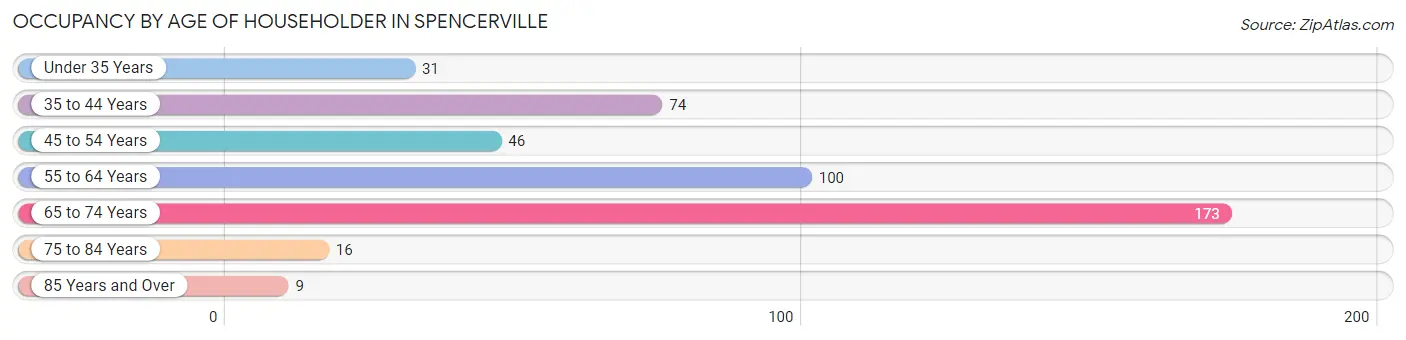
| Age Bracket | # Households | % Households |
| Under 35 Years | 31 | 6.9% |
| 35 to 44 Years | 74 | 16.5% |
| 45 to 54 Years | 46 | 10.2% |
| 55 to 64 Years | 100 | 22.3% |
| 65 to 74 Years | 173 | 38.5% |
| 75 to 84 Years | 16 | 3.6% |
| 85 Years and Over | 9 | 2.0% |
| Total | 449 | 100.0% |
Housing Finances in Spencerville
Median Income by Occupancy in Spencerville
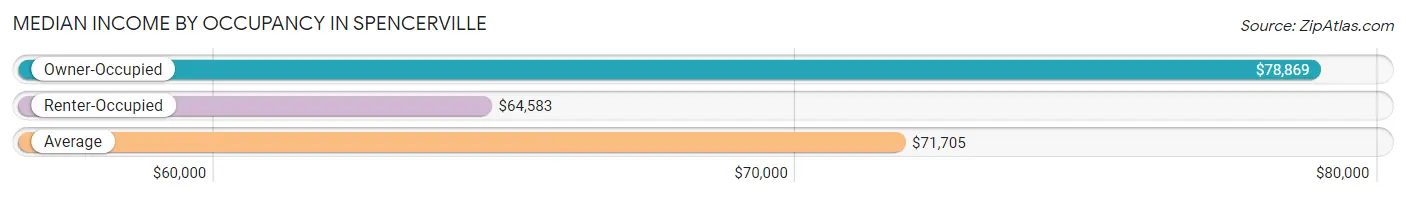
| Occupancy Type | # Households | Median Income |
| Owner-Occupied | 338 (75.3%) | $78,869 |
| Renter-Occupied | 111 (24.7%) | $64,583 |
| Average | 449 (100.0%) | $71,705 |
Occupancy by Householder Income Bracket in Spencerville
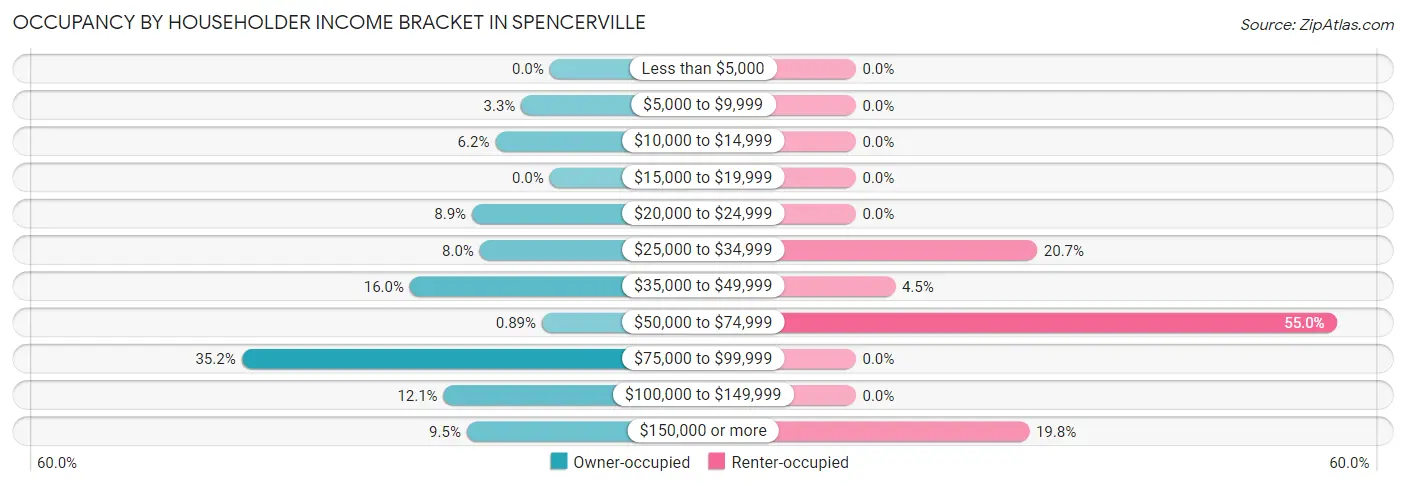
| Income Bracket | Owner-occupied | Renter-occupied |
| Less than $5,000 | 0 (0.0%) | 0 (0.0%) |
| $5,000 to $9,999 | 11 (3.3%) | 0 (0.0%) |
| $10,000 to $14,999 | 21 (6.2%) | 0 (0.0%) |
| $15,000 to $19,999 | 0 (0.0%) | 0 (0.0%) |
| $20,000 to $24,999 | 30 (8.9%) | 0 (0.0%) |
| $25,000 to $34,999 | 27 (8.0%) | 23 (20.7%) |
| $35,000 to $49,999 | 54 (16.0%) | 5 (4.5%) |
| $50,000 to $74,999 | 3 (0.9%) | 61 (54.9%) |
| $75,000 to $99,999 | 119 (35.2%) | 0 (0.0%) |
| $100,000 to $149,999 | 41 (12.1%) | 0 (0.0%) |
| $150,000 or more | 32 (9.5%) | 22 (19.8%) |
| Total | 338 (100.0%) | 111 (100.0%) |
Monthly Housing Cost Tiers in Spencerville
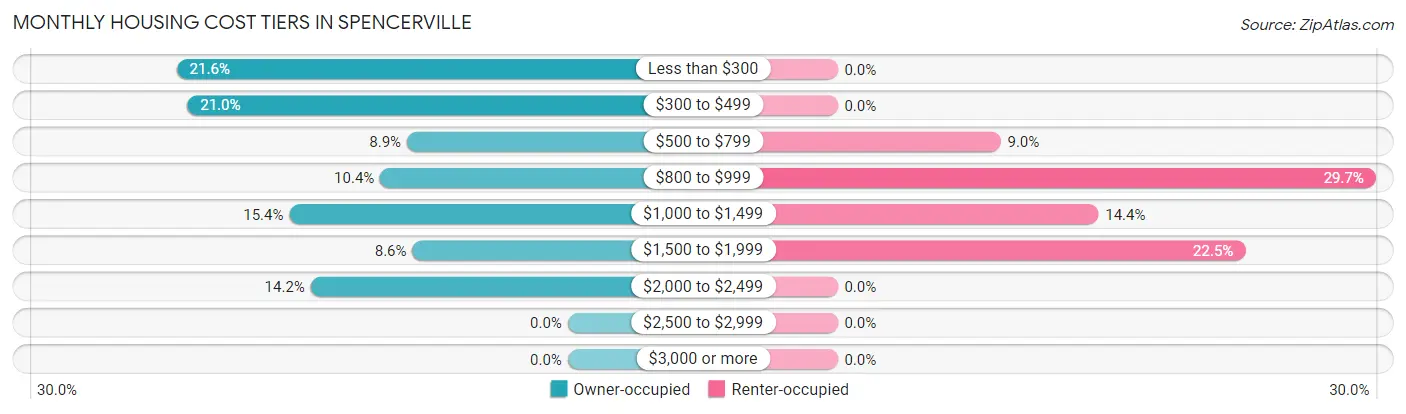
| Monthly Cost | Owner-occupied | Renter-occupied |
| Less than $300 | 73 (21.6%) | 0 (0.0%) |
| $300 to $499 | 71 (21.0%) | 0 (0.0%) |
| $500 to $799 | 30 (8.9%) | 10 (9.0%) |
| $800 to $999 | 35 (10.4%) | 33 (29.7%) |
| $1,000 to $1,499 | 52 (15.4%) | 16 (14.4%) |
| $1,500 to $1,999 | 29 (8.6%) | 25 (22.5%) |
| $2,000 to $2,499 | 48 (14.2%) | 0 (0.0%) |
| $2,500 to $2,999 | 0 (0.0%) | 0 (0.0%) |
| $3,000 or more | 0 (0.0%) | 0 (0.0%) |
| Total | 338 (100.0%) | 111 (100.0%) |
Physical Housing Characteristics in Spencerville
Housing Structures in Spencerville
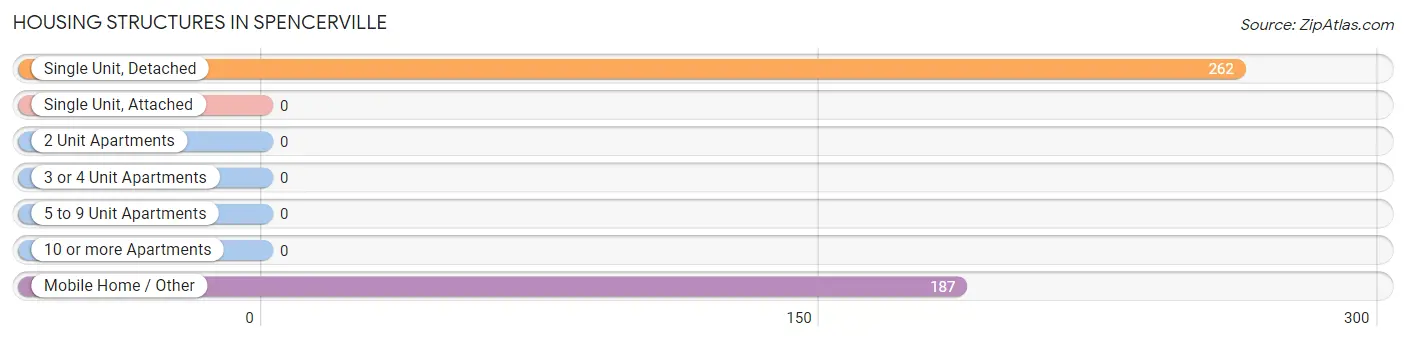
| Structure Type | # Housing Units | % Housing Units |
| Single Unit, Detached | 262 | 58.4% |
| Single Unit, Attached | 0 | 0.0% |
| 2 Unit Apartments | 0 | 0.0% |
| 3 or 4 Unit Apartments | 0 | 0.0% |
| 5 to 9 Unit Apartments | 0 | 0.0% |
| 10 or more Apartments | 0 | 0.0% |
| Mobile Home / Other | 187 | 41.6% |
| Total | 449 | 100.0% |
Housing Structures by Occupancy in Spencerville
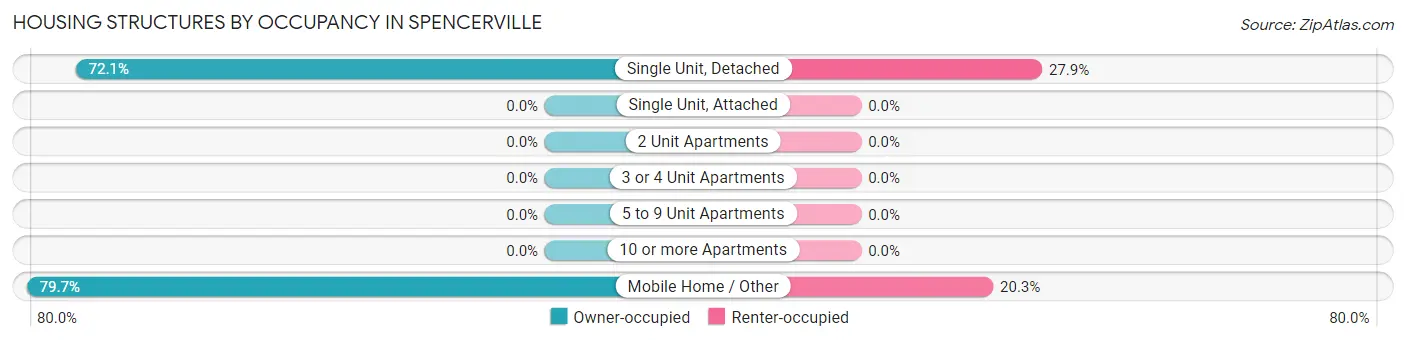
| Structure Type | Owner-occupied | Renter-occupied |
| Single Unit, Detached | 189 (72.1%) | 73 (27.9%) |
| Single Unit, Attached | 0 (0.0%) | 0 (0.0%) |
| 2 Unit Apartments | 0 (0.0%) | 0 (0.0%) |
| 3 or 4 Unit Apartments | 0 (0.0%) | 0 (0.0%) |
| 5 to 9 Unit Apartments | 0 (0.0%) | 0 (0.0%) |
| 10 or more Apartments | 0 (0.0%) | 0 (0.0%) |
| Mobile Home / Other | 149 (79.7%) | 38 (20.3%) |
| Total | 338 (75.3%) | 111 (24.7%) |
Housing Structures by Number of Rooms in Spencerville
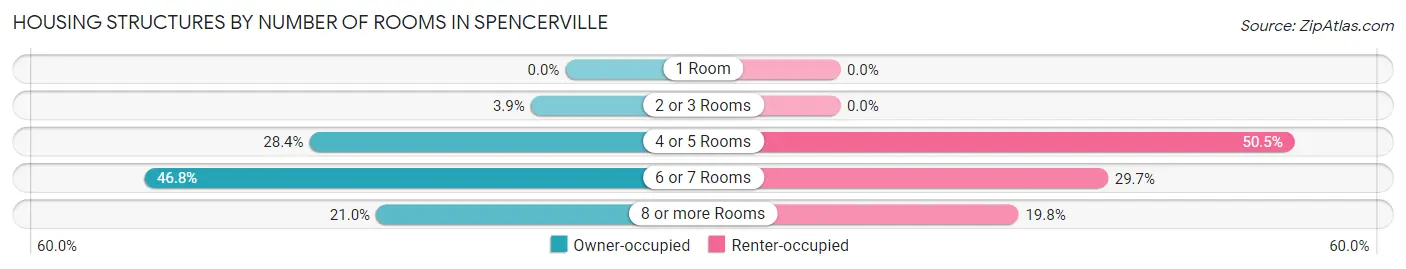
| Number of Rooms | Owner-occupied | Renter-occupied |
| 1 Room | 0 (0.0%) | 0 (0.0%) |
| 2 or 3 Rooms | 13 (3.8%) | 0 (0.0%) |
| 4 or 5 Rooms | 96 (28.4%) | 56 (50.4%) |
| 6 or 7 Rooms | 158 (46.8%) | 33 (29.7%) |
| 8 or more Rooms | 71 (21.0%) | 22 (19.8%) |
| Total | 338 (100.0%) | 111 (100.0%) |
Housing Structure by Heating Type in Spencerville
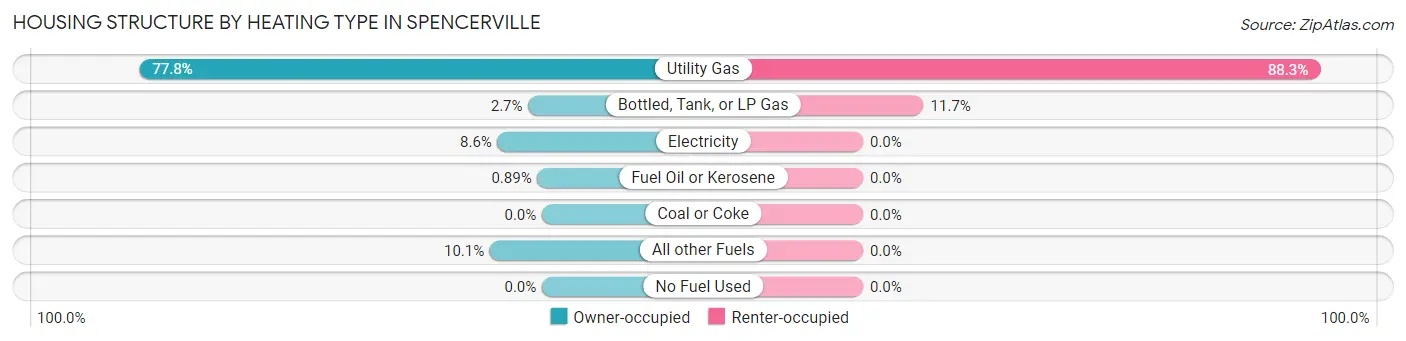
| Heating Type | Owner-occupied | Renter-occupied |
| Utility Gas | 263 (77.8%) | 98 (88.3%) |
| Bottled, Tank, or LP Gas | 9 (2.7%) | 13 (11.7%) |
| Electricity | 29 (8.6%) | 0 (0.0%) |
| Fuel Oil or Kerosene | 3 (0.9%) | 0 (0.0%) |
| Coal or Coke | 0 (0.0%) | 0 (0.0%) |
| All other Fuels | 34 (10.1%) | 0 (0.0%) |
| No Fuel Used | 0 (0.0%) | 0 (0.0%) |
| Total | 338 (100.0%) | 111 (100.0%) |
Household Vehicle Usage in Spencerville
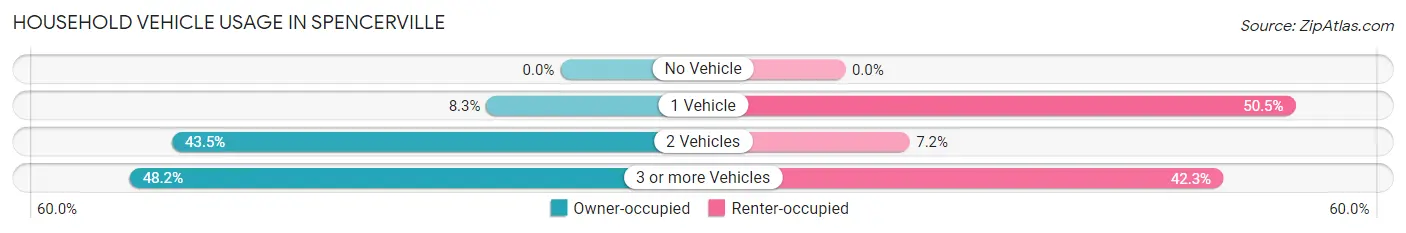
| Vehicles per Household | Owner-occupied | Renter-occupied |
| No Vehicle | 0 (0.0%) | 0 (0.0%) |
| 1 Vehicle | 28 (8.3%) | 56 (50.4%) |
| 2 Vehicles | 147 (43.5%) | 8 (7.2%) |
| 3 or more Vehicles | 163 (48.2%) | 47 (42.3%) |
| Total | 338 (100.0%) | 111 (100.0%) |
Real Estate & Mortgages in Spencerville
Real Estate and Mortgage Overview in Spencerville
| Characteristic | Without Mortgage | With Mortgage |
| Housing Units | 174 | 164 |
| Median Property Value | $200,000 | $239,100 |
| Median Household Income | - | - |
| Monthly Housing Costs | $412 | $0 |
| Real Estate Taxes | $1,123 | $0 |
Property Value by Mortgage Status in Spencerville
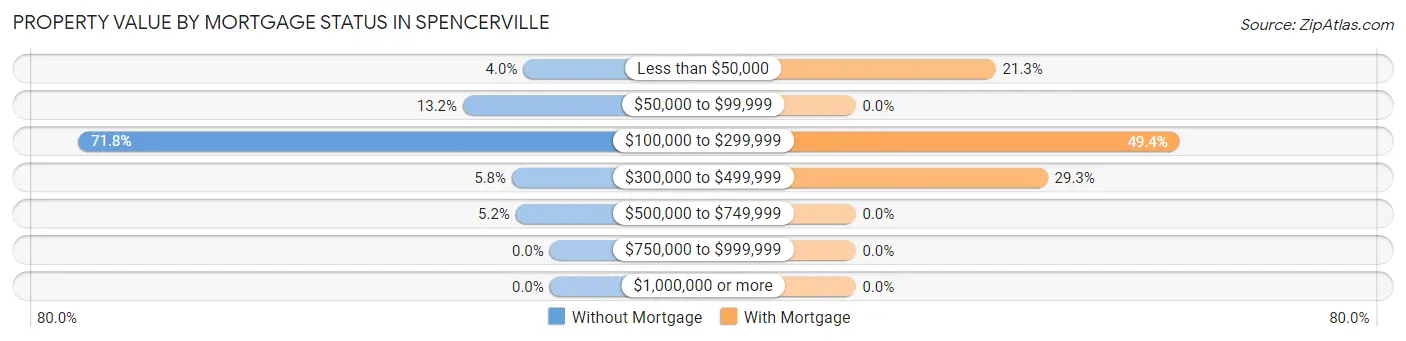
| Property Value | Without Mortgage | With Mortgage |
| Less than $50,000 | 7 (4.0%) | 35 (21.3%) |
| $50,000 to $99,999 | 23 (13.2%) | 0 (0.0%) |
| $100,000 to $299,999 | 125 (71.8%) | 81 (49.4%) |
| $300,000 to $499,999 | 10 (5.8%) | 48 (29.3%) |
| $500,000 to $749,999 | 9 (5.2%) | 0 (0.0%) |
| $750,000 to $999,999 | 0 (0.0%) | 0 (0.0%) |
| $1,000,000 or more | 0 (0.0%) | 0 (0.0%) |
| Total | 174 (100.0%) | 164 (100.0%) |
Household Income by Mortgage Status in Spencerville
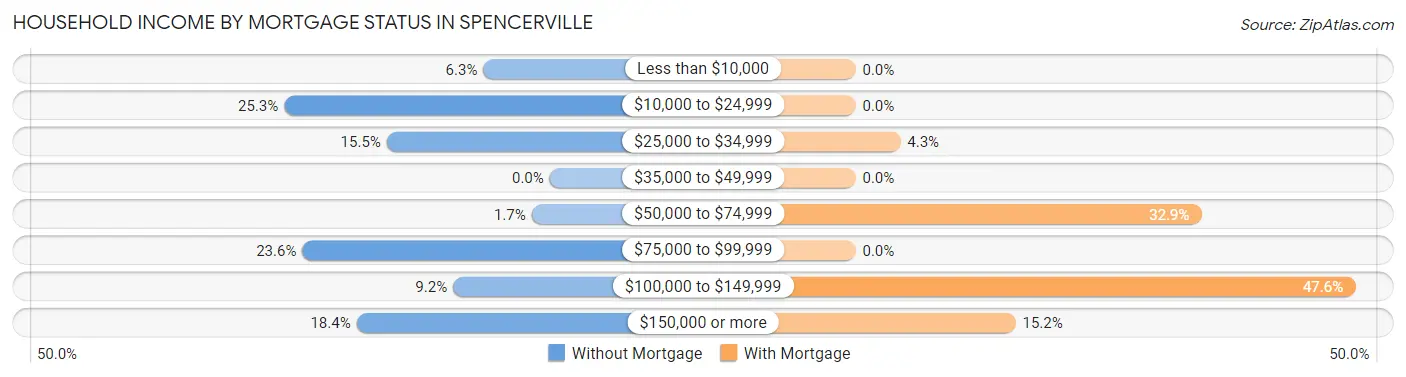
| Household Income | Without Mortgage | With Mortgage |
| Less than $10,000 | 11 (6.3%) | 0 (0.0%) |
| $10,000 to $24,999 | 44 (25.3%) | 0 (0.0%) |
| $25,000 to $34,999 | 27 (15.5%) | 7 (4.3%) |
| $35,000 to $49,999 | 0 (0.0%) | 0 (0.0%) |
| $50,000 to $74,999 | 3 (1.7%) | 54 (32.9%) |
| $75,000 to $99,999 | 41 (23.6%) | 0 (0.0%) |
| $100,000 to $149,999 | 16 (9.2%) | 78 (47.6%) |
| $150,000 or more | 32 (18.4%) | 25 (15.2%) |
| Total | 174 (100.0%) | 164 (100.0%) |
Property Value to Household Income Ratio in Spencerville
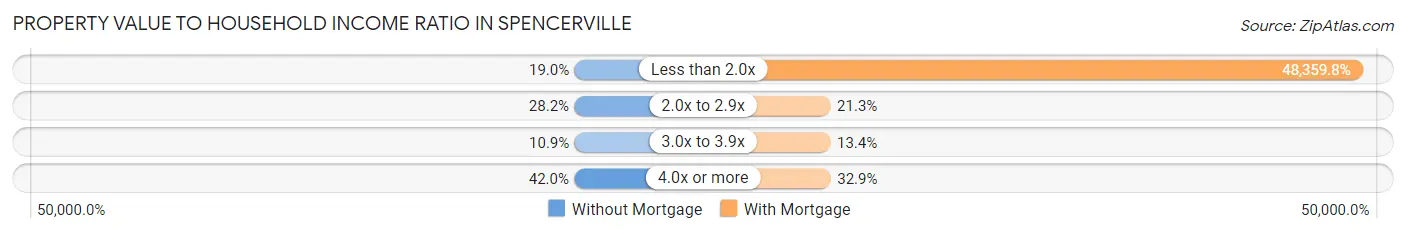
| Value-to-Income Ratio | Without Mortgage | With Mortgage |
| Less than 2.0x | 33 (19.0%) | 79,310 (48,359.8%) |
| 2.0x to 2.9x | 49 (28.2%) | 35 (21.3%) |
| 3.0x to 3.9x | 19 (10.9%) | 22 (13.4%) |
| 4.0x or more | 73 (41.9%) | 54 (32.9%) |
| Total | 174 (100.0%) | 164 (100.0%) |
Real Estate Taxes by Mortgage Status in Spencerville
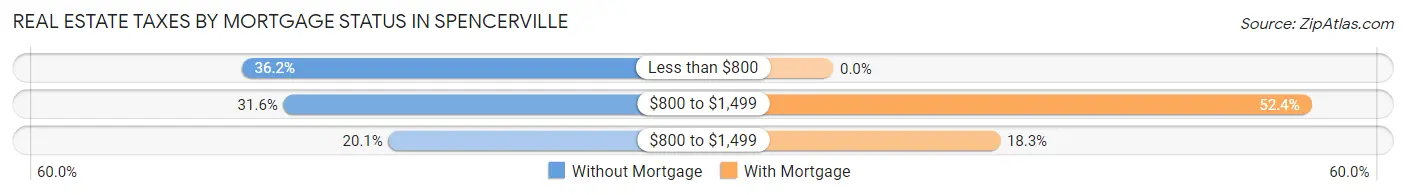
| Property Taxes | Without Mortgage | With Mortgage |
| Less than $800 | 63 (36.2%) | 0 (0.0%) |
| $800 to $1,499 | 55 (31.6%) | 86 (52.4%) |
| $800 to $1,499 | 35 (20.1%) | 30 (18.3%) |
| Total | 174 (100.0%) | 164 (100.0%) |
Health & Disability in Spencerville
Health Insurance Coverage by Age in Spencerville
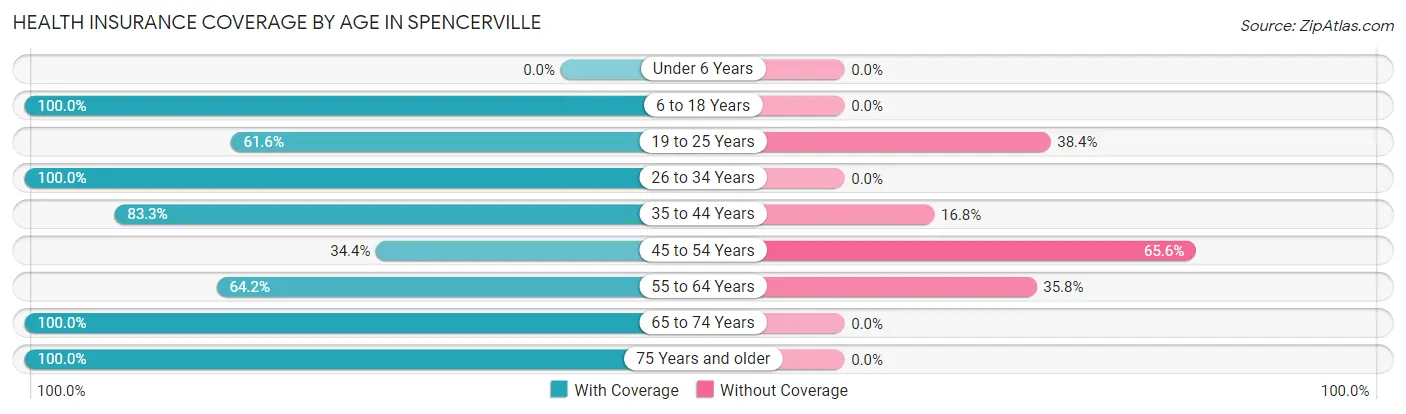
| Age Bracket | With Coverage | Without Coverage |
| Under 6 Years | 0 (0.0%) | 0 (0.0%) |
| 6 to 18 Years | 188 (100.0%) | 0 (0.0%) |
| 19 to 25 Years | 93 (61.6%) | 58 (38.4%) |
| 26 to 34 Years | 39 (100.0%) | 0 (0.0%) |
| 35 to 44 Years | 169 (83.3%) | 34 (16.8%) |
| 45 to 54 Years | 32 (34.4%) | 61 (65.6%) |
| 55 to 64 Years | 113 (64.2%) | 63 (35.8%) |
| 65 to 74 Years | 263 (100.0%) | 0 (0.0%) |
| 75 Years and older | 61 (100.0%) | 0 (0.0%) |
| Total | 958 (81.6%) | 216 (18.4%) |
Health Insurance Coverage by Citizenship Status in Spencerville
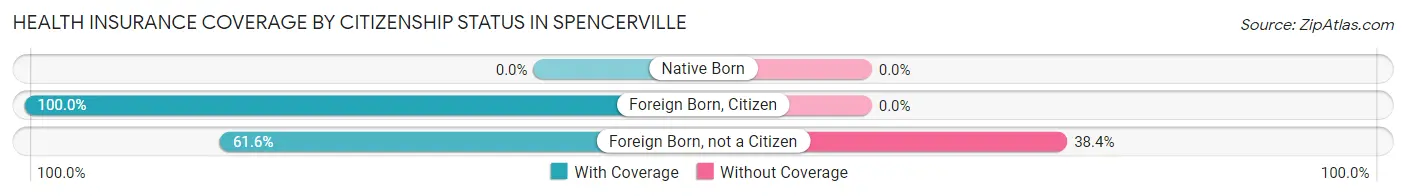
| Citizenship Status | With Coverage | Without Coverage |
| Native Born | 0 (0.0%) | 0 (0.0%) |
| Foreign Born, Citizen | 188 (100.0%) | 0 (0.0%) |
| Foreign Born, not a Citizen | 93 (61.6%) | 58 (38.4%) |
Health Insurance Coverage by Household Income in Spencerville
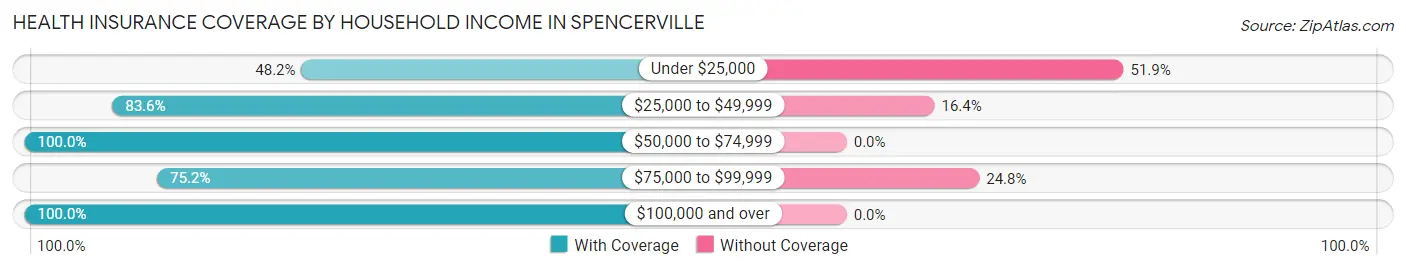
| Household Income | With Coverage | Without Coverage |
| Under $25,000 | 65 (48.1%) | 70 (51.8%) |
| $25,000 to $49,999 | 183 (83.6%) | 36 (16.4%) |
| $50,000 to $74,999 | 176 (100.0%) | 0 (0.0%) |
| $75,000 to $99,999 | 333 (75.2%) | 110 (24.8%) |
| $100,000 and over | 201 (100.0%) | 0 (0.0%) |
Public vs Private Health Insurance Coverage by Age in Spencerville
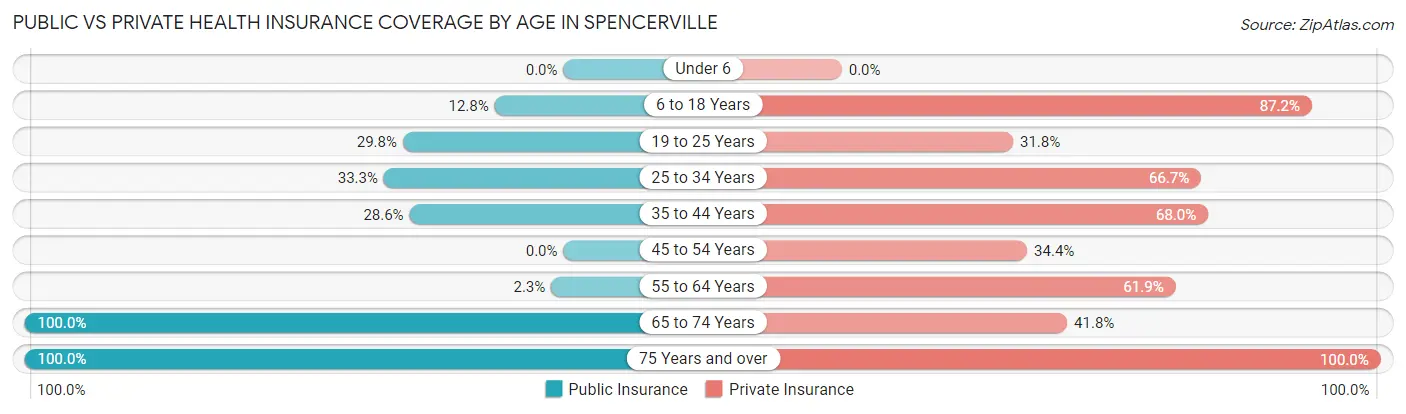
| Age Bracket | Public Insurance | Private Insurance |
| Under 6 | 0 (0.0%) | 0 (0.0%) |
| 6 to 18 Years | 24 (12.8%) | 164 (87.2%) |
| 19 to 25 Years | 45 (29.8%) | 48 (31.8%) |
| 25 to 34 Years | 13 (33.3%) | 26 (66.7%) |
| 35 to 44 Years | 58 (28.6%) | 138 (68.0%) |
| 45 to 54 Years | 0 (0.0%) | 32 (34.4%) |
| 55 to 64 Years | 4 (2.3%) | 109 (61.9%) |
| 65 to 74 Years | 263 (100.0%) | 110 (41.8%) |
| 75 Years and over | 61 (100.0%) | 61 (100.0%) |
| Total | 468 (39.9%) | 688 (58.6%) |
Disability Status by Sex by Age in Spencerville
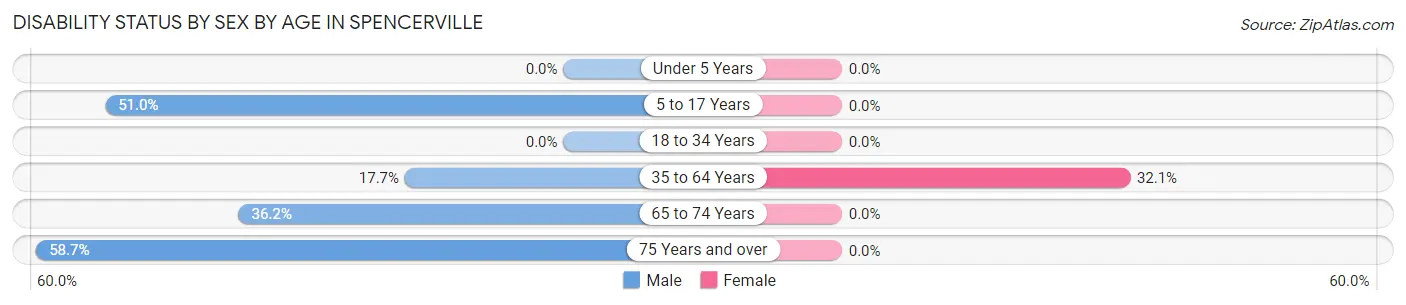
| Age Bracket | Male | Female |
| Under 5 Years | 0 (0.0%) | 0 (0.0%) |
| 5 to 17 Years | 25 (51.0%) | 0 (0.0%) |
| 18 to 34 Years | 0 (0.0%) | 0 (0.0%) |
| 35 to 64 Years | 36 (17.6%) | 86 (32.1%) |
| 65 to 74 Years | 51 (36.2%) | 0 (0.0%) |
| 75 Years and over | 27 (58.7%) | 0 (0.0%) |
Disability Class by Sex by Age in Spencerville
Disability Class: Hearing Difficulty
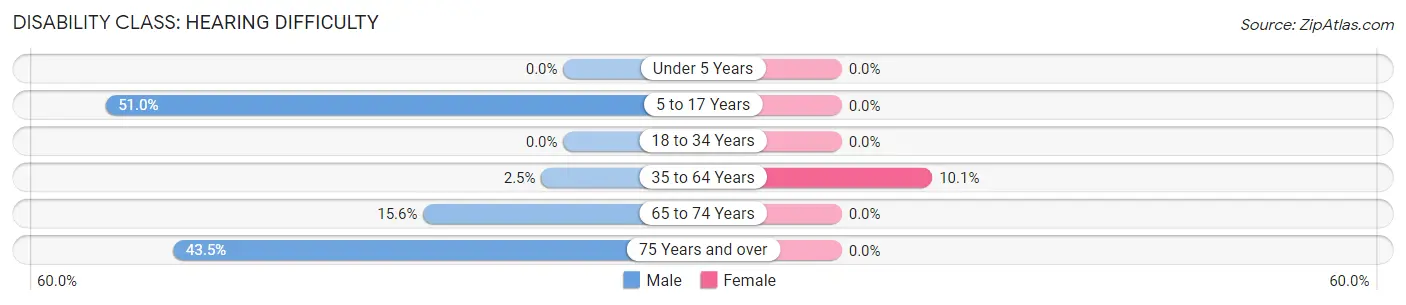
| Age Bracket | Male | Female |
| Under 5 Years | 0 (0.0%) | 0 (0.0%) |
| 5 to 17 Years | 25 (51.0%) | 0 (0.0%) |
| 18 to 34 Years | 0 (0.0%) | 0 (0.0%) |
| 35 to 64 Years | 5 (2.5%) | 27 (10.1%) |
| 65 to 74 Years | 22 (15.6%) | 0 (0.0%) |
| 75 Years and over | 20 (43.5%) | 0 (0.0%) |
Disability Class: Vision Difficulty
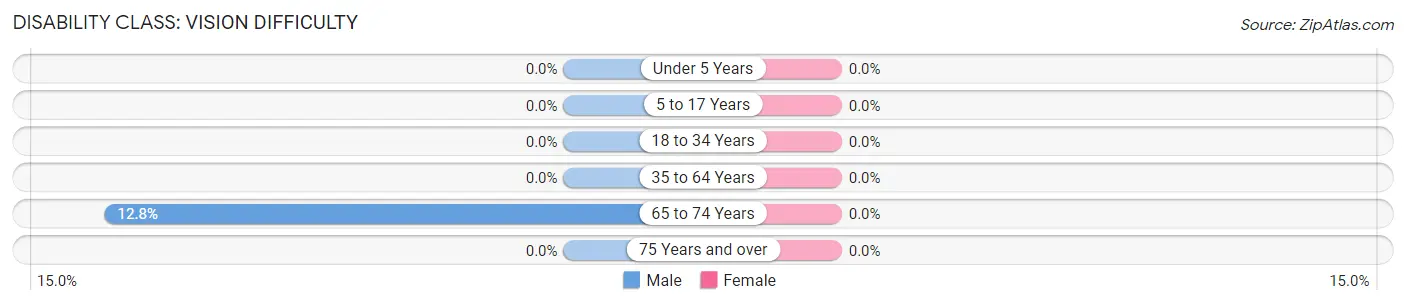
| Age Bracket | Male | Female |
| Under 5 Years | 0 (0.0%) | 0 (0.0%) |
| 5 to 17 Years | 0 (0.0%) | 0 (0.0%) |
| 18 to 34 Years | 0 (0.0%) | 0 (0.0%) |
| 35 to 64 Years | 0 (0.0%) | 0 (0.0%) |
| 65 to 74 Years | 18 (12.8%) | 0 (0.0%) |
| 75 Years and over | 0 (0.0%) | 0 (0.0%) |
Disability Class: Cognitive Difficulty
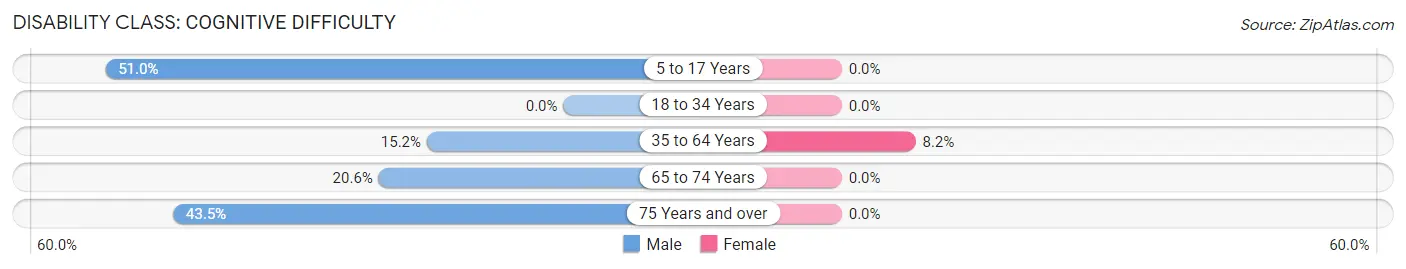
| Age Bracket | Male | Female |
| 5 to 17 Years | 25 (51.0%) | 0 (0.0%) |
| 18 to 34 Years | 0 (0.0%) | 0 (0.0%) |
| 35 to 64 Years | 31 (15.2%) | 22 (8.2%) |
| 65 to 74 Years | 29 (20.6%) | 0 (0.0%) |
| 75 Years and over | 20 (43.5%) | 0 (0.0%) |
Disability Class: Ambulatory Difficulty
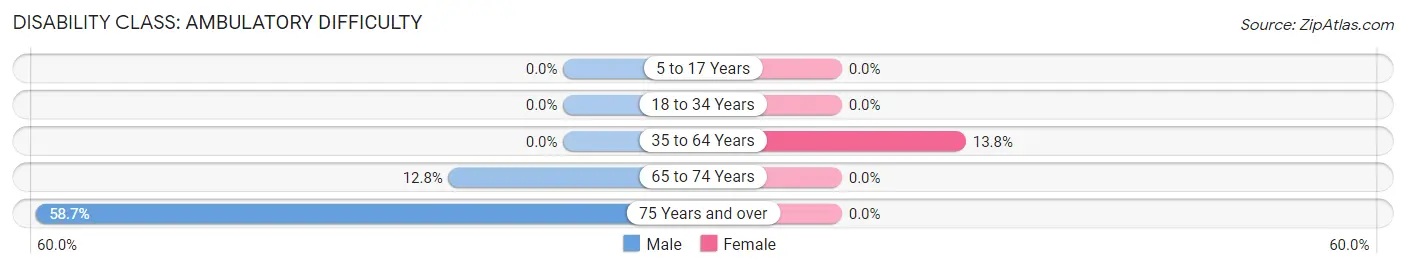
| Age Bracket | Male | Female |
| 5 to 17 Years | 0 (0.0%) | 0 (0.0%) |
| 18 to 34 Years | 0 (0.0%) | 0 (0.0%) |
| 35 to 64 Years | 0 (0.0%) | 37 (13.8%) |
| 65 to 74 Years | 18 (12.8%) | 0 (0.0%) |
| 75 Years and over | 27 (58.7%) | 0 (0.0%) |
Disability Class: Self-Care Difficulty
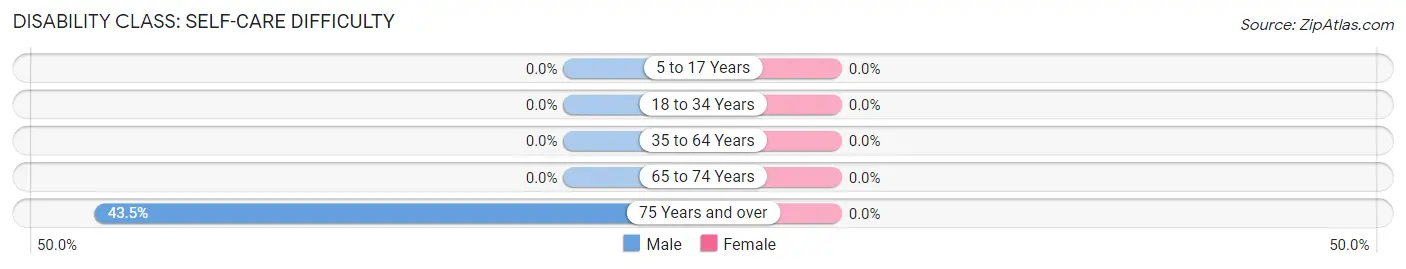
| Age Bracket | Male | Female |
| 5 to 17 Years | 0 (0.0%) | 0 (0.0%) |
| 18 to 34 Years | 0 (0.0%) | 0 (0.0%) |
| 35 to 64 Years | 0 (0.0%) | 0 (0.0%) |
| 65 to 74 Years | 0 (0.0%) | 0 (0.0%) |
| 75 Years and over | 20 (43.5%) | 0 (0.0%) |
Technology Access in Spencerville
Computing Device Access in Spencerville
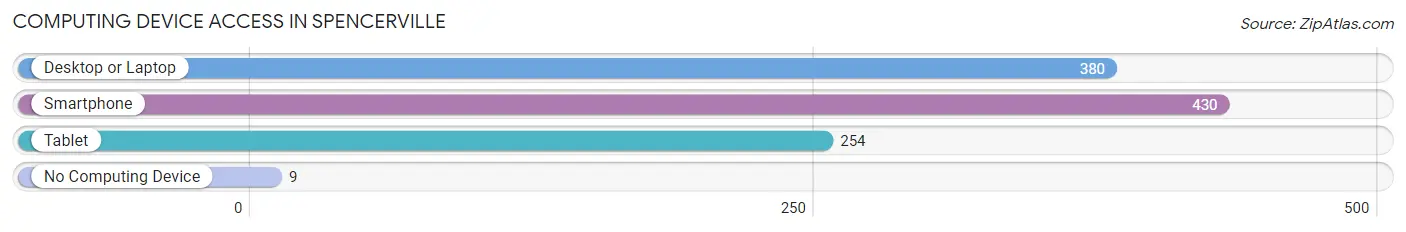
| Device Type | # Households | % Households |
| Desktop or Laptop | 380 | 84.6% |
| Smartphone | 430 | 95.8% |
| Tablet | 254 | 56.6% |
| No Computing Device | 9 | 2.0% |
| Total | 449 | 100.0% |
Internet Access in Spencerville
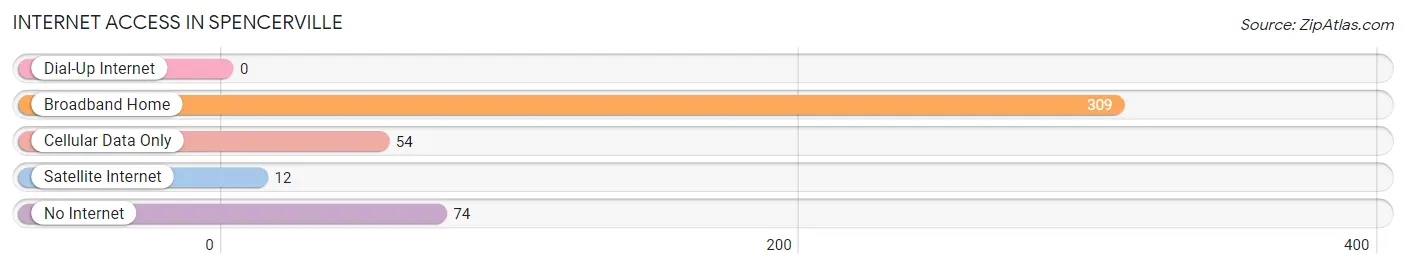
| Internet Type | # Households | % Households |
| Dial-Up Internet | 0 | 0.0% |
| Broadband Home | 309 | 68.8% |
| Cellular Data Only | 54 | 12.0% |
| Satellite Internet | 12 | 2.7% |
| No Internet | 74 | 16.5% |
| Total | 449 | 100.0% |
Spencerville Summary
Spencerville is a small unincorporated community located in the state of New Mexico. It is situated in the southeastern corner of the state, near the border with Texas. The town is located in Eddy County, and is part of the Carlsbad-Artesia Micropolitan Statistical Area. As of the 2010 census, the population of Spencerville was estimated to be around 200 people.
History
Spencerville was founded in the late 19th century by a group of settlers from the nearby town of Artesia. The town was named after one of the settlers, John Spence, who was a rancher and farmer. The town was originally a small farming community, but it soon grew to become a trading post for the surrounding area. In the early 20th century, the town was home to a number of businesses, including a general store, a blacksmith shop, and a saloon.
Geography
Spencerville is located in the southeastern corner of New Mexico, near the border with Texas. The town is situated in Eddy County, and is part of the Carlsbad-Artesia Micropolitan Statistical Area. The town is located at an elevation of 3,845 feet (1,172 m). The climate in the area is semi-arid, with hot summers and mild winters.
Economy
The economy of Spencerville is largely based on agriculture. The town is home to a number of farms, which produce a variety of crops, including cotton, corn, and alfalfa. The town is also home to a number of small businesses, including a general store, a gas station, and a restaurant.
Demographics
As of the 2010 census, the population of Spencerville was estimated to be around 200 people. The racial makeup of the town was 94.5% White, 0.5% African American, 0.5% Native American, 0.5% Asian, and 4.0% from other races. The median household income in the town was $31,250, and the median family income was $37,500. The per capita income in the town was $14,818. The unemployment rate in the town was 8.3%.
Conclusion
Spencerville is a small unincorporated community located in the southeastern corner of New Mexico. The town was founded in the late 19th century by a group of settlers from the nearby town of Artesia. The economy of the town is largely based on agriculture, and the town is home to a number of small businesses. As of the 2010 census, the population of Spencerville was estimated to be around 200 people. The racial makeup of the town was 94.5% White, 0.5% African American, 0.5% Native American, 0.5% Asian, and 4.0% from other races. The median household income in the town was $31,250, and the median family income was $37,500. The per capita income in the town was $14,818. The unemployment rate in the town was 8.3%.
Common Questions
What is Per Capita Income in Spencerville?
Per Capita income in Spencerville is $33,360.
What is the Median Family Income in Spencerville?
Median Family Income in Spencerville is $77,629.
What is the Median Household income in Spencerville?
Median Household Income in Spencerville is $71,705.
What is Income or Wage Gap in Spencerville?
Income or Wage Gap in Spencerville is 27.5%.
Women in Spencerville earn 72.5 cents for every dollar earned by a man.
What is Inequality or Gini Index in Spencerville?
Inequality or Gini Index in Spencerville is 0.41.
What is the Total Population of Spencerville?
Total Population of Spencerville is 1,174.
What is the Total Male Population of Spencerville?
Total Male Population of Spencerville is 595.
What is the Total Female Population of Spencerville?
Total Female Population of Spencerville is 579.
What is the Ratio of Males per 100 Females in Spencerville?
There are 102.76 Males per 100 Females in Spencerville.
What is the Ratio of Females per 100 Males in Spencerville?
There are 97.31 Females per 100 Males in Spencerville.
What is the Median Population Age in Spencerville?
Median Population Age in Spencerville is 45.5 Years.
What is the Average Family Size in Spencerville
Average Family Size in Spencerville is 3.0 People.
What is the Average Household Size in Spencerville
Average Household Size in Spencerville is 2.6 People.
How Large is the Labor Force in Spencerville?
There are 499 People in the Labor Forcein in Spencerville.
What is the Percentage of People in the Labor Force in Spencerville?
45.3% of People are in the Labor Force in Spencerville.
What is the Unemployment Rate in Spencerville?
Unemployment Rate in Spencerville is 3.0%.