Zip Codes with the Highest Percentage of Population Employed in Administrative & Support Services in Santa Fe, NM
RELATED REPORTS & OPTIONS
Administrative & Support Services
Santa Fe
Compare Zip Codes
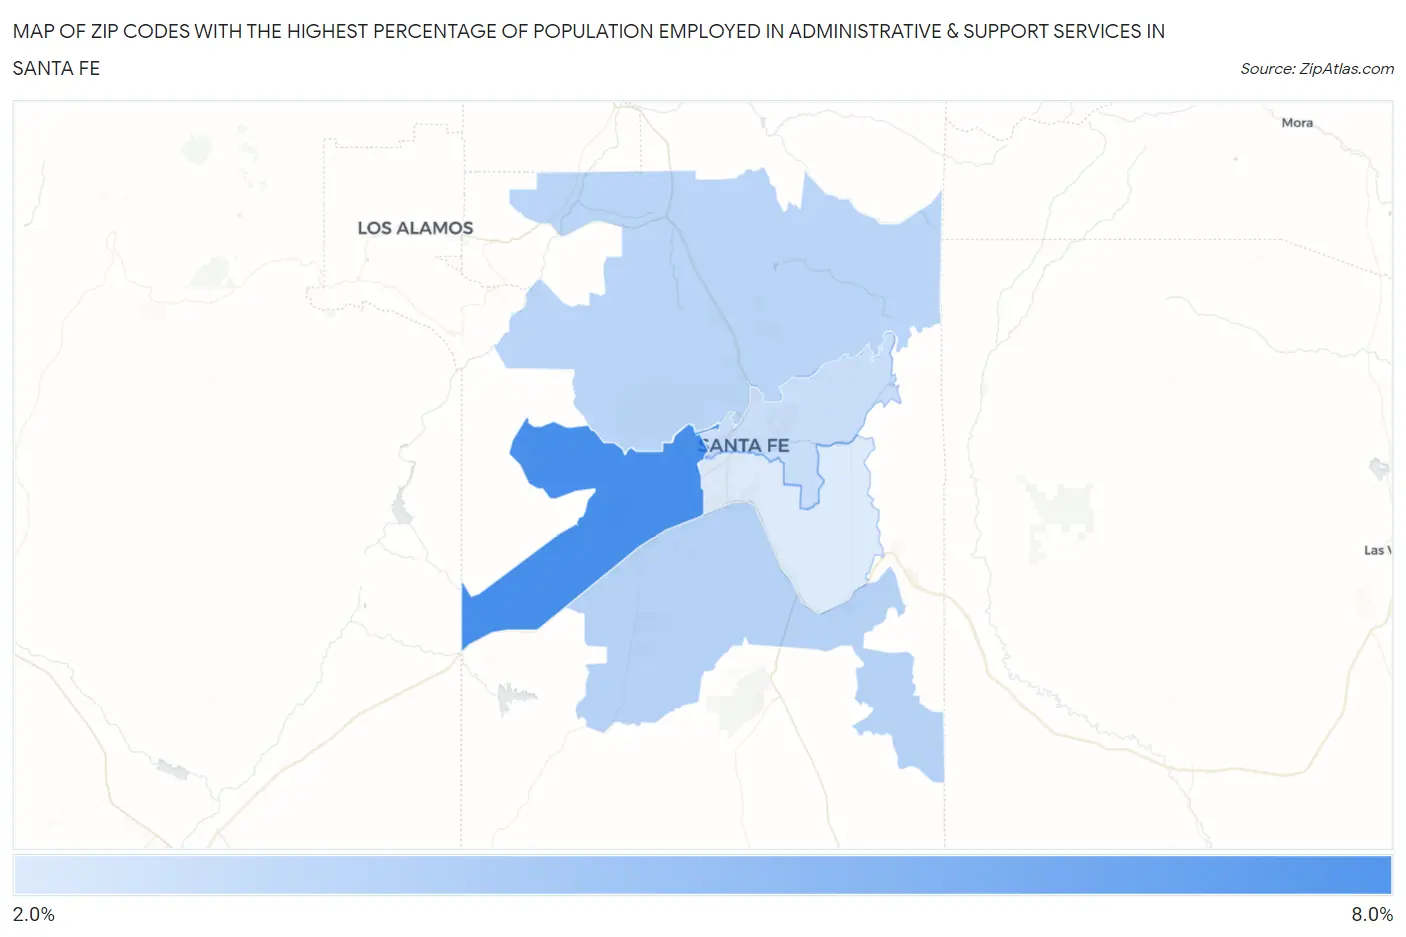
Map of Zip Codes with the Highest Percentage of Population Employed in Administrative & Support Services in Santa Fe
2.7%
6.5%
Zip Codes with the Highest Percentage of Population Employed in Administrative & Support Services in Santa Fe, NM
| Zip Code | % Employed | vs State | vs National | |
| 1. | 87507 | 6.5% | 3.9%(+2.52)#38 | 4.1%(+2.32)#3,962 |
| 2. | 87508 | 3.7% | 3.9%(-0.267)#86 | 4.1%(-0.468)#12,072 |
| 3. | 87506 | 3.5% | 3.9%(-0.407)#89 | 4.1%(-0.608)#12,755 |
| 4. | 87501 | 3.2% | 3.9%(-0.754)#104 | 4.1%(-0.955)#14,495 |
| 5. | 87505 | 2.7% | 3.9%(-1.26)#121 | 4.1%(-1.46)#17,136 |
1
Common Questions
What are the Top 3 Zip Codes with the Highest Percentage of Population Employed in Administrative & Support Services in Santa Fe, NM?
Top 3 Zip Codes with the Highest Percentage of Population Employed in Administrative & Support Services in Santa Fe, NM are:
What zip code has the Highest Percentage of Population Employed in Administrative & Support Services in Santa Fe, NM?
87507 has the Highest Percentage of Population Employed in Administrative & Support Services in Santa Fe, NM with 6.5%.
What is the Percentage of Population Employed in Administrative & Support Services in Santa Fe, NM?
Percentage of Population Employed in Administrative & Support Services in Santa Fe is 4.7%.
What is the Percentage of Population Employed in Administrative & Support Services in New Mexico?
Percentage of Population Employed in Administrative & Support Services in New Mexico is 3.9%.
What is the Percentage of Population Employed in Administrative & Support Services in the United States?
Percentage of Population Employed in Administrative & Support Services in the United States is 4.1%.