McKinley, MN Map & Demographics
McKinley Map
McKinley Overview
$39,435
PER CAPITA INCOME
$103,750
AVG FAMILY INCOME
$54,583
AVG HOUSEHOLD INCOME
0.36
INEQUALITY / GINI INDEX
104
TOTAL POPULATION
46
MALE POPULATION
58
FEMALE POPULATION
79.31
MALES / 100 FEMALES
126.09
FEMALES / 100 MALES
63.5
MEDIAN AGE
2.3
AVG FAMILY SIZE
2.0
AVG HOUSEHOLD SIZE
53
LABOR FORCE [ PEOPLE ]
58.9%
PERCENT IN LABOR FORCE
1.9%
UNEMPLOYMENT RATE
McKinley Area Codes
Income in McKinley
Income Overview in McKinley
Per Capita Income in McKinley is $39,435, while median incomes of families and households are $103,750 and $54,583 respectively.
| Characteristic | Number | Measure |
| Per Capita Income | 104 | $39,435 |
| Median Family Income | 37 | $103,750 |
| Mean Family Income | 37 | $95,778 |
| Median Household Income | 53 | $54,583 |
| Mean Household Income | 53 | $77,113 |
| Income Deficit | 37 | $0 |
| Wage / Income Gap (%) | 104 | 0.00% |
| Wage / Income Gap ($) | 104 | 100.00¢ per $1 |
| Gini / Inequality Index | 104 | 0.36 |
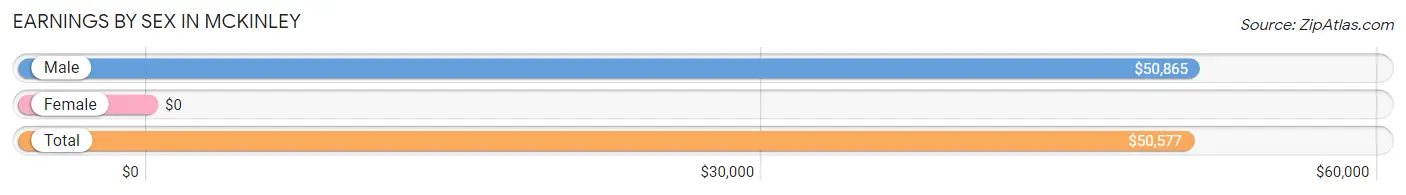
Earnings by Sex in McKinley
| Sex | Number | Average Earnings |
| Male | 27 (46.6%) | $50,865 |
| Female | 31 (53.4%) | $0 |
| Total | 58 (100.0%) | $50,577 |
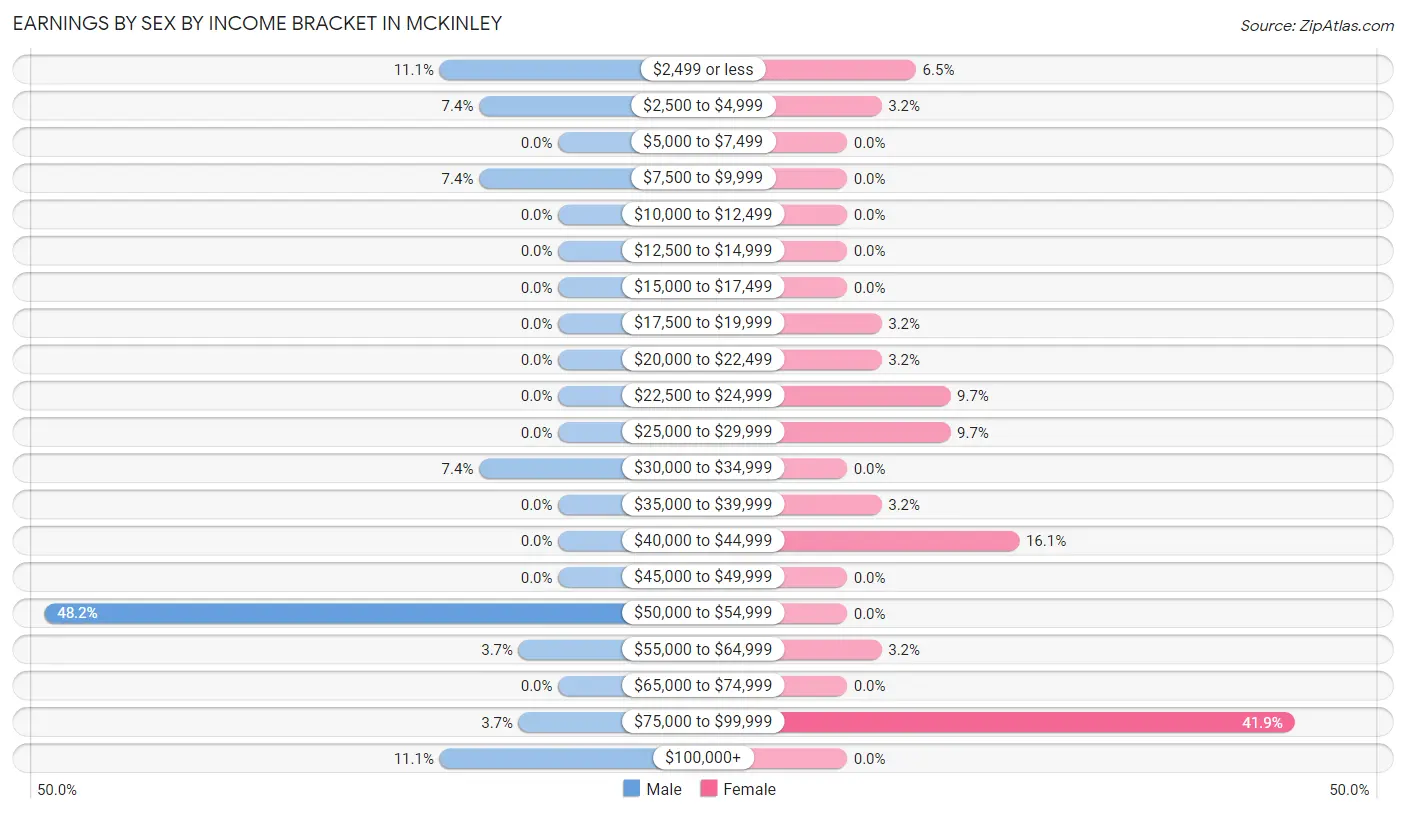
Earnings by Sex by Income Bracket in McKinley
The most common earnings brackets in McKinley are $50,000 to $54,999 for men (13 | 48.1%) and $75,000 to $99,999 for women (13 | 41.9%).
| Income | Male | Female |
| $2,499 or less | 3 (11.1%) | 2 (6.5%) |
| $2,500 to $4,999 | 2 (7.4%) | 1 (3.2%) |
| $5,000 to $7,499 | 0 (0.0%) | 0 (0.0%) |
| $7,500 to $9,999 | 2 (7.4%) | 0 (0.0%) |
| $10,000 to $12,499 | 0 (0.0%) | 0 (0.0%) |
| $12,500 to $14,999 | 0 (0.0%) | 0 (0.0%) |
| $15,000 to $17,499 | 0 (0.0%) | 0 (0.0%) |
| $17,500 to $19,999 | 0 (0.0%) | 1 (3.2%) |
| $20,000 to $22,499 | 0 (0.0%) | 1 (3.2%) |
| $22,500 to $24,999 | 0 (0.0%) | 3 (9.7%) |
| $25,000 to $29,999 | 0 (0.0%) | 3 (9.7%) |
| $30,000 to $34,999 | 2 (7.4%) | 0 (0.0%) |
| $35,000 to $39,999 | 0 (0.0%) | 1 (3.2%) |
| $40,000 to $44,999 | 0 (0.0%) | 5 (16.1%) |
| $45,000 to $49,999 | 0 (0.0%) | 0 (0.0%) |
| $50,000 to $54,999 | 13 (48.1%) | 0 (0.0%) |
| $55,000 to $64,999 | 1 (3.7%) | 1 (3.2%) |
| $65,000 to $74,999 | 0 (0.0%) | 0 (0.0%) |
| $75,000 to $99,999 | 1 (3.7%) | 13 (41.9%) |
| $100,000+ | 3 (11.1%) | 0 (0.0%) |
| Total | 27 (100.0%) | 31 (100.0%) |
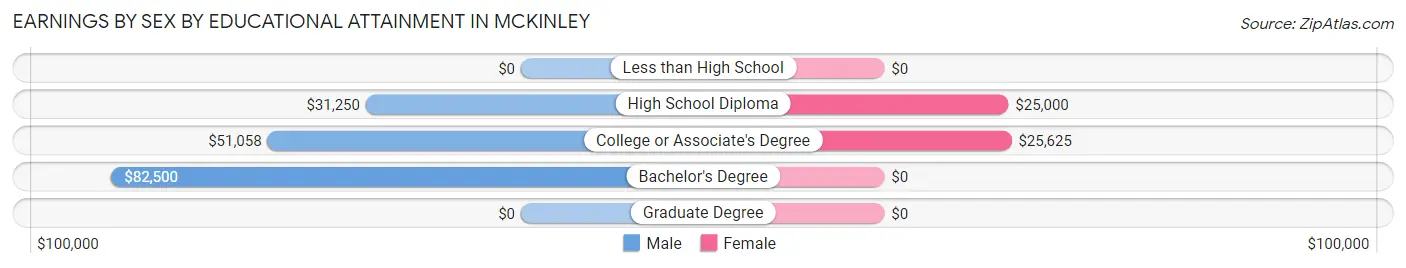
Earnings by Sex by Educational Attainment in McKinley
| Educational Attainment | Male Income | Female Income |
| Less than High School | - | - |
| High School Diploma | $31,250 | $25,000 |
| College or Associate's Degree | $51,058 | $25,625 |
| Bachelor's Degree | $82,500 | $0 |
| Graduate Degree | - | - |
| Total | $51,058 | $0 |
Family Income in McKinley
Family Income Brackets in McKinley
According to the McKinley family income data, there are 18 families falling into the $100,000 to $149,999 income range, which is the most common income bracket and makes up 48.6% of all families.
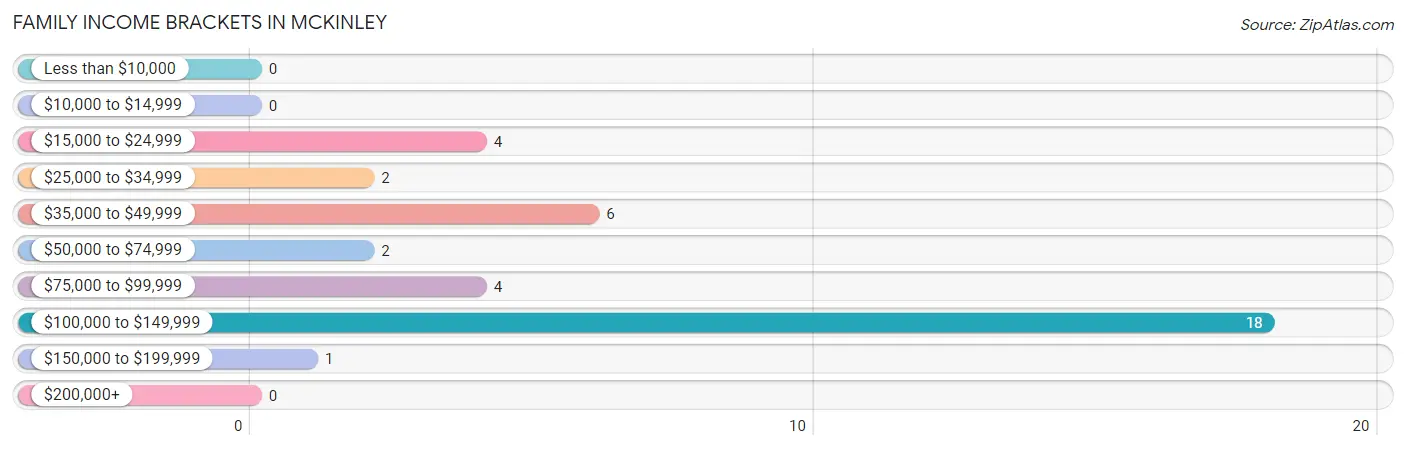
| Income Bracket | # Families | % Families |
| Less than $10,000 | 0 | 0.0% |
| $10,000 to $14,999 | 0 | 0.0% |
| $15,000 to $24,999 | 4 | 10.8% |
| $25,000 to $34,999 | 2 | 5.4% |
| $35,000 to $49,999 | 6 | 16.2% |
| $50,000 to $74,999 | 2 | 5.4% |
| $75,000 to $99,999 | 4 | 10.8% |
| $100,000 to $149,999 | 18 | 48.6% |
| $150,000 to $199,999 | 1 | 2.7% |
| $200,000+ | 0 | 0.0% |
Family Income by Famaliy Size in McKinley
| Income Bracket | # Families | Median Income |
| 2-Person Families | 29 (78.4%) | $0 |
| 3-Person Families | 5 (13.5%) | $0 |
| 4-Person Families | 1 (2.7%) | $0 |
| 5-Person Families | 2 (5.4%) | $0 |
| 6-Person Families | 0 (0.0%) | $0 |
| 7+ Person Families | 0 (0.0%) | $0 |
| Total | 37 (100.0%) | $103,750 |
Family Income by Number of Earners in McKinley
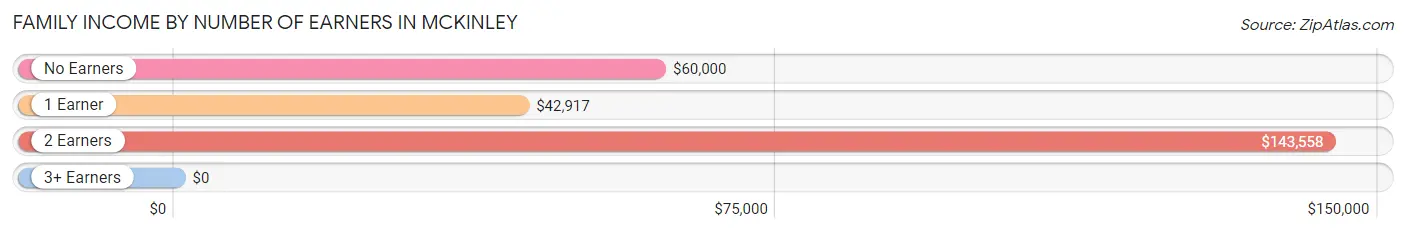
| Number of Earners | # Families | Median Income |
| No Earners | 8 (21.6%) | $60,000 |
| 1 Earner | 11 (29.7%) | $42,917 |
| 2 Earners | 17 (46.0%) | $143,558 |
| 3+ Earners | 1 (2.7%) | $0 |
| Total | 37 (100.0%) | $103,750 |
Household Income in McKinley
Household Income Brackets in McKinley
With 18 households falling in the category, the $100,000 to $149,999 income range is the most frequent in McKinley, accounting for 34.0% of all households.
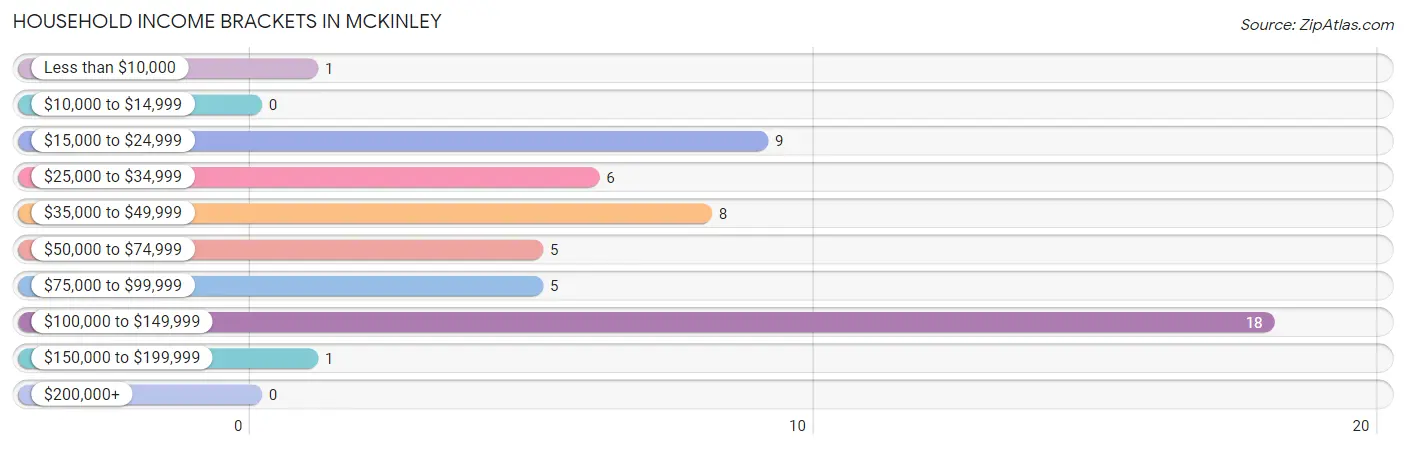
| Income Bracket | # Households | % Households |
| Less than $10,000 | 1 | 1.9% |
| $10,000 to $14,999 | 0 | 0.0% |
| $15,000 to $24,999 | 9 | 17.0% |
| $25,000 to $34,999 | 6 | 11.3% |
| $35,000 to $49,999 | 8 | 15.1% |
| $50,000 to $74,999 | 5 | 9.4% |
| $75,000 to $99,999 | 5 | 9.4% |
| $100,000 to $149,999 | 18 | 34.0% |
| $150,000 to $199,999 | 1 | 1.9% |
| $200,000+ | 0 | 0.0% |
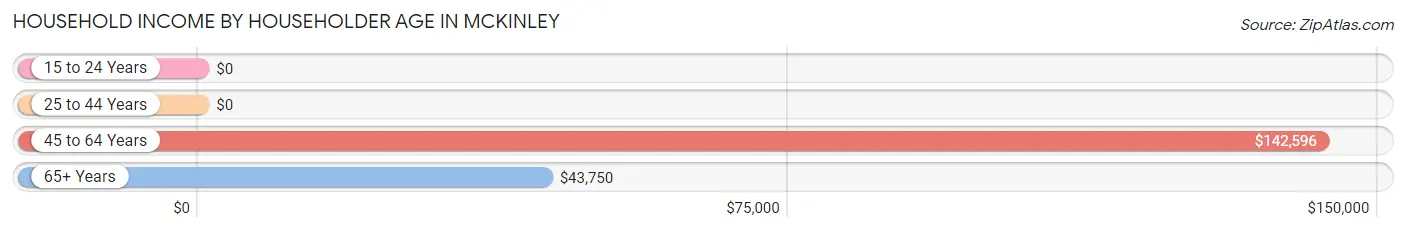
Household Income by Householder Age in McKinley
The median household income in McKinley is $54,583, with the highest median household income of $142,596 found in the 45 to 64 years age bracket for the primary householder. A total of 25 households (47.2%) fall into this category.
| Income Bracket | # Households | Median Income |
| 15 to 24 Years | 0 (0.0%) | $0 |
| 25 to 44 Years | 7 (13.2%) | $0 |
| 45 to 64 Years | 25 (47.2%) | $142,596 |
| 65+ Years | 21 (39.6%) | $43,750 |
| Total | 53 (100.0%) | $54,583 |
Poverty in McKinley
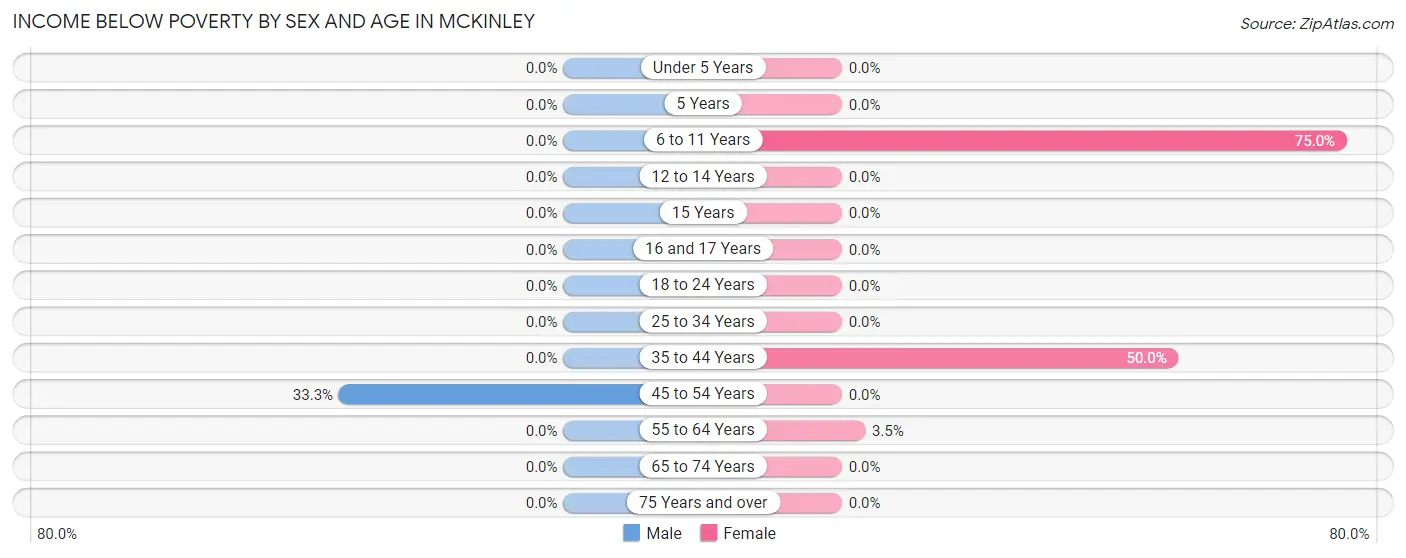
Income Below Poverty by Sex and Age in McKinley
With 2.2% poverty level for males and 17.2% for females among the residents of McKinley, 45 to 54 year old males and 6 to 11 year old females are the most vulnerable to poverty, with 1 males (33.3%) and 6 females (75.0%) in their respective age groups living below the poverty level.
| Age Bracket | Male | Female |
| Under 5 Years | 0 (0.0%) | 0 (0.0%) |
| 5 Years | 0 (0.0%) | 0 (0.0%) |
| 6 to 11 Years | 0 (0.0%) | 6 (75.0%) |
| 12 to 14 Years | 0 (0.0%) | 0 (0.0%) |
| 15 Years | 0 (0.0%) | 0 (0.0%) |
| 16 and 17 Years | 0 (0.0%) | 0 (0.0%) |
| 18 to 24 Years | 0 (0.0%) | 0 (0.0%) |
| 25 to 34 Years | 0 (0.0%) | 0 (0.0%) |
| 35 to 44 Years | 0 (0.0%) | 3 (50.0%) |
| 45 to 54 Years | 1 (33.3%) | 0 (0.0%) |
| 55 to 64 Years | 0 (0.0%) | 1 (3.5%) |
| 65 to 74 Years | 0 (0.0%) | 0 (0.0%) |
| 75 Years and over | 0 (0.0%) | 0 (0.0%) |
| Total | 1 (2.2%) | 10 (17.2%) |
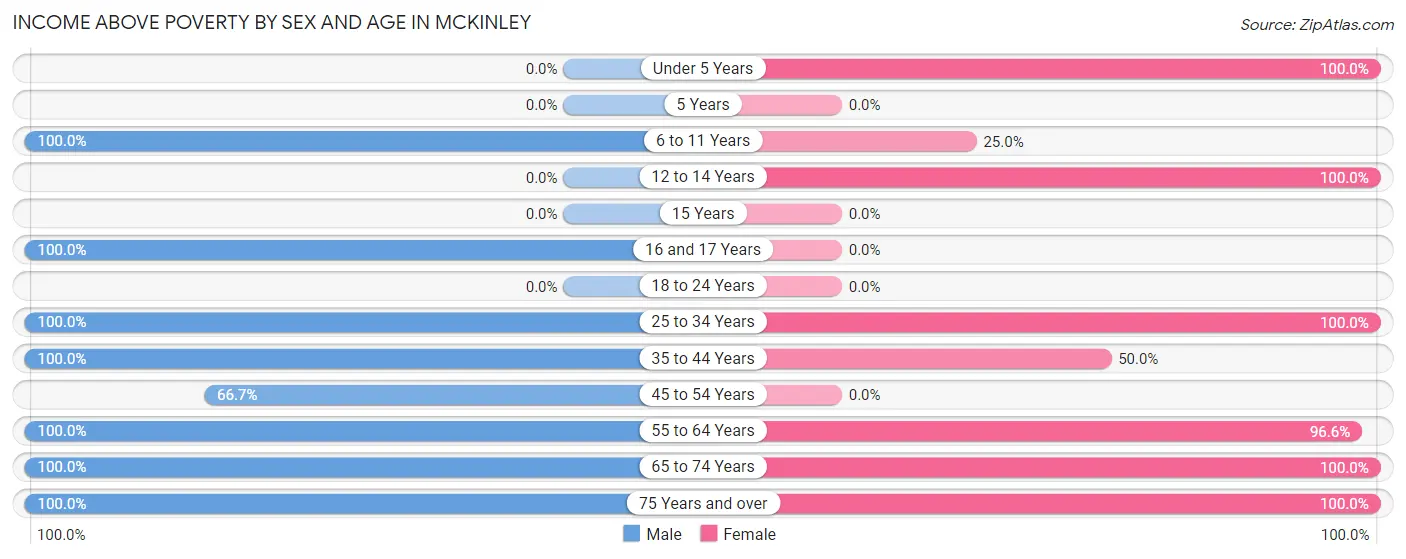
Income Above Poverty by Sex and Age in McKinley
According to the poverty statistics in McKinley, males aged 6 to 11 years and females aged under 5 years are the age groups that are most secure financially, with 100.0% of males and 100.0% of females in these age groups living above the poverty line.
| Age Bracket | Male | Female |
| Under 5 Years | 0 (0.0%) | 1 (100.0%) |
| 5 Years | 0 (0.0%) | 0 (0.0%) |
| 6 to 11 Years | 3 (100.0%) | 2 (25.0%) |
| 12 to 14 Years | 0 (0.0%) | 1 (100.0%) |
| 15 Years | 0 (0.0%) | 0 (0.0%) |
| 16 and 17 Years | 2 (100.0%) | 0 (0.0%) |
| 18 to 24 Years | 0 (0.0%) | 0 (0.0%) |
| 25 to 34 Years | 1 (100.0%) | 2 (100.0%) |
| 35 to 44 Years | 3 (100.0%) | 3 (50.0%) |
| 45 to 54 Years | 2 (66.7%) | 0 (0.0%) |
| 55 to 64 Years | 16 (100.0%) | 28 (96.6%) |
| 65 to 74 Years | 13 (100.0%) | 7 (100.0%) |
| 75 Years and over | 4 (100.0%) | 4 (100.0%) |
| Total | 44 (97.8%) | 48 (82.8%) |
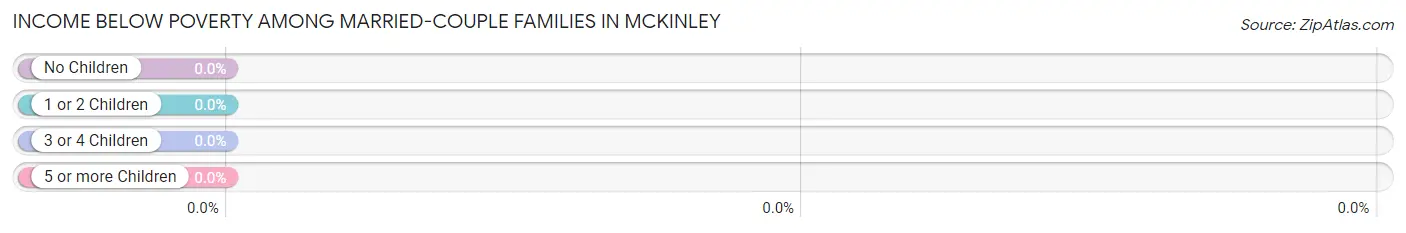
Income Below Poverty Among Married-Couple Families in McKinley
| Children | Above Poverty | Below Poverty |
| No Children | 28 (100.0%) | 0 (0.0%) |
| 1 or 2 Children | 2 (100.0%) | 0 (0.0%) |
| 3 or 4 Children | 2 (100.0%) | 0 (0.0%) |
| 5 or more Children | 0 (0.0%) | 0 (0.0%) |
| Total | 32 (100.0%) | 0 (0.0%) |
Income Below Poverty Among Single-Parent Households in McKinley
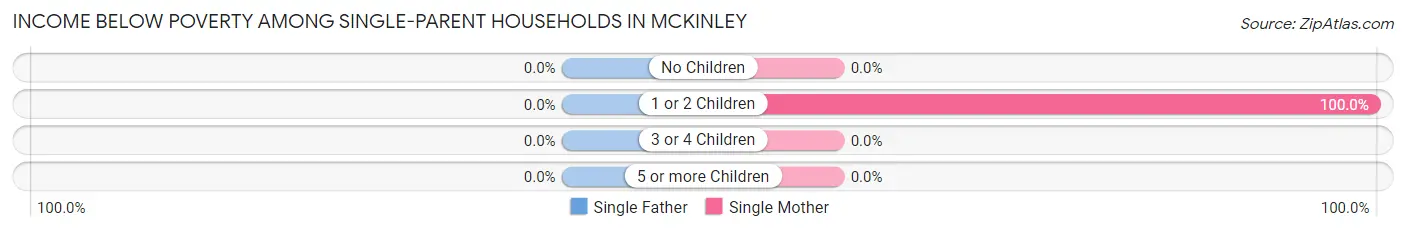
| Children | Single Father | Single Mother |
| No Children | 0 (0.0%) | 0 (0.0%) |
| 1 or 2 Children | 0 (0.0%) | 3 (100.0%) |
| 3 or 4 Children | 0 (0.0%) | 0 (0.0%) |
| 5 or more Children | 0 (0.0%) | 0 (0.0%) |
| Total | 0 (0.0%) | 3 (60.0%) |
Income Below Poverty Among Married-Couple vs Single-Parent Households in McKinley
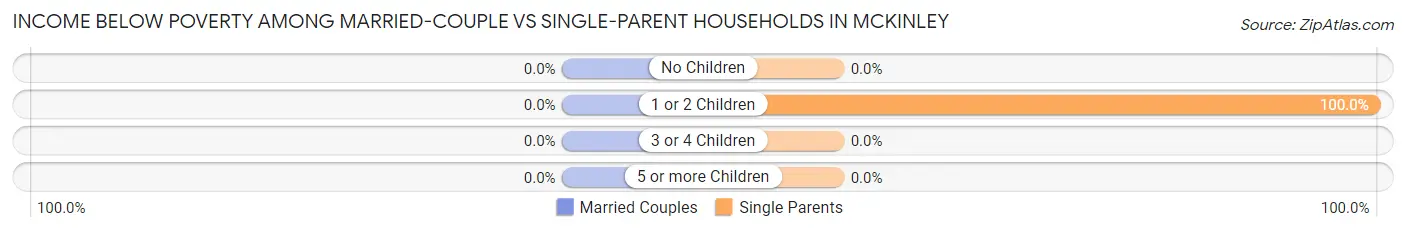
| Children | Married-Couple Families | Single-Parent Households |
| No Children | 0 (0.0%) | 0 (0.0%) |
| 1 or 2 Children | 0 (0.0%) | 3 (100.0%) |
| 3 or 4 Children | 0 (0.0%) | 0 (0.0%) |
| 5 or more Children | 0 (0.0%) | 0 (0.0%) |
| Total | 0 (0.0%) | 3 (60.0%) |
Race in McKinley
The most populous races in McKinley are White / Caucasian (103 | 99.0%), and Asian (1 | 1.0%).
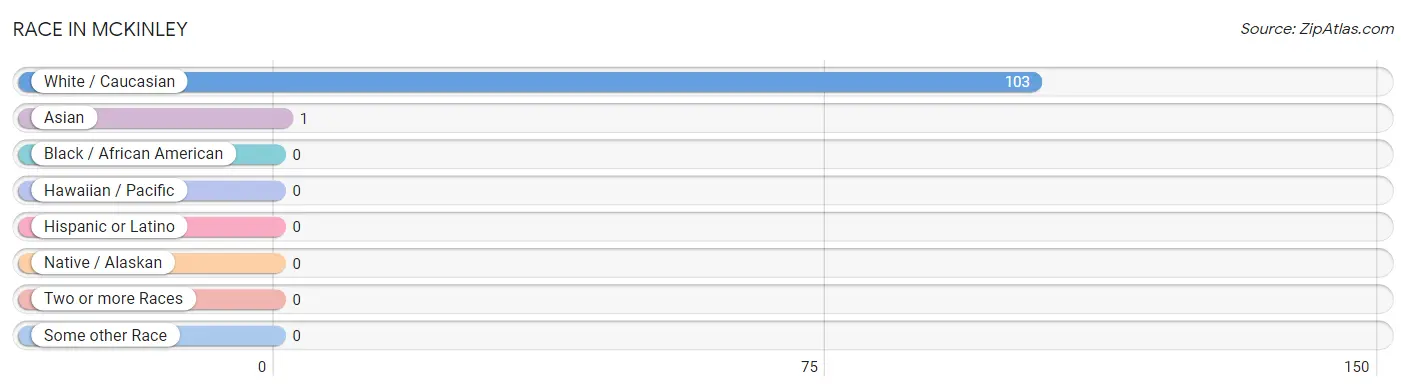
| Race | # Population | % Population |
| Asian | 1 | 1.0% |
| Black / African American | 0 | 0.0% |
| Hawaiian / Pacific | 0 | 0.0% |
| Hispanic or Latino | 0 | 0.0% |
| Native / Alaskan | 0 | 0.0% |
| White / Caucasian | 103 | 99.0% |
| Two or more Races | 0 | 0.0% |
| Some other Race | 0 | 0.0% |
| Total | 104 | 100.0% |
Ancestry in McKinley
The most populous ancestries reported in McKinley are Slovene (22 | 21.1%), German (21 | 20.2%), Norwegian (14 | 13.5%), Swedish (12 | 11.5%), and American (8 | 7.7%), together accounting for 74.0% of all McKinley residents.
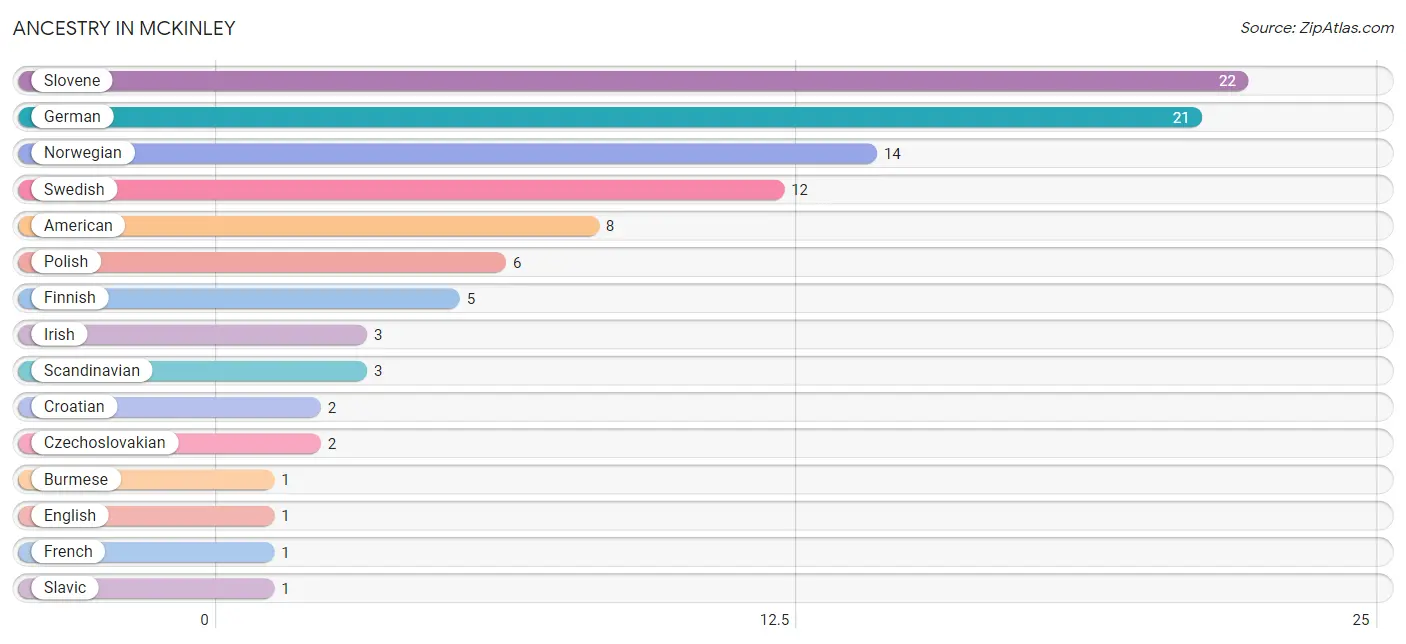
| Ancestry | # Population | % Population |
| American | 8 | 7.7% |
| Burmese | 1 | 1.0% |
| Croatian | 2 | 1.9% |
| Czechoslovakian | 2 | 1.9% |
| English | 1 | 1.0% |
| Finnish | 5 | 4.8% |
| French | 1 | 1.0% |
| German | 21 | 20.2% |
| Irish | 3 | 2.9% |
| Norwegian | 14 | 13.5% |
| Polish | 6 | 5.8% |
| Scandinavian | 3 | 2.9% |
| Slavic | 1 | 1.0% |
| Slovak | 1 | 1.0% |
| Slovene | 22 | 21.1% |
| Swedish | 12 | 11.5% |
| Yugoslavian | 1 | 1.0% | View All 17 Rows |
Immigrants in McKinley
The most numerous immigrant groups reported in McKinley came from Asia (1 | 1.0%), Eastern Asia (1 | 1.0%), and Korea (1 | 1.0%), together accounting for 2.9% of all McKinley residents.
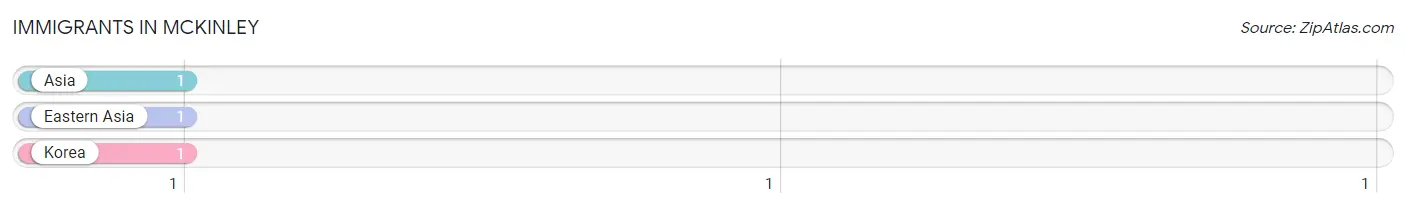
| Immigration Origin | # Population | % Population |
| Asia | 1 | 1.0% |
| Eastern Asia | 1 | 1.0% |
| Korea | 1 | 1.0% | View All 3 Rows |
Sex and Age in McKinley
Sex and Age in McKinley
The most populous age groups in McKinley are 60 to 64 Years (16 | 34.8%) for men and 60 to 64 Years (18 | 31.0%) for women.
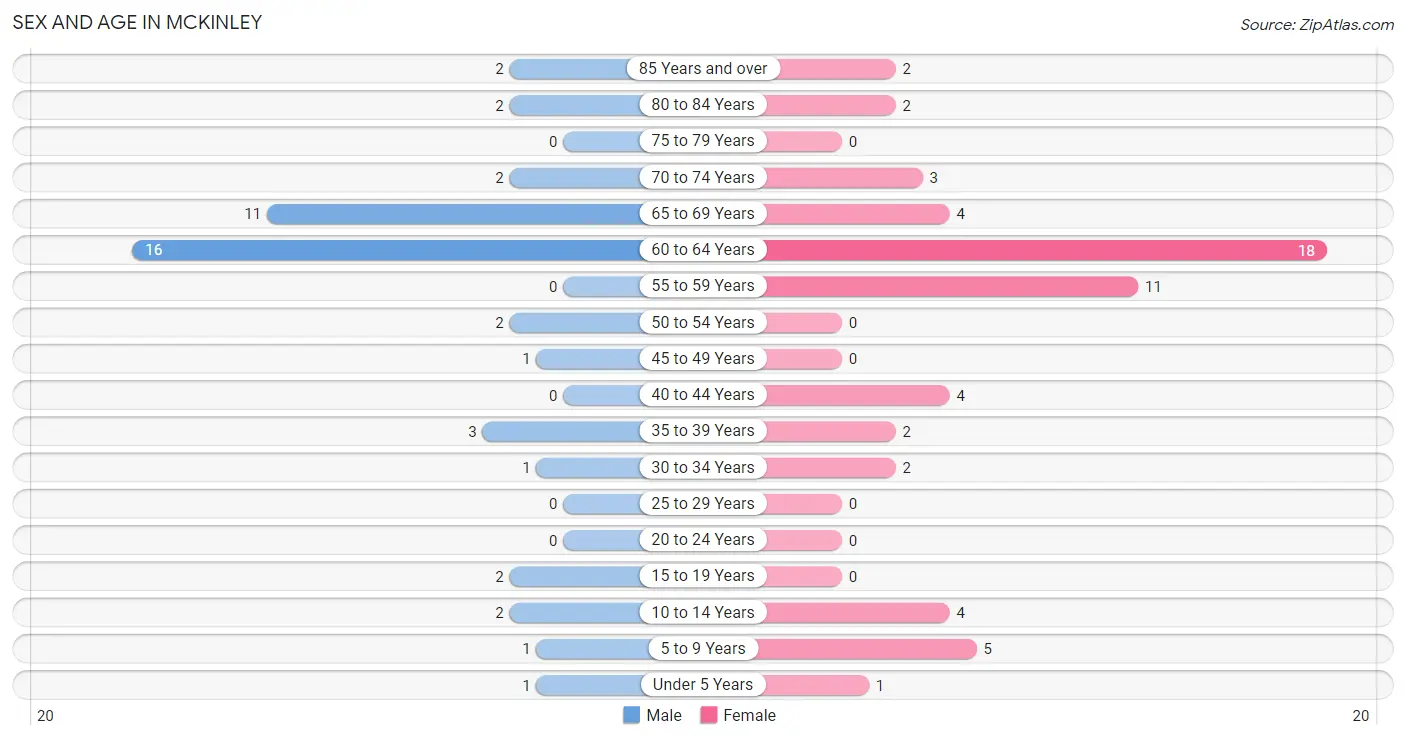
| Age Bracket | Male | Female |
| Under 5 Years | 1 (2.2%) | 1 (1.7%) |
| 5 to 9 Years | 1 (2.2%) | 5 (8.6%) |
| 10 to 14 Years | 2 (4.3%) | 4 (6.9%) |
| 15 to 19 Years | 2 (4.3%) | 0 (0.0%) |
| 20 to 24 Years | 0 (0.0%) | 0 (0.0%) |
| 25 to 29 Years | 0 (0.0%) | 0 (0.0%) |
| 30 to 34 Years | 1 (2.2%) | 2 (3.5%) |
| 35 to 39 Years | 3 (6.5%) | 2 (3.5%) |
| 40 to 44 Years | 0 (0.0%) | 4 (6.9%) |
| 45 to 49 Years | 1 (2.2%) | 0 (0.0%) |
| 50 to 54 Years | 2 (4.3%) | 0 (0.0%) |
| 55 to 59 Years | 0 (0.0%) | 11 (19.0%) |
| 60 to 64 Years | 16 (34.8%) | 18 (31.0%) |
| 65 to 69 Years | 11 (23.9%) | 4 (6.9%) |
| 70 to 74 Years | 2 (4.3%) | 3 (5.2%) |
| 75 to 79 Years | 0 (0.0%) | 0 (0.0%) |
| 80 to 84 Years | 2 (4.3%) | 2 (3.5%) |
| 85 Years and over | 2 (4.3%) | 2 (3.5%) |
| Total | 46 (100.0%) | 58 (100.0%) |
Families and Households in McKinley
Median Family Size in McKinley
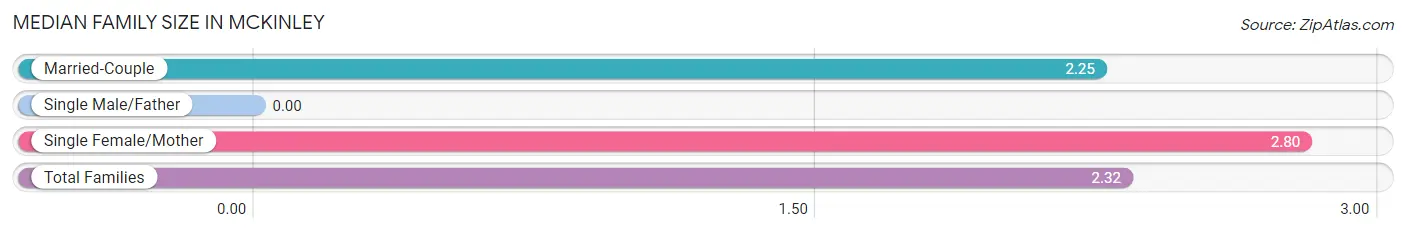
| Family Type | # Families | Family Size |
| Married-Couple | 32 (86.5%) | 2.25 |
| Single Male/Father | 0 (0.0%) | - |
| Single Female/Mother | 5 (13.5%) | 2.80 |
| Total Families | 37 (100.0%) | 2.32 |
Median Household Size in McKinley
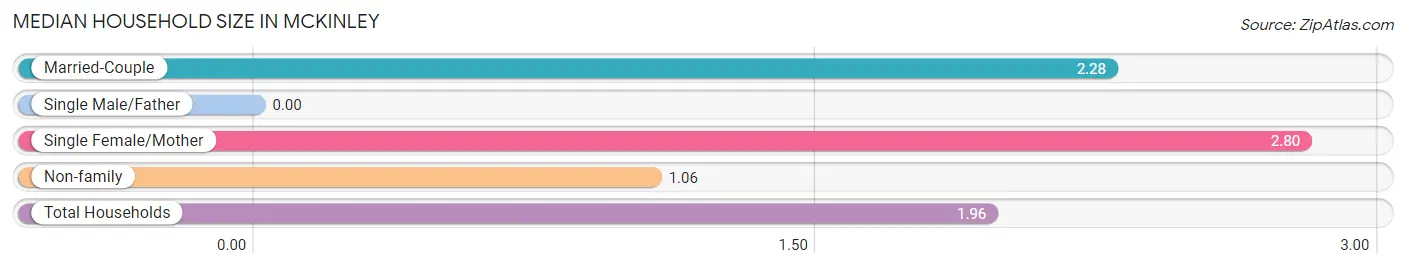
| Household Type | # Households | Household Size |
| Married-Couple | 32 (60.4%) | 2.28 |
| Single Male/Father | 0 (0.0%) | - |
| Single Female/Mother | 5 (9.4%) | 2.80 |
| Non-family | 16 (30.2%) | 1.06 |
| Total Households | 53 (100.0%) | 1.96 |
Household Size by Marriage Status in McKinley
Out of a total of 53 households in McKinley, 37 (69.8%) are family households, while 16 (30.2%) are nonfamily households. The most numerous type of family households are 2-person households, comprising 29, and the most common type of nonfamily households are 1-person households, comprising 15.
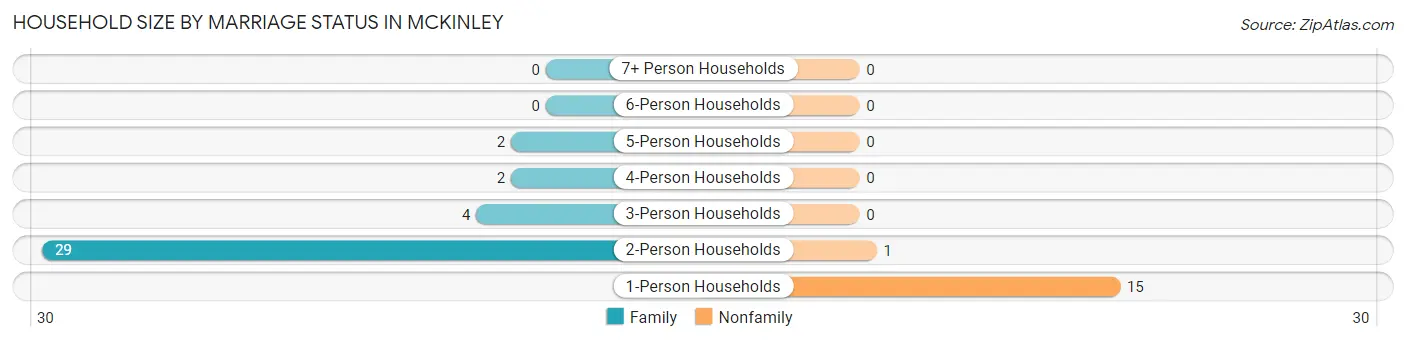
| Household Size | Family Households | Nonfamily Households |
| 1-Person Households | - | 15 (28.3%) |
| 2-Person Households | 29 (54.7%) | 1 (1.9%) |
| 3-Person Households | 4 (7.5%) | 0 (0.0%) |
| 4-Person Households | 2 (3.8%) | 0 (0.0%) |
| 5-Person Households | 2 (3.8%) | 0 (0.0%) |
| 6-Person Households | 0 (0.0%) | 0 (0.0%) |
| 7+ Person Households | 0 (0.0%) | 0 (0.0%) |
| Total | 37 (69.8%) | 16 (30.2%) |
Female Fertility in McKinley
Fertility by Age in McKinley
| Age Bracket | Women with Births | Births / 1,000 Women |
| 15 to 19 years | 0 (0.0%) | 0.0 |
| 20 to 34 years | 0 (0.0%) | 0.0 |
| 35 to 50 years | 0 (0.0%) | 0.0 |
| Total | 0 (0.0%) | 0.0 |
Fertility by Age by Marriage Status in McKinley
| Age Bracket | Married | Unmarried |
| 15 to 19 years | 0 (0.0%) | 0 (0.0%) |
| 20 to 34 years | 0 (0.0%) | 0 (0.0%) |
| 35 to 50 years | 0 (0.0%) | 0 (0.0%) |
| Total | 0 (0.0%) | 0 (0.0%) |
Fertility by Education in McKinley
| Educational Attainment | Women with Births | Births / 1,000 Women |
| Less than High School | 0 (0.0%) | 0.0 |
| High School Diploma | 0 (0.0%) | 0.0 |
| College or Associate's Degree | 0 (0.0%) | 0.0 |
| Bachelor's Degree | 0 (0.0%) | 0.0 |
| Graduate Degree | 0 (0.0%) | 0.0 |
| Total | 0 (0.0%) | 0.0 |
Fertility by Education by Marriage Status in McKinley
| Educational Attainment | Married | Unmarried |
| Less than High School | 0 (0.0%) | 0 (0.0%) |
| High School Diploma | 0 (0.0%) | 0 (0.0%) |
| College or Associate's Degree | 0 (0.0%) | 0 (0.0%) |
| Bachelor's Degree | 0 (0.0%) | 0 (0.0%) |
| Graduate Degree | 0 (0.0%) | 0 (0.0%) |
| Total | 0 (0.0%) | 0 (0.0%) |
Employment Characteristics in McKinley
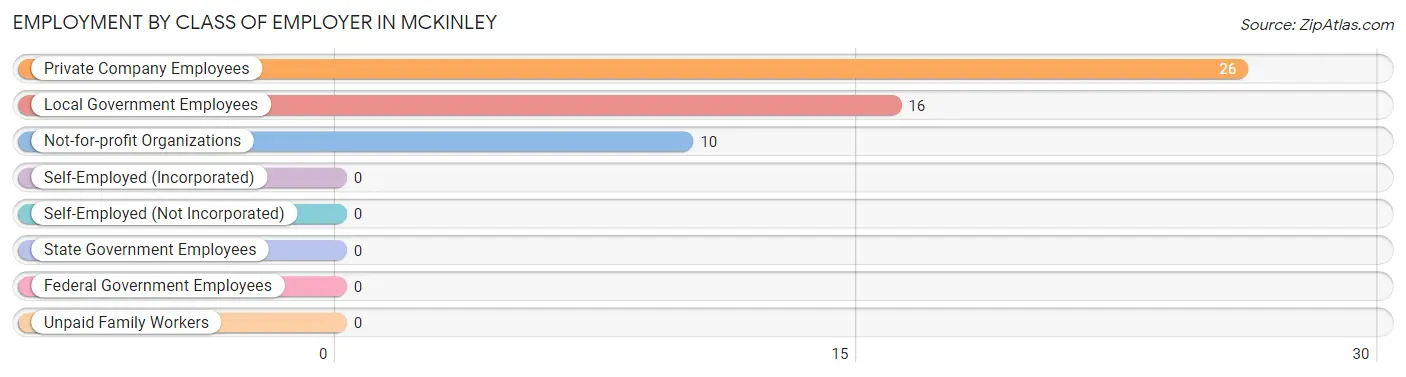
Employment by Class of Employer in McKinley
Among the 52 employed individuals in McKinley, private company employees (26 | 50.0%), local government employees (16 | 30.8%), and not-for-profit organizations (10 | 19.2%) make up the most common classes of employment.
| Employer Class | # Employees | % Employees |
| Private Company Employees | 26 | 50.0% |
| Self-Employed (Incorporated) | 0 | 0.0% |
| Self-Employed (Not Incorporated) | 0 | 0.0% |
| Not-for-profit Organizations | 10 | 19.2% |
| Local Government Employees | 16 | 30.8% |
| State Government Employees | 0 | 0.0% |
| Federal Government Employees | 0 | 0.0% |
| Unpaid Family Workers | 0 | 0.0% |
| Total | 52 | 100.0% |
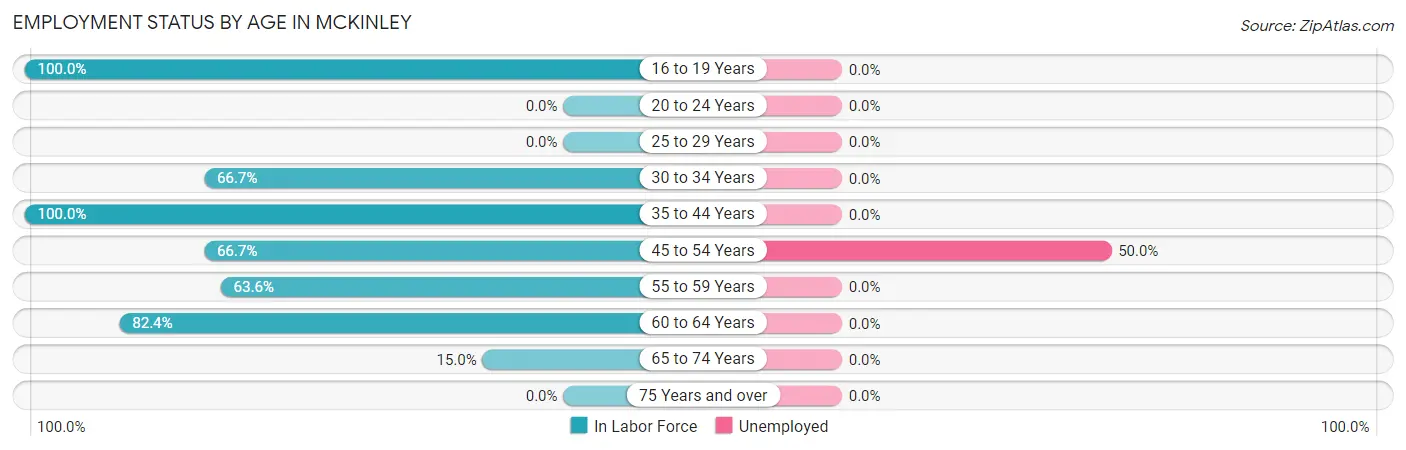
Employment Status by Age in McKinley
According to the labor force statistics for McKinley, out of the total population over 16 years of age (90), 58.9% or 53 individuals are in the labor force, with 1.9% or 1 of them unemployed. The age group with the highest labor force participation rate is 16 to 19 years, with 100.0% or 2 individuals in the labor force. Within the labor force, the 45 to 54 years age range has the highest percentage of unemployed individuals, with 50.0% or 1 of them being unemployed.
| Age Bracket | In Labor Force | Unemployed |
| 16 to 19 Years | 2 (100.0%) | 0 (0.0%) |
| 20 to 24 Years | 0 (0.0%) | 0 (0.0%) |
| 25 to 29 Years | 0 (0.0%) | 0 (0.0%) |
| 30 to 34 Years | 2 (66.7%) | 0 (0.0%) |
| 35 to 44 Years | 9 (100.0%) | 0 (0.0%) |
| 45 to 54 Years | 2 (66.7%) | 1 (50.0%) |
| 55 to 59 Years | 7 (63.6%) | 0 (0.0%) |
| 60 to 64 Years | 28 (82.4%) | 0 (0.0%) |
| 65 to 74 Years | 3 (15.0%) | 0 (0.0%) |
| 75 Years and over | 0 (0.0%) | 0 (0.0%) |
| Total | 53 (58.9%) | 1 (1.9%) |
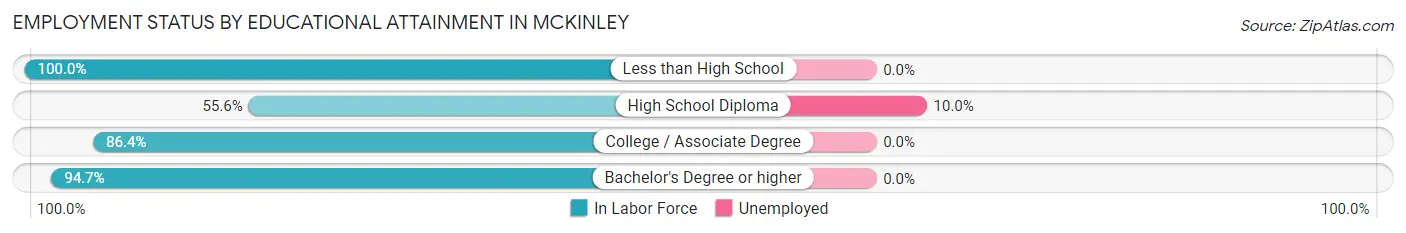
Employment Status by Educational Attainment in McKinley
According to labor force statistics for McKinley, 80.0% of individuals (48) out of the total population between 25 and 64 years of age (60) are in the labor force, with 2.1% or 1 of them being unemployed. The group with the highest labor force participation rate are those with the educational attainment of less than high school, with 100.0% or 1 individuals in the labor force. Within the labor force, individuals with high school diploma education have the highest percentage of unemployment, with 10.0% or 1 of them being unemployed.
| Educational Attainment | In Labor Force | Unemployed |
| Less than High School | 1 (100.0%) | 0 (0.0%) |
| High School Diploma | 10 (55.6%) | 2 (10.0%) |
| College / Associate Degree | 19 (86.4%) | 0 (0.0%) |
| Bachelor's Degree or higher | 18 (94.7%) | 0 (0.0%) |
| Total | 48 (80.0%) | 1 (2.1%) |
Employment Occupations by Sex in McKinley
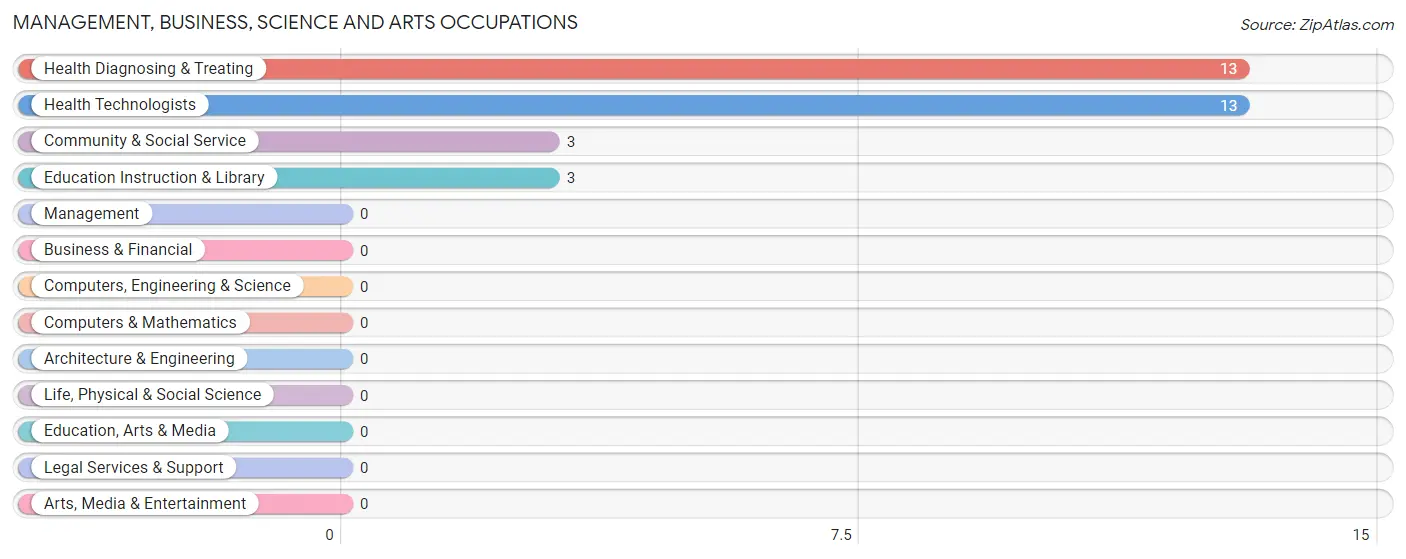
Management, Business, Science and Arts Occupations
The most common Management, Business, Science and Arts occupations in McKinley are Health Diagnosing & Treating (13 | 25.0%), Health Technologists (13 | 25.0%), Community & Social Service (3 | 5.8%), and Education Instruction & Library (3 | 5.8%).
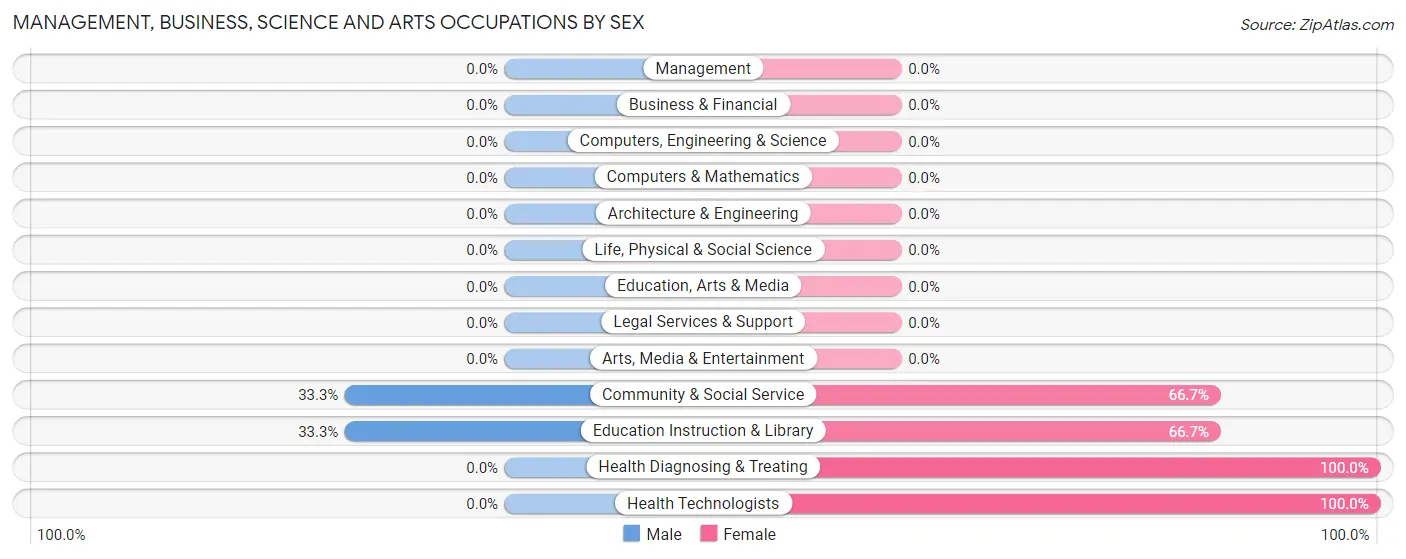
Management, Business, Science and Arts Occupations by Sex
Within the Management, Business, Science and Arts occupations in McKinley, the most male-oriented occupations are Community & Social Service (33.3%), and Education Instruction & Library (33.3%), while the most female-oriented occupations are Health Diagnosing & Treating (100.0%), Health Technologists (100.0%), and Community & Social Service (66.7%).
| Occupation | Male | Female |
| Management | 0 (0.0%) | 0 (0.0%) |
| Business & Financial | 0 (0.0%) | 0 (0.0%) |
| Computers, Engineering & Science | 0 (0.0%) | 0 (0.0%) |
| Computers & Mathematics | 0 (0.0%) | 0 (0.0%) |
| Architecture & Engineering | 0 (0.0%) | 0 (0.0%) |
| Life, Physical & Social Science | 0 (0.0%) | 0 (0.0%) |
| Community & Social Service | 1 (33.3%) | 2 (66.7%) |
| Education, Arts & Media | 0 (0.0%) | 0 (0.0%) |
| Legal Services & Support | 0 (0.0%) | 0 (0.0%) |
| Education Instruction & Library | 1 (33.3%) | 2 (66.7%) |
| Arts, Media & Entertainment | 0 (0.0%) | 0 (0.0%) |
| Health Diagnosing & Treating | 0 (0.0%) | 13 (100.0%) |
| Health Technologists | 0 (0.0%) | 13 (100.0%) |
| Total (Category) | 1 (6.2%) | 15 (93.8%) |
| Total (Overall) | 23 (44.2%) | 29 (55.8%) |
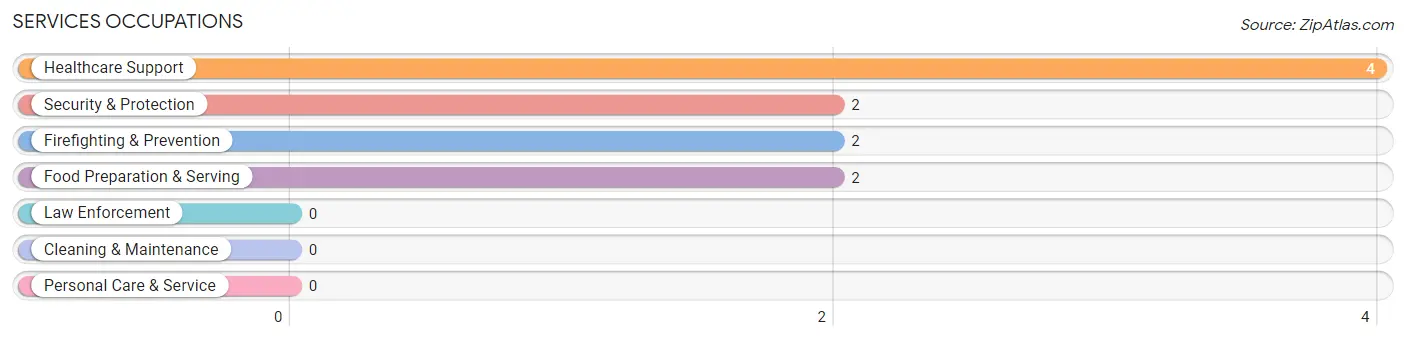
Services Occupations
The most common Services occupations in McKinley are Healthcare Support (4 | 7.7%), Security & Protection (2 | 3.8%), Firefighting & Prevention (2 | 3.8%), and Food Preparation & Serving (2 | 3.8%).
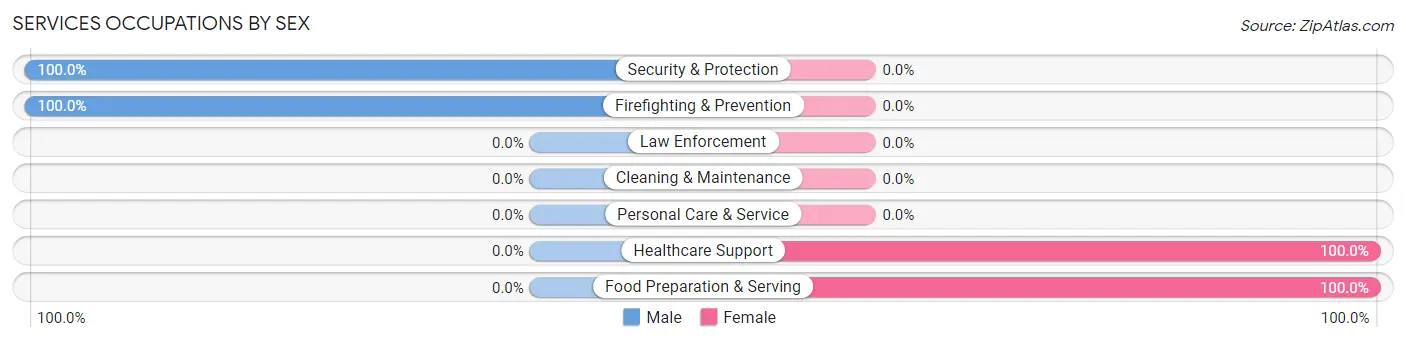
Services Occupations by Sex
Within the Services occupations in McKinley, the most male-oriented occupations are Security & Protection (100.0%), and Firefighting & Prevention (100.0%), while the most female-oriented occupations are Healthcare Support (100.0%), and Food Preparation & Serving (100.0%).
| Occupation | Male | Female |
| Healthcare Support | 0 (0.0%) | 4 (100.0%) |
| Security & Protection | 2 (100.0%) | 0 (0.0%) |
| Firefighting & Prevention | 2 (100.0%) | 0 (0.0%) |
| Law Enforcement | 0 (0.0%) | 0 (0.0%) |
| Food Preparation & Serving | 0 (0.0%) | 2 (100.0%) |
| Cleaning & Maintenance | 0 (0.0%) | 0 (0.0%) |
| Personal Care & Service | 0 (0.0%) | 0 (0.0%) |
| Total (Category) | 2 (25.0%) | 6 (75.0%) |
| Total (Overall) | 23 (44.2%) | 29 (55.8%) |
Sales and Office Occupations
The most common Sales and Office occupations in McKinley are Office & Administration (9 | 17.3%), and Sales & Related (2 | 3.8%).
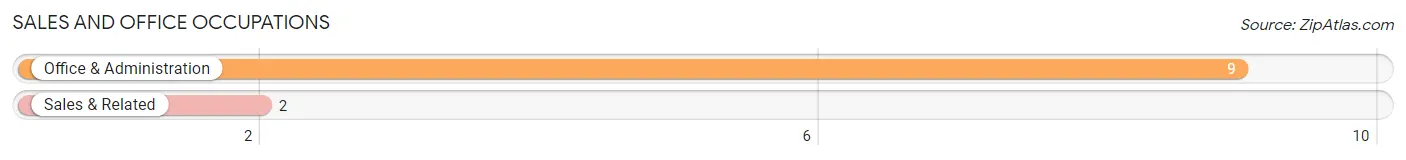
Sales and Office Occupations by Sex
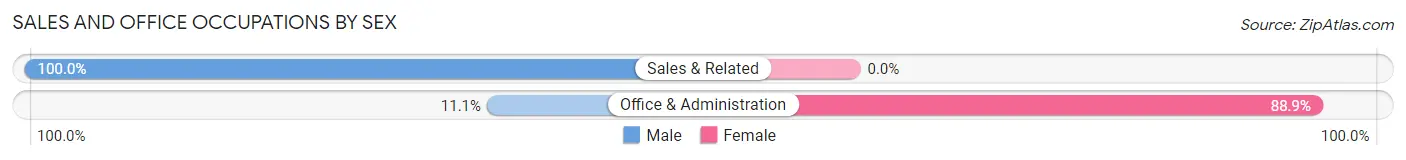
| Occupation | Male | Female |
| Sales & Related | 2 (100.0%) | 0 (0.0%) |
| Office & Administration | 1 (11.1%) | 8 (88.9%) |
| Total (Category) | 3 (27.3%) | 8 (72.7%) |
| Total (Overall) | 23 (44.2%) | 29 (55.8%) |
Natural Resources, Construction and Maintenance Occupations
The most common Natural Resources, Construction and Maintenance occupations in McKinley are , and Construction & Extraction (3 | 5.8%).
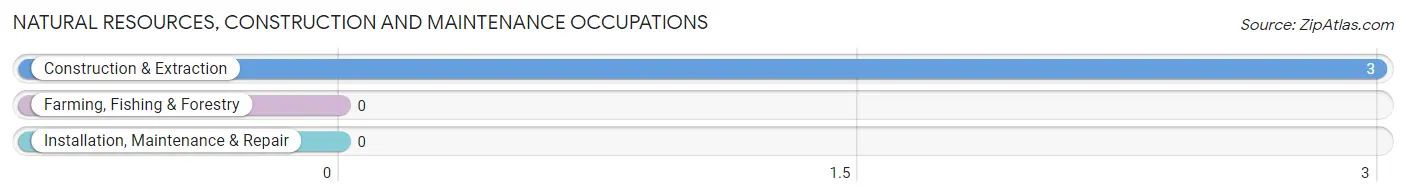
Natural Resources, Construction and Maintenance Occupations by Sex
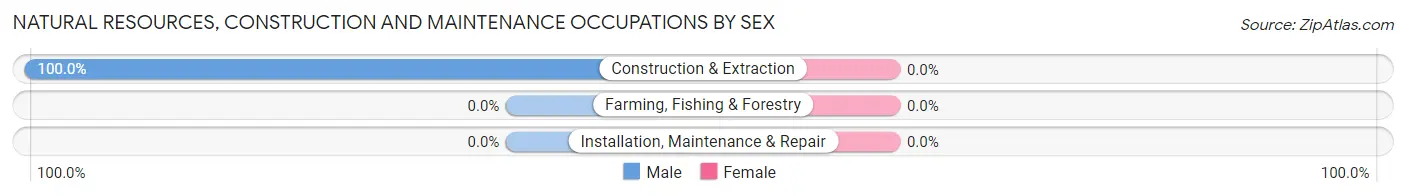
| Occupation | Male | Female |
| Farming, Fishing & Forestry | 0 (0.0%) | 0 (0.0%) |
| Construction & Extraction | 3 (100.0%) | 0 (0.0%) |
| Installation, Maintenance & Repair | 0 (0.0%) | 0 (0.0%) |
| Total (Category) | 3 (100.0%) | 0 (0.0%) |
| Total (Overall) | 23 (44.2%) | 29 (55.8%) |
Production, Transportation and Moving Occupations
The most common Production, Transportation and Moving occupations in McKinley are , and Transportation (14 | 26.9%).
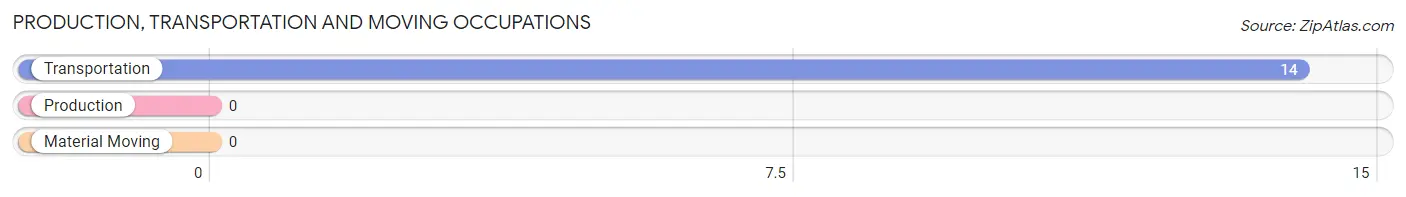
Production, Transportation and Moving Occupations by Sex
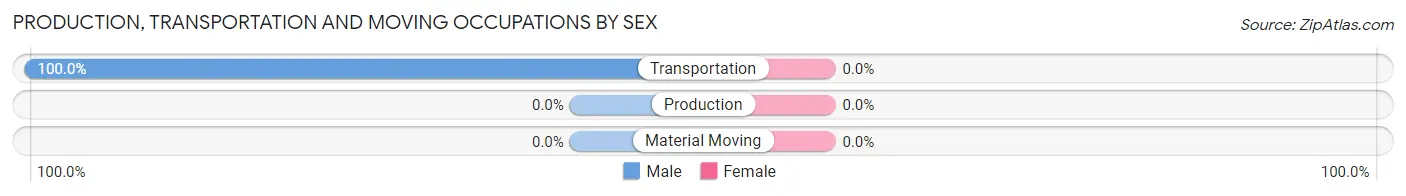
| Occupation | Male | Female |
| Production | 0 (0.0%) | 0 (0.0%) |
| Transportation | 14 (100.0%) | 0 (0.0%) |
| Material Moving | 0 (0.0%) | 0 (0.0%) |
| Total (Category) | 14 (100.0%) | 0 (0.0%) |
| Total (Overall) | 23 (44.2%) | 29 (55.8%) |
Employment Industries by Sex in McKinley
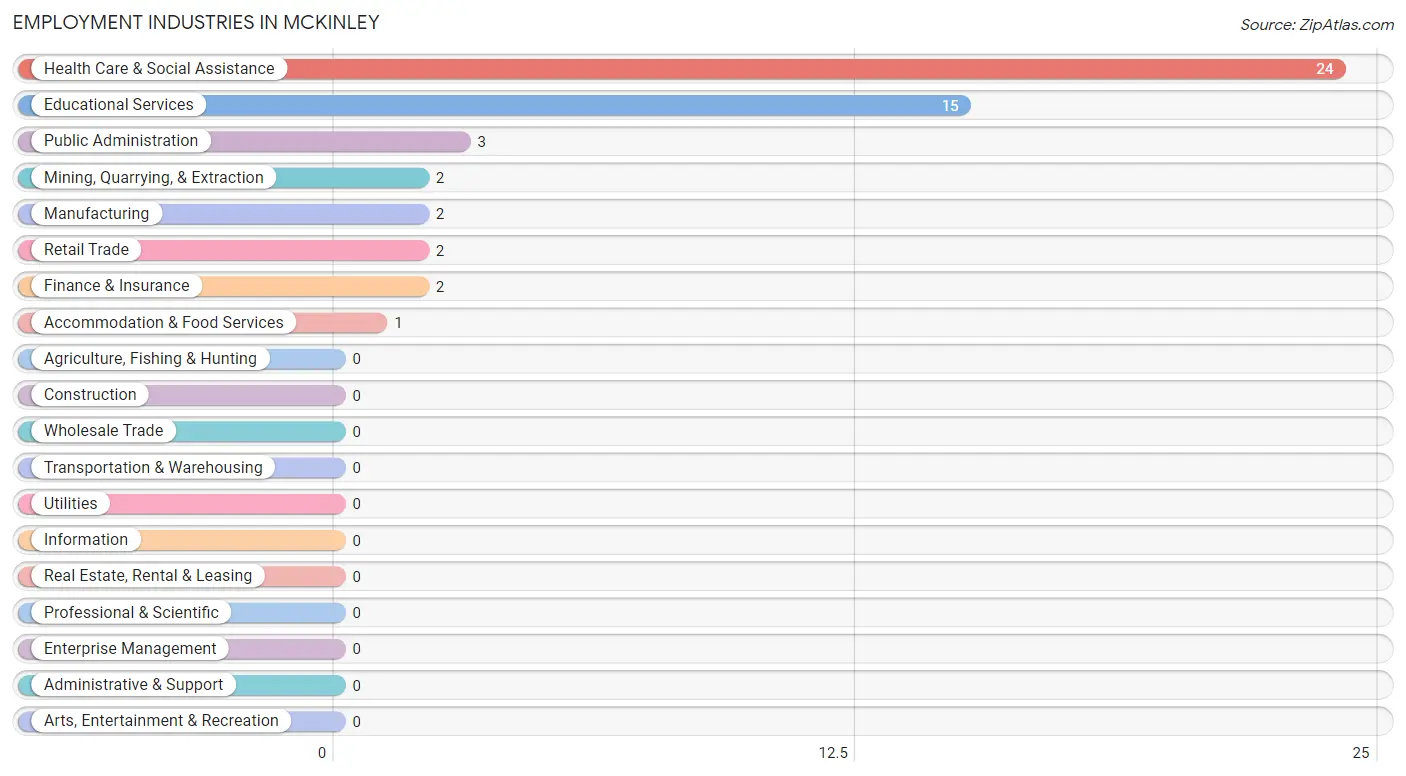
Employment Industries in McKinley
The major employment industries in McKinley include Health Care & Social Assistance (24 | 46.2%), Educational Services (15 | 28.8%), Public Administration (3 | 5.8%), Mining, Quarrying, & Extraction (2 | 3.8%), and Manufacturing (2 | 3.8%).
Employment Industries by Sex in McKinley
The McKinley industries that see more men than women are Mining, Quarrying, & Extraction (100.0%), Manufacturing (100.0%), and Retail Trade (100.0%), whereas the industries that tend to have a higher number of women are Finance & Insurance (100.0%), Health Care & Social Assistance (100.0%), and Accommodation & Food Services (100.0%).
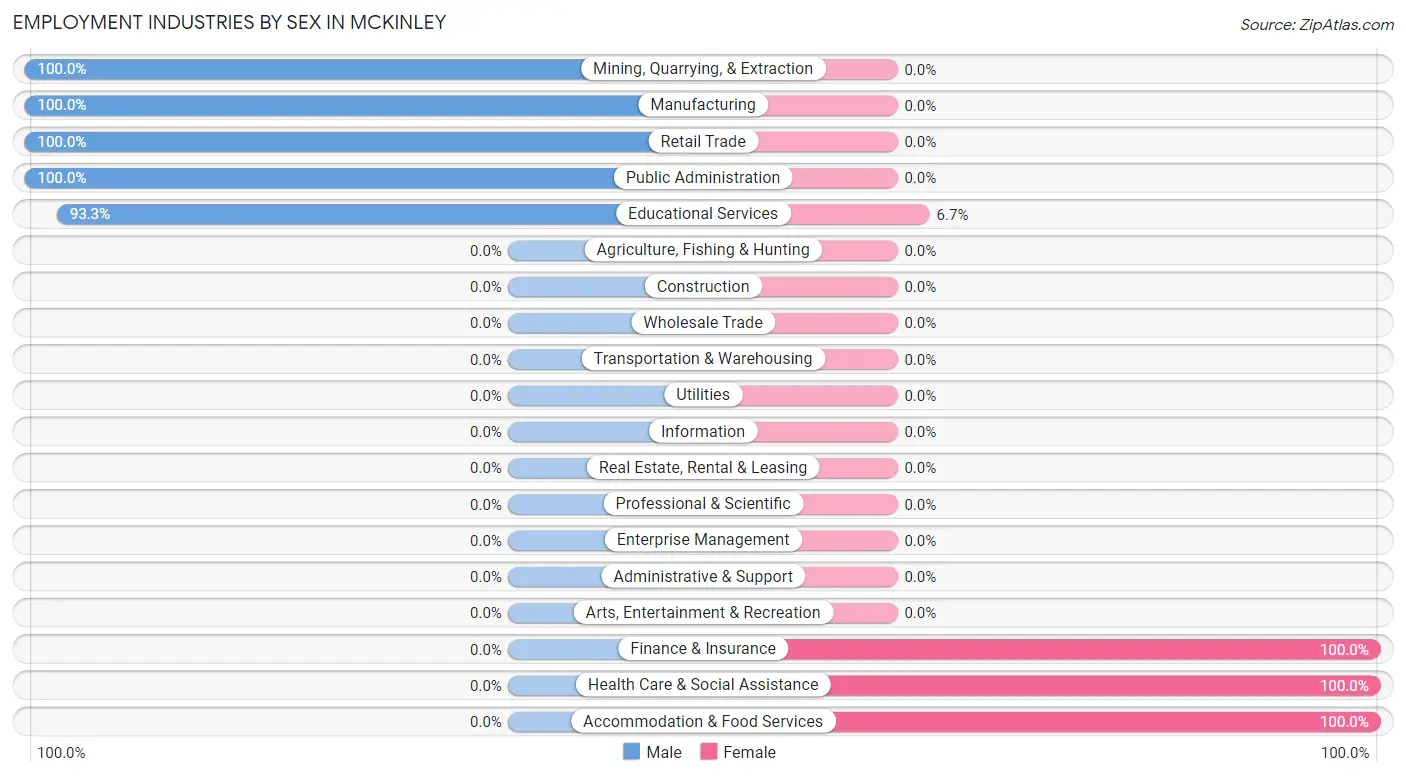
| Industry | Male | Female |
| Agriculture, Fishing & Hunting | 0 (0.0%) | 0 (0.0%) |
| Mining, Quarrying, & Extraction | 2 (100.0%) | 0 (0.0%) |
| Construction | 0 (0.0%) | 0 (0.0%) |
| Manufacturing | 2 (100.0%) | 0 (0.0%) |
| Wholesale Trade | 0 (0.0%) | 0 (0.0%) |
| Retail Trade | 2 (100.0%) | 0 (0.0%) |
| Transportation & Warehousing | 0 (0.0%) | 0 (0.0%) |
| Utilities | 0 (0.0%) | 0 (0.0%) |
| Information | 0 (0.0%) | 0 (0.0%) |
| Finance & Insurance | 0 (0.0%) | 2 (100.0%) |
| Real Estate, Rental & Leasing | 0 (0.0%) | 0 (0.0%) |
| Professional & Scientific | 0 (0.0%) | 0 (0.0%) |
| Enterprise Management | 0 (0.0%) | 0 (0.0%) |
| Administrative & Support | 0 (0.0%) | 0 (0.0%) |
| Educational Services | 14 (93.3%) | 1 (6.7%) |
| Health Care & Social Assistance | 0 (0.0%) | 24 (100.0%) |
| Arts, Entertainment & Recreation | 0 (0.0%) | 0 (0.0%) |
| Accommodation & Food Services | 0 (0.0%) | 1 (100.0%) |
| Public Administration | 3 (100.0%) | 0 (0.0%) |
| Total | 23 (44.2%) | 29 (55.8%) |
Education in McKinley
School Enrollment in McKinley
The most common levels of schooling among the 14 students in McKinley are elementary school (5 | 35.7%), middle school (4 | 28.6%), and kindergarten (3 | 21.4%).
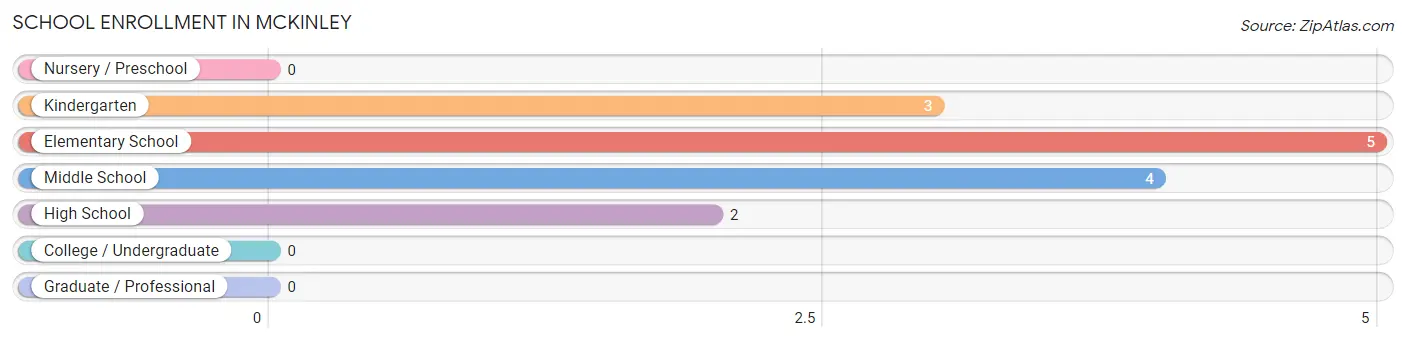
| School Level | # Students | % Students |
| Nursery / Preschool | 0 | 0.0% |
| Kindergarten | 3 | 21.4% |
| Elementary School | 5 | 35.7% |
| Middle School | 4 | 28.6% |
| High School | 2 | 14.3% |
| College / Undergraduate | 0 | 0.0% |
| Graduate / Professional | 0 | 0.0% |
| Total | 14 | 100.0% |
School Enrollment by Age by Funding Source in McKinley
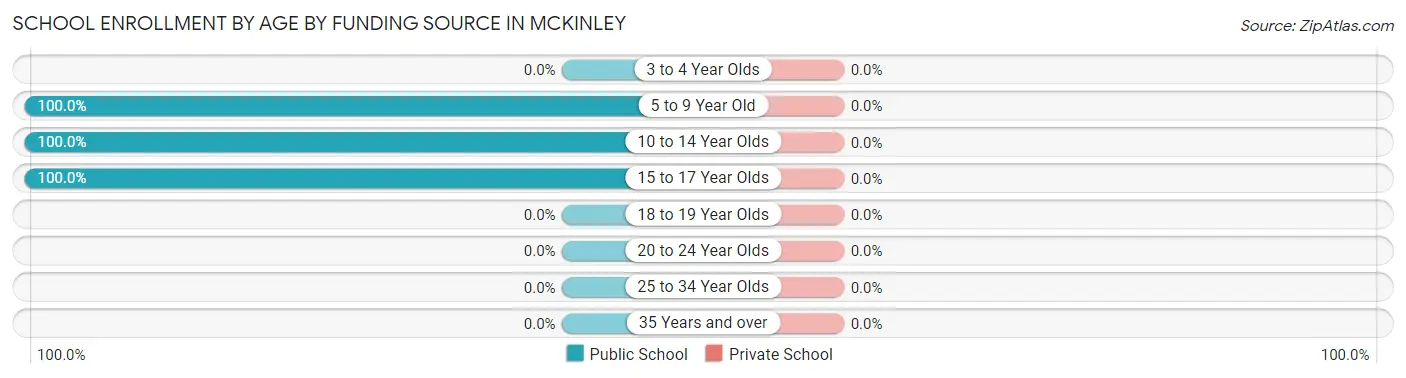
| Age Bracket | Public School | Private School |
| 3 to 4 Year Olds | 0 (0.0%) | 0 (0.0%) |
| 5 to 9 Year Old | 6 (100.0%) | 0 (0.0%) |
| 10 to 14 Year Olds | 6 (100.0%) | 0 (0.0%) |
| 15 to 17 Year Olds | 2 (100.0%) | 0 (0.0%) |
| 18 to 19 Year Olds | 0 (0.0%) | 0 (0.0%) |
| 20 to 24 Year Olds | 0 (0.0%) | 0 (0.0%) |
| 25 to 34 Year Olds | 0 (0.0%) | 0 (0.0%) |
| 35 Years and over | 0 (0.0%) | 0 (0.0%) |
| Total | 14 (100.0%) | 0 (0.0%) |
Educational Attainment by Field of Study in McKinley
Science & technology (13 | 48.1%), computers & mathematics (3 | 11.1%), business (3 | 11.1%), education (3 | 11.1%), and physical & health sciences (2 | 7.4%) are the most common fields of study among 27 individuals in McKinley who have obtained a bachelor's degree or higher.
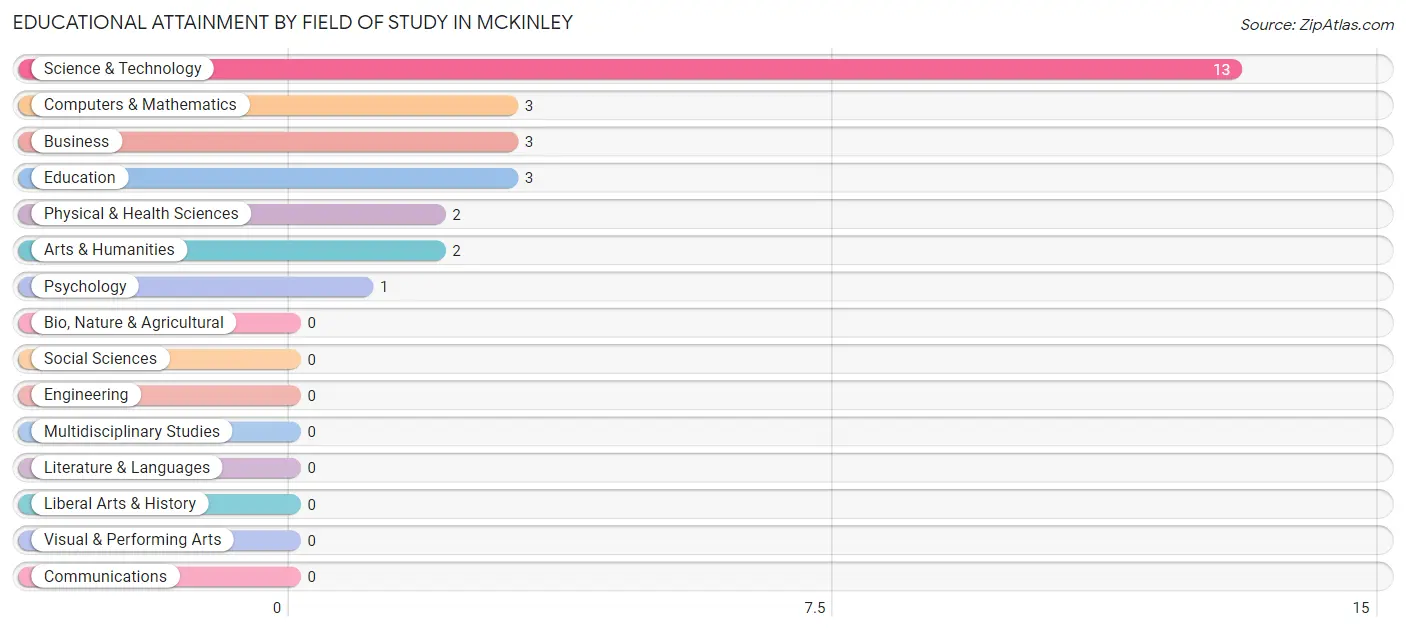
| Field of Study | # Graduates | % Graduates |
| Computers & Mathematics | 3 | 11.1% |
| Bio, Nature & Agricultural | 0 | 0.0% |
| Physical & Health Sciences | 2 | 7.4% |
| Psychology | 1 | 3.7% |
| Social Sciences | 0 | 0.0% |
| Engineering | 0 | 0.0% |
| Multidisciplinary Studies | 0 | 0.0% |
| Science & Technology | 13 | 48.1% |
| Business | 3 | 11.1% |
| Education | 3 | 11.1% |
| Literature & Languages | 0 | 0.0% |
| Liberal Arts & History | 0 | 0.0% |
| Visual & Performing Arts | 0 | 0.0% |
| Communications | 0 | 0.0% |
| Arts & Humanities | 2 | 7.4% |
| Total | 27 | 100.0% |
Transportation & Commute in McKinley
Vehicle Availability by Sex in McKinley
The most prevalent vehicle ownership categories in McKinley are males with 2 vehicles (15, accounting for 65.2%) and females with 2 vehicles (16, making up 51.7%).
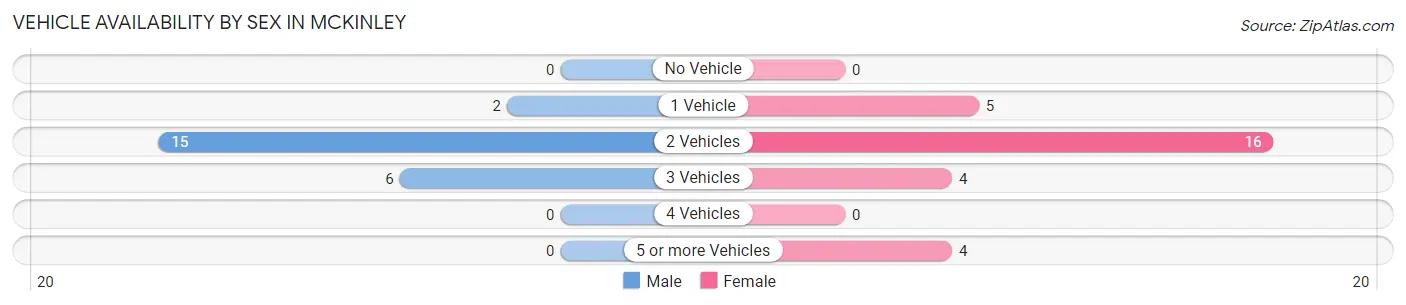
| Vehicles Available | Male | Female |
| No Vehicle | 0 (0.0%) | 0 (0.0%) |
| 1 Vehicle | 2 (8.7%) | 5 (17.2%) |
| 2 Vehicles | 15 (65.2%) | 16 (55.2%) |
| 3 Vehicles | 6 (26.1%) | 4 (13.8%) |
| 4 Vehicles | 0 (0.0%) | 0 (0.0%) |
| 5 or more Vehicles | 0 (0.0%) | 4 (13.8%) |
| Total | 23 (100.0%) | 29 (100.0%) |
Commute Time in McKinley
The most frequently occuring commute durations in McKinley are 10 to 14 minutes (19 commuters, 36.5%), 20 to 24 minutes (18 commuters, 34.6%), and 15 to 19 minutes (4 commuters, 7.7%).
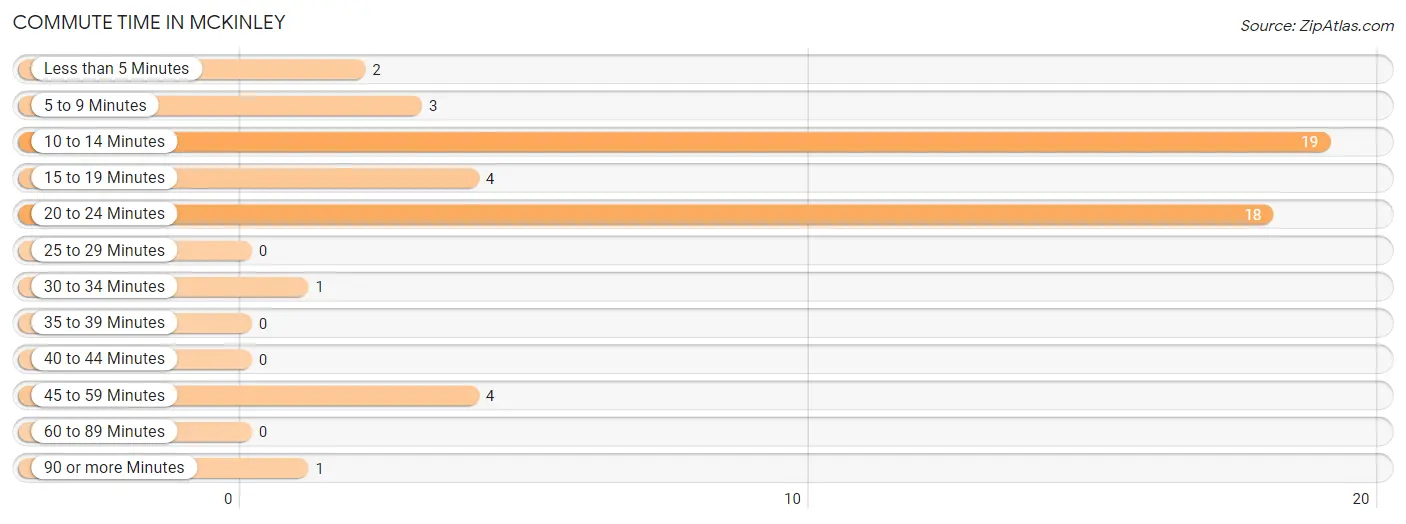
| Commute Time | # Commuters | % Commuters |
| Less than 5 Minutes | 2 | 3.8% |
| 5 to 9 Minutes | 3 | 5.8% |
| 10 to 14 Minutes | 19 | 36.5% |
| 15 to 19 Minutes | 4 | 7.7% |
| 20 to 24 Minutes | 18 | 34.6% |
| 25 to 29 Minutes | 0 | 0.0% |
| 30 to 34 Minutes | 1 | 1.9% |
| 35 to 39 Minutes | 0 | 0.0% |
| 40 to 44 Minutes | 0 | 0.0% |
| 45 to 59 Minutes | 4 | 7.7% |
| 60 to 89 Minutes | 0 | 0.0% |
| 90 or more Minutes | 1 | 1.9% |
Commute Time by Sex in McKinley
The most common commute times in McKinley are 10 to 14 minutes (14 commuters, 60.9%) for males and 20 to 24 minutes (18 commuters, 62.1%) for females.
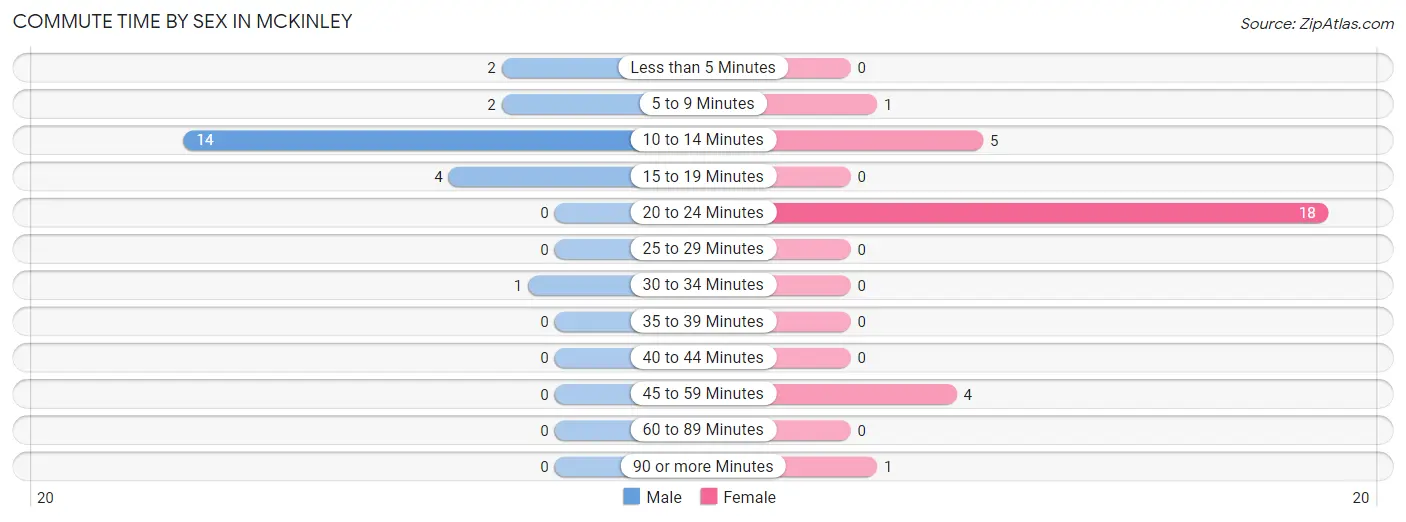
| Commute Time | Male | Female |
| Less than 5 Minutes | 2 (8.7%) | 0 (0.0%) |
| 5 to 9 Minutes | 2 (8.7%) | 1 (3.5%) |
| 10 to 14 Minutes | 14 (60.9%) | 5 (17.2%) |
| 15 to 19 Minutes | 4 (17.4%) | 0 (0.0%) |
| 20 to 24 Minutes | 0 (0.0%) | 18 (62.1%) |
| 25 to 29 Minutes | 0 (0.0%) | 0 (0.0%) |
| 30 to 34 Minutes | 1 (4.3%) | 0 (0.0%) |
| 35 to 39 Minutes | 0 (0.0%) | 0 (0.0%) |
| 40 to 44 Minutes | 0 (0.0%) | 0 (0.0%) |
| 45 to 59 Minutes | 0 (0.0%) | 4 (13.8%) |
| 60 to 89 Minutes | 0 (0.0%) | 0 (0.0%) |
| 90 or more Minutes | 0 (0.0%) | 1 (3.5%) |
Time of Departure to Work by Sex in McKinley
The most frequent times of departure to work in McKinley are 6:00 AM to 6:29 AM (13, 56.5%) for males and 5:30 AM to 5:59 AM (13, 44.8%) for females.
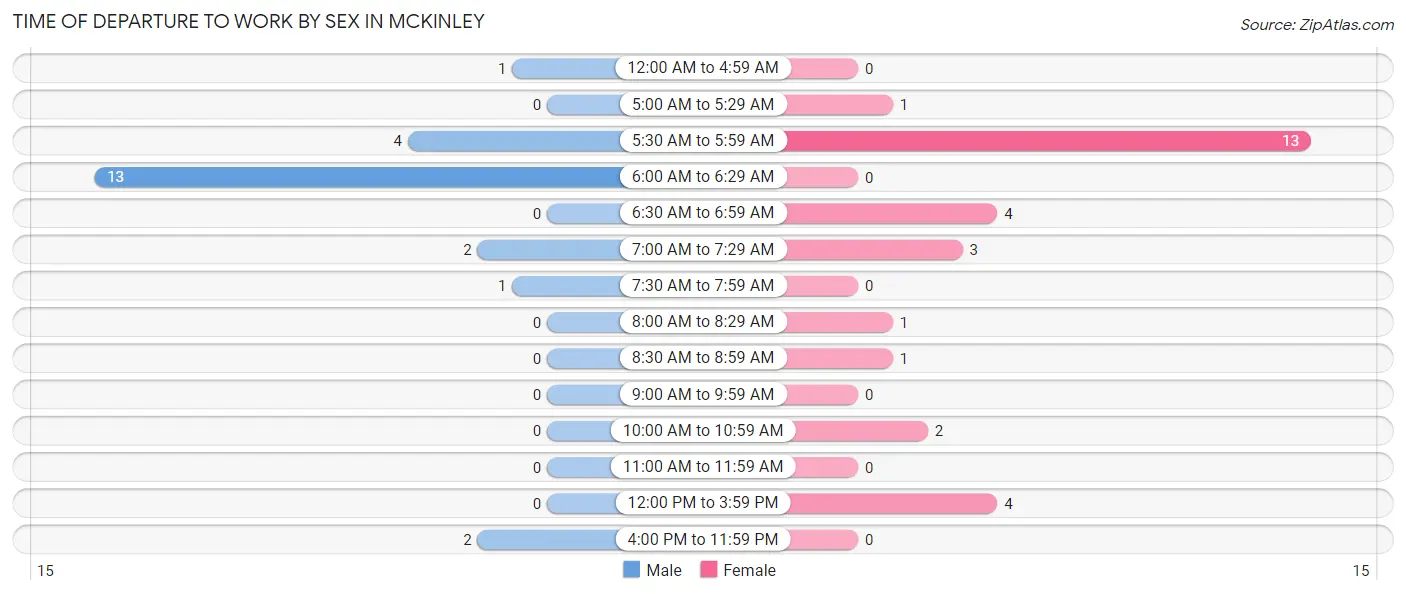
| Time of Departure | Male | Female |
| 12:00 AM to 4:59 AM | 1 (4.3%) | 0 (0.0%) |
| 5:00 AM to 5:29 AM | 0 (0.0%) | 1 (3.5%) |
| 5:30 AM to 5:59 AM | 4 (17.4%) | 13 (44.8%) |
| 6:00 AM to 6:29 AM | 13 (56.5%) | 0 (0.0%) |
| 6:30 AM to 6:59 AM | 0 (0.0%) | 4 (13.8%) |
| 7:00 AM to 7:29 AM | 2 (8.7%) | 3 (10.3%) |
| 7:30 AM to 7:59 AM | 1 (4.3%) | 0 (0.0%) |
| 8:00 AM to 8:29 AM | 0 (0.0%) | 1 (3.5%) |
| 8:30 AM to 8:59 AM | 0 (0.0%) | 1 (3.5%) |
| 9:00 AM to 9:59 AM | 0 (0.0%) | 0 (0.0%) |
| 10:00 AM to 10:59 AM | 0 (0.0%) | 2 (6.9%) |
| 11:00 AM to 11:59 AM | 0 (0.0%) | 0 (0.0%) |
| 12:00 PM to 3:59 PM | 0 (0.0%) | 4 (13.8%) |
| 4:00 PM to 11:59 PM | 2 (8.7%) | 0 (0.0%) |
| Total | 23 (100.0%) | 29 (100.0%) |
Housing Occupancy in McKinley
Occupancy by Ownership in McKinley
Of the total 53 dwellings in McKinley, owner-occupied units account for 50 (94.3%), while renter-occupied units make up 3 (5.7%).
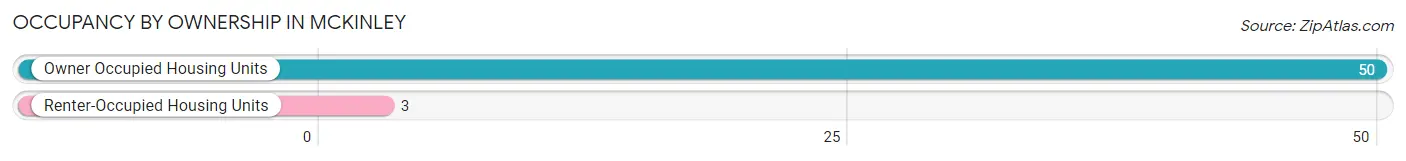
| Occupancy | # Housing Units | % Housing Units |
| Owner Occupied Housing Units | 50 | 94.3% |
| Renter-Occupied Housing Units | 3 | 5.7% |
| Total Occupied Housing Units | 53 | 100.0% |
Occupancy by Household Size in McKinley
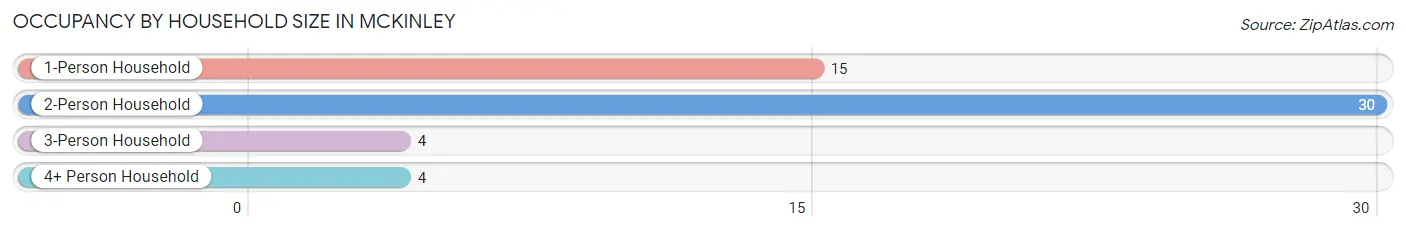
| Household Size | # Housing Units | % Housing Units |
| 1-Person Household | 15 | 28.3% |
| 2-Person Household | 30 | 56.6% |
| 3-Person Household | 4 | 7.5% |
| 4+ Person Household | 4 | 7.5% |
| Total Housing Units | 53 | 100.0% |
Occupancy by Ownership by Household Size in McKinley
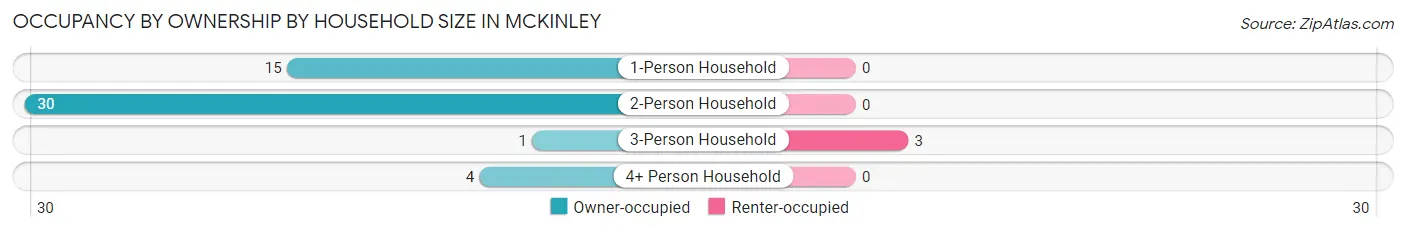
| Household Size | Owner-occupied | Renter-occupied |
| 1-Person Household | 15 (100.0%) | 0 (0.0%) |
| 2-Person Household | 30 (100.0%) | 0 (0.0%) |
| 3-Person Household | 1 (25.0%) | 3 (75.0%) |
| 4+ Person Household | 4 (100.0%) | 0 (0.0%) |
| Total Housing Units | 50 (94.3%) | 3 (5.7%) |
Occupancy by Educational Attainment in McKinley
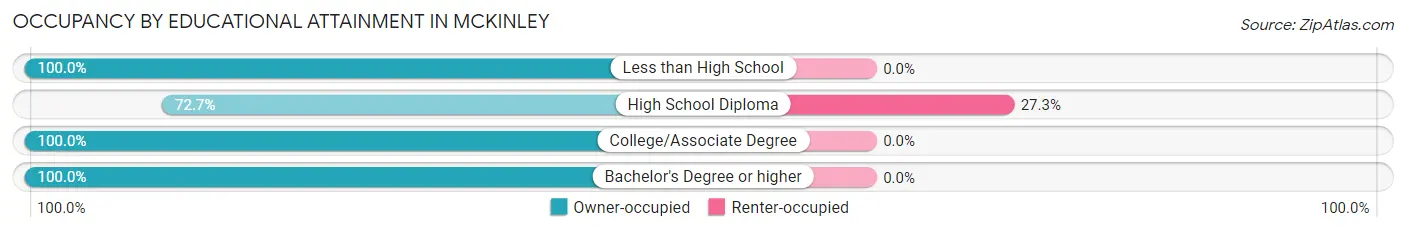
| Household Size | Owner-occupied | Renter-occupied |
| Less than High School | 2 (100.0%) | 0 (0.0%) |
| High School Diploma | 8 (72.7%) | 3 (27.3%) |
| College/Associate Degree | 30 (100.0%) | 0 (0.0%) |
| Bachelor's Degree or higher | 10 (100.0%) | 0 (0.0%) |
Occupancy by Age of Householder in McKinley
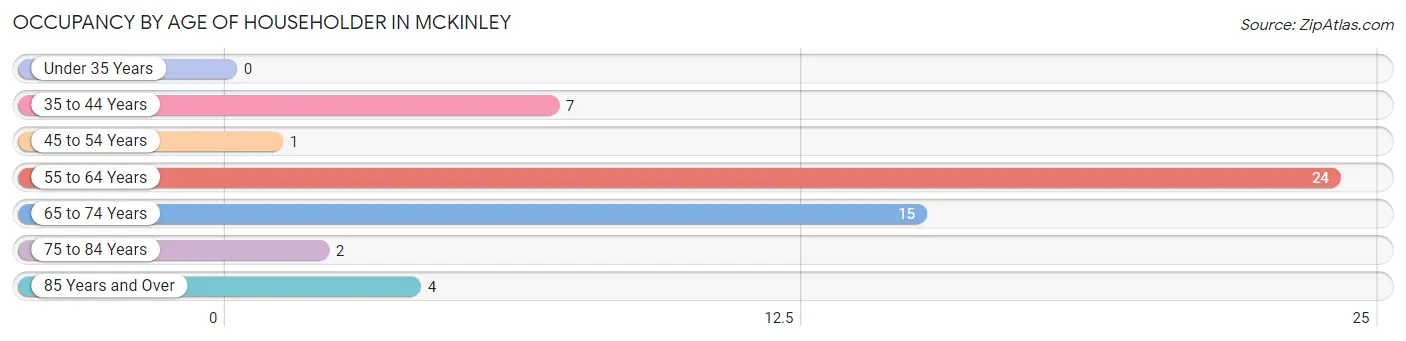
| Age Bracket | # Households | % Households |
| Under 35 Years | 0 | 0.0% |
| 35 to 44 Years | 7 | 13.2% |
| 45 to 54 Years | 1 | 1.9% |
| 55 to 64 Years | 24 | 45.3% |
| 65 to 74 Years | 15 | 28.3% |
| 75 to 84 Years | 2 | 3.8% |
| 85 Years and Over | 4 | 7.5% |
| Total | 53 | 100.0% |
Housing Finances in McKinley
Median Income by Occupancy in McKinley
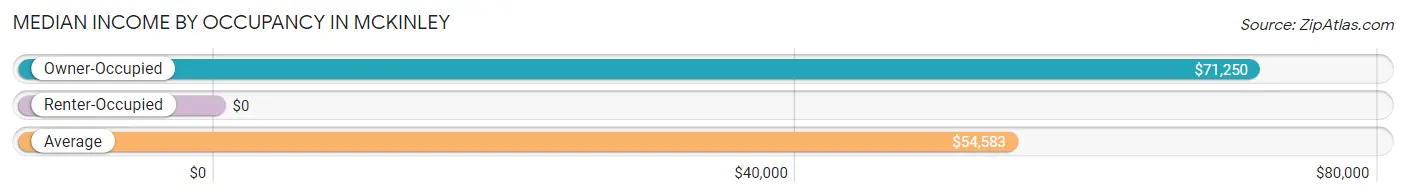
| Occupancy Type | # Households | Median Income |
| Owner-Occupied | 50 (94.3%) | $71,250 |
| Renter-Occupied | 3 (5.7%) | $0 |
| Average | 53 (100.0%) | $54,583 |
Occupancy by Householder Income Bracket in McKinley
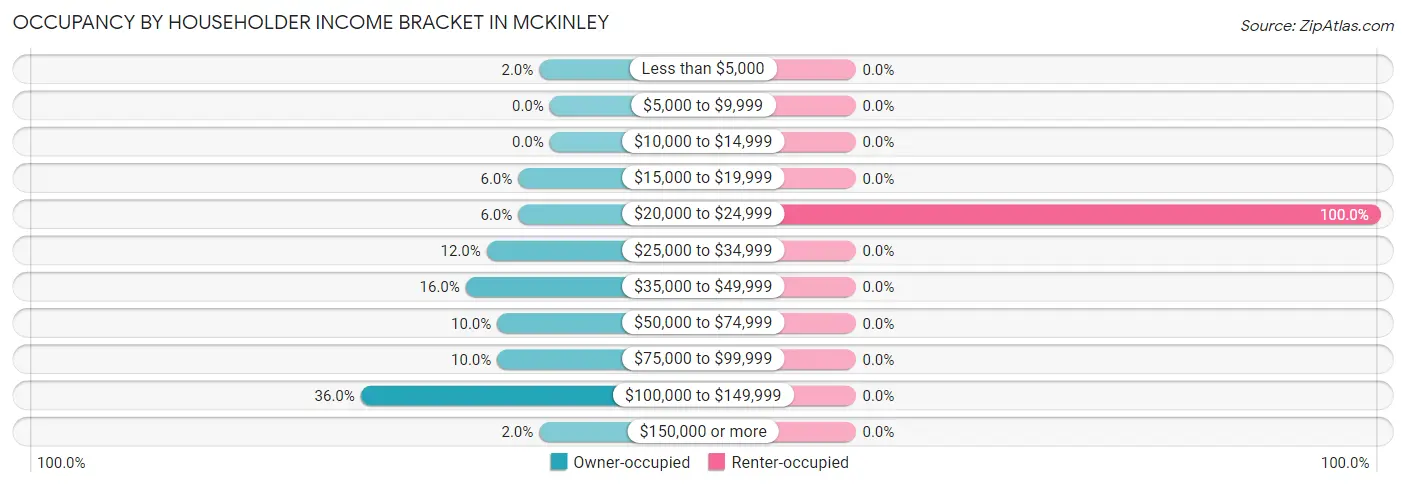
| Income Bracket | Owner-occupied | Renter-occupied |
| Less than $5,000 | 1 (2.0%) | 0 (0.0%) |
| $5,000 to $9,999 | 0 (0.0%) | 0 (0.0%) |
| $10,000 to $14,999 | 0 (0.0%) | 0 (0.0%) |
| $15,000 to $19,999 | 3 (6.0%) | 0 (0.0%) |
| $20,000 to $24,999 | 3 (6.0%) | 3 (100.0%) |
| $25,000 to $34,999 | 6 (12.0%) | 0 (0.0%) |
| $35,000 to $49,999 | 8 (16.0%) | 0 (0.0%) |
| $50,000 to $74,999 | 5 (10.0%) | 0 (0.0%) |
| $75,000 to $99,999 | 5 (10.0%) | 0 (0.0%) |
| $100,000 to $149,999 | 18 (36.0%) | 0 (0.0%) |
| $150,000 or more | 1 (2.0%) | 0 (0.0%) |
| Total | 50 (100.0%) | 3 (100.0%) |
Monthly Housing Cost Tiers in McKinley
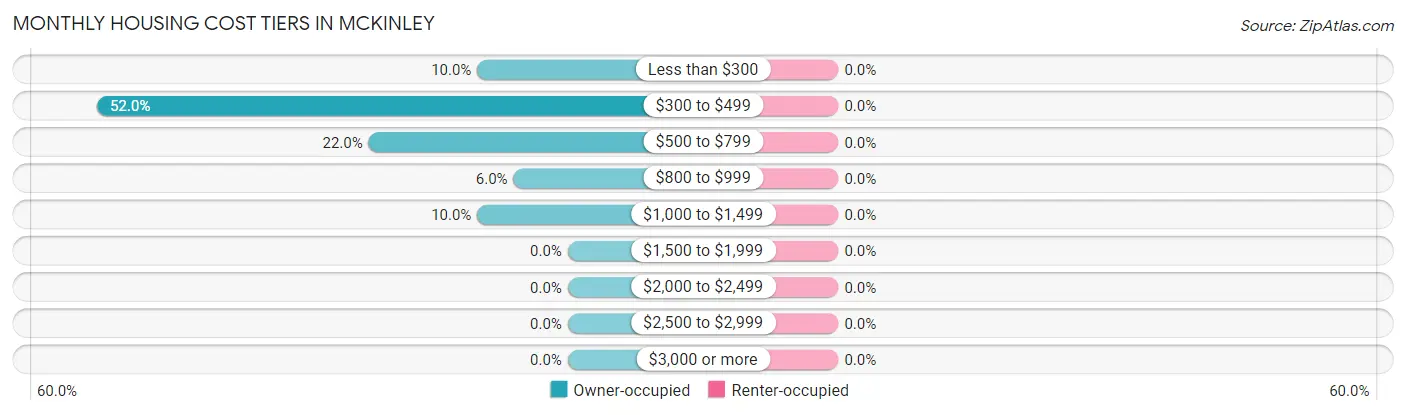
| Monthly Cost | Owner-occupied | Renter-occupied |
| Less than $300 | 5 (10.0%) | 0 (0.0%) |
| $300 to $499 | 26 (52.0%) | 0 (0.0%) |
| $500 to $799 | 11 (22.0%) | 0 (0.0%) |
| $800 to $999 | 3 (6.0%) | 0 (0.0%) |
| $1,000 to $1,499 | 5 (10.0%) | 0 (0.0%) |
| $1,500 to $1,999 | 0 (0.0%) | 0 (0.0%) |
| $2,000 to $2,499 | 0 (0.0%) | 0 (0.0%) |
| $2,500 to $2,999 | 0 (0.0%) | 0 (0.0%) |
| $3,000 or more | 0 (0.0%) | 0 (0.0%) |
| Total | 50 (100.0%) | 3 (100.0%) |
Physical Housing Characteristics in McKinley
Housing Structures in McKinley
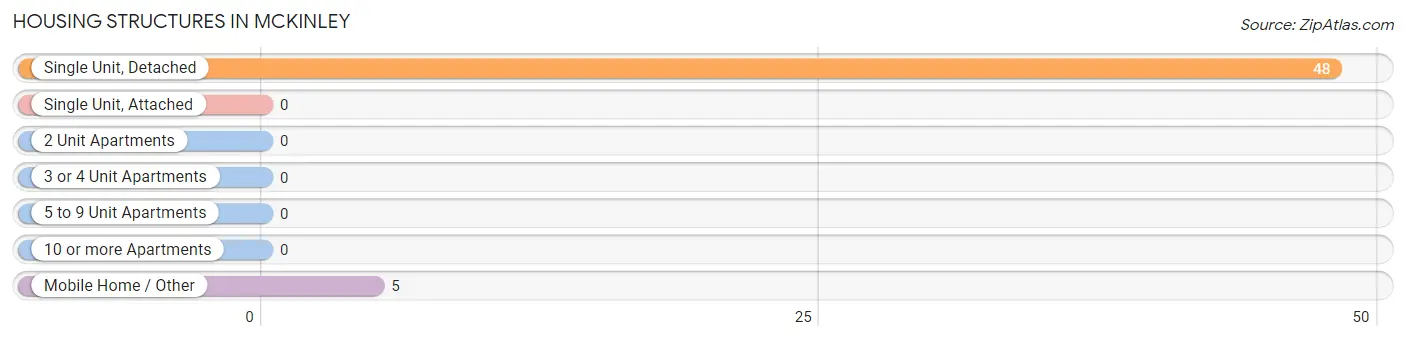
| Structure Type | # Housing Units | % Housing Units |
| Single Unit, Detached | 48 | 90.6% |
| Single Unit, Attached | 0 | 0.0% |
| 2 Unit Apartments | 0 | 0.0% |
| 3 or 4 Unit Apartments | 0 | 0.0% |
| 5 to 9 Unit Apartments | 0 | 0.0% |
| 10 or more Apartments | 0 | 0.0% |
| Mobile Home / Other | 5 | 9.4% |
| Total | 53 | 100.0% |
Housing Structures by Occupancy in McKinley
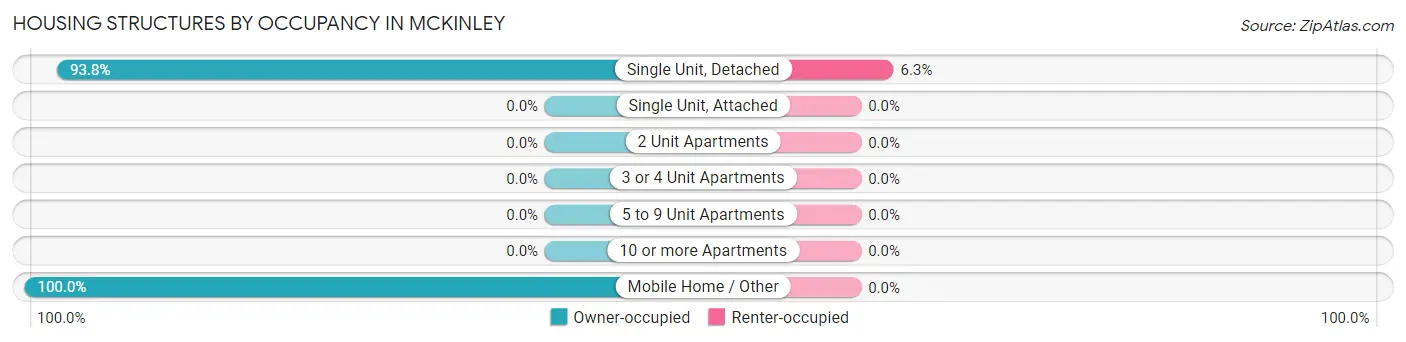
| Structure Type | Owner-occupied | Renter-occupied |
| Single Unit, Detached | 45 (93.8%) | 3 (6.2%) |
| Single Unit, Attached | 0 (0.0%) | 0 (0.0%) |
| 2 Unit Apartments | 0 (0.0%) | 0 (0.0%) |
| 3 or 4 Unit Apartments | 0 (0.0%) | 0 (0.0%) |
| 5 to 9 Unit Apartments | 0 (0.0%) | 0 (0.0%) |
| 10 or more Apartments | 0 (0.0%) | 0 (0.0%) |
| Mobile Home / Other | 5 (100.0%) | 0 (0.0%) |
| Total | 50 (94.3%) | 3 (5.7%) |
Housing Structures by Number of Rooms in McKinley
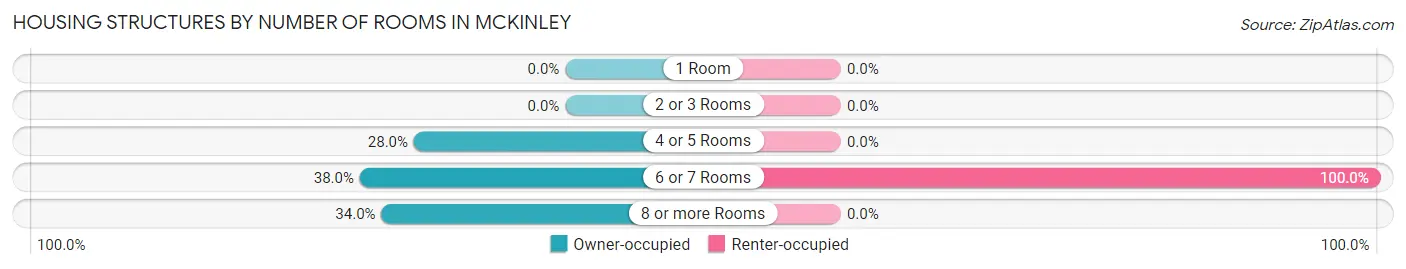
| Number of Rooms | Owner-occupied | Renter-occupied |
| 1 Room | 0 (0.0%) | 0 (0.0%) |
| 2 or 3 Rooms | 0 (0.0%) | 0 (0.0%) |
| 4 or 5 Rooms | 14 (28.0%) | 0 (0.0%) |
| 6 or 7 Rooms | 19 (38.0%) | 3 (100.0%) |
| 8 or more Rooms | 17 (34.0%) | 0 (0.0%) |
| Total | 50 (100.0%) | 3 (100.0%) |
Housing Structure by Heating Type in McKinley
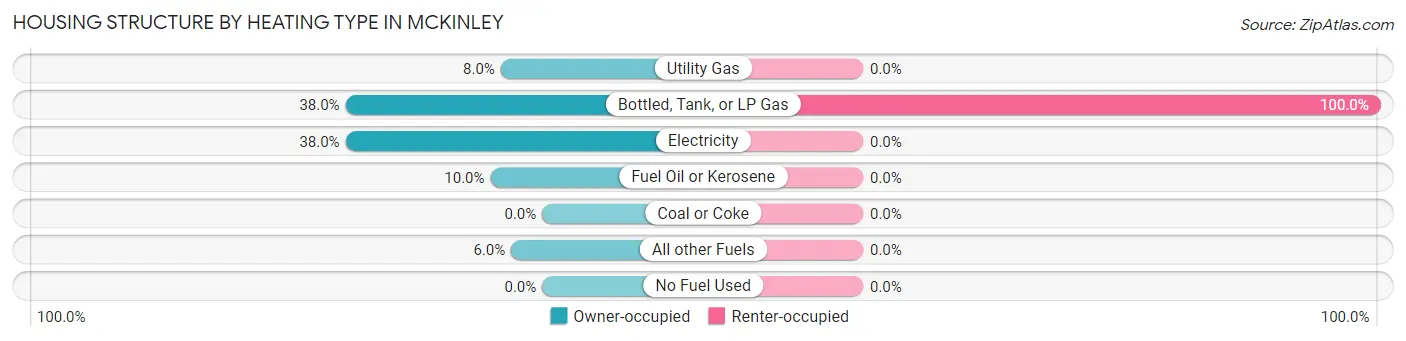
| Heating Type | Owner-occupied | Renter-occupied |
| Utility Gas | 4 (8.0%) | 0 (0.0%) |
| Bottled, Tank, or LP Gas | 19 (38.0%) | 3 (100.0%) |
| Electricity | 19 (38.0%) | 0 (0.0%) |
| Fuel Oil or Kerosene | 5 (10.0%) | 0 (0.0%) |
| Coal or Coke | 0 (0.0%) | 0 (0.0%) |
| All other Fuels | 3 (6.0%) | 0 (0.0%) |
| No Fuel Used | 0 (0.0%) | 0 (0.0%) |
| Total | 50 (100.0%) | 3 (100.0%) |
Household Vehicle Usage in McKinley
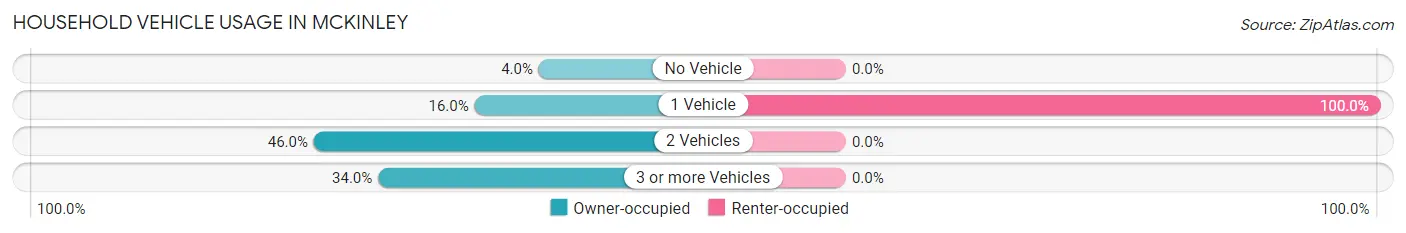
| Vehicles per Household | Owner-occupied | Renter-occupied |
| No Vehicle | 2 (4.0%) | 0 (0.0%) |
| 1 Vehicle | 8 (16.0%) | 3 (100.0%) |
| 2 Vehicles | 23 (46.0%) | 0 (0.0%) |
| 3 or more Vehicles | 17 (34.0%) | 0 (0.0%) |
| Total | 50 (100.0%) | 3 (100.0%) |
Real Estate & Mortgages in McKinley
Real Estate and Mortgage Overview in McKinley
| Characteristic | Without Mortgage | With Mortgage |
| Housing Units | 42 | 8 |
| Median Property Value | $120,800 | $0 |
| Median Household Income | - | - |
| Monthly Housing Costs | $444 | $0 |
| Real Estate Taxes | $1,024 | $0 |
Property Value by Mortgage Status in McKinley
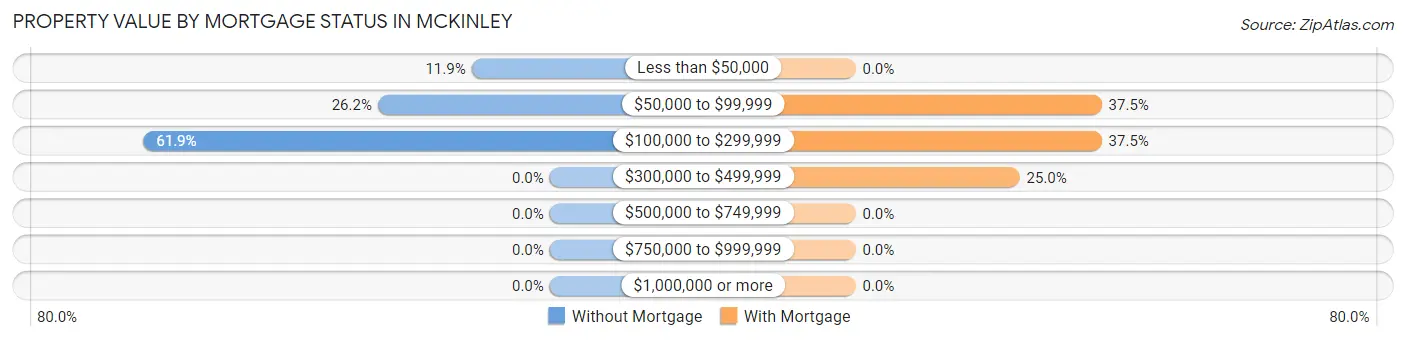
| Property Value | Without Mortgage | With Mortgage |
| Less than $50,000 | 5 (11.9%) | 0 (0.0%) |
| $50,000 to $99,999 | 11 (26.2%) | 3 (37.5%) |
| $100,000 to $299,999 | 26 (61.9%) | 3 (37.5%) |
| $300,000 to $499,999 | 0 (0.0%) | 2 (25.0%) |
| $500,000 to $749,999 | 0 (0.0%) | 0 (0.0%) |
| $750,000 to $999,999 | 0 (0.0%) | 0 (0.0%) |
| $1,000,000 or more | 0 (0.0%) | 0 (0.0%) |
| Total | 42 (100.0%) | 8 (100.0%) |
Household Income by Mortgage Status in McKinley
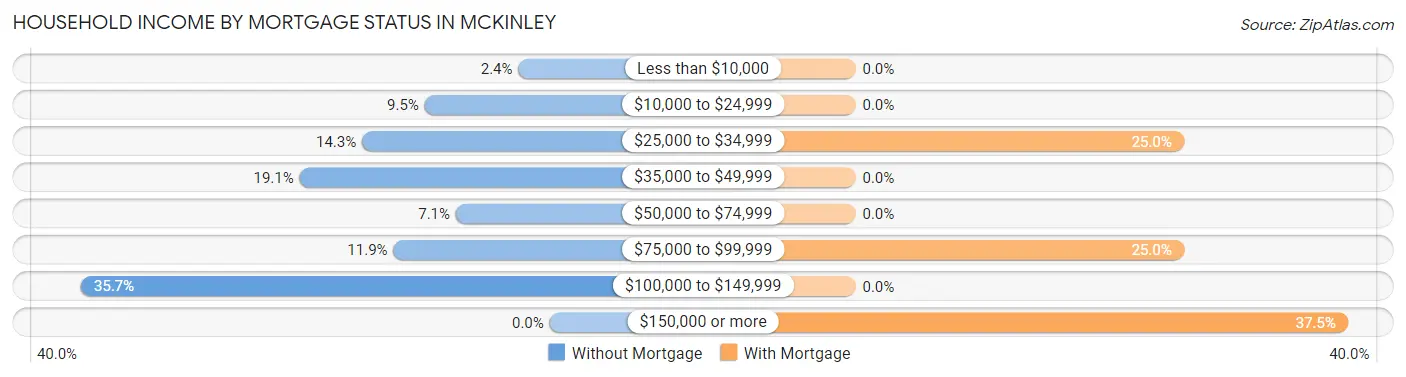
| Household Income | Without Mortgage | With Mortgage |
| Less than $10,000 | 1 (2.4%) | 0 (0.0%) |
| $10,000 to $24,999 | 4 (9.5%) | 0 (0.0%) |
| $25,000 to $34,999 | 6 (14.3%) | 2 (25.0%) |
| $35,000 to $49,999 | 8 (19.1%) | 0 (0.0%) |
| $50,000 to $74,999 | 3 (7.1%) | 0 (0.0%) |
| $75,000 to $99,999 | 5 (11.9%) | 2 (25.0%) |
| $100,000 to $149,999 | 15 (35.7%) | 0 (0.0%) |
| $150,000 or more | 0 (0.0%) | 3 (37.5%) |
| Total | 42 (100.0%) | 8 (100.0%) |
Property Value to Household Income Ratio in McKinley
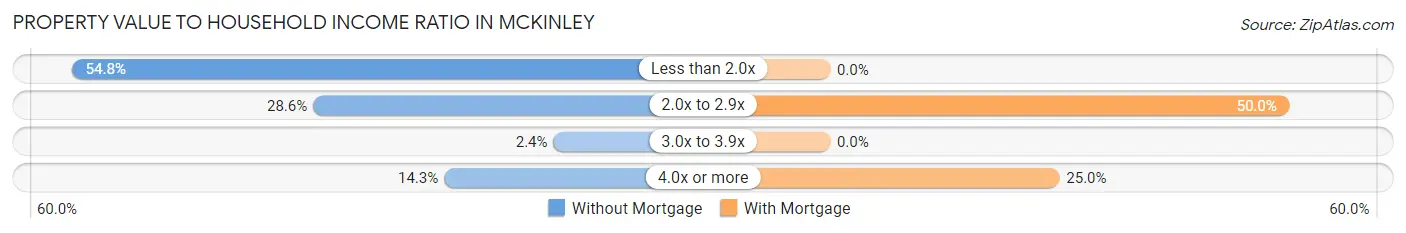
| Value-to-Income Ratio | Without Mortgage | With Mortgage |
| Less than 2.0x | 23 (54.8%) | 0 (0.0%) |
| 2.0x to 2.9x | 12 (28.6%) | 4 (50.0%) |
| 3.0x to 3.9x | 1 (2.4%) | 0 (0.0%) |
| 4.0x or more | 6 (14.3%) | 2 (25.0%) |
| Total | 42 (100.0%) | 8 (100.0%) |
Real Estate Taxes by Mortgage Status in McKinley
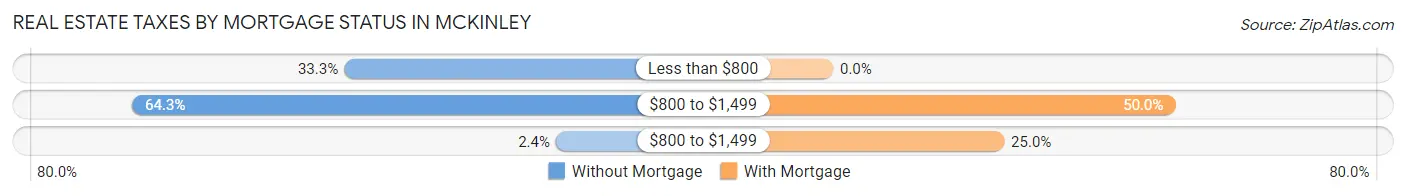
| Property Taxes | Without Mortgage | With Mortgage |
| Less than $800 | 14 (33.3%) | 0 (0.0%) |
| $800 to $1,499 | 27 (64.3%) | 4 (50.0%) |
| $800 to $1,499 | 1 (2.4%) | 2 (25.0%) |
| Total | 42 (100.0%) | 8 (100.0%) |
Health & Disability in McKinley
Health Insurance Coverage by Age in McKinley
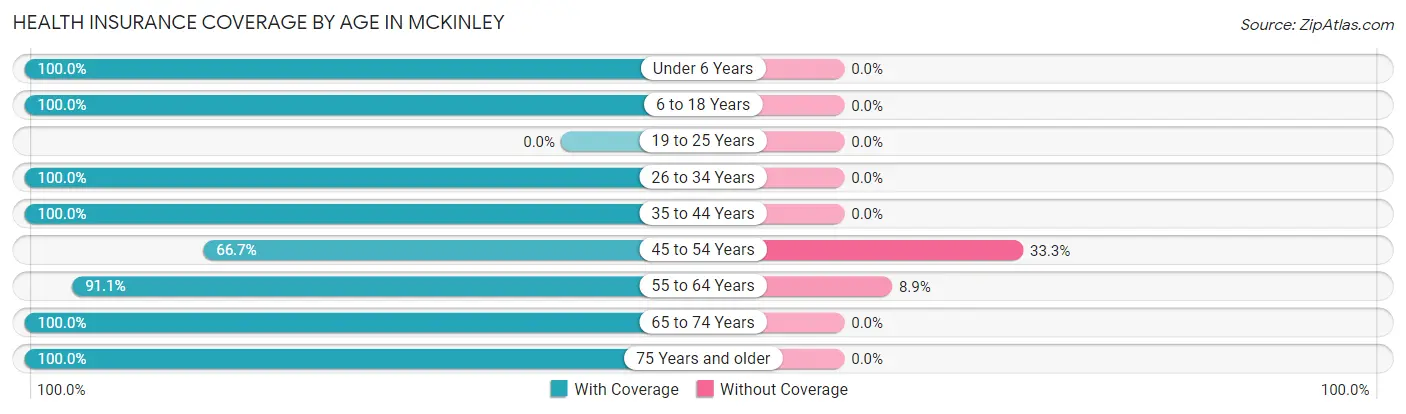
| Age Bracket | With Coverage | Without Coverage |
| Under 6 Years | 2 (100.0%) | 0 (0.0%) |
| 6 to 18 Years | 14 (100.0%) | 0 (0.0%) |
| 19 to 25 Years | 0 (0.0%) | 0 (0.0%) |
| 26 to 34 Years | 3 (100.0%) | 0 (0.0%) |
| 35 to 44 Years | 9 (100.0%) | 0 (0.0%) |
| 45 to 54 Years | 2 (66.7%) | 1 (33.3%) |
| 55 to 64 Years | 41 (91.1%) | 4 (8.9%) |
| 65 to 74 Years | 20 (100.0%) | 0 (0.0%) |
| 75 Years and older | 8 (100.0%) | 0 (0.0%) |
| Total | 99 (95.2%) | 5 (4.8%) |
Health Insurance Coverage by Citizenship Status in McKinley
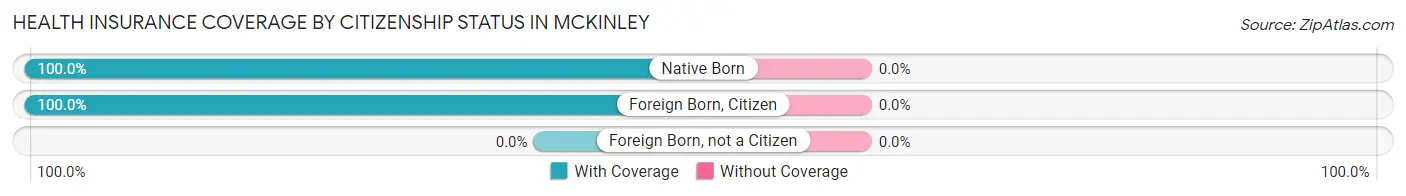
| Citizenship Status | With Coverage | Without Coverage |
| Native Born | 2 (100.0%) | 0 (0.0%) |
| Foreign Born, Citizen | 14 (100.0%) | 0 (0.0%) |
| Foreign Born, not a Citizen | 0 (0.0%) | 0 (0.0%) |
Health Insurance Coverage by Household Income in McKinley
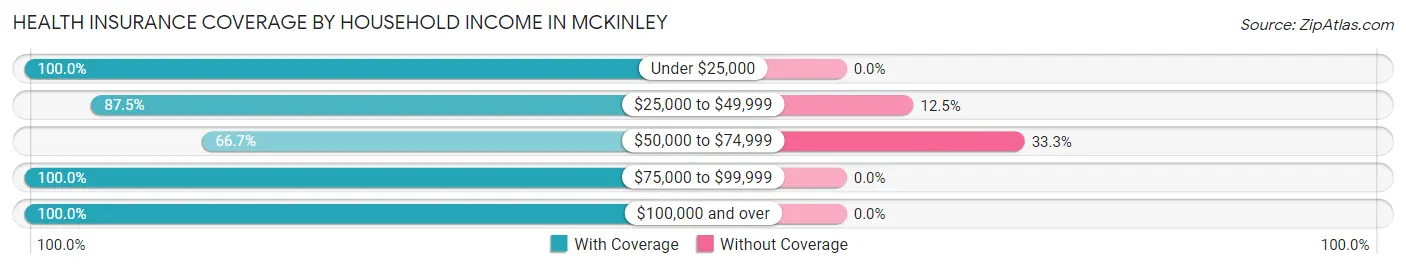
| Household Income | With Coverage | Without Coverage |
| Under $25,000 | 17 (100.0%) | 0 (0.0%) |
| $25,000 to $49,999 | 21 (87.5%) | 3 (12.5%) |
| $50,000 to $74,999 | 4 (66.7%) | 2 (33.3%) |
| $75,000 to $99,999 | 10 (100.0%) | 0 (0.0%) |
| $100,000 and over | 47 (100.0%) | 0 (0.0%) |
Public vs Private Health Insurance Coverage by Age in McKinley
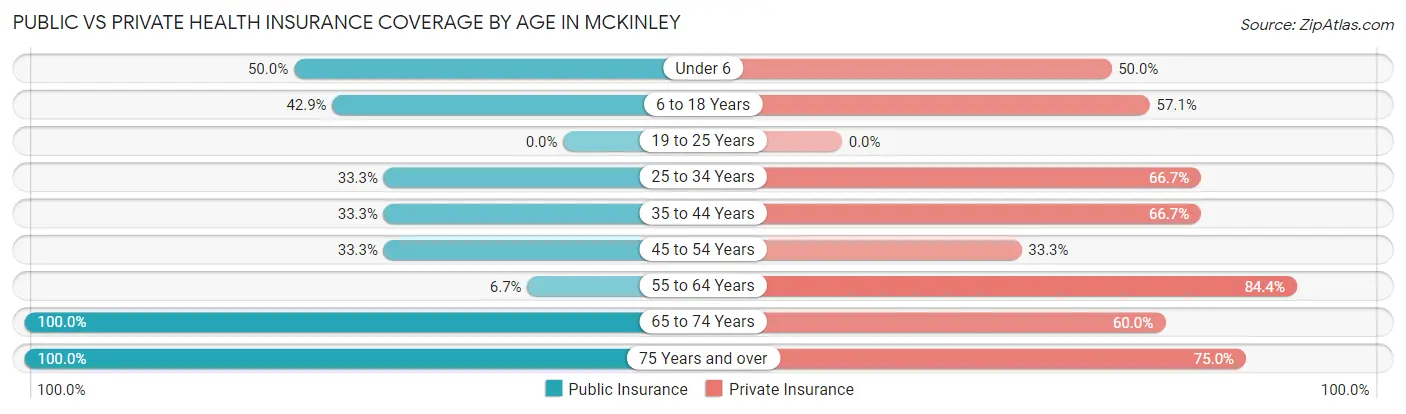
| Age Bracket | Public Insurance | Private Insurance |
| Under 6 | 1 (50.0%) | 1 (50.0%) |
| 6 to 18 Years | 6 (42.9%) | 8 (57.1%) |
| 19 to 25 Years | 0 (0.0%) | 0 (0.0%) |
| 25 to 34 Years | 1 (33.3%) | 2 (66.7%) |
| 35 to 44 Years | 3 (33.3%) | 6 (66.7%) |
| 45 to 54 Years | 1 (33.3%) | 1 (33.3%) |
| 55 to 64 Years | 3 (6.7%) | 38 (84.4%) |
| 65 to 74 Years | 20 (100.0%) | 12 (60.0%) |
| 75 Years and over | 8 (100.0%) | 6 (75.0%) |
| Total | 43 (41.3%) | 74 (71.2%) |
Disability Status by Sex by Age in McKinley
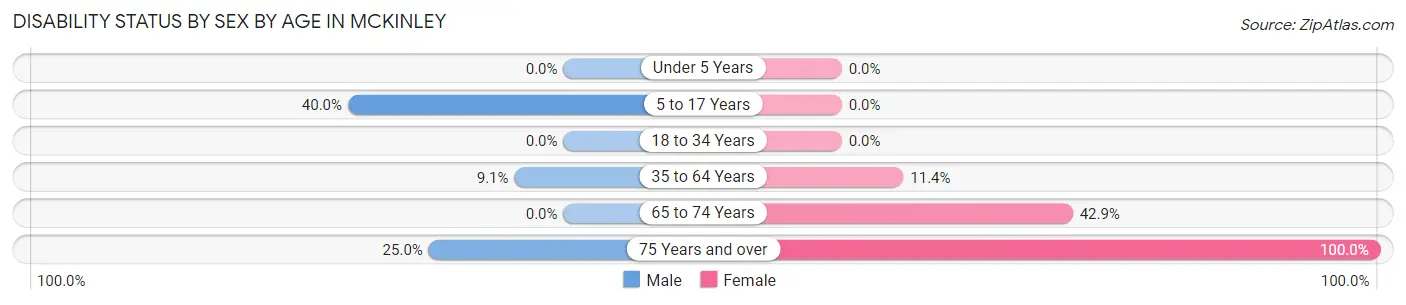
| Age Bracket | Male | Female |
| Under 5 Years | 0 (0.0%) | 0 (0.0%) |
| 5 to 17 Years | 2 (40.0%) | 0 (0.0%) |
| 18 to 34 Years | 0 (0.0%) | 0 (0.0%) |
| 35 to 64 Years | 2 (9.1%) | 4 (11.4%) |
| 65 to 74 Years | 0 (0.0%) | 3 (42.9%) |
| 75 Years and over | 1 (25.0%) | 4 (100.0%) |
Disability Class by Sex by Age in McKinley
Disability Class: Hearing Difficulty
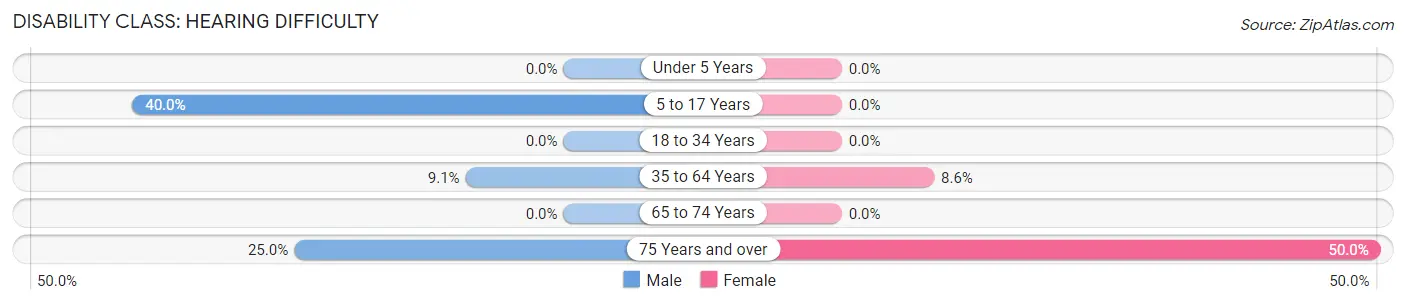
| Age Bracket | Male | Female |
| Under 5 Years | 0 (0.0%) | 0 (0.0%) |
| 5 to 17 Years | 2 (40.0%) | 0 (0.0%) |
| 18 to 34 Years | 0 (0.0%) | 0 (0.0%) |
| 35 to 64 Years | 2 (9.1%) | 3 (8.6%) |
| 65 to 74 Years | 0 (0.0%) | 0 (0.0%) |
| 75 Years and over | 1 (25.0%) | 2 (50.0%) |
Disability Class: Vision Difficulty
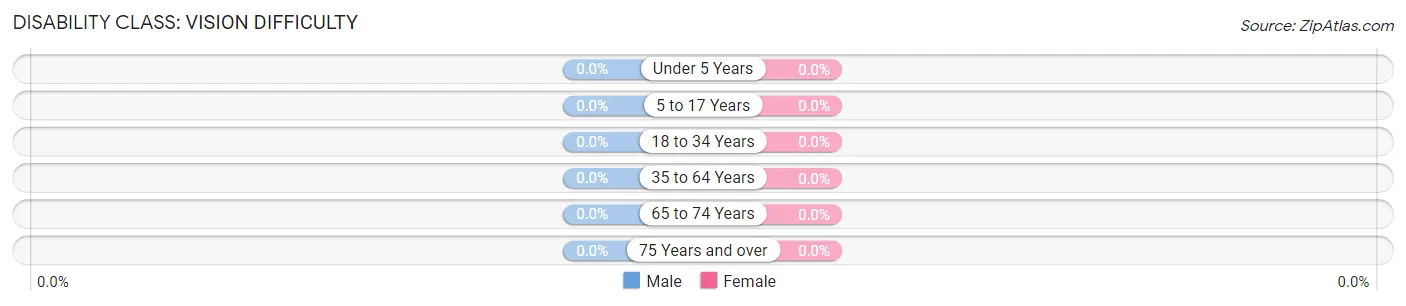
| Age Bracket | Male | Female |
| Under 5 Years | 0 (0.0%) | 0 (0.0%) |
| 5 to 17 Years | 0 (0.0%) | 0 (0.0%) |
| 18 to 34 Years | 0 (0.0%) | 0 (0.0%) |
| 35 to 64 Years | 0 (0.0%) | 0 (0.0%) |
| 65 to 74 Years | 0 (0.0%) | 0 (0.0%) |
| 75 Years and over | 0 (0.0%) | 0 (0.0%) |
Disability Class: Cognitive Difficulty
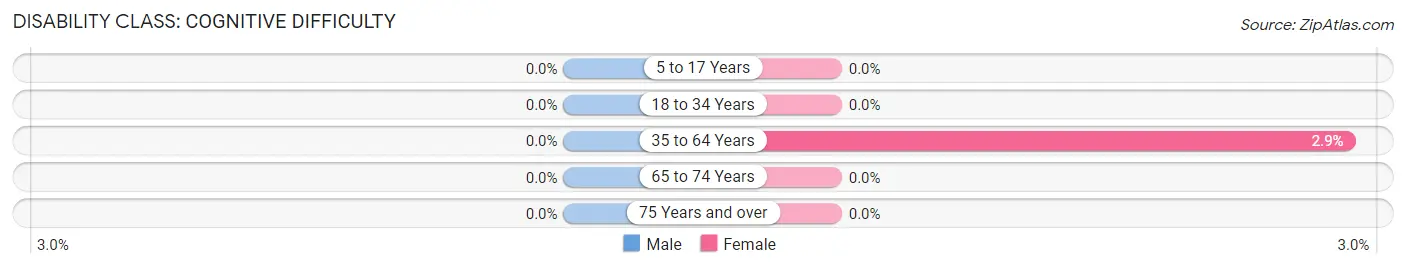
| Age Bracket | Male | Female |
| 5 to 17 Years | 0 (0.0%) | 0 (0.0%) |
| 18 to 34 Years | 0 (0.0%) | 0 (0.0%) |
| 35 to 64 Years | 0 (0.0%) | 1 (2.9%) |
| 65 to 74 Years | 0 (0.0%) | 0 (0.0%) |
| 75 Years and over | 0 (0.0%) | 0 (0.0%) |
Disability Class: Ambulatory Difficulty
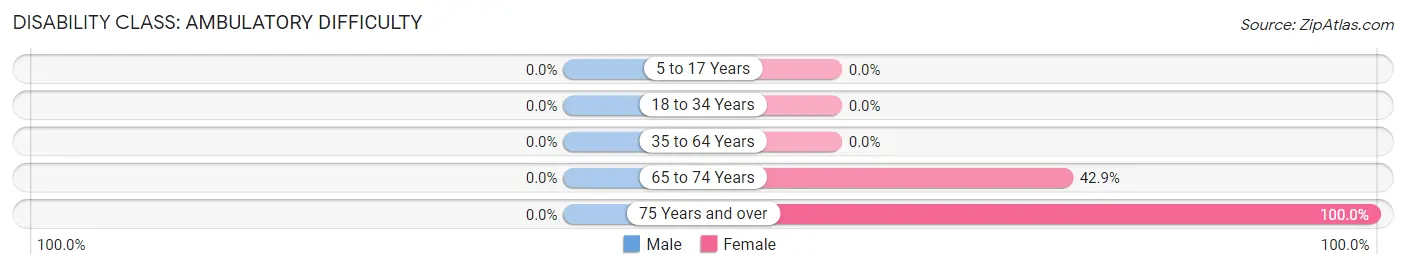
| Age Bracket | Male | Female |
| 5 to 17 Years | 0 (0.0%) | 0 (0.0%) |
| 18 to 34 Years | 0 (0.0%) | 0 (0.0%) |
| 35 to 64 Years | 0 (0.0%) | 0 (0.0%) |
| 65 to 74 Years | 0 (0.0%) | 3 (42.9%) |
| 75 Years and over | 0 (0.0%) | 4 (100.0%) |
Disability Class: Self-Care Difficulty
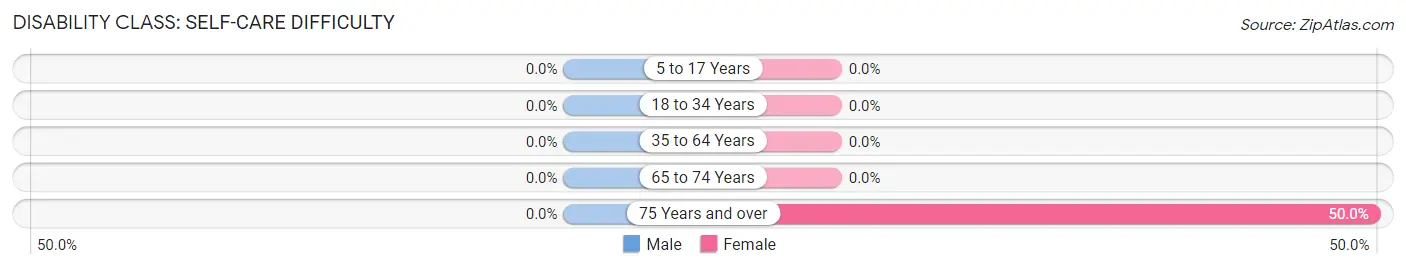
| Age Bracket | Male | Female |
| 5 to 17 Years | 0 (0.0%) | 0 (0.0%) |
| 18 to 34 Years | 0 (0.0%) | 0 (0.0%) |
| 35 to 64 Years | 0 (0.0%) | 0 (0.0%) |
| 65 to 74 Years | 0 (0.0%) | 0 (0.0%) |
| 75 Years and over | 0 (0.0%) | 2 (50.0%) |
Technology Access in McKinley
Computing Device Access in McKinley
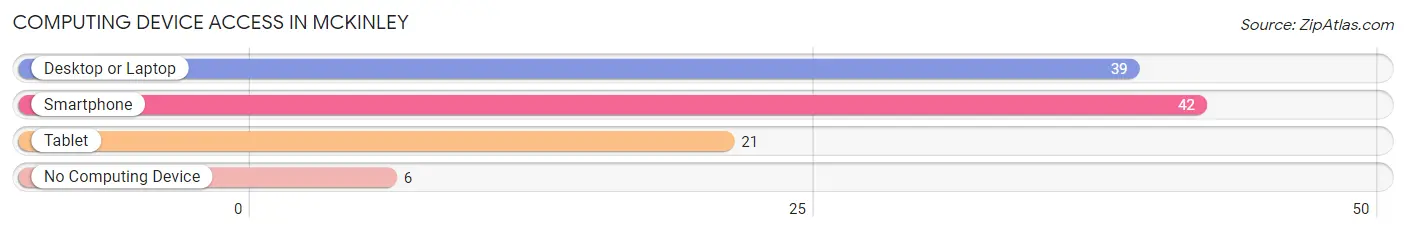
| Device Type | # Households | % Households |
| Desktop or Laptop | 39 | 73.6% |
| Smartphone | 42 | 79.2% |
| Tablet | 21 | 39.6% |
| No Computing Device | 6 | 11.3% |
| Total | 53 | 100.0% |
Internet Access in McKinley
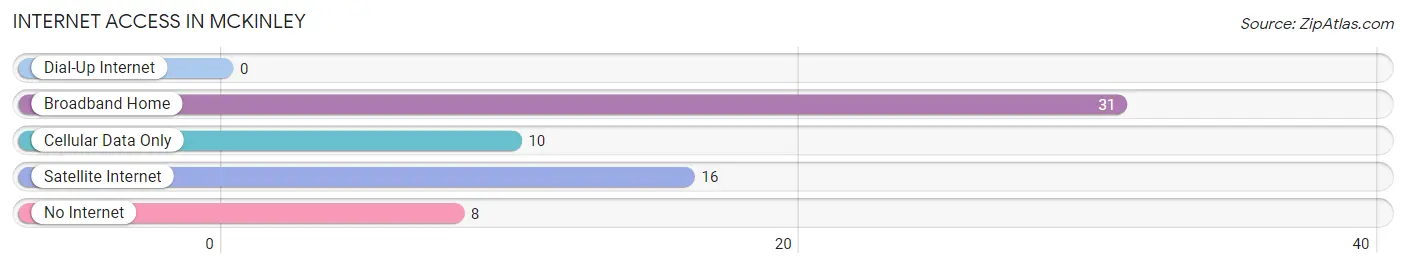
| Internet Type | # Households | % Households |
| Dial-Up Internet | 0 | 0.0% |
| Broadband Home | 31 | 58.5% |
| Cellular Data Only | 10 | 18.9% |
| Satellite Internet | 16 | 30.2% |
| No Internet | 8 | 15.1% |
| Total | 53 | 100.0% |
McKinley Summary
Mckinley, Minnesota is a small town located in the northern part of the state, near the Canadian border. It is situated in the heart of the Iron Range, an area known for its rich iron ore deposits. The town was founded in 1887 and has a population of just over 1,000 people.
Geography
Mckinley is located in the northern part of Minnesota, near the Canadian border. It is situated in the heart of the Iron Range, an area known for its rich iron ore deposits. The town is located on the Mesabi Range, which is the largest iron ore range in the world. The town is surrounded by forests and lakes, and is home to many wildlife species. The town is also located near the Boundary Waters Canoe Area Wilderness, which is a popular destination for outdoor enthusiasts.
The town is located in St. Louis County, and is part of the Duluth Metropolitan Statistical Area. The town is located about 25 miles from Duluth, and is accessible by car or bus.
Economy
Mckinley’s economy is largely based on the mining industry. The town is home to several iron ore mines, which provide jobs for many of the town’s residents. The town is also home to several small businesses, including restaurants, stores, and other services.
The town is also home to a number of tourist attractions, including the Iron Range Museum, which showcases the history of the area. The town is also home to several parks and trails, which are popular with outdoor enthusiasts.
Demographics
As of the 2010 census, the population of Mckinley was 1,072. The town is predominantly white, with 95.3% of the population identifying as white. The town also has a small Hispanic population, with 2.2% of the population identifying as Hispanic or Latino. The town also has a small Native American population, with 0.7% of the population identifying as Native American.
The median household income in Mckinley is $41,250, and the median home value is $117,400. The town has a poverty rate of 11.3%, which is slightly higher than the national average.
Conclusion
Mckinley, Minnesota is a small town located in the northern part of the state, near the Canadian border. It is situated in the heart of the Iron Range, an area known for its rich iron ore deposits. The town was founded in 1887 and has a population of just over 1,000 people. The town’s economy is largely based on the mining industry, and it is also home to several tourist attractions. The town is predominantly white, with 95.3% of the population identifying as white. The median household income in Mckinley is $41,250, and the median home value is $117,400.
Common Questions
What is Per Capita Income in McKinley?
Per Capita income in McKinley is $39,435.
What is the Median Family Income in McKinley?
Median Family Income in McKinley is $103,750.
What is the Median Household income in McKinley?
Median Household Income in McKinley is $54,583.
What is Inequality or Gini Index in McKinley?
Inequality or Gini Index in McKinley is 0.36.
What is the Total Population of McKinley?
Total Population of McKinley is 104.
What is the Total Male Population of McKinley?
Total Male Population of McKinley is 46.
What is the Total Female Population of McKinley?
Total Female Population of McKinley is 58.
What is the Ratio of Males per 100 Females in McKinley?
There are 79.31 Males per 100 Females in McKinley.
What is the Ratio of Females per 100 Males in McKinley?
There are 126.09 Females per 100 Males in McKinley.
What is the Median Population Age in McKinley?
Median Population Age in McKinley is 63.5 Years.
What is the Average Family Size in McKinley
Average Family Size in McKinley is 2.3 People.
What is the Average Household Size in McKinley
Average Household Size in McKinley is 2.0 People.
How Large is the Labor Force in McKinley?
There are 53 People in the Labor Forcein in McKinley.
What is the Percentage of People in the Labor Force in McKinley?
58.9% of People are in the Labor Force in McKinley.
What is the Unemployment Rate in McKinley?
Unemployment Rate in McKinley is 1.9%.