Zip Codes with the Highest Percentage of Population with a Degree in Computers and Mathematics in Minnesota
RELATED REPORTS & OPTIONS
Computers and Mathematics
Minnesota
Compare Zip Codes
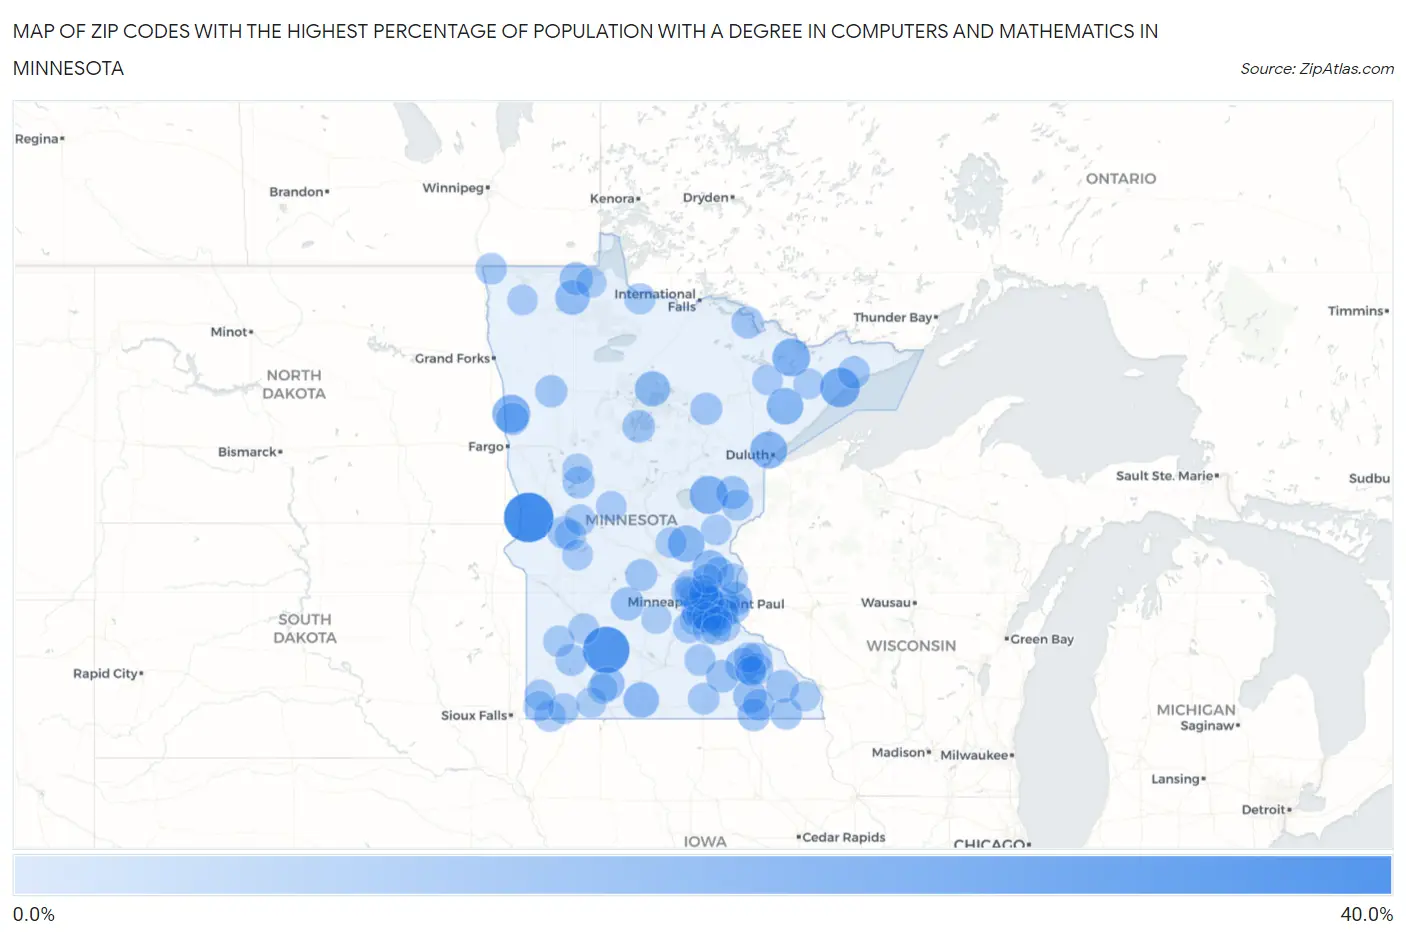
Map of Zip Codes with the Highest Percentage of Population with a Degree in Computers and Mathematics in Minnesota
0.0%
40.0%
Zip Codes with the Highest Percentage of Population with a Degree in Computers and Mathematics in Minnesota
| Zip Code | % Graduates | vs State | vs National | |
| 1. | 56583 | 36.4% | 4.5%(+31.8)#1 | 4.9%(+31.5)#156 |
| 2. | 56224 | 31.6% | 4.5%(+27.1)#2 | 4.9%(+26.7)#204 |
| 3. | 55613 | 20.6% | 4.5%(+16.1)#3 | 4.9%(+15.7)#443 |
| 4. | 56350 | 18.2% | 4.5%(+13.7)#4 | 4.9%(+13.3)#554 |
| 5. | 55796 | 17.9% | 4.5%(+13.3)#5 | 4.9%(+13.0)#570 |
| 6. | 56550 | 17.8% | 4.5%(+13.2)#6 | 4.9%(+12.9)#574 |
| 7. | 55814 | 16.7% | 4.5%(+12.1)#7 | 4.9%(+11.8)#648 |
| 8. | 56363 | 16.0% | 4.5%(+11.5)#8 | 4.9%(+11.1)#703 |
| 9. | 55602 | 15.9% | 4.5%(+11.4)#9 | 4.9%(+11.0)#708 |
| 10. | 56075 | 14.3% | 4.5%(+9.76)#10 | 4.9%(+9.39)#884 |
| 11. | 56681 | 13.8% | 4.5%(+9.27)#11 | 4.9%(+8.90)#931 |
| 12. | 55005 | 13.6% | 4.5%(+9.03)#12 | 4.9%(+8.67)#968 |
| 13. | 56761 | 12.8% | 4.5%(+8.24)#13 | 4.9%(+7.87)#1,082 |
| 14. | 55003 | 12.5% | 4.5%(+7.94)#14 | 4.9%(+7.58)#1,145 |
| 15. | 56118 | 11.9% | 4.5%(+7.38)#15 | 4.9%(+7.01)#1,234 |
| 16. | 55963 | 11.8% | 4.5%(+7.28)#16 | 4.9%(+6.92)#1,252 |
| 17. | 55967 | 11.5% | 4.5%(+6.94)#17 | 4.9%(+6.57)#1,335 |
| 18. | 56228 | 10.7% | 4.5%(+6.19)#18 | 4.9%(+5.82)#1,520 |
| 19. | 55119 | 10.5% | 4.5%(+6.01)#19 | 4.9%(+5.64)#1,571 |
| 20. | 56756 | 10.4% | 4.5%(+5.92)#20 | 4.9%(+5.55)#1,600 |
| 21. | 55344 | 10.4% | 4.5%(+5.91)#21 | 4.9%(+5.54)#1,605 |
| 22. | 55795 | 10.3% | 4.5%(+5.80)#22 | 4.9%(+5.43)#1,643 |
| 23. | 55454 | 10.0% | 4.5%(+5.50)#23 | 4.9%(+5.13)#1,743 |
| 24. | 56484 | 9.8% | 4.5%(+5.29)#24 | 4.9%(+4.93)#1,825 |
| 25. | 55979 | 9.8% | 4.5%(+5.29)#25 | 4.9%(+4.93)#1,829 |
| 26. | 55924 | 9.6% | 4.5%(+5.09)#26 | 4.9%(+4.72)#1,919 |
| 27. | 56574 | 9.6% | 4.5%(+5.09)#27 | 4.9%(+4.72)#1,920 |
| 28. | 55951 | 9.6% | 4.5%(+5.05)#28 | 4.9%(+4.68)#1,933 |
| 29. | 56592 | 9.3% | 4.5%(+4.81)#29 | 4.9%(+4.44)#2,045 |
| 30. | 56339 | 9.3% | 4.5%(+4.77)#30 | 4.9%(+4.41)#2,065 |
| 31. | 55404 | 9.1% | 4.5%(+4.57)#31 | 4.9%(+4.20)#2,175 |
| 32. | 55764 | 9.1% | 4.5%(+4.56)#32 | 4.9%(+4.20)#2,196 |
| 33. | 55725 | 9.1% | 4.5%(+4.56)#33 | 4.9%(+4.20)#2,205 |
| 34. | 55612 | 9.1% | 4.5%(+4.53)#34 | 4.9%(+4.16)#2,222 |
| 35. | 55389 | 9.0% | 4.5%(+4.48)#35 | 4.9%(+4.12)#2,250 |
| 36. | 55001 | 9.0% | 4.5%(+4.43)#36 | 4.9%(+4.06)#2,284 |
| 37. | 56571 | 8.8% | 4.5%(+4.30)#37 | 4.9%(+3.94)#2,350 |
| 38. | 55991 | 8.7% | 4.5%(+4.18)#38 | 4.9%(+3.82)#2,415 |
| 39. | 55343 | 8.7% | 4.5%(+4.15)#39 | 4.9%(+3.78)#2,437 |
| 40. | 55975 | 8.5% | 4.5%(+3.98)#40 | 4.9%(+3.61)#2,532 |
| 41. | 56175 | 8.5% | 4.5%(+3.95)#41 | 4.9%(+3.58)#2,549 |
| 42. | 55922 | 8.4% | 4.5%(+3.91)#42 | 4.9%(+3.54)#2,576 |
| 43. | 56016 | 8.3% | 4.5%(+3.74)#43 | 4.9%(+3.38)#2,692 |
| 44. | 55114 | 8.2% | 4.5%(+3.70)#44 | 4.9%(+3.33)#2,728 |
| 45. | 55960 | 8.2% | 4.5%(+3.67)#45 | 4.9%(+3.30)#2,750 |
| 46. | 56755 | 8.0% | 4.5%(+3.47)#46 | 4.9%(+3.11)#2,902 |
| 47. | 55087 | 8.0% | 4.5%(+3.43)#47 | 4.9%(+3.06)#2,941 |
| 48. | 56129 | 7.9% | 4.5%(+3.39)#48 | 4.9%(+3.03)#2,962 |
| 49. | 55352 | 7.9% | 4.5%(+3.36)#49 | 4.9%(+3.00)#2,986 |
| 50. | 55401 | 7.8% | 4.5%(+3.27)#50 | 4.9%(+2.91)#3,066 |
| 51. | 55906 | 7.8% | 4.5%(+3.24)#51 | 4.9%(+2.87)#3,095 |
| 52. | 55092 | 7.8% | 4.5%(+3.23)#52 | 4.9%(+2.87)#3,096 |
| 53. | 55072 | 7.7% | 4.5%(+3.18)#53 | 4.9%(+2.81)#3,128 |
| 54. | 56343 | 7.7% | 4.5%(+3.16)#54 | 4.9%(+2.80)#3,155 |
| 55. | 56239 | 7.7% | 4.5%(+3.16)#55 | 4.9%(+2.80)#3,161 |
| 56. | 56623 | 7.7% | 4.5%(+3.15)#56 | 4.9%(+2.78)#3,175 |
| 57. | 56332 | 7.6% | 4.5%(+3.08)#57 | 4.9%(+2.72)#3,229 |
| 58. | 55431 | 7.6% | 4.5%(+3.08)#58 | 4.9%(+2.71)#3,232 |
| 59. | 56134 | 7.5% | 4.5%(+3.02)#59 | 4.9%(+2.65)#3,296 |
| 60. | 55123 | 7.5% | 4.5%(+3.00)#60 | 4.9%(+2.63)#3,309 |
| 61. | 56168 | 7.5% | 4.5%(+2.97)#61 | 4.9%(+2.61)#3,343 |
| 62. | 55414 | 7.5% | 4.5%(+2.96)#62 | 4.9%(+2.59)#3,355 |
| 63. | 56329 | 7.5% | 4.5%(+2.93)#63 | 4.9%(+2.57)#3,380 |
| 64. | 55124 | 7.4% | 4.5%(+2.92)#64 | 4.9%(+2.55)#3,389 |
| 65. | 55122 | 7.3% | 4.5%(+2.80)#65 | 4.9%(+2.43)#3,494 |
| 66. | 55121 | 7.2% | 4.5%(+2.66)#66 | 4.9%(+2.29)#3,643 |
| 67. | 55073 | 7.2% | 4.5%(+2.65)#67 | 4.9%(+2.28)#3,652 |
| 68. | 55415 | 7.1% | 4.5%(+2.61)#68 | 4.9%(+2.24)#3,702 |
| 69. | 55379 | 7.1% | 4.5%(+2.58)#69 | 4.9%(+2.22)#3,719 |
| 70. | 56381 | 7.1% | 4.5%(+2.55)#70 | 4.9%(+2.19)#3,746 |
| 71. | 56237 | 7.0% | 4.5%(+2.51)#71 | 4.9%(+2.15)#3,779 |
| 72. | 55347 | 7.0% | 4.5%(+2.49)#72 | 4.9%(+2.13)#3,799 |
| 73. | 55607 | 7.0% | 4.5%(+2.49)#73 | 4.9%(+2.12)#3,804 |
| 74. | 55030 | 7.0% | 4.5%(+2.45)#74 | 4.9%(+2.08)#3,865 |
| 75. | 56156 | 6.8% | 4.5%(+2.30)#75 | 4.9%(+1.93)#4,030 |
| 76. | 56440 | 6.7% | 4.5%(+2.21)#76 | 4.9%(+1.85)#4,150 |
| 77. | 55340 | 6.7% | 4.5%(+2.19)#77 | 4.9%(+1.82)#4,174 |
| 78. | 55732 | 6.6% | 4.5%(+2.11)#78 | 4.9%(+1.75)#4,284 |
| 79. | 55956 | 6.6% | 4.5%(+2.11)#79 | 4.9%(+1.74)#4,286 |
| 80. | 55446 | 6.6% | 4.5%(+2.10)#80 | 4.9%(+1.73)#4,303 |
| 81. | 56763 | 6.6% | 4.5%(+2.08)#81 | 4.9%(+1.71)#4,328 |
| 82. | 56161 | 6.6% | 4.5%(+2.05)#82 | 4.9%(+1.68)#4,357 |
| 83. | 55071 | 6.6% | 4.5%(+2.05)#83 | 4.9%(+1.68)#4,358 |
| 84. | 55374 | 6.6% | 4.5%(+2.03)#84 | 4.9%(+1.67)#4,373 |
| 85. | 56732 | 6.6% | 4.5%(+2.03)#85 | 4.9%(+1.66)#4,381 |
| 86. | 55443 | 6.5% | 4.5%(+2.02)#86 | 4.9%(+1.65)#4,399 |
| 87. | 56101 | 6.5% | 4.5%(+2.01)#87 | 4.9%(+1.65)#4,405 |
| 88. | 55085 | 6.5% | 4.5%(+1.99)#88 | 4.9%(+1.63)#4,436 |
| 89. | 55438 | 6.5% | 4.5%(+1.94)#89 | 4.9%(+1.57)#4,506 |
| 90. | 56573 | 6.4% | 4.5%(+1.89)#90 | 4.9%(+1.53)#4,574 |
| 91. | 55044 | 6.4% | 4.5%(+1.88)#91 | 4.9%(+1.52)#4,587 |
| 92. | 55337 | 6.4% | 4.5%(+1.87)#92 | 4.9%(+1.50)#4,611 |
| 93. | 55943 | 6.4% | 4.5%(+1.83)#93 | 4.9%(+1.46)#4,685 |
| 94. | 55429 | 6.3% | 4.5%(+1.79)#94 | 4.9%(+1.42)#4,738 |
| 95. | 55068 | 6.3% | 4.5%(+1.78)#95 | 4.9%(+1.41)#4,756 |
| 96. | 55357 | 6.3% | 4.5%(+1.78)#96 | 4.9%(+1.41)#4,761 |
| 97. | 55336 | 6.3% | 4.5%(+1.76)#97 | 4.9%(+1.39)#4,792 |
| 98. | 55304 | 6.3% | 4.5%(+1.73)#98 | 4.9%(+1.36)#4,836 |
| 99. | 55024 | 6.2% | 4.5%(+1.68)#99 | 4.9%(+1.32)#4,927 |
| 100. | 55901 | 6.2% | 4.5%(+1.67)#100 | 4.9%(+1.31)#4,938 |
Common Questions
What are the Top 10 Zip Codes with the Highest Percentage of Population with a Degree in Computers and Mathematics in Minnesota?
Top 10 Zip Codes with the Highest Percentage of Population with a Degree in Computers and Mathematics in Minnesota are:
What zip code has the Highest Percentage of Population with a Degree in Computers and Mathematics in Minnesota?
56583 has the Highest Percentage of Population with a Degree in Computers and Mathematics in Minnesota with 36.4%.
What is the Percentage of Population with a Degree in Computers and Mathematics in the State of Minnesota?
Percentage of Population with a Degree in Computers and Mathematics in Minnesota is 4.5%.
What is the Percentage of Population with a Degree in Computers and Mathematics in the United States?
Percentage of Population with a Degree in Computers and Mathematics in the United States is 4.9%.