Becker, MN Map & Demographics
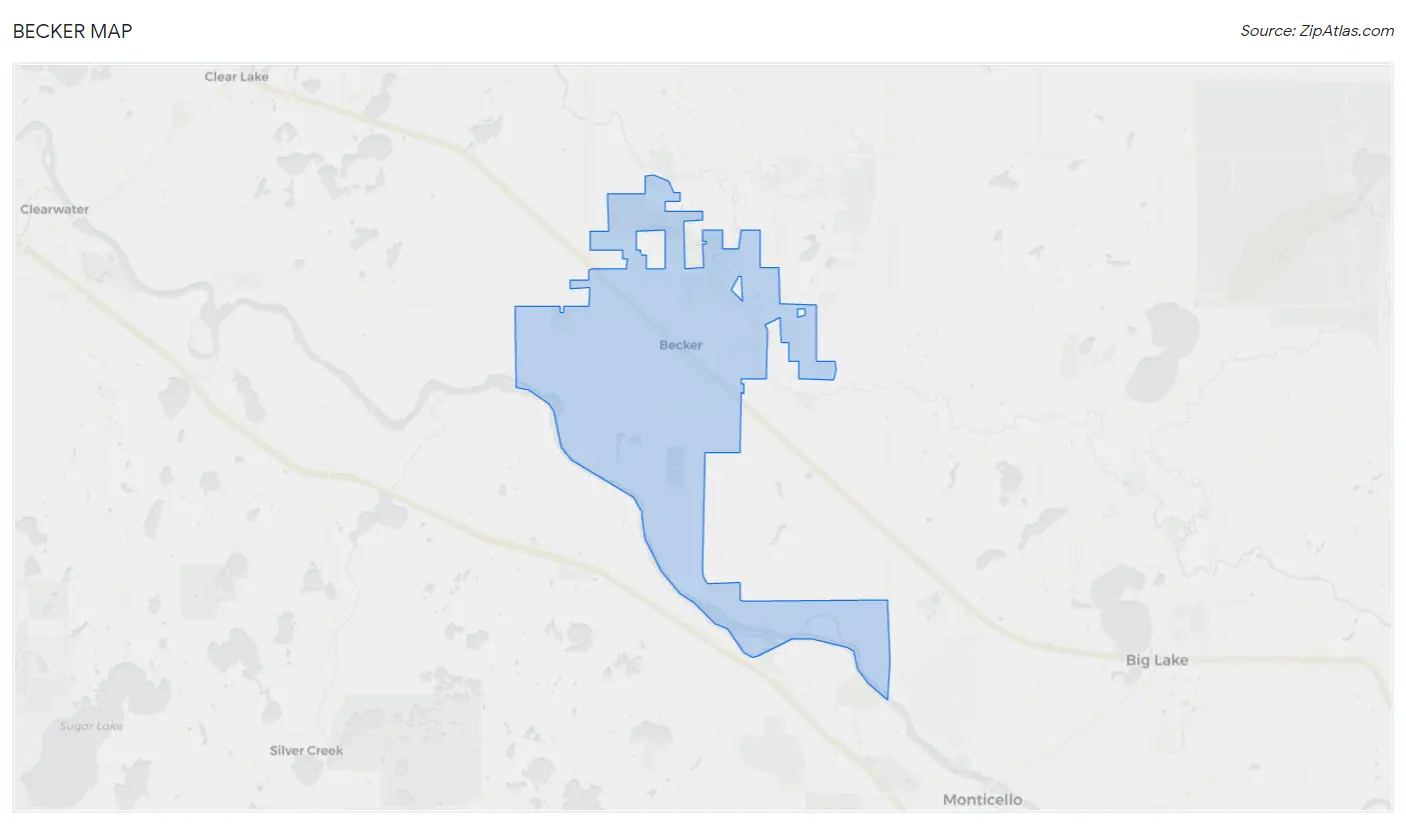
Becker Map
Becker Overview
$35,900
PER CAPITA INCOME
$106,429
AVG FAMILY INCOME
$87,432
AVG HOUSEHOLD INCOME
18.1%
WAGE / INCOME GAP [ % ]
81.9¢/ $1
WAGE / INCOME GAP [ $ ]
0.36
INEQUALITY / GINI INDEX
4,897
TOTAL POPULATION
2,558
MALE POPULATION
2,339
FEMALE POPULATION
109.36
MALES / 100 FEMALES
91.44
FEMALES / 100 MALES
33.3
MEDIAN AGE
3.4
AVG FAMILY SIZE
2.8
AVG HOUSEHOLD SIZE
2,742
LABOR FORCE [ PEOPLE ]
74.8%
PERCENT IN LABOR FORCE
0.6%
UNEMPLOYMENT RATE
Becker Zip Codes
Becker Area Codes
Income in Becker
Income Overview in Becker
Per Capita Income in Becker is $35,900, while median incomes of families and households are $106,429 and $87,432 respectively.
| Characteristic | Number | Measure |
| Per Capita Income | 4,897 | $35,900 |
| Median Family Income | 1,222 | $106,429 |
| Mean Family Income | 1,222 | $115,057 |
| Median Household Income | 1,754 | $87,432 |
| Mean Household Income | 1,754 | $96,175 |
| Income Deficit | 1,222 | $0 |
| Wage / Income Gap (%) | 4,897 | 18.10% |
| Wage / Income Gap ($) | 4,897 | 81.90¢ per $1 |
| Gini / Inequality Index | 4,897 | 0.36 |
Earnings by Sex in Becker
Average Earnings in Becker are $47,546, $52,750 for men and $43,200 for women, a difference of 18.1%.
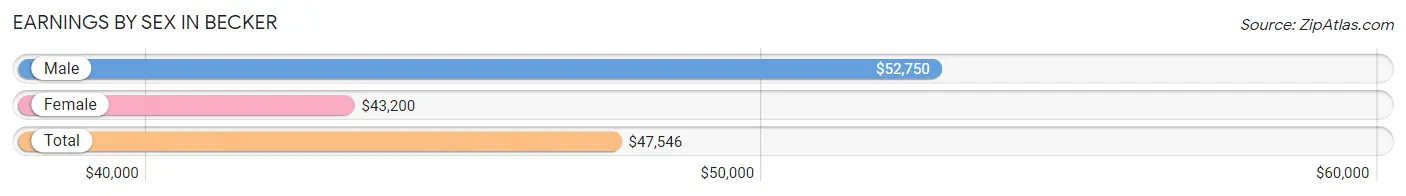
| Sex | Number | Average Earnings |
| Male | 1,604 (54.2%) | $52,750 |
| Female | 1,354 (45.8%) | $43,200 |
| Total | 2,958 (100.0%) | $47,546 |
Earnings by Sex by Income Bracket in Becker
The most common earnings brackets in Becker are $100,000+ for men (291 | 18.1%) and $50,000 to $54,999 for women (194 | 14.3%).
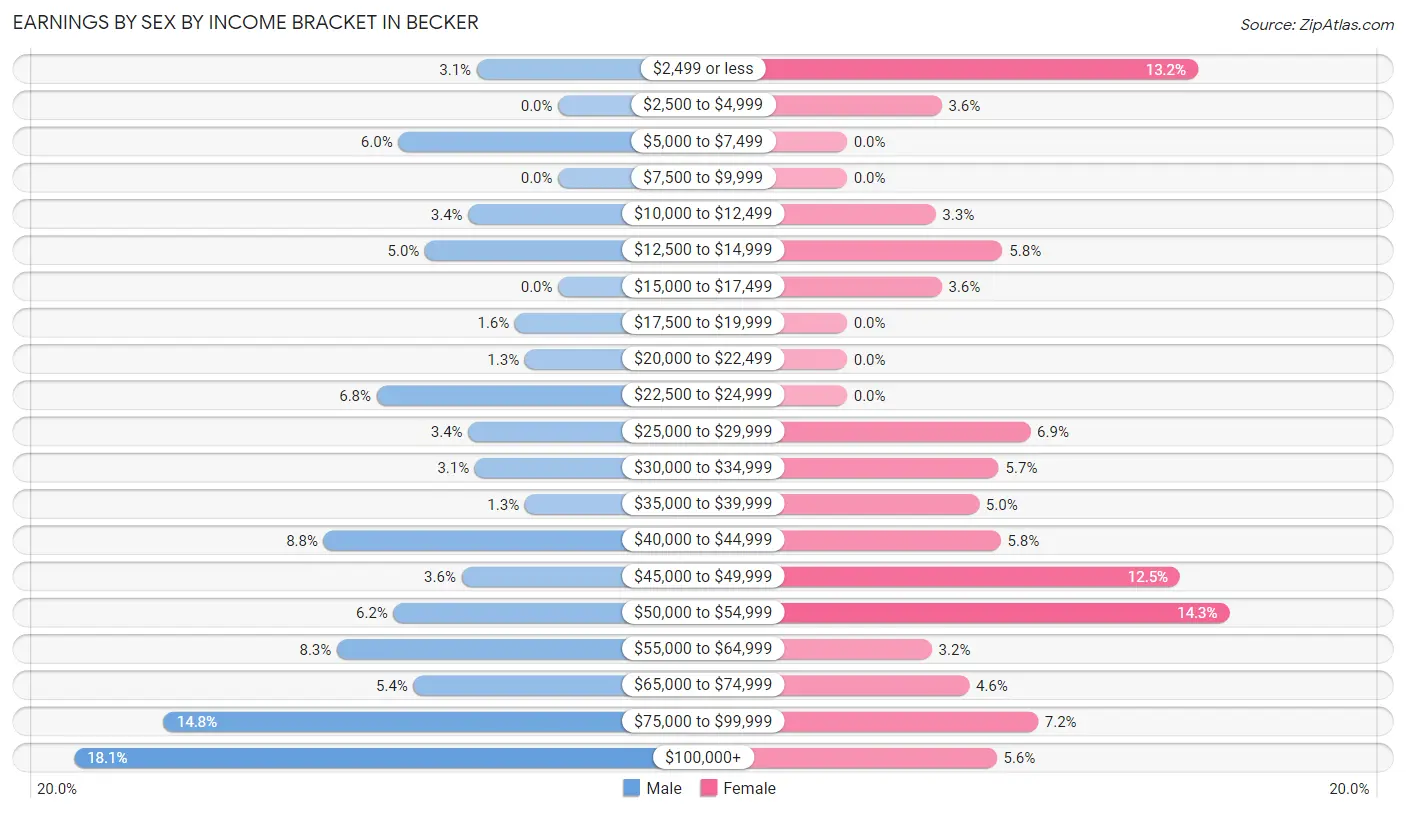
| Income | Male | Female |
| $2,499 or less | 49 (3.0%) | 178 (13.2%) |
| $2,500 to $4,999 | 0 (0.0%) | 48 (3.5%) |
| $5,000 to $7,499 | 96 (6.0%) | 0 (0.0%) |
| $7,500 to $9,999 | 0 (0.0%) | 0 (0.0%) |
| $10,000 to $12,499 | 54 (3.4%) | 45 (3.3%) |
| $12,500 to $14,999 | 80 (5.0%) | 79 (5.8%) |
| $15,000 to $17,499 | 0 (0.0%) | 48 (3.5%) |
| $17,500 to $19,999 | 26 (1.6%) | 0 (0.0%) |
| $20,000 to $22,499 | 20 (1.3%) | 0 (0.0%) |
| $22,500 to $24,999 | 109 (6.8%) | 0 (0.0%) |
| $25,000 to $29,999 | 54 (3.4%) | 93 (6.9%) |
| $30,000 to $34,999 | 50 (3.1%) | 77 (5.7%) |
| $35,000 to $39,999 | 20 (1.3%) | 67 (5.0%) |
| $40,000 to $44,999 | 141 (8.8%) | 78 (5.8%) |
| $45,000 to $49,999 | 58 (3.6%) | 169 (12.5%) |
| $50,000 to $54,999 | 99 (6.2%) | 194 (14.3%) |
| $55,000 to $64,999 | 133 (8.3%) | 43 (3.2%) |
| $65,000 to $74,999 | 87 (5.4%) | 62 (4.6%) |
| $75,000 to $99,999 | 237 (14.8%) | 97 (7.2%) |
| $100,000+ | 291 (18.1%) | 76 (5.6%) |
| Total | 1,604 (100.0%) | 1,354 (100.0%) |
Earnings by Sex by Educational Attainment in Becker
Average earnings in Becker are $64,948 for men and $46,875 for women, a difference of 27.8%. Men with an educational attainment of bachelor's degree enjoy the highest average annual earnings of $80,313, while those with high school diploma education earn the least with $59,083. Women with an educational attainment of bachelor's degree earn the most with the average annual earnings of $57,679, while those with high school diploma education have the smallest earnings of $27,019.
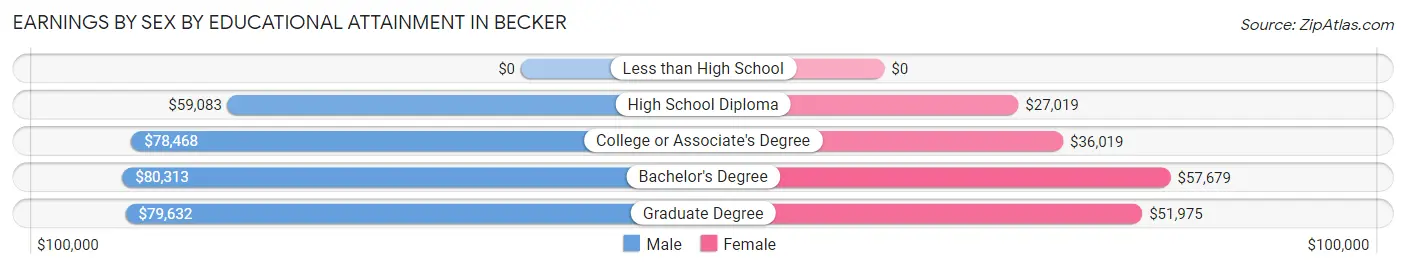
| Educational Attainment | Male Income | Female Income |
| Less than High School | - | - |
| High School Diploma | $59,083 | $27,019 |
| College or Associate's Degree | $78,468 | $36,019 |
| Bachelor's Degree | $80,313 | $57,679 |
| Graduate Degree | $79,632 | $51,975 |
| Total | $64,948 | $46,875 |
Family Income in Becker
Family Income Brackets in Becker
According to the Becker family income data, there are 499 families falling into the $100,000 to $149,999 income range, which is the most common income bracket and makes up 40.8% of all families.
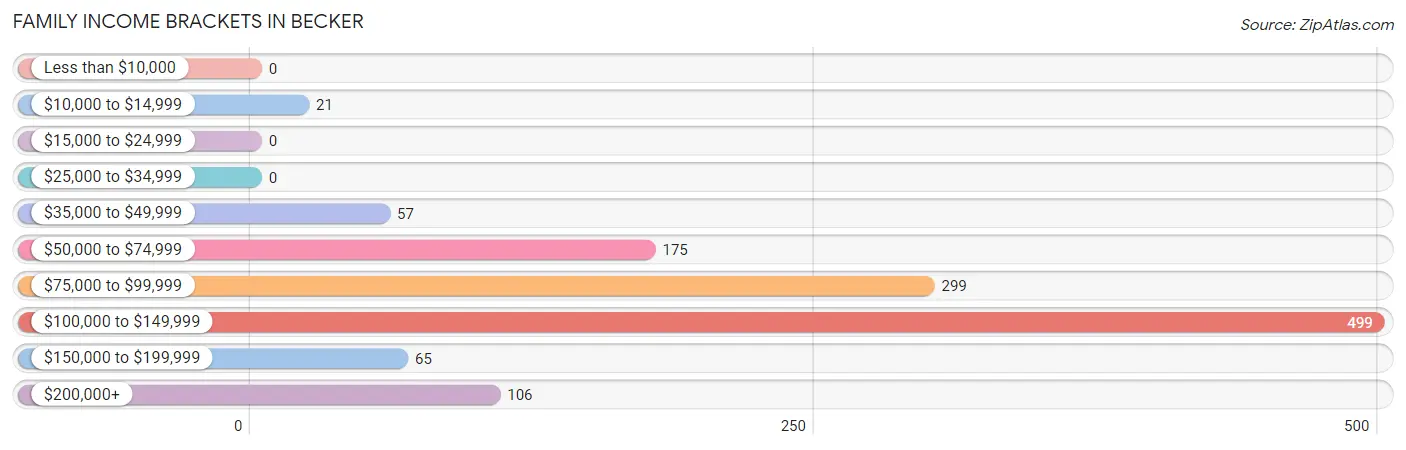
| Income Bracket | # Families | % Families |
| Less than $10,000 | 0 | 0.0% |
| $10,000 to $14,999 | 21 | 1.7% |
| $15,000 to $24,999 | 0 | 0.0% |
| $25,000 to $34,999 | 0 | 0.0% |
| $35,000 to $49,999 | 57 | 4.7% |
| $50,000 to $74,999 | 175 | 14.3% |
| $75,000 to $99,999 | 299 | 24.5% |
| $100,000 to $149,999 | 499 | 40.8% |
| $150,000 to $199,999 | 65 | 5.3% |
| $200,000+ | 106 | 8.7% |
Family Income by Famaliy Size in Becker
5-person families (77 | 6.3%) account for the highest median family income in Becker with $206,050 per family, while 2-person families (545 | 44.6%) have the highest median income of $48,706 per family member.
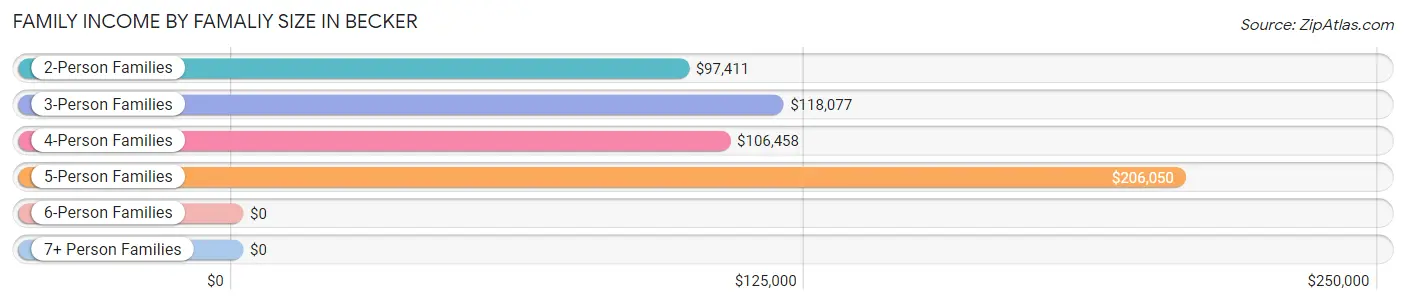
| Income Bracket | # Families | Median Income |
| 2-Person Families | 545 (44.6%) | $97,411 |
| 3-Person Families | 160 (13.1%) | $118,077 |
| 4-Person Families | 424 (34.7%) | $106,458 |
| 5-Person Families | 77 (6.3%) | $206,050 |
| 6-Person Families | 16 (1.3%) | $0 |
| 7+ Person Families | 0 (0.0%) | $0 |
| Total | 1,222 (100.0%) | $106,429 |
Family Income by Number of Earners in Becker
The median family income in Becker is $106,429, with families comprising 3+ earners (213) having the highest median family income of $143,125, while families with no earners (123) have the lowest median family income of $72,423, accounting for 17.4% and 10.1% of families, respectively.
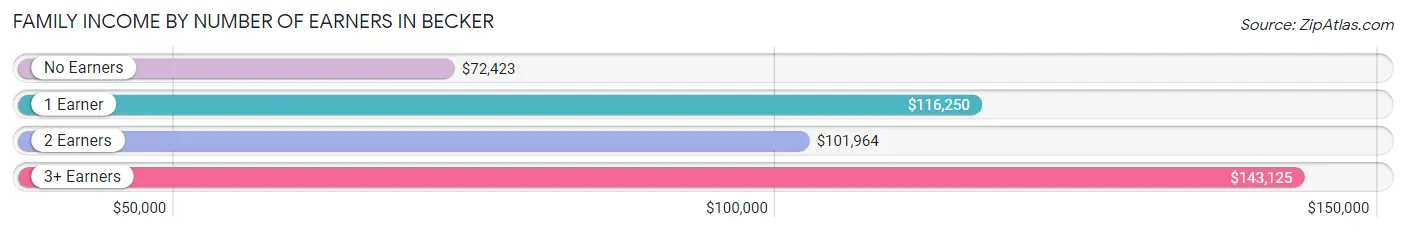
| Number of Earners | # Families | Median Income |
| No Earners | 123 (10.1%) | $72,423 |
| 1 Earner | 284 (23.2%) | $116,250 |
| 2 Earners | 602 (49.3%) | $101,964 |
| 3+ Earners | 213 (17.4%) | $143,125 |
| Total | 1,222 (100.0%) | $106,429 |
Household Income in Becker
Household Income Brackets in Becker
With 449 households falling in the category, the $100,000 to $149,999 income range is the most frequent in Becker, accounting for 25.6% of all households. In contrast, only 39 households (2.2%) fall into the $15,000 to $24,999 income bracket, making it the least populous group.
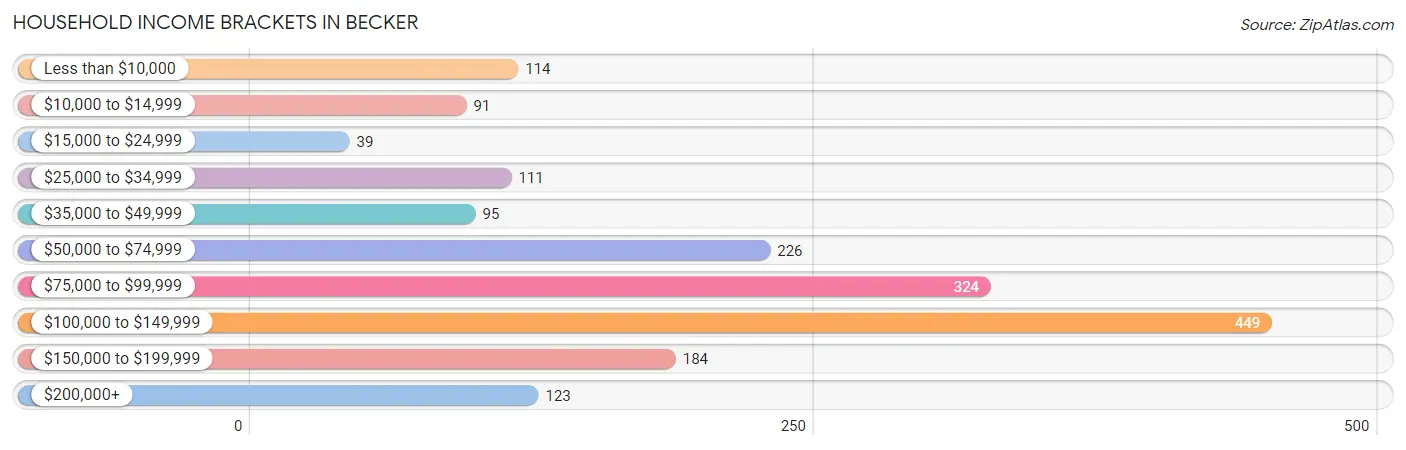
| Income Bracket | # Households | % Households |
| Less than $10,000 | 114 | 6.5% |
| $10,000 to $14,999 | 91 | 5.2% |
| $15,000 to $24,999 | 39 | 2.2% |
| $25,000 to $34,999 | 111 | 6.3% |
| $35,000 to $49,999 | 95 | 5.4% |
| $50,000 to $74,999 | 226 | 12.9% |
| $75,000 to $99,999 | 324 | 18.5% |
| $100,000 to $149,999 | 449 | 25.6% |
| $150,000 to $199,999 | 184 | 10.5% |
| $200,000+ | 123 | 7.0% |
Household Income by Householder Age in Becker
The median household income in Becker is $87,432, with the highest median household income of $112,891 found in the 25 to 44 years age bracket for the primary householder. A total of 630 households (35.9%) fall into this category. Meanwhile, the 15 to 24 years age bracket for the primary householder has the lowest median household income of $0, with 25 households (1.4%) in this group.
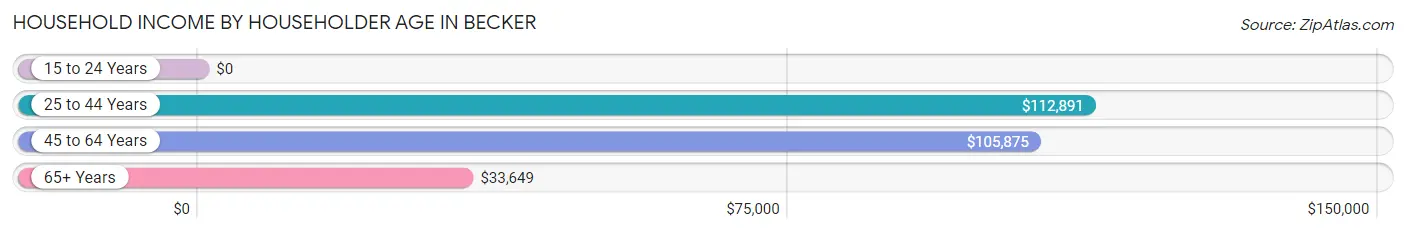
| Income Bracket | # Households | Median Income |
| 15 to 24 Years | 25 (1.4%) | $0 |
| 25 to 44 Years | 630 (35.9%) | $112,891 |
| 45 to 64 Years | 633 (36.1%) | $105,875 |
| 65+ Years | 466 (26.6%) | $33,649 |
| Total | 1,754 (100.0%) | $87,432 |
Poverty in Becker
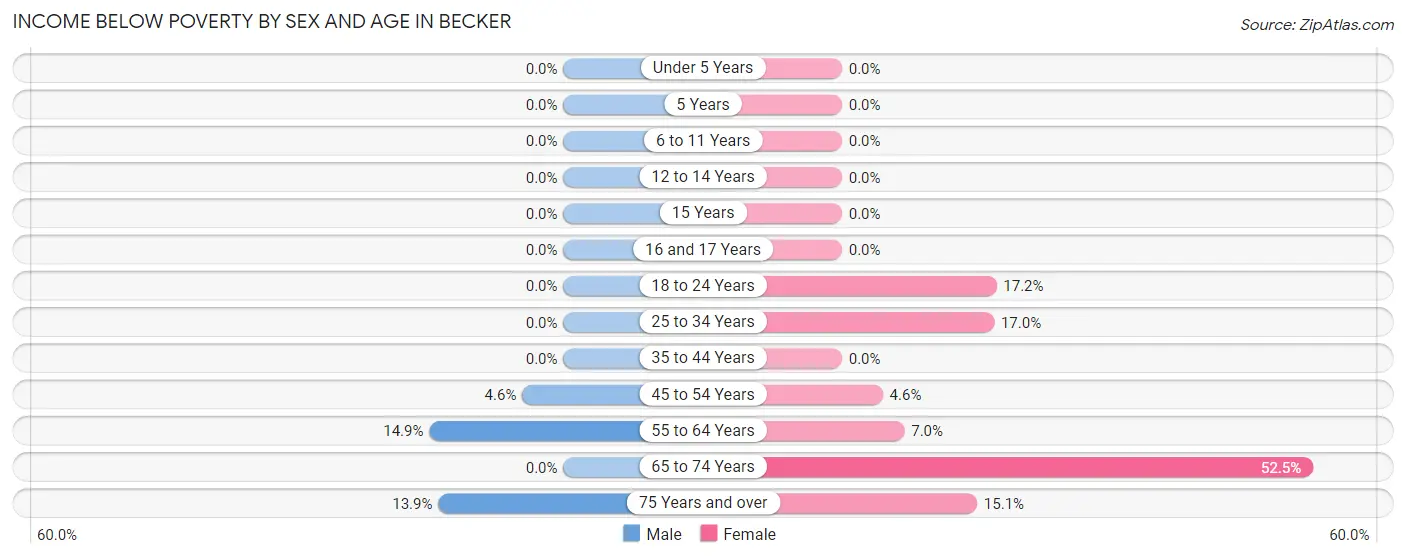
Income Below Poverty by Sex and Age in Becker
With 2.6% poverty level for males and 10.6% for females among the residents of Becker, 55 to 64 year old males and 65 to 74 year old females are the most vulnerable to poverty, with 33 males (14.9%) and 106 females (52.5%) in their respective age groups living below the poverty level.
| Age Bracket | Male | Female |
| Under 5 Years | 0 (0.0%) | 0 (0.0%) |
| 5 Years | 0 (0.0%) | 0 (0.0%) |
| 6 to 11 Years | 0 (0.0%) | 0 (0.0%) |
| 12 to 14 Years | 0 (0.0%) | 0 (0.0%) |
| 15 Years | 0 (0.0%) | 0 (0.0%) |
| 16 and 17 Years | 0 (0.0%) | 0 (0.0%) |
| 18 to 24 Years | 0 (0.0%) | 21 (17.2%) |
| 25 to 34 Years | 0 (0.0%) | 59 (17.0%) |
| 35 to 44 Years | 0 (0.0%) | 0 (0.0%) |
| 45 to 54 Years | 17 (4.6%) | 17 (4.5%) |
| 55 to 64 Years | 33 (14.9%) | 16 (7.0%) |
| 65 to 74 Years | 0 (0.0%) | 106 (52.5%) |
| 75 Years and over | 17 (13.9%) | 28 (15.0%) |
| Total | 67 (2.6%) | 247 (10.6%) |
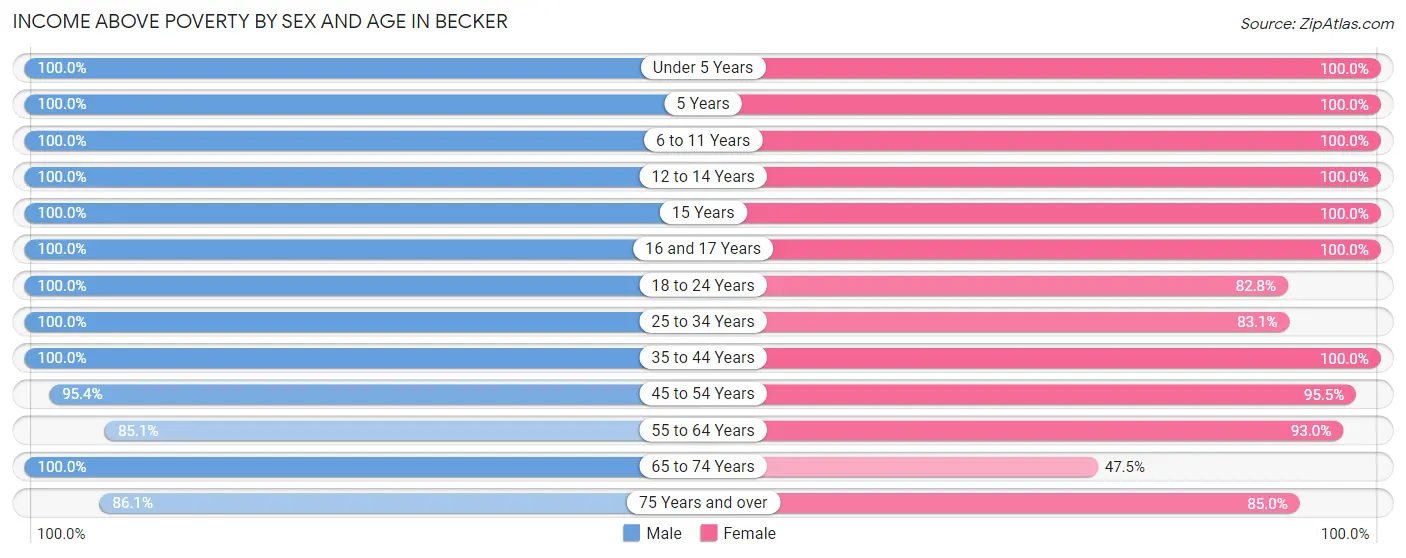
Income Above Poverty by Sex and Age in Becker
According to the poverty statistics in Becker, males aged under 5 years and females aged under 5 years are the age groups that are most secure financially, with 100.0% of males and 100.0% of females in these age groups living above the poverty line.
| Age Bracket | Male | Female |
| Under 5 Years | 252 (100.0%) | 144 (100.0%) |
| 5 Years | 30 (100.0%) | 6 (100.0%) |
| 6 to 11 Years | 283 (100.0%) | 180 (100.0%) |
| 12 to 14 Years | 91 (100.0%) | 193 (100.0%) |
| 15 Years | 15 (100.0%) | 23 (100.0%) |
| 16 and 17 Years | 35 (100.0%) | 65 (100.0%) |
| 18 to 24 Years | 413 (100.0%) | 101 (82.8%) |
| 25 to 34 Years | 330 (100.0%) | 289 (83.1%) |
| 35 to 44 Years | 284 (100.0%) | 266 (100.0%) |
| 45 to 54 Years | 354 (95.4%) | 357 (95.5%) |
| 55 to 64 Years | 188 (85.1%) | 214 (93.0%) |
| 65 to 74 Years | 97 (100.0%) | 96 (47.5%) |
| 75 Years and over | 105 (86.1%) | 158 (85.0%) |
| Total | 2,477 (97.4%) | 2,092 (89.4%) |
Income Below Poverty Among Married-Couple Families in Becker
| Children | Above Poverty | Below Poverty |
| No Children | 383 (100.0%) | 0 (0.0%) |
| 1 or 2 Children | 441 (100.0%) | 0 (0.0%) |
| 3 or 4 Children | 41 (100.0%) | 0 (0.0%) |
| 5 or more Children | 0 (0.0%) | 0 (0.0%) |
| Total | 865 (100.0%) | 0 (0.0%) |
Income Below Poverty Among Single-Parent Households in Becker
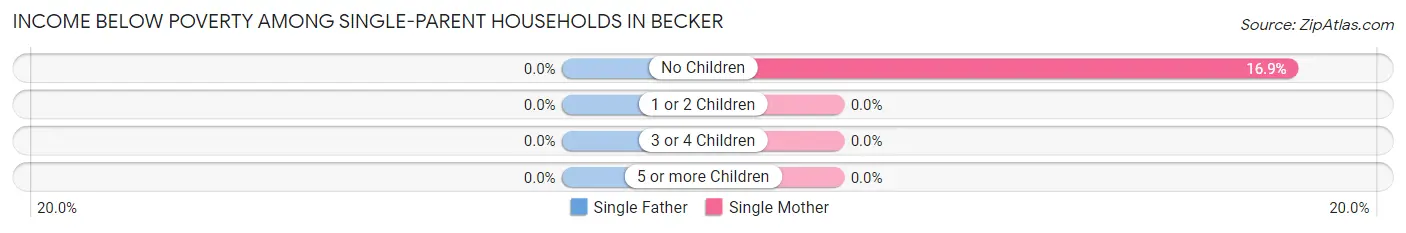
| Children | Single Father | Single Mother |
| No Children | 0 (0.0%) | 21 (16.9%) |
| 1 or 2 Children | 0 (0.0%) | 0 (0.0%) |
| 3 or 4 Children | 0 (0.0%) | 0 (0.0%) |
| 5 or more Children | 0 (0.0%) | 0 (0.0%) |
| Total | 0 (0.0%) | 21 (9.0%) |
Income Below Poverty Among Married-Couple vs Single-Parent Households in Becker
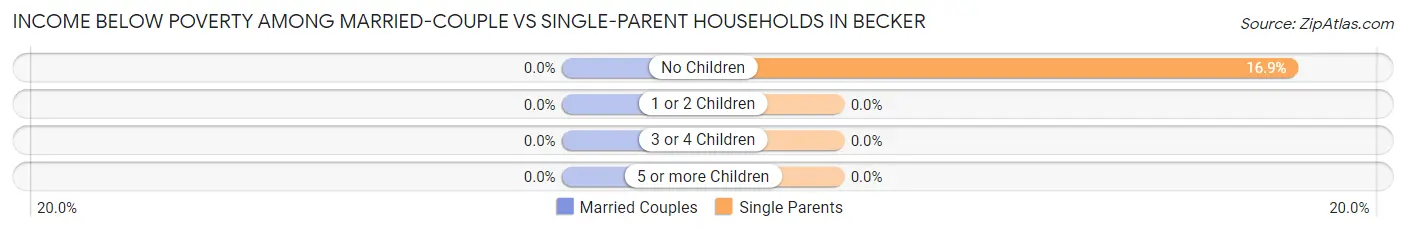
| Children | Married-Couple Families | Single-Parent Households |
| No Children | 0 (0.0%) | 21 (16.9%) |
| 1 or 2 Children | 0 (0.0%) | 0 (0.0%) |
| 3 or 4 Children | 0 (0.0%) | 0 (0.0%) |
| 5 or more Children | 0 (0.0%) | 0 (0.0%) |
| Total | 0 (0.0%) | 21 (5.9%) |
Race in Becker
The most populous races in Becker are White / Caucasian (4,670 | 95.4%), Two or more Races (164 | 3.4%), and Hispanic or Latino (54 | 1.1%).
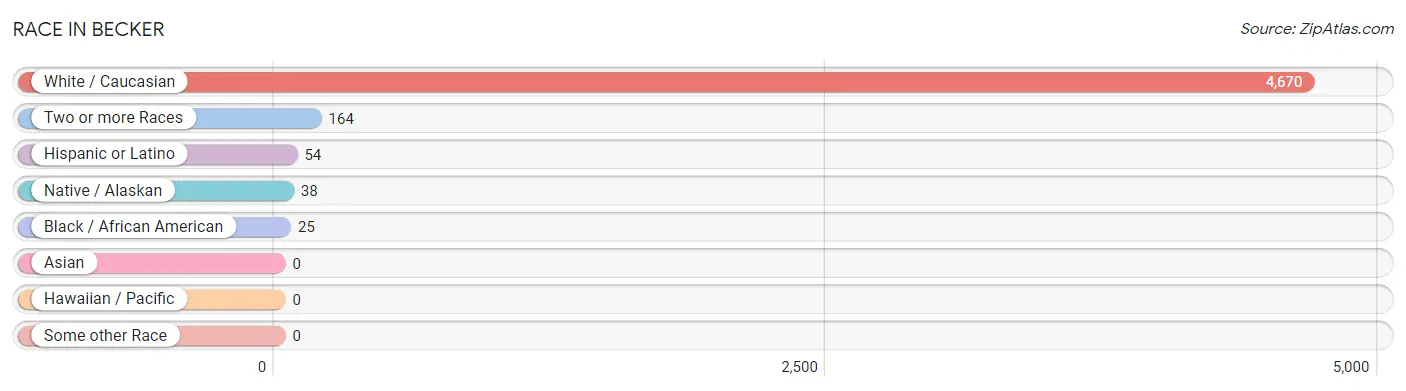
| Race | # Population | % Population |
| Asian | 0 | 0.0% |
| Black / African American | 25 | 0.5% |
| Hawaiian / Pacific | 0 | 0.0% |
| Hispanic or Latino | 54 | 1.1% |
| Native / Alaskan | 38 | 0.8% |
| White / Caucasian | 4,670 | 95.4% |
| Two or more Races | 164 | 3.4% |
| Some other Race | 0 | 0.0% |
| Total | 4,897 | 100.0% |
Ancestry in Becker
The most populous ancestries reported in Becker are German (1,946 | 39.7%), Norwegian (646 | 13.2%), Irish (340 | 6.9%), Swedish (327 | 6.7%), and English (310 | 6.3%), together accounting for 72.9% of all Becker residents.
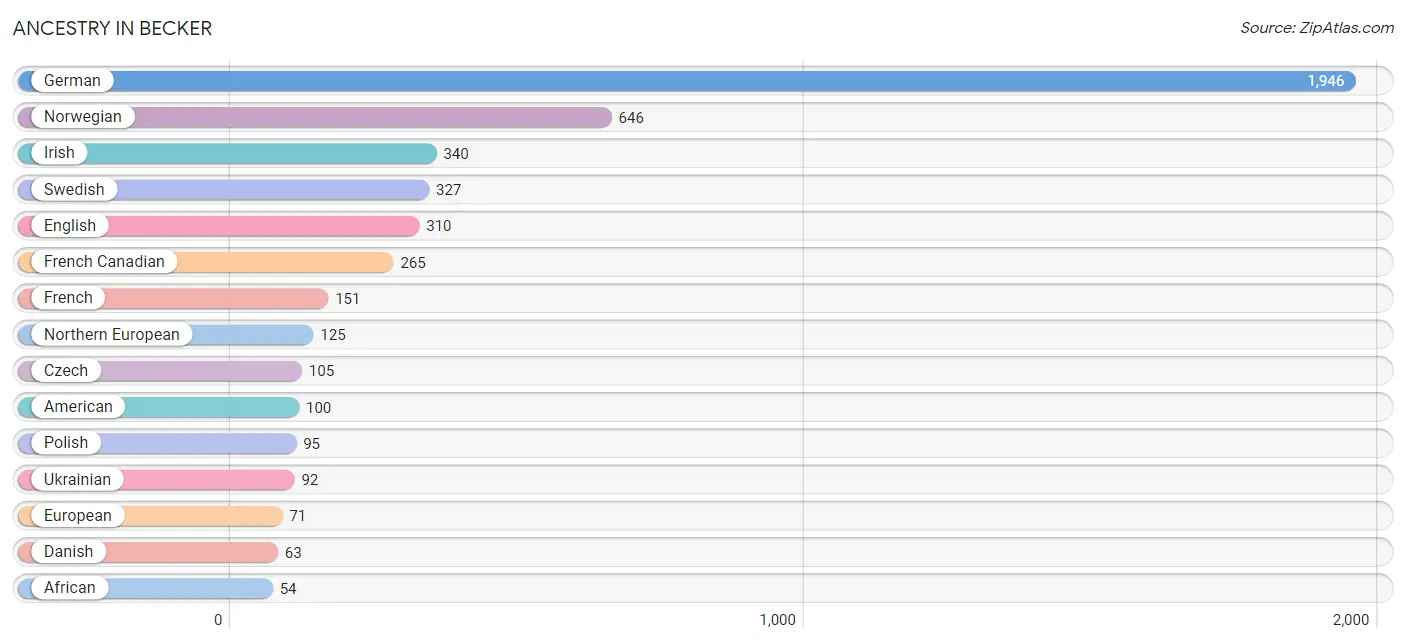
| Ancestry | # Population | % Population |
| African | 54 | 1.1% |
| American | 100 | 2.0% |
| Chippewa | 38 | 0.8% |
| Czech | 105 | 2.1% |
| Czechoslovakian | 22 | 0.4% |
| Danish | 63 | 1.3% |
| English | 310 | 6.3% |
| European | 71 | 1.5% |
| Finnish | 31 | 0.6% |
| French | 151 | 3.1% |
| French Canadian | 265 | 5.4% |
| German | 1,946 | 39.7% |
| Irish | 340 | 6.9% |
| Italian | 48 | 1.0% |
| Mexican | 54 | 1.1% |
| Northern European | 125 | 2.5% |
| Norwegian | 646 | 13.2% |
| Polish | 95 | 1.9% |
| Subsaharan African | 54 | 1.1% |
| Swedish | 327 | 6.7% |
| Swiss | 11 | 0.2% |
| Ukrainian | 92 | 1.9% |
| Welsh | 29 | 0.6% | View All 23 Rows |
Immigrants in Becker
The most numerous immigrant groups reported in Becker came from , and Canada (19 | 0.4%), together accounting for 0.4% of all Becker residents.

| Immigration Origin | # Population | % Population |
| Canada | 19 | 0.4% | View All 1 Rows |
Sex and Age in Becker
Sex and Age in Becker
The most populous age groups in Becker are Under 5 Years (252 | 9.9%) for men and 45 to 49 Years (288 | 12.3%) for women.
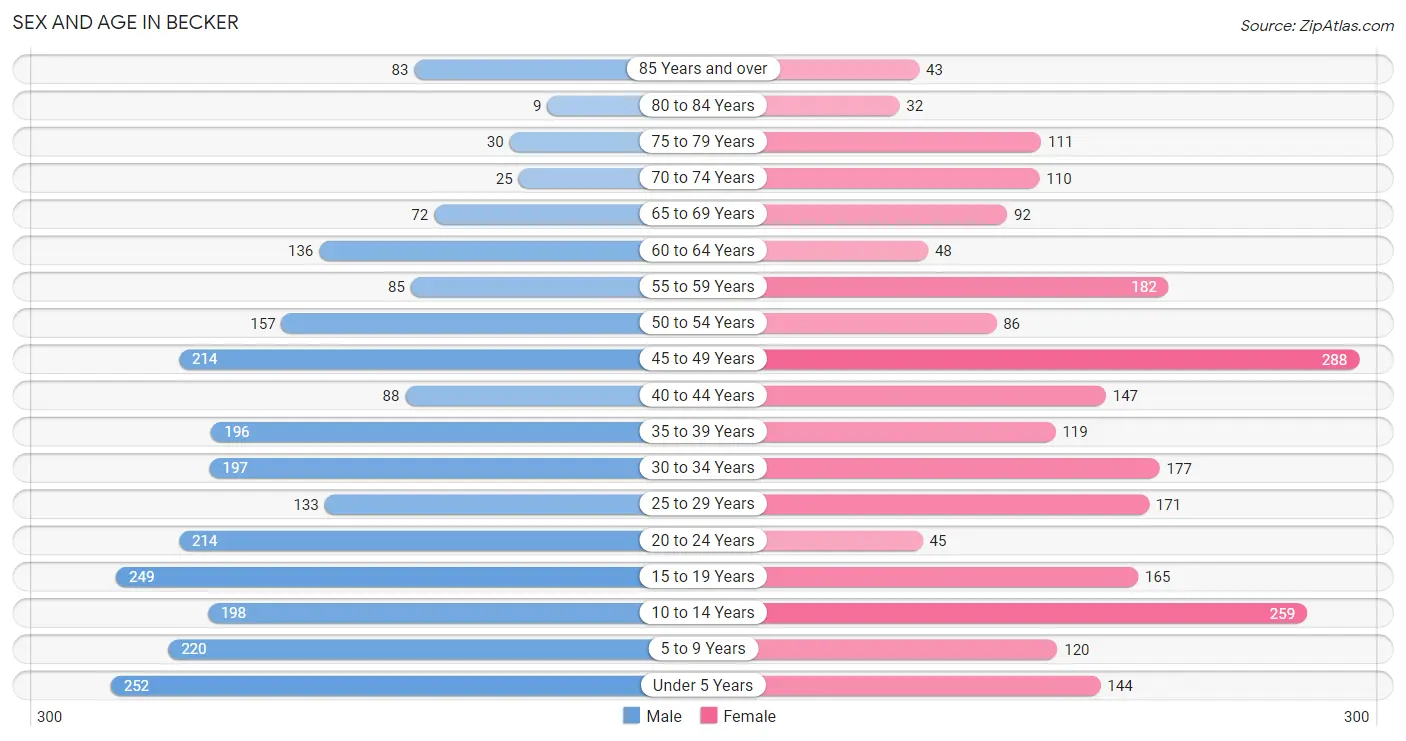
| Age Bracket | Male | Female |
| Under 5 Years | 252 (9.9%) | 144 (6.2%) |
| 5 to 9 Years | 220 (8.6%) | 120 (5.1%) |
| 10 to 14 Years | 198 (7.7%) | 259 (11.1%) |
| 15 to 19 Years | 249 (9.7%) | 165 (7.0%) |
| 20 to 24 Years | 214 (8.4%) | 45 (1.9%) |
| 25 to 29 Years | 133 (5.2%) | 171 (7.3%) |
| 30 to 34 Years | 197 (7.7%) | 177 (7.6%) |
| 35 to 39 Years | 196 (7.7%) | 119 (5.1%) |
| 40 to 44 Years | 88 (3.4%) | 147 (6.3%) |
| 45 to 49 Years | 214 (8.4%) | 288 (12.3%) |
| 50 to 54 Years | 157 (6.1%) | 86 (3.7%) |
| 55 to 59 Years | 85 (3.3%) | 182 (7.8%) |
| 60 to 64 Years | 136 (5.3%) | 48 (2.1%) |
| 65 to 69 Years | 72 (2.8%) | 92 (3.9%) |
| 70 to 74 Years | 25 (1.0%) | 110 (4.7%) |
| 75 to 79 Years | 30 (1.2%) | 111 (4.8%) |
| 80 to 84 Years | 9 (0.4%) | 32 (1.4%) |
| 85 Years and over | 83 (3.2%) | 43 (1.8%) |
| Total | 2,558 (100.0%) | 2,339 (100.0%) |
Families and Households in Becker
Median Family Size in Becker
The median family size in Becker is 3.36 persons per family, with single female/mother families (234 | 19.2%) accounting for the largest median family size of 3.67 persons per family. On the other hand, single male/father families (123 | 10.1%) represent the smallest median family size with 3.05 persons per family.
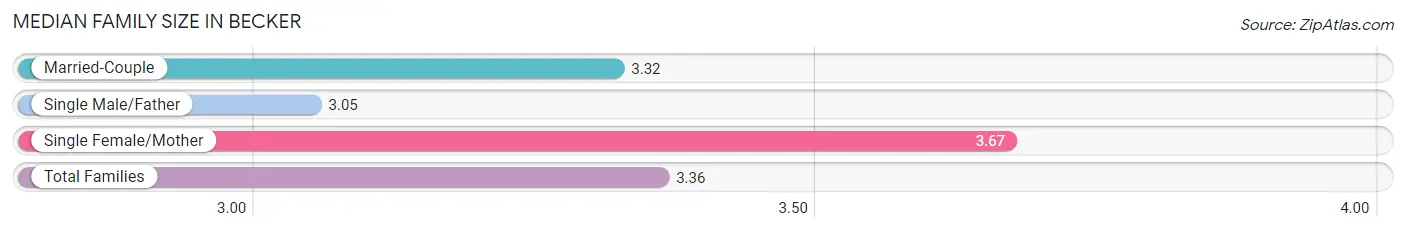
| Family Type | # Families | Family Size |
| Married-Couple | 865 (70.8%) | 3.32 |
| Single Male/Father | 123 (10.1%) | 3.05 |
| Single Female/Mother | 234 (19.2%) | 3.67 |
| Total Families | 1,222 (100.0%) | 3.36 |
Median Household Size in Becker
The median household size in Becker is 2.79 persons per household, with single female/mother households (234 | 13.3%) accounting for the largest median household size of 3.91 persons per household. non-family households (532 | 30.3%) represent the smallest median household size with 1.22 persons per household.
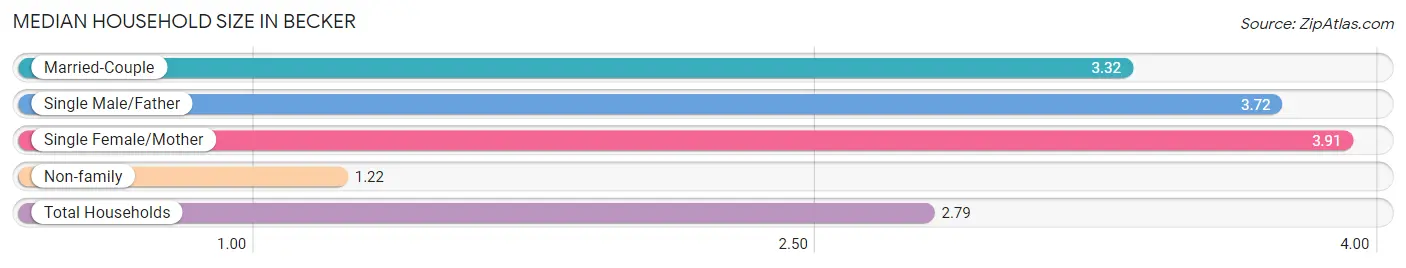
| Household Type | # Households | Household Size |
| Married-Couple | 865 (49.3%) | 3.32 |
| Single Male/Father | 123 (7.0%) | 3.72 |
| Single Female/Mother | 234 (13.3%) | 3.91 |
| Non-family | 532 (30.3%) | 1.22 |
| Total Households | 1,754 (100.0%) | 2.79 |
Household Size by Marriage Status in Becker
Out of a total of 1,754 households in Becker, 1,222 (69.7%) are family households, while 532 (30.3%) are nonfamily households. The most numerous type of family households are 4-person households, comprising 458, and the most common type of nonfamily households are 1-person households, comprising 427.
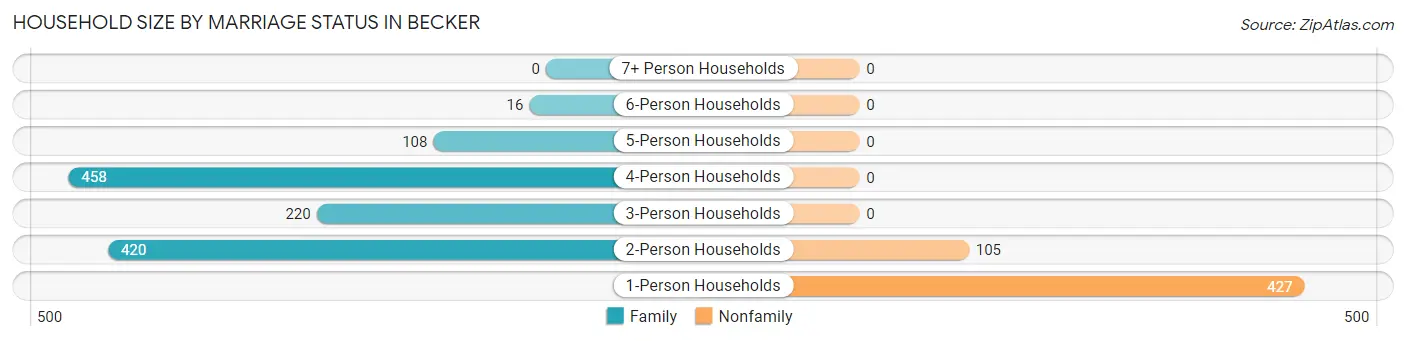
| Household Size | Family Households | Nonfamily Households |
| 1-Person Households | - | 427 (24.3%) |
| 2-Person Households | 420 (23.9%) | 105 (6.0%) |
| 3-Person Households | 220 (12.5%) | 0 (0.0%) |
| 4-Person Households | 458 (26.1%) | 0 (0.0%) |
| 5-Person Households | 108 (6.2%) | 0 (0.0%) |
| 6-Person Households | 16 (0.9%) | 0 (0.0%) |
| 7+ Person Households | 0 (0.0%) | 0 (0.0%) |
| Total | 1,222 (69.7%) | 532 (30.3%) |
Female Fertility in Becker
Fertility by Age in Becker
Average fertility rate in Becker is 106.0 births per 1,000 women. Women in the age bracket of 15 to 19 years have the highest fertility rate with 242.0 births per 1,000 women. Women in the age bracket of 20 to 34 years acount for 60.2% of all women with births.
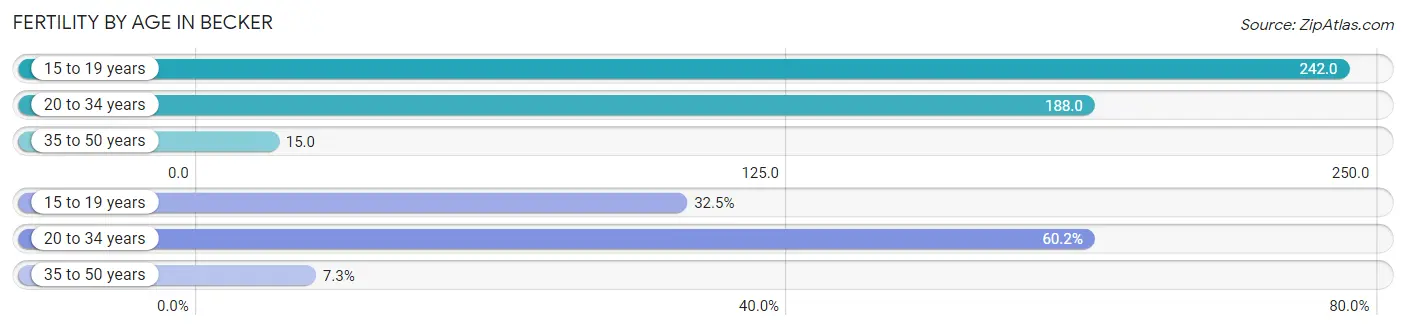
| Age Bracket | Women with Births | Births / 1,000 Women |
| 15 to 19 years | 40 (32.5%) | 242.0 |
| 20 to 34 years | 74 (60.2%) | 188.0 |
| 35 to 50 years | 9 (7.3%) | 15.0 |
| Total | 123 (100.0%) | 106.0 |
Fertility by Age by Marriage Status in Becker
36.6% of women with births (123) in Becker are married. The highest percentage of unmarried women with births falls into 15 to 19 years age bracket with 100.0% of them unmarried at the time of birth, while the lowest percentage of unmarried women with births belong to 35 to 50 years age bracket with 0.0% of them unmarried.
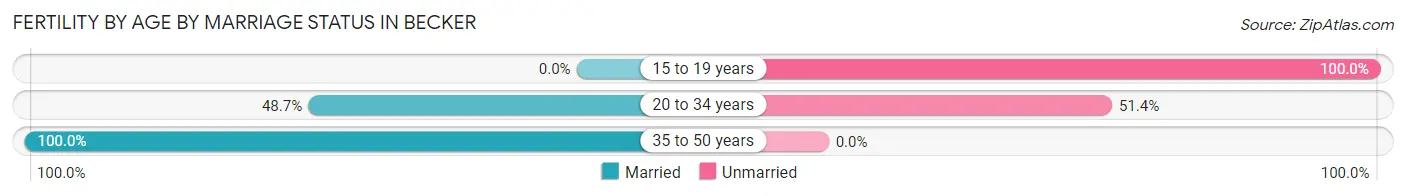
| Age Bracket | Married | Unmarried |
| 15 to 19 years | 0 (0.0%) | 40 (100.0%) |
| 20 to 34 years | 36 (48.6%) | 38 (51.3%) |
| 35 to 50 years | 9 (100.0%) | 0 (0.0%) |
| Total | 45 (36.6%) | 78 (63.4%) |
Fertility by Education in Becker
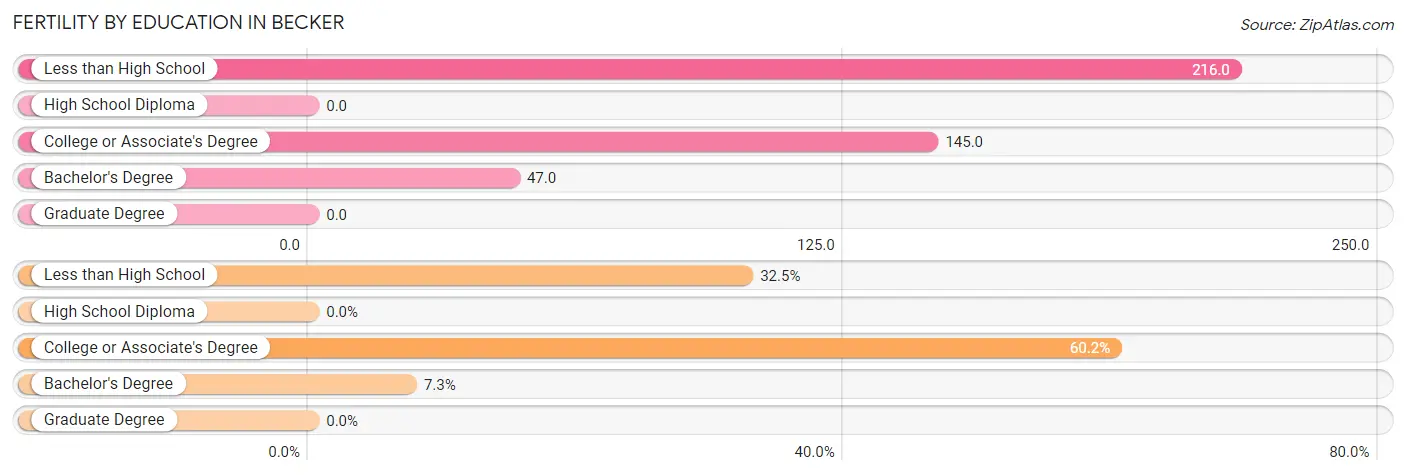
| Educational Attainment | Women with Births | Births / 1,000 Women |
| Less than High School | 40 (32.5%) | 216.0 |
| High School Diploma | 0 (0.0%) | 0.0 |
| College or Associate's Degree | 74 (60.2%) | 145.0 |
| Bachelor's Degree | 9 (7.3%) | 47.0 |
| Graduate Degree | 0 (0.0%) | 0.0 |
| Total | 123 (100.0%) | 106.0 |
Fertility by Education by Marriage Status in Becker
63.4% of women with births in Becker are unmarried. Women with the educational attainment of bachelor's degree are most likely to be married with 100.0% of them married at childbirth, while women with the educational attainment of less than high school are least likely to be married with 100.0% of them unmarried at childbirth.
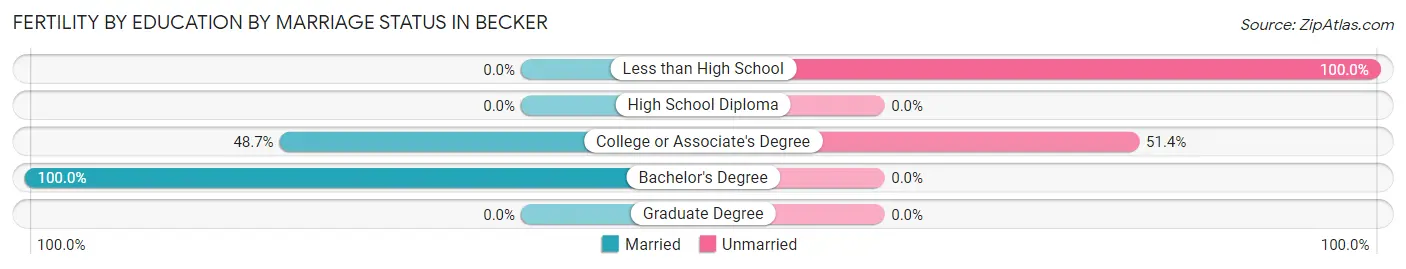
| Educational Attainment | Married | Unmarried |
| Less than High School | 0 (0.0%) | 40 (100.0%) |
| High School Diploma | 0 (0.0%) | 0 (0.0%) |
| College or Associate's Degree | 36 (48.6%) | 38 (51.3%) |
| Bachelor's Degree | 9 (100.0%) | 0 (0.0%) |
| Graduate Degree | 0 (0.0%) | 0 (0.0%) |
| Total | 45 (36.6%) | 78 (63.4%) |
Employment Characteristics in Becker
Employment by Class of Employer in Becker
Among the 2,658 employed individuals in Becker, private company employees (1,843 | 69.3%), local government employees (284 | 10.7%), and not-for-profit organizations (198 | 7.4%) make up the most common classes of employment.
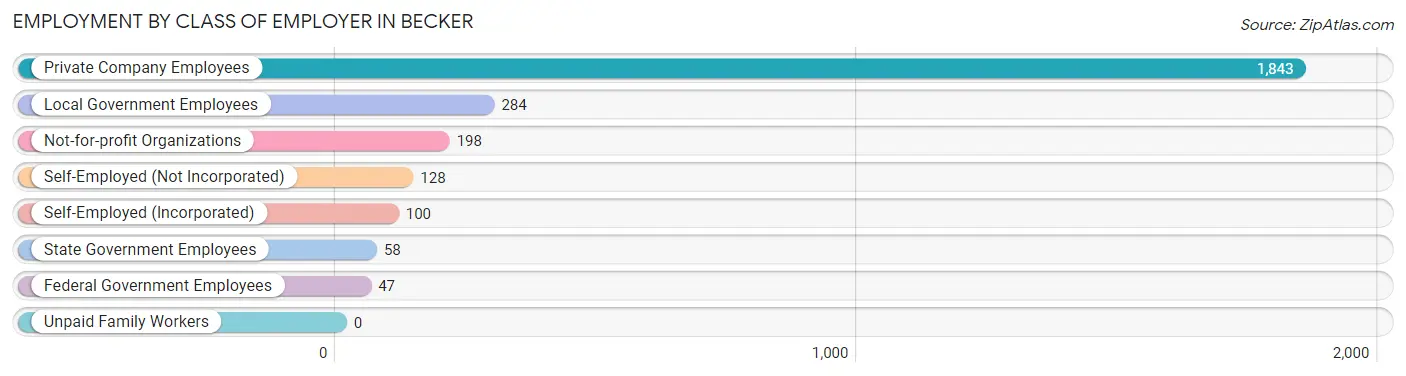
| Employer Class | # Employees | % Employees |
| Private Company Employees | 1,843 | 69.3% |
| Self-Employed (Incorporated) | 100 | 3.8% |
| Self-Employed (Not Incorporated) | 128 | 4.8% |
| Not-for-profit Organizations | 198 | 7.4% |
| Local Government Employees | 284 | 10.7% |
| State Government Employees | 58 | 2.2% |
| Federal Government Employees | 47 | 1.8% |
| Unpaid Family Workers | 0 | 0.0% |
| Total | 2,658 | 100.0% |
Employment Status by Age in Becker
According to the labor force statistics for Becker, out of the total population over 16 years of age (3,666), 74.8% or 2,742 individuals are in the labor force, with 0.6% or 16 of them unemployed. The age group with the highest labor force participation rate is 20 to 24 years, with 100.0% or 259 individuals in the labor force. Within the labor force, the 30 to 34 years age range has the highest percentage of unemployed individuals, with 4.3% or 16 of them being unemployed.
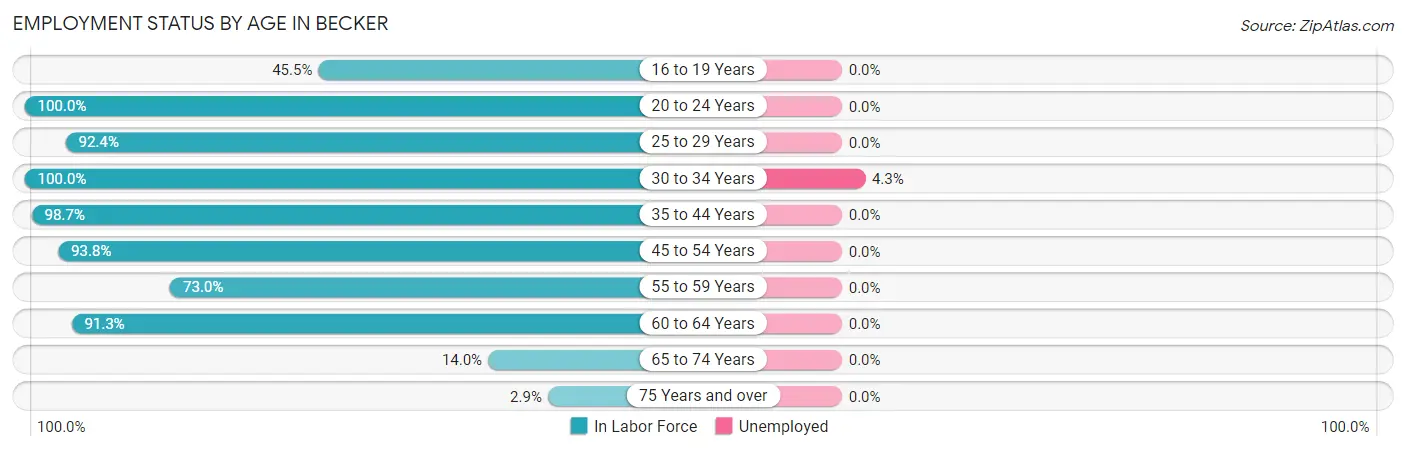
| Age Bracket | In Labor Force | Unemployed |
| 16 to 19 Years | 171 (45.5%) | 0 (0.0%) |
| 20 to 24 Years | 259 (100.0%) | 0 (0.0%) |
| 25 to 29 Years | 281 (92.4%) | 0 (0.0%) |
| 30 to 34 Years | 374 (100.0%) | 16 (4.3%) |
| 35 to 44 Years | 543 (98.7%) | 0 (0.0%) |
| 45 to 54 Years | 699 (93.8%) | 0 (0.0%) |
| 55 to 59 Years | 195 (73.0%) | 0 (0.0%) |
| 60 to 64 Years | 168 (91.3%) | 0 (0.0%) |
| 65 to 74 Years | 42 (14.0%) | 0 (0.0%) |
| 75 Years and over | 9 (2.9%) | 0 (0.0%) |
| Total | 2,742 (74.8%) | 16 (0.6%) |
Employment Status by Educational Attainment in Becker
According to labor force statistics for Becker, 93.2% of individuals (2,259) out of the total population between 25 and 64 years of age (2,424) are in the labor force, with 0.7% or 16 of them being unemployed. The group with the highest labor force participation rate are those with the educational attainment of less than high school, with 100.0% or 84 individuals in the labor force. Within the labor force, individuals with college / associate degree education have the highest percentage of unemployment, with 1.8% or 16 of them being unemployed.
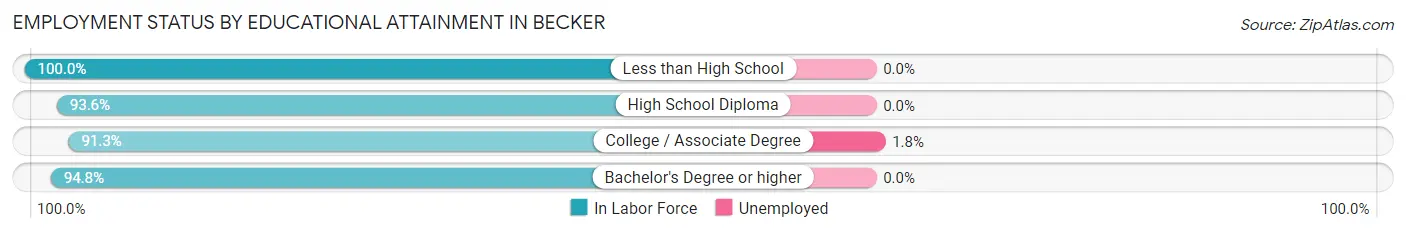
| Educational Attainment | In Labor Force | Unemployed |
| Less than High School | 84 (100.0%) | 0 (0.0%) |
| High School Diploma | 655 (93.6%) | 0 (0.0%) |
| College / Associate Degree | 879 (91.3%) | 17 (1.8%) |
| Bachelor's Degree or higher | 642 (94.8%) | 0 (0.0%) |
| Total | 2,259 (93.2%) | 17 (0.7%) |
Employment Occupations by Sex in Becker
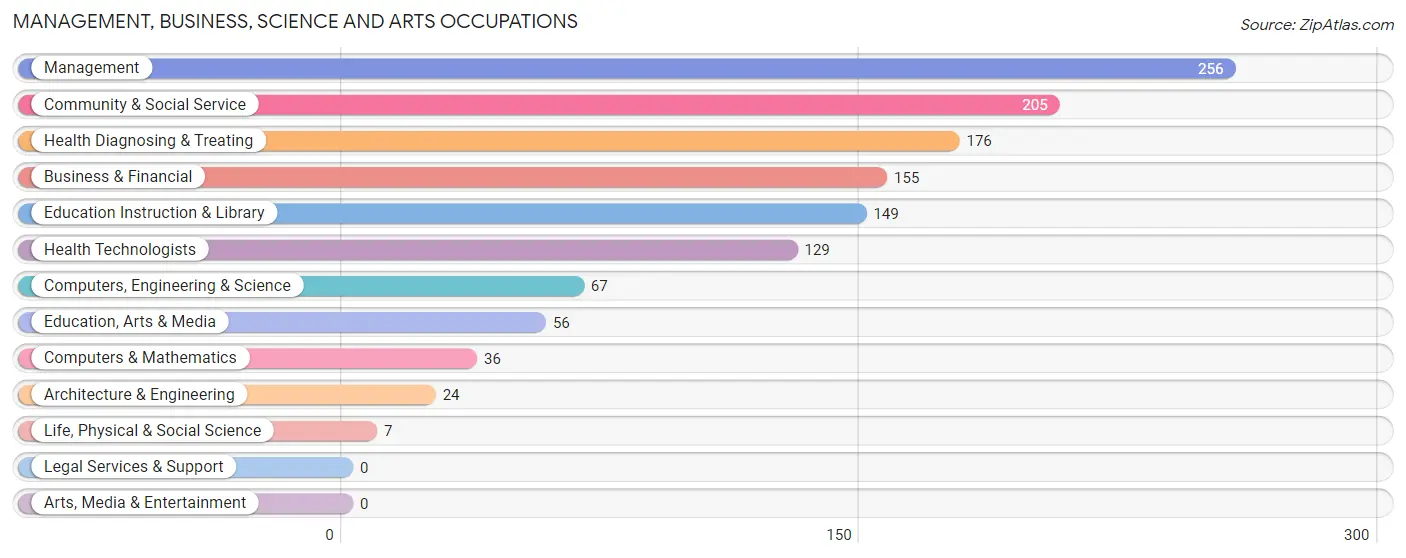
Management, Business, Science and Arts Occupations
The most common Management, Business, Science and Arts occupations in Becker are Management (256 | 9.4%), Community & Social Service (205 | 7.5%), Health Diagnosing & Treating (176 | 6.5%), Business & Financial (155 | 5.7%), and Education Instruction & Library (149 | 5.5%).
Management, Business, Science and Arts Occupations by Sex
Within the Management, Business, Science and Arts occupations in Becker, the most male-oriented occupations are Architecture & Engineering (100.0%), Life, Physical & Social Science (100.0%), and Computers, Engineering & Science (68.7%), while the most female-oriented occupations are Education, Arts & Media (100.0%), Health Diagnosing & Treating (83.5%), and Health Technologists (77.5%).
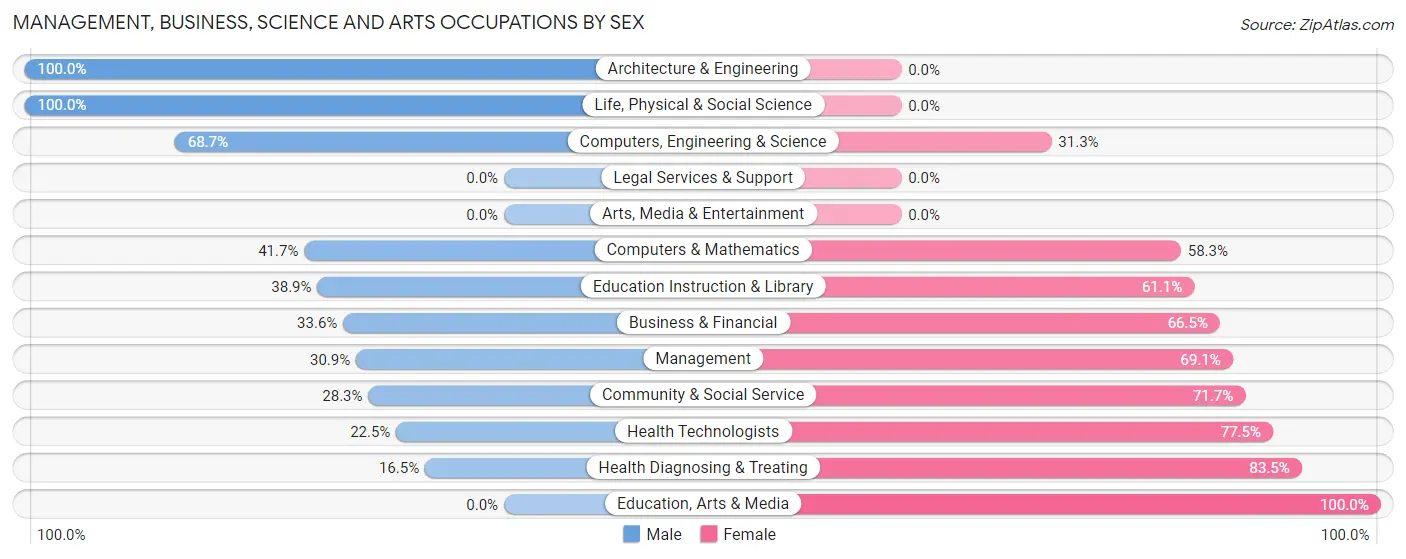
| Occupation | Male | Female |
| Management | 79 (30.9%) | 177 (69.1%) |
| Business & Financial | 52 (33.6%) | 103 (66.4%) |
| Computers, Engineering & Science | 46 (68.7%) | 21 (31.3%) |
| Computers & Mathematics | 15 (41.7%) | 21 (58.3%) |
| Architecture & Engineering | 24 (100.0%) | 0 (0.0%) |
| Life, Physical & Social Science | 7 (100.0%) | 0 (0.0%) |
| Community & Social Service | 58 (28.3%) | 147 (71.7%) |
| Education, Arts & Media | 0 (0.0%) | 56 (100.0%) |
| Legal Services & Support | 0 (0.0%) | 0 (0.0%) |
| Education Instruction & Library | 58 (38.9%) | 91 (61.1%) |
| Arts, Media & Entertainment | 0 (0.0%) | 0 (0.0%) |
| Health Diagnosing & Treating | 29 (16.5%) | 147 (83.5%) |
| Health Technologists | 29 (22.5%) | 100 (77.5%) |
| Total (Category) | 264 (30.7%) | 595 (69.3%) |
| Total (Overall) | 1,524 (55.9%) | 1,201 (44.1%) |
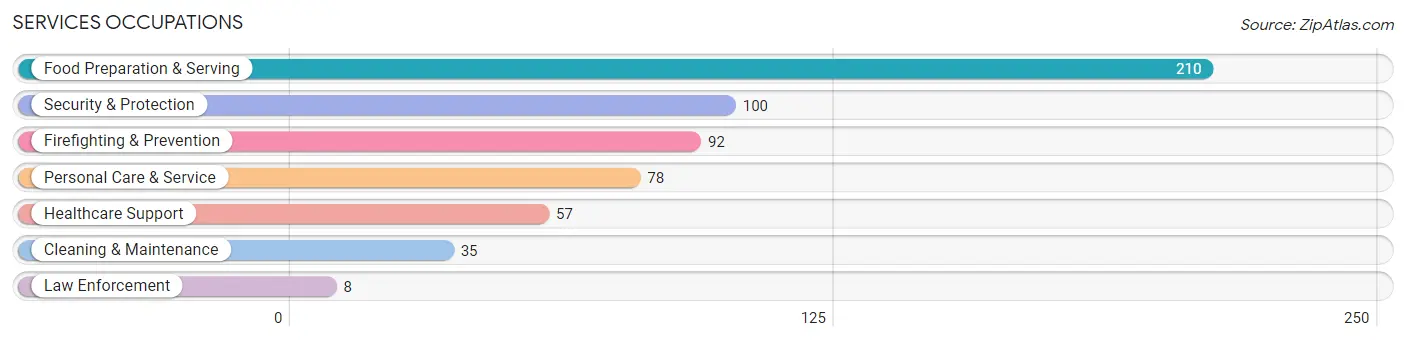
Services Occupations
The most common Services occupations in Becker are Food Preparation & Serving (210 | 7.7%), Security & Protection (100 | 3.7%), Firefighting & Prevention (92 | 3.4%), Personal Care & Service (78 | 2.9%), and Healthcare Support (57 | 2.1%).
Services Occupations by Sex
Within the Services occupations in Becker, the most male-oriented occupations are Law Enforcement (100.0%), Food Preparation & Serving (96.7%), and Security & Protection (71.0%), while the most female-oriented occupations are Healthcare Support (100.0%), Personal Care & Service (100.0%), and Cleaning & Maintenance (42.9%).
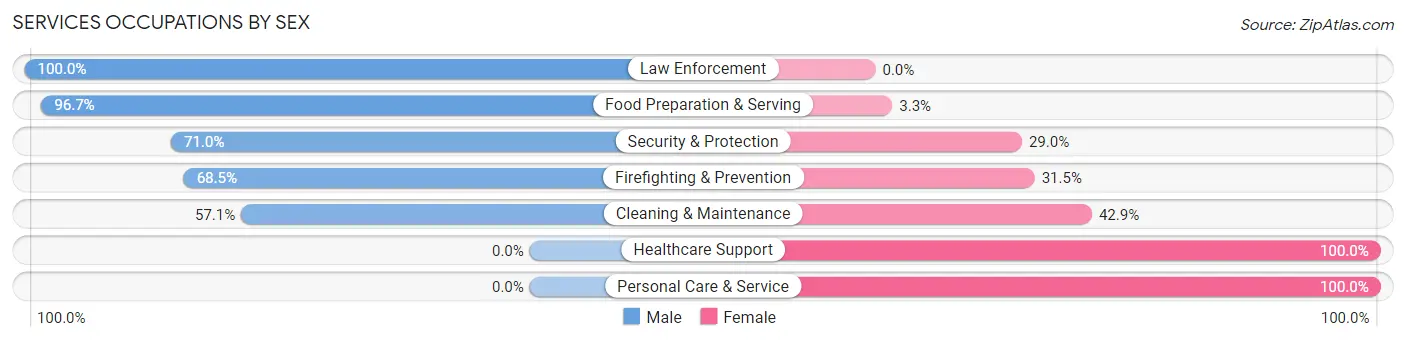
| Occupation | Male | Female |
| Healthcare Support | 0 (0.0%) | 57 (100.0%) |
| Security & Protection | 71 (71.0%) | 29 (29.0%) |
| Firefighting & Prevention | 63 (68.5%) | 29 (31.5%) |
| Law Enforcement | 8 (100.0%) | 0 (0.0%) |
| Food Preparation & Serving | 203 (96.7%) | 7 (3.3%) |
| Cleaning & Maintenance | 20 (57.1%) | 15 (42.9%) |
| Personal Care & Service | 0 (0.0%) | 78 (100.0%) |
| Total (Category) | 294 (61.3%) | 186 (38.8%) |
| Total (Overall) | 1,524 (55.9%) | 1,201 (44.1%) |
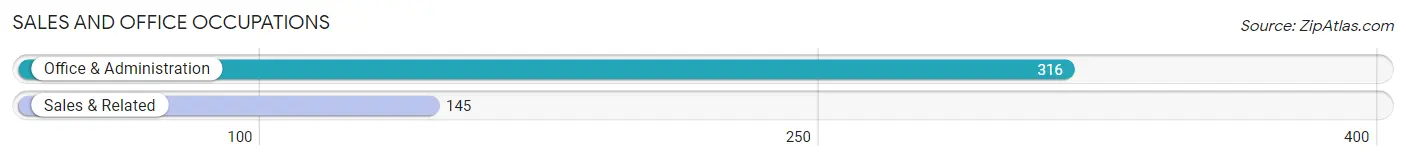
Sales and Office Occupations
The most common Sales and Office occupations in Becker are Office & Administration (316 | 11.6%), and Sales & Related (145 | 5.3%).
Sales and Office Occupations by Sex
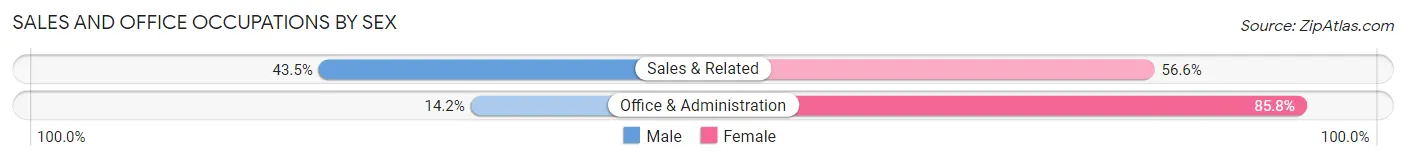
| Occupation | Male | Female |
| Sales & Related | 63 (43.4%) | 82 (56.6%) |
| Office & Administration | 45 (14.2%) | 271 (85.8%) |
| Total (Category) | 108 (23.4%) | 353 (76.6%) |
| Total (Overall) | 1,524 (55.9%) | 1,201 (44.1%) |
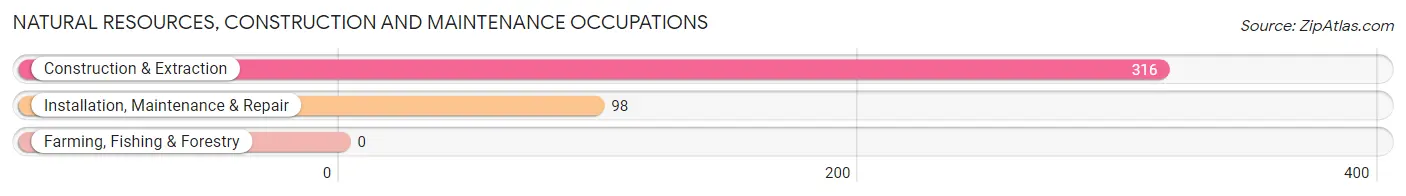
Natural Resources, Construction and Maintenance Occupations
The most common Natural Resources, Construction and Maintenance occupations in Becker are Construction & Extraction (316 | 11.6%), and Installation, Maintenance & Repair (98 | 3.6%).
Natural Resources, Construction and Maintenance Occupations by Sex
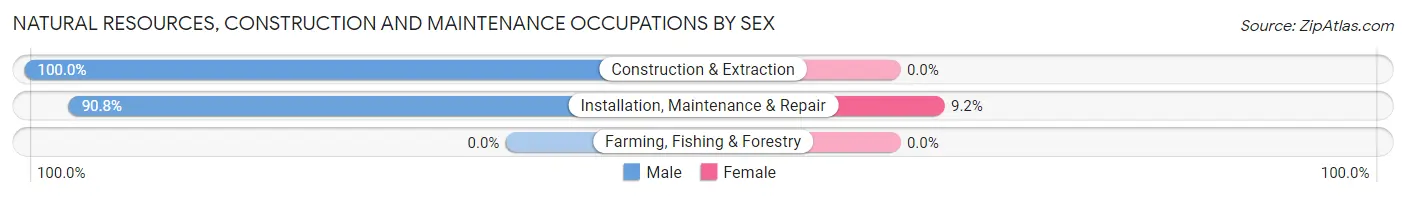
| Occupation | Male | Female |
| Farming, Fishing & Forestry | 0 (0.0%) | 0 (0.0%) |
| Construction & Extraction | 316 (100.0%) | 0 (0.0%) |
| Installation, Maintenance & Repair | 89 (90.8%) | 9 (9.2%) |
| Total (Category) | 405 (97.8%) | 9 (2.2%) |
| Total (Overall) | 1,524 (55.9%) | 1,201 (44.1%) |
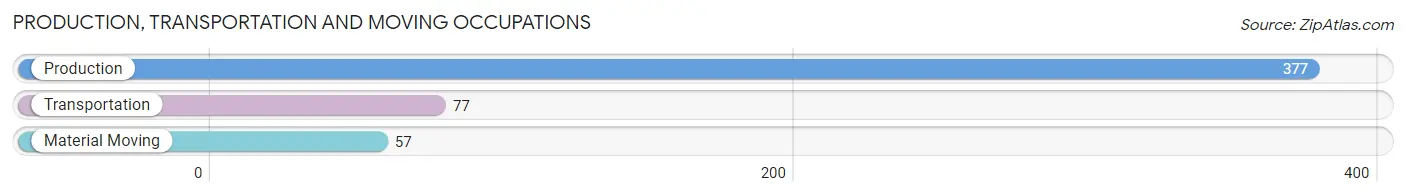
Production, Transportation and Moving Occupations
The most common Production, Transportation and Moving occupations in Becker are Production (377 | 13.8%), Transportation (77 | 2.8%), and Material Moving (57 | 2.1%).
Production, Transportation and Moving Occupations by Sex
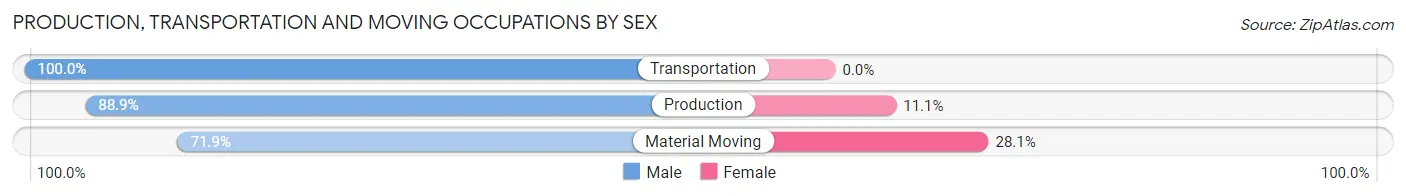
| Occupation | Male | Female |
| Production | 335 (88.9%) | 42 (11.1%) |
| Transportation | 77 (100.0%) | 0 (0.0%) |
| Material Moving | 41 (71.9%) | 16 (28.1%) |
| Total (Category) | 453 (88.6%) | 58 (11.4%) |
| Total (Overall) | 1,524 (55.9%) | 1,201 (44.1%) |
Employment Industries by Sex in Becker
Employment Industries in Becker
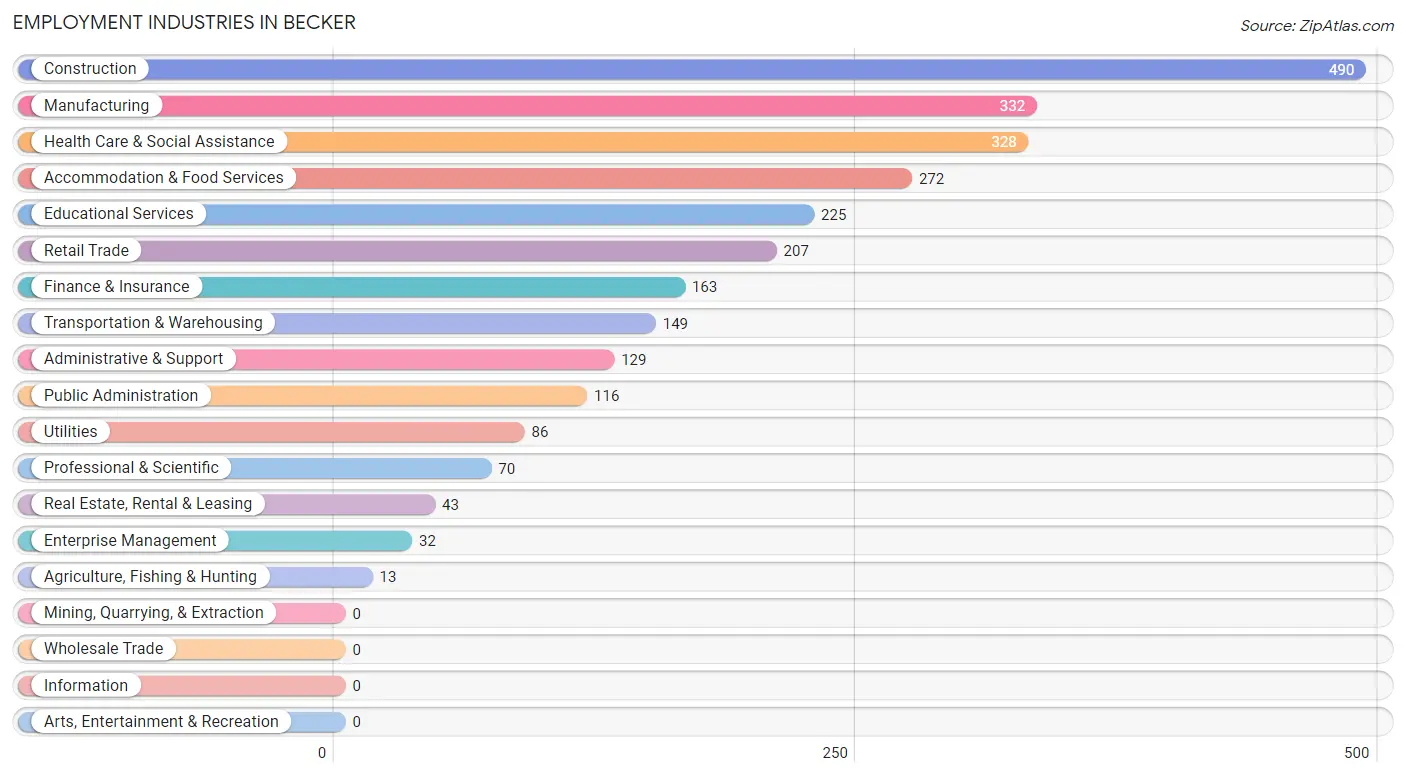
The major employment industries in Becker include Construction (490 | 18.0%), Manufacturing (332 | 12.2%), Health Care & Social Assistance (328 | 12.0%), Accommodation & Food Services (272 | 10.0%), and Educational Services (225 | 8.3%).
Employment Industries by Sex in Becker
The Becker industries that see more men than women are Agriculture, Fishing & Hunting (100.0%), Utilities (100.0%), and Construction (91.4%), whereas the industries that tend to have a higher number of women are Real Estate, Rental & Leasing (100.0%), Enterprise Management (100.0%), and Health Care & Social Assistance (91.2%).
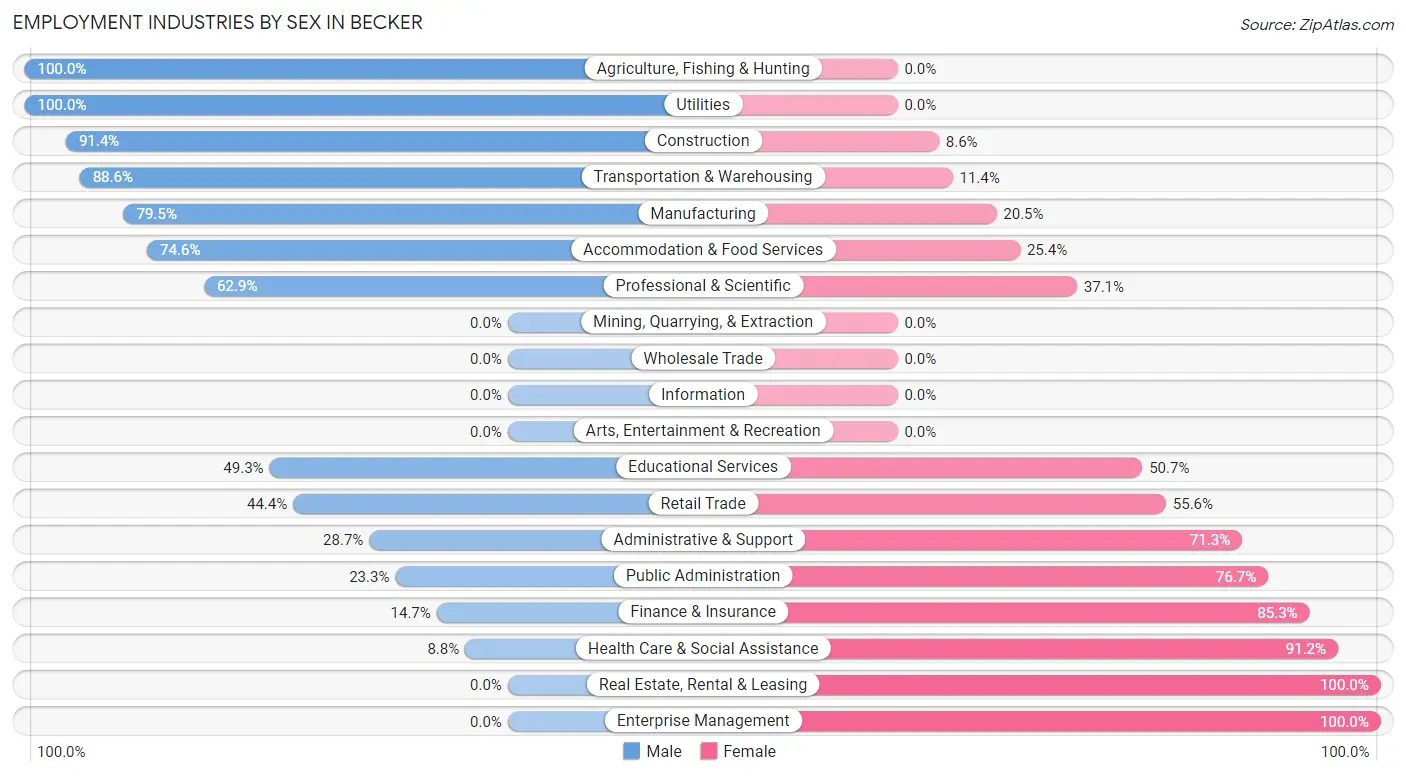
| Industry | Male | Female |
| Agriculture, Fishing & Hunting | 13 (100.0%) | 0 (0.0%) |
| Mining, Quarrying, & Extraction | 0 (0.0%) | 0 (0.0%) |
| Construction | 448 (91.4%) | 42 (8.6%) |
| Manufacturing | 264 (79.5%) | 68 (20.5%) |
| Wholesale Trade | 0 (0.0%) | 0 (0.0%) |
| Retail Trade | 92 (44.4%) | 115 (55.6%) |
| Transportation & Warehousing | 132 (88.6%) | 17 (11.4%) |
| Utilities | 86 (100.0%) | 0 (0.0%) |
| Information | 0 (0.0%) | 0 (0.0%) |
| Finance & Insurance | 24 (14.7%) | 139 (85.3%) |
| Real Estate, Rental & Leasing | 0 (0.0%) | 43 (100.0%) |
| Professional & Scientific | 44 (62.9%) | 26 (37.1%) |
| Enterprise Management | 0 (0.0%) | 32 (100.0%) |
| Administrative & Support | 37 (28.7%) | 92 (71.3%) |
| Educational Services | 111 (49.3%) | 114 (50.7%) |
| Health Care & Social Assistance | 29 (8.8%) | 299 (91.2%) |
| Arts, Entertainment & Recreation | 0 (0.0%) | 0 (0.0%) |
| Accommodation & Food Services | 203 (74.6%) | 69 (25.4%) |
| Public Administration | 27 (23.3%) | 89 (76.7%) |
| Total | 1,524 (55.9%) | 1,201 (44.1%) |
Education in Becker
School Enrollment in Becker
The most common levels of schooling among the 1,224 students in Becker are elementary school (339 | 27.7%), middle school (291 | 23.8%), and high school (235 | 19.2%).
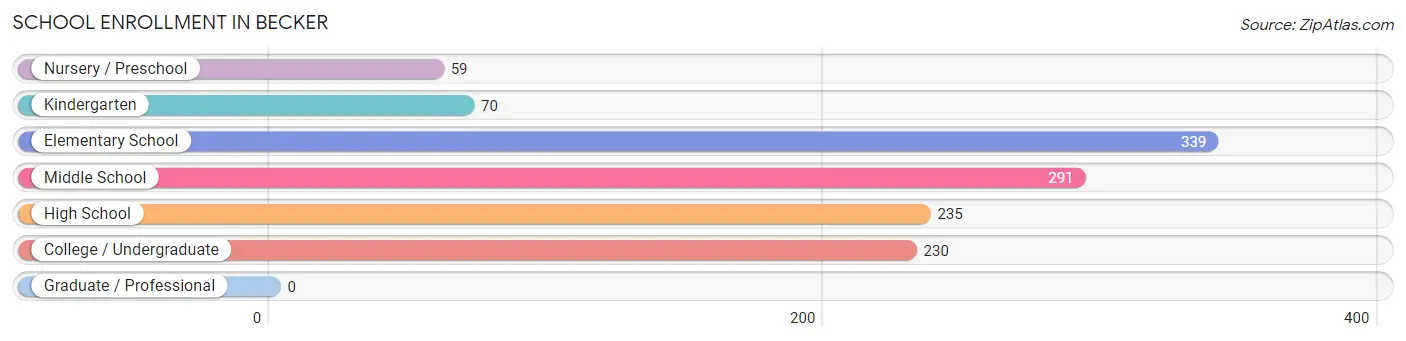
| School Level | # Students | % Students |
| Nursery / Preschool | 59 | 4.8% |
| Kindergarten | 70 | 5.7% |
| Elementary School | 339 | 27.7% |
| Middle School | 291 | 23.8% |
| High School | 235 | 19.2% |
| College / Undergraduate | 230 | 18.8% |
| Graduate / Professional | 0 | 0.0% |
| Total | 1,224 | 100.0% |
School Enrollment by Age by Funding Source in Becker
Out of a total of 1,224 students who are enrolled in schools in Becker, 108 (8.8%) attend a private institution, while the remaining 1,116 (91.2%) are enrolled in public schools. The age group of 25 to 34 year olds has the highest likelihood of being enrolled in private schools, with 61 (100.0% in the age bracket) enrolled. Conversely, the age group of 5 to 9 year old has the lowest likelihood of being enrolled in a private school, with 340 (100.0% in the age bracket) attending a public institution.
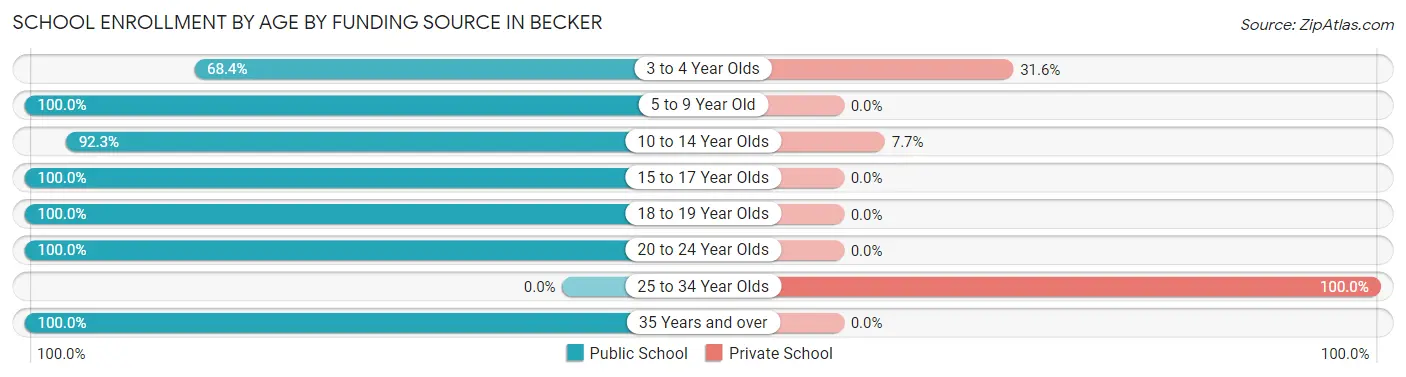
| Age Bracket | Public School | Private School |
| 3 to 4 Year Olds | 26 (68.4%) | 12 (31.6%) |
| 5 to 9 Year Old | 340 (100.0%) | 0 (0.0%) |
| 10 to 14 Year Olds | 422 (92.3%) | 35 (7.7%) |
| 15 to 17 Year Olds | 138 (100.0%) | 0 (0.0%) |
| 18 to 19 Year Olds | 90 (100.0%) | 0 (0.0%) |
| 20 to 24 Year Olds | 83 (100.0%) | 0 (0.0%) |
| 25 to 34 Year Olds | 0 (0.0%) | 61 (100.0%) |
| 35 Years and over | 17 (100.0%) | 0 (0.0%) |
| Total | 1,116 (91.2%) | 108 (8.8%) |
Educational Attainment by Field of Study in Becker
Education (219 | 27.6%), business (180 | 22.7%), arts & humanities (110 | 13.9%), liberal arts & history (76 | 9.6%), and computers & mathematics (55 | 6.9%) are the most common fields of study among 793 individuals in Becker who have obtained a bachelor's degree or higher.
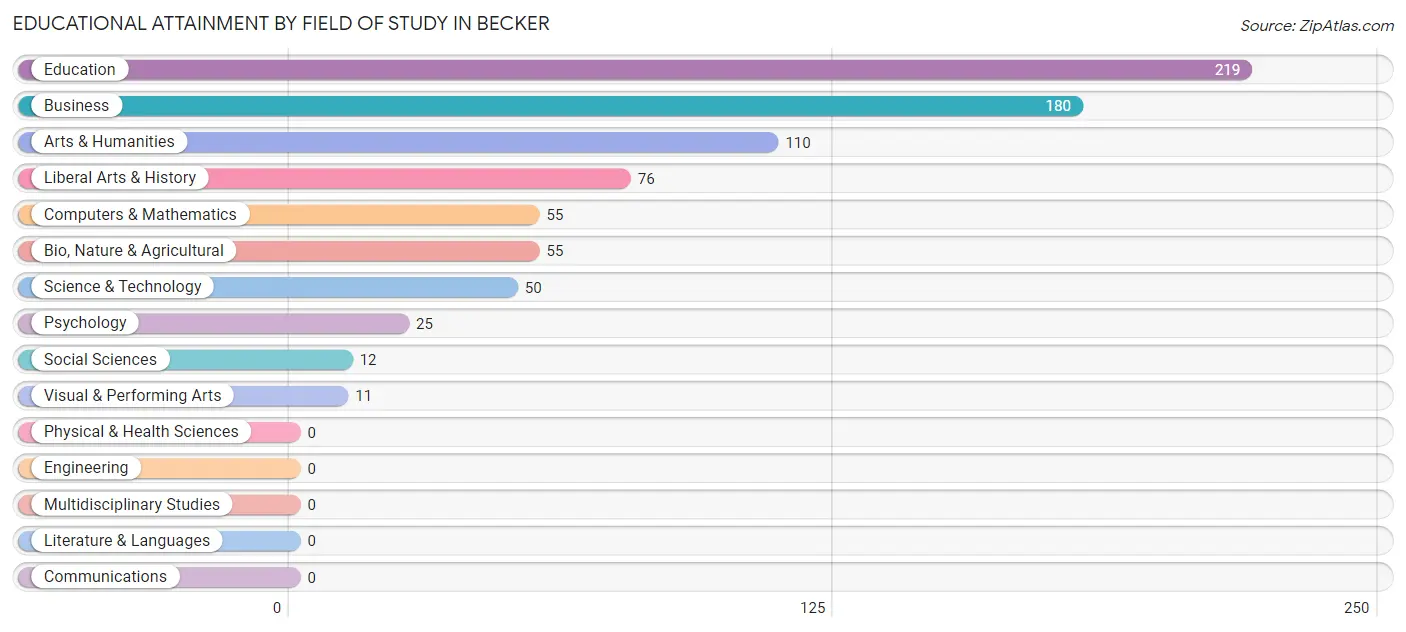
| Field of Study | # Graduates | % Graduates |
| Computers & Mathematics | 55 | 6.9% |
| Bio, Nature & Agricultural | 55 | 6.9% |
| Physical & Health Sciences | 0 | 0.0% |
| Psychology | 25 | 3.2% |
| Social Sciences | 12 | 1.5% |
| Engineering | 0 | 0.0% |
| Multidisciplinary Studies | 0 | 0.0% |
| Science & Technology | 50 | 6.3% |
| Business | 180 | 22.7% |
| Education | 219 | 27.6% |
| Literature & Languages | 0 | 0.0% |
| Liberal Arts & History | 76 | 9.6% |
| Visual & Performing Arts | 11 | 1.4% |
| Communications | 0 | 0.0% |
| Arts & Humanities | 110 | 13.9% |
| Total | 793 | 100.0% |
Transportation & Commute in Becker
Vehicle Availability by Sex in Becker
The most prevalent vehicle ownership categories in Becker are males with 2 vehicles (625, accounting for 42.4%) and females with 2 vehicles (559, making up 52.7%).
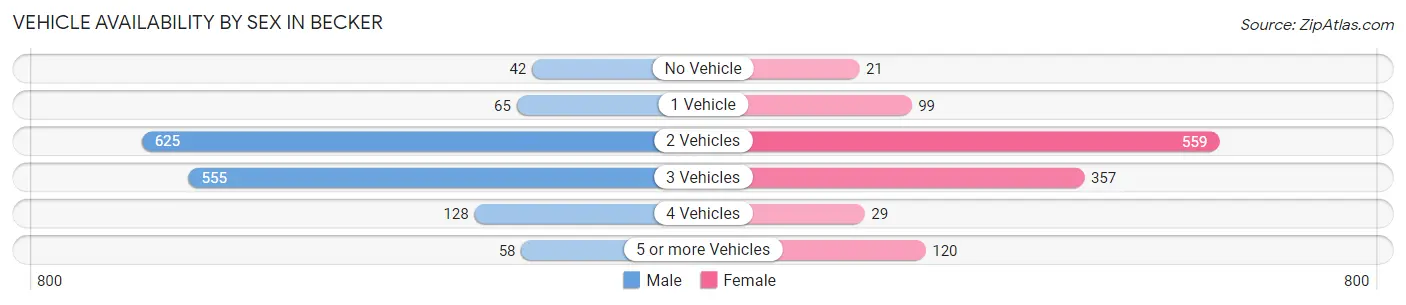
| Vehicles Available | Male | Female |
| No Vehicle | 42 (2.9%) | 21 (1.8%) |
| 1 Vehicle | 65 (4.4%) | 99 (8.4%) |
| 2 Vehicles | 625 (42.4%) | 559 (47.2%) |
| 3 Vehicles | 555 (37.7%) | 357 (30.1%) |
| 4 Vehicles | 128 (8.7%) | 29 (2.5%) |
| 5 or more Vehicles | 58 (3.9%) | 120 (10.1%) |
| Total | 1,473 (100.0%) | 1,185 (100.0%) |
Commute Time in Becker
The most frequently occuring commute durations in Becker are 30 to 34 minutes (428 commuters, 17.3%), 60 to 89 minutes (300 commuters, 12.1%), and 10 to 14 minutes (298 commuters, 12.1%).
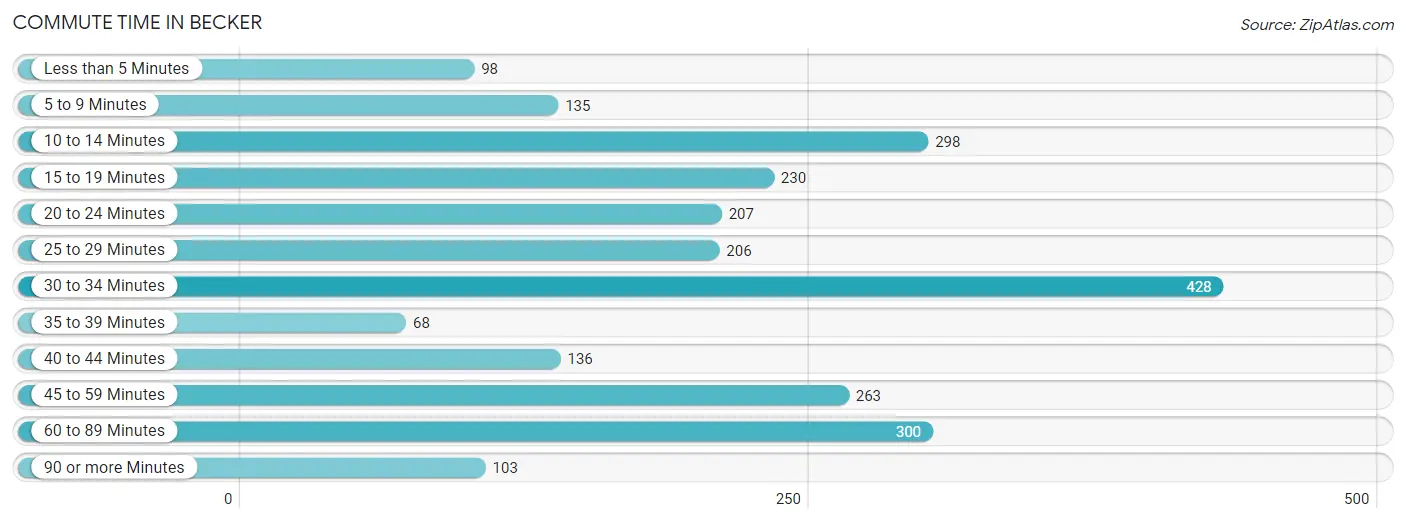
| Commute Time | # Commuters | % Commuters |
| Less than 5 Minutes | 98 | 4.0% |
| 5 to 9 Minutes | 135 | 5.5% |
| 10 to 14 Minutes | 298 | 12.1% |
| 15 to 19 Minutes | 230 | 9.3% |
| 20 to 24 Minutes | 207 | 8.4% |
| 25 to 29 Minutes | 206 | 8.3% |
| 30 to 34 Minutes | 428 | 17.3% |
| 35 to 39 Minutes | 68 | 2.8% |
| 40 to 44 Minutes | 136 | 5.5% |
| 45 to 59 Minutes | 263 | 10.6% |
| 60 to 89 Minutes | 300 | 12.1% |
| 90 or more Minutes | 103 | 4.2% |
Commute Time by Sex in Becker
The most common commute times in Becker are 30 to 34 minutes (267 commuters, 18.3%) for males and 15 to 19 minutes (167 commuters, 16.5%) for females.
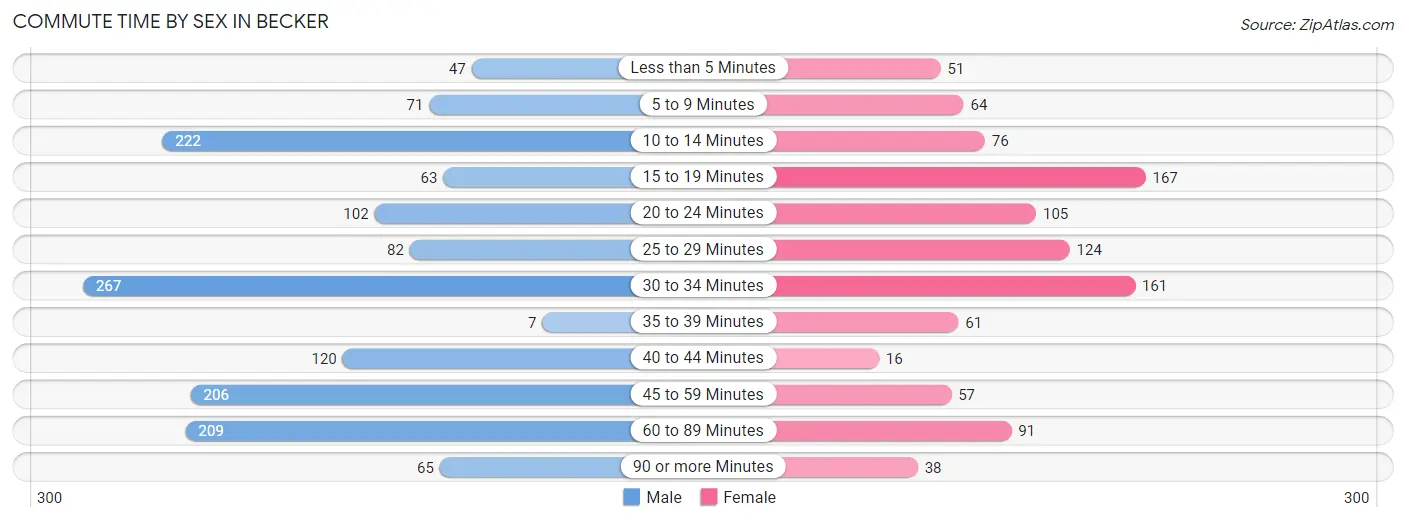
| Commute Time | Male | Female |
| Less than 5 Minutes | 47 (3.2%) | 51 (5.0%) |
| 5 to 9 Minutes | 71 (4.9%) | 64 (6.3%) |
| 10 to 14 Minutes | 222 (15.2%) | 76 (7.5%) |
| 15 to 19 Minutes | 63 (4.3%) | 167 (16.5%) |
| 20 to 24 Minutes | 102 (7.0%) | 105 (10.4%) |
| 25 to 29 Minutes | 82 (5.6%) | 124 (12.3%) |
| 30 to 34 Minutes | 267 (18.3%) | 161 (15.9%) |
| 35 to 39 Minutes | 7 (0.5%) | 61 (6.0%) |
| 40 to 44 Minutes | 120 (8.2%) | 16 (1.6%) |
| 45 to 59 Minutes | 206 (14.1%) | 57 (5.6%) |
| 60 to 89 Minutes | 209 (14.3%) | 91 (9.0%) |
| 90 or more Minutes | 65 (4.4%) | 38 (3.8%) |
Time of Departure to Work by Sex in Becker
The most frequent times of departure to work in Becker are 12:00 AM to 4:59 AM (292, 20.0%) for males and 7:00 AM to 7:29 AM (191, 18.9%) for females.
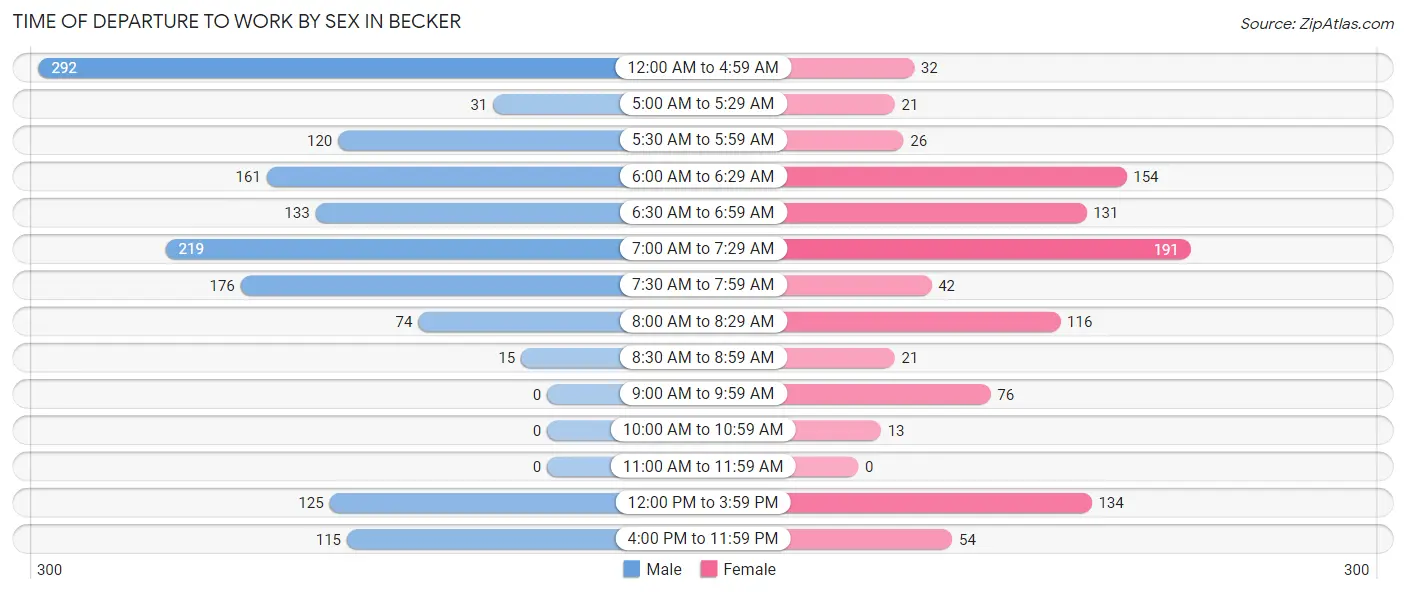
| Time of Departure | Male | Female |
| 12:00 AM to 4:59 AM | 292 (20.0%) | 32 (3.2%) |
| 5:00 AM to 5:29 AM | 31 (2.1%) | 21 (2.1%) |
| 5:30 AM to 5:59 AM | 120 (8.2%) | 26 (2.6%) |
| 6:00 AM to 6:29 AM | 161 (11.0%) | 154 (15.2%) |
| 6:30 AM to 6:59 AM | 133 (9.1%) | 131 (13.0%) |
| 7:00 AM to 7:29 AM | 219 (15.0%) | 191 (18.9%) |
| 7:30 AM to 7:59 AM | 176 (12.0%) | 42 (4.2%) |
| 8:00 AM to 8:29 AM | 74 (5.1%) | 116 (11.5%) |
| 8:30 AM to 8:59 AM | 15 (1.0%) | 21 (2.1%) |
| 9:00 AM to 9:59 AM | 0 (0.0%) | 76 (7.5%) |
| 10:00 AM to 10:59 AM | 0 (0.0%) | 13 (1.3%) |
| 11:00 AM to 11:59 AM | 0 (0.0%) | 0 (0.0%) |
| 12:00 PM to 3:59 PM | 125 (8.6%) | 134 (13.3%) |
| 4:00 PM to 11:59 PM | 115 (7.9%) | 54 (5.3%) |
| Total | 1,461 (100.0%) | 1,011 (100.0%) |
Housing Occupancy in Becker
Occupancy by Ownership in Becker
Of the total 1,754 dwellings in Becker, owner-occupied units account for 1,528 (87.1%), while renter-occupied units make up 226 (12.9%).
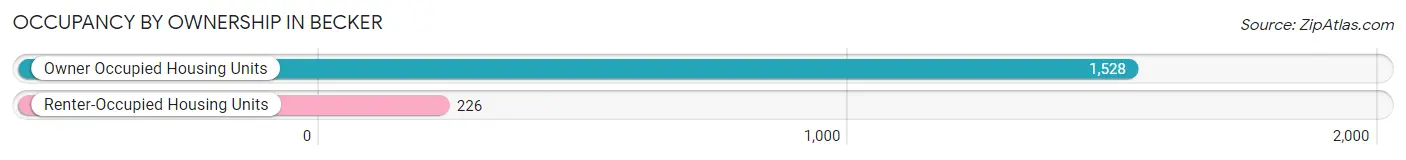
| Occupancy | # Housing Units | % Housing Units |
| Owner Occupied Housing Units | 1,528 | 87.1% |
| Renter-Occupied Housing Units | 226 | 12.9% |
| Total Occupied Housing Units | 1,754 | 100.0% |
Occupancy by Household Size in Becker
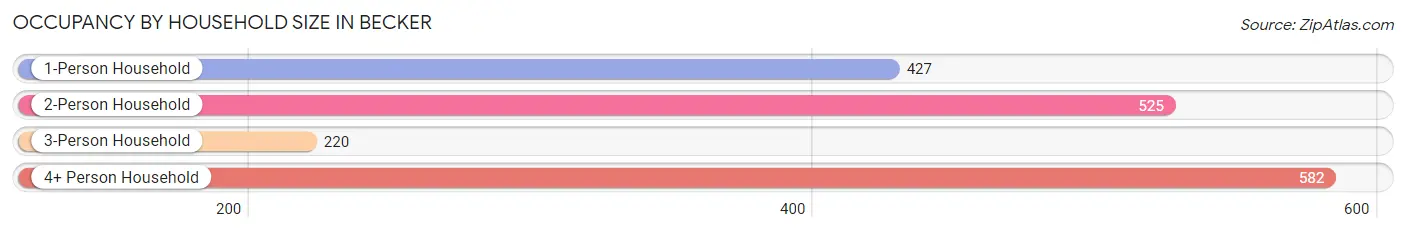
| Household Size | # Housing Units | % Housing Units |
| 1-Person Household | 427 | 24.3% |
| 2-Person Household | 525 | 29.9% |
| 3-Person Household | 220 | 12.5% |
| 4+ Person Household | 582 | 33.2% |
| Total Housing Units | 1,754 | 100.0% |
Occupancy by Ownership by Household Size in Becker
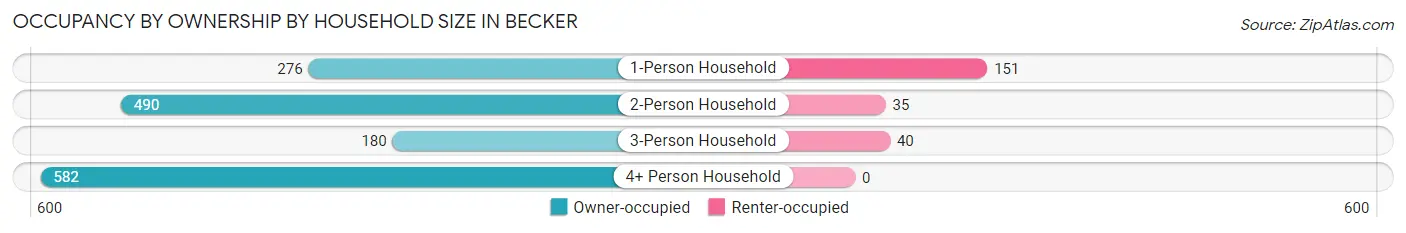
| Household Size | Owner-occupied | Renter-occupied |
| 1-Person Household | 276 (64.6%) | 151 (35.4%) |
| 2-Person Household | 490 (93.3%) | 35 (6.7%) |
| 3-Person Household | 180 (81.8%) | 40 (18.2%) |
| 4+ Person Household | 582 (100.0%) | 0 (0.0%) |
| Total Housing Units | 1,528 (87.1%) | 226 (12.9%) |
Occupancy by Educational Attainment in Becker
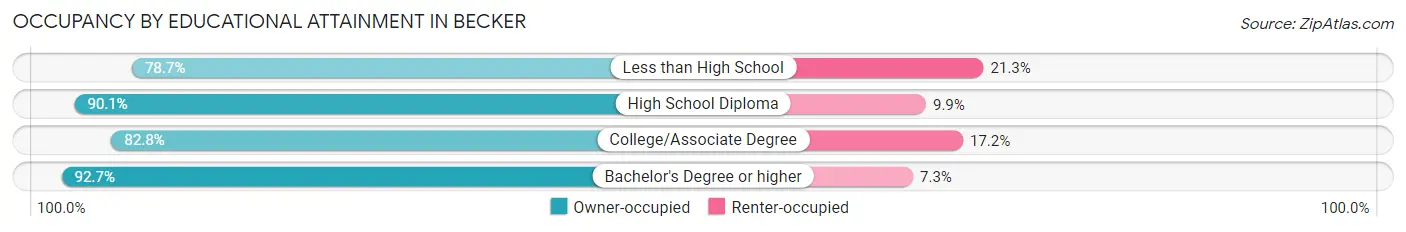
| Household Size | Owner-occupied | Renter-occupied |
| Less than High School | 85 (78.7%) | 23 (21.3%) |
| High School Diploma | 492 (90.1%) | 54 (9.9%) |
| College/Associate Degree | 572 (82.8%) | 119 (17.2%) |
| Bachelor's Degree or higher | 379 (92.7%) | 30 (7.3%) |
Occupancy by Age of Householder in Becker
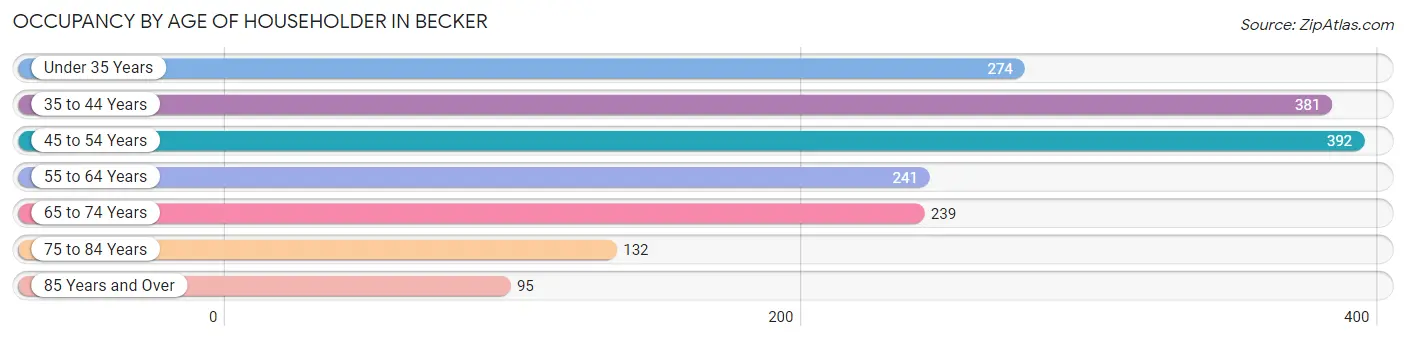
| Age Bracket | # Households | % Households |
| Under 35 Years | 274 | 15.6% |
| 35 to 44 Years | 381 | 21.7% |
| 45 to 54 Years | 392 | 22.4% |
| 55 to 64 Years | 241 | 13.7% |
| 65 to 74 Years | 239 | 13.6% |
| 75 to 84 Years | 132 | 7.5% |
| 85 Years and Over | 95 | 5.4% |
| Total | 1,754 | 100.0% |
Housing Finances in Becker
Median Income by Occupancy in Becker
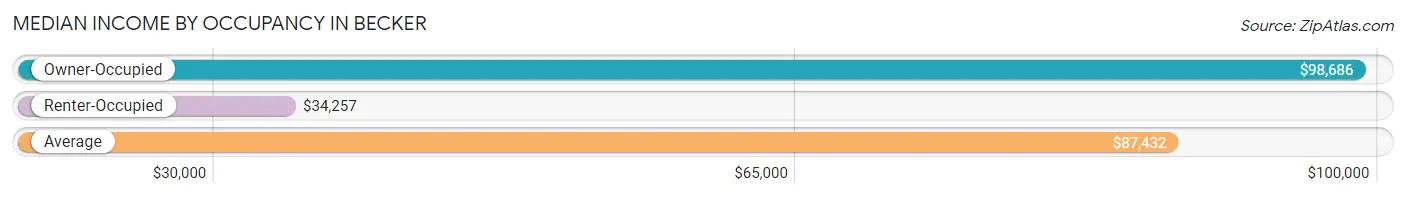
| Occupancy Type | # Households | Median Income |
| Owner-Occupied | 1,528 (87.1%) | $98,686 |
| Renter-Occupied | 226 (12.9%) | $34,257 |
| Average | 1,754 (100.0%) | $87,432 |
Occupancy by Householder Income Bracket in Becker
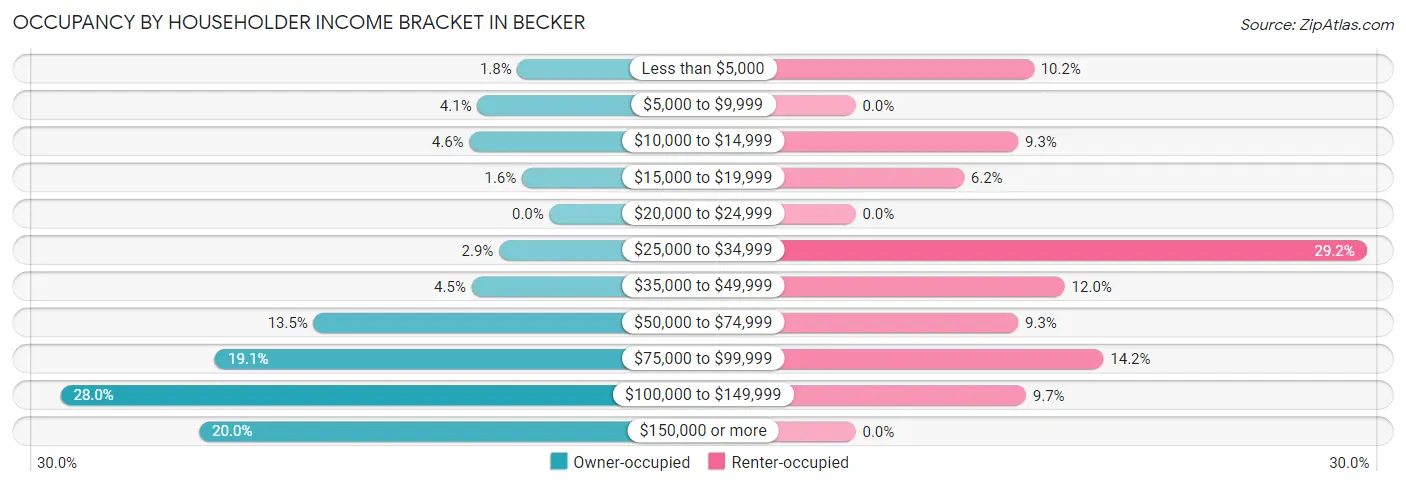
| Income Bracket | Owner-occupied | Renter-occupied |
| Less than $5,000 | 28 (1.8%) | 23 (10.2%) |
| $5,000 to $9,999 | 63 (4.1%) | 0 (0.0%) |
| $10,000 to $14,999 | 70 (4.6%) | 21 (9.3%) |
| $15,000 to $19,999 | 24 (1.6%) | 14 (6.2%) |
| $20,000 to $24,999 | 0 (0.0%) | 0 (0.0%) |
| $25,000 to $34,999 | 44 (2.9%) | 66 (29.2%) |
| $35,000 to $49,999 | 68 (4.4%) | 27 (11.9%) |
| $50,000 to $74,999 | 206 (13.5%) | 21 (9.3%) |
| $75,000 to $99,999 | 292 (19.1%) | 32 (14.2%) |
| $100,000 to $149,999 | 427 (28.0%) | 22 (9.7%) |
| $150,000 or more | 306 (20.0%) | 0 (0.0%) |
| Total | 1,528 (100.0%) | 226 (100.0%) |
Monthly Housing Cost Tiers in Becker
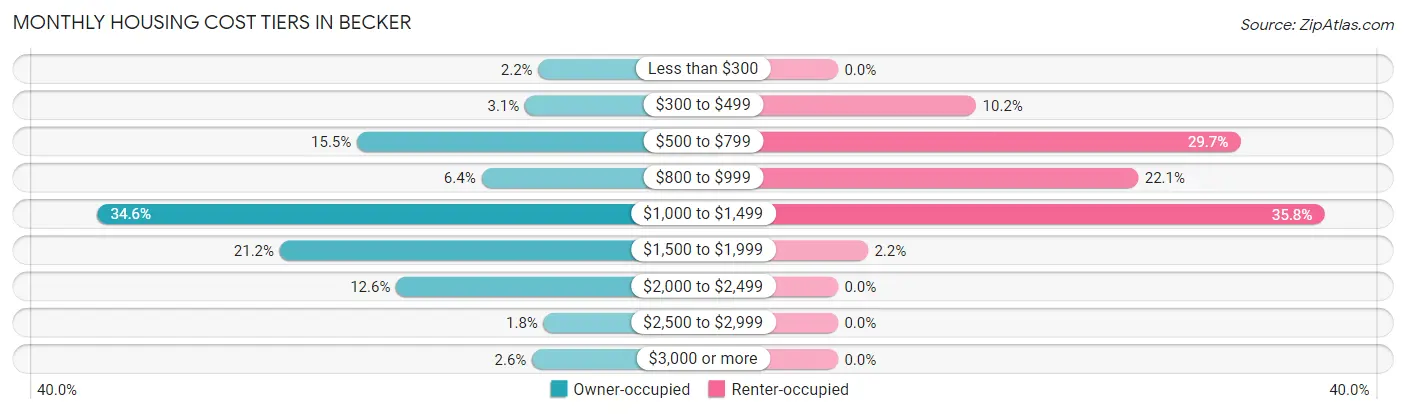
| Monthly Cost | Owner-occupied | Renter-occupied |
| Less than $300 | 33 (2.2%) | 0 (0.0%) |
| $300 to $499 | 48 (3.1%) | 23 (10.2%) |
| $500 to $799 | 237 (15.5%) | 67 (29.6%) |
| $800 to $999 | 97 (6.4%) | 50 (22.1%) |
| $1,000 to $1,499 | 529 (34.6%) | 81 (35.8%) |
| $1,500 to $1,999 | 324 (21.2%) | 5 (2.2%) |
| $2,000 to $2,499 | 193 (12.6%) | 0 (0.0%) |
| $2,500 to $2,999 | 27 (1.8%) | 0 (0.0%) |
| $3,000 or more | 40 (2.6%) | 0 (0.0%) |
| Total | 1,528 (100.0%) | 226 (100.0%) |
Physical Housing Characteristics in Becker
Housing Structures in Becker
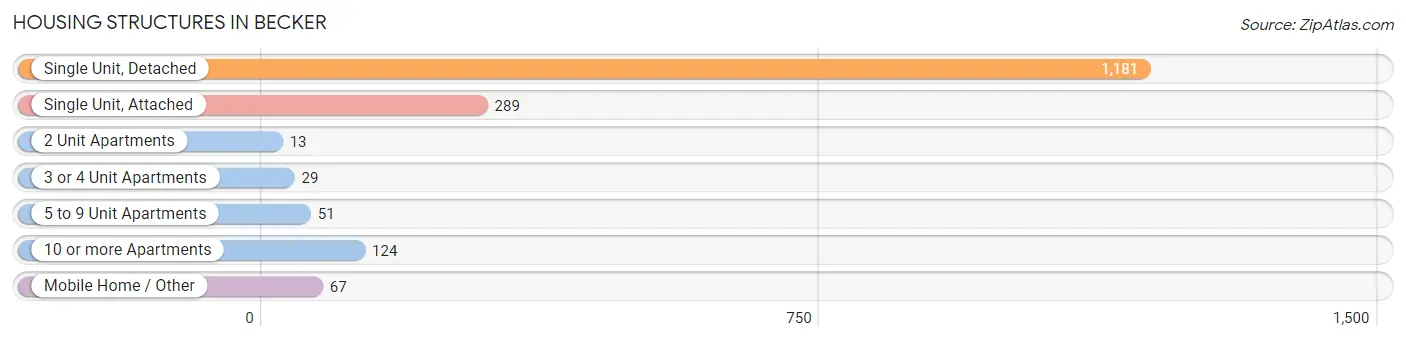
| Structure Type | # Housing Units | % Housing Units |
| Single Unit, Detached | 1,181 | 67.3% |
| Single Unit, Attached | 289 | 16.5% |
| 2 Unit Apartments | 13 | 0.7% |
| 3 or 4 Unit Apartments | 29 | 1.7% |
| 5 to 9 Unit Apartments | 51 | 2.9% |
| 10 or more Apartments | 124 | 7.1% |
| Mobile Home / Other | 67 | 3.8% |
| Total | 1,754 | 100.0% |
Housing Structures by Occupancy in Becker
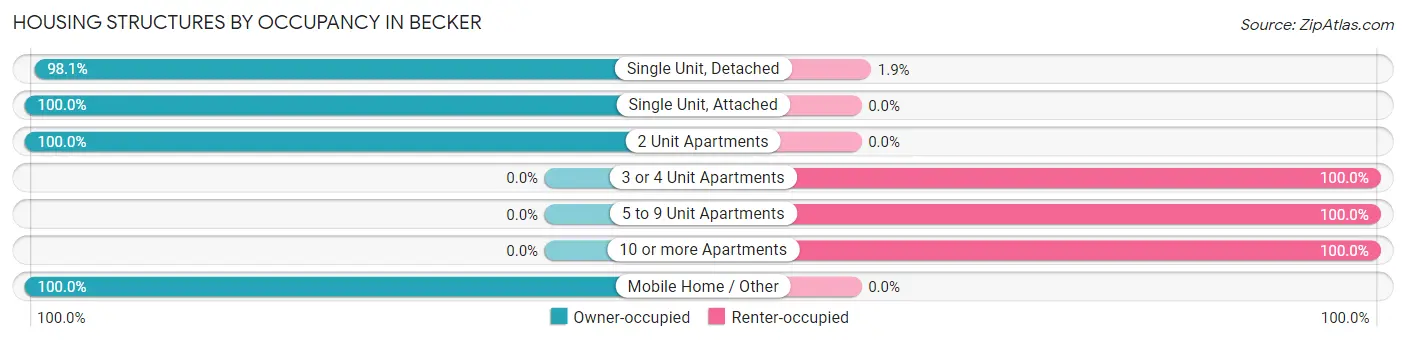
| Structure Type | Owner-occupied | Renter-occupied |
| Single Unit, Detached | 1,159 (98.1%) | 22 (1.9%) |
| Single Unit, Attached | 289 (100.0%) | 0 (0.0%) |
| 2 Unit Apartments | 13 (100.0%) | 0 (0.0%) |
| 3 or 4 Unit Apartments | 0 (0.0%) | 29 (100.0%) |
| 5 to 9 Unit Apartments | 0 (0.0%) | 51 (100.0%) |
| 10 or more Apartments | 0 (0.0%) | 124 (100.0%) |
| Mobile Home / Other | 67 (100.0%) | 0 (0.0%) |
| Total | 1,528 (87.1%) | 226 (12.9%) |
Housing Structures by Number of Rooms in Becker
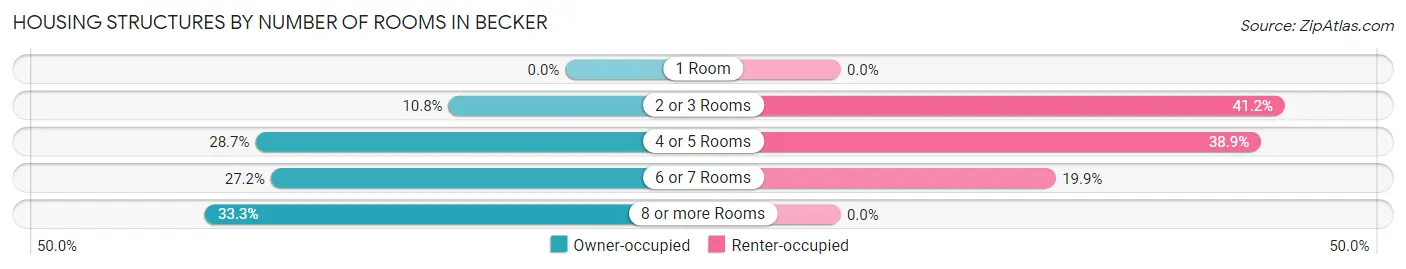
| Number of Rooms | Owner-occupied | Renter-occupied |
| 1 Room | 0 (0.0%) | 0 (0.0%) |
| 2 or 3 Rooms | 165 (10.8%) | 93 (41.1%) |
| 4 or 5 Rooms | 438 (28.7%) | 88 (38.9%) |
| 6 or 7 Rooms | 416 (27.2%) | 45 (19.9%) |
| 8 or more Rooms | 509 (33.3%) | 0 (0.0%) |
| Total | 1,528 (100.0%) | 226 (100.0%) |
Housing Structure by Heating Type in Becker
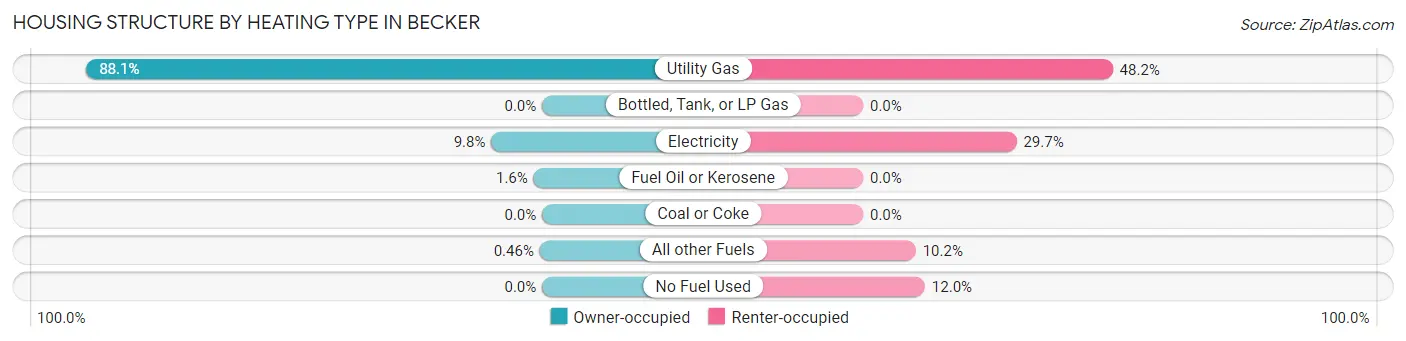
| Heating Type | Owner-occupied | Renter-occupied |
| Utility Gas | 1,346 (88.1%) | 109 (48.2%) |
| Bottled, Tank, or LP Gas | 0 (0.0%) | 0 (0.0%) |
| Electricity | 150 (9.8%) | 67 (29.6%) |
| Fuel Oil or Kerosene | 25 (1.6%) | 0 (0.0%) |
| Coal or Coke | 0 (0.0%) | 0 (0.0%) |
| All other Fuels | 7 (0.5%) | 23 (10.2%) |
| No Fuel Used | 0 (0.0%) | 27 (11.9%) |
| Total | 1,528 (100.0%) | 226 (100.0%) |
Household Vehicle Usage in Becker
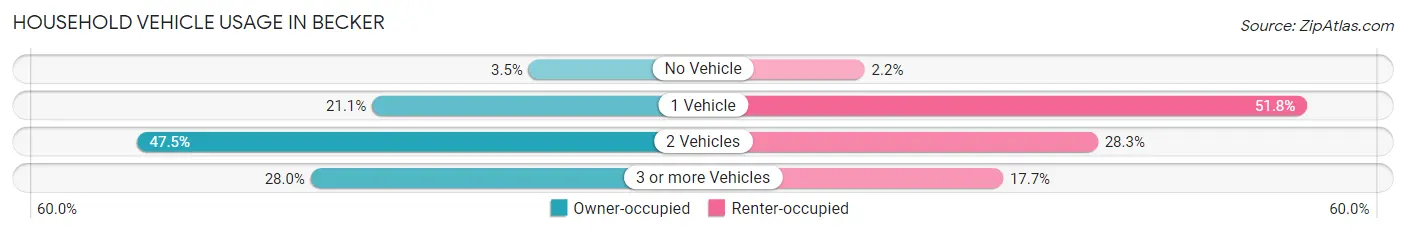
| Vehicles per Household | Owner-occupied | Renter-occupied |
| No Vehicle | 54 (3.5%) | 5 (2.2%) |
| 1 Vehicle | 322 (21.1%) | 117 (51.8%) |
| 2 Vehicles | 725 (47.4%) | 64 (28.3%) |
| 3 or more Vehicles | 427 (28.0%) | 40 (17.7%) |
| Total | 1,528 (100.0%) | 226 (100.0%) |
Real Estate & Mortgages in Becker
Real Estate and Mortgage Overview in Becker
| Characteristic | Without Mortgage | With Mortgage |
| Housing Units | 383 | 1,145 |
| Median Property Value | $224,800 | $238,800 |
| Median Household Income | $71,577 | $280 |
| Monthly Housing Costs | $617 | $40 |
| Real Estate Taxes | $2,404 | $0 |
Property Value by Mortgage Status in Becker
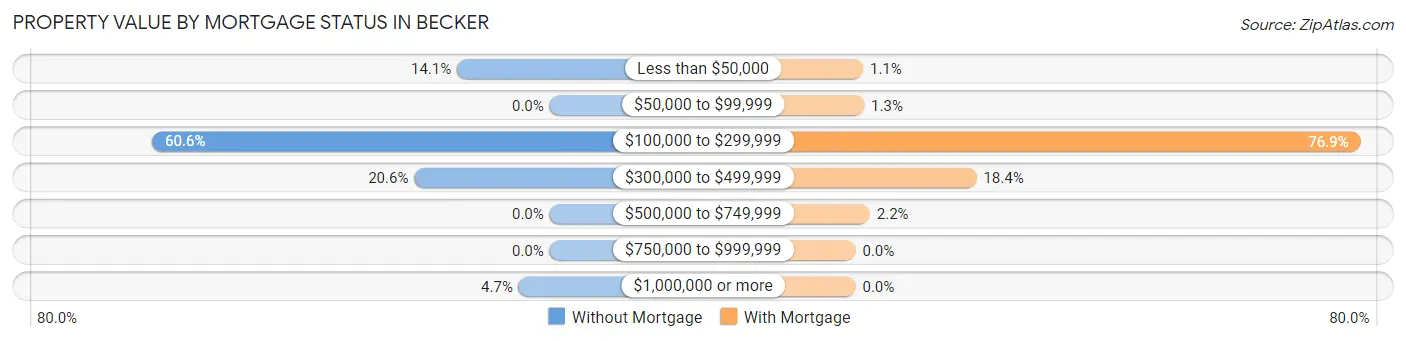
| Property Value | Without Mortgage | With Mortgage |
| Less than $50,000 | 54 (14.1%) | 13 (1.1%) |
| $50,000 to $99,999 | 0 (0.0%) | 15 (1.3%) |
| $100,000 to $299,999 | 232 (60.6%) | 881 (76.9%) |
| $300,000 to $499,999 | 79 (20.6%) | 211 (18.4%) |
| $500,000 to $749,999 | 0 (0.0%) | 25 (2.2%) |
| $750,000 to $999,999 | 0 (0.0%) | 0 (0.0%) |
| $1,000,000 or more | 18 (4.7%) | 0 (0.0%) |
| Total | 383 (100.0%) | 1,145 (100.0%) |
Household Income by Mortgage Status in Becker
| Household Income | Without Mortgage | With Mortgage |
| Less than $10,000 | 74 (19.3%) | 0 (0.0%) |
| $10,000 to $24,999 | 17 (4.4%) | 17 (1.5%) |
| $25,000 to $34,999 | 44 (11.5%) | 77 (6.7%) |
| $35,000 to $49,999 | 30 (7.8%) | 0 (0.0%) |
| $50,000 to $74,999 | 42 (11.0%) | 38 (3.3%) |
| $75,000 to $99,999 | 85 (22.2%) | 164 (14.3%) |
| $100,000 to $149,999 | 65 (17.0%) | 207 (18.1%) |
| $150,000 or more | 26 (6.8%) | 362 (31.6%) |
| Total | 383 (100.0%) | 1,145 (100.0%) |
Property Value to Household Income Ratio in Becker
| Value-to-Income Ratio | Without Mortgage | With Mortgage |
| Less than 2.0x | 113 (29.5%) | 106,932 (9,339.0%) |
| 2.0x to 2.9x | 85 (22.2%) | 514 (44.9%) |
| 3.0x to 3.9x | 34 (8.9%) | 283 (24.7%) |
| 4.0x or more | 141 (36.8%) | 131 (11.4%) |
| Total | 383 (100.0%) | 1,145 (100.0%) |
Real Estate Taxes by Mortgage Status in Becker

| Property Taxes | Without Mortgage | With Mortgage |
| Less than $800 | 54 (14.1%) | 0 (0.0%) |
| $800 to $1,499 | 63 (16.5%) | 13 (1.1%) |
| $800 to $1,499 | 266 (69.5%) | 76 (6.6%) |
| Total | 383 (100.0%) | 1,145 (100.0%) |
Health & Disability in Becker
Health Insurance Coverage by Age in Becker
| Age Bracket | With Coverage | Without Coverage |
| Under 6 Years | 432 (100.0%) | 0 (0.0%) |
| 6 to 18 Years | 1,000 (96.7%) | 34 (3.3%) |
| 19 to 25 Years | 383 (88.4%) | 50 (11.6%) |
| 26 to 34 Years | 645 (100.0%) | 0 (0.0%) |
| 35 to 44 Years | 520 (94.6%) | 30 (5.4%) |
| 45 to 54 Years | 716 (96.1%) | 29 (3.9%) |
| 55 to 64 Years | 418 (92.7%) | 33 (7.3%) |
| 65 to 74 Years | 299 (100.0%) | 0 (0.0%) |
| 75 Years and older | 308 (100.0%) | 0 (0.0%) |
| Total | 4,721 (96.4%) | 176 (3.6%) |
Health Insurance Coverage by Citizenship Status in Becker
| Citizenship Status | With Coverage | Without Coverage |
| Native Born | 432 (100.0%) | 0 (0.0%) |
| Foreign Born, Citizen | 1,000 (96.7%) | 34 (3.3%) |
| Foreign Born, not a Citizen | 383 (88.4%) | 50 (11.6%) |
Health Insurance Coverage by Household Income in Becker
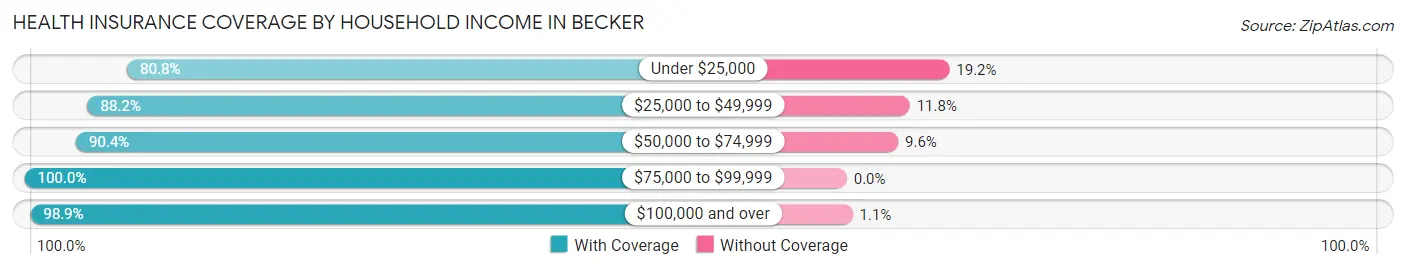
| Household Income | With Coverage | Without Coverage |
| Under $25,000 | 227 (80.8%) | 54 (19.2%) |
| $25,000 to $49,999 | 217 (88.2%) | 29 (11.8%) |
| $50,000 to $74,999 | 601 (90.4%) | 64 (9.6%) |
| $75,000 to $99,999 | 1,014 (100.0%) | 0 (0.0%) |
| $100,000 and over | 2,662 (98.9%) | 29 (1.1%) |
Public vs Private Health Insurance Coverage by Age in Becker
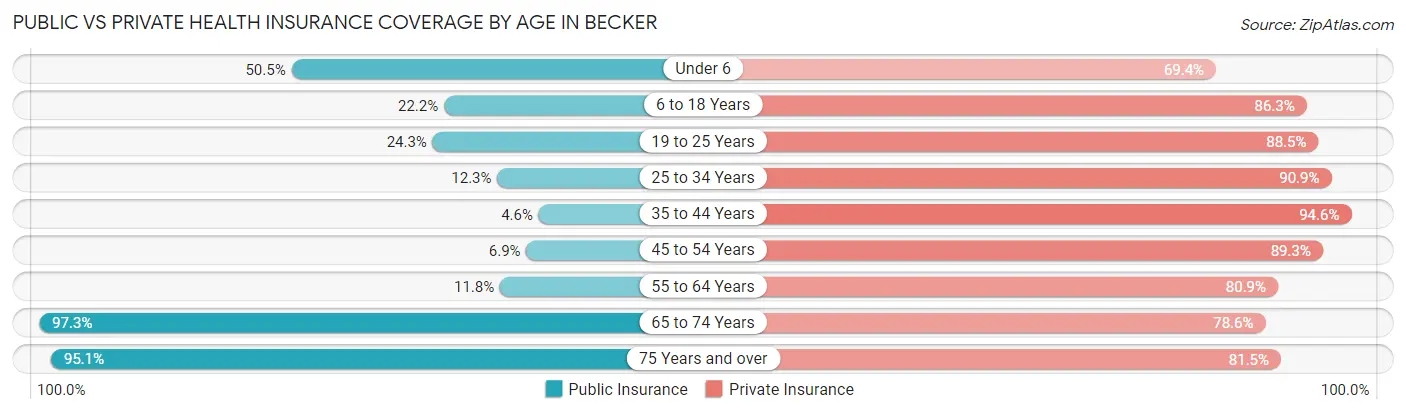
| Age Bracket | Public Insurance | Private Insurance |
| Under 6 | 218 (50.5%) | 300 (69.4%) |
| 6 to 18 Years | 229 (22.2%) | 892 (86.3%) |
| 19 to 25 Years | 105 (24.2%) | 383 (88.4%) |
| 25 to 34 Years | 79 (12.2%) | 586 (90.8%) |
| 35 to 44 Years | 25 (4.5%) | 520 (94.6%) |
| 45 to 54 Years | 51 (6.9%) | 665 (89.3%) |
| 55 to 64 Years | 53 (11.7%) | 365 (80.9%) |
| 65 to 74 Years | 291 (97.3%) | 235 (78.6%) |
| 75 Years and over | 293 (95.1%) | 251 (81.5%) |
| Total | 1,344 (27.5%) | 4,197 (85.7%) |
Disability Status by Sex by Age in Becker
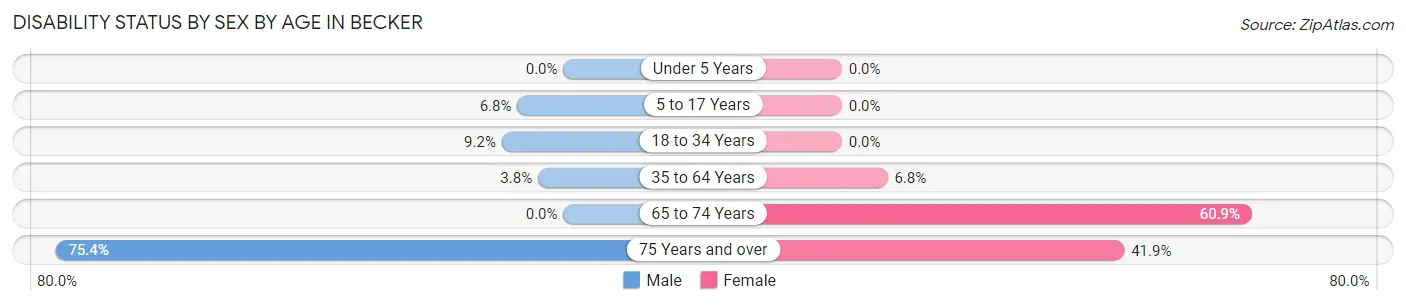
| Age Bracket | Male | Female |
| Under 5 Years | 0 (0.0%) | 0 (0.0%) |
| 5 to 17 Years | 32 (6.8%) | 0 (0.0%) |
| 18 to 34 Years | 68 (9.1%) | 0 (0.0%) |
| 35 to 64 Years | 33 (3.8%) | 59 (6.8%) |
| 65 to 74 Years | 0 (0.0%) | 123 (60.9%) |
| 75 Years and over | 92 (75.4%) | 78 (41.9%) |
Disability Class by Sex by Age in Becker
Disability Class: Hearing Difficulty
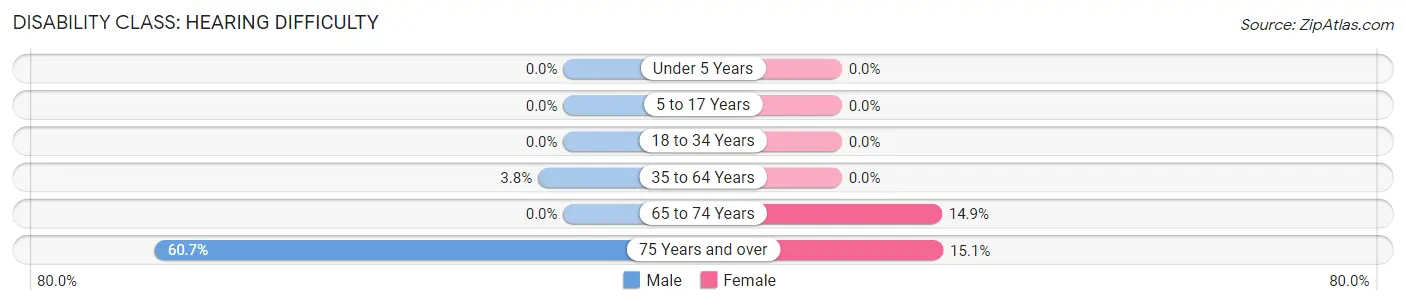
| Age Bracket | Male | Female |
| Under 5 Years | 0 (0.0%) | 0 (0.0%) |
| 5 to 17 Years | 0 (0.0%) | 0 (0.0%) |
| 18 to 34 Years | 0 (0.0%) | 0 (0.0%) |
| 35 to 64 Years | 33 (3.8%) | 0 (0.0%) |
| 65 to 74 Years | 0 (0.0%) | 30 (14.8%) |
| 75 Years and over | 74 (60.7%) | 28 (15.0%) |
Disability Class: Vision Difficulty
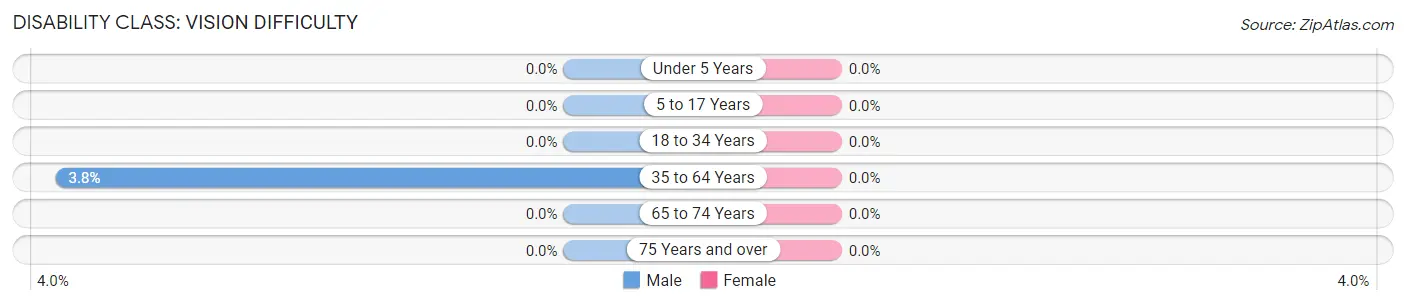
| Age Bracket | Male | Female |
| Under 5 Years | 0 (0.0%) | 0 (0.0%) |
| 5 to 17 Years | 0 (0.0%) | 0 (0.0%) |
| 18 to 34 Years | 0 (0.0%) | 0 (0.0%) |
| 35 to 64 Years | 33 (3.8%) | 0 (0.0%) |
| 65 to 74 Years | 0 (0.0%) | 0 (0.0%) |
| 75 Years and over | 0 (0.0%) | 0 (0.0%) |
Disability Class: Cognitive Difficulty
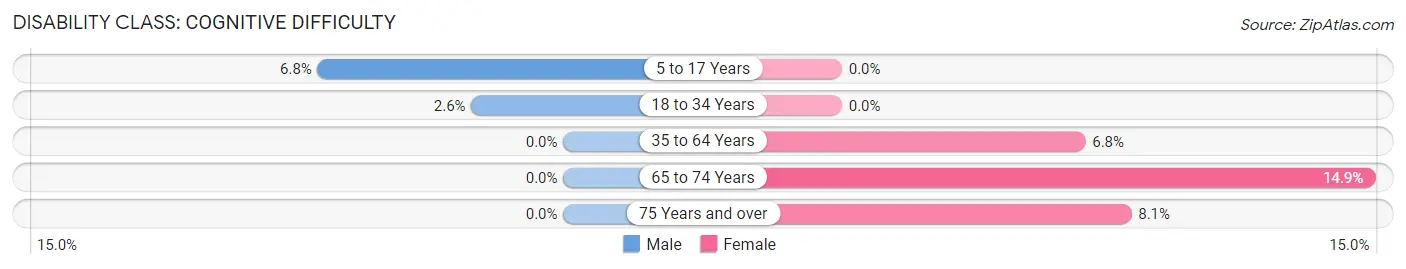
| Age Bracket | Male | Female |
| 5 to 17 Years | 32 (6.8%) | 0 (0.0%) |
| 18 to 34 Years | 19 (2.6%) | 0 (0.0%) |
| 35 to 64 Years | 0 (0.0%) | 59 (6.8%) |
| 65 to 74 Years | 0 (0.0%) | 30 (14.8%) |
| 75 Years and over | 0 (0.0%) | 15 (8.1%) |
Disability Class: Ambulatory Difficulty
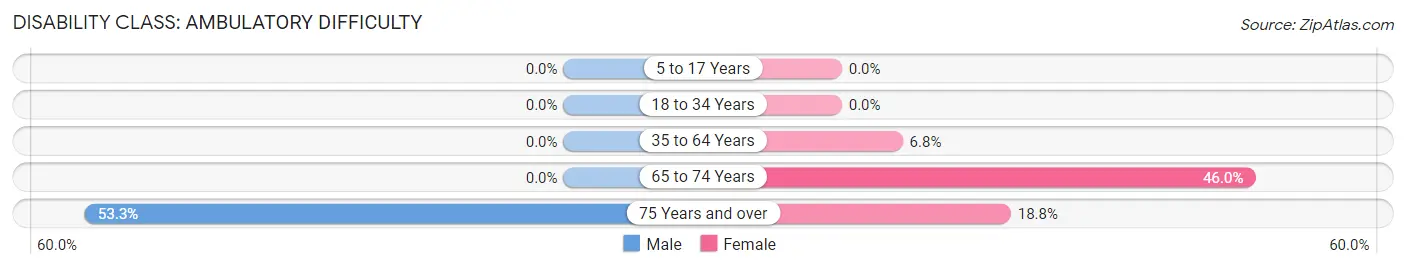
| Age Bracket | Male | Female |
| 5 to 17 Years | 0 (0.0%) | 0 (0.0%) |
| 18 to 34 Years | 0 (0.0%) | 0 (0.0%) |
| 35 to 64 Years | 0 (0.0%) | 59 (6.8%) |
| 65 to 74 Years | 0 (0.0%) | 93 (46.0%) |
| 75 Years and over | 65 (53.3%) | 35 (18.8%) |
Disability Class: Self-Care Difficulty
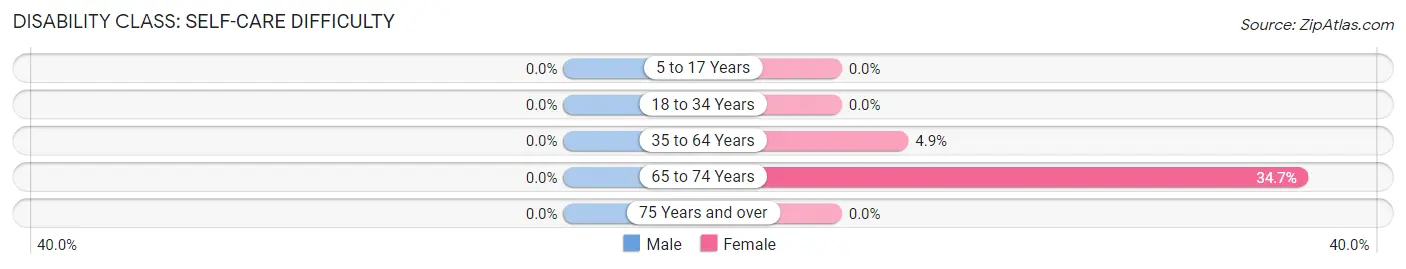
| Age Bracket | Male | Female |
| 5 to 17 Years | 0 (0.0%) | 0 (0.0%) |
| 18 to 34 Years | 0 (0.0%) | 0 (0.0%) |
| 35 to 64 Years | 0 (0.0%) | 43 (4.9%) |
| 65 to 74 Years | 0 (0.0%) | 70 (34.6%) |
| 75 Years and over | 0 (0.0%) | 0 (0.0%) |
Technology Access in Becker
Computing Device Access in Becker

| Device Type | # Households | % Households |
| Desktop or Laptop | 1,496 | 85.3% |
| Smartphone | 1,398 | 79.7% |
| Tablet | 1,181 | 67.3% |
| No Computing Device | 64 | 3.6% |
| Total | 1,754 | 100.0% |
Internet Access in Becker
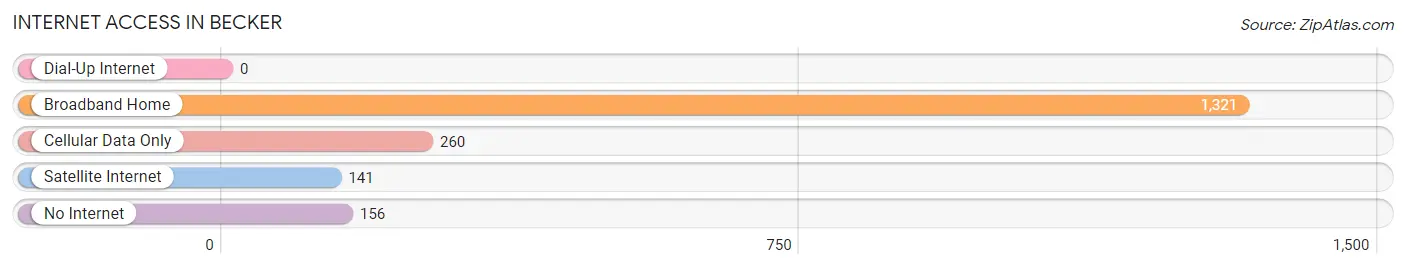
| Internet Type | # Households | % Households |
| Dial-Up Internet | 0 | 0.0% |
| Broadband Home | 1,321 | 75.3% |
| Cellular Data Only | 260 | 14.8% |
| Satellite Internet | 141 | 8.0% |
| No Internet | 156 | 8.9% |
| Total | 1,754 | 100.0% |
Becker Summary
Becker, Minnesota is a small city located in Sherburne County, Minnesota. It is situated on the banks of the Mississippi River, approximately 25 miles northwest of Minneapolis. The city has a population of approximately 4,500 people and is part of the larger St. Cloud Metropolitan Statistical Area.
History
Becker was founded in 1856 by German immigrants who were looking for a place to settle and farm. The city was named after a local settler, John Becker, who was the first to settle in the area. The city was incorporated in 1887 and has since grown to become a thriving community.
Geography
Becker is located in the central part of Minnesota, approximately 25 miles northwest of Minneapolis. The city is situated on the banks of the Mississippi River and is surrounded by rolling hills and farmland. The city has a total area of 4.2 square miles, all of which is land.
Economy
Becker’s economy is largely based on agriculture and manufacturing. The city is home to several large companies, including the Becker Manufacturing Company, which produces agricultural equipment, and the Becker Dairy, which produces dairy products. The city also has a thriving retail sector, with several stores and restaurants located in the downtown area.
Demographics
As of the 2010 census, Becker had a population of 4,500 people. The racial makeup of the city was 95.2% White, 0.7% African American, 0.3% Native American, 0.7% Asian, 0.1% Pacific Islander, 1.2% from other races, and 1.7% from two or more races. Hispanic or Latino of any race were 3.2% of the population.
The median income for a household in Becker was $50,000, and the median income for a family was $56,000. The per capita income for the city was $21,000. About 8.2% of families and 10.2% of the population were below the poverty line, including 14.2% of those under age 18 and 6.2% of those age 65 or over.
Becker is a small city with a rich history and a vibrant economy. It is home to a diverse population and offers a variety of activities and attractions for residents and visitors alike. With its close proximity to Minneapolis, Becker is an ideal place to live and work.
Common Questions
What is Per Capita Income in Becker?
Per Capita income in Becker is $35,900.
What is the Median Family Income in Becker?
Median Family Income in Becker is $106,429.
What is the Median Household income in Becker?
Median Household Income in Becker is $87,432.
What is Income or Wage Gap in Becker?
Income or Wage Gap in Becker is 18.1%.
Women in Becker earn 81.9 cents for every dollar earned by a man.
What is Inequality or Gini Index in Becker?
Inequality or Gini Index in Becker is 0.36.
What is the Total Population of Becker?
Total Population of Becker is 4,897.
What is the Total Male Population of Becker?
Total Male Population of Becker is 2,558.
What is the Total Female Population of Becker?
Total Female Population of Becker is 2,339.
What is the Ratio of Males per 100 Females in Becker?
There are 109.36 Males per 100 Females in Becker.
What is the Ratio of Females per 100 Males in Becker?
There are 91.44 Females per 100 Males in Becker.
What is the Median Population Age in Becker?
Median Population Age in Becker is 33.3 Years.
What is the Average Family Size in Becker
Average Family Size in Becker is 3.4 People.
What is the Average Household Size in Becker
Average Household Size in Becker is 2.8 People.
How Large is the Labor Force in Becker?
There are 2,742 People in the Labor Forcein in Becker.
What is the Percentage of People in the Labor Force in Becker?
74.8% of People are in the Labor Force in Becker.
What is the Unemployment Rate in Becker?
Unemployment Rate in Becker is 0.6%.