Rockville, MN Map & Demographics
Rockville Map
Rockville Overview
$44,072
PER CAPITA INCOME
$107,885
AVG FAMILY INCOME
$86,641
AVG HOUSEHOLD INCOME
35.2%
WAGE / INCOME GAP [ % ]
64.8¢/ $1
WAGE / INCOME GAP [ $ ]
0.39
INEQUALITY / GINI INDEX
2,271
TOTAL POPULATION
1,172
MALE POPULATION
1,099
FEMALE POPULATION
106.64
MALES / 100 FEMALES
93.77
FEMALES / 100 MALES
44.7
MEDIAN AGE
2.9
AVG FAMILY SIZE
2.5
AVG HOUSEHOLD SIZE
1,214
LABOR FORCE [ PEOPLE ]
66.9%
PERCENT IN LABOR FORCE
1.1%
UNEMPLOYMENT RATE
Rockville Zip Codes
Rockville Area Codes
Income in Rockville
Income Overview in Rockville
Per Capita Income in Rockville is $44,072, while median incomes of families and households are $107,885 and $86,641 respectively.
| Characteristic | Number | Measure |
| Per Capita Income | 2,271 | $44,072 |
| Median Family Income | 680 | $107,885 |
| Mean Family Income | 680 | $125,734 |
| Median Household Income | 921 | $86,641 |
| Mean Household Income | 921 | $108,637 |
| Income Deficit | 680 | $0 |
| Wage / Income Gap (%) | 2,271 | 35.25% |
| Wage / Income Gap ($) | 2,271 | 64.75¢ per $1 |
| Gini / Inequality Index | 2,271 | 0.39 |
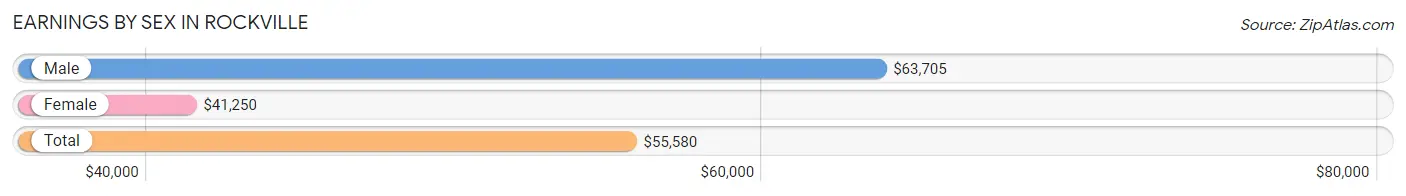
Earnings by Sex in Rockville
Average Earnings in Rockville are $55,580, $63,705 for men and $41,250 for women, a difference of 35.2%.
| Sex | Number | Average Earnings |
| Male | 697 (53.7%) | $63,705 |
| Female | 600 (46.3%) | $41,250 |
| Total | 1,297 (100.0%) | $55,580 |
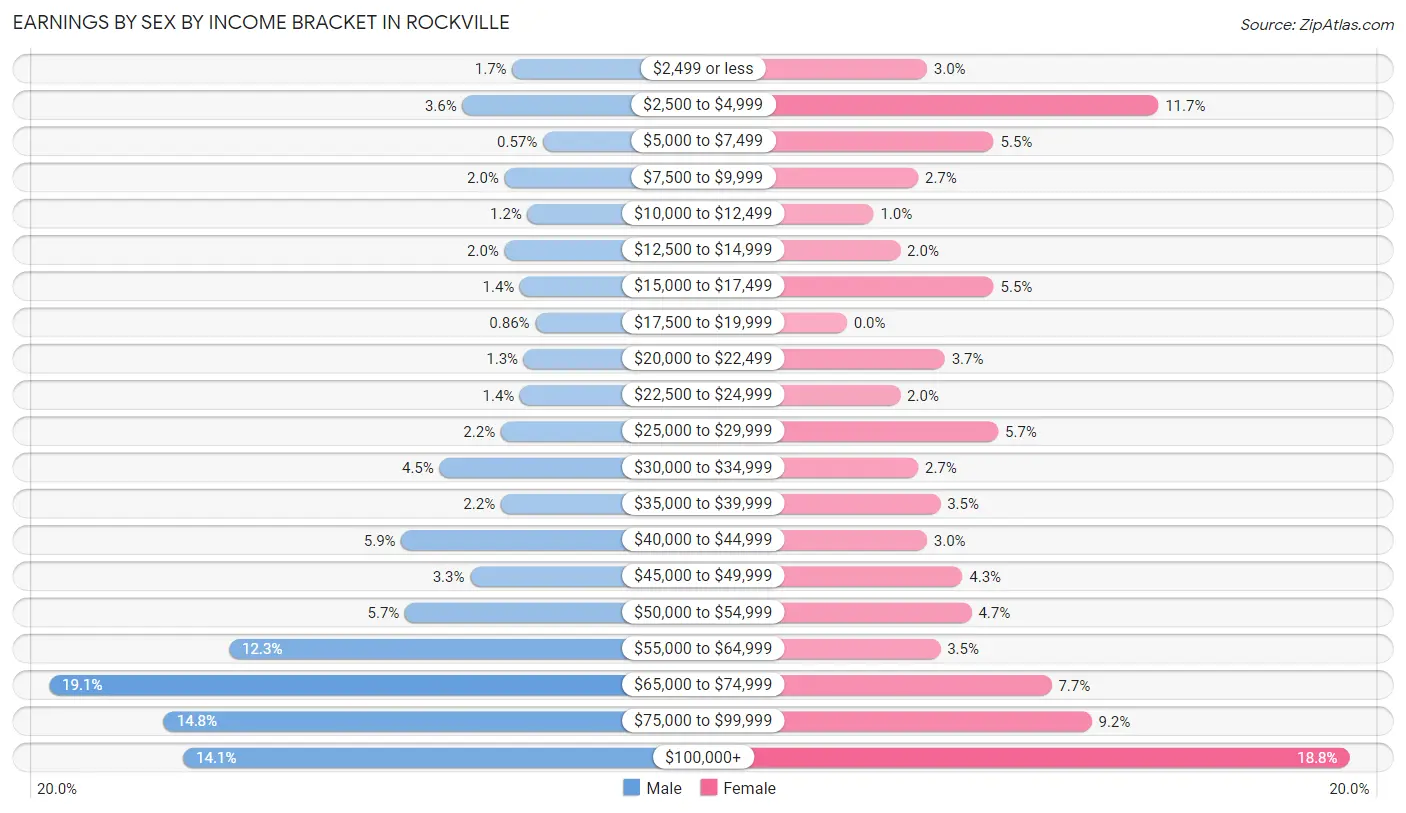
Earnings by Sex by Income Bracket in Rockville
The most common earnings brackets in Rockville are $65,000 to $74,999 for men (133 | 19.1%) and $100,000+ for women (113 | 18.8%).
| Income | Male | Female |
| $2,499 or less | 12 (1.7%) | 18 (3.0%) |
| $2,500 to $4,999 | 25 (3.6%) | 70 (11.7%) |
| $5,000 to $7,499 | 4 (0.6%) | 33 (5.5%) |
| $7,500 to $9,999 | 14 (2.0%) | 16 (2.7%) |
| $10,000 to $12,499 | 8 (1.1%) | 6 (1.0%) |
| $12,500 to $14,999 | 14 (2.0%) | 12 (2.0%) |
| $15,000 to $17,499 | 10 (1.4%) | 33 (5.5%) |
| $17,500 to $19,999 | 6 (0.9%) | 0 (0.0%) |
| $20,000 to $22,499 | 9 (1.3%) | 22 (3.7%) |
| $22,500 to $24,999 | 10 (1.4%) | 12 (2.0%) |
| $25,000 to $29,999 | 15 (2.1%) | 34 (5.7%) |
| $30,000 to $34,999 | 31 (4.4%) | 16 (2.7%) |
| $35,000 to $39,999 | 15 (2.1%) | 21 (3.5%) |
| $40,000 to $44,999 | 41 (5.9%) | 18 (3.0%) |
| $45,000 to $49,999 | 23 (3.3%) | 26 (4.3%) |
| $50,000 to $54,999 | 40 (5.7%) | 28 (4.7%) |
| $55,000 to $64,999 | 86 (12.3%) | 21 (3.5%) |
| $65,000 to $74,999 | 133 (19.1%) | 46 (7.7%) |
| $75,000 to $99,999 | 103 (14.8%) | 55 (9.2%) |
| $100,000+ | 98 (14.1%) | 113 (18.8%) |
| Total | 697 (100.0%) | 600 (100.0%) |
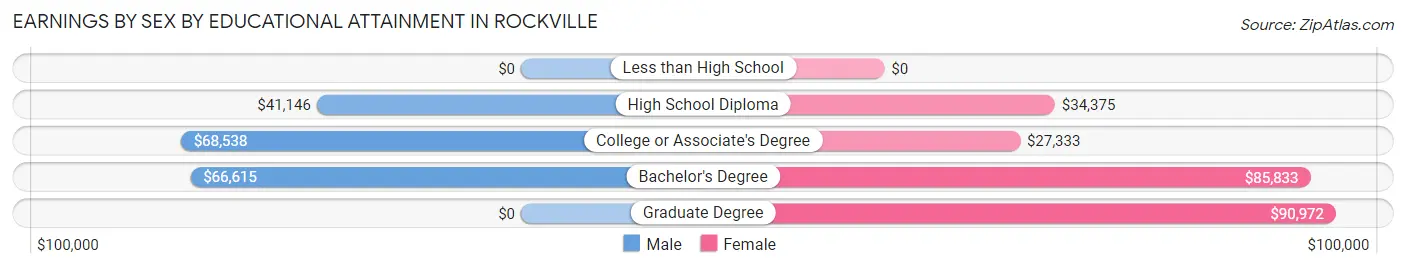
Earnings by Sex by Educational Attainment in Rockville
Average earnings in Rockville are $65,282 for men and $50,978 for women, a difference of 21.9%. Men with an educational attainment of college or associate's degree enjoy the highest average annual earnings of $68,538, while those with high school diploma education earn the least with $41,146. Women with an educational attainment of graduate degree earn the most with the average annual earnings of $90,972, while those with college or associate's degree education have the smallest earnings of $27,333.
| Educational Attainment | Male Income | Female Income |
| Less than High School | - | - |
| High School Diploma | $41,146 | $34,375 |
| College or Associate's Degree | $68,538 | $27,333 |
| Bachelor's Degree | $66,615 | $85,833 |
| Graduate Degree | - | - |
| Total | $65,282 | $50,978 |
Family Income in Rockville
Family Income Brackets in Rockville
According to the Rockville family income data, there are 164 families falling into the $100,000 to $149,999 income range, which is the most common income bracket and makes up 24.1% of all families.
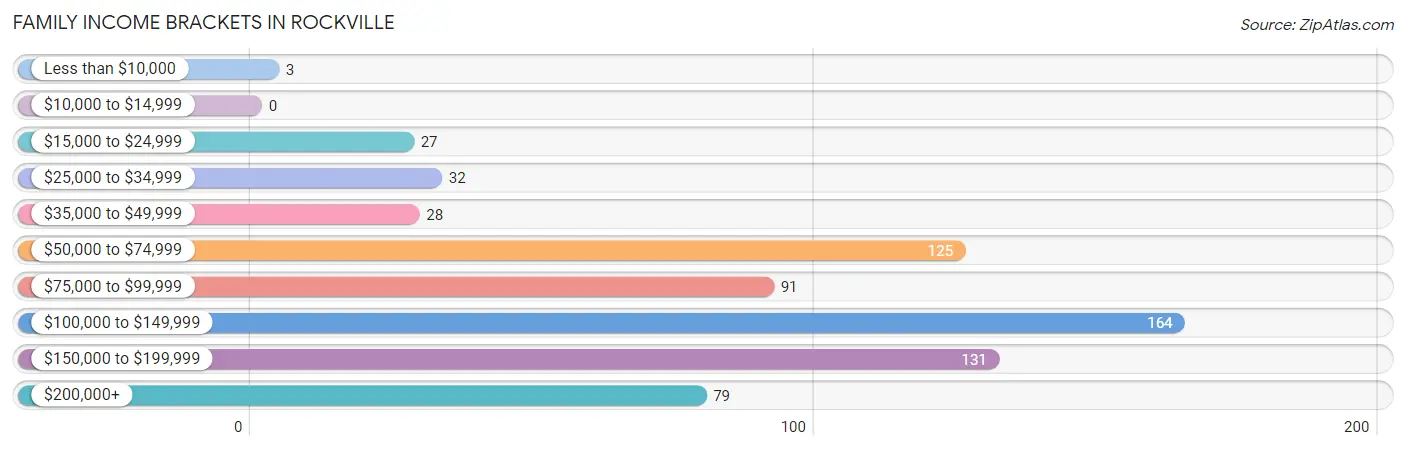
| Income Bracket | # Families | % Families |
| Less than $10,000 | 3 | 0.4% |
| $10,000 to $14,999 | 0 | 0.0% |
| $15,000 to $24,999 | 27 | 4.0% |
| $25,000 to $34,999 | 32 | 4.7% |
| $35,000 to $49,999 | 28 | 4.1% |
| $50,000 to $74,999 | 125 | 18.4% |
| $75,000 to $99,999 | 91 | 13.4% |
| $100,000 to $149,999 | 164 | 24.1% |
| $150,000 to $199,999 | 131 | 19.3% |
| $200,000+ | 79 | 11.6% |
Family Income by Famaliy Size in Rockville
6-person families (36 | 5.3%) account for the highest median family income in Rockville with $162,857 per family, while 2-person families (419 | 61.6%) have the highest median income of $50,312 per family member.
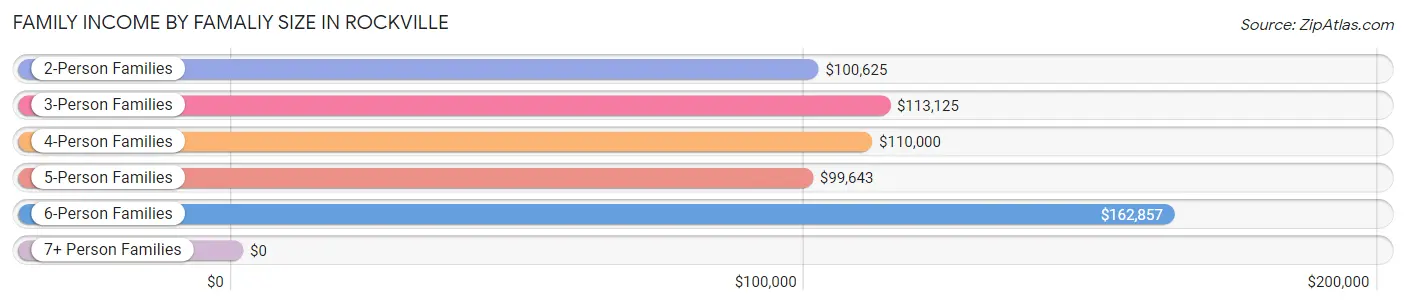
| Income Bracket | # Families | Median Income |
| 2-Person Families | 419 (61.6%) | $100,625 |
| 3-Person Families | 115 (16.9%) | $113,125 |
| 4-Person Families | 68 (10.0%) | $110,000 |
| 5-Person Families | 40 (5.9%) | $99,643 |
| 6-Person Families | 36 (5.3%) | $162,857 |
| 7+ Person Families | 2 (0.3%) | $0 |
| Total | 680 (100.0%) | $107,885 |
Family Income by Number of Earners in Rockville
The median family income in Rockville is $107,885, with families comprising 3+ earners (51) having the highest median family income of $228,194, while families with no earners (126) have the lowest median family income of $54,875, accounting for 7.5% and 18.5% of families, respectively.
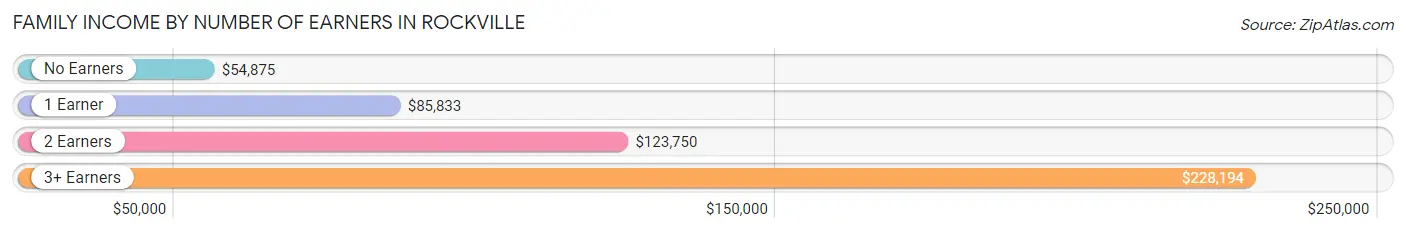
| Number of Earners | # Families | Median Income |
| No Earners | 126 (18.5%) | $54,875 |
| 1 Earner | 122 (17.9%) | $85,833 |
| 2 Earners | 381 (56.0%) | $123,750 |
| 3+ Earners | 51 (7.5%) | $228,194 |
| Total | 680 (100.0%) | $107,885 |
Household Income in Rockville
Household Income Brackets in Rockville
With 233 households falling in the category, the $50,000 to $74,999 income range is the most frequent in Rockville, accounting for 25.3% of all households. In contrast, only 21 households (2.3%) fall into the less than $10,000 income bracket, making it the least populous group.
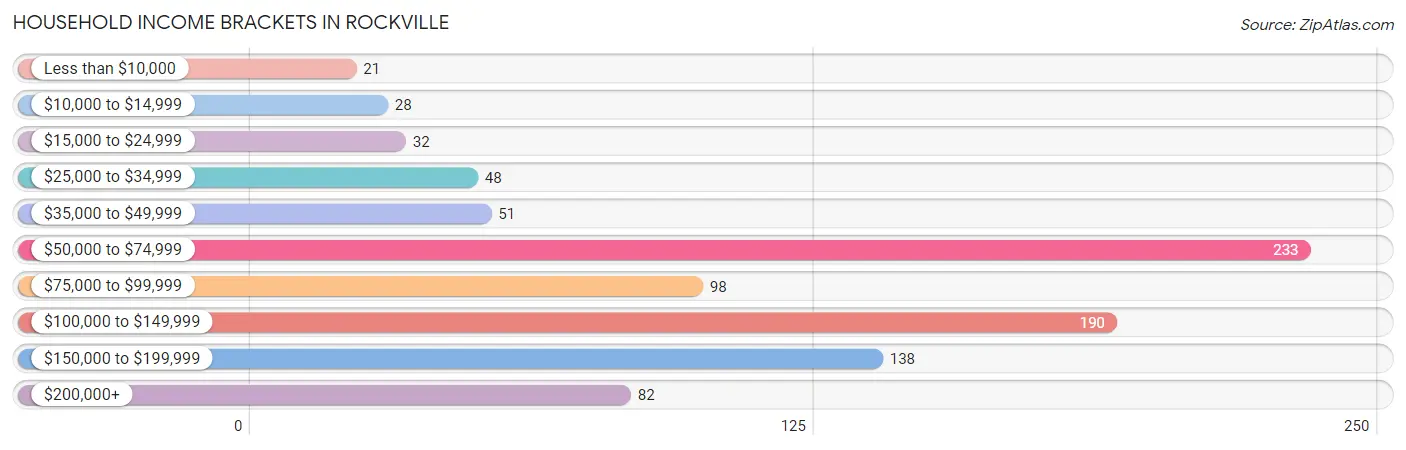
| Income Bracket | # Households | % Households |
| Less than $10,000 | 21 | 2.3% |
| $10,000 to $14,999 | 28 | 3.0% |
| $15,000 to $24,999 | 32 | 3.5% |
| $25,000 to $34,999 | 48 | 5.2% |
| $35,000 to $49,999 | 51 | 5.5% |
| $50,000 to $74,999 | 233 | 25.3% |
| $75,000 to $99,999 | 98 | 10.6% |
| $100,000 to $149,999 | 190 | 20.6% |
| $150,000 to $199,999 | 138 | 15.0% |
| $200,000+ | 82 | 8.9% |
Household Income by Householder Age in Rockville
The median household income in Rockville is $86,641, with the highest median household income of $112,708 found in the 45 to 64 years age bracket for the primary householder. A total of 357 households (38.8%) fall into this category. Meanwhile, the 15 to 24 years age bracket for the primary householder has the lowest median household income of $0, with 10 households (1.1%) in this group.
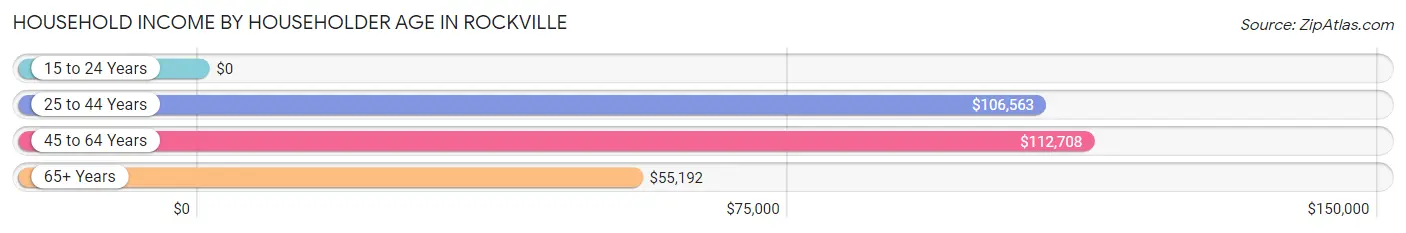
| Income Bracket | # Households | Median Income |
| 15 to 24 Years | 10 (1.1%) | $0 |
| 25 to 44 Years | 278 (30.2%) | $106,563 |
| 45 to 64 Years | 357 (38.8%) | $112,708 |
| 65+ Years | 276 (30.0%) | $55,192 |
| Total | 921 (100.0%) | $86,641 |
Poverty in Rockville
Income Below Poverty by Sex and Age in Rockville
With 5.7% poverty level for males and 4.0% for females among the residents of Rockville, 65 to 74 year old males and 25 to 34 year old females are the most vulnerable to poverty, with 31 males (20.7%) and 11 females (8.8%) in their respective age groups living below the poverty level.
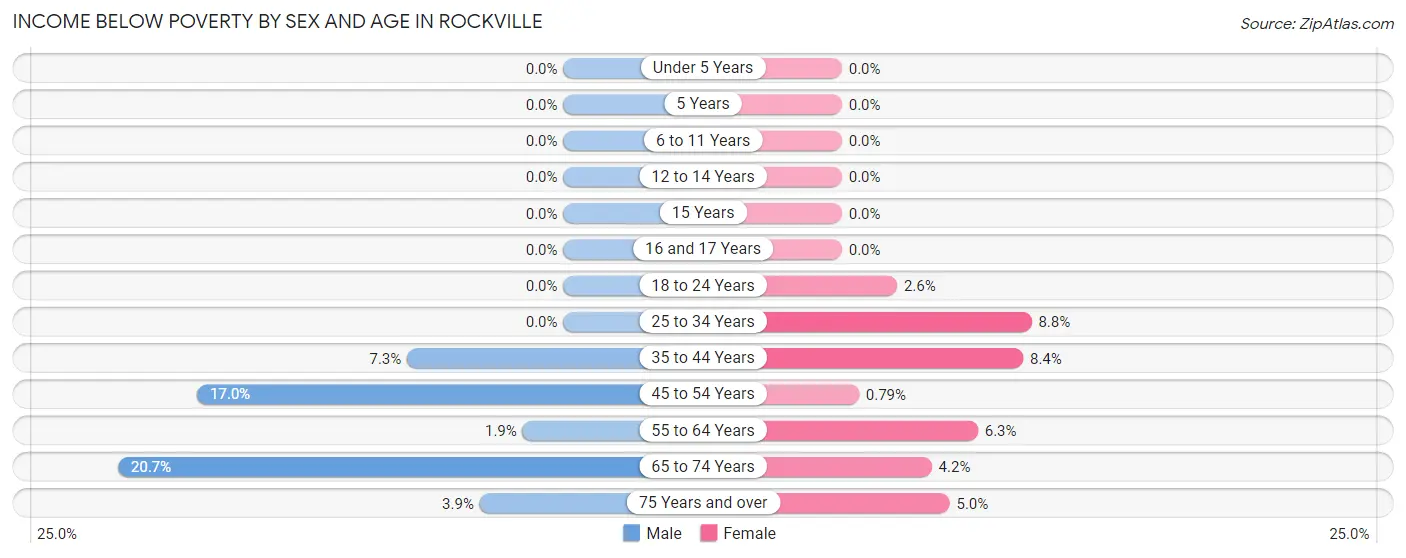
| Age Bracket | Male | Female |
| Under 5 Years | 0 (0.0%) | 0 (0.0%) |
| 5 Years | 0 (0.0%) | 0 (0.0%) |
| 6 to 11 Years | 0 (0.0%) | 0 (0.0%) |
| 12 to 14 Years | 0 (0.0%) | 0 (0.0%) |
| 15 Years | 0 (0.0%) | 0 (0.0%) |
| 16 and 17 Years | 0 (0.0%) | 0 (0.0%) |
| 18 to 24 Years | 0 (0.0%) | 2 (2.6%) |
| 25 to 34 Years | 0 (0.0%) | 11 (8.8%) |
| 35 to 44 Years | 10 (7.2%) | 9 (8.4%) |
| 45 to 54 Years | 17 (17.0%) | 1 (0.8%) |
| 55 to 64 Years | 5 (1.9%) | 13 (6.3%) |
| 65 to 74 Years | 31 (20.7%) | 4 (4.2%) |
| 75 Years and over | 4 (3.9%) | 4 (5.0%) |
| Total | 67 (5.7%) | 44 (4.0%) |
Income Above Poverty by Sex and Age in Rockville
According to the poverty statistics in Rockville, males aged under 5 years and females aged under 5 years are the age groups that are most secure financially, with 100.0% of males and 100.0% of females in these age groups living above the poverty line.
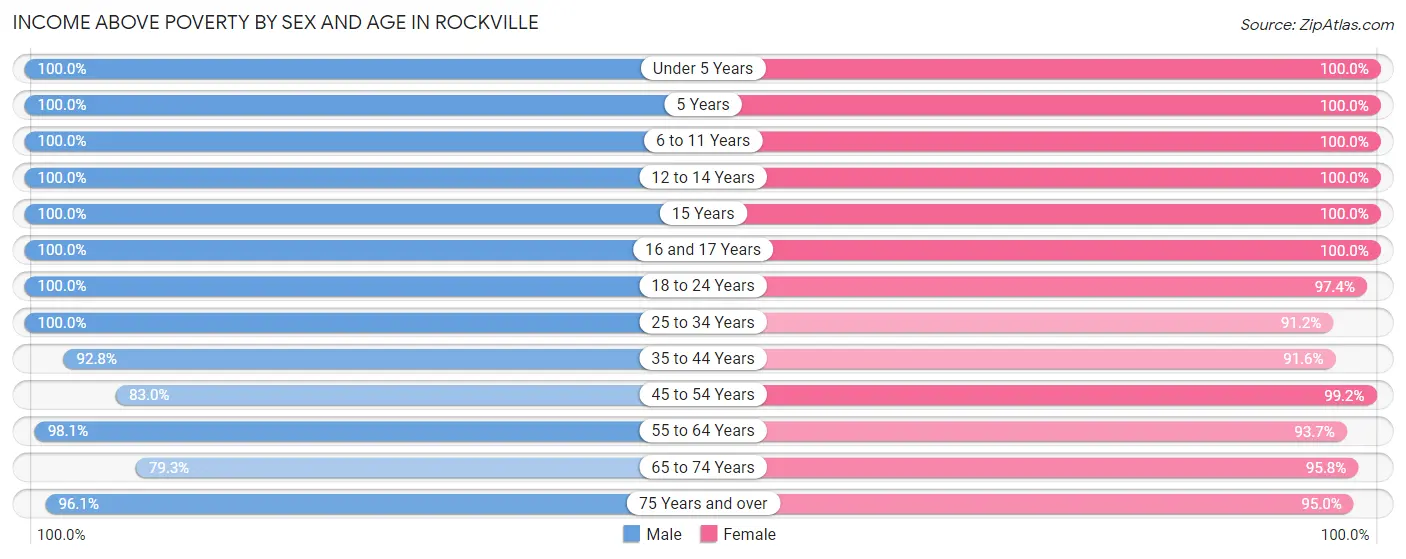
| Age Bracket | Male | Female |
| Under 5 Years | 59 (100.0%) | 115 (100.0%) |
| 5 Years | 4 (100.0%) | 7 (100.0%) |
| 6 to 11 Years | 96 (100.0%) | 61 (100.0%) |
| 12 to 14 Years | 49 (100.0%) | 49 (100.0%) |
| 15 Years | 8 (100.0%) | 8 (100.0%) |
| 16 and 17 Years | 26 (100.0%) | 41 (100.0%) |
| 18 to 24 Years | 31 (100.0%) | 76 (97.4%) |
| 25 to 34 Years | 144 (100.0%) | 114 (91.2%) |
| 35 to 44 Years | 128 (92.7%) | 98 (91.6%) |
| 45 to 54 Years | 83 (83.0%) | 125 (99.2%) |
| 55 to 64 Years | 259 (98.1%) | 193 (93.7%) |
| 65 to 74 Years | 119 (79.3%) | 92 (95.8%) |
| 75 Years and over | 99 (96.1%) | 76 (95.0%) |
| Total | 1,105 (94.3%) | 1,055 (96.0%) |
Income Below Poverty Among Married-Couple Families in Rockville
The poverty statistics for married-couple families in Rockville show that 2.4% or 15 of the total 621 families live below the poverty line. Families with no children have the highest poverty rate of 3.5%, comprising of 15 families. On the other hand, families with 1 or 2 children have the lowest poverty rate of 0.0%, which includes 0 families.
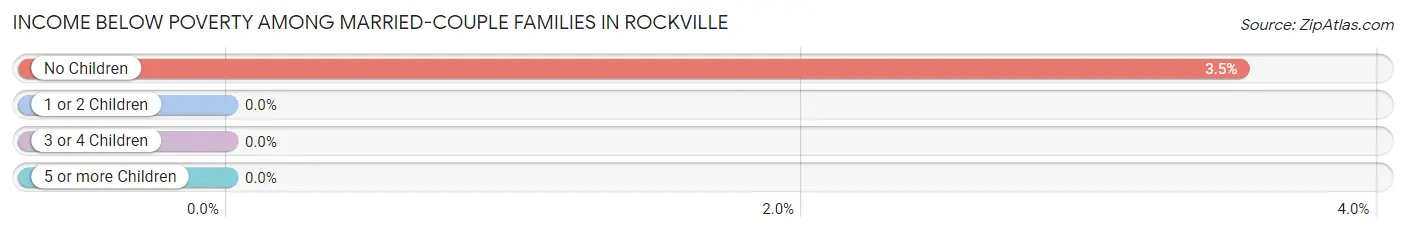
| Children | Above Poverty | Below Poverty |
| No Children | 411 (96.5%) | 15 (3.5%) |
| 1 or 2 Children | 121 (100.0%) | 0 (0.0%) |
| 3 or 4 Children | 72 (100.0%) | 0 (0.0%) |
| 5 or more Children | 2 (100.0%) | 0 (0.0%) |
| Total | 606 (97.6%) | 15 (2.4%) |
Income Below Poverty Among Single-Parent Households in Rockville
| Children | Single Father | Single Mother |
| No Children | 0 (0.0%) | 0 (0.0%) |
| 1 or 2 Children | 0 (0.0%) | 0 (0.0%) |
| 3 or 4 Children | 0 (0.0%) | 0 (0.0%) |
| 5 or more Children | 0 (0.0%) | 0 (0.0%) |
| Total | 0 (0.0%) | 0 (0.0%) |
Income Below Poverty Among Married-Couple vs Single-Parent Households in Rockville
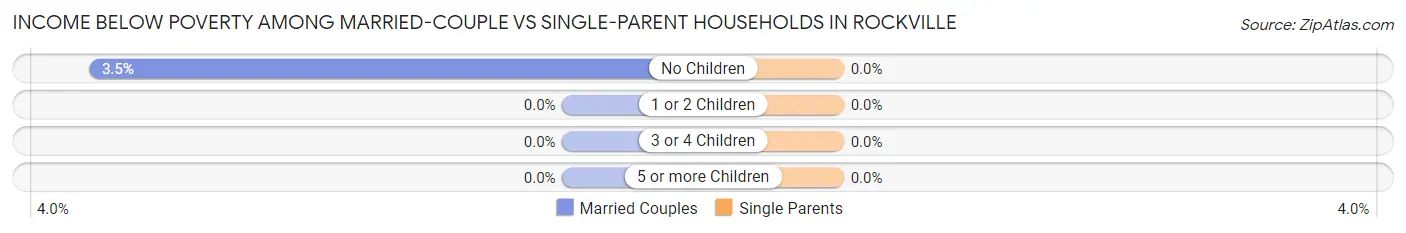
| Children | Married-Couple Families | Single-Parent Households |
| No Children | 15 (3.5%) | 0 (0.0%) |
| 1 or 2 Children | 0 (0.0%) | 0 (0.0%) |
| 3 or 4 Children | 0 (0.0%) | 0 (0.0%) |
| 5 or more Children | 0 (0.0%) | 0 (0.0%) |
| Total | 15 (2.4%) | 0 (0.0%) |
Race in Rockville
The most populous races in Rockville are White / Caucasian (2,192 | 96.5%), Hispanic or Latino (67 | 2.9%), and Some other Race (50 | 2.2%).
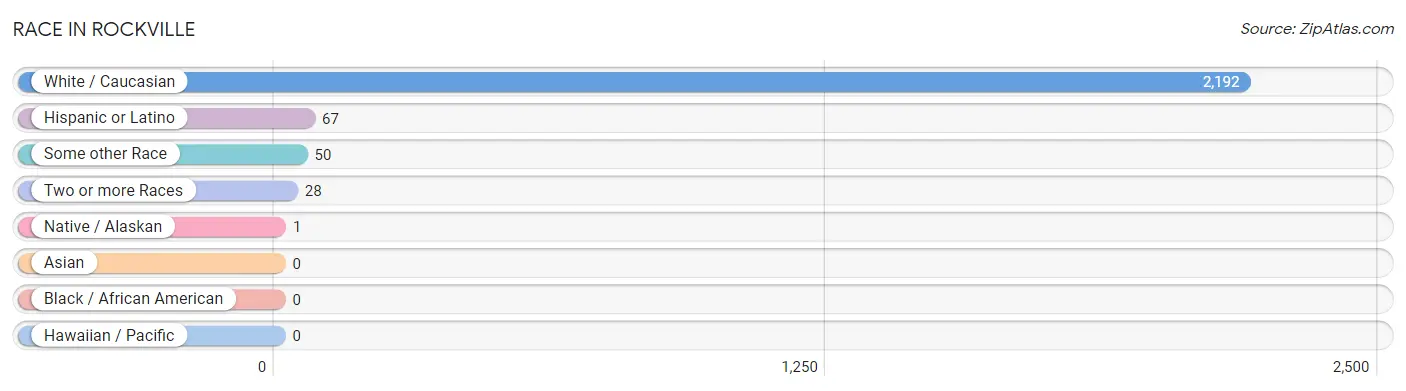
| Race | # Population | % Population |
| Asian | 0 | 0.0% |
| Black / African American | 0 | 0.0% |
| Hawaiian / Pacific | 0 | 0.0% |
| Hispanic or Latino | 67 | 2.9% |
| Native / Alaskan | 1 | 0.0% |
| White / Caucasian | 2,192 | 96.5% |
| Two or more Races | 28 | 1.2% |
| Some other Race | 50 | 2.2% |
| Total | 2,271 | 100.0% |
Ancestry in Rockville
The most populous ancestries reported in Rockville are German (1,135 | 50.0%), American (195 | 8.6%), Swedish (174 | 7.7%), Norwegian (137 | 6.0%), and Irish (129 | 5.7%), together accounting for 77.9% of all Rockville residents.
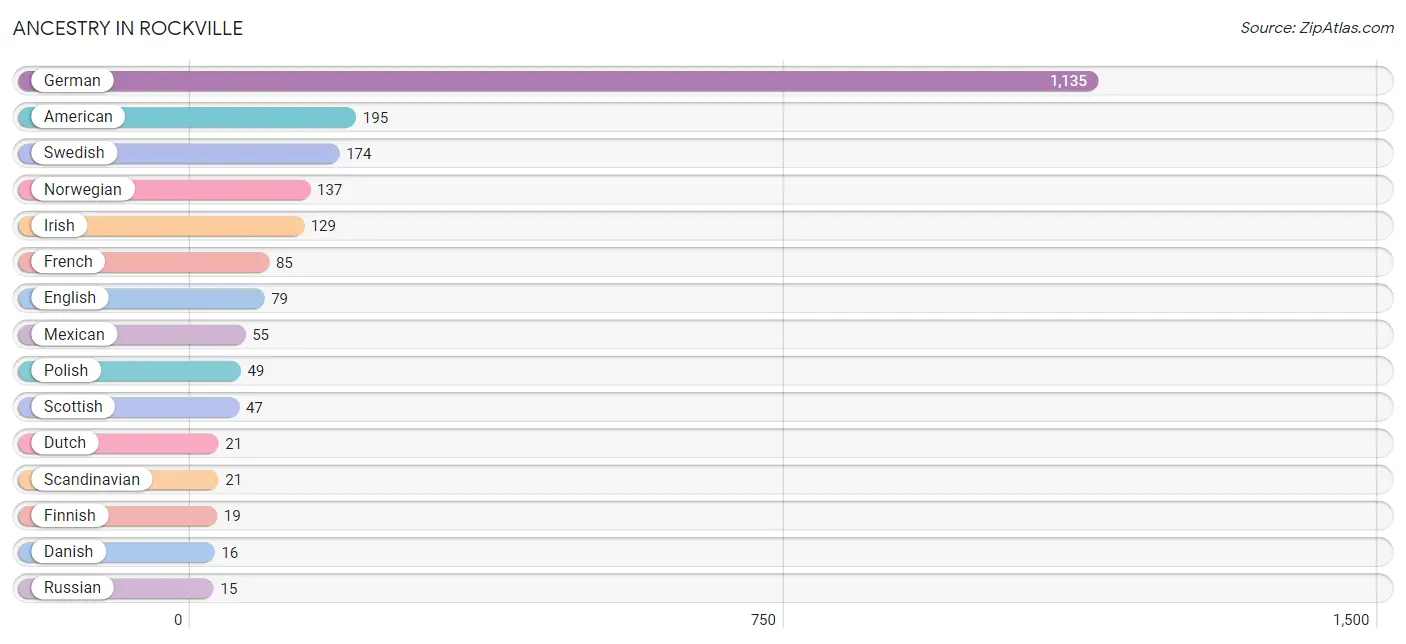
| Ancestry | # Population | % Population |
| American | 195 | 8.6% |
| Austrian | 4 | 0.2% |
| Bolivian | 6 | 0.3% |
| Central American | 6 | 0.3% |
| Cherokee | 7 | 0.3% |
| Chippewa | 1 | 0.0% |
| Danish | 16 | 0.7% |
| Dutch | 21 | 0.9% |
| English | 79 | 3.5% |
| Finnish | 19 | 0.8% |
| French | 85 | 3.7% |
| French Canadian | 5 | 0.2% |
| German | 1,135 | 50.0% |
| Irish | 129 | 5.7% |
| Italian | 13 | 0.6% |
| Mexican | 55 | 2.4% |
| Nicaraguan | 6 | 0.3% |
| Norwegian | 137 | 6.0% |
| Polish | 49 | 2.2% |
| Russian | 15 | 0.7% |
| Scandinavian | 21 | 0.9% |
| Scotch-Irish | 4 | 0.2% |
| Scottish | 47 | 2.1% |
| Slovak | 4 | 0.2% |
| Slovene | 7 | 0.3% |
| South American | 6 | 0.3% |
| Swedish | 174 | 7.7% | View All 27 Rows |
Immigrants in Rockville
The most numerous immigrant groups reported in Rockville came from Latin America (42 | 1.8%), Central America (36 | 1.6%), Mexico (36 | 1.6%), Europe (13 | 0.6%), and Southern Europe (13 | 0.6%), together accounting for 6.2% of all Rockville residents.
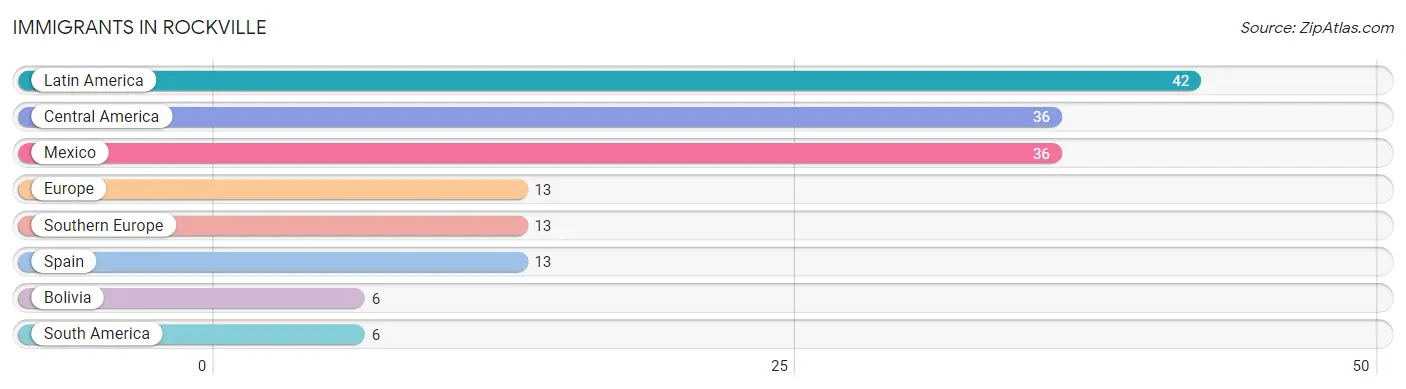
| Immigration Origin | # Population | % Population |
| Bolivia | 6 | 0.3% |
| Central America | 36 | 1.6% |
| Europe | 13 | 0.6% |
| Latin America | 42 | 1.8% |
| Mexico | 36 | 1.6% |
| South America | 6 | 0.3% |
| Southern Europe | 13 | 0.6% |
| Spain | 13 | 0.6% | View All 8 Rows |
Sex and Age in Rockville
Sex and Age in Rockville
The most populous age groups in Rockville are 60 to 64 Years (150 | 12.8%) for men and Under 5 Years (115 | 10.5%) for women.
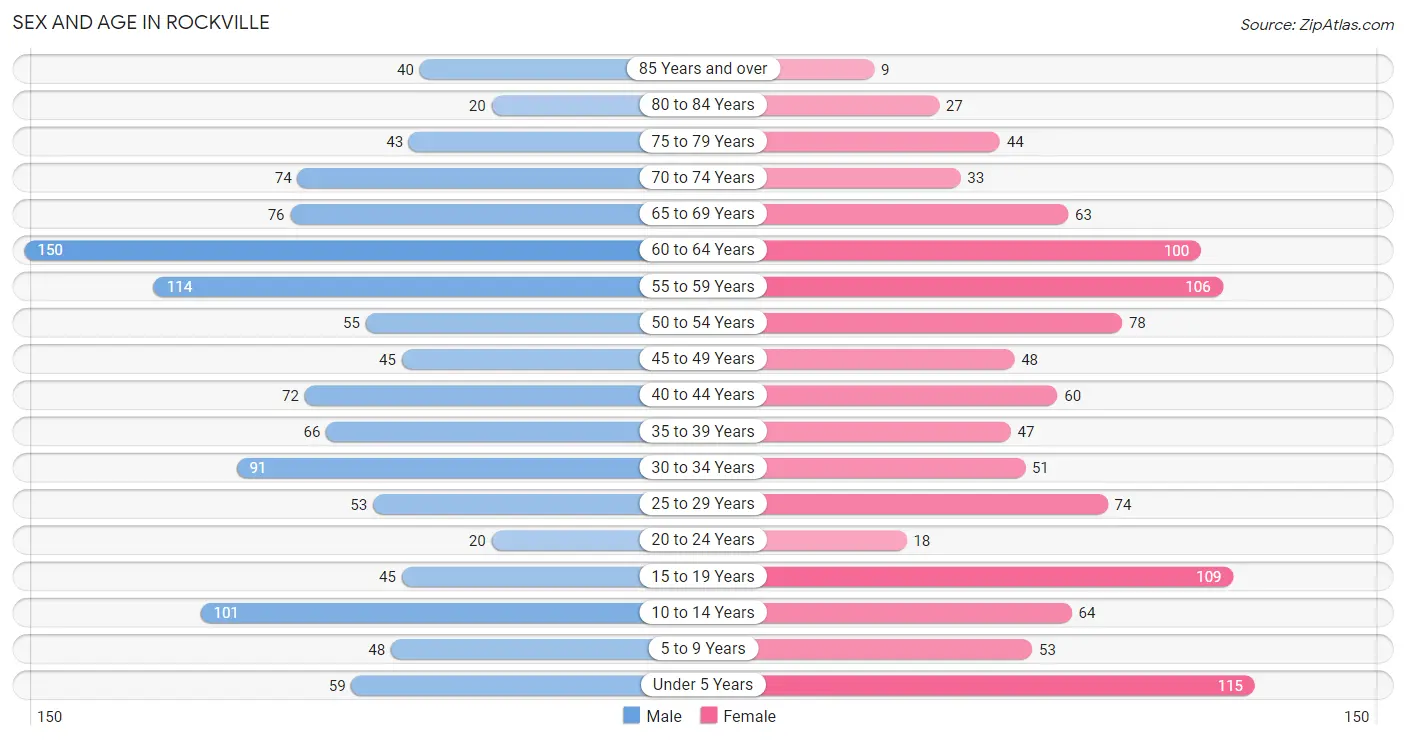
| Age Bracket | Male | Female |
| Under 5 Years | 59 (5.0%) | 115 (10.5%) |
| 5 to 9 Years | 48 (4.1%) | 53 (4.8%) |
| 10 to 14 Years | 101 (8.6%) | 64 (5.8%) |
| 15 to 19 Years | 45 (3.8%) | 109 (9.9%) |
| 20 to 24 Years | 20 (1.7%) | 18 (1.6%) |
| 25 to 29 Years | 53 (4.5%) | 74 (6.7%) |
| 30 to 34 Years | 91 (7.8%) | 51 (4.6%) |
| 35 to 39 Years | 66 (5.6%) | 47 (4.3%) |
| 40 to 44 Years | 72 (6.1%) | 60 (5.5%) |
| 45 to 49 Years | 45 (3.8%) | 48 (4.4%) |
| 50 to 54 Years | 55 (4.7%) | 78 (7.1%) |
| 55 to 59 Years | 114 (9.7%) | 106 (9.7%) |
| 60 to 64 Years | 150 (12.8%) | 100 (9.1%) |
| 65 to 69 Years | 76 (6.5%) | 63 (5.7%) |
| 70 to 74 Years | 74 (6.3%) | 33 (3.0%) |
| 75 to 79 Years | 43 (3.7%) | 44 (4.0%) |
| 80 to 84 Years | 20 (1.7%) | 27 (2.5%) |
| 85 Years and over | 40 (3.4%) | 9 (0.8%) |
| Total | 1,172 (100.0%) | 1,099 (100.0%) |
Families and Households in Rockville
Median Family Size in Rockville
The median family size in Rockville is 2.87 persons per family, with married-couple families (621 | 91.3%) accounting for the largest median family size of 2.92 persons per family. On the other hand, single female/mother families (35 | 5.1%) represent the smallest median family size with 2.31 persons per family.
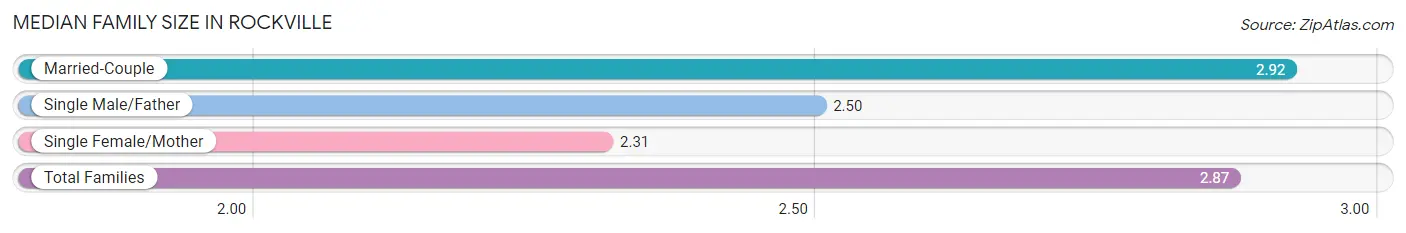
| Family Type | # Families | Family Size |
| Married-Couple | 621 (91.3%) | 2.92 |
| Single Male/Father | 24 (3.5%) | 2.50 |
| Single Female/Mother | 35 (5.1%) | 2.31 |
| Total Families | 680 (100.0%) | 2.87 |
Median Household Size in Rockville
The median household size in Rockville is 2.47 persons per household, with single male/father households (24 | 2.6%) accounting for the largest median household size of 3.25 persons per household. non-family households (241 | 26.2%) represent the smallest median household size with 1.20 persons per household.
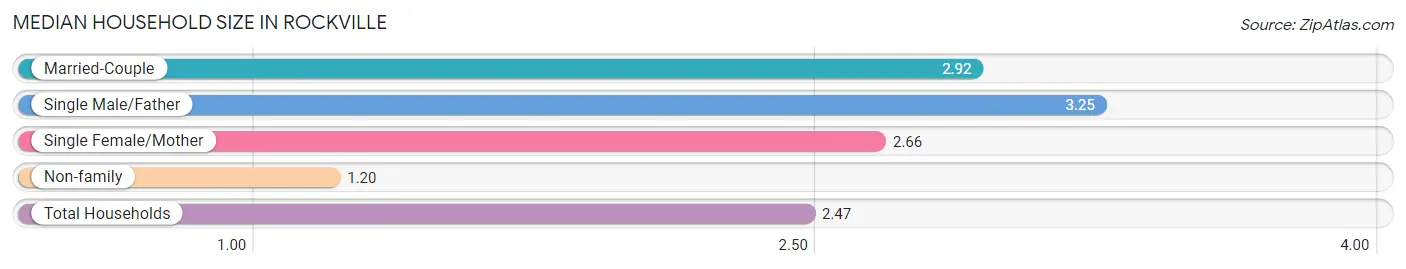
| Household Type | # Households | Household Size |
| Married-Couple | 621 (67.4%) | 2.92 |
| Single Male/Father | 24 (2.6%) | 3.25 |
| Single Female/Mother | 35 (3.8%) | 2.66 |
| Non-family | 241 (26.2%) | 1.20 |
| Total Households | 921 (100.0%) | 2.47 |
Household Size by Marriage Status in Rockville
Out of a total of 921 households in Rockville, 680 (73.8%) are family households, while 241 (26.2%) are nonfamily households. The most numerous type of family households are 2-person households, comprising 406, and the most common type of nonfamily households are 1-person households, comprising 189.
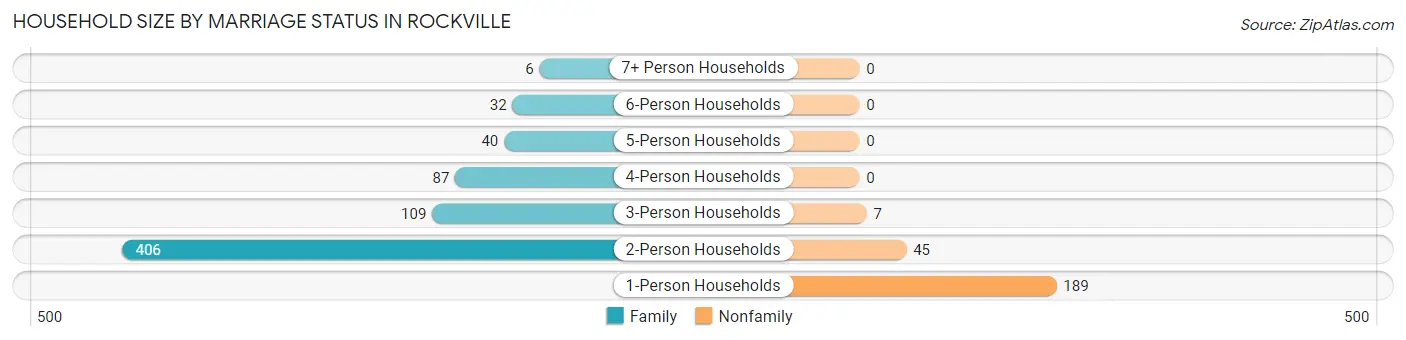
| Household Size | Family Households | Nonfamily Households |
| 1-Person Households | - | 189 (20.5%) |
| 2-Person Households | 406 (44.1%) | 45 (4.9%) |
| 3-Person Households | 109 (11.8%) | 7 (0.8%) |
| 4-Person Households | 87 (9.5%) | 0 (0.0%) |
| 5-Person Households | 40 (4.3%) | 0 (0.0%) |
| 6-Person Households | 32 (3.5%) | 0 (0.0%) |
| 7+ Person Households | 6 (0.6%) | 0 (0.0%) |
| Total | 680 (73.8%) | 241 (26.2%) |
Female Fertility in Rockville
Fertility by Age in Rockville
Average fertility rate in Rockville is 123.0 births per 1,000 women. Women in the age bracket of 20 to 34 years have the highest fertility rate with 301.0 births per 1,000 women. Women in the age bracket of 20 to 34 years acount for 84.3% of all women with births.
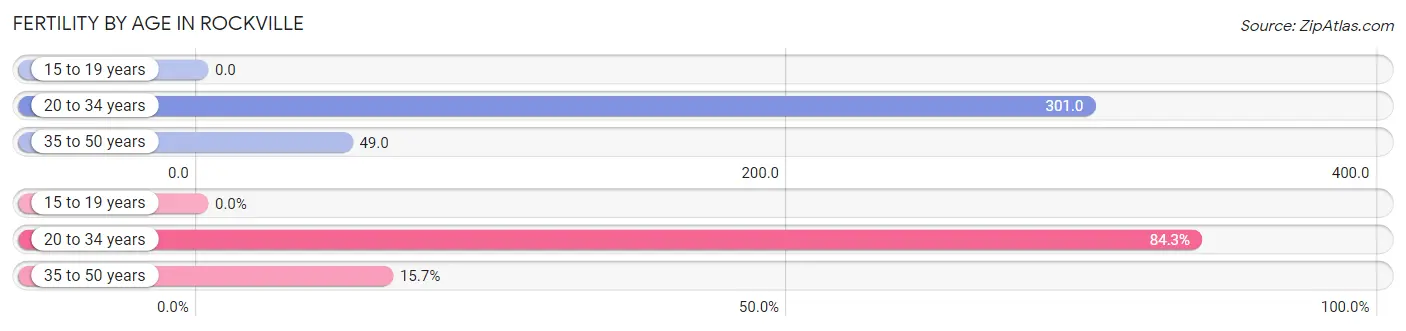
| Age Bracket | Women with Births | Births / 1,000 Women |
| 15 to 19 years | 0 (0.0%) | 0.0 |
| 20 to 34 years | 43 (84.3%) | 301.0 |
| 35 to 50 years | 8 (15.7%) | 49.0 |
| Total | 51 (100.0%) | 123.0 |
Fertility by Age by Marriage Status in Rockville
92.2% of women with births (51) in Rockville are married. The highest percentage of unmarried women with births falls into 35 to 50 years age bracket with 50.0% of them unmarried at the time of birth, while the lowest percentage of unmarried women with births belong to 20 to 34 years age bracket with 0.0% of them unmarried.
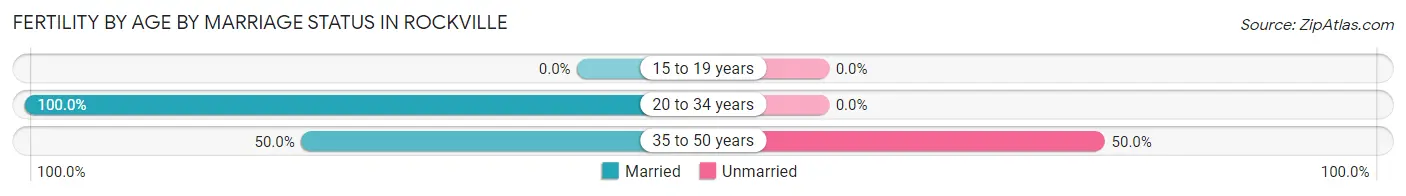
| Age Bracket | Married | Unmarried |
| 15 to 19 years | 0 (0.0%) | 0 (0.0%) |
| 20 to 34 years | 43 (100.0%) | 0 (0.0%) |
| 35 to 50 years | 4 (50.0%) | 4 (50.0%) |
| Total | 47 (92.2%) | 4 (7.8%) |
Fertility by Education in Rockville
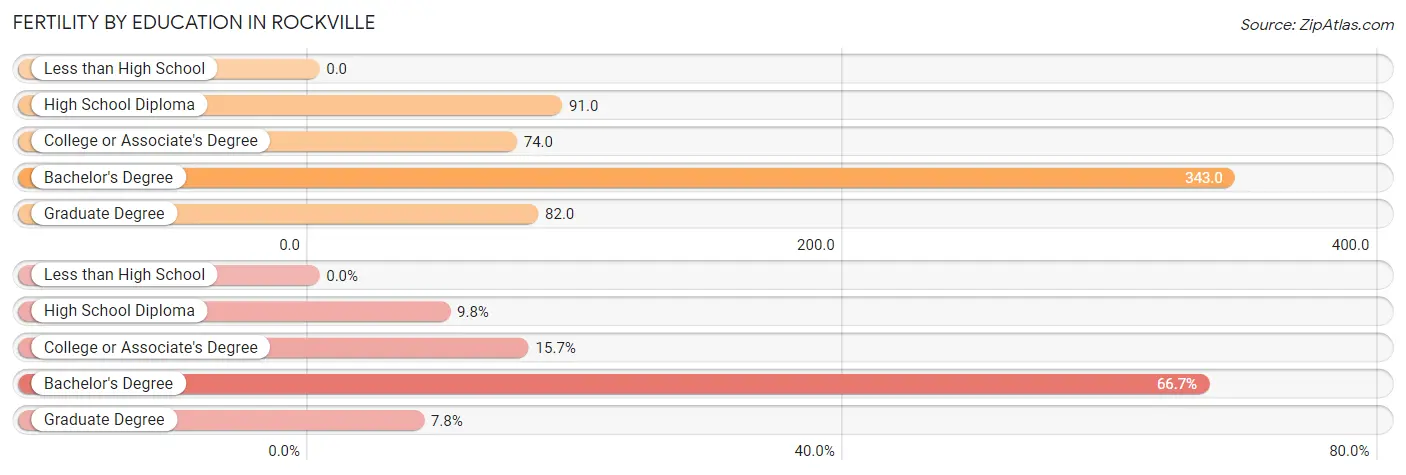
| Educational Attainment | Women with Births | Births / 1,000 Women |
| Less than High School | 0 (0.0%) | 0.0 |
| High School Diploma | 5 (9.8%) | 91.0 |
| College or Associate's Degree | 8 (15.7%) | 74.0 |
| Bachelor's Degree | 34 (66.7%) | 343.0 |
| Graduate Degree | 4 (7.8%) | 82.0 |
| Total | 51 (100.0%) | 123.0 |
Fertility by Education by Marriage Status in Rockville
7.8% of women with births in Rockville are unmarried. Women with the educational attainment of high school diploma are most likely to be married with 100.0% of them married at childbirth, while women with the educational attainment of college or associate's degree are least likely to be married with 50.0% of them unmarried at childbirth.
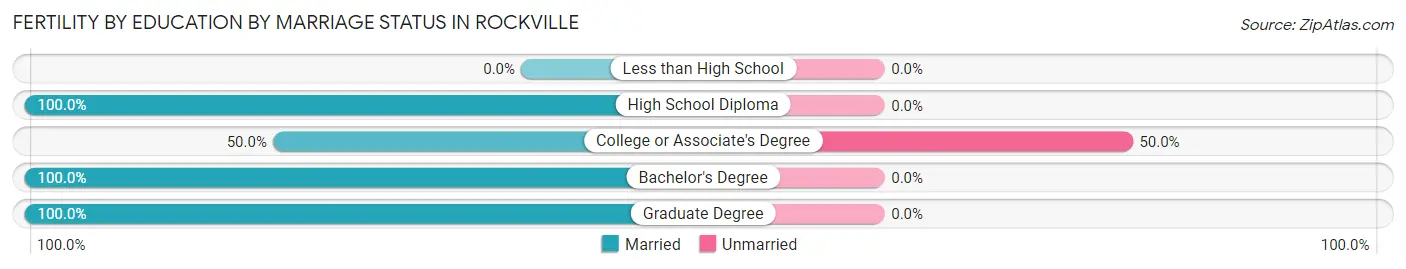
| Educational Attainment | Married | Unmarried |
| Less than High School | 0 (0.0%) | 0 (0.0%) |
| High School Diploma | 5 (100.0%) | 0 (0.0%) |
| College or Associate's Degree | 4 (50.0%) | 4 (50.0%) |
| Bachelor's Degree | 34 (100.0%) | 0 (0.0%) |
| Graduate Degree | 4 (100.0%) | 0 (0.0%) |
| Total | 47 (92.2%) | 4 (7.8%) |
Employment Characteristics in Rockville
Employment by Class of Employer in Rockville
Among the 1,189 employed individuals in Rockville, private company employees (748 | 62.9%), not-for-profit organizations (194 | 16.3%), and self-employed (incorporated) (81 | 6.8%) make up the most common classes of employment.
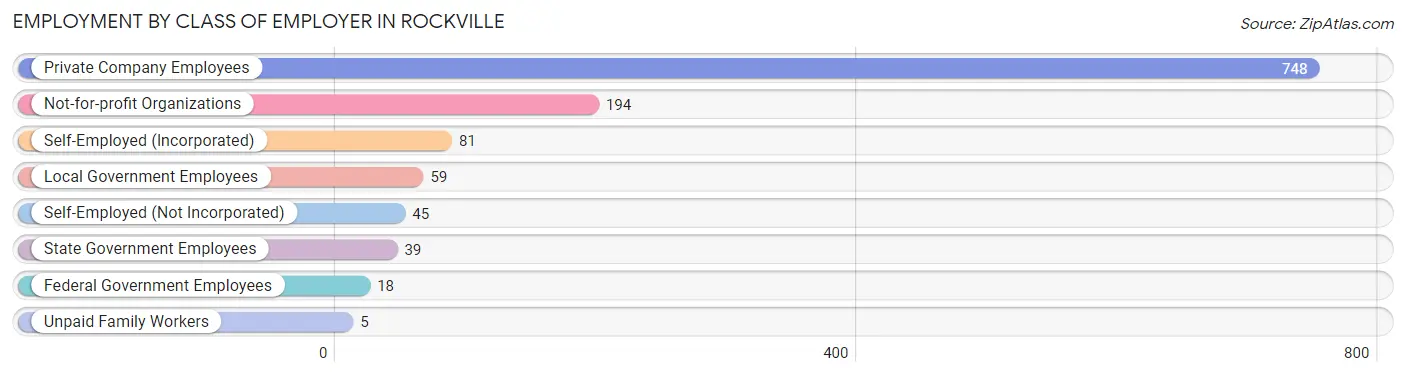
| Employer Class | # Employees | % Employees |
| Private Company Employees | 748 | 62.9% |
| Self-Employed (Incorporated) | 81 | 6.8% |
| Self-Employed (Not Incorporated) | 45 | 3.8% |
| Not-for-profit Organizations | 194 | 16.3% |
| Local Government Employees | 59 | 5.0% |
| State Government Employees | 39 | 3.3% |
| Federal Government Employees | 18 | 1.5% |
| Unpaid Family Workers | 5 | 0.4% |
| Total | 1,189 | 100.0% |
Employment Status by Age in Rockville
According to the labor force statistics for Rockville, out of the total population over 16 years of age (1,815), 66.9% or 1,214 individuals are in the labor force, with 1.1% or 13 of them unemployed. The age group with the highest labor force participation rate is 55 to 59 years, with 97.7% or 215 individuals in the labor force. Within the labor force, the 60 to 64 years age range has the highest percentage of unemployed individuals, with 2.9% or 5 of them being unemployed.
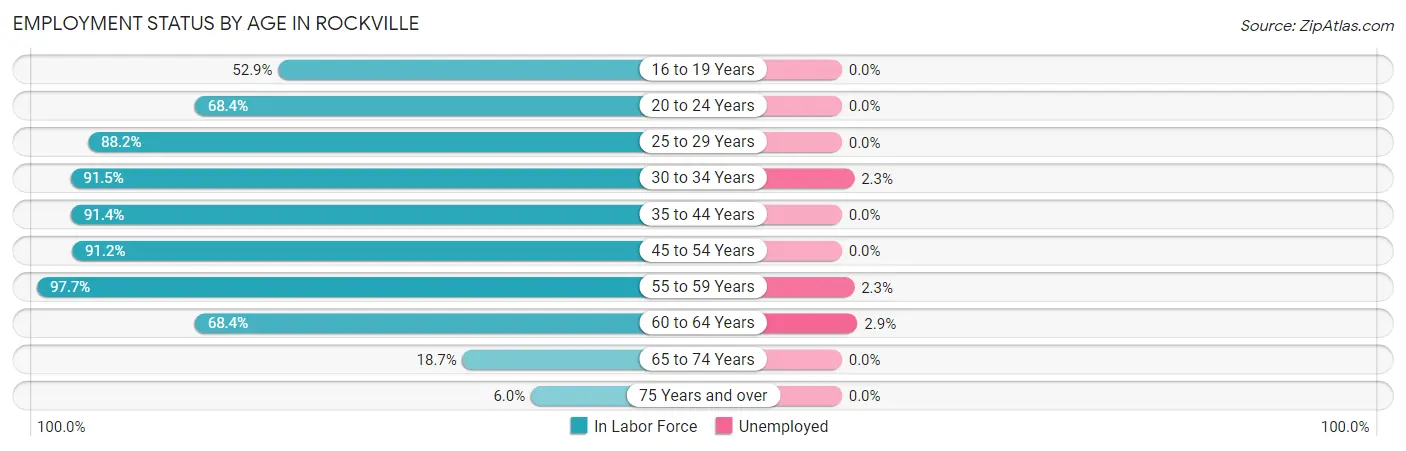
| Age Bracket | In Labor Force | Unemployed |
| 16 to 19 Years | 73 (52.9%) | 0 (0.0%) |
| 20 to 24 Years | 26 (68.4%) | 0 (0.0%) |
| 25 to 29 Years | 112 (88.2%) | 0 (0.0%) |
| 30 to 34 Years | 130 (91.5%) | 3 (2.3%) |
| 35 to 44 Years | 224 (91.4%) | 0 (0.0%) |
| 45 to 54 Years | 206 (91.2%) | 0 (0.0%) |
| 55 to 59 Years | 215 (97.7%) | 5 (2.3%) |
| 60 to 64 Years | 171 (68.4%) | 5 (2.9%) |
| 65 to 74 Years | 46 (18.7%) | 0 (0.0%) |
| 75 Years and over | 11 (6.0%) | 0 (0.0%) |
| Total | 1,214 (66.9%) | 13 (1.1%) |
Employment Status by Educational Attainment in Rockville
According to labor force statistics for Rockville, 87.4% of individuals (1,058) out of the total population between 25 and 64 years of age (1,210) are in the labor force, with 1.2% or 13 of them being unemployed. The group with the highest labor force participation rate are those with the educational attainment of college / associate degree, with 89.5% or 497 individuals in the labor force. Within the labor force, individuals with college / associate degree education have the highest percentage of unemployment, with 2.0% or 10 of them being unemployed.
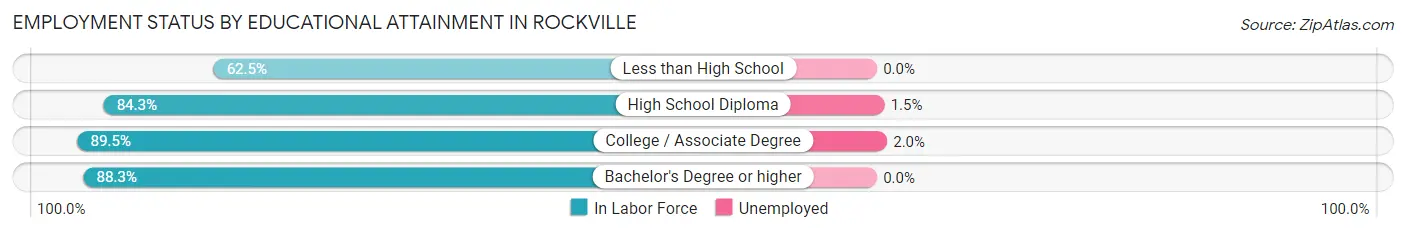
| Educational Attainment | In Labor Force | Unemployed |
| Less than High School | 20 (62.5%) | 0 (0.0%) |
| High School Diploma | 194 (84.3%) | 3 (1.5%) |
| College / Associate Degree | 497 (89.5%) | 11 (2.0%) |
| Bachelor's Degree or higher | 347 (88.3%) | 0 (0.0%) |
| Total | 1,058 (87.4%) | 15 (1.2%) |
Employment Occupations by Sex in Rockville
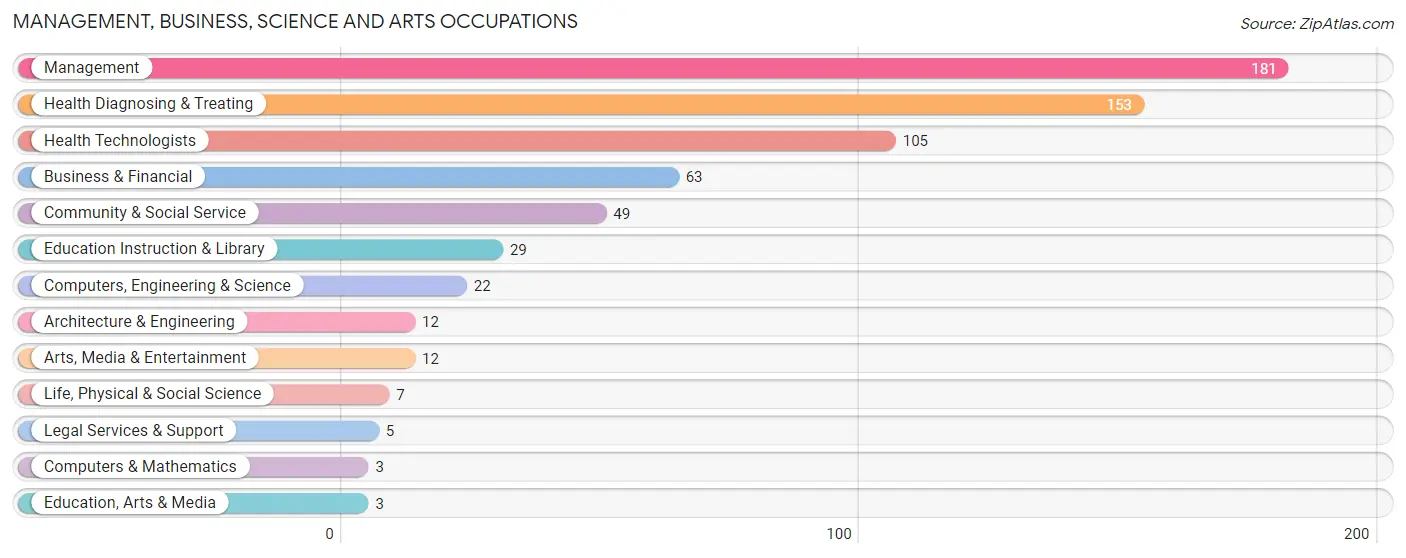
Management, Business, Science and Arts Occupations
The most common Management, Business, Science and Arts occupations in Rockville are Management (181 | 15.1%), Health Diagnosing & Treating (153 | 12.7%), Health Technologists (105 | 8.7%), Business & Financial (63 | 5.2%), and Community & Social Service (49 | 4.1%).
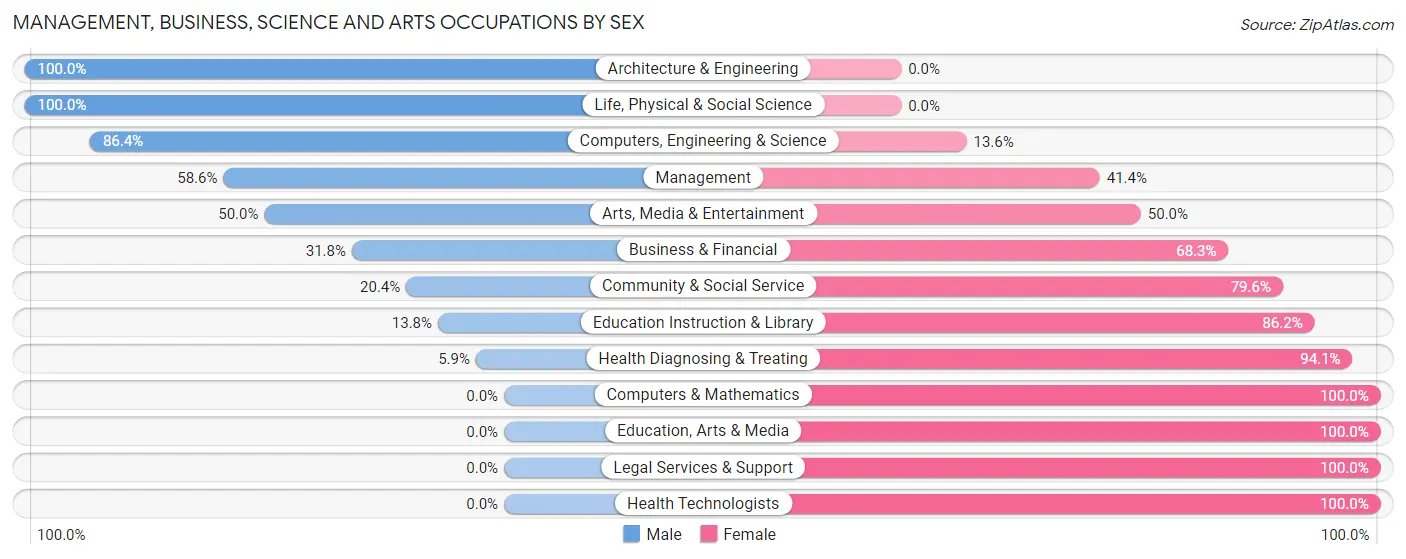
Management, Business, Science and Arts Occupations by Sex
Within the Management, Business, Science and Arts occupations in Rockville, the most male-oriented occupations are Architecture & Engineering (100.0%), Life, Physical & Social Science (100.0%), and Computers, Engineering & Science (86.4%), while the most female-oriented occupations are Computers & Mathematics (100.0%), Education, Arts & Media (100.0%), and Legal Services & Support (100.0%).
| Occupation | Male | Female |
| Management | 106 (58.6%) | 75 (41.4%) |
| Business & Financial | 20 (31.8%) | 43 (68.2%) |
| Computers, Engineering & Science | 19 (86.4%) | 3 (13.6%) |
| Computers & Mathematics | 0 (0.0%) | 3 (100.0%) |
| Architecture & Engineering | 12 (100.0%) | 0 (0.0%) |
| Life, Physical & Social Science | 7 (100.0%) | 0 (0.0%) |
| Community & Social Service | 10 (20.4%) | 39 (79.6%) |
| Education, Arts & Media | 0 (0.0%) | 3 (100.0%) |
| Legal Services & Support | 0 (0.0%) | 5 (100.0%) |
| Education Instruction & Library | 4 (13.8%) | 25 (86.2%) |
| Arts, Media & Entertainment | 6 (50.0%) | 6 (50.0%) |
| Health Diagnosing & Treating | 9 (5.9%) | 144 (94.1%) |
| Health Technologists | 0 (0.0%) | 105 (100.0%) |
| Total (Category) | 164 (35.0%) | 304 (65.0%) |
| Total (Overall) | 645 (53.7%) | 556 (46.3%) |
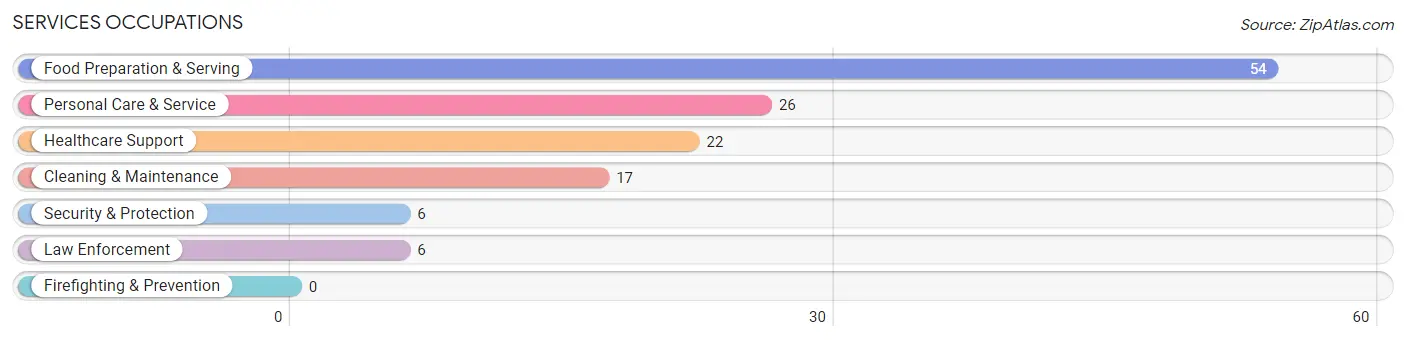
Services Occupations
The most common Services occupations in Rockville are Food Preparation & Serving (54 | 4.5%), Personal Care & Service (26 | 2.2%), Healthcare Support (22 | 1.8%), Cleaning & Maintenance (17 | 1.4%), and Security & Protection (6 | 0.5%).
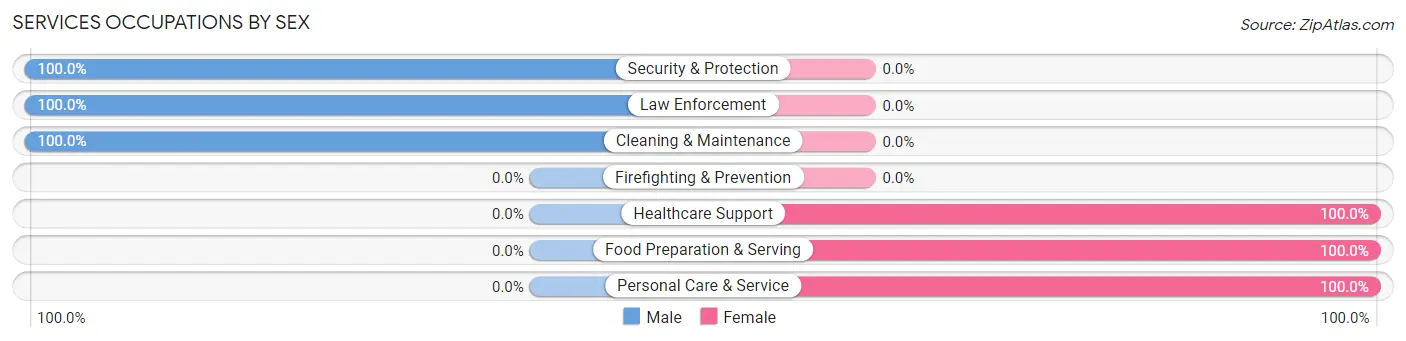
Services Occupations by Sex
Within the Services occupations in Rockville, the most male-oriented occupations are Security & Protection (100.0%), Law Enforcement (100.0%), and Cleaning & Maintenance (100.0%), while the most female-oriented occupations are Healthcare Support (100.0%), Food Preparation & Serving (100.0%), and Personal Care & Service (100.0%).
| Occupation | Male | Female |
| Healthcare Support | 0 (0.0%) | 22 (100.0%) |
| Security & Protection | 6 (100.0%) | 0 (0.0%) |
| Firefighting & Prevention | 0 (0.0%) | 0 (0.0%) |
| Law Enforcement | 6 (100.0%) | 0 (0.0%) |
| Food Preparation & Serving | 0 (0.0%) | 54 (100.0%) |
| Cleaning & Maintenance | 17 (100.0%) | 0 (0.0%) |
| Personal Care & Service | 0 (0.0%) | 26 (100.0%) |
| Total (Category) | 23 (18.4%) | 102 (81.6%) |
| Total (Overall) | 645 (53.7%) | 556 (46.3%) |
Sales and Office Occupations
The most common Sales and Office occupations in Rockville are Office & Administration (115 | 9.6%), and Sales & Related (93 | 7.7%).

Sales and Office Occupations by Sex
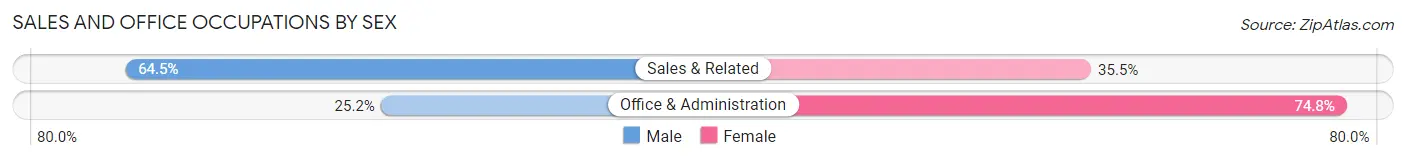
| Occupation | Male | Female |
| Sales & Related | 60 (64.5%) | 33 (35.5%) |
| Office & Administration | 29 (25.2%) | 86 (74.8%) |
| Total (Category) | 89 (42.8%) | 119 (57.2%) |
| Total (Overall) | 645 (53.7%) | 556 (46.3%) |
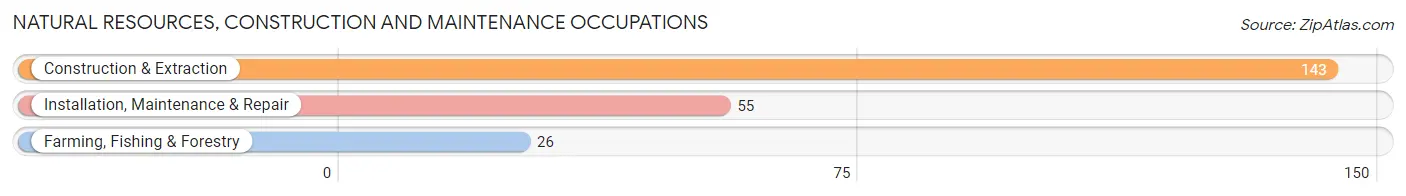
Natural Resources, Construction and Maintenance Occupations
The most common Natural Resources, Construction and Maintenance occupations in Rockville are Construction & Extraction (143 | 11.9%), Installation, Maintenance & Repair (55 | 4.6%), and Farming, Fishing & Forestry (26 | 2.2%).
Natural Resources, Construction and Maintenance Occupations by Sex

| Occupation | Male | Female |
| Farming, Fishing & Forestry | 24 (92.3%) | 2 (7.7%) |
| Construction & Extraction | 143 (100.0%) | 0 (0.0%) |
| Installation, Maintenance & Repair | 55 (100.0%) | 0 (0.0%) |
| Total (Category) | 222 (99.1%) | 2 (0.9%) |
| Total (Overall) | 645 (53.7%) | 556 (46.3%) |
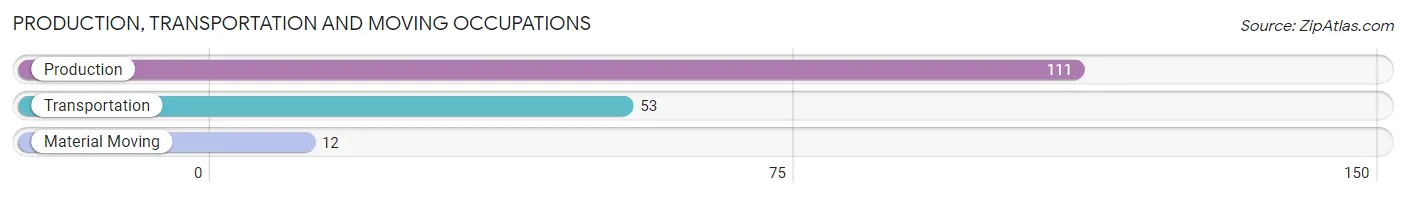
Production, Transportation and Moving Occupations
The most common Production, Transportation and Moving occupations in Rockville are Production (111 | 9.2%), Transportation (53 | 4.4%), and Material Moving (12 | 1.0%).
Production, Transportation and Moving Occupations by Sex
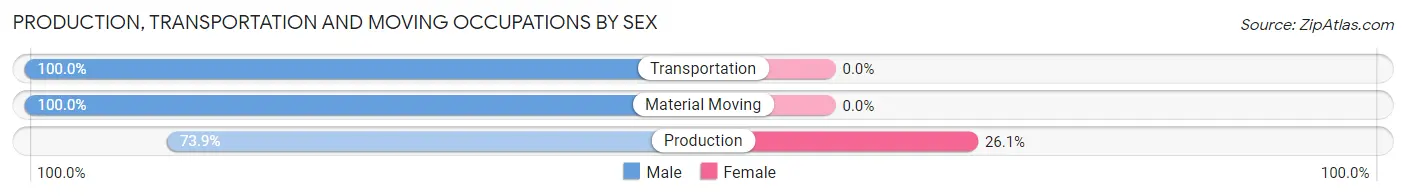
| Occupation | Male | Female |
| Production | 82 (73.9%) | 29 (26.1%) |
| Transportation | 53 (100.0%) | 0 (0.0%) |
| Material Moving | 12 (100.0%) | 0 (0.0%) |
| Total (Category) | 147 (83.5%) | 29 (16.5%) |
| Total (Overall) | 645 (53.7%) | 556 (46.3%) |
Employment Industries by Sex in Rockville
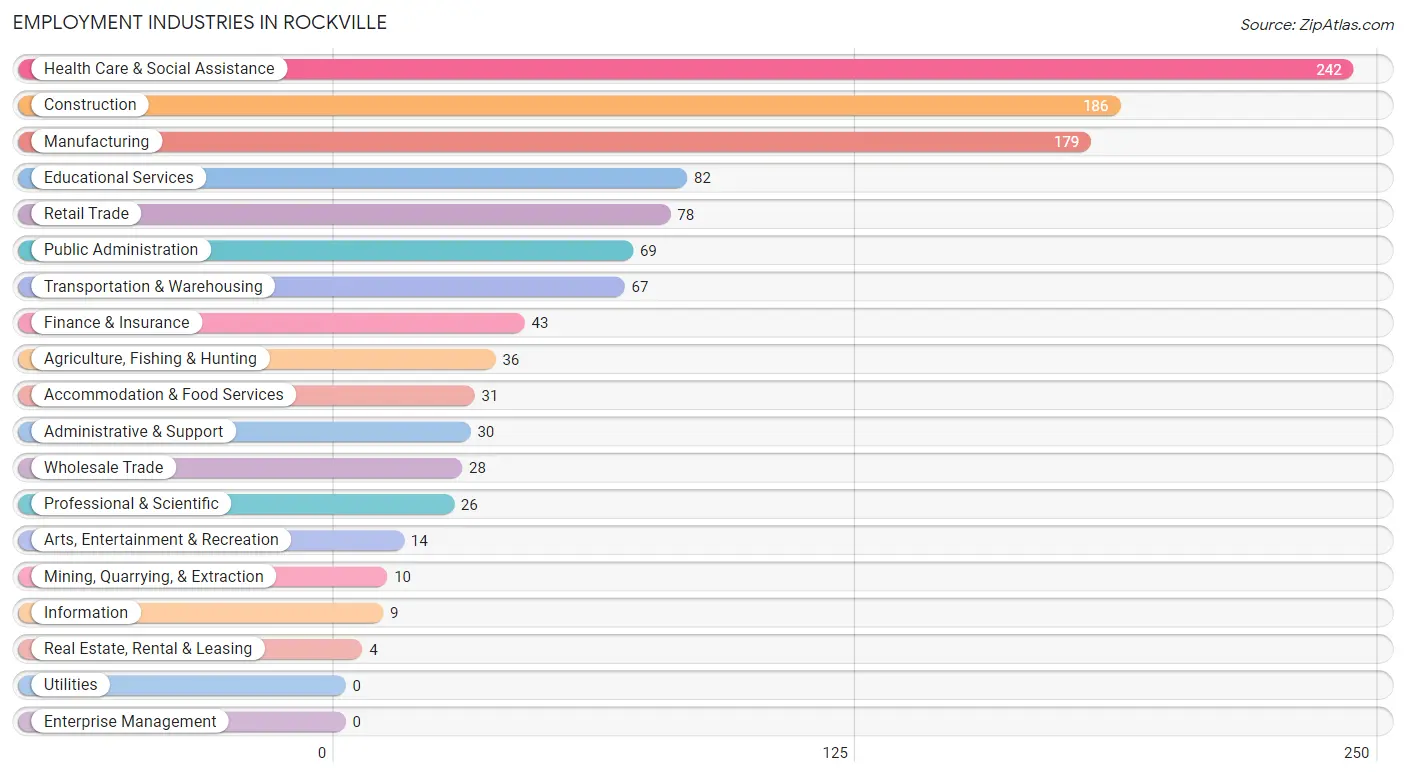
Employment Industries in Rockville
The major employment industries in Rockville include Health Care & Social Assistance (242 | 20.2%), Construction (186 | 15.5%), Manufacturing (179 | 14.9%), Educational Services (82 | 6.8%), and Retail Trade (78 | 6.5%).
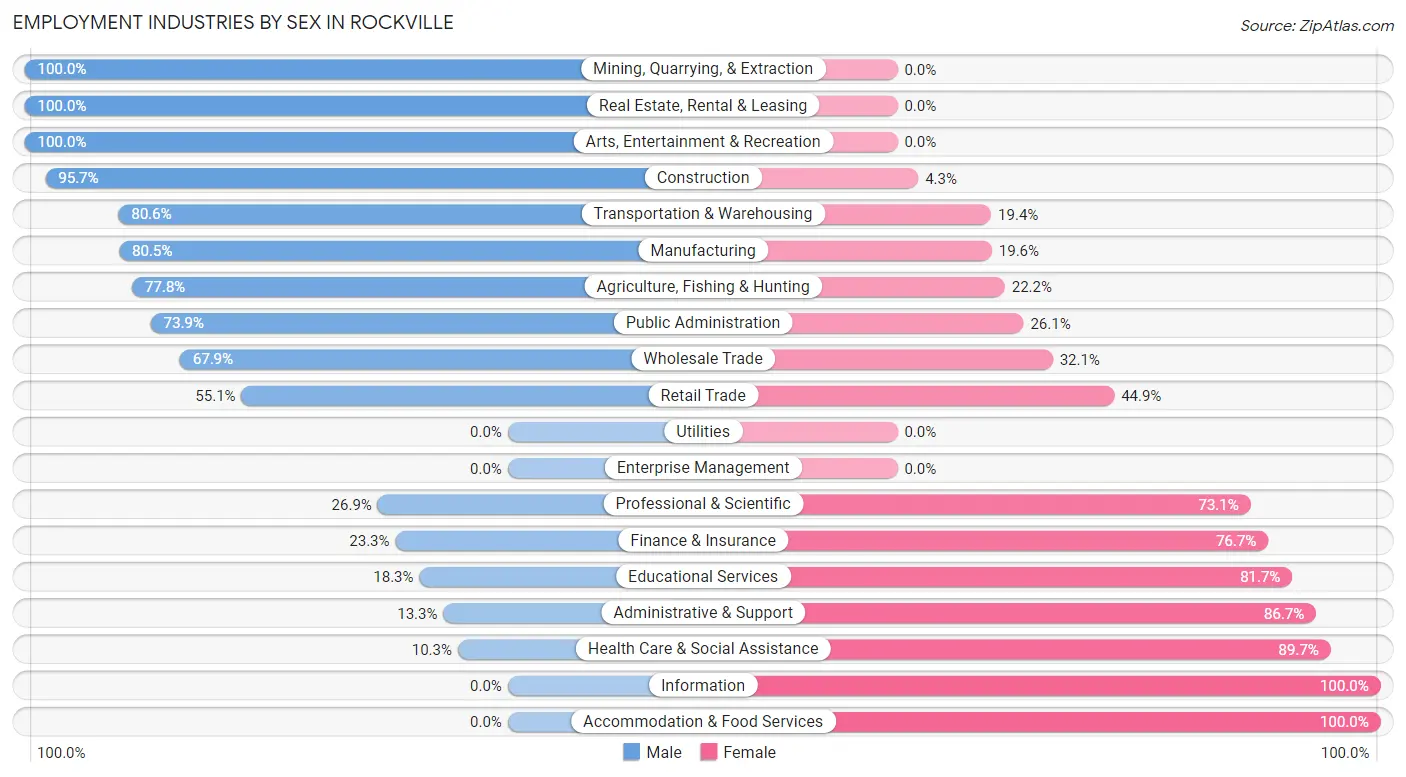
Employment Industries by Sex in Rockville
The Rockville industries that see more men than women are Mining, Quarrying, & Extraction (100.0%), Real Estate, Rental & Leasing (100.0%), and Arts, Entertainment & Recreation (100.0%), whereas the industries that tend to have a higher number of women are Information (100.0%), Accommodation & Food Services (100.0%), and Health Care & Social Assistance (89.7%).
| Industry | Male | Female |
| Agriculture, Fishing & Hunting | 28 (77.8%) | 8 (22.2%) |
| Mining, Quarrying, & Extraction | 10 (100.0%) | 0 (0.0%) |
| Construction | 178 (95.7%) | 8 (4.3%) |
| Manufacturing | 144 (80.4%) | 35 (19.6%) |
| Wholesale Trade | 19 (67.9%) | 9 (32.1%) |
| Retail Trade | 43 (55.1%) | 35 (44.9%) |
| Transportation & Warehousing | 54 (80.6%) | 13 (19.4%) |
| Utilities | 0 (0.0%) | 0 (0.0%) |
| Information | 0 (0.0%) | 9 (100.0%) |
| Finance & Insurance | 10 (23.3%) | 33 (76.7%) |
| Real Estate, Rental & Leasing | 4 (100.0%) | 0 (0.0%) |
| Professional & Scientific | 7 (26.9%) | 19 (73.1%) |
| Enterprise Management | 0 (0.0%) | 0 (0.0%) |
| Administrative & Support | 4 (13.3%) | 26 (86.7%) |
| Educational Services | 15 (18.3%) | 67 (81.7%) |
| Health Care & Social Assistance | 25 (10.3%) | 217 (89.7%) |
| Arts, Entertainment & Recreation | 14 (100.0%) | 0 (0.0%) |
| Accommodation & Food Services | 0 (0.0%) | 31 (100.0%) |
| Public Administration | 51 (73.9%) | 18 (26.1%) |
| Total | 645 (53.7%) | 556 (46.3%) |
Education in Rockville
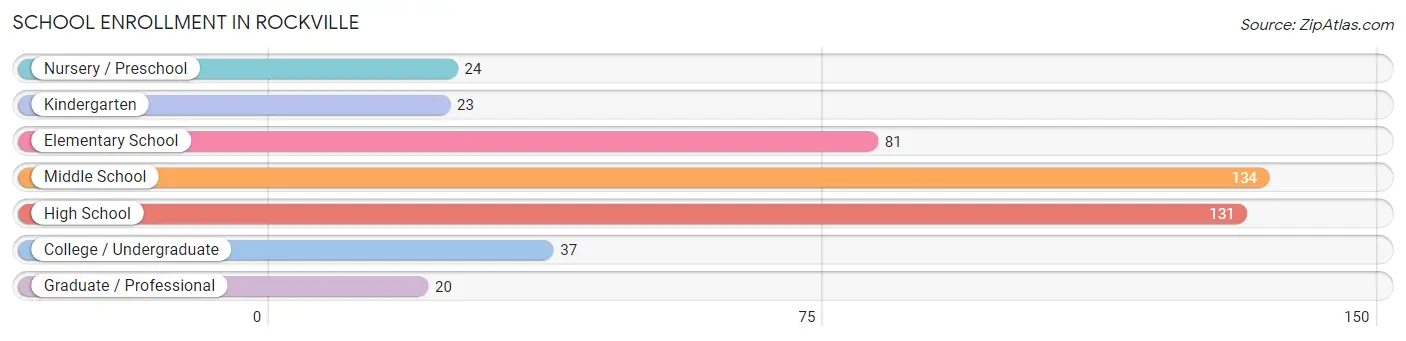
School Enrollment in Rockville
The most common levels of schooling among the 450 students in Rockville are middle school (134 | 29.8%), high school (131 | 29.1%), and elementary school (81 | 18.0%).
| School Level | # Students | % Students |
| Nursery / Preschool | 24 | 5.3% |
| Kindergarten | 23 | 5.1% |
| Elementary School | 81 | 18.0% |
| Middle School | 134 | 29.8% |
| High School | 131 | 29.1% |
| College / Undergraduate | 37 | 8.2% |
| Graduate / Professional | 20 | 4.4% |
| Total | 450 | 100.0% |
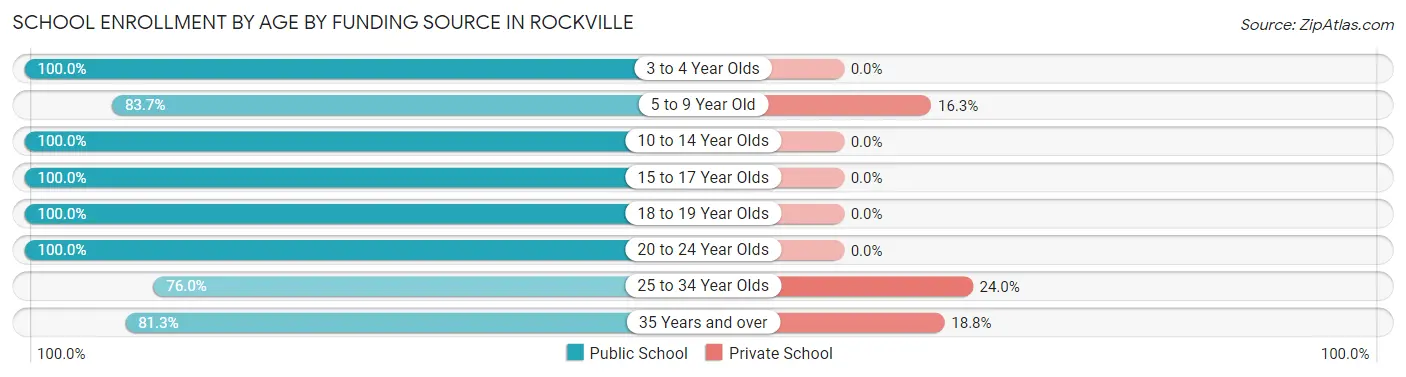
School Enrollment by Age by Funding Source in Rockville
Out of a total of 450 students who are enrolled in schools in Rockville, 23 (5.1%) attend a private institution, while the remaining 427 (94.9%) are enrolled in public schools. The age group of 25 to 34 year olds has the highest likelihood of being enrolled in private schools, with 6 (24.0% in the age bracket) enrolled. Conversely, the age group of 3 to 4 year olds has the lowest likelihood of being enrolled in a private school, with 19 (100.0% in the age bracket) attending a public institution.
| Age Bracket | Public School | Private School |
| 3 to 4 Year Olds | 19 (100.0%) | 0 (0.0%) |
| 5 to 9 Year Old | 72 (83.7%) | 14 (16.3%) |
| 10 to 14 Year Olds | 165 (100.0%) | 0 (0.0%) |
| 15 to 17 Year Olds | 78 (100.0%) | 0 (0.0%) |
| 18 to 19 Year Olds | 57 (100.0%) | 0 (0.0%) |
| 20 to 24 Year Olds | 4 (100.0%) | 0 (0.0%) |
| 25 to 34 Year Olds | 19 (76.0%) | 6 (24.0%) |
| 35 Years and over | 13 (81.2%) | 3 (18.8%) |
| Total | 427 (94.9%) | 23 (5.1%) |
Educational Attainment by Field of Study in Rockville
Business (98 | 18.5%), science & technology (88 | 16.6%), education (76 | 14.3%), arts & humanities (50 | 9.4%), and physical & health sciences (43 | 8.1%) are the most common fields of study among 531 individuals in Rockville who have obtained a bachelor's degree or higher.
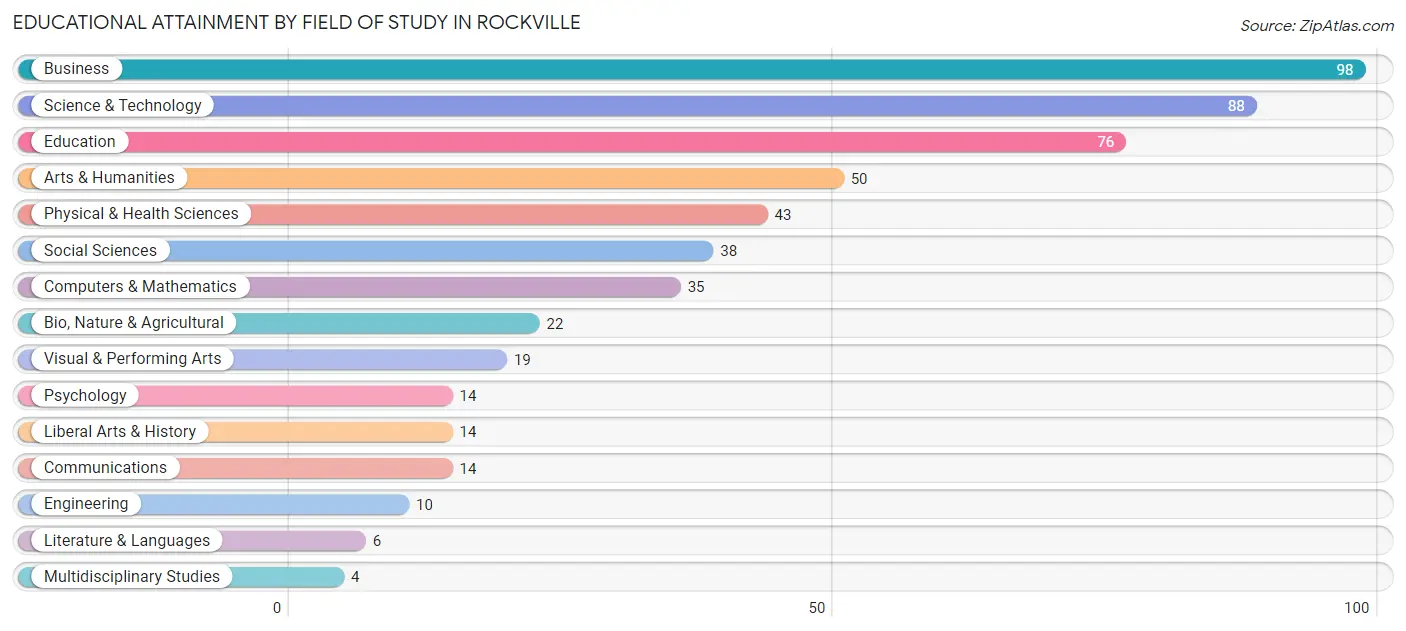
| Field of Study | # Graduates | % Graduates |
| Computers & Mathematics | 35 | 6.6% |
| Bio, Nature & Agricultural | 22 | 4.1% |
| Physical & Health Sciences | 43 | 8.1% |
| Psychology | 14 | 2.6% |
| Social Sciences | 38 | 7.2% |
| Engineering | 10 | 1.9% |
| Multidisciplinary Studies | 4 | 0.7% |
| Science & Technology | 88 | 16.6% |
| Business | 98 | 18.5% |
| Education | 76 | 14.3% |
| Literature & Languages | 6 | 1.1% |
| Liberal Arts & History | 14 | 2.6% |
| Visual & Performing Arts | 19 | 3.6% |
| Communications | 14 | 2.6% |
| Arts & Humanities | 50 | 9.4% |
| Total | 531 | 100.0% |
Transportation & Commute in Rockville
Vehicle Availability by Sex in Rockville
The most prevalent vehicle ownership categories in Rockville are males with 2 vehicles (269, accounting for 42.5%) and females with 2 vehicles (240, making up 48.4%).
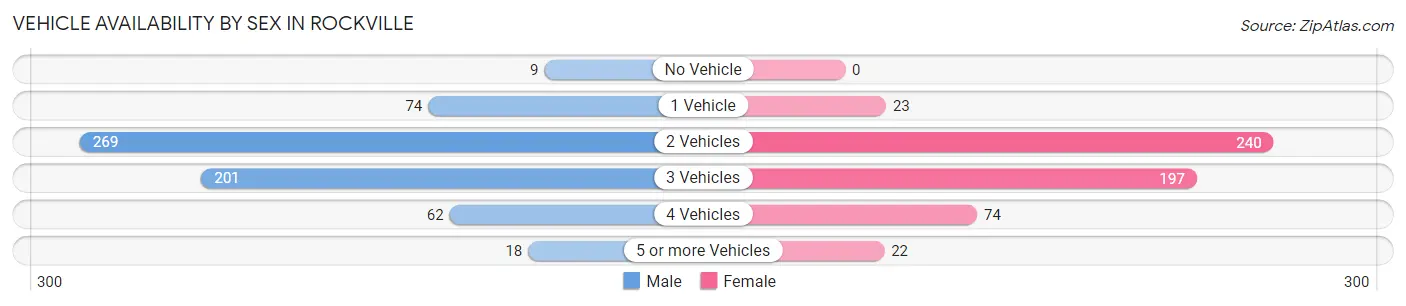
| Vehicles Available | Male | Female |
| No Vehicle | 9 (1.4%) | 0 (0.0%) |
| 1 Vehicle | 74 (11.7%) | 23 (4.1%) |
| 2 Vehicles | 269 (42.5%) | 240 (43.2%) |
| 3 Vehicles | 201 (31.8%) | 197 (35.4%) |
| 4 Vehicles | 62 (9.8%) | 74 (13.3%) |
| 5 or more Vehicles | 18 (2.8%) | 22 (4.0%) |
| Total | 633 (100.0%) | 556 (100.0%) |
Commute Time in Rockville
The most frequently occuring commute durations in Rockville are 15 to 19 minutes (239 commuters, 21.2%), 20 to 24 minutes (222 commuters, 19.7%), and 10 to 14 minutes (150 commuters, 13.3%).
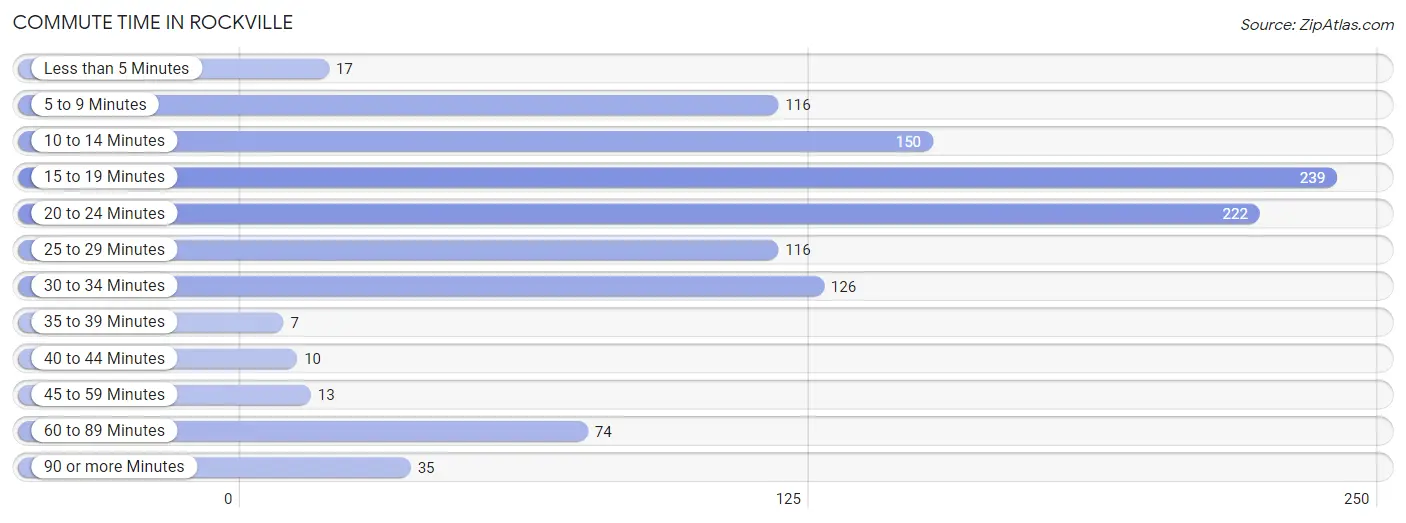
| Commute Time | # Commuters | % Commuters |
| Less than 5 Minutes | 17 | 1.5% |
| 5 to 9 Minutes | 116 | 10.3% |
| 10 to 14 Minutes | 150 | 13.3% |
| 15 to 19 Minutes | 239 | 21.2% |
| 20 to 24 Minutes | 222 | 19.7% |
| 25 to 29 Minutes | 116 | 10.3% |
| 30 to 34 Minutes | 126 | 11.2% |
| 35 to 39 Minutes | 7 | 0.6% |
| 40 to 44 Minutes | 10 | 0.9% |
| 45 to 59 Minutes | 13 | 1.2% |
| 60 to 89 Minutes | 74 | 6.6% |
| 90 or more Minutes | 35 | 3.1% |
Commute Time by Sex in Rockville
The most common commute times in Rockville are 15 to 19 minutes (122 commuters, 20.4%) for males and 20 to 24 minutes (146 commuters, 27.7%) for females.
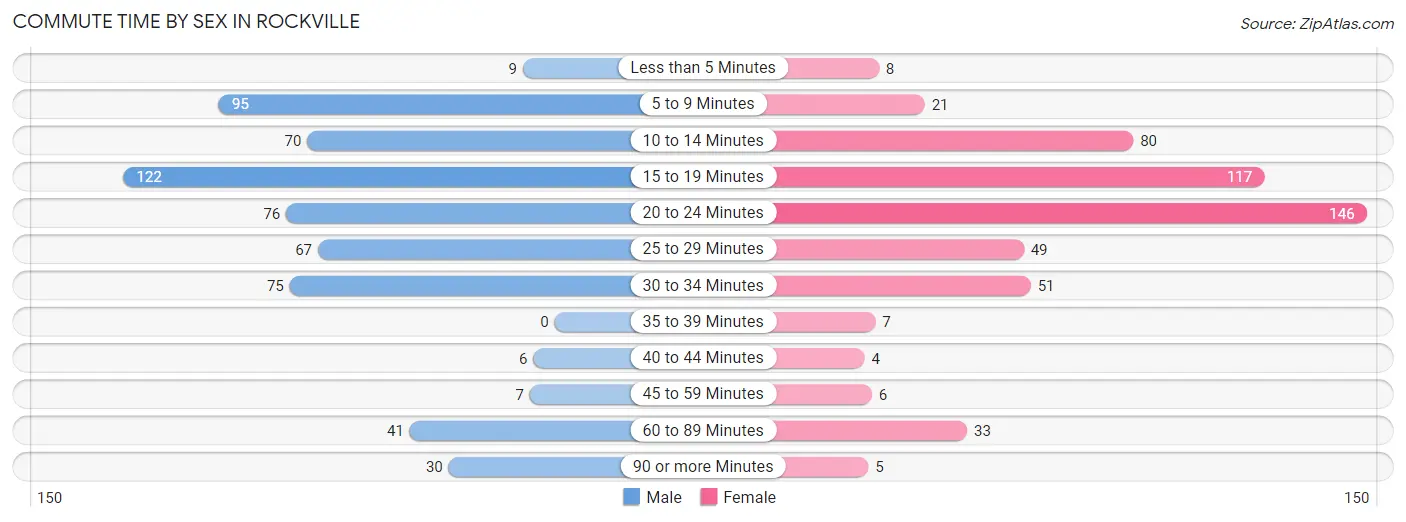
| Commute Time | Male | Female |
| Less than 5 Minutes | 9 (1.5%) | 8 (1.5%) |
| 5 to 9 Minutes | 95 (15.9%) | 21 (4.0%) |
| 10 to 14 Minutes | 70 (11.7%) | 80 (15.2%) |
| 15 to 19 Minutes | 122 (20.4%) | 117 (22.2%) |
| 20 to 24 Minutes | 76 (12.7%) | 146 (27.7%) |
| 25 to 29 Minutes | 67 (11.2%) | 49 (9.3%) |
| 30 to 34 Minutes | 75 (12.5%) | 51 (9.7%) |
| 35 to 39 Minutes | 0 (0.0%) | 7 (1.3%) |
| 40 to 44 Minutes | 6 (1.0%) | 4 (0.8%) |
| 45 to 59 Minutes | 7 (1.2%) | 6 (1.1%) |
| 60 to 89 Minutes | 41 (6.9%) | 33 (6.3%) |
| 90 or more Minutes | 30 (5.0%) | 5 (0.9%) |
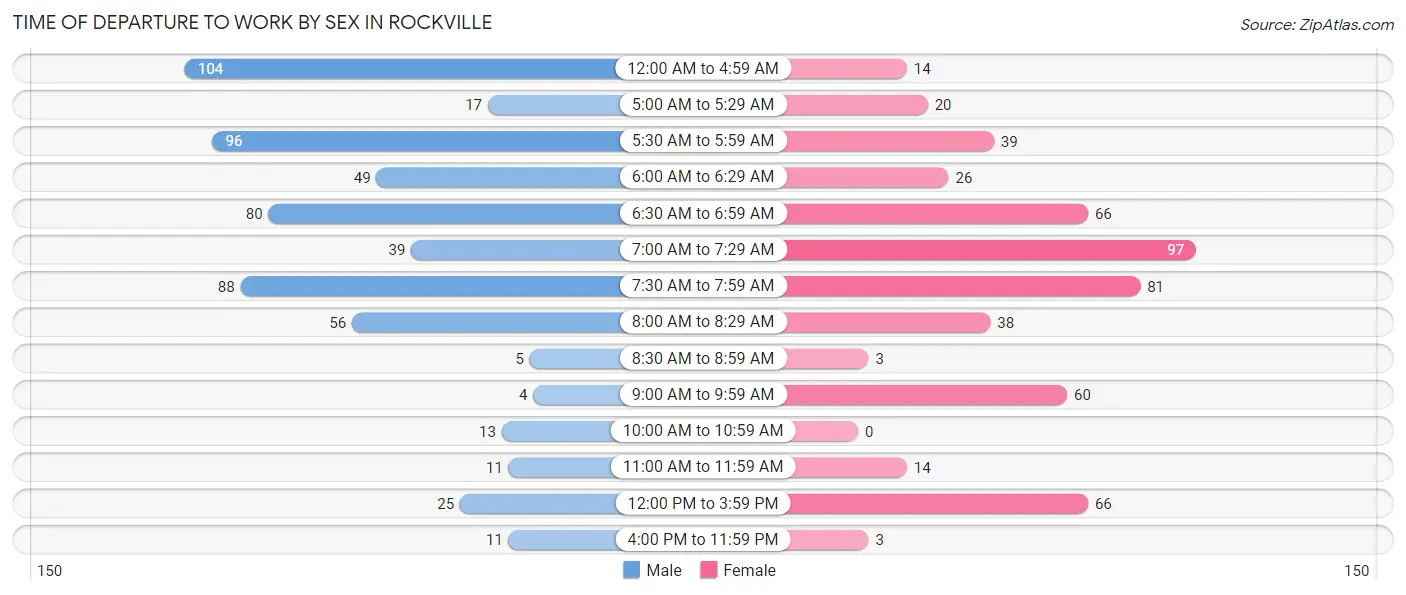
Time of Departure to Work by Sex in Rockville
The most frequent times of departure to work in Rockville are 12:00 AM to 4:59 AM (104, 17.4%) for males and 7:00 AM to 7:29 AM (97, 18.4%) for females.
| Time of Departure | Male | Female |
| 12:00 AM to 4:59 AM | 104 (17.4%) | 14 (2.7%) |
| 5:00 AM to 5:29 AM | 17 (2.8%) | 20 (3.8%) |
| 5:30 AM to 5:59 AM | 96 (16.1%) | 39 (7.4%) |
| 6:00 AM to 6:29 AM | 49 (8.2%) | 26 (4.9%) |
| 6:30 AM to 6:59 AM | 80 (13.4%) | 66 (12.5%) |
| 7:00 AM to 7:29 AM | 39 (6.5%) | 97 (18.4%) |
| 7:30 AM to 7:59 AM | 88 (14.7%) | 81 (15.4%) |
| 8:00 AM to 8:29 AM | 56 (9.4%) | 38 (7.2%) |
| 8:30 AM to 8:59 AM | 5 (0.8%) | 3 (0.6%) |
| 9:00 AM to 9:59 AM | 4 (0.7%) | 60 (11.4%) |
| 10:00 AM to 10:59 AM | 13 (2.2%) | 0 (0.0%) |
| 11:00 AM to 11:59 AM | 11 (1.8%) | 14 (2.7%) |
| 12:00 PM to 3:59 PM | 25 (4.2%) | 66 (12.5%) |
| 4:00 PM to 11:59 PM | 11 (1.8%) | 3 (0.6%) |
| Total | 598 (100.0%) | 527 (100.0%) |
Housing Occupancy in Rockville
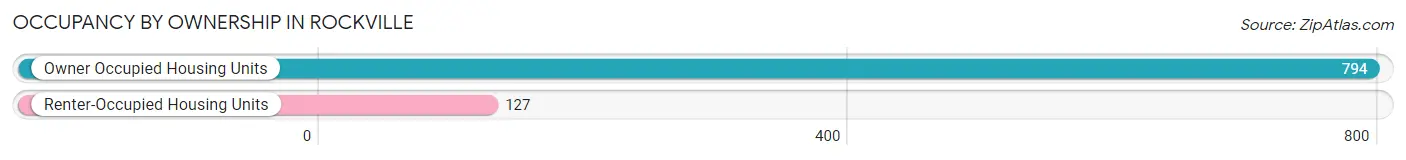
Occupancy by Ownership in Rockville
Of the total 921 dwellings in Rockville, owner-occupied units account for 794 (86.2%), while renter-occupied units make up 127 (13.8%).
| Occupancy | # Housing Units | % Housing Units |
| Owner Occupied Housing Units | 794 | 86.2% |
| Renter-Occupied Housing Units | 127 | 13.8% |
| Total Occupied Housing Units | 921 | 100.0% |
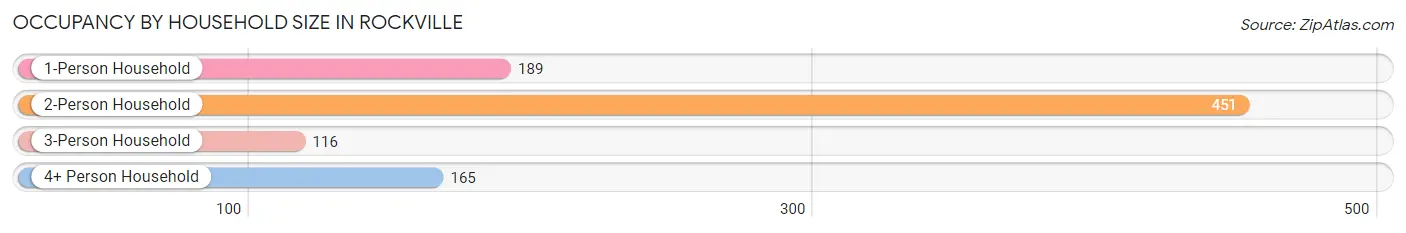
Occupancy by Household Size in Rockville
| Household Size | # Housing Units | % Housing Units |
| 1-Person Household | 189 | 20.5% |
| 2-Person Household | 451 | 49.0% |
| 3-Person Household | 116 | 12.6% |
| 4+ Person Household | 165 | 17.9% |
| Total Housing Units | 921 | 100.0% |
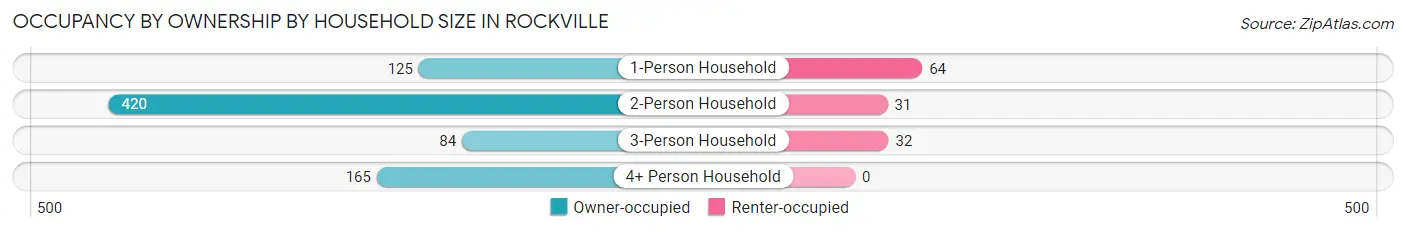
Occupancy by Ownership by Household Size in Rockville
| Household Size | Owner-occupied | Renter-occupied |
| 1-Person Household | 125 (66.1%) | 64 (33.9%) |
| 2-Person Household | 420 (93.1%) | 31 (6.9%) |
| 3-Person Household | 84 (72.4%) | 32 (27.6%) |
| 4+ Person Household | 165 (100.0%) | 0 (0.0%) |
| Total Housing Units | 794 (86.2%) | 127 (13.8%) |
Occupancy by Educational Attainment in Rockville
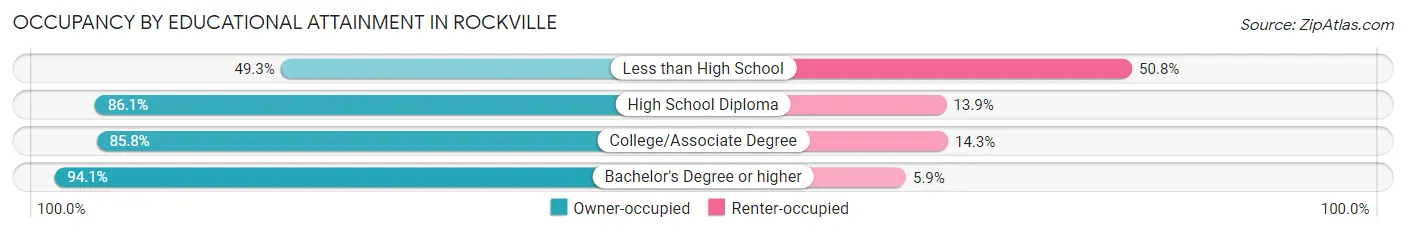
| Household Size | Owner-occupied | Renter-occupied |
| Less than High School | 33 (49.2%) | 34 (50.7%) |
| High School Diploma | 142 (86.1%) | 23 (13.9%) |
| College/Associate Degree | 301 (85.8%) | 50 (14.2%) |
| Bachelor's Degree or higher | 318 (94.1%) | 20 (5.9%) |
Occupancy by Age of Householder in Rockville
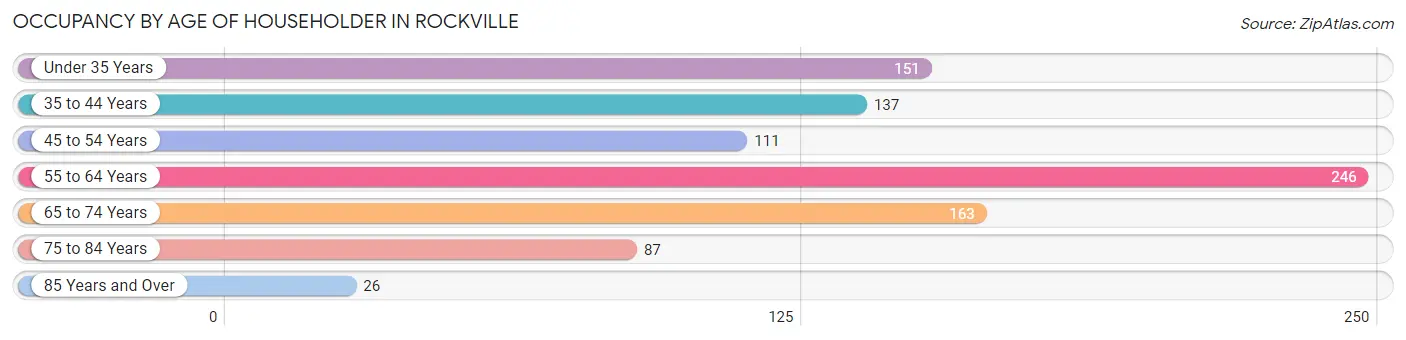
| Age Bracket | # Households | % Households |
| Under 35 Years | 151 | 16.4% |
| 35 to 44 Years | 137 | 14.9% |
| 45 to 54 Years | 111 | 12.0% |
| 55 to 64 Years | 246 | 26.7% |
| 65 to 74 Years | 163 | 17.7% |
| 75 to 84 Years | 87 | 9.5% |
| 85 Years and Over | 26 | 2.8% |
| Total | 921 | 100.0% |
Housing Finances in Rockville
Median Income by Occupancy in Rockville
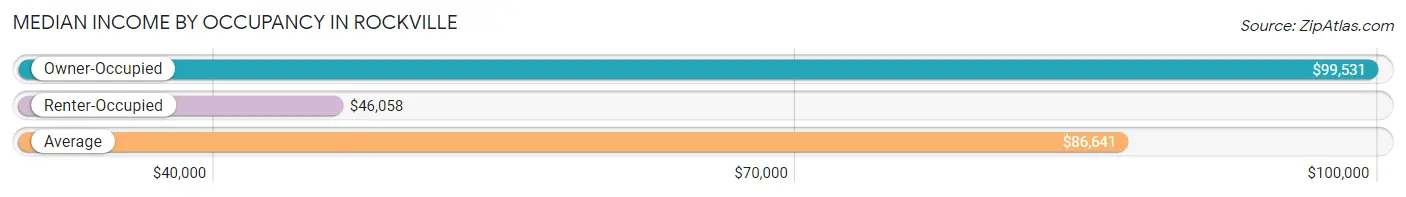
| Occupancy Type | # Households | Median Income |
| Owner-Occupied | 794 (86.2%) | $99,531 |
| Renter-Occupied | 127 (13.8%) | $46,058 |
| Average | 921 (100.0%) | $86,641 |
Occupancy by Householder Income Bracket in Rockville
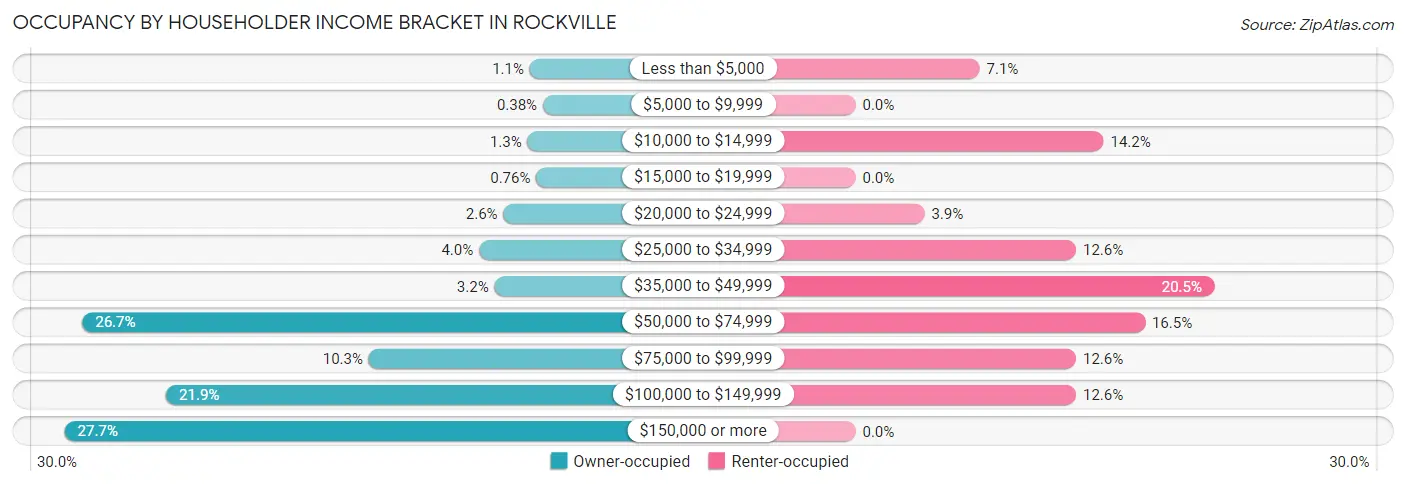
| Income Bracket | Owner-occupied | Renter-occupied |
| Less than $5,000 | 9 (1.1%) | 9 (7.1%) |
| $5,000 to $9,999 | 3 (0.4%) | 0 (0.0%) |
| $10,000 to $14,999 | 10 (1.3%) | 18 (14.2%) |
| $15,000 to $19,999 | 6 (0.8%) | 0 (0.0%) |
| $20,000 to $24,999 | 21 (2.6%) | 5 (3.9%) |
| $25,000 to $34,999 | 32 (4.0%) | 16 (12.6%) |
| $35,000 to $49,999 | 25 (3.2%) | 26 (20.5%) |
| $50,000 to $74,999 | 212 (26.7%) | 21 (16.5%) |
| $75,000 to $99,999 | 82 (10.3%) | 16 (12.6%) |
| $100,000 to $149,999 | 174 (21.9%) | 16 (12.6%) |
| $150,000 or more | 220 (27.7%) | 0 (0.0%) |
| Total | 794 (100.0%) | 127 (100.0%) |
Monthly Housing Cost Tiers in Rockville
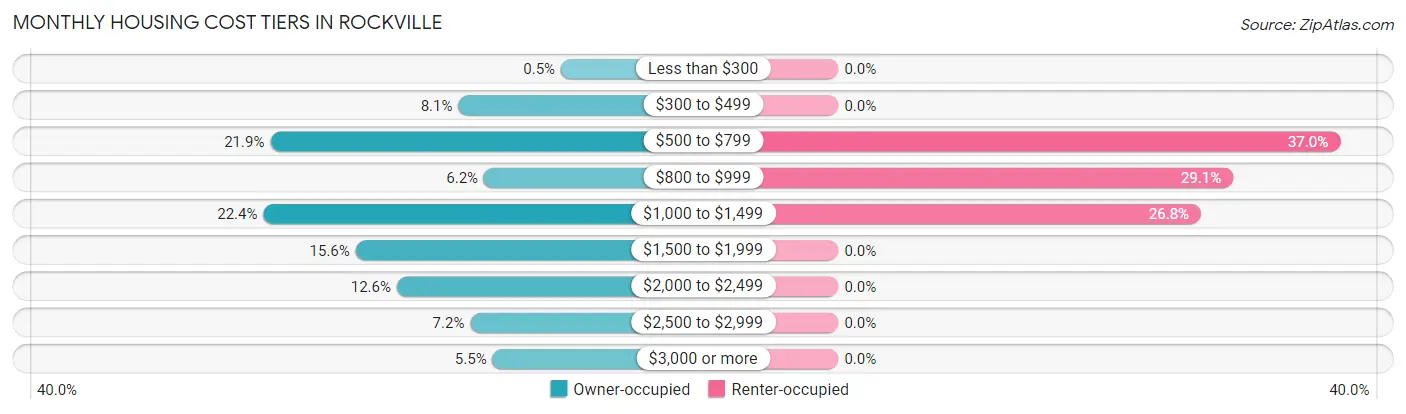
| Monthly Cost | Owner-occupied | Renter-occupied |
| Less than $300 | 4 (0.5%) | 0 (0.0%) |
| $300 to $499 | 64 (8.1%) | 0 (0.0%) |
| $500 to $799 | 174 (21.9%) | 47 (37.0%) |
| $800 to $999 | 49 (6.2%) | 37 (29.1%) |
| $1,000 to $1,499 | 178 (22.4%) | 34 (26.8%) |
| $1,500 to $1,999 | 124 (15.6%) | 0 (0.0%) |
| $2,000 to $2,499 | 100 (12.6%) | 0 (0.0%) |
| $2,500 to $2,999 | 57 (7.2%) | 0 (0.0%) |
| $3,000 or more | 44 (5.5%) | 0 (0.0%) |
| Total | 794 (100.0%) | 127 (100.0%) |
Physical Housing Characteristics in Rockville
Housing Structures in Rockville
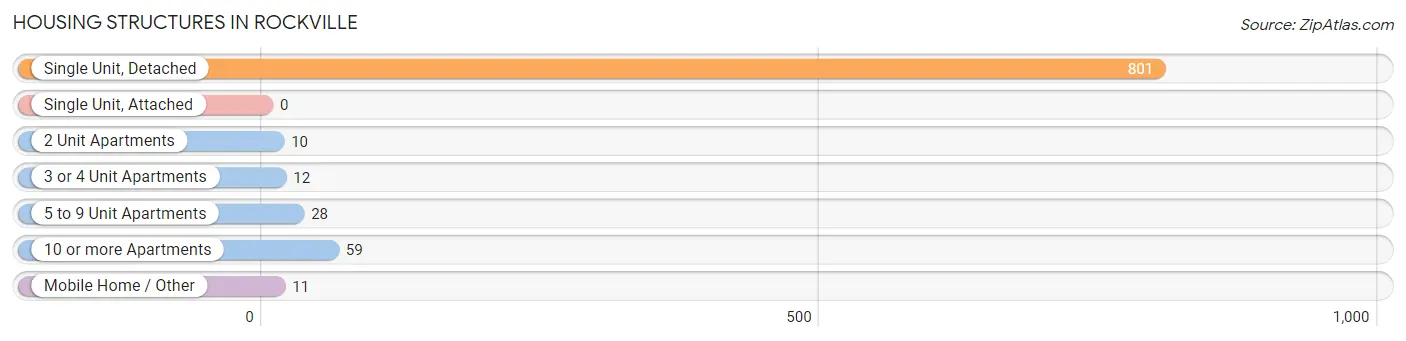
| Structure Type | # Housing Units | % Housing Units |
| Single Unit, Detached | 801 | 87.0% |
| Single Unit, Attached | 0 | 0.0% |
| 2 Unit Apartments | 10 | 1.1% |
| 3 or 4 Unit Apartments | 12 | 1.3% |
| 5 to 9 Unit Apartments | 28 | 3.0% |
| 10 or more Apartments | 59 | 6.4% |
| Mobile Home / Other | 11 | 1.2% |
| Total | 921 | 100.0% |
Housing Structures by Occupancy in Rockville
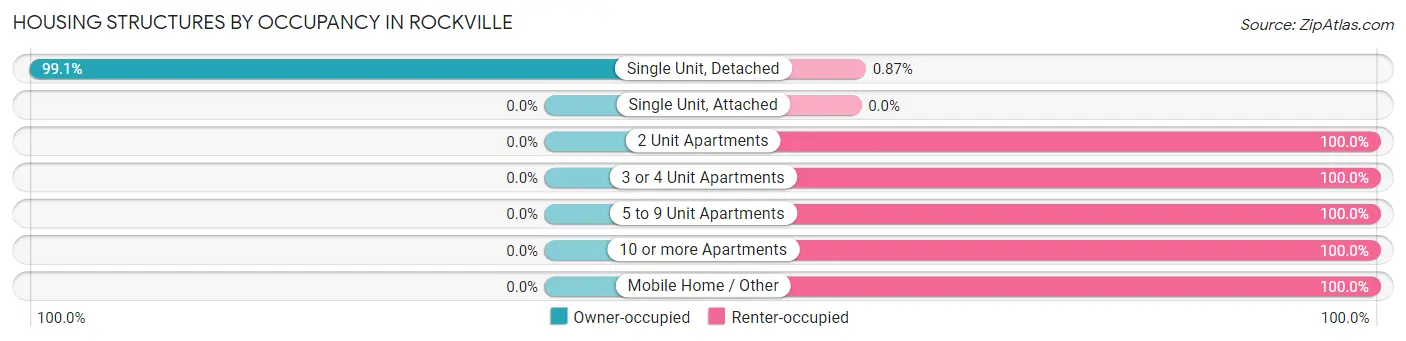
| Structure Type | Owner-occupied | Renter-occupied |
| Single Unit, Detached | 794 (99.1%) | 7 (0.9%) |
| Single Unit, Attached | 0 (0.0%) | 0 (0.0%) |
| 2 Unit Apartments | 0 (0.0%) | 10 (100.0%) |
| 3 or 4 Unit Apartments | 0 (0.0%) | 12 (100.0%) |
| 5 to 9 Unit Apartments | 0 (0.0%) | 28 (100.0%) |
| 10 or more Apartments | 0 (0.0%) | 59 (100.0%) |
| Mobile Home / Other | 0 (0.0%) | 11 (100.0%) |
| Total | 794 (86.2%) | 127 (13.8%) |
Housing Structures by Number of Rooms in Rockville
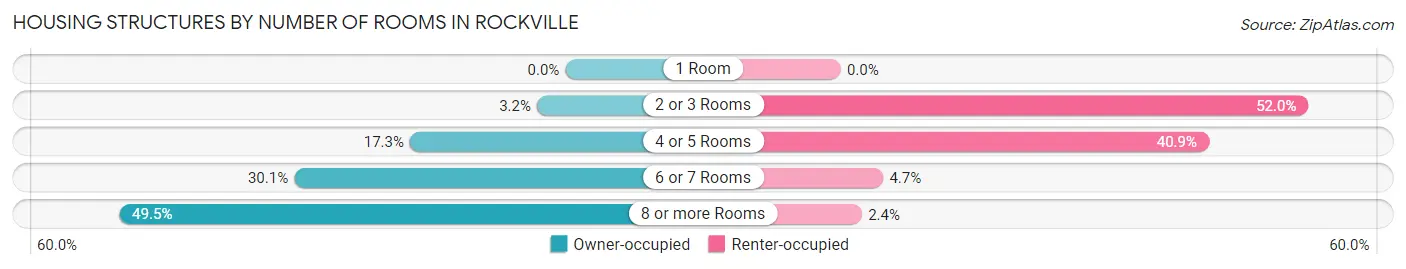
| Number of Rooms | Owner-occupied | Renter-occupied |
| 1 Room | 0 (0.0%) | 0 (0.0%) |
| 2 or 3 Rooms | 25 (3.2%) | 66 (52.0%) |
| 4 or 5 Rooms | 137 (17.2%) | 52 (40.9%) |
| 6 or 7 Rooms | 239 (30.1%) | 6 (4.7%) |
| 8 or more Rooms | 393 (49.5%) | 3 (2.4%) |
| Total | 794 (100.0%) | 127 (100.0%) |
Housing Structure by Heating Type in Rockville
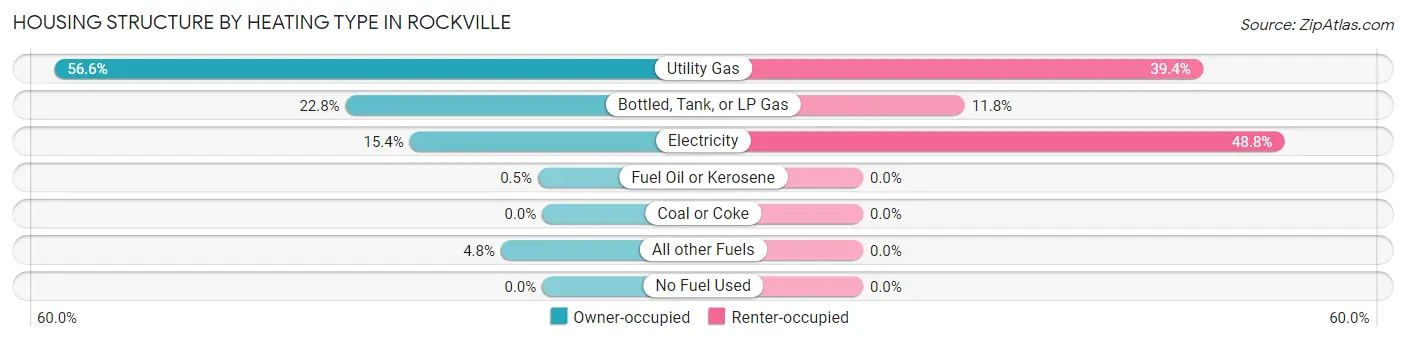
| Heating Type | Owner-occupied | Renter-occupied |
| Utility Gas | 449 (56.6%) | 50 (39.4%) |
| Bottled, Tank, or LP Gas | 181 (22.8%) | 15 (11.8%) |
| Electricity | 122 (15.4%) | 62 (48.8%) |
| Fuel Oil or Kerosene | 4 (0.5%) | 0 (0.0%) |
| Coal or Coke | 0 (0.0%) | 0 (0.0%) |
| All other Fuels | 38 (4.8%) | 0 (0.0%) |
| No Fuel Used | 0 (0.0%) | 0 (0.0%) |
| Total | 794 (100.0%) | 127 (100.0%) |
Household Vehicle Usage in Rockville
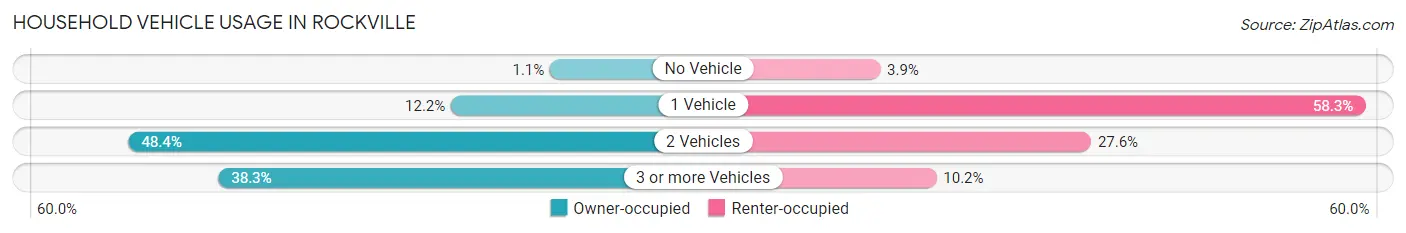
| Vehicles per Household | Owner-occupied | Renter-occupied |
| No Vehicle | 9 (1.1%) | 5 (3.9%) |
| 1 Vehicle | 97 (12.2%) | 74 (58.3%) |
| 2 Vehicles | 384 (48.4%) | 35 (27.6%) |
| 3 or more Vehicles | 304 (38.3%) | 13 (10.2%) |
| Total | 794 (100.0%) | 127 (100.0%) |
Real Estate & Mortgages in Rockville
Real Estate and Mortgage Overview in Rockville
| Characteristic | Without Mortgage | With Mortgage |
| Housing Units | 340 | 454 |
| Median Property Value | $278,000 | $318,600 |
| Median Household Income | $65,556 | $171 |
| Monthly Housing Costs | $677 | $44 |
| Real Estate Taxes | $3,682 | $3 |
Property Value by Mortgage Status in Rockville
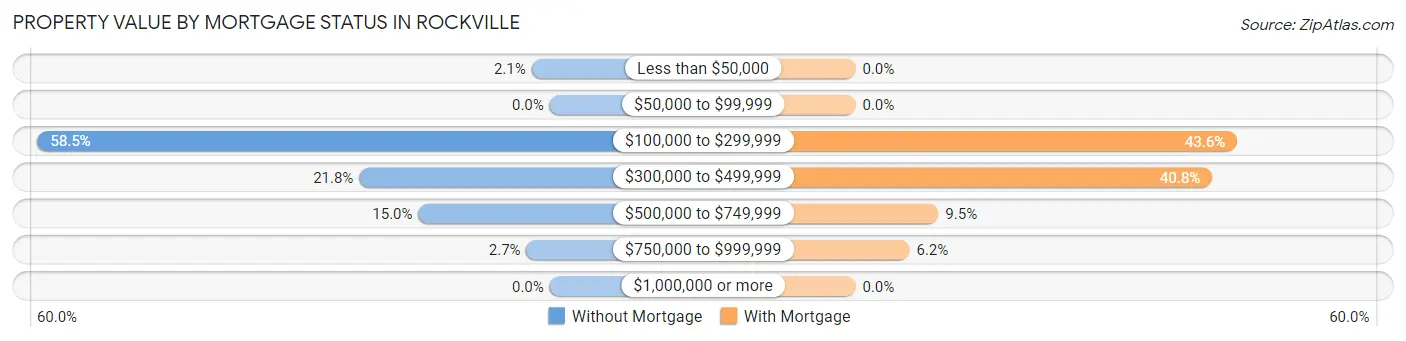
| Property Value | Without Mortgage | With Mortgage |
| Less than $50,000 | 7 (2.1%) | 0 (0.0%) |
| $50,000 to $99,999 | 0 (0.0%) | 0 (0.0%) |
| $100,000 to $299,999 | 199 (58.5%) | 198 (43.6%) |
| $300,000 to $499,999 | 74 (21.8%) | 185 (40.7%) |
| $500,000 to $749,999 | 51 (15.0%) | 43 (9.5%) |
| $750,000 to $999,999 | 9 (2.6%) | 28 (6.2%) |
| $1,000,000 or more | 0 (0.0%) | 0 (0.0%) |
| Total | 340 (100.0%) | 454 (100.0%) |
Household Income by Mortgage Status in Rockville
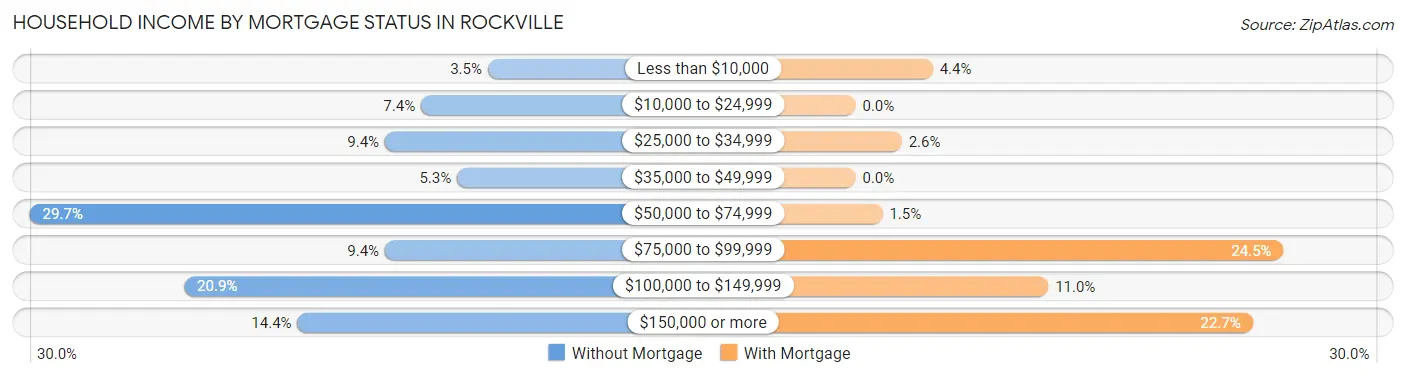
| Household Income | Without Mortgage | With Mortgage |
| Less than $10,000 | 12 (3.5%) | 20 (4.4%) |
| $10,000 to $24,999 | 25 (7.3%) | 0 (0.0%) |
| $25,000 to $34,999 | 32 (9.4%) | 12 (2.6%) |
| $35,000 to $49,999 | 18 (5.3%) | 0 (0.0%) |
| $50,000 to $74,999 | 101 (29.7%) | 7 (1.5%) |
| $75,000 to $99,999 | 32 (9.4%) | 111 (24.4%) |
| $100,000 to $149,999 | 71 (20.9%) | 50 (11.0%) |
| $150,000 or more | 49 (14.4%) | 103 (22.7%) |
| Total | 340 (100.0%) | 454 (100.0%) |
Property Value to Household Income Ratio in Rockville
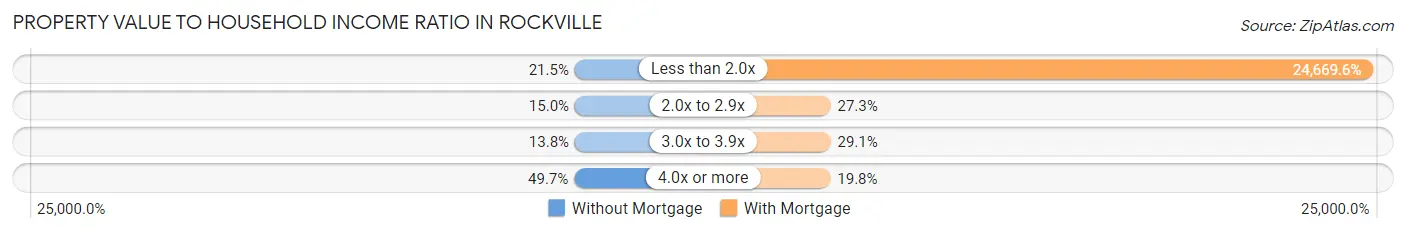
| Value-to-Income Ratio | Without Mortgage | With Mortgage |
| Less than 2.0x | 73 (21.5%) | 112,000 (24,669.6%) |
| 2.0x to 2.9x | 51 (15.0%) | 124 (27.3%) |
| 3.0x to 3.9x | 47 (13.8%) | 132 (29.1%) |
| 4.0x or more | 169 (49.7%) | 90 (19.8%) |
| Total | 340 (100.0%) | 454 (100.0%) |
Real Estate Taxes by Mortgage Status in Rockville
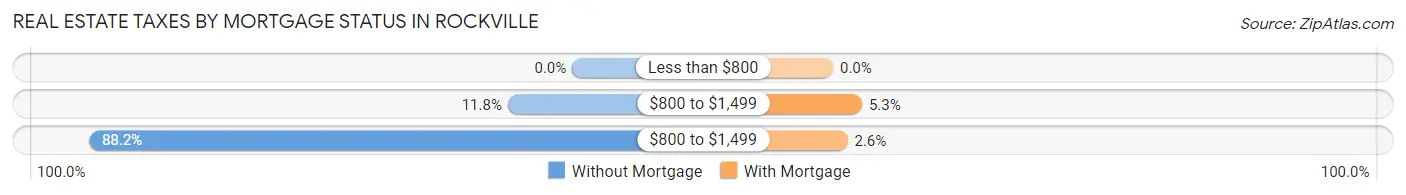
| Property Taxes | Without Mortgage | With Mortgage |
| Less than $800 | 0 (0.0%) | 0 (0.0%) |
| $800 to $1,499 | 40 (11.8%) | 24 (5.3%) |
| $800 to $1,499 | 300 (88.2%) | 12 (2.6%) |
| Total | 340 (100.0%) | 454 (100.0%) |
Health & Disability in Rockville
Health Insurance Coverage by Age in Rockville
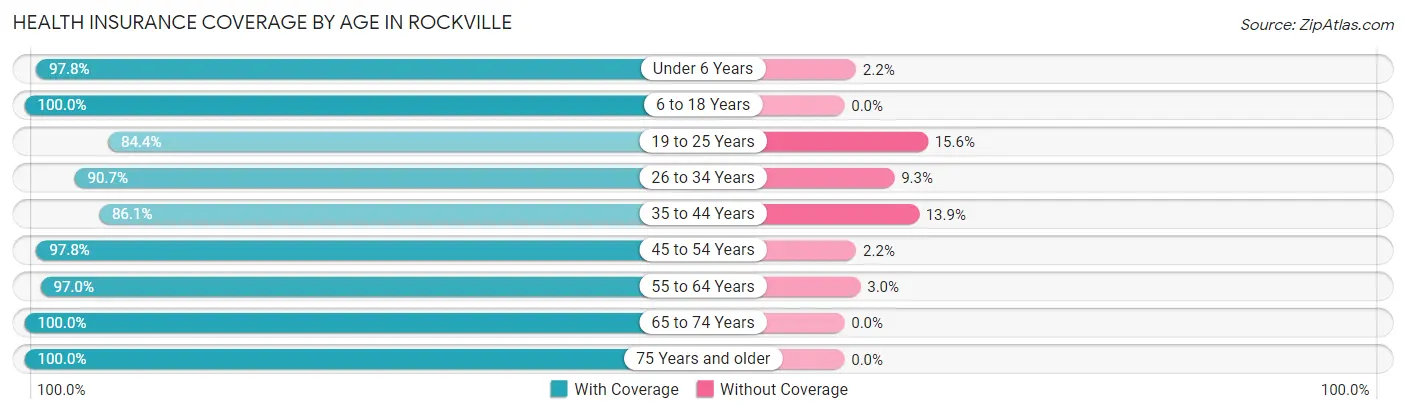
| Age Bracket | With Coverage | Without Coverage |
| Under 6 Years | 181 (97.8%) | 4 (2.2%) |
| 6 to 18 Years | 379 (100.0%) | 0 (0.0%) |
| 19 to 25 Years | 76 (84.4%) | 14 (15.6%) |
| 26 to 34 Years | 224 (90.7%) | 23 (9.3%) |
| 35 to 44 Years | 211 (86.1%) | 34 (13.9%) |
| 45 to 54 Years | 221 (97.8%) | 5 (2.2%) |
| 55 to 64 Years | 456 (97.0%) | 14 (3.0%) |
| 65 to 74 Years | 246 (100.0%) | 0 (0.0%) |
| 75 Years and older | 183 (100.0%) | 0 (0.0%) |
| Total | 2,177 (95.9%) | 94 (4.1%) |
Health Insurance Coverage by Citizenship Status in Rockville
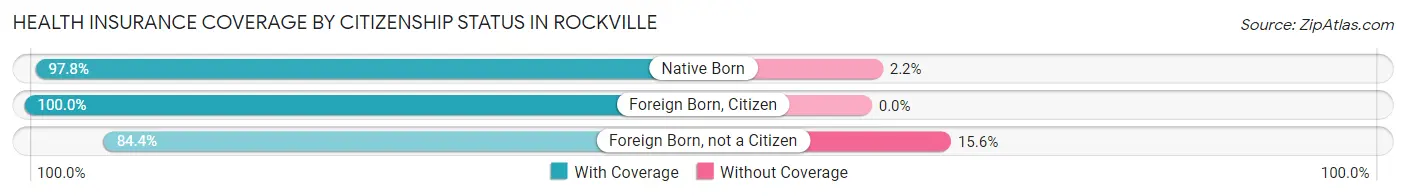
| Citizenship Status | With Coverage | Without Coverage |
| Native Born | 181 (97.8%) | 4 (2.2%) |
| Foreign Born, Citizen | 379 (100.0%) | 0 (0.0%) |
| Foreign Born, not a Citizen | 76 (84.4%) | 14 (15.6%) |
Health Insurance Coverage by Household Income in Rockville
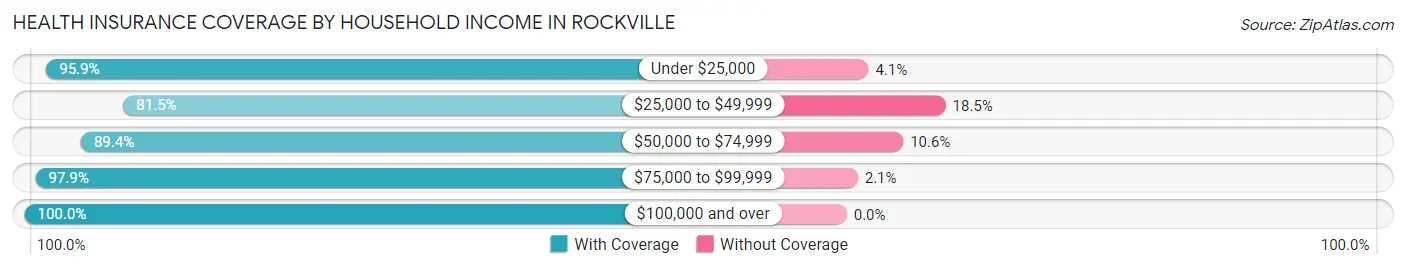
| Household Income | With Coverage | Without Coverage |
| Under $25,000 | 118 (95.9%) | 5 (4.1%) |
| $25,000 to $49,999 | 176 (81.5%) | 40 (18.5%) |
| $50,000 to $74,999 | 364 (89.4%) | 43 (10.6%) |
| $75,000 to $99,999 | 285 (97.9%) | 6 (2.1%) |
| $100,000 and over | 1,234 (100.0%) | 0 (0.0%) |
Public vs Private Health Insurance Coverage by Age in Rockville
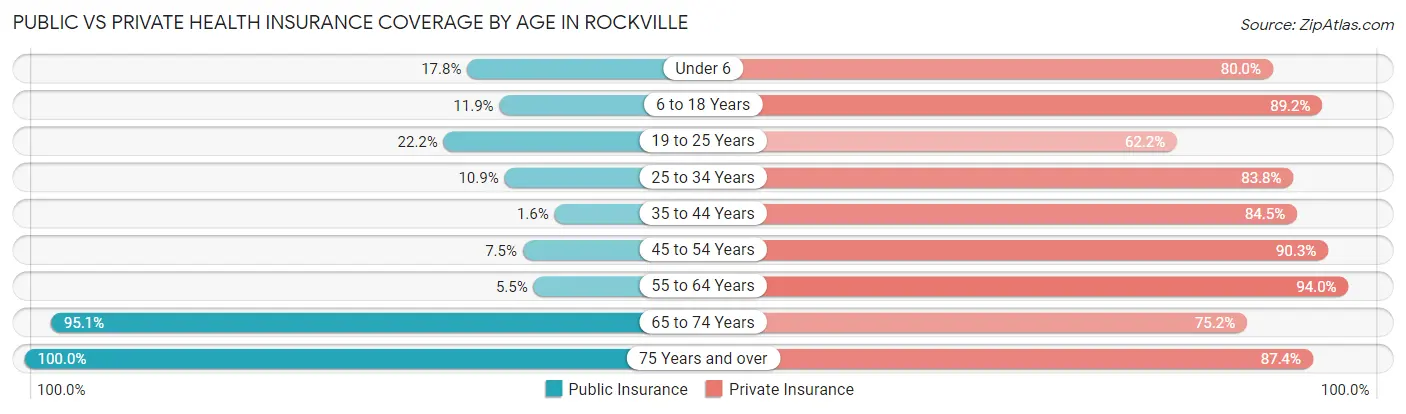
| Age Bracket | Public Insurance | Private Insurance |
| Under 6 | 33 (17.8%) | 148 (80.0%) |
| 6 to 18 Years | 45 (11.9%) | 338 (89.2%) |
| 19 to 25 Years | 20 (22.2%) | 56 (62.2%) |
| 25 to 34 Years | 27 (10.9%) | 207 (83.8%) |
| 35 to 44 Years | 4 (1.6%) | 207 (84.5%) |
| 45 to 54 Years | 17 (7.5%) | 204 (90.3%) |
| 55 to 64 Years | 26 (5.5%) | 442 (94.0%) |
| 65 to 74 Years | 234 (95.1%) | 185 (75.2%) |
| 75 Years and over | 183 (100.0%) | 160 (87.4%) |
| Total | 589 (25.9%) | 1,947 (85.7%) |
Disability Status by Sex by Age in Rockville
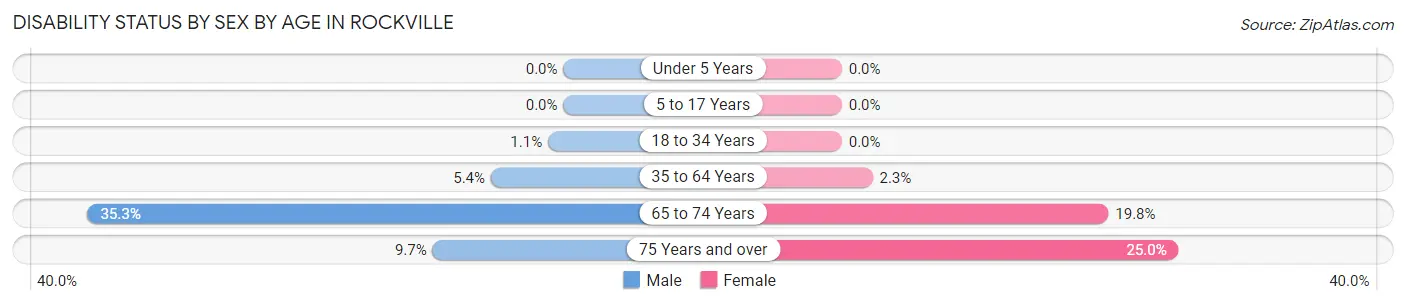
| Age Bracket | Male | Female |
| Under 5 Years | 0 (0.0%) | 0 (0.0%) |
| 5 to 17 Years | 0 (0.0%) | 0 (0.0%) |
| 18 to 34 Years | 2 (1.1%) | 0 (0.0%) |
| 35 to 64 Years | 27 (5.4%) | 10 (2.3%) |
| 65 to 74 Years | 53 (35.3%) | 19 (19.8%) |
| 75 Years and over | 10 (9.7%) | 20 (25.0%) |
Disability Class by Sex by Age in Rockville
Disability Class: Hearing Difficulty
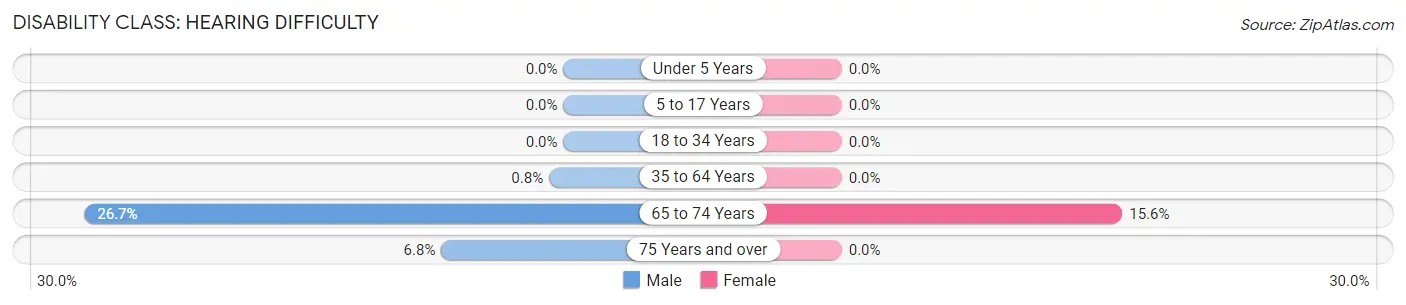
| Age Bracket | Male | Female |
| Under 5 Years | 0 (0.0%) | 0 (0.0%) |
| 5 to 17 Years | 0 (0.0%) | 0 (0.0%) |
| 18 to 34 Years | 0 (0.0%) | 0 (0.0%) |
| 35 to 64 Years | 4 (0.8%) | 0 (0.0%) |
| 65 to 74 Years | 40 (26.7%) | 15 (15.6%) |
| 75 Years and over | 7 (6.8%) | 0 (0.0%) |
Disability Class: Vision Difficulty
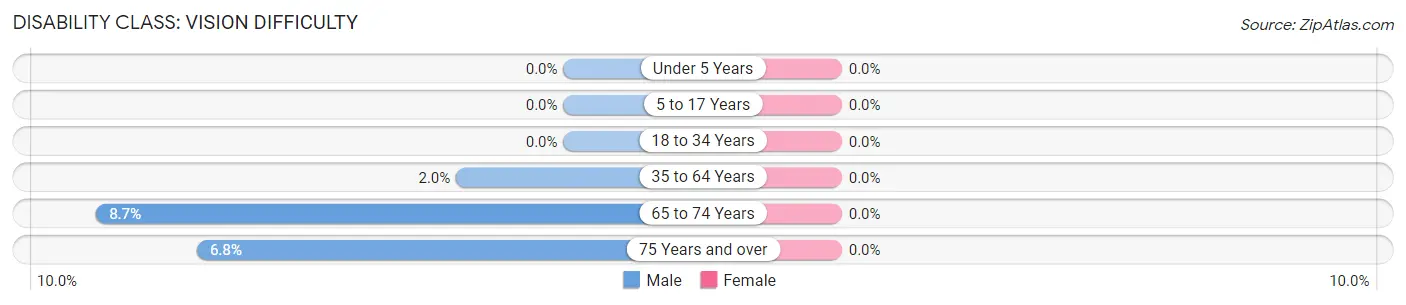
| Age Bracket | Male | Female |
| Under 5 Years | 0 (0.0%) | 0 (0.0%) |
| 5 to 17 Years | 0 (0.0%) | 0 (0.0%) |
| 18 to 34 Years | 0 (0.0%) | 0 (0.0%) |
| 35 to 64 Years | 10 (2.0%) | 0 (0.0%) |
| 65 to 74 Years | 13 (8.7%) | 0 (0.0%) |
| 75 Years and over | 7 (6.8%) | 0 (0.0%) |
Disability Class: Cognitive Difficulty
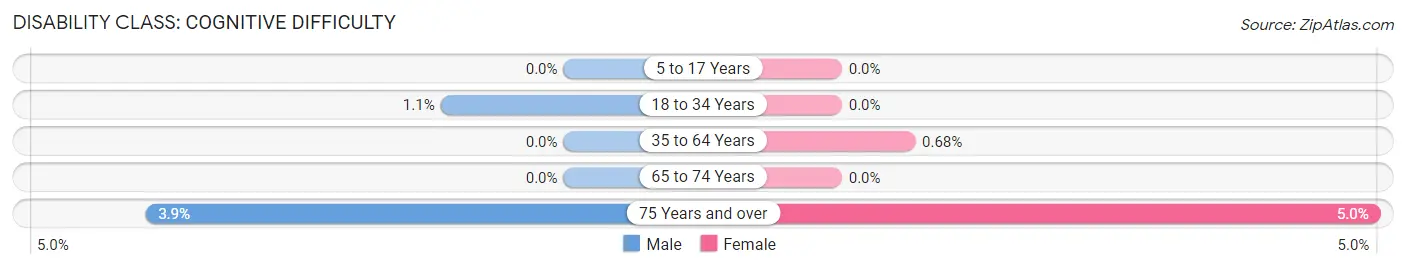
| Age Bracket | Male | Female |
| 5 to 17 Years | 0 (0.0%) | 0 (0.0%) |
| 18 to 34 Years | 2 (1.1%) | 0 (0.0%) |
| 35 to 64 Years | 0 (0.0%) | 3 (0.7%) |
| 65 to 74 Years | 0 (0.0%) | 0 (0.0%) |
| 75 Years and over | 4 (3.9%) | 4 (5.0%) |
Disability Class: Ambulatory Difficulty
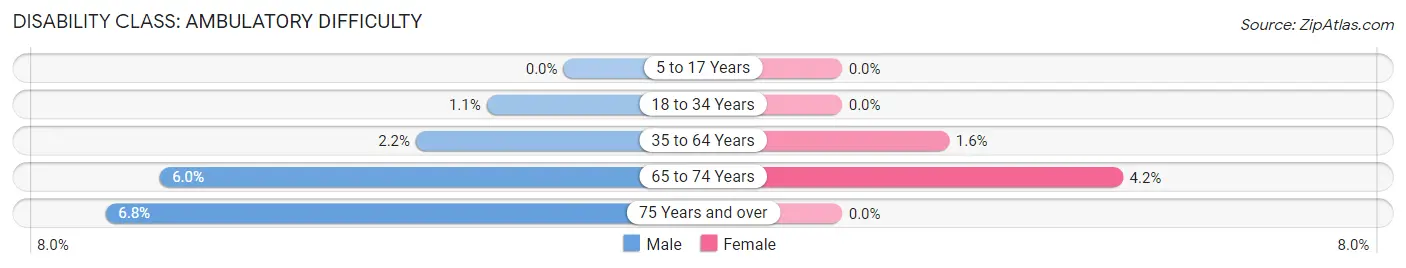
| Age Bracket | Male | Female |
| 5 to 17 Years | 0 (0.0%) | 0 (0.0%) |
| 18 to 34 Years | 2 (1.1%) | 0 (0.0%) |
| 35 to 64 Years | 11 (2.2%) | 7 (1.6%) |
| 65 to 74 Years | 9 (6.0%) | 4 (4.2%) |
| 75 Years and over | 7 (6.8%) | 0 (0.0%) |
Disability Class: Self-Care Difficulty
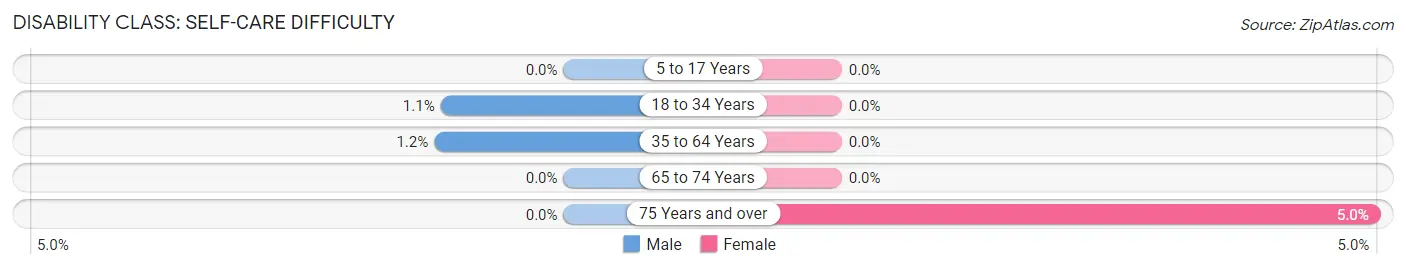
| Age Bracket | Male | Female |
| 5 to 17 Years | 0 (0.0%) | 0 (0.0%) |
| 18 to 34 Years | 2 (1.1%) | 0 (0.0%) |
| 35 to 64 Years | 6 (1.2%) | 0 (0.0%) |
| 65 to 74 Years | 0 (0.0%) | 0 (0.0%) |
| 75 Years and over | 0 (0.0%) | 4 (5.0%) |
Technology Access in Rockville
Computing Device Access in Rockville
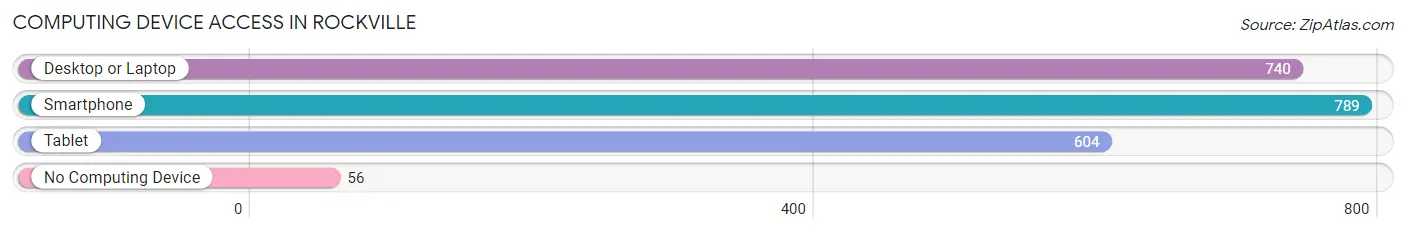
| Device Type | # Households | % Households |
| Desktop or Laptop | 740 | 80.3% |
| Smartphone | 789 | 85.7% |
| Tablet | 604 | 65.6% |
| No Computing Device | 56 | 6.1% |
| Total | 921 | 100.0% |
Internet Access in Rockville
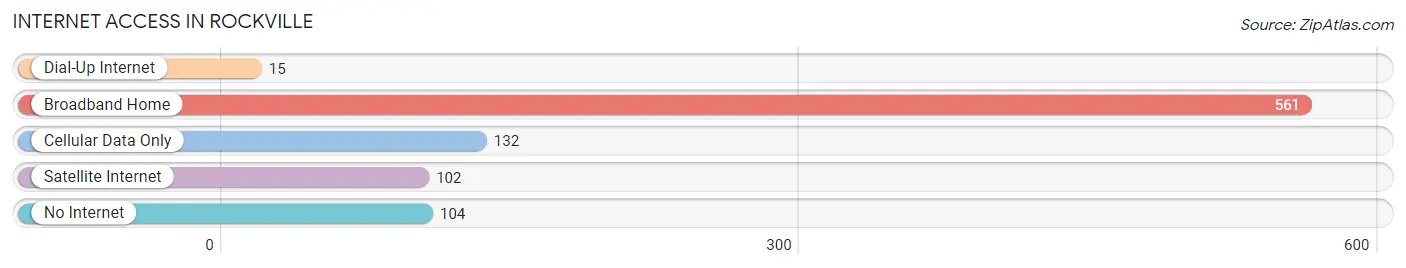
| Internet Type | # Households | % Households |
| Dial-Up Internet | 15 | 1.6% |
| Broadband Home | 561 | 60.9% |
| Cellular Data Only | 132 | 14.3% |
| Satellite Internet | 102 | 11.1% |
| No Internet | 104 | 11.3% |
| Total | 921 | 100.0% |
Rockville Summary
Rockville, Minnesota is a small city located in the southeastern corner of Stearns County, Minnesota. It is situated on the banks of the Sauk River, and is part of the St. Cloud Metropolitan Statistical Area. The city has a population of 1,845 as of the 2010 census, and is the county seat of Stearns County.
History
Rockville was founded in 1856 by a group of settlers from Wisconsin. The city was named after the rocky terrain of the area, and was originally known as Rockville Station. The city was incorporated in 1872, and was the first city in Stearns County to be incorporated.
The city was an important stop on the St. Cloud and Sioux City Railroad, which ran from St. Cloud to Sioux City, Iowa. The railroad was a major factor in the growth of the city, and it was the first city in Stearns County to have a railroad station.
The city was also an important stop on the Great Northern Railway, which ran from St. Cloud to Duluth. The railroad was a major factor in the growth of the city, and it was the first city in Stearns County to have a railroad station.
Geography
Rockville is located in the southeastern corner of Stearns County, Minnesota. It is situated on the banks of the Sauk River, and is part of the St. Cloud Metropolitan Statistical Area. The city has a total area of 1.2 square miles, all of which is land.
The city is located in a rural area, and is surrounded by farmland and wooded areas. The city is located approximately 25 miles from St. Cloud, and is about an hour and a half drive from Minneapolis.
Economy
The economy of Rockville is largely based on agriculture and tourism. The city is home to several farms, and the surrounding area is known for its dairy and beef production. The city is also home to several small businesses, including restaurants, retail stores, and service providers.
The city is also a popular tourist destination, and is home to several attractions, including the Rockville Historical Society Museum, the Rockville Dam, and the Rockville State Park. The city is also home to several festivals and events throughout the year, including the Rockville Days Festival and the Rockville Summerfest.
Demographics
As of the 2010 census, the city had a population of 1,845. The racial makeup of the city was 97.3% White, 0.3% African American, 0.2% Native American, 0.4% Asian, 0.1% Pacific Islander, 0.7% from other races, and 0.9% from two or more races. Hispanic or Latino of any race were 1.7% of the population.
The median income for a household in the city was $45,938, and the median income for a family was $51,938. The per capita income for the city was $20,938. About 8.3% of families and 10.2% of the population were below the poverty line, including 14.3% of those under age 18 and 8.2% of those age 65 or over.
Rockville is a small city with a rich history and a vibrant economy. The city is home to several farms and businesses, and is a popular tourist destination. The city has a diverse population, and is a great place to live and work.
Common Questions
What is Per Capita Income in Rockville?
Per Capita income in Rockville is $44,072.
What is the Median Family Income in Rockville?
Median Family Income in Rockville is $107,885.
What is the Median Household income in Rockville?
Median Household Income in Rockville is $86,641.
What is Income or Wage Gap in Rockville?
Income or Wage Gap in Rockville is 35.2%.
Women in Rockville earn 64.8 cents for every dollar earned by a man.
What is Inequality or Gini Index in Rockville?
Inequality or Gini Index in Rockville is 0.39.
What is the Total Population of Rockville?
Total Population of Rockville is 2,271.
What is the Total Male Population of Rockville?
Total Male Population of Rockville is 1,172.
What is the Total Female Population of Rockville?
Total Female Population of Rockville is 1,099.
What is the Ratio of Males per 100 Females in Rockville?
There are 106.64 Males per 100 Females in Rockville.
What is the Ratio of Females per 100 Males in Rockville?
There are 93.77 Females per 100 Males in Rockville.
What is the Median Population Age in Rockville?
Median Population Age in Rockville is 44.7 Years.
What is the Average Family Size in Rockville
Average Family Size in Rockville is 2.9 People.
What is the Average Household Size in Rockville
Average Household Size in Rockville is 2.5 People.
How Large is the Labor Force in Rockville?
There are 1,214 People in the Labor Forcein in Rockville.
What is the Percentage of People in the Labor Force in Rockville?
66.9% of People are in the Labor Force in Rockville.
What is the Unemployment Rate in Rockville?
Unemployment Rate in Rockville is 1.1%.