Montevideo, MN Map & Demographics
Montevideo Map
Montevideo Overview
$28,170
PER CAPITA INCOME
$66,694
AVG FAMILY INCOME
$49,435
AVG HOUSEHOLD INCOME
25.1%
WAGE / INCOME GAP [ % ]
74.9¢/ $1
WAGE / INCOME GAP [ $ ]
0.42
INEQUALITY / GINI INDEX
5,350
TOTAL POPULATION
2,801
MALE POPULATION
2,549
FEMALE POPULATION
109.89
MALES / 100 FEMALES
91.00
FEMALES / 100 MALES
42.0
MEDIAN AGE
3.1
AVG FAMILY SIZE
2.2
AVG HOUSEHOLD SIZE
2,610
LABOR FORCE [ PEOPLE ]
60.8%
PERCENT IN LABOR FORCE
4.2%
UNEMPLOYMENT RATE
Montevideo Zip Codes
Montevideo Area Codes
Income in Montevideo
Income Overview in Montevideo
Per Capita Income in Montevideo is $28,170, while median incomes of families and households are $66,694 and $49,435 respectively.
| Characteristic | Number | Measure |
| Per Capita Income | 5,350 | $28,170 |
| Median Family Income | 1,194 | $66,694 |
| Mean Family Income | 1,194 | $82,807 |
| Median Household Income | 2,342 | $49,435 |
| Mean Household Income | 2,342 | $62,365 |
| Income Deficit | 1,194 | $0 |
| Wage / Income Gap (%) | 5,350 | 25.06% |
| Wage / Income Gap ($) | 5,350 | 74.94¢ per $1 |
| Gini / Inequality Index | 5,350 | 0.42 |
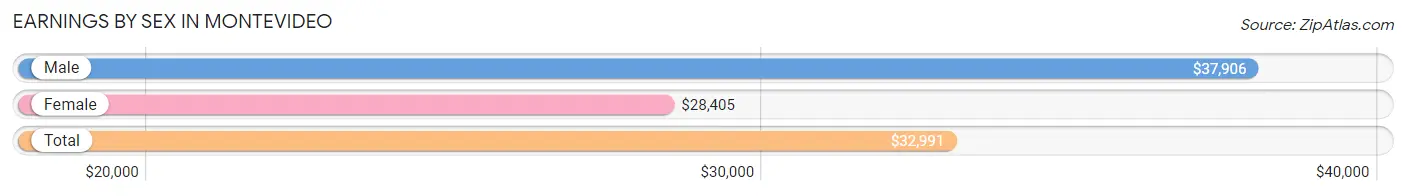
Earnings by Sex in Montevideo
Average Earnings in Montevideo are $32,991, $37,906 for men and $28,405 for women, a difference of 25.1%.
| Sex | Number | Average Earnings |
| Male | 1,692 (58.2%) | $37,906 |
| Female | 1,216 (41.8%) | $28,405 |
| Total | 2,908 (100.0%) | $32,991 |
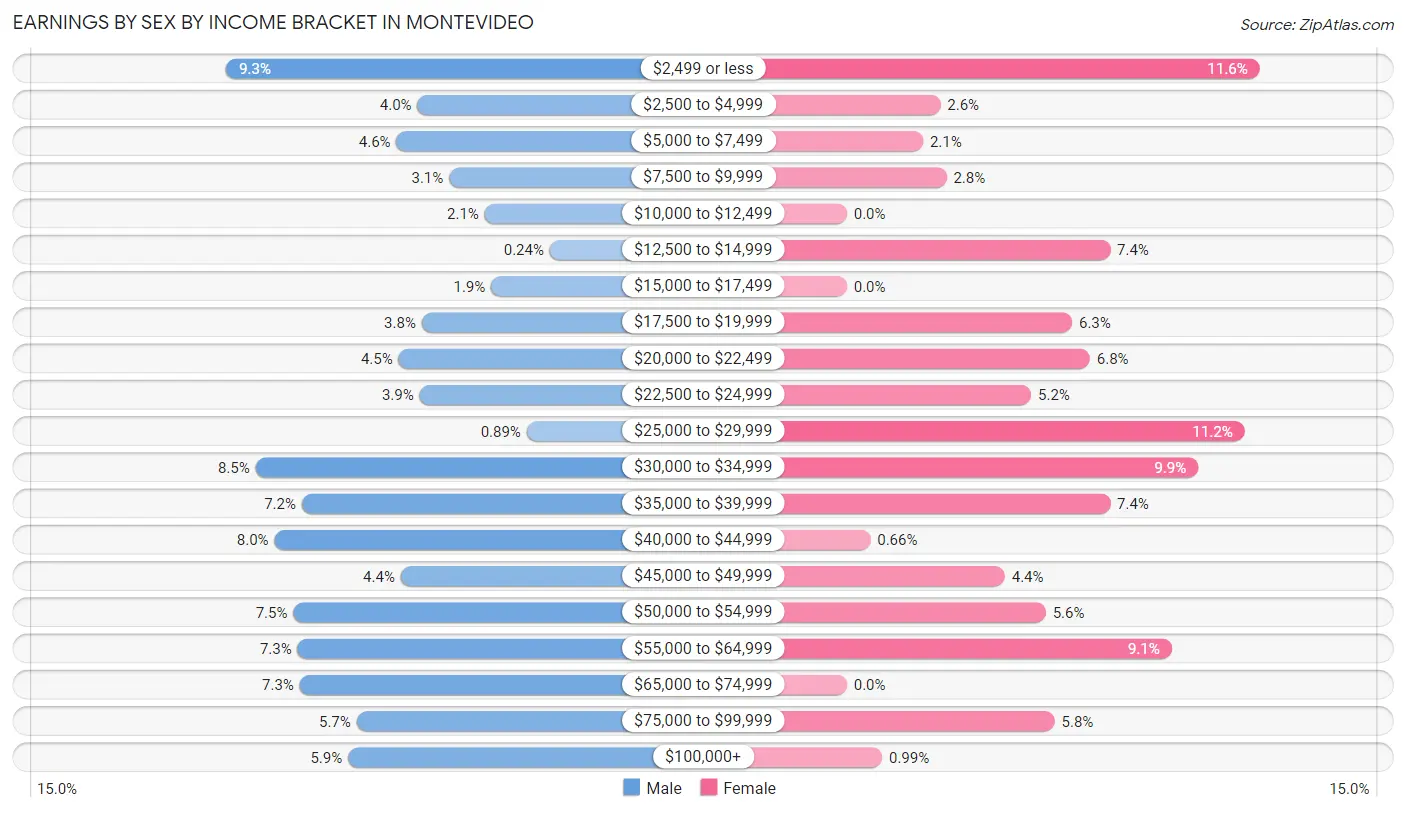
Earnings by Sex by Income Bracket in Montevideo
The most common earnings brackets in Montevideo are $2,499 or less for men (158 | 9.3%) and $2,499 or less for women (141 | 11.6%).
| Income | Male | Female |
| $2,499 or less | 158 (9.3%) | 141 (11.6%) |
| $2,500 to $4,999 | 67 (4.0%) | 32 (2.6%) |
| $5,000 to $7,499 | 77 (4.5%) | 26 (2.1%) |
| $7,500 to $9,999 | 52 (3.1%) | 34 (2.8%) |
| $10,000 to $12,499 | 35 (2.1%) | 0 (0.0%) |
| $12,500 to $14,999 | 4 (0.2%) | 90 (7.4%) |
| $15,000 to $17,499 | 32 (1.9%) | 0 (0.0%) |
| $17,500 to $19,999 | 65 (3.8%) | 77 (6.3%) |
| $20,000 to $22,499 | 76 (4.5%) | 83 (6.8%) |
| $22,500 to $24,999 | 66 (3.9%) | 63 (5.2%) |
| $25,000 to $29,999 | 15 (0.9%) | 136 (11.2%) |
| $30,000 to $34,999 | 144 (8.5%) | 120 (9.9%) |
| $35,000 to $39,999 | 122 (7.2%) | 90 (7.4%) |
| $40,000 to $44,999 | 135 (8.0%) | 8 (0.7%) |
| $45,000 to $49,999 | 75 (4.4%) | 54 (4.4%) |
| $50,000 to $54,999 | 126 (7.4%) | 68 (5.6%) |
| $55,000 to $64,999 | 124 (7.3%) | 111 (9.1%) |
| $65,000 to $74,999 | 123 (7.3%) | 0 (0.0%) |
| $75,000 to $99,999 | 96 (5.7%) | 71 (5.8%) |
| $100,000+ | 100 (5.9%) | 12 (1.0%) |
| Total | 1,692 (100.0%) | 1,216 (100.0%) |
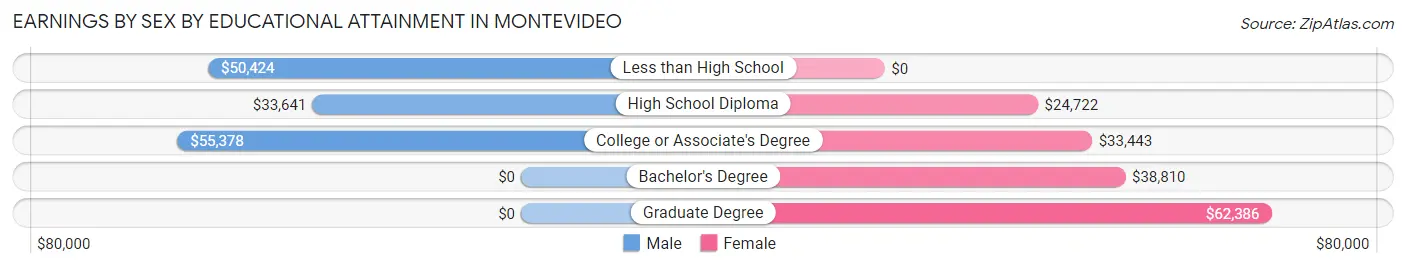
Earnings by Sex by Educational Attainment in Montevideo
Average earnings in Montevideo are $43,811 for men and $29,925 for women, a difference of 31.7%. Men with an educational attainment of college or associate's degree enjoy the highest average annual earnings of $55,378, while those with high school diploma education earn the least with $33,641. Women with an educational attainment of graduate degree earn the most with the average annual earnings of $62,386, while those with high school diploma education have the smallest earnings of $24,722.
| Educational Attainment | Male Income | Female Income |
| Less than High School | $50,424 | $0 |
| High School Diploma | $33,641 | $24,722 |
| College or Associate's Degree | $55,378 | $33,443 |
| Bachelor's Degree | - | - |
| Graduate Degree | - | - |
| Total | $43,811 | $29,925 |
Family Income in Montevideo
Family Income Brackets in Montevideo
According to the Montevideo family income data, there are 214 families falling into the $35,000 to $49,999 income range, which is the most common income bracket and makes up 17.9% of all families.
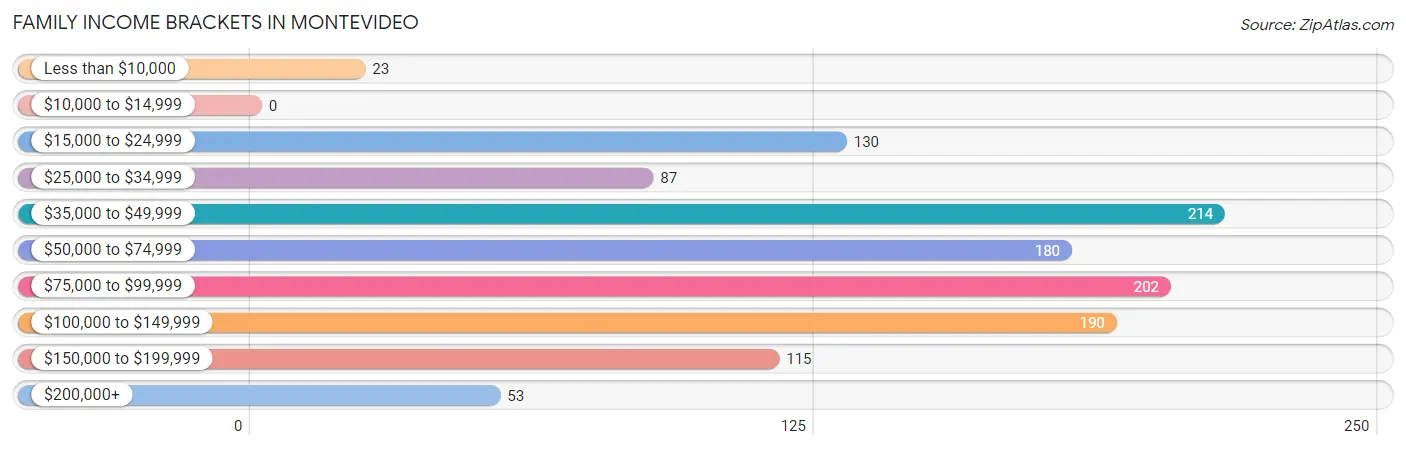
| Income Bracket | # Families | % Families |
| Less than $10,000 | 23 | 1.9% |
| $10,000 to $14,999 | 0 | 0.0% |
| $15,000 to $24,999 | 130 | 10.9% |
| $25,000 to $34,999 | 87 | 7.3% |
| $35,000 to $49,999 | 214 | 17.9% |
| $50,000 to $74,999 | 180 | 15.1% |
| $75,000 to $99,999 | 202 | 16.9% |
| $100,000 to $149,999 | 190 | 15.9% |
| $150,000 to $199,999 | 115 | 9.6% |
| $200,000+ | 53 | 4.4% |
Family Income by Famaliy Size in Montevideo
6-person families (44 | 3.7%) account for the highest median family income in Montevideo with $98,696 per family, while 2-person families (592 | 49.6%) have the highest median income of $38,844 per family member.
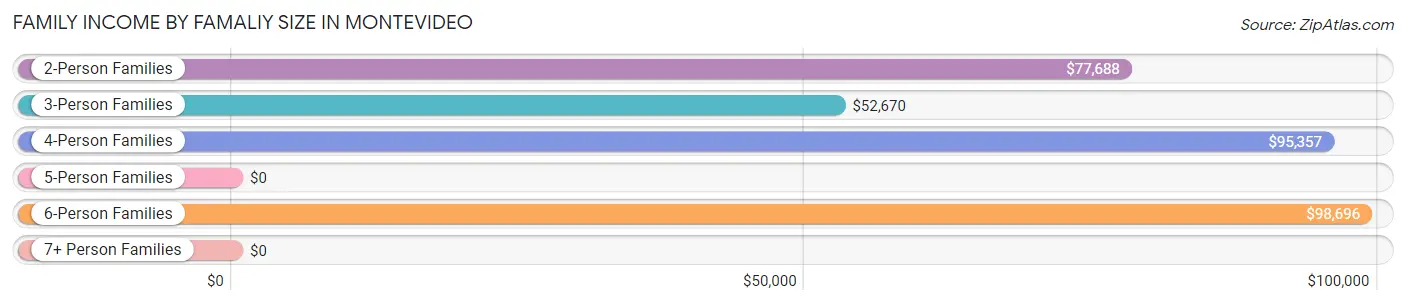
| Income Bracket | # Families | Median Income |
| 2-Person Families | 592 (49.6%) | $77,688 |
| 3-Person Families | 243 (20.3%) | $52,670 |
| 4-Person Families | 200 (16.8%) | $95,357 |
| 5-Person Families | 115 (9.6%) | $0 |
| 6-Person Families | 44 (3.7%) | $98,696 |
| 7+ Person Families | 0 (0.0%) | $0 |
| Total | 1,194 (100.0%) | $66,694 |
Family Income by Number of Earners in Montevideo
The median family income in Montevideo is $66,694, with families comprising 3+ earners (196) having the highest median family income of $146,250, while families with 1 earner (343) have the lowest median family income of $42,165, accounting for 16.4% and 28.7% of families, respectively.
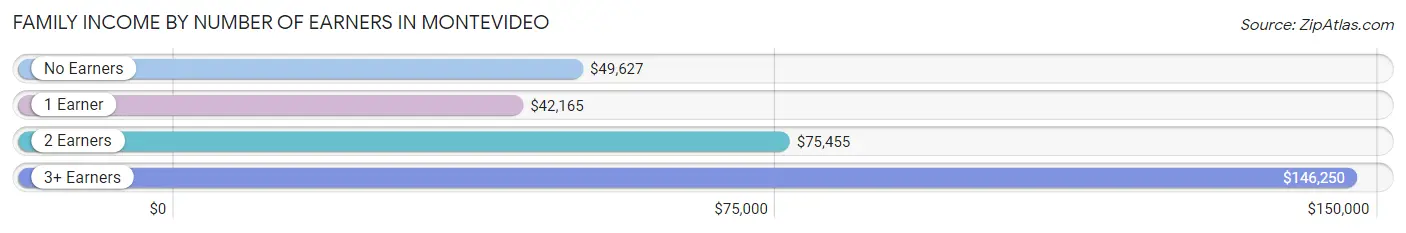
| Number of Earners | # Families | Median Income |
| No Earners | 235 (19.7%) | $49,627 |
| 1 Earner | 343 (28.7%) | $42,165 |
| 2 Earners | 420 (35.2%) | $75,455 |
| 3+ Earners | 196 (16.4%) | $146,250 |
| Total | 1,194 (100.0%) | $66,694 |
Household Income in Montevideo
Household Income Brackets in Montevideo
With 438 households falling in the category, the $50,000 to $74,999 income range is the most frequent in Montevideo, accounting for 18.7% of all households. In contrast, only 54 households (2.3%) fall into the $200,000+ income bracket, making it the least populous group.
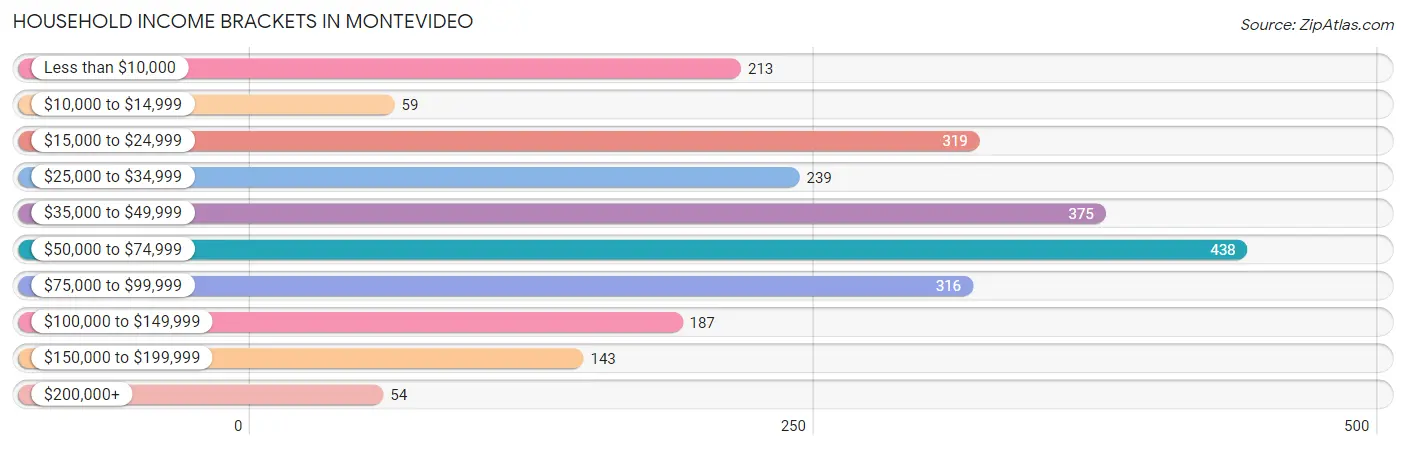
| Income Bracket | # Households | % Households |
| Less than $10,000 | 213 | 9.1% |
| $10,000 to $14,999 | 59 | 2.5% |
| $15,000 to $24,999 | 319 | 13.6% |
| $25,000 to $34,999 | 239 | 10.2% |
| $35,000 to $49,999 | 375 | 16.0% |
| $50,000 to $74,999 | 438 | 18.7% |
| $75,000 to $99,999 | 316 | 13.5% |
| $100,000 to $149,999 | 187 | 8.0% |
| $150,000 to $199,999 | 143 | 6.1% |
| $200,000+ | 54 | 2.3% |
Household Income by Householder Age in Montevideo
The median household income in Montevideo is $49,435, with the highest median household income of $63,965 found in the 25 to 44 years age bracket for the primary householder. A total of 653 households (27.9%) fall into this category. Meanwhile, the 15 to 24 years age bracket for the primary householder has the lowest median household income of $0, with 134 households (5.7%) in this group.
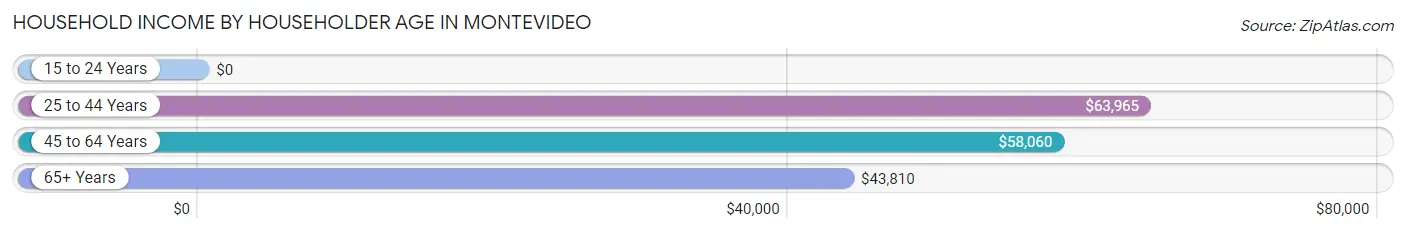
| Income Bracket | # Households | Median Income |
| 15 to 24 Years | 134 (5.7%) | $0 |
| 25 to 44 Years | 653 (27.9%) | $63,965 |
| 45 to 64 Years | 795 (34.0%) | $58,060 |
| 65+ Years | 760 (32.5%) | $43,810 |
| Total | 2,342 (100.0%) | $49,435 |
Poverty in Montevideo
Income Below Poverty by Sex and Age in Montevideo
With 11.8% poverty level for males and 20.5% for females among the residents of Montevideo, 16 and 17 year old males and 18 to 24 year old females are the most vulnerable to poverty, with 71 males (45.5%) and 81 females (82.7%) in their respective age groups living below the poverty level.
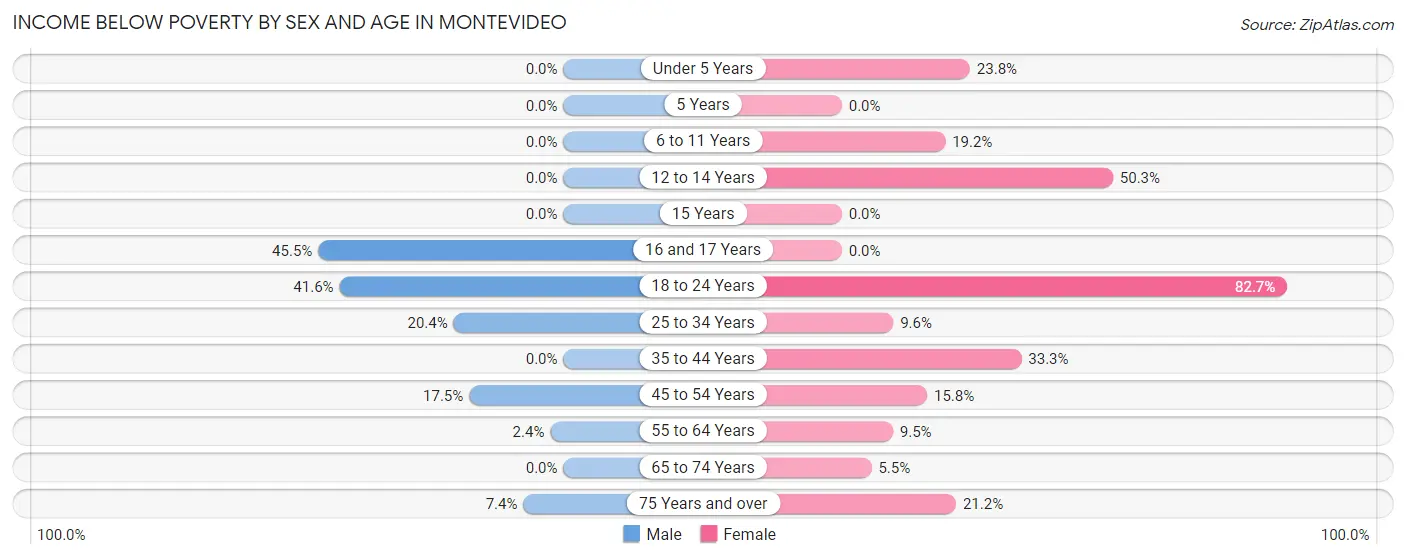
| Age Bracket | Male | Female |
| Under 5 Years | 0 (0.0%) | 34 (23.8%) |
| 5 Years | 0 (0.0%) | 0 (0.0%) |
| 6 to 11 Years | 0 (0.0%) | 38 (19.2%) |
| 12 to 14 Years | 0 (0.0%) | 82 (50.3%) |
| 15 Years | 0 (0.0%) | 0 (0.0%) |
| 16 and 17 Years | 71 (45.5%) | 0 (0.0%) |
| 18 to 24 Years | 111 (41.6%) | 81 (82.7%) |
| 25 to 34 Years | 75 (20.4%) | 30 (9.6%) |
| 35 to 44 Years | 0 (0.0%) | 74 (33.3%) |
| 45 to 54 Years | 39 (17.5%) | 44 (15.8%) |
| 55 to 64 Years | 10 (2.4%) | 31 (9.5%) |
| 65 to 74 Years | 0 (0.0%) | 12 (5.5%) |
| 75 Years and over | 16 (7.4%) | 82 (21.2%) |
| Total | 322 (11.8%) | 508 (20.5%) |
Income Above Poverty by Sex and Age in Montevideo
According to the poverty statistics in Montevideo, males aged under 5 years and females aged 5 years are the age groups that are most secure financially, with 100.0% of males and 100.0% of females in these age groups living above the poverty line.
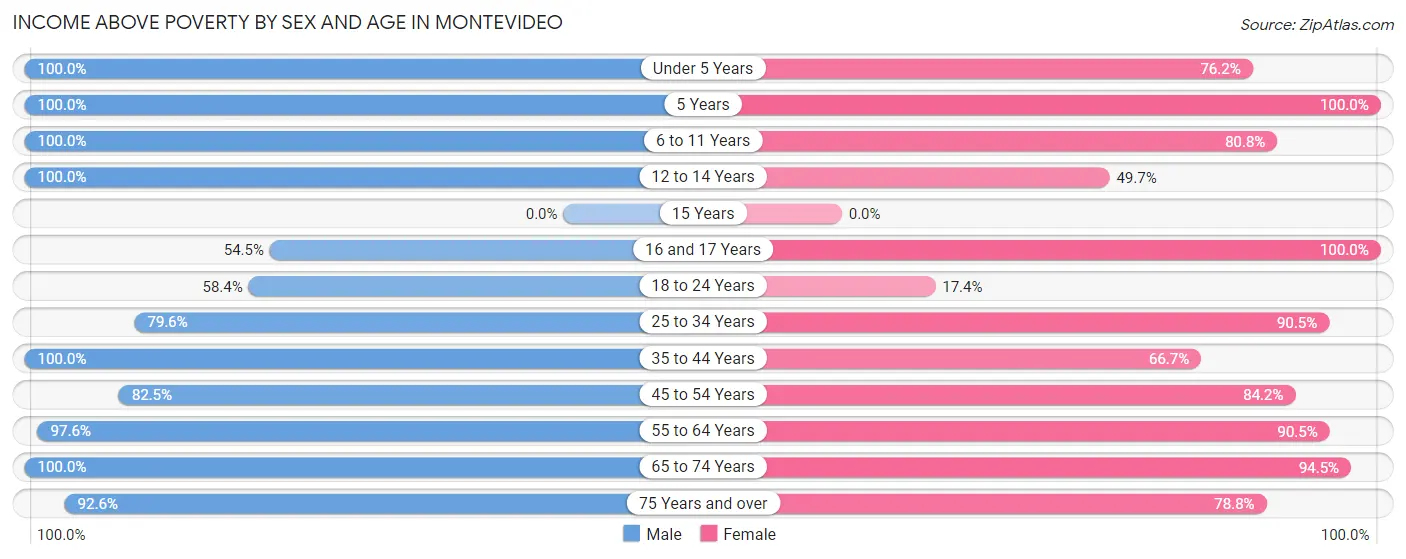
| Age Bracket | Male | Female |
| Under 5 Years | 182 (100.0%) | 109 (76.2%) |
| 5 Years | 24 (100.0%) | 44 (100.0%) |
| 6 to 11 Years | 144 (100.0%) | 160 (80.8%) |
| 12 to 14 Years | 155 (100.0%) | 81 (49.7%) |
| 15 Years | 0 (0.0%) | 0 (0.0%) |
| 16 and 17 Years | 85 (54.5%) | 82 (100.0%) |
| 18 to 24 Years | 156 (58.4%) | 17 (17.3%) |
| 25 to 34 Years | 293 (79.6%) | 284 (90.4%) |
| 35 to 44 Years | 355 (100.0%) | 148 (66.7%) |
| 45 to 54 Years | 184 (82.5%) | 234 (84.2%) |
| 55 to 64 Years | 401 (97.6%) | 296 (90.5%) |
| 65 to 74 Years | 237 (100.0%) | 206 (94.5%) |
| 75 Years and over | 199 (92.6%) | 305 (78.8%) |
| Total | 2,415 (88.2%) | 1,966 (79.5%) |
Income Below Poverty Among Married-Couple Families in Montevideo
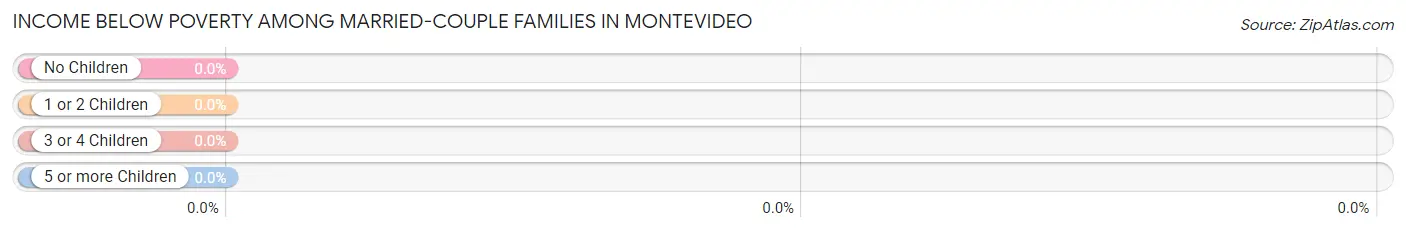
| Children | Above Poverty | Below Poverty |
| No Children | 477 (100.0%) | 0 (0.0%) |
| 1 or 2 Children | 296 (100.0%) | 0 (0.0%) |
| 3 or 4 Children | 66 (100.0%) | 0 (0.0%) |
| 5 or more Children | 0 (0.0%) | 0 (0.0%) |
| Total | 839 (100.0%) | 0 (0.0%) |
Income Below Poverty Among Single-Parent Households in Montevideo
According to the poverty data in Montevideo, 29.3% or 36 single-father households and 44.4% or 103 single-mother households are living below the poverty line. Among single-father households, those with 1 or 2 children have the highest poverty rate, with 36 households (38.3%) experiencing poverty. Likewise, among single-mother households, those with 3 or 4 children have the highest poverty rate, with 51 households (100.0%) falling below the poverty line.
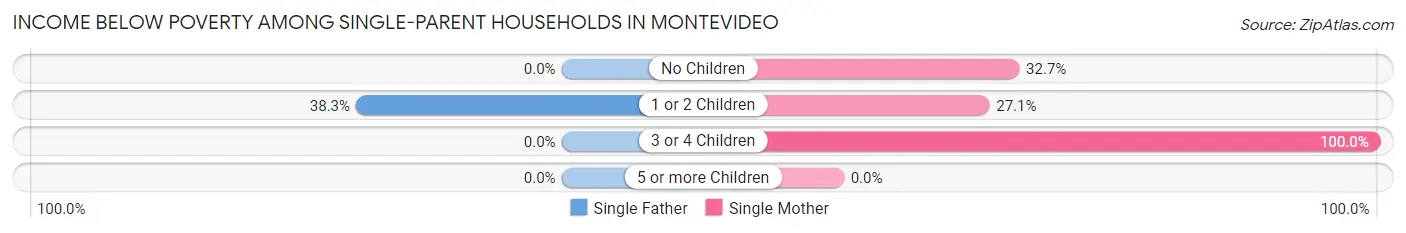
| Children | Single Father | Single Mother |
| No Children | 0 (0.0%) | 17 (32.7%) |
| 1 or 2 Children | 36 (38.3%) | 35 (27.1%) |
| 3 or 4 Children | 0 (0.0%) | 51 (100.0%) |
| 5 or more Children | 0 (0.0%) | 0 (0.0%) |
| Total | 36 (29.3%) | 103 (44.4%) |
Income Below Poverty Among Married-Couple vs Single-Parent Households in Montevideo
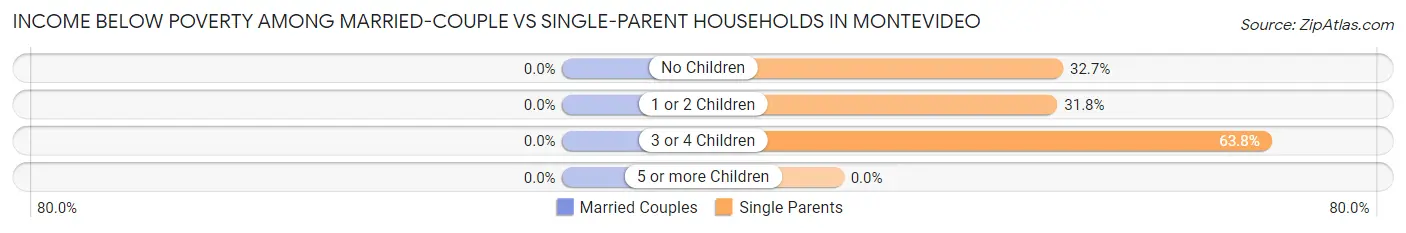
| Children | Married-Couple Families | Single-Parent Households |
| No Children | 0 (0.0%) | 17 (32.7%) |
| 1 or 2 Children | 0 (0.0%) | 71 (31.8%) |
| 3 or 4 Children | 0 (0.0%) | 51 (63.7%) |
| 5 or more Children | 0 (0.0%) | 0 (0.0%) |
| Total | 0 (0.0%) | 139 (39.2%) |
Race in Montevideo
The most populous races in Montevideo are White / Caucasian (4,385 | 82.0%), Hispanic or Latino (658 | 12.3%), and Some other Race (587 | 11.0%).
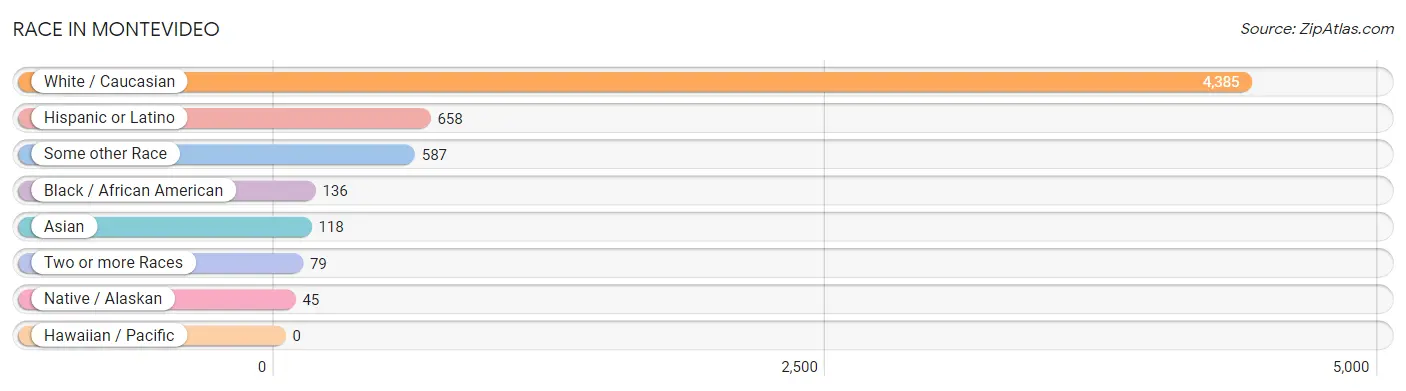
| Race | # Population | % Population |
| Asian | 118 | 2.2% |
| Black / African American | 136 | 2.5% |
| Hawaiian / Pacific | 0 | 0.0% |
| Hispanic or Latino | 658 | 12.3% |
| Native / Alaskan | 45 | 0.8% |
| White / Caucasian | 4,385 | 82.0% |
| Two or more Races | 79 | 1.5% |
| Some other Race | 587 | 11.0% |
| Total | 5,350 | 100.0% |
Ancestry in Montevideo
The most populous ancestries reported in Montevideo are German (1,949 | 36.4%), Norwegian (1,832 | 34.2%), Irish (599 | 11.2%), Mexican (270 | 5.1%), and Central American (259 | 4.8%), together accounting for 91.8% of all Montevideo residents.
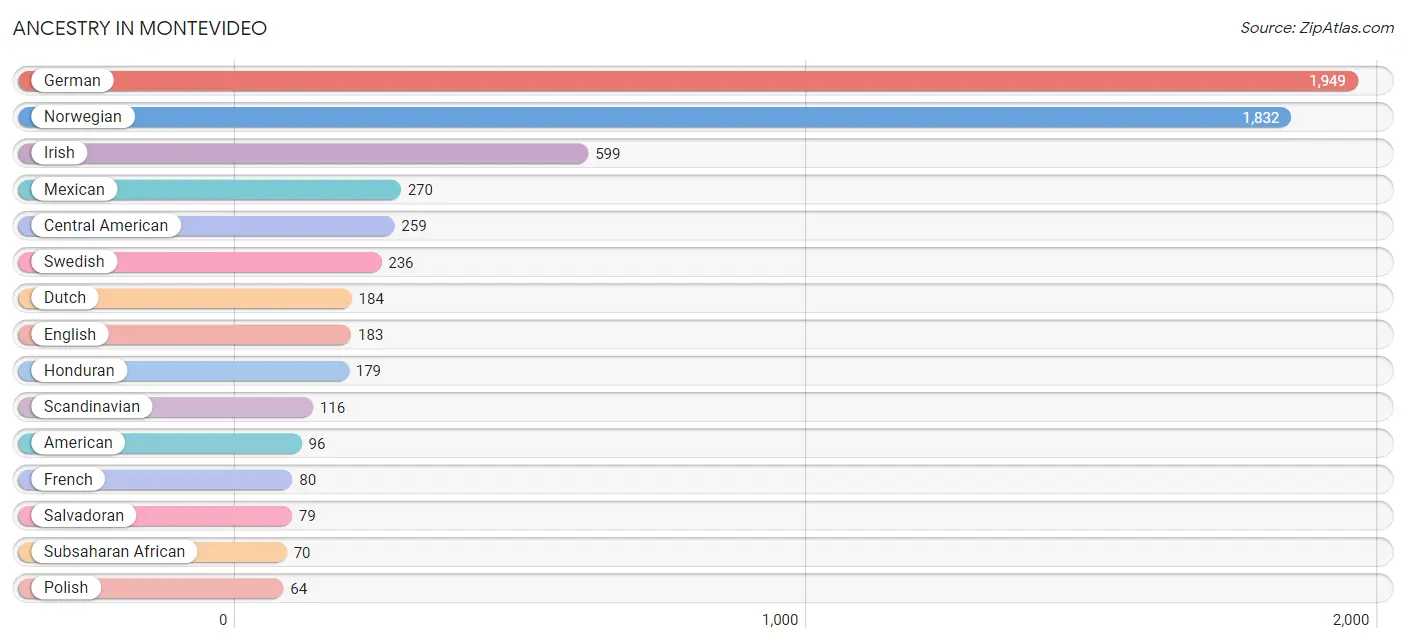
| Ancestry | # Population | % Population |
| American | 96 | 1.8% |
| Bolivian | 3 | 0.1% |
| British | 34 | 0.6% |
| Burmese | 14 | 0.3% |
| Central American | 259 | 4.8% |
| Cherokee | 41 | 0.8% |
| Chippewa | 4 | 0.1% |
| Czech | 53 | 1.0% |
| Czechoslovakian | 24 | 0.4% |
| Danish | 62 | 1.2% |
| Dutch | 184 | 3.4% |
| English | 183 | 3.4% |
| European | 52 | 1.0% |
| French | 80 | 1.5% |
| French Canadian | 37 | 0.7% |
| German | 1,949 | 36.4% |
| Guatemalan | 1 | 0.0% |
| Honduran | 179 | 3.4% |
| Hungarian | 28 | 0.5% |
| Irish | 599 | 11.2% |
| Italian | 60 | 1.1% |
| Liberian | 4 | 0.1% |
| Mexican | 270 | 5.1% |
| Northern European | 6 | 0.1% |
| Norwegian | 1,832 | 34.2% |
| Polish | 64 | 1.2% |
| Russian | 10 | 0.2% |
| Salvadoran | 79 | 1.5% |
| Scandinavian | 116 | 2.2% |
| Scottish | 14 | 0.3% |
| South American | 3 | 0.1% |
| Subsaharan African | 70 | 1.3% |
| Swedish | 236 | 4.4% |
| Swiss | 16 | 0.3% | View All 34 Rows |
Immigrants in Montevideo
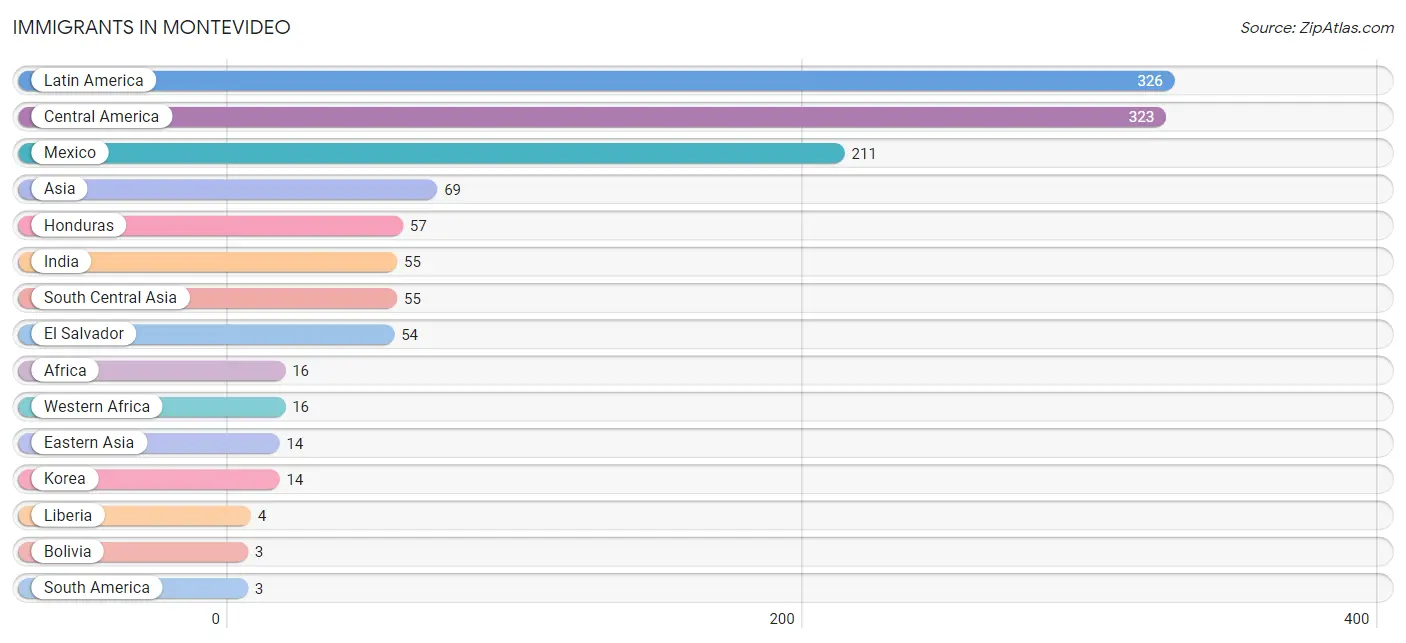
The most numerous immigrant groups reported in Montevideo came from Latin America (326 | 6.1%), Central America (323 | 6.0%), Mexico (211 | 3.9%), Asia (69 | 1.3%), and Honduras (57 | 1.1%), together accounting for 18.4% of all Montevideo residents.
| Immigration Origin | # Population | % Population |
| Africa | 16 | 0.3% |
| Asia | 69 | 1.3% |
| Bolivia | 3 | 0.1% |
| Central America | 323 | 6.0% |
| Eastern Asia | 14 | 0.3% |
| El Salvador | 54 | 1.0% |
| Guatemala | 1 | 0.0% |
| Honduras | 57 | 1.1% |
| India | 55 | 1.0% |
| Korea | 14 | 0.3% |
| Latin America | 326 | 6.1% |
| Liberia | 4 | 0.1% |
| Mexico | 211 | 3.9% |
| South America | 3 | 0.1% |
| South Central Asia | 55 | 1.0% |
| Western Africa | 16 | 0.3% | View All 16 Rows |
Sex and Age in Montevideo
Sex and Age in Montevideo
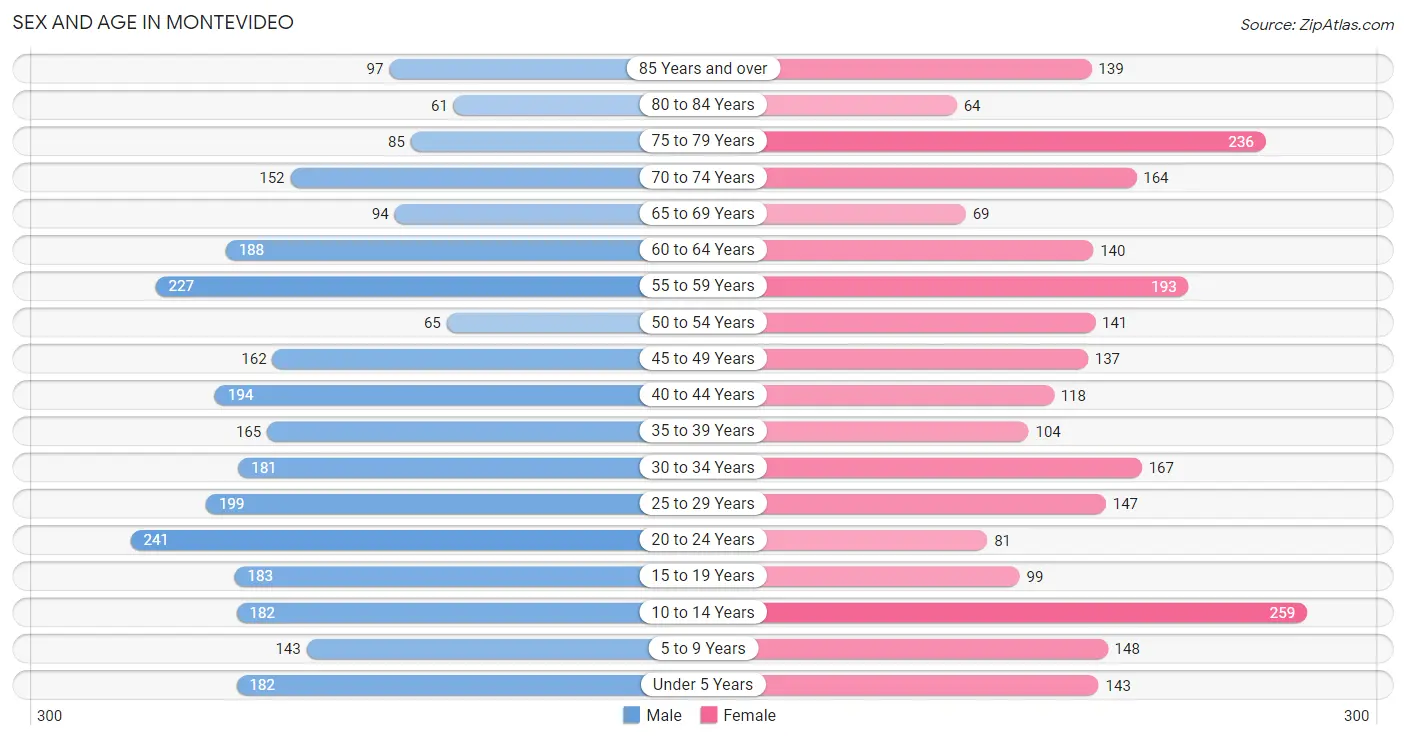
The most populous age groups in Montevideo are 20 to 24 Years (241 | 8.6%) for men and 10 to 14 Years (259 | 10.2%) for women.
| Age Bracket | Male | Female |
| Under 5 Years | 182 (6.5%) | 143 (5.6%) |
| 5 to 9 Years | 143 (5.1%) | 148 (5.8%) |
| 10 to 14 Years | 182 (6.5%) | 259 (10.2%) |
| 15 to 19 Years | 183 (6.5%) | 99 (3.9%) |
| 20 to 24 Years | 241 (8.6%) | 81 (3.2%) |
| 25 to 29 Years | 199 (7.1%) | 147 (5.8%) |
| 30 to 34 Years | 181 (6.5%) | 167 (6.6%) |
| 35 to 39 Years | 165 (5.9%) | 104 (4.1%) |
| 40 to 44 Years | 194 (6.9%) | 118 (4.6%) |
| 45 to 49 Years | 162 (5.8%) | 137 (5.4%) |
| 50 to 54 Years | 65 (2.3%) | 141 (5.5%) |
| 55 to 59 Years | 227 (8.1%) | 193 (7.6%) |
| 60 to 64 Years | 188 (6.7%) | 140 (5.5%) |
| 65 to 69 Years | 94 (3.4%) | 69 (2.7%) |
| 70 to 74 Years | 152 (5.4%) | 164 (6.4%) |
| 75 to 79 Years | 85 (3.0%) | 236 (9.3%) |
| 80 to 84 Years | 61 (2.2%) | 64 (2.5%) |
| 85 Years and over | 97 (3.5%) | 139 (5.4%) |
| Total | 2,801 (100.0%) | 2,549 (100.0%) |
Families and Households in Montevideo
Median Family Size in Montevideo
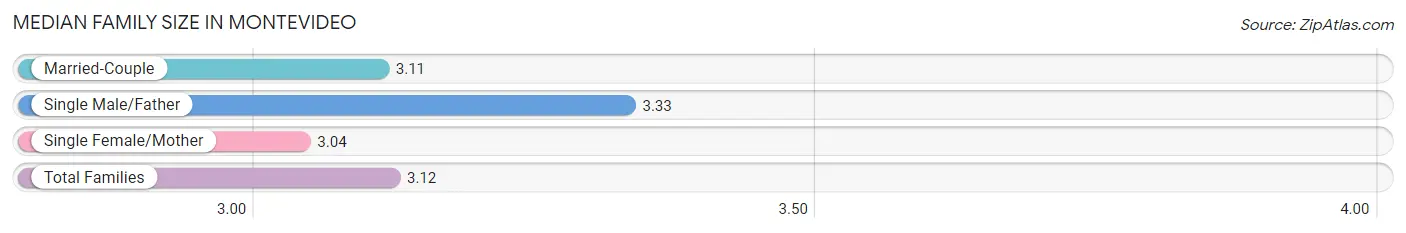
The median family size in Montevideo is 3.12 persons per family, with single male/father families (123 | 10.3%) accounting for the largest median family size of 3.33 persons per family. On the other hand, single female/mother families (232 | 19.4%) represent the smallest median family size with 3.04 persons per family.
| Family Type | # Families | Family Size |
| Married-Couple | 839 (70.3%) | 3.11 |
| Single Male/Father | 123 (10.3%) | 3.33 |
| Single Female/Mother | 232 (19.4%) | 3.04 |
| Total Families | 1,194 (100.0%) | 3.12 |
Median Household Size in Montevideo
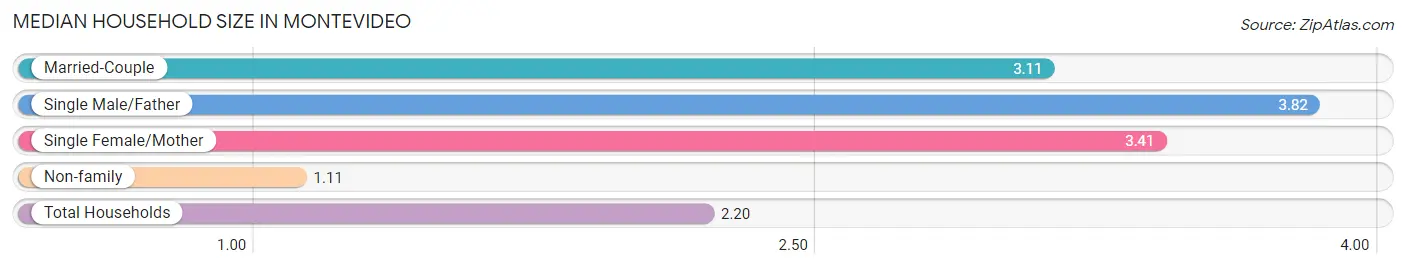
The median household size in Montevideo is 2.20 persons per household, with single male/father households (123 | 5.2%) accounting for the largest median household size of 3.82 persons per household. non-family households (1,148 | 49.0%) represent the smallest median household size with 1.11 persons per household.
| Household Type | # Households | Household Size |
| Married-Couple | 839 (35.8%) | 3.11 |
| Single Male/Father | 123 (5.2%) | 3.82 |
| Single Female/Mother | 232 (9.9%) | 3.41 |
| Non-family | 1,148 (49.0%) | 1.11 |
| Total Households | 2,342 (100.0%) | 2.20 |
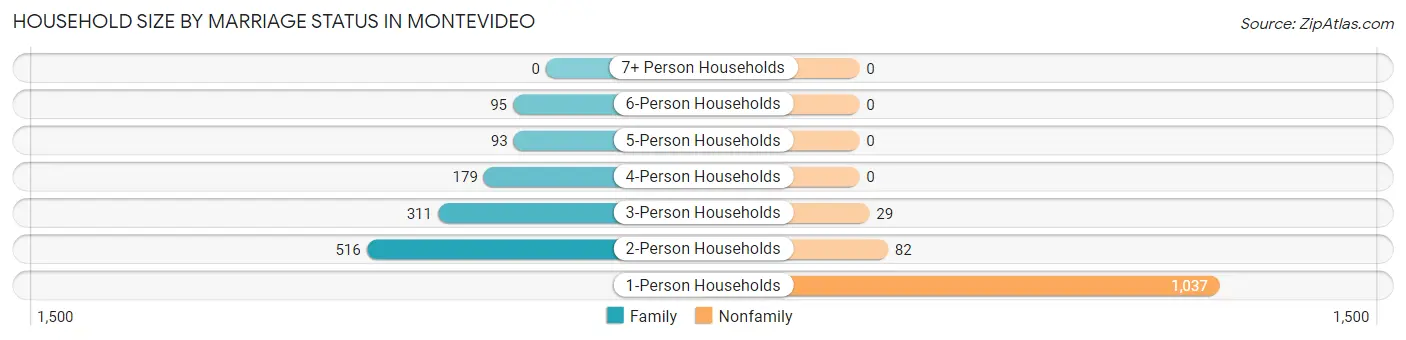
Household Size by Marriage Status in Montevideo
Out of a total of 2,342 households in Montevideo, 1,194 (51.0%) are family households, while 1,148 (49.0%) are nonfamily households. The most numerous type of family households are 2-person households, comprising 516, and the most common type of nonfamily households are 1-person households, comprising 1,037.
| Household Size | Family Households | Nonfamily Households |
| 1-Person Households | - | 1,037 (44.3%) |
| 2-Person Households | 516 (22.0%) | 82 (3.5%) |
| 3-Person Households | 311 (13.3%) | 29 (1.2%) |
| 4-Person Households | 179 (7.6%) | 0 (0.0%) |
| 5-Person Households | 93 (4.0%) | 0 (0.0%) |
| 6-Person Households | 95 (4.1%) | 0 (0.0%) |
| 7+ Person Households | 0 (0.0%) | 0 (0.0%) |
| Total | 1,194 (51.0%) | 1,148 (49.0%) |
Female Fertility in Montevideo
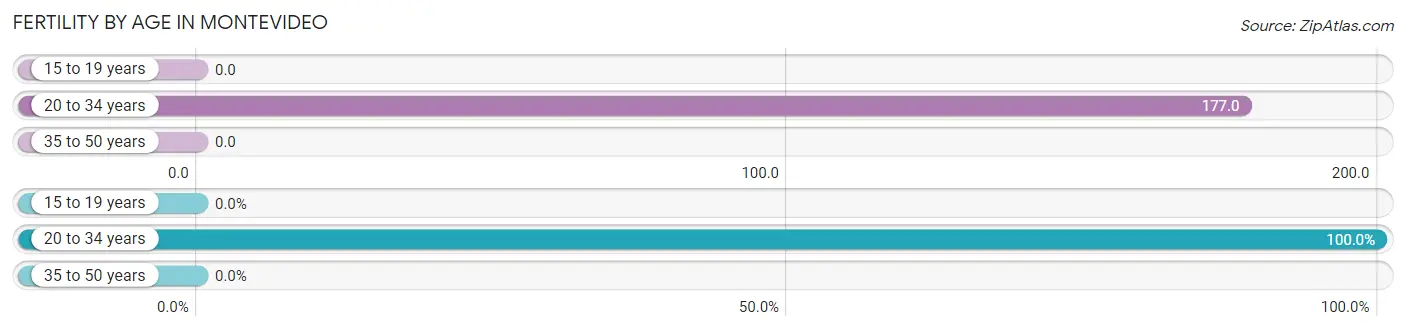
Fertility by Age in Montevideo
Average fertility rate in Montevideo is 82.0 births per 1,000 women. Women in the age bracket of 20 to 34 years have the highest fertility rate with 177.0 births per 1,000 women. Women in the age bracket of 20 to 34 years acount for 100.0% of all women with births.
| Age Bracket | Women with Births | Births / 1,000 Women |
| 15 to 19 years | 0 (0.0%) | 0.0 |
| 20 to 34 years | 70 (100.0%) | 177.0 |
| 35 to 50 years | 0 (0.0%) | 0.0 |
| Total | 70 (100.0%) | 82.0 |
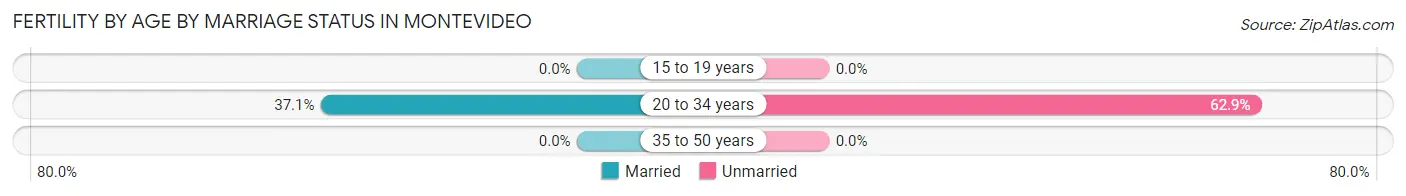
Fertility by Age by Marriage Status in Montevideo
37.1% of women with births (70) in Montevideo are married. The highest percentage of unmarried women with births falls into 20 to 34 years age bracket with 62.9% of them unmarried at the time of birth, while the lowest percentage of unmarried women with births belong to 20 to 34 years age bracket with 62.9% of them unmarried.
| Age Bracket | Married | Unmarried |
| 15 to 19 years | 0 (0.0%) | 0 (0.0%) |
| 20 to 34 years | 26 (37.1%) | 44 (62.9%) |
| 35 to 50 years | 0 (0.0%) | 0 (0.0%) |
| Total | 26 (37.1%) | 44 (62.9%) |
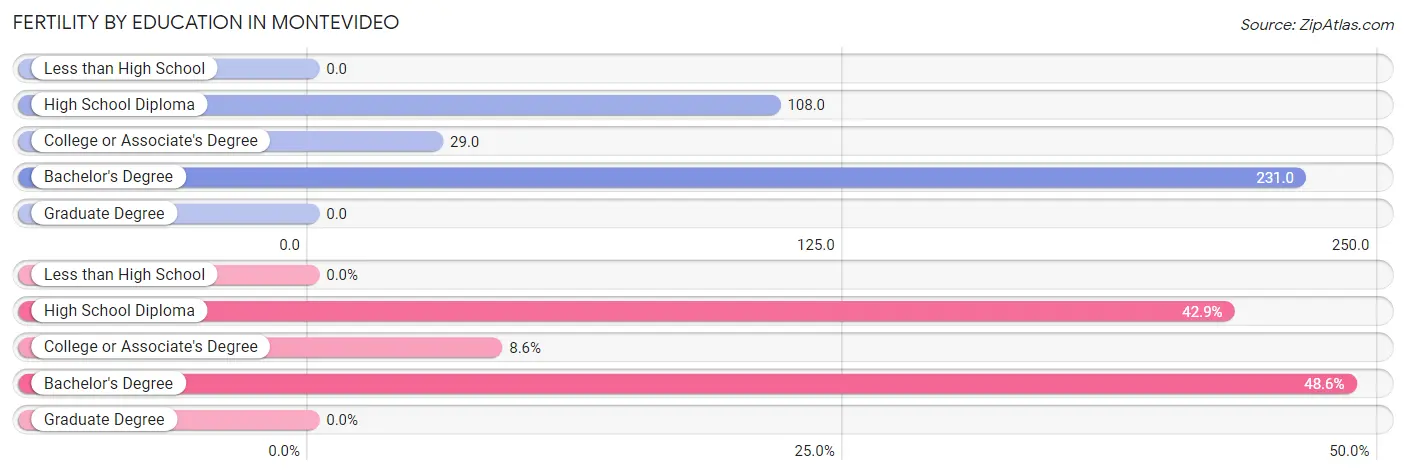
Fertility by Education in Montevideo
| Educational Attainment | Women with Births | Births / 1,000 Women |
| Less than High School | 0 (0.0%) | 0.0 |
| High School Diploma | 30 (42.9%) | 108.0 |
| College or Associate's Degree | 6 (8.6%) | 29.0 |
| Bachelor's Degree | 34 (48.6%) | 231.0 |
| Graduate Degree | 0 (0.0%) | 0.0 |
| Total | 70 (100.0%) | 82.0 |
Fertility by Education by Marriage Status in Montevideo
62.9% of women with births in Montevideo are unmarried. Women with the educational attainment of bachelor's degree are most likely to be married with 76.5% of them married at childbirth, while women with the educational attainment of high school diploma are least likely to be married with 100.0% of them unmarried at childbirth.
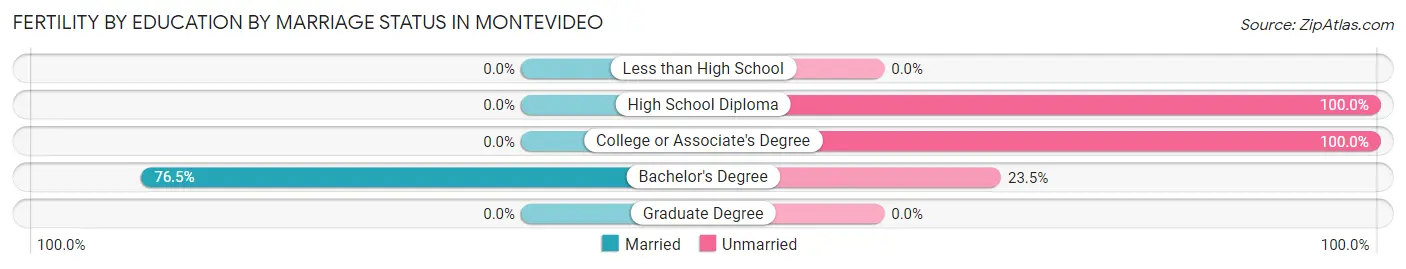
| Educational Attainment | Married | Unmarried |
| Less than High School | 0 (0.0%) | 0 (0.0%) |
| High School Diploma | 0 (0.0%) | 30 (100.0%) |
| College or Associate's Degree | 0 (0.0%) | 6 (100.0%) |
| Bachelor's Degree | 26 (76.5%) | 8 (23.5%) |
| Graduate Degree | 0 (0.0%) | 0 (0.0%) |
| Total | 26 (37.1%) | 44 (62.9%) |
Employment Characteristics in Montevideo
Employment by Class of Employer in Montevideo
Among the 2,362 employed individuals in Montevideo, private company employees (1,447 | 61.3%), local government employees (362 | 15.3%), and not-for-profit organizations (175 | 7.4%) make up the most common classes of employment.
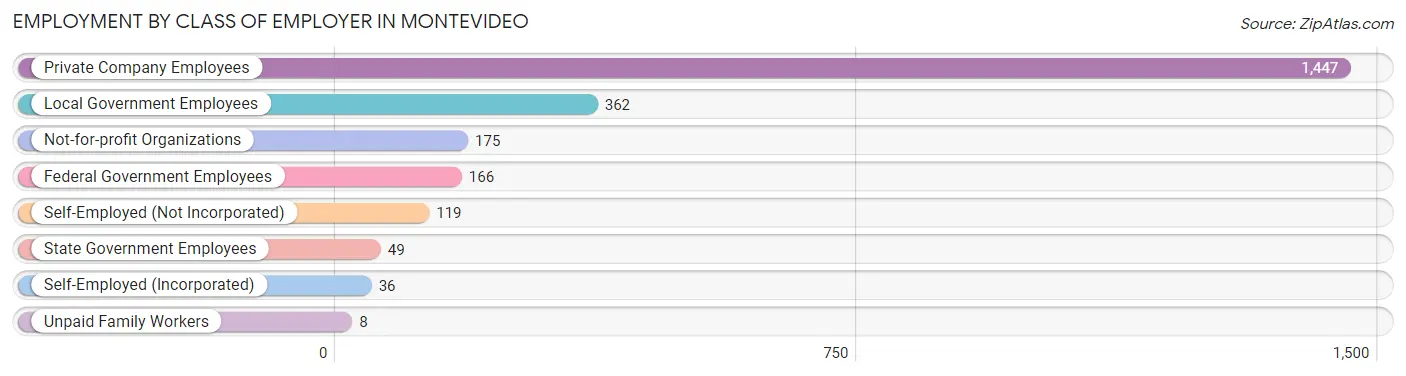
| Employer Class | # Employees | % Employees |
| Private Company Employees | 1,447 | 61.3% |
| Self-Employed (Incorporated) | 36 | 1.5% |
| Self-Employed (Not Incorporated) | 119 | 5.0% |
| Not-for-profit Organizations | 175 | 7.4% |
| Local Government Employees | 362 | 15.3% |
| State Government Employees | 49 | 2.1% |
| Federal Government Employees | 166 | 7.0% |
| Unpaid Family Workers | 8 | 0.3% |
| Total | 2,362 | 100.0% |
Employment Status by Age in Montevideo
According to the labor force statistics for Montevideo, out of the total population over 16 years of age (4,293), 60.8% or 2,610 individuals are in the labor force, with 4.2% or 110 of them unemployed. The age group with the highest labor force participation rate is 55 to 59 years, with 92.9% or 390 individuals in the labor force. Within the labor force, the 25 to 29 years age range has the highest percentage of unemployed individuals, with 15.9% or 43 of them being unemployed.
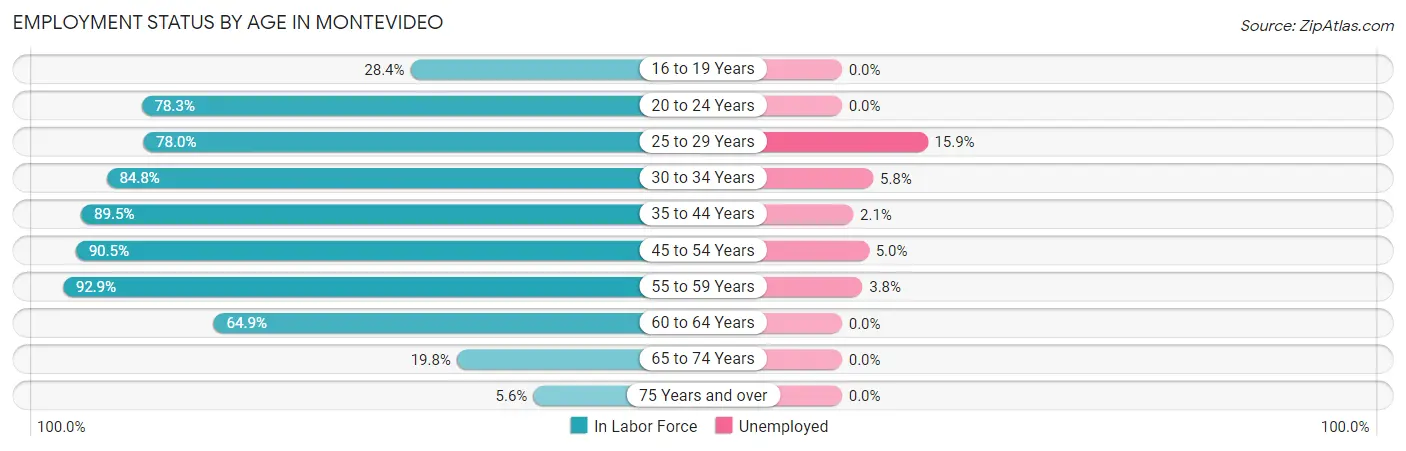
| Age Bracket | In Labor Force | Unemployed |
| 16 to 19 Years | 80 (28.4%) | 0 (0.0%) |
| 20 to 24 Years | 252 (78.3%) | 0 (0.0%) |
| 25 to 29 Years | 270 (78.0%) | 43 (15.9%) |
| 30 to 34 Years | 295 (84.8%) | 17 (5.8%) |
| 35 to 44 Years | 520 (89.5%) | 11 (2.1%) |
| 45 to 54 Years | 457 (90.5%) | 23 (5.0%) |
| 55 to 59 Years | 390 (92.9%) | 15 (3.8%) |
| 60 to 64 Years | 213 (64.9%) | 0 (0.0%) |
| 65 to 74 Years | 95 (19.8%) | 0 (0.0%) |
| 75 Years and over | 38 (5.6%) | 0 (0.0%) |
| Total | 2,610 (60.8%) | 110 (4.2%) |
Employment Status by Educational Attainment in Montevideo
According to labor force statistics for Montevideo, 84.8% of individuals (2,144) out of the total population between 25 and 64 years of age (2,528) are in the labor force, with 5.1% or 109 of them being unemployed. The group with the highest labor force participation rate are those with the educational attainment of less than high school, with 99.0% or 194 individuals in the labor force. Within the labor force, individuals with less than high school education have the highest percentage of unemployment, with 18.6% or 36 of them being unemployed.
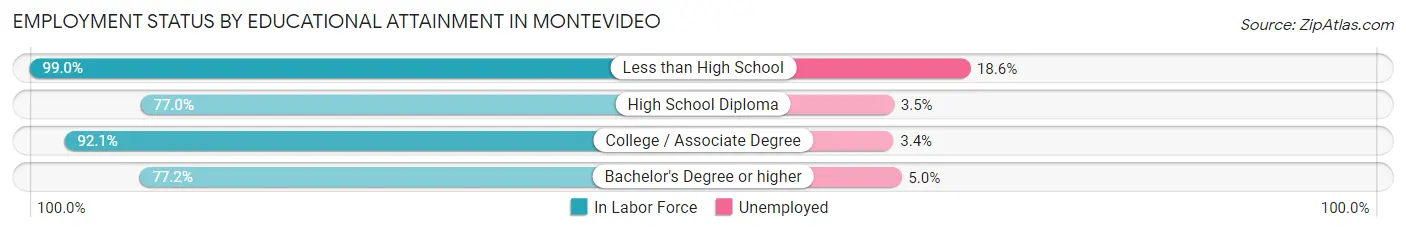
| Educational Attainment | In Labor Force | Unemployed |
| Less than High School | 194 (99.0%) | 36 (18.6%) |
| High School Diploma | 651 (77.0%) | 30 (3.5%) |
| College / Associate Degree | 937 (92.1%) | 35 (3.4%) |
| Bachelor's Degree or higher | 363 (77.2%) | 24 (5.0%) |
| Total | 2,144 (84.8%) | 129 (5.1%) |
Employment Occupations by Sex in Montevideo
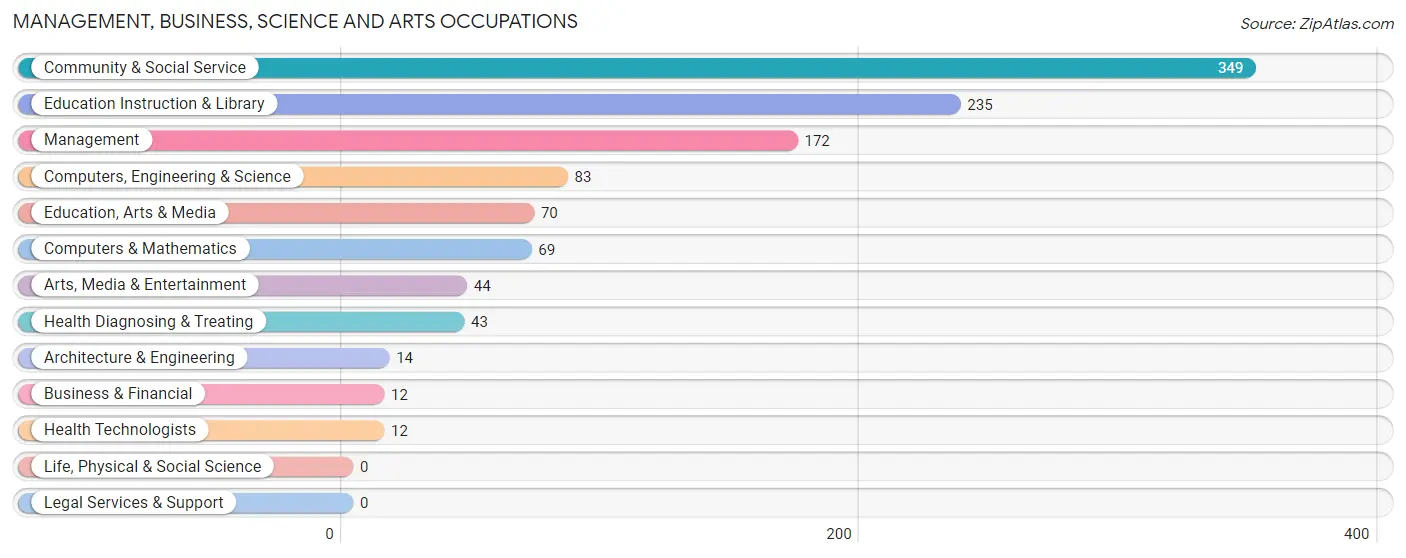
Management, Business, Science and Arts Occupations
The most common Management, Business, Science and Arts occupations in Montevideo are Community & Social Service (349 | 14.0%), Education Instruction & Library (235 | 9.4%), Management (172 | 6.9%), Computers, Engineering & Science (83 | 3.3%), and Education, Arts & Media (70 | 2.8%).
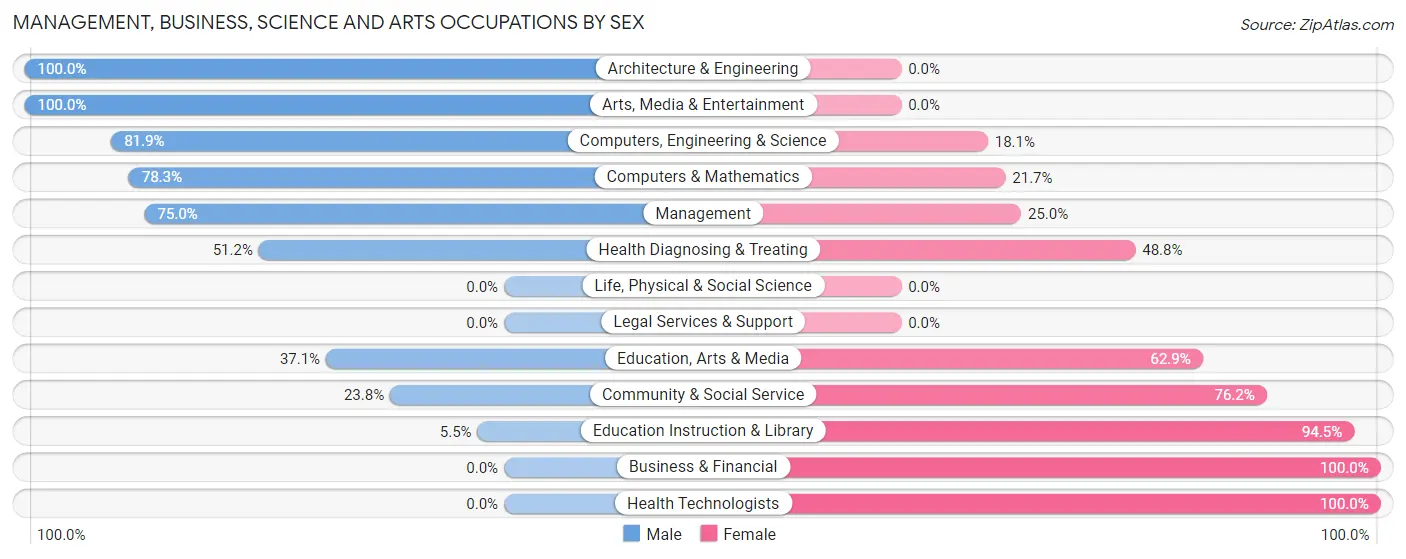
Management, Business, Science and Arts Occupations by Sex
Within the Management, Business, Science and Arts occupations in Montevideo, the most male-oriented occupations are Architecture & Engineering (100.0%), Arts, Media & Entertainment (100.0%), and Computers, Engineering & Science (81.9%), while the most female-oriented occupations are Business & Financial (100.0%), Health Technologists (100.0%), and Education Instruction & Library (94.5%).
| Occupation | Male | Female |
| Management | 129 (75.0%) | 43 (25.0%) |
| Business & Financial | 0 (0.0%) | 12 (100.0%) |
| Computers, Engineering & Science | 68 (81.9%) | 15 (18.1%) |
| Computers & Mathematics | 54 (78.3%) | 15 (21.7%) |
| Architecture & Engineering | 14 (100.0%) | 0 (0.0%) |
| Life, Physical & Social Science | 0 (0.0%) | 0 (0.0%) |
| Community & Social Service | 83 (23.8%) | 266 (76.2%) |
| Education, Arts & Media | 26 (37.1%) | 44 (62.9%) |
| Legal Services & Support | 0 (0.0%) | 0 (0.0%) |
| Education Instruction & Library | 13 (5.5%) | 222 (94.5%) |
| Arts, Media & Entertainment | 44 (100.0%) | 0 (0.0%) |
| Health Diagnosing & Treating | 22 (51.2%) | 21 (48.8%) |
| Health Technologists | 0 (0.0%) | 12 (100.0%) |
| Total (Category) | 302 (45.8%) | 357 (54.2%) |
| Total (Overall) | 1,382 (55.3%) | 1,119 (44.7%) |
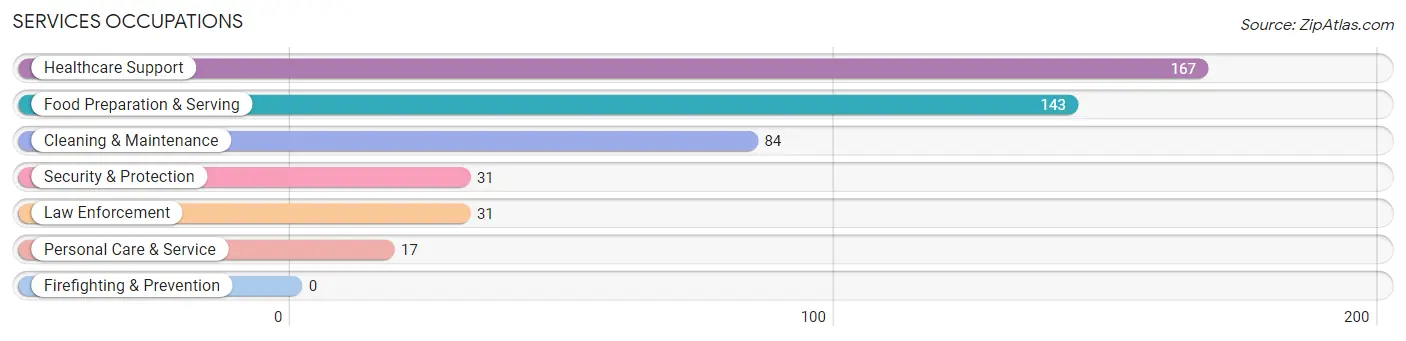
Services Occupations
The most common Services occupations in Montevideo are Healthcare Support (167 | 6.7%), Food Preparation & Serving (143 | 5.7%), Cleaning & Maintenance (84 | 3.4%), Security & Protection (31 | 1.2%), and Law Enforcement (31 | 1.2%).
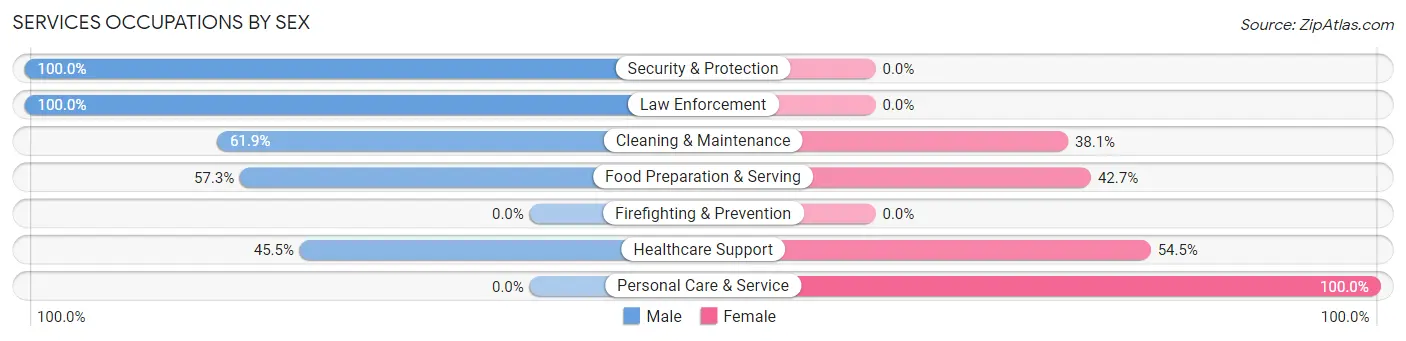
Services Occupations by Sex
Within the Services occupations in Montevideo, the most male-oriented occupations are Security & Protection (100.0%), Law Enforcement (100.0%), and Cleaning & Maintenance (61.9%), while the most female-oriented occupations are Personal Care & Service (100.0%), Healthcare Support (54.5%), and Food Preparation & Serving (42.7%).
| Occupation | Male | Female |
| Healthcare Support | 76 (45.5%) | 91 (54.5%) |
| Security & Protection | 31 (100.0%) | 0 (0.0%) |
| Firefighting & Prevention | 0 (0.0%) | 0 (0.0%) |
| Law Enforcement | 31 (100.0%) | 0 (0.0%) |
| Food Preparation & Serving | 82 (57.3%) | 61 (42.7%) |
| Cleaning & Maintenance | 52 (61.9%) | 32 (38.1%) |
| Personal Care & Service | 0 (0.0%) | 17 (100.0%) |
| Total (Category) | 241 (54.5%) | 201 (45.5%) |
| Total (Overall) | 1,382 (55.3%) | 1,119 (44.7%) |
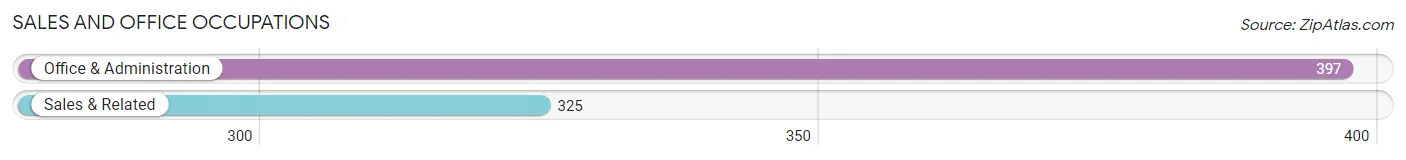
Sales and Office Occupations
The most common Sales and Office occupations in Montevideo are Office & Administration (397 | 15.9%), and Sales & Related (325 | 13.0%).
Sales and Office Occupations by Sex
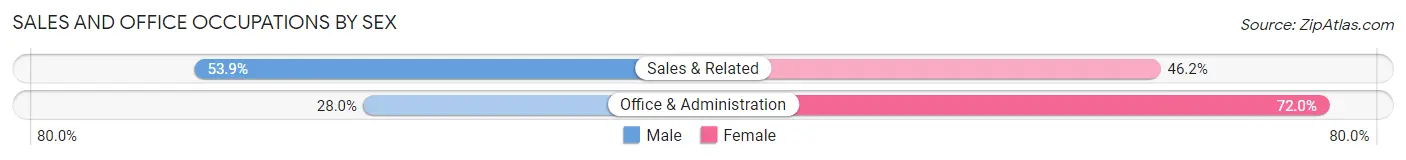
| Occupation | Male | Female |
| Sales & Related | 175 (53.8%) | 150 (46.2%) |
| Office & Administration | 111 (28.0%) | 286 (72.0%) |
| Total (Category) | 286 (39.6%) | 436 (60.4%) |
| Total (Overall) | 1,382 (55.3%) | 1,119 (44.7%) |
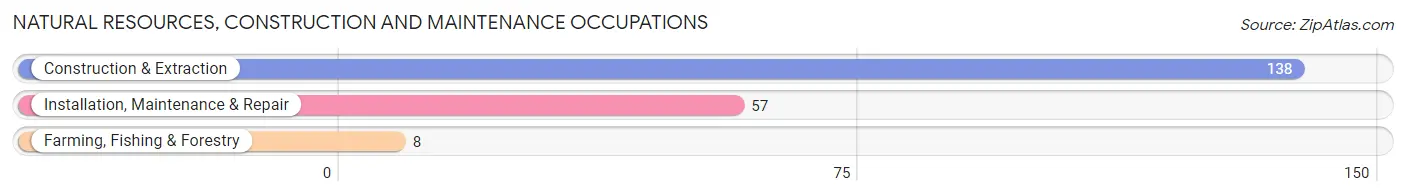
Natural Resources, Construction and Maintenance Occupations
The most common Natural Resources, Construction and Maintenance occupations in Montevideo are Construction & Extraction (138 | 5.5%), Installation, Maintenance & Repair (57 | 2.3%), and Farming, Fishing & Forestry (8 | 0.3%).
Natural Resources, Construction and Maintenance Occupations by Sex
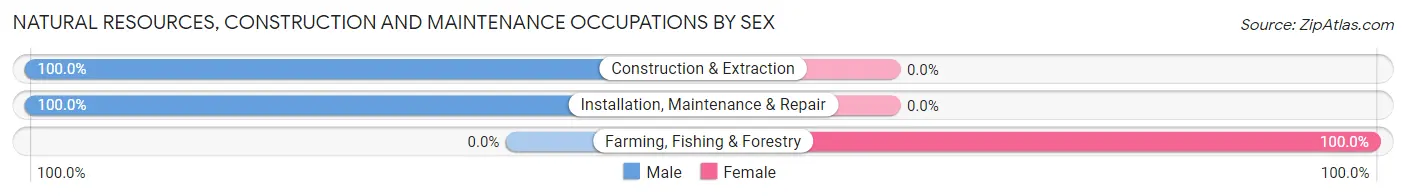
| Occupation | Male | Female |
| Farming, Fishing & Forestry | 0 (0.0%) | 8 (100.0%) |
| Construction & Extraction | 138 (100.0%) | 0 (0.0%) |
| Installation, Maintenance & Repair | 57 (100.0%) | 0 (0.0%) |
| Total (Category) | 195 (96.1%) | 8 (3.9%) |
| Total (Overall) | 1,382 (55.3%) | 1,119 (44.7%) |
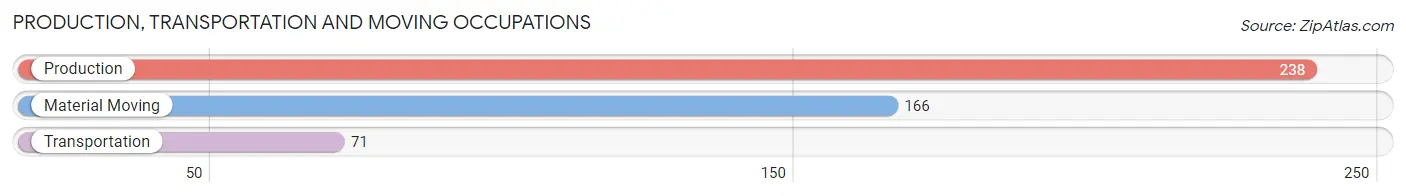
Production, Transportation and Moving Occupations
The most common Production, Transportation and Moving occupations in Montevideo are Production (238 | 9.5%), Material Moving (166 | 6.6%), and Transportation (71 | 2.8%).
Production, Transportation and Moving Occupations by Sex
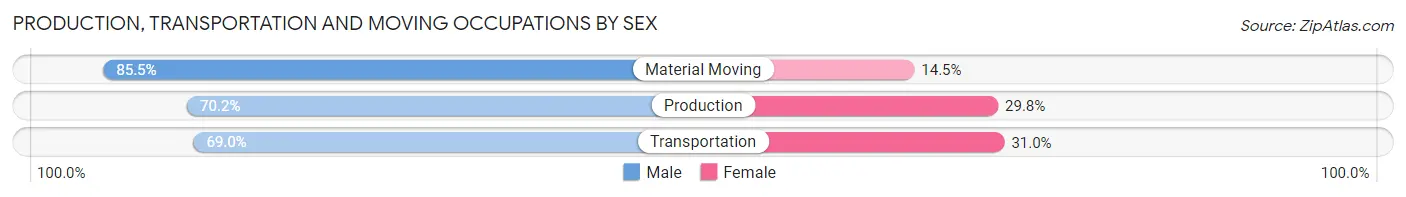
| Occupation | Male | Female |
| Production | 167 (70.2%) | 71 (29.8%) |
| Transportation | 49 (69.0%) | 22 (31.0%) |
| Material Moving | 142 (85.5%) | 24 (14.5%) |
| Total (Category) | 358 (75.4%) | 117 (24.6%) |
| Total (Overall) | 1,382 (55.3%) | 1,119 (44.7%) |
Employment Industries by Sex in Montevideo
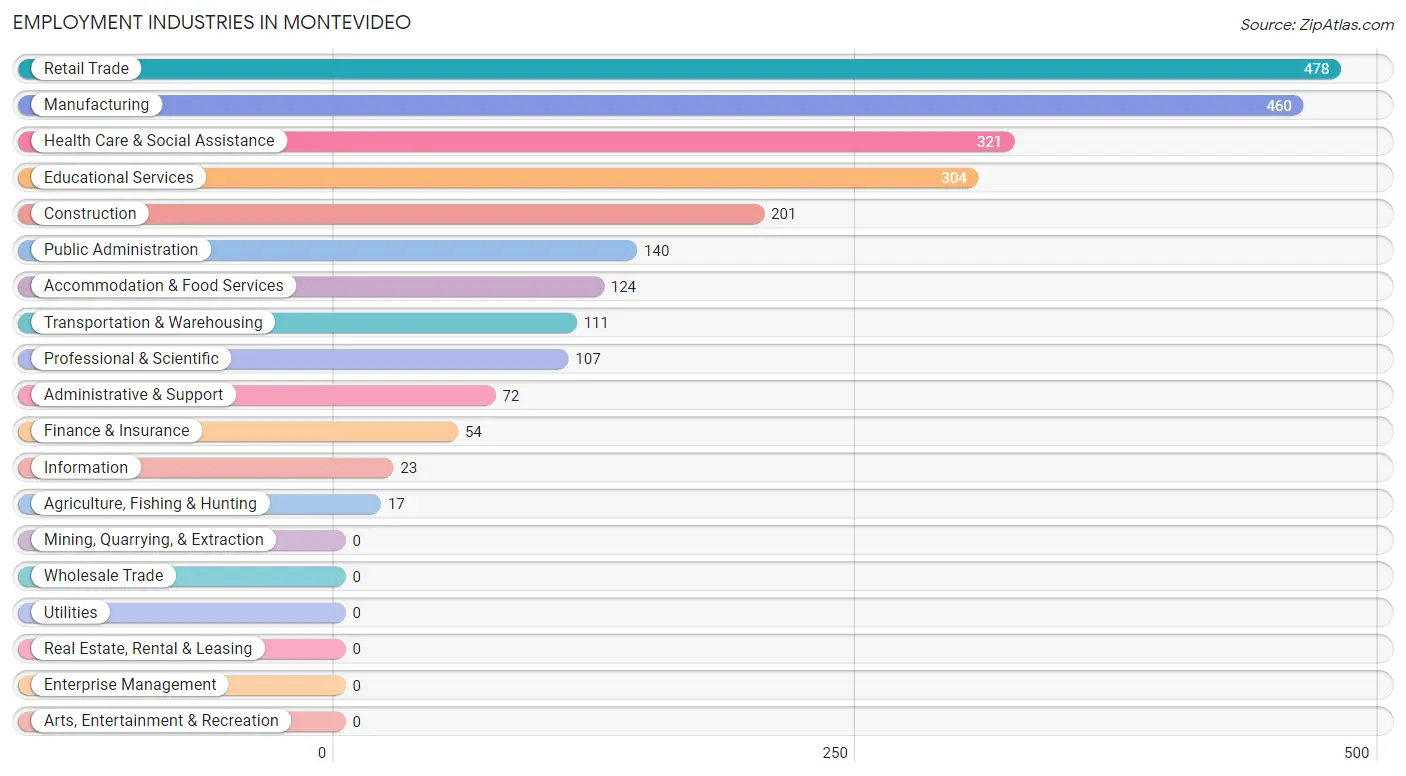
Employment Industries in Montevideo
The major employment industries in Montevideo include Retail Trade (478 | 19.1%), Manufacturing (460 | 18.4%), Health Care & Social Assistance (321 | 12.8%), Educational Services (304 | 12.2%), and Construction (201 | 8.0%).
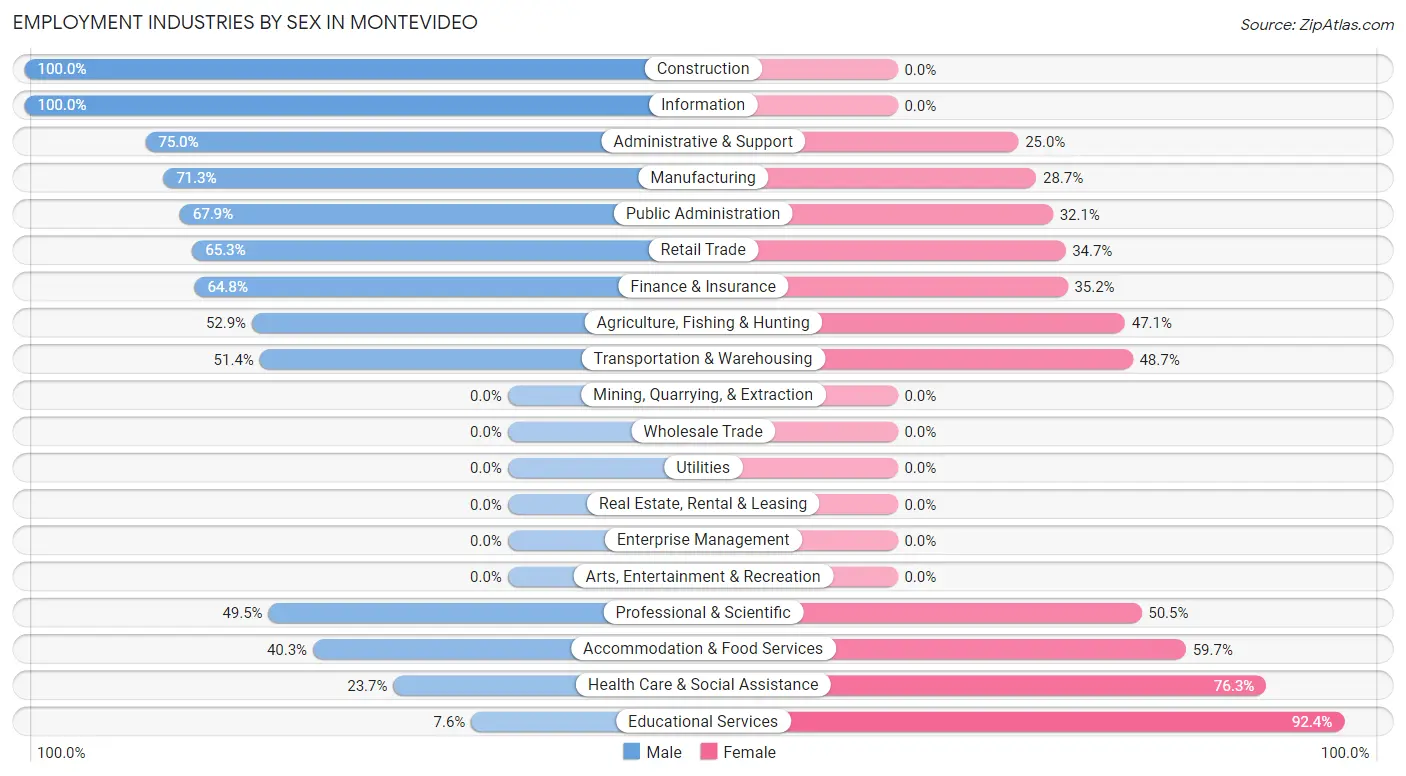
Employment Industries by Sex in Montevideo
The Montevideo industries that see more men than women are Construction (100.0%), Information (100.0%), and Administrative & Support (75.0%), whereas the industries that tend to have a higher number of women are Educational Services (92.4%), Health Care & Social Assistance (76.3%), and Accommodation & Food Services (59.7%).
| Industry | Male | Female |
| Agriculture, Fishing & Hunting | 9 (52.9%) | 8 (47.1%) |
| Mining, Quarrying, & Extraction | 0 (0.0%) | 0 (0.0%) |
| Construction | 201 (100.0%) | 0 (0.0%) |
| Manufacturing | 328 (71.3%) | 132 (28.7%) |
| Wholesale Trade | 0 (0.0%) | 0 (0.0%) |
| Retail Trade | 312 (65.3%) | 166 (34.7%) |
| Transportation & Warehousing | 57 (51.3%) | 54 (48.6%) |
| Utilities | 0 (0.0%) | 0 (0.0%) |
| Information | 23 (100.0%) | 0 (0.0%) |
| Finance & Insurance | 35 (64.8%) | 19 (35.2%) |
| Real Estate, Rental & Leasing | 0 (0.0%) | 0 (0.0%) |
| Professional & Scientific | 53 (49.5%) | 54 (50.5%) |
| Enterprise Management | 0 (0.0%) | 0 (0.0%) |
| Administrative & Support | 54 (75.0%) | 18 (25.0%) |
| Educational Services | 23 (7.6%) | 281 (92.4%) |
| Health Care & Social Assistance | 76 (23.7%) | 245 (76.3%) |
| Arts, Entertainment & Recreation | 0 (0.0%) | 0 (0.0%) |
| Accommodation & Food Services | 50 (40.3%) | 74 (59.7%) |
| Public Administration | 95 (67.9%) | 45 (32.1%) |
| Total | 1,382 (55.3%) | 1,119 (44.7%) |
Education in Montevideo
School Enrollment in Montevideo
The most common levels of schooling among the 1,196 students in Montevideo are middle school (414 | 34.6%), high school (266 | 22.2%), and elementary school (216 | 18.1%).
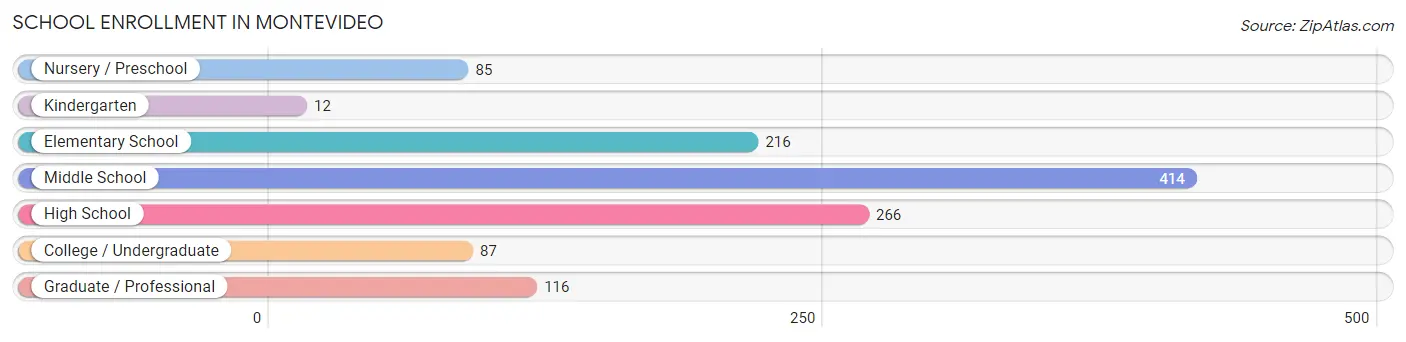
| School Level | # Students | % Students |
| Nursery / Preschool | 85 | 7.1% |
| Kindergarten | 12 | 1.0% |
| Elementary School | 216 | 18.1% |
| Middle School | 414 | 34.6% |
| High School | 266 | 22.2% |
| College / Undergraduate | 87 | 7.3% |
| Graduate / Professional | 116 | 9.7% |
| Total | 1,196 | 100.0% |
School Enrollment by Age by Funding Source in Montevideo
Out of a total of 1,196 students who are enrolled in schools in Montevideo, 51 (4.3%) attend a private institution, while the remaining 1,145 (95.7%) are enrolled in public schools. The age group of 10 to 14 year olds has the highest likelihood of being enrolled in private schools, with 52 (12.1% in the age bracket) enrolled. Conversely, the age group of 3 to 4 year olds has the lowest likelihood of being enrolled in a private school, with 41 (100.0% in the age bracket) attending a public institution.
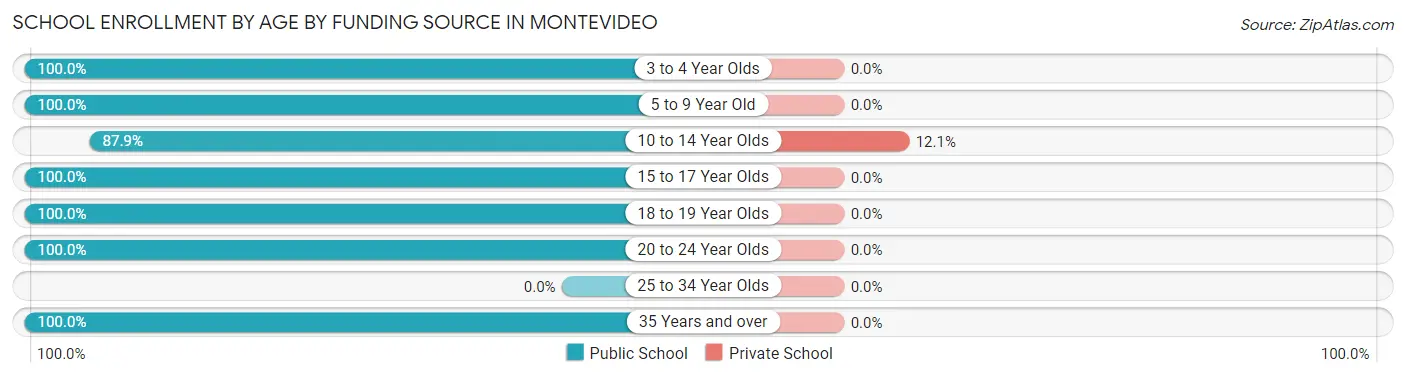
| Age Bracket | Public School | Private School |
| 3 to 4 Year Olds | 41 (100.0%) | 0 (0.0%) |
| 5 to 9 Year Old | 258 (100.0%) | 0 (0.0%) |
| 10 to 14 Year Olds | 377 (87.9%) | 52 (12.1%) |
| 15 to 17 Year Olds | 238 (100.0%) | 0 (0.0%) |
| 18 to 19 Year Olds | 44 (100.0%) | 0 (0.0%) |
| 20 to 24 Year Olds | 156 (100.0%) | 0 (0.0%) |
| 25 to 34 Year Olds | 0 (0.0%) | 0 (0.0%) |
| 35 Years and over | 30 (100.0%) | 0 (0.0%) |
| Total | 1,145 (95.7%) | 51 (4.3%) |
Educational Attainment by Field of Study in Montevideo
Education (150 | 19.5%), business (138 | 17.9%), social sciences (106 | 13.8%), bio, nature & agricultural (66 | 8.6%), and computers & mathematics (57 | 7.4%) are the most common fields of study among 771 individuals in Montevideo who have obtained a bachelor's degree or higher.
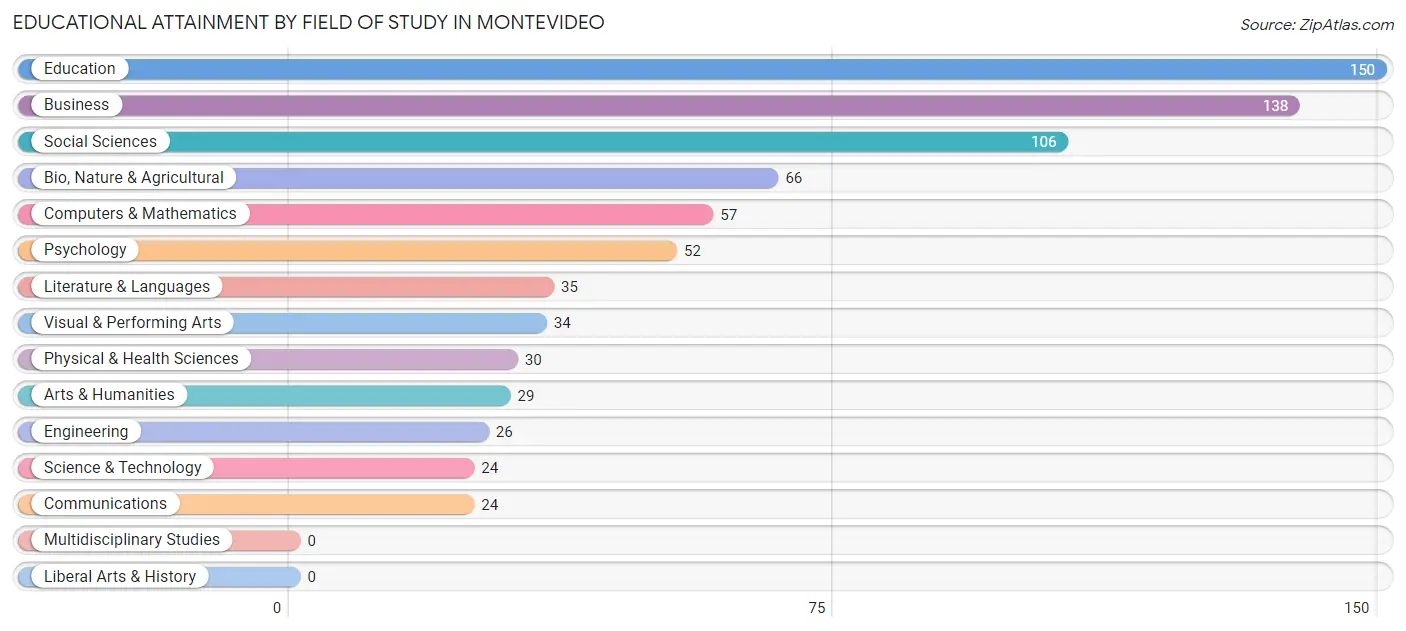
| Field of Study | # Graduates | % Graduates |
| Computers & Mathematics | 57 | 7.4% |
| Bio, Nature & Agricultural | 66 | 8.6% |
| Physical & Health Sciences | 30 | 3.9% |
| Psychology | 52 | 6.7% |
| Social Sciences | 106 | 13.8% |
| Engineering | 26 | 3.4% |
| Multidisciplinary Studies | 0 | 0.0% |
| Science & Technology | 24 | 3.1% |
| Business | 138 | 17.9% |
| Education | 150 | 19.5% |
| Literature & Languages | 35 | 4.5% |
| Liberal Arts & History | 0 | 0.0% |
| Visual & Performing Arts | 34 | 4.4% |
| Communications | 24 | 3.1% |
| Arts & Humanities | 29 | 3.8% |
| Total | 771 | 100.0% |
Transportation & Commute in Montevideo
Vehicle Availability by Sex in Montevideo
The most prevalent vehicle ownership categories in Montevideo are males with 2 vehicles (489, accounting for 36.9%) and females with 2 vehicles (202, making up 47.7%).
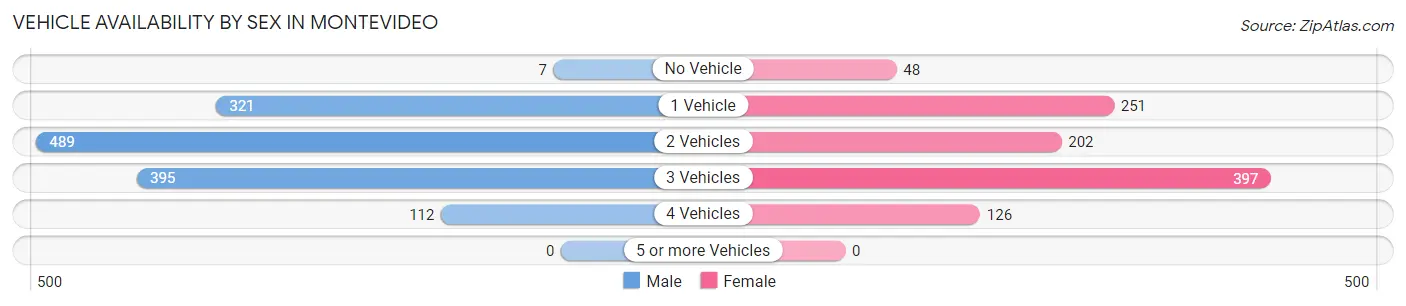
| Vehicles Available | Male | Female |
| No Vehicle | 7 (0.5%) | 48 (4.7%) |
| 1 Vehicle | 321 (24.2%) | 251 (24.5%) |
| 2 Vehicles | 489 (36.9%) | 202 (19.7%) |
| 3 Vehicles | 395 (29.8%) | 397 (38.8%) |
| 4 Vehicles | 112 (8.5%) | 126 (12.3%) |
| 5 or more Vehicles | 0 (0.0%) | 0 (0.0%) |
| Total | 1,324 (100.0%) | 1,024 (100.0%) |
Commute Time in Montevideo
The most frequently occuring commute durations in Montevideo are 5 to 9 minutes (822 commuters, 35.5%), less than 5 minutes (429 commuters, 18.6%), and 10 to 14 minutes (263 commuters, 11.4%).
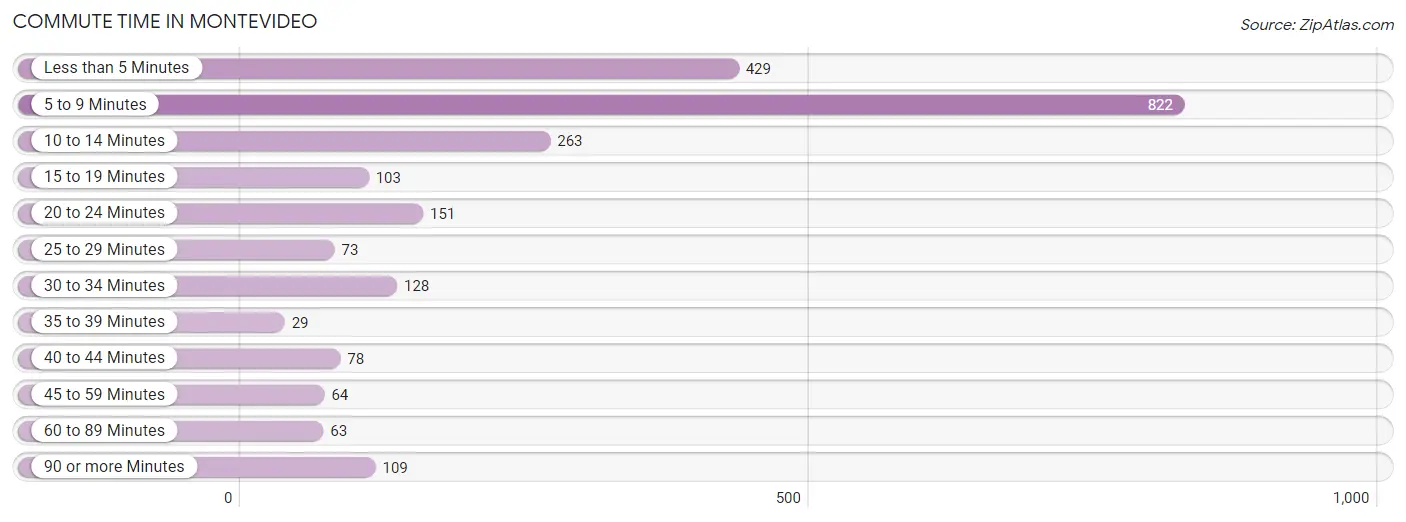
| Commute Time | # Commuters | % Commuters |
| Less than 5 Minutes | 429 | 18.6% |
| 5 to 9 Minutes | 822 | 35.5% |
| 10 to 14 Minutes | 263 | 11.4% |
| 15 to 19 Minutes | 103 | 4.5% |
| 20 to 24 Minutes | 151 | 6.5% |
| 25 to 29 Minutes | 73 | 3.2% |
| 30 to 34 Minutes | 128 | 5.5% |
| 35 to 39 Minutes | 29 | 1.3% |
| 40 to 44 Minutes | 78 | 3.4% |
| 45 to 59 Minutes | 64 | 2.8% |
| 60 to 89 Minutes | 63 | 2.7% |
| 90 or more Minutes | 109 | 4.7% |
Commute Time by Sex in Montevideo
The most common commute times in Montevideo are 5 to 9 minutes (346 commuters, 26.5%) for males and 5 to 9 minutes (476 commuters, 47.3%) for females.
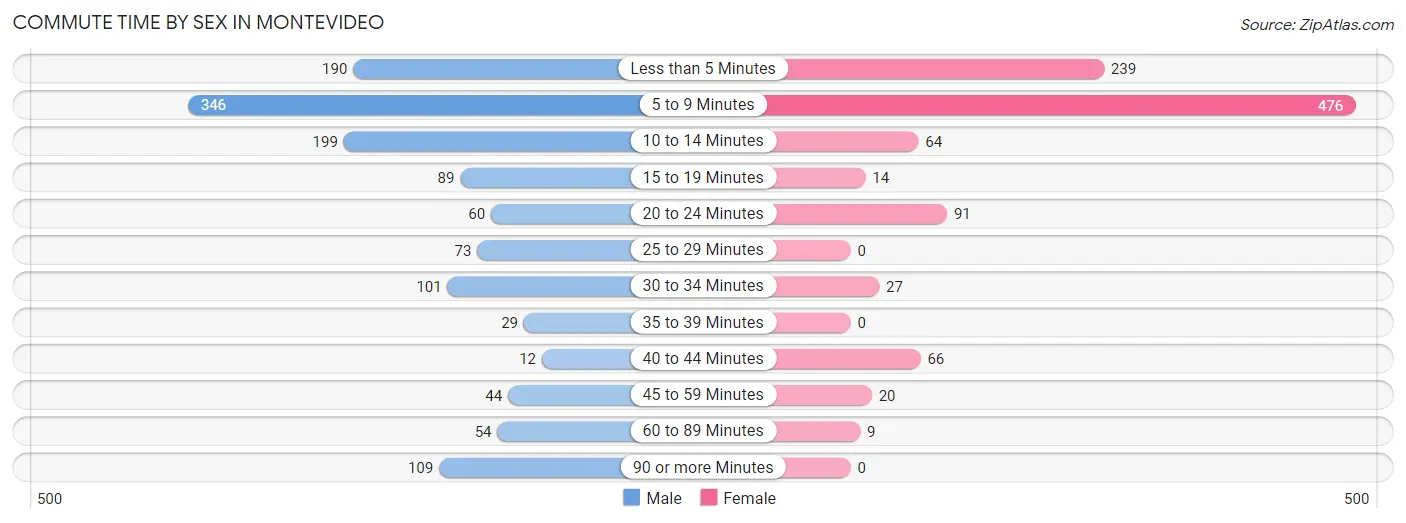
| Commute Time | Male | Female |
| Less than 5 Minutes | 190 (14.5%) | 239 (23.8%) |
| 5 to 9 Minutes | 346 (26.5%) | 476 (47.3%) |
| 10 to 14 Minutes | 199 (15.2%) | 64 (6.4%) |
| 15 to 19 Minutes | 89 (6.8%) | 14 (1.4%) |
| 20 to 24 Minutes | 60 (4.6%) | 91 (9.0%) |
| 25 to 29 Minutes | 73 (5.6%) | 0 (0.0%) |
| 30 to 34 Minutes | 101 (7.7%) | 27 (2.7%) |
| 35 to 39 Minutes | 29 (2.2%) | 0 (0.0%) |
| 40 to 44 Minutes | 12 (0.9%) | 66 (6.6%) |
| 45 to 59 Minutes | 44 (3.4%) | 20 (2.0%) |
| 60 to 89 Minutes | 54 (4.1%) | 9 (0.9%) |
| 90 or more Minutes | 109 (8.4%) | 0 (0.0%) |
Time of Departure to Work by Sex in Montevideo
The most frequent times of departure to work in Montevideo are 6:30 AM to 6:59 AM (245, 18.8%) for males and 7:00 AM to 7:29 AM (292, 29.0%) for females.
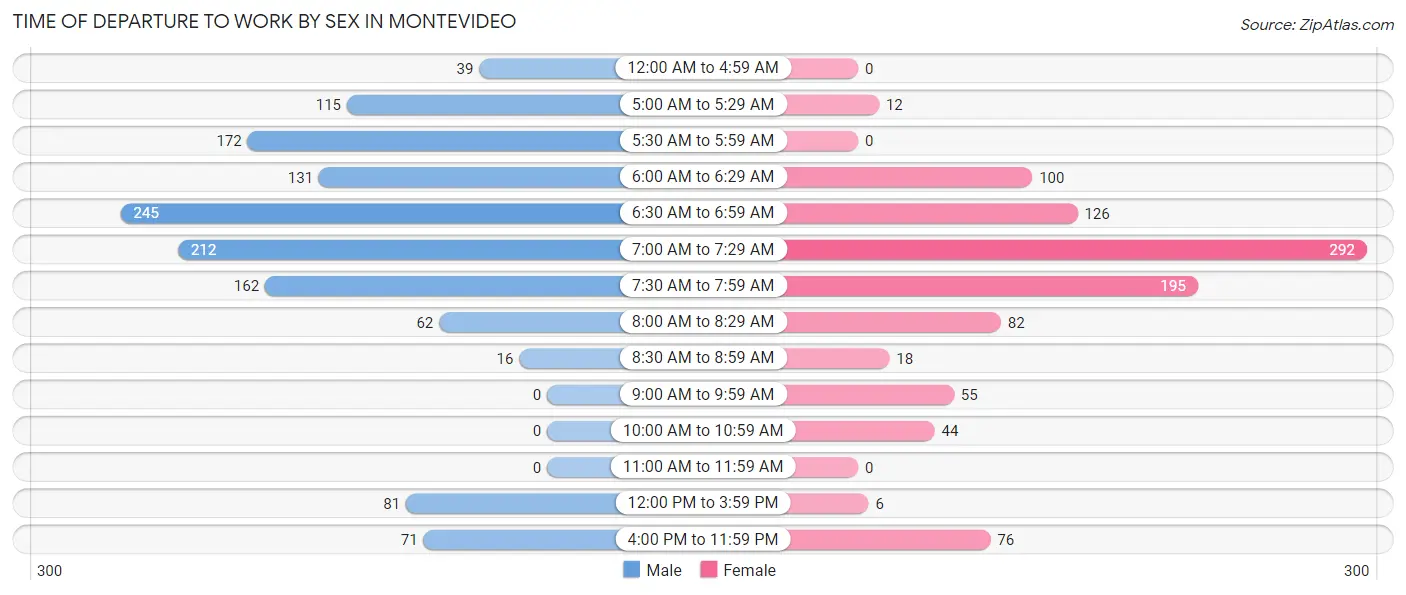
| Time of Departure | Male | Female |
| 12:00 AM to 4:59 AM | 39 (3.0%) | 0 (0.0%) |
| 5:00 AM to 5:29 AM | 115 (8.8%) | 12 (1.2%) |
| 5:30 AM to 5:59 AM | 172 (13.2%) | 0 (0.0%) |
| 6:00 AM to 6:29 AM | 131 (10.0%) | 100 (9.9%) |
| 6:30 AM to 6:59 AM | 245 (18.8%) | 126 (12.5%) |
| 7:00 AM to 7:29 AM | 212 (16.2%) | 292 (29.0%) |
| 7:30 AM to 7:59 AM | 162 (12.4%) | 195 (19.4%) |
| 8:00 AM to 8:29 AM | 62 (4.8%) | 82 (8.2%) |
| 8:30 AM to 8:59 AM | 16 (1.2%) | 18 (1.8%) |
| 9:00 AM to 9:59 AM | 0 (0.0%) | 55 (5.5%) |
| 10:00 AM to 10:59 AM | 0 (0.0%) | 44 (4.4%) |
| 11:00 AM to 11:59 AM | 0 (0.0%) | 0 (0.0%) |
| 12:00 PM to 3:59 PM | 81 (6.2%) | 6 (0.6%) |
| 4:00 PM to 11:59 PM | 71 (5.4%) | 76 (7.5%) |
| Total | 1,306 (100.0%) | 1,006 (100.0%) |
Housing Occupancy in Montevideo
Occupancy by Ownership in Montevideo
Of the total 2,342 dwellings in Montevideo, owner-occupied units account for 1,432 (61.1%), while renter-occupied units make up 910 (38.9%).
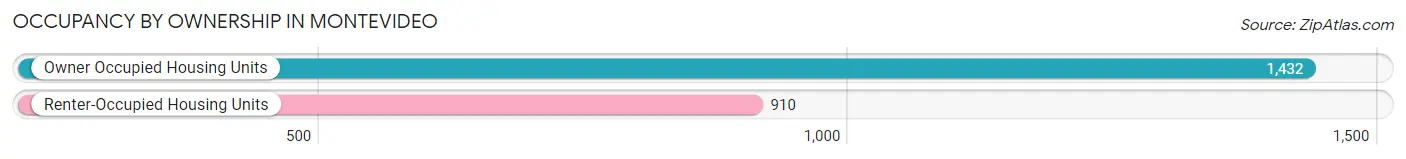
| Occupancy | # Housing Units | % Housing Units |
| Owner Occupied Housing Units | 1,432 | 61.1% |
| Renter-Occupied Housing Units | 910 | 38.9% |
| Total Occupied Housing Units | 2,342 | 100.0% |
Occupancy by Household Size in Montevideo
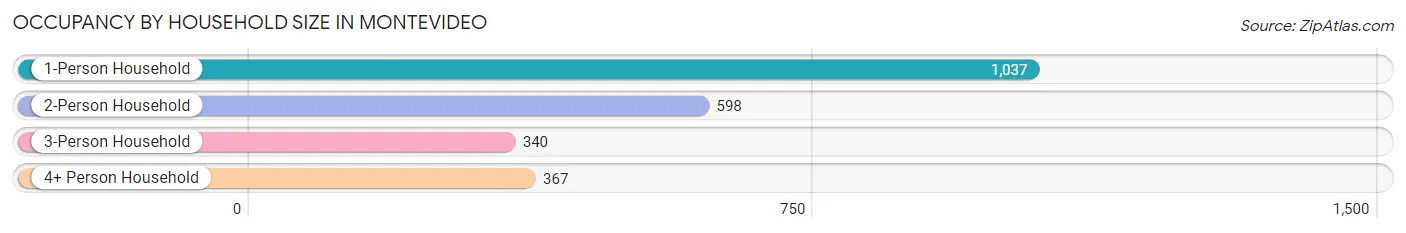
| Household Size | # Housing Units | % Housing Units |
| 1-Person Household | 1,037 | 44.3% |
| 2-Person Household | 598 | 25.5% |
| 3-Person Household | 340 | 14.5% |
| 4+ Person Household | 367 | 15.7% |
| Total Housing Units | 2,342 | 100.0% |
Occupancy by Ownership by Household Size in Montevideo
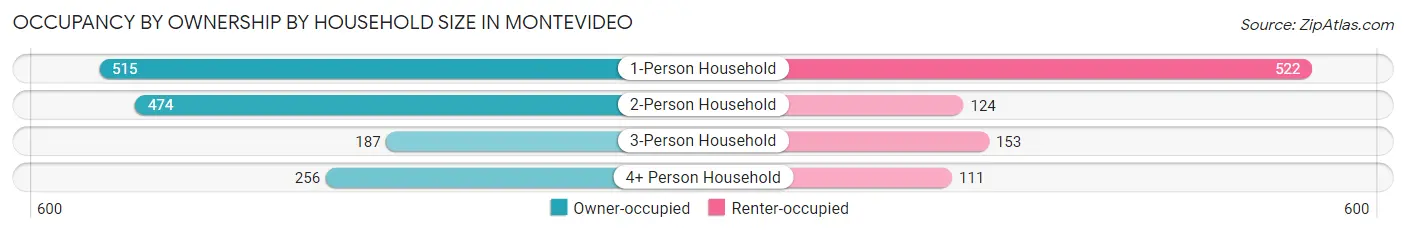
| Household Size | Owner-occupied | Renter-occupied |
| 1-Person Household | 515 (49.7%) | 522 (50.3%) |
| 2-Person Household | 474 (79.3%) | 124 (20.7%) |
| 3-Person Household | 187 (55.0%) | 153 (45.0%) |
| 4+ Person Household | 256 (69.8%) | 111 (30.2%) |
| Total Housing Units | 1,432 (61.1%) | 910 (38.9%) |
Occupancy by Educational Attainment in Montevideo
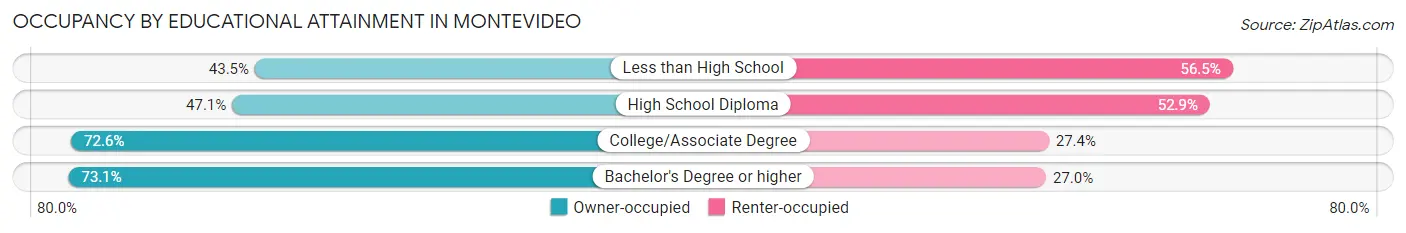
| Household Size | Owner-occupied | Renter-occupied |
| Less than High School | 70 (43.5%) | 91 (56.5%) |
| High School Diploma | 413 (47.1%) | 464 (52.9%) |
| College/Associate Degree | 602 (72.6%) | 227 (27.4%) |
| Bachelor's Degree or higher | 347 (73.1%) | 128 (27.0%) |
Occupancy by Age of Householder in Montevideo
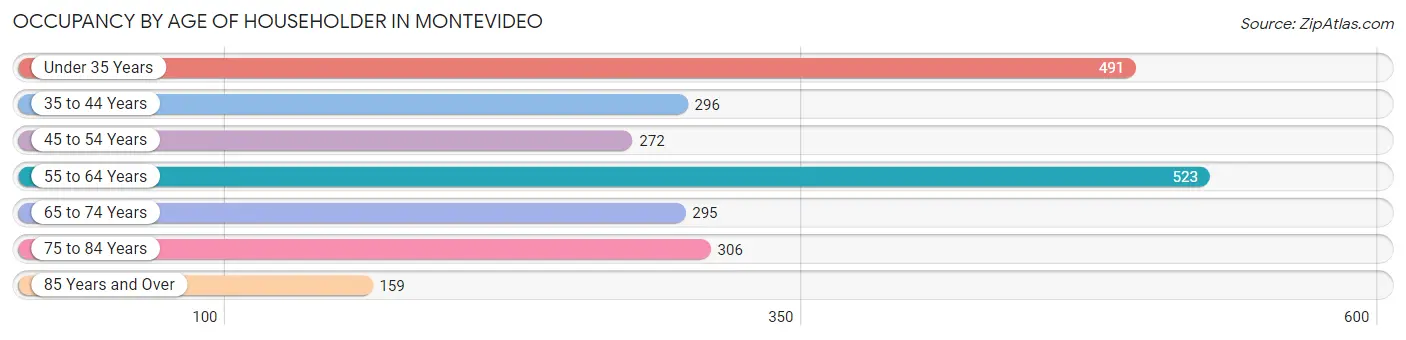
| Age Bracket | # Households | % Households |
| Under 35 Years | 491 | 21.0% |
| 35 to 44 Years | 296 | 12.6% |
| 45 to 54 Years | 272 | 11.6% |
| 55 to 64 Years | 523 | 22.3% |
| 65 to 74 Years | 295 | 12.6% |
| 75 to 84 Years | 306 | 13.1% |
| 85 Years and Over | 159 | 6.8% |
| Total | 2,342 | 100.0% |
Housing Finances in Montevideo
Median Income by Occupancy in Montevideo
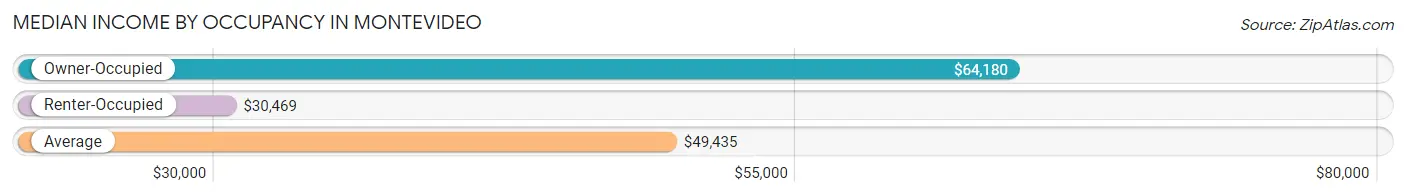
| Occupancy Type | # Households | Median Income |
| Owner-Occupied | 1,432 (61.1%) | $64,180 |
| Renter-Occupied | 910 (38.9%) | $30,469 |
| Average | 2,342 (100.0%) | $49,435 |
Occupancy by Householder Income Bracket in Montevideo
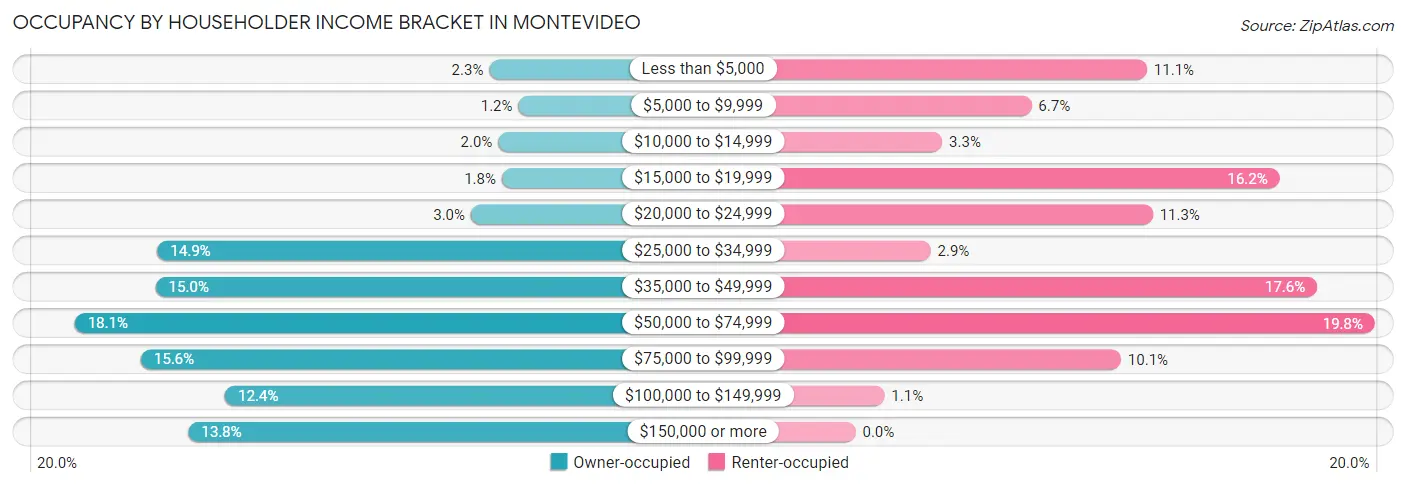
| Income Bracket | Owner-occupied | Renter-occupied |
| Less than $5,000 | 33 (2.3%) | 101 (11.1%) |
| $5,000 to $9,999 | 17 (1.2%) | 61 (6.7%) |
| $10,000 to $14,999 | 28 (2.0%) | 30 (3.3%) |
| $15,000 to $19,999 | 26 (1.8%) | 147 (16.2%) |
| $20,000 to $24,999 | 43 (3.0%) | 103 (11.3%) |
| $25,000 to $34,999 | 214 (14.9%) | 26 (2.9%) |
| $35,000 to $49,999 | 215 (15.0%) | 160 (17.6%) |
| $50,000 to $74,999 | 259 (18.1%) | 180 (19.8%) |
| $75,000 to $99,999 | 223 (15.6%) | 92 (10.1%) |
| $100,000 to $149,999 | 177 (12.4%) | 10 (1.1%) |
| $150,000 or more | 197 (13.8%) | 0 (0.0%) |
| Total | 1,432 (100.0%) | 910 (100.0%) |
Monthly Housing Cost Tiers in Montevideo
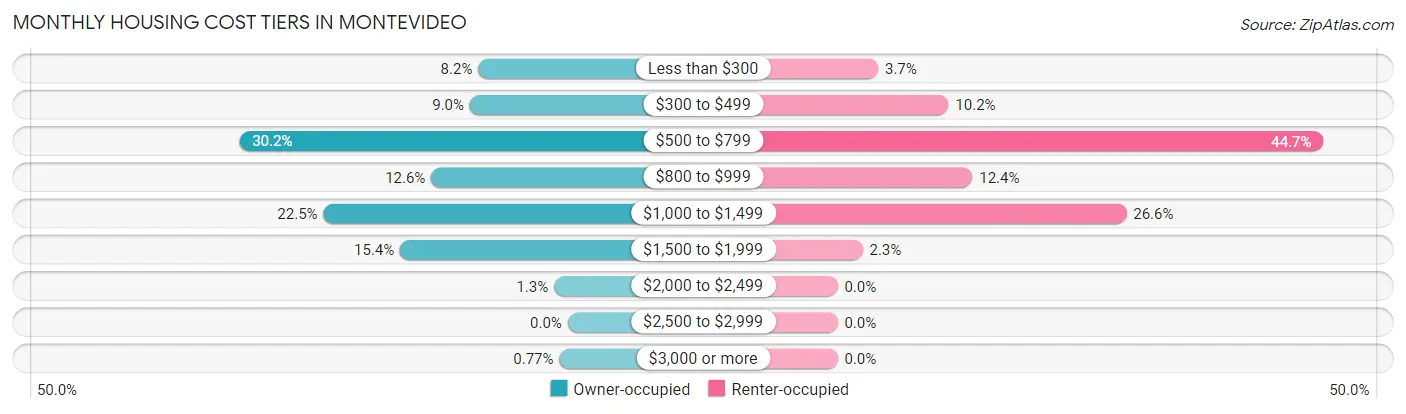
| Monthly Cost | Owner-occupied | Renter-occupied |
| Less than $300 | 118 (8.2%) | 34 (3.7%) |
| $300 to $499 | 129 (9.0%) | 93 (10.2%) |
| $500 to $799 | 433 (30.2%) | 407 (44.7%) |
| $800 to $999 | 180 (12.6%) | 113 (12.4%) |
| $1,000 to $1,499 | 322 (22.5%) | 242 (26.6%) |
| $1,500 to $1,999 | 221 (15.4%) | 21 (2.3%) |
| $2,000 to $2,499 | 18 (1.3%) | 0 (0.0%) |
| $2,500 to $2,999 | 0 (0.0%) | 0 (0.0%) |
| $3,000 or more | 11 (0.8%) | 0 (0.0%) |
| Total | 1,432 (100.0%) | 910 (100.0%) |
Physical Housing Characteristics in Montevideo
Housing Structures in Montevideo
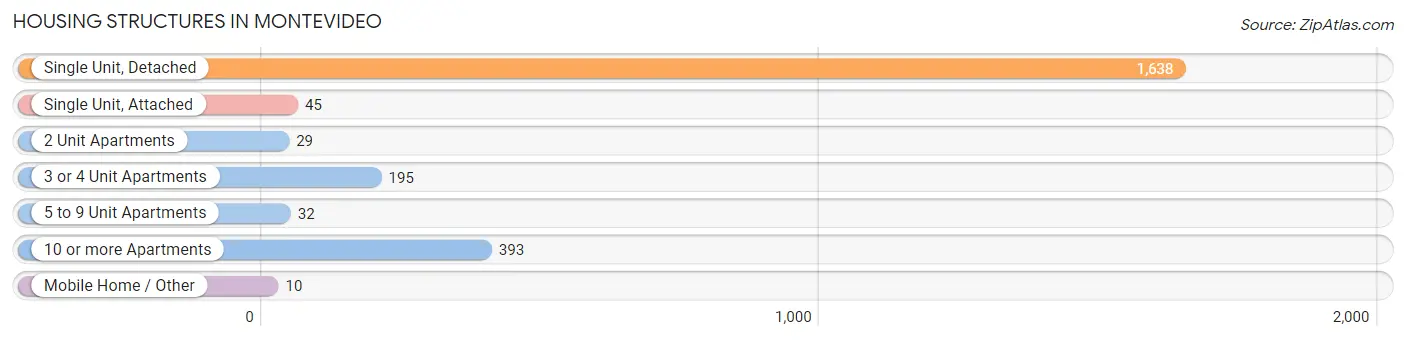
| Structure Type | # Housing Units | % Housing Units |
| Single Unit, Detached | 1,638 | 69.9% |
| Single Unit, Attached | 45 | 1.9% |
| 2 Unit Apartments | 29 | 1.2% |
| 3 or 4 Unit Apartments | 195 | 8.3% |
| 5 to 9 Unit Apartments | 32 | 1.4% |
| 10 or more Apartments | 393 | 16.8% |
| Mobile Home / Other | 10 | 0.4% |
| Total | 2,342 | 100.0% |
Housing Structures by Occupancy in Montevideo
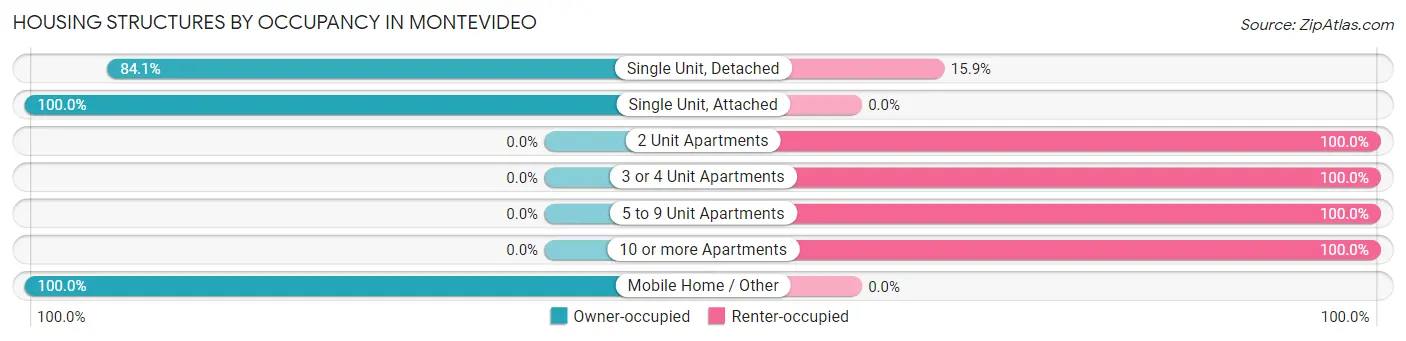
| Structure Type | Owner-occupied | Renter-occupied |
| Single Unit, Detached | 1,377 (84.1%) | 261 (15.9%) |
| Single Unit, Attached | 45 (100.0%) | 0 (0.0%) |
| 2 Unit Apartments | 0 (0.0%) | 29 (100.0%) |
| 3 or 4 Unit Apartments | 0 (0.0%) | 195 (100.0%) |
| 5 to 9 Unit Apartments | 0 (0.0%) | 32 (100.0%) |
| 10 or more Apartments | 0 (0.0%) | 393 (100.0%) |
| Mobile Home / Other | 10 (100.0%) | 0 (0.0%) |
| Total | 1,432 (61.1%) | 910 (38.9%) |
Housing Structures by Number of Rooms in Montevideo
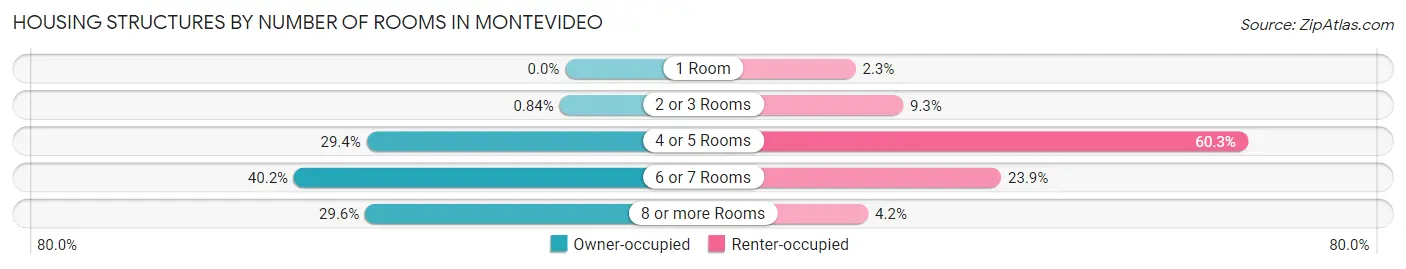
| Number of Rooms | Owner-occupied | Renter-occupied |
| 1 Room | 0 (0.0%) | 21 (2.3%) |
| 2 or 3 Rooms | 12 (0.8%) | 85 (9.3%) |
| 4 or 5 Rooms | 421 (29.4%) | 549 (60.3%) |
| 6 or 7 Rooms | 575 (40.2%) | 217 (23.8%) |
| 8 or more Rooms | 424 (29.6%) | 38 (4.2%) |
| Total | 1,432 (100.0%) | 910 (100.0%) |
Housing Structure by Heating Type in Montevideo
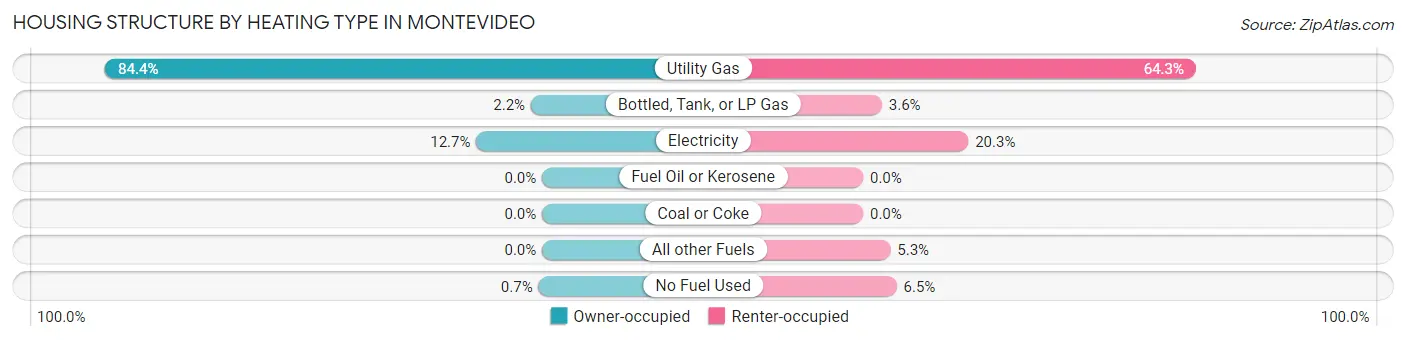
| Heating Type | Owner-occupied | Renter-occupied |
| Utility Gas | 1,209 (84.4%) | 585 (64.3%) |
| Bottled, Tank, or LP Gas | 31 (2.2%) | 33 (3.6%) |
| Electricity | 182 (12.7%) | 185 (20.3%) |
| Fuel Oil or Kerosene | 0 (0.0%) | 0 (0.0%) |
| Coal or Coke | 0 (0.0%) | 0 (0.0%) |
| All other Fuels | 0 (0.0%) | 48 (5.3%) |
| No Fuel Used | 10 (0.7%) | 59 (6.5%) |
| Total | 1,432 (100.0%) | 910 (100.0%) |
Household Vehicle Usage in Montevideo
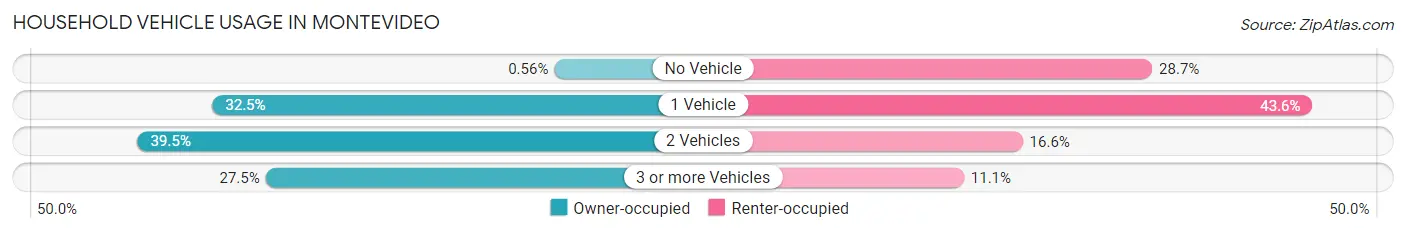
| Vehicles per Household | Owner-occupied | Renter-occupied |
| No Vehicle | 8 (0.6%) | 261 (28.7%) |
| 1 Vehicle | 465 (32.5%) | 397 (43.6%) |
| 2 Vehicles | 565 (39.5%) | 151 (16.6%) |
| 3 or more Vehicles | 394 (27.5%) | 101 (11.1%) |
| Total | 1,432 (100.0%) | 910 (100.0%) |
Real Estate & Mortgages in Montevideo
Real Estate and Mortgage Overview in Montevideo
| Characteristic | Without Mortgage | With Mortgage |
| Housing Units | 405 | 1,027 |
| Median Property Value | $107,400 | $128,200 |
| Median Household Income | $47,279 | $172 |
| Monthly Housing Costs | $459 | $11 |
| Real Estate Taxes | $1,340 | $40 |
Property Value by Mortgage Status in Montevideo
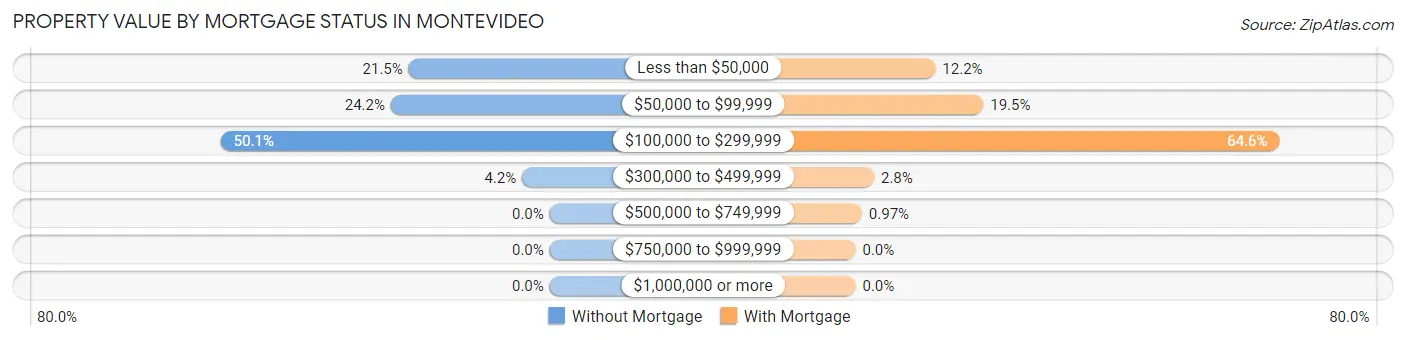
| Property Value | Without Mortgage | With Mortgage |
| Less than $50,000 | 87 (21.5%) | 125 (12.2%) |
| $50,000 to $99,999 | 98 (24.2%) | 200 (19.5%) |
| $100,000 to $299,999 | 203 (50.1%) | 663 (64.6%) |
| $300,000 to $499,999 | 17 (4.2%) | 29 (2.8%) |
| $500,000 to $749,999 | 0 (0.0%) | 10 (1.0%) |
| $750,000 to $999,999 | 0 (0.0%) | 0 (0.0%) |
| $1,000,000 or more | 0 (0.0%) | 0 (0.0%) |
| Total | 405 (100.0%) | 1,027 (100.0%) |
Household Income by Mortgage Status in Montevideo
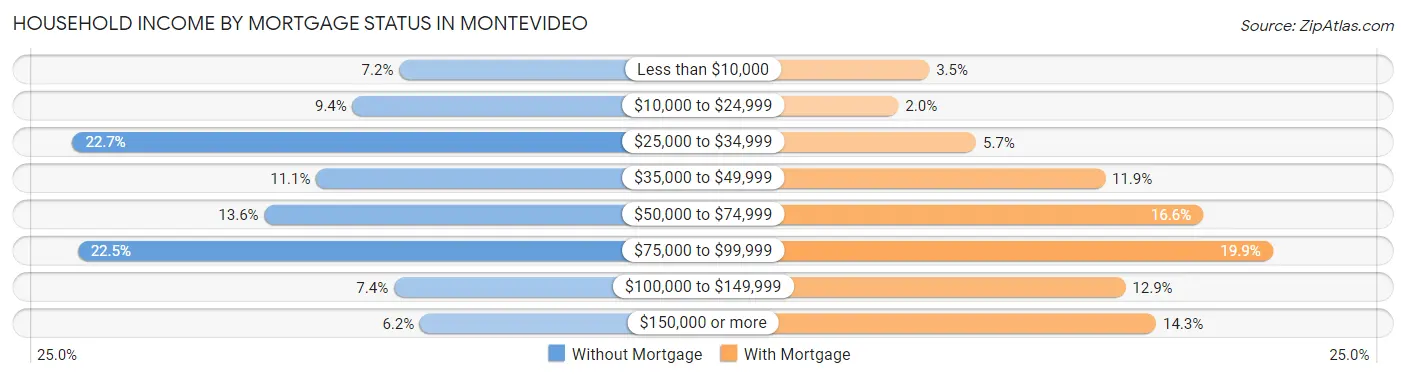
| Household Income | Without Mortgage | With Mortgage |
| Less than $10,000 | 29 (7.2%) | 36 (3.5%) |
| $10,000 to $24,999 | 38 (9.4%) | 21 (2.0%) |
| $25,000 to $34,999 | 92 (22.7%) | 59 (5.7%) |
| $35,000 to $49,999 | 45 (11.1%) | 122 (11.9%) |
| $50,000 to $74,999 | 55 (13.6%) | 170 (16.6%) |
| $75,000 to $99,999 | 91 (22.5%) | 204 (19.9%) |
| $100,000 to $149,999 | 30 (7.4%) | 132 (12.9%) |
| $150,000 or more | 25 (6.2%) | 147 (14.3%) |
| Total | 405 (100.0%) | 1,027 (100.0%) |
Property Value to Household Income Ratio in Montevideo
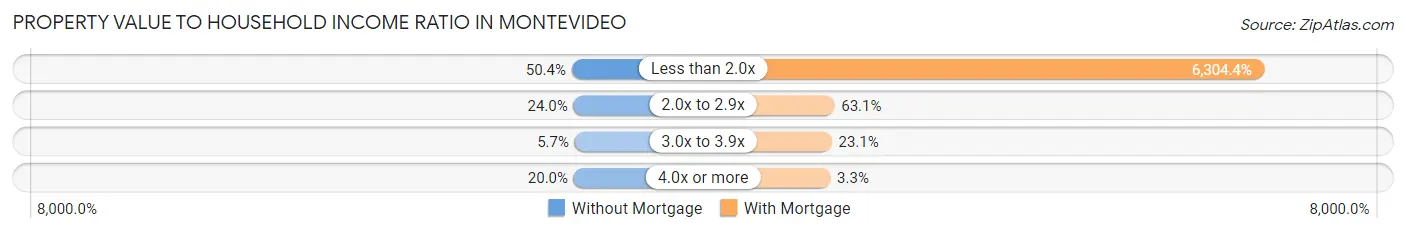
| Value-to-Income Ratio | Without Mortgage | With Mortgage |
| Less than 2.0x | 204 (50.4%) | 64,746 (6,304.4%) |
| 2.0x to 2.9x | 97 (23.9%) | 648 (63.1%) |
| 3.0x to 3.9x | 23 (5.7%) | 237 (23.1%) |
| 4.0x or more | 81 (20.0%) | 34 (3.3%) |
| Total | 405 (100.0%) | 1,027 (100.0%) |
Real Estate Taxes by Mortgage Status in Montevideo
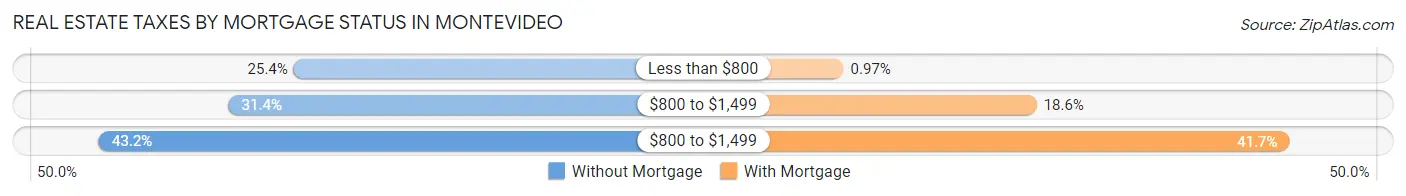
| Property Taxes | Without Mortgage | With Mortgage |
| Less than $800 | 103 (25.4%) | 10 (1.0%) |
| $800 to $1,499 | 127 (31.4%) | 191 (18.6%) |
| $800 to $1,499 | 175 (43.2%) | 428 (41.7%) |
| Total | 405 (100.0%) | 1,027 (100.0%) |
Health & Disability in Montevideo
Health Insurance Coverage by Age in Montevideo
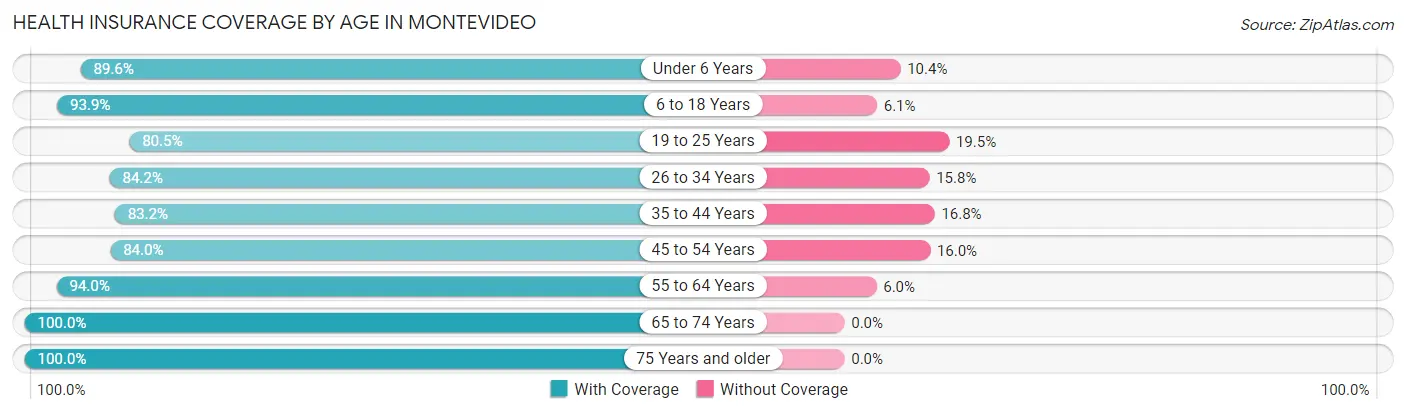
| Age Bracket | With Coverage | Without Coverage |
| Under 6 Years | 352 (89.6%) | 41 (10.4%) |
| 6 to 18 Years | 868 (93.9%) | 56 (6.1%) |
| 19 to 25 Years | 334 (80.5%) | 81 (19.5%) |
| 26 to 34 Years | 510 (84.2%) | 96 (15.8%) |
| 35 to 44 Years | 480 (83.2%) | 97 (16.8%) |
| 45 to 54 Years | 421 (84.0%) | 80 (16.0%) |
| 55 to 64 Years | 694 (94.0%) | 44 (6.0%) |
| 65 to 74 Years | 455 (100.0%) | 0 (0.0%) |
| 75 Years and older | 602 (100.0%) | 0 (0.0%) |
| Total | 4,716 (90.5%) | 495 (9.5%) |
Health Insurance Coverage by Citizenship Status in Montevideo
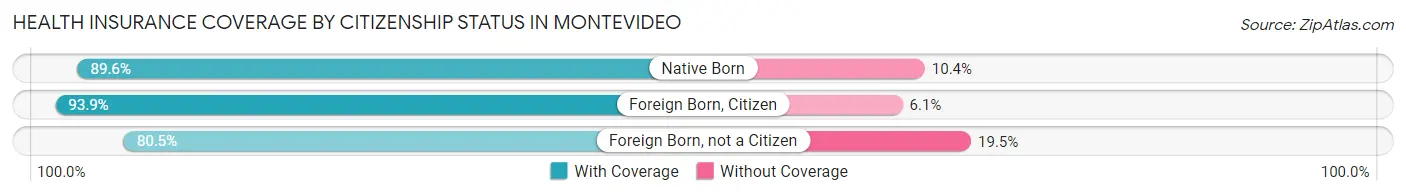
| Citizenship Status | With Coverage | Without Coverage |
| Native Born | 352 (89.6%) | 41 (10.4%) |
| Foreign Born, Citizen | 868 (93.9%) | 56 (6.1%) |
| Foreign Born, not a Citizen | 334 (80.5%) | 81 (19.5%) |
Health Insurance Coverage by Household Income in Montevideo
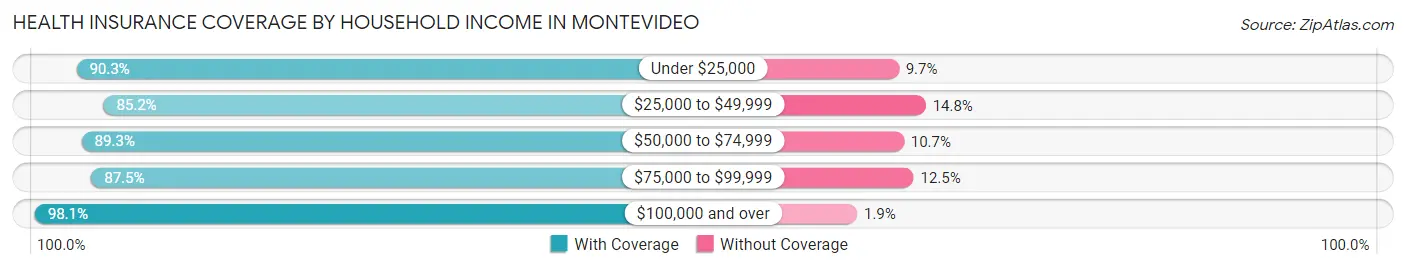
| Household Income | With Coverage | Without Coverage |
| Under $25,000 | 752 (90.3%) | 81 (9.7%) |
| $25,000 to $49,999 | 1,061 (85.2%) | 184 (14.8%) |
| $50,000 to $74,999 | 803 (89.3%) | 96 (10.7%) |
| $75,000 to $99,999 | 762 (87.5%) | 109 (12.5%) |
| $100,000 and over | 1,279 (98.1%) | 25 (1.9%) |
Public vs Private Health Insurance Coverage by Age in Montevideo
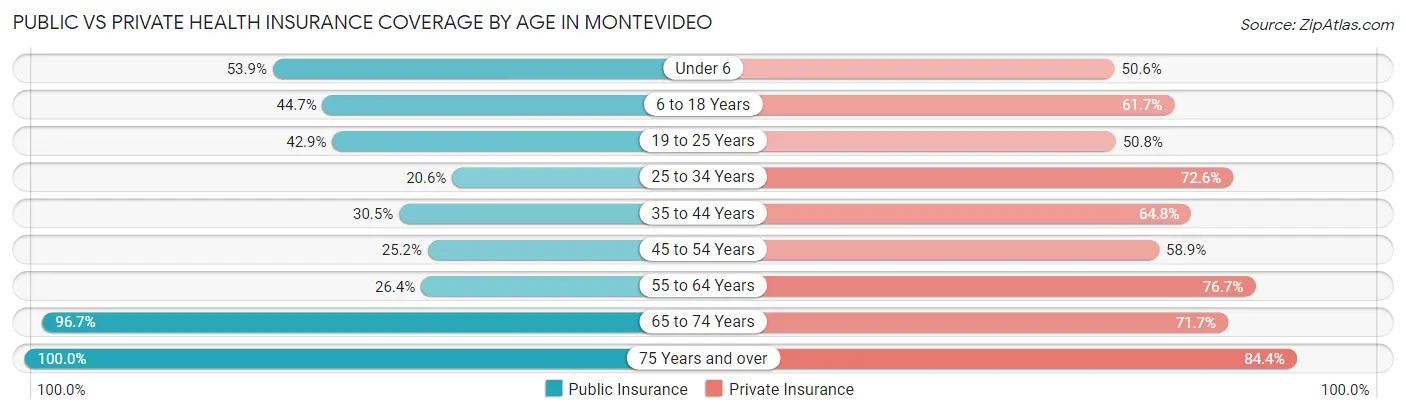
| Age Bracket | Public Insurance | Private Insurance |
| Under 6 | 212 (53.9%) | 199 (50.6%) |
| 6 to 18 Years | 413 (44.7%) | 570 (61.7%) |
| 19 to 25 Years | 178 (42.9%) | 211 (50.8%) |
| 25 to 34 Years | 125 (20.6%) | 440 (72.6%) |
| 35 to 44 Years | 176 (30.5%) | 374 (64.8%) |
| 45 to 54 Years | 126 (25.2%) | 295 (58.9%) |
| 55 to 64 Years | 195 (26.4%) | 566 (76.7%) |
| 65 to 74 Years | 440 (96.7%) | 326 (71.7%) |
| 75 Years and over | 602 (100.0%) | 508 (84.4%) |
| Total | 2,467 (47.3%) | 3,489 (66.9%) |
Disability Status by Sex by Age in Montevideo
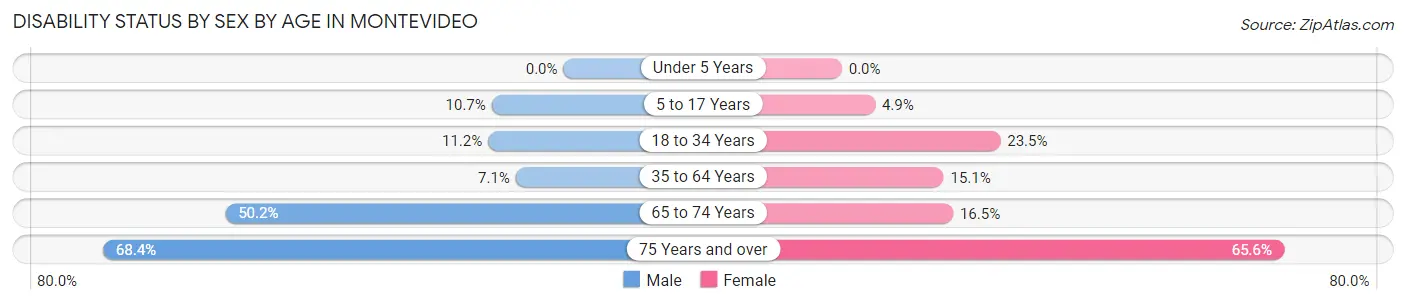
| Age Bracket | Male | Female |
| Under 5 Years | 0 (0.0%) | 0 (0.0%) |
| 5 to 17 Years | 51 (10.6%) | 24 (4.9%) |
| 18 to 34 Years | 71 (11.2%) | 97 (23.5%) |
| 35 to 64 Years | 70 (7.1%) | 125 (15.1%) |
| 65 to 74 Years | 119 (50.2%) | 36 (16.5%) |
| 75 Years and over | 147 (68.4%) | 254 (65.6%) |
Disability Class by Sex by Age in Montevideo
Disability Class: Hearing Difficulty
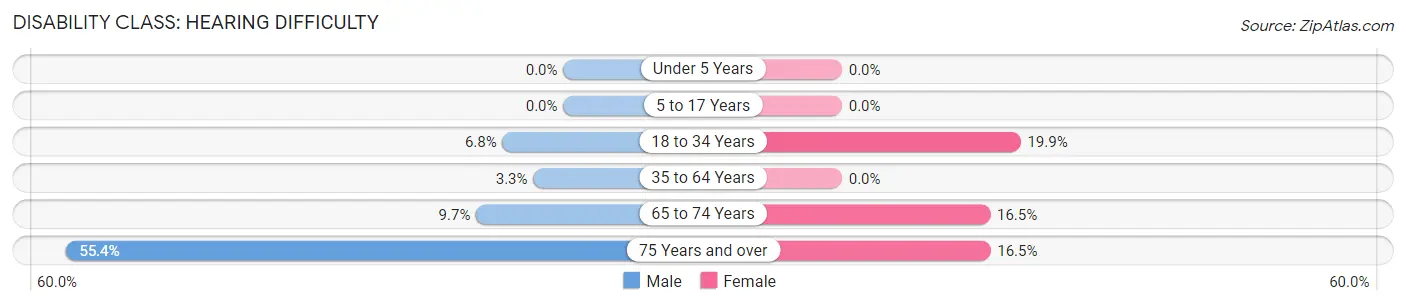
| Age Bracket | Male | Female |
| Under 5 Years | 0 (0.0%) | 0 (0.0%) |
| 5 to 17 Years | 0 (0.0%) | 0 (0.0%) |
| 18 to 34 Years | 43 (6.8%) | 82 (19.9%) |
| 35 to 64 Years | 33 (3.3%) | 0 (0.0%) |
| 65 to 74 Years | 23 (9.7%) | 36 (16.5%) |
| 75 Years and over | 119 (55.3%) | 64 (16.5%) |
Disability Class: Vision Difficulty
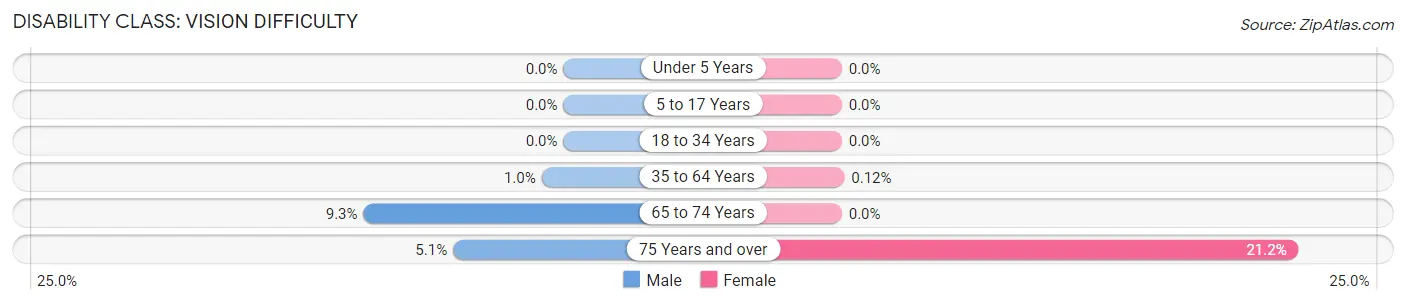
| Age Bracket | Male | Female |
| Under 5 Years | 0 (0.0%) | 0 (0.0%) |
| 5 to 17 Years | 0 (0.0%) | 0 (0.0%) |
| 18 to 34 Years | 0 (0.0%) | 0 (0.0%) |
| 35 to 64 Years | 10 (1.0%) | 1 (0.1%) |
| 65 to 74 Years | 22 (9.3%) | 0 (0.0%) |
| 75 Years and over | 11 (5.1%) | 82 (21.2%) |
Disability Class: Cognitive Difficulty
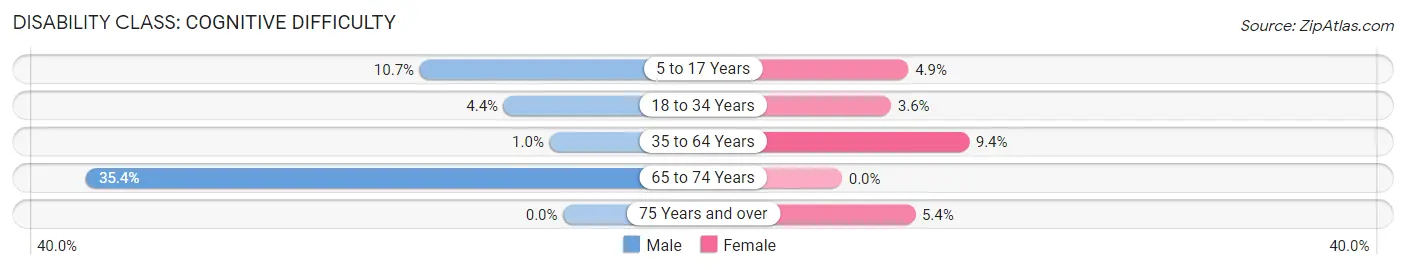
| Age Bracket | Male | Female |
| 5 to 17 Years | 51 (10.6%) | 24 (4.9%) |
| 18 to 34 Years | 28 (4.4%) | 15 (3.6%) |
| 35 to 64 Years | 10 (1.0%) | 78 (9.4%) |
| 65 to 74 Years | 84 (35.4%) | 0 (0.0%) |
| 75 Years and over | 0 (0.0%) | 21 (5.4%) |
Disability Class: Ambulatory Difficulty
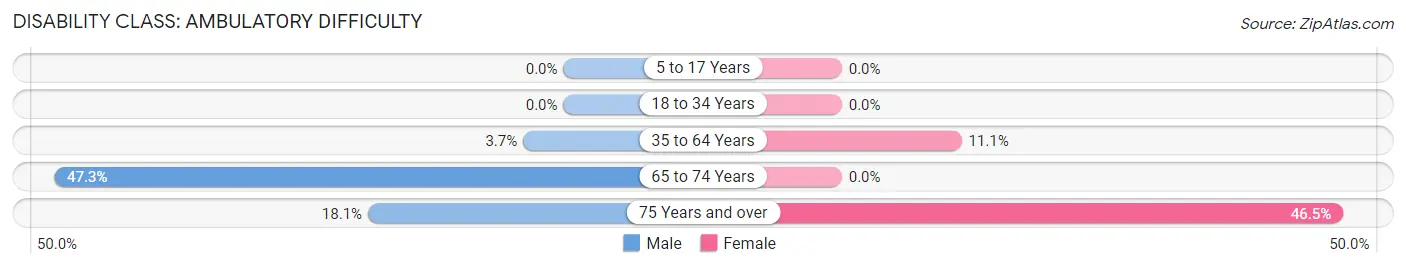
| Age Bracket | Male | Female |
| 5 to 17 Years | 0 (0.0%) | 0 (0.0%) |
| 18 to 34 Years | 0 (0.0%) | 0 (0.0%) |
| 35 to 64 Years | 37 (3.7%) | 92 (11.1%) |
| 65 to 74 Years | 112 (47.3%) | 0 (0.0%) |
| 75 Years and over | 39 (18.1%) | 180 (46.5%) |
Disability Class: Self-Care Difficulty
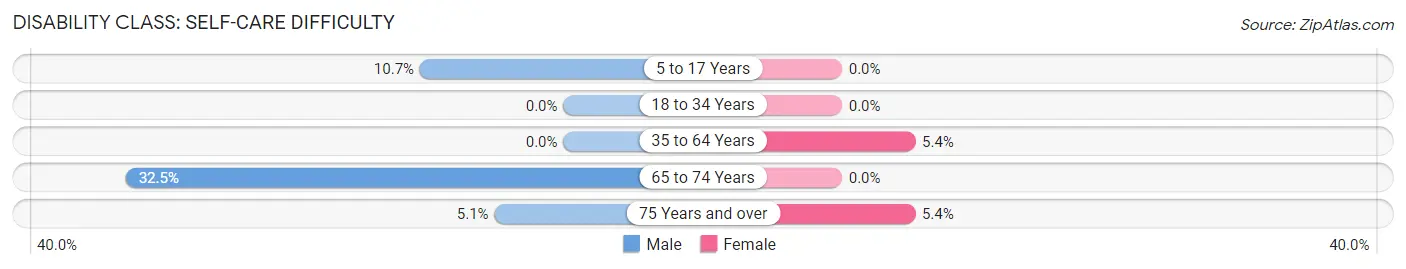
| Age Bracket | Male | Female |
| 5 to 17 Years | 51 (10.6%) | 0 (0.0%) |
| 18 to 34 Years | 0 (0.0%) | 0 (0.0%) |
| 35 to 64 Years | 0 (0.0%) | 45 (5.4%) |
| 65 to 74 Years | 77 (32.5%) | 0 (0.0%) |
| 75 Years and over | 11 (5.1%) | 21 (5.4%) |
Technology Access in Montevideo
Computing Device Access in Montevideo
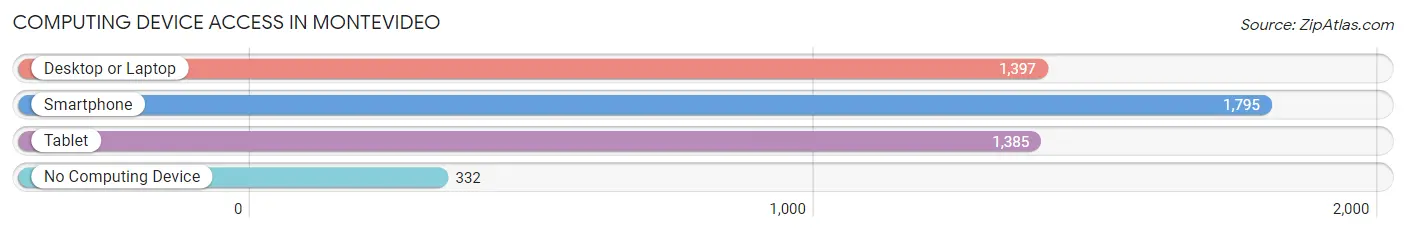
| Device Type | # Households | % Households |
| Desktop or Laptop | 1,397 | 59.7% |
| Smartphone | 1,795 | 76.6% |
| Tablet | 1,385 | 59.1% |
| No Computing Device | 332 | 14.2% |
| Total | 2,342 | 100.0% |
Internet Access in Montevideo
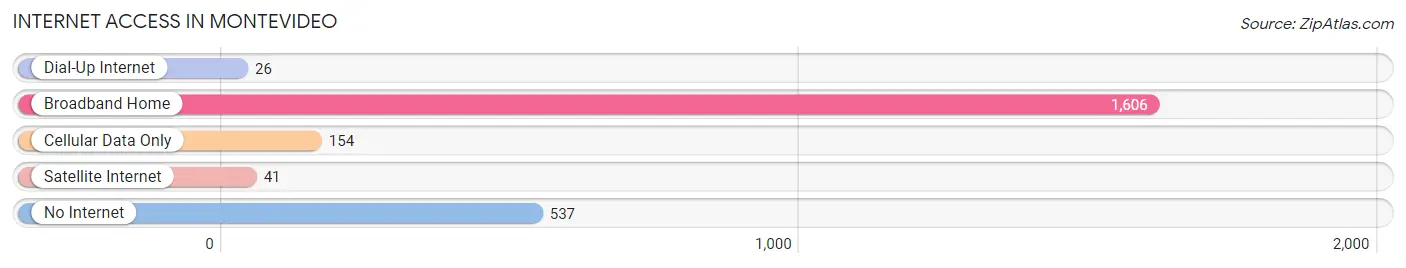
| Internet Type | # Households | % Households |
| Dial-Up Internet | 26 | 1.1% |
| Broadband Home | 1,606 | 68.6% |
| Cellular Data Only | 154 | 6.6% |
| Satellite Internet | 41 | 1.8% |
| No Internet | 537 | 22.9% |
| Total | 2,342 | 100.0% |
Montevideo Summary
Montevideo is a city located in Chippewa County, Minnesota, United States. It is the county seat of Chippewa County and is located along the Minnesota River. As of the 2010 census, the city had a population of 5,435.
History
Montevideo was founded in 1868 by a group of settlers from Montevideo, Uruguay. The city was named after the Uruguayan capital, and the settlers were hoping to recreate the same atmosphere of their homeland. The city was incorporated in 1887 and was the first city in Chippewa County.
The city was an important trading center for the area, and it was also a major stop on the Great Northern Railway. The city was also home to a number of industries, including a flour mill, a creamery, a brewery, and a brickyard.
Geography
Montevideo is located at the confluence of the Minnesota and Chippewa Rivers. The city is situated on the western edge of the Minnesota River Valley, and is surrounded by rolling hills and bluffs. The city is located approximately 75 miles west of Minneapolis and St. Paul.
The city has a total area of 4.2 square miles, of which 4.1 square miles is land and 0.1 square miles is water.
Economy
Montevideo is a small city with a diverse economy. The city is home to a number of businesses, including manufacturing, retail, and service industries. The city is also home to a number of government offices, including the Chippewa County Courthouse and the Chippewa County Sheriff's Office.
The city is also home to a number of educational institutions, including the University of Minnesota-Morris, Minnesota West Community and Technical College, and the Montevideo Public Schools.
Demographics
As of the 2010 census, there were 5,435 people, 2,093 households, and 1,323 families residing in the city. The population density was 1,312.3 people per square mile. The racial makeup of the city was 92.2% White, 0.7% African American, 0.3% Native American, 0.3% Asian, 4.3% from other races, and 2.2% from two or more races. Hispanic or Latino of any race were 8.2% of the population.
The median income for a household in the city was $37,917, and the median income for a family was $48,958. The per capita income for the city was $19,845. About 11.2% of families and 14.2% of the population were below the poverty line, including 19.2% of those under age 18 and 8.2% of those age 65 or over.
Common Questions
What is Per Capita Income in Montevideo?
Per Capita income in Montevideo is $28,170.
What is the Median Family Income in Montevideo?
Median Family Income in Montevideo is $66,694.
What is the Median Household income in Montevideo?
Median Household Income in Montevideo is $49,435.
What is Income or Wage Gap in Montevideo?
Income or Wage Gap in Montevideo is 25.1%.
Women in Montevideo earn 74.9 cents for every dollar earned by a man.
What is Inequality or Gini Index in Montevideo?
Inequality or Gini Index in Montevideo is 0.42.
What is the Total Population of Montevideo?
Total Population of Montevideo is 5,350.
What is the Total Male Population of Montevideo?
Total Male Population of Montevideo is 2,801.
What is the Total Female Population of Montevideo?
Total Female Population of Montevideo is 2,549.
What is the Ratio of Males per 100 Females in Montevideo?
There are 109.89 Males per 100 Females in Montevideo.
What is the Ratio of Females per 100 Males in Montevideo?
There are 91.00 Females per 100 Males in Montevideo.
What is the Median Population Age in Montevideo?
Median Population Age in Montevideo is 42.0 Years.
What is the Average Family Size in Montevideo
Average Family Size in Montevideo is 3.1 People.
What is the Average Household Size in Montevideo
Average Household Size in Montevideo is 2.2 People.
How Large is the Labor Force in Montevideo?
There are 2,610 People in the Labor Forcein in Montevideo.
What is the Percentage of People in the Labor Force in Montevideo?
60.8% of People are in the Labor Force in Montevideo.
What is the Unemployment Rate in Montevideo?
Unemployment Rate in Montevideo is 4.2%.