Glencoe, MN Map & Demographics
Glencoe Map
Glencoe Overview
$32,665
PER CAPITA INCOME
$83,484
AVG FAMILY INCOME
$67,547
AVG HOUSEHOLD INCOME
26.6%
WAGE / INCOME GAP [ % ]
73.4¢/ $1
WAGE / INCOME GAP [ $ ]
0.37
INEQUALITY / GINI INDEX
5,712
TOTAL POPULATION
2,970
MALE POPULATION
2,742
FEMALE POPULATION
108.32
MALES / 100 FEMALES
92.32
FEMALES / 100 MALES
37.6
MEDIAN AGE
3.1
AVG FAMILY SIZE
2.5
AVG HOUSEHOLD SIZE
2,951
LABOR FORCE [ PEOPLE ]
64.6%
PERCENT IN LABOR FORCE
2.1%
UNEMPLOYMENT RATE
Glencoe Zip Codes
Glencoe Area Codes
Income in Glencoe
Income Overview in Glencoe
Per Capita Income in Glencoe is $32,665, while median incomes of families and households are $83,484 and $67,547 respectively.
| Characteristic | Number | Measure |
| Per Capita Income | 5,712 | $32,665 |
| Median Family Income | 1,461 | $83,484 |
| Mean Family Income | 1,461 | $91,177 |
| Median Household Income | 2,215 | $67,547 |
| Mean Household Income | 2,215 | $80,705 |
| Income Deficit | 1,461 | $0 |
| Wage / Income Gap (%) | 5,712 | 26.63% |
| Wage / Income Gap ($) | 5,712 | 73.37¢ per $1 |
| Gini / Inequality Index | 5,712 | 0.37 |
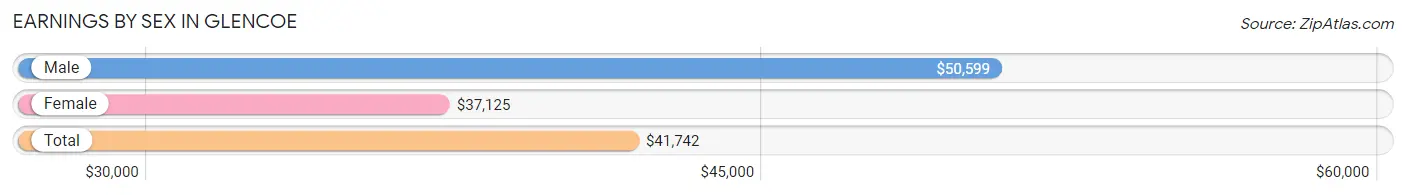
Earnings by Sex in Glencoe
Average Earnings in Glencoe are $41,742, $50,599 for men and $37,125 for women, a difference of 26.6%.
| Sex | Number | Average Earnings |
| Male | 1,621 (54.2%) | $50,599 |
| Female | 1,367 (45.8%) | $37,125 |
| Total | 2,988 (100.0%) | $41,742 |
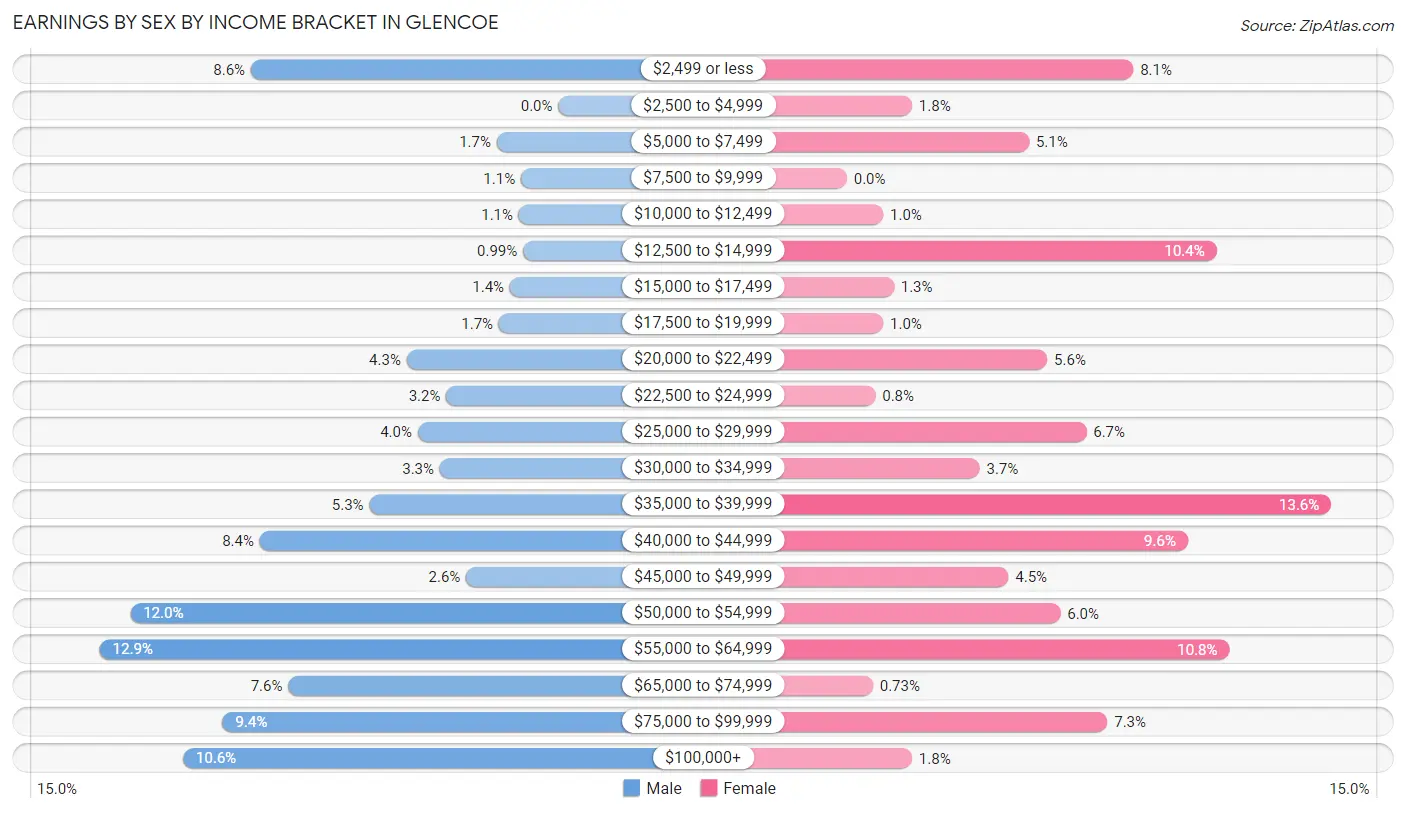
Earnings by Sex by Income Bracket in Glencoe
The most common earnings brackets in Glencoe are $55,000 to $64,999 for men (209 | 12.9%) and $35,000 to $39,999 for women (186 | 13.6%).
| Income | Male | Female |
| $2,499 or less | 140 (8.6%) | 110 (8.1%) |
| $2,500 to $4,999 | 0 (0.0%) | 25 (1.8%) |
| $5,000 to $7,499 | 28 (1.7%) | 70 (5.1%) |
| $7,500 to $9,999 | 17 (1.1%) | 0 (0.0%) |
| $10,000 to $12,499 | 18 (1.1%) | 14 (1.0%) |
| $12,500 to $14,999 | 16 (1.0%) | 142 (10.4%) |
| $15,000 to $17,499 | 22 (1.4%) | 18 (1.3%) |
| $17,500 to $19,999 | 27 (1.7%) | 14 (1.0%) |
| $20,000 to $22,499 | 69 (4.3%) | 77 (5.6%) |
| $22,500 to $24,999 | 51 (3.2%) | 11 (0.8%) |
| $25,000 to $29,999 | 64 (4.0%) | 92 (6.7%) |
| $30,000 to $34,999 | 54 (3.3%) | 51 (3.7%) |
| $35,000 to $39,999 | 86 (5.3%) | 186 (13.6%) |
| $40,000 to $44,999 | 136 (8.4%) | 131 (9.6%) |
| $45,000 to $49,999 | 42 (2.6%) | 62 (4.5%) |
| $50,000 to $54,999 | 195 (12.0%) | 82 (6.0%) |
| $55,000 to $64,999 | 209 (12.9%) | 147 (10.7%) |
| $65,000 to $74,999 | 123 (7.6%) | 10 (0.7%) |
| $75,000 to $99,999 | 153 (9.4%) | 100 (7.3%) |
| $100,000+ | 171 (10.5%) | 25 (1.8%) |
| Total | 1,621 (100.0%) | 1,367 (100.0%) |
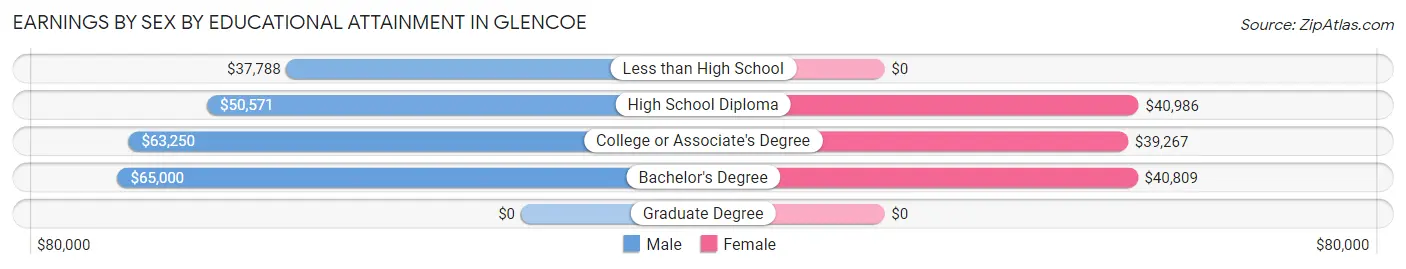
Earnings by Sex by Educational Attainment in Glencoe
Average earnings in Glencoe are $51,938 for men and $40,156 for women, a difference of 22.7%. Men with an educational attainment of bachelor's degree enjoy the highest average annual earnings of $65,000, while those with less than high school education earn the least with $37,788. Women with an educational attainment of high school diploma earn the most with the average annual earnings of $40,986, while those with college or associate's degree education have the smallest earnings of $39,267.
| Educational Attainment | Male Income | Female Income |
| Less than High School | $37,788 | $0 |
| High School Diploma | $50,571 | $40,986 |
| College or Associate's Degree | $63,250 | $39,267 |
| Bachelor's Degree | $65,000 | $40,809 |
| Graduate Degree | - | - |
| Total | $51,938 | $40,156 |
Family Income in Glencoe
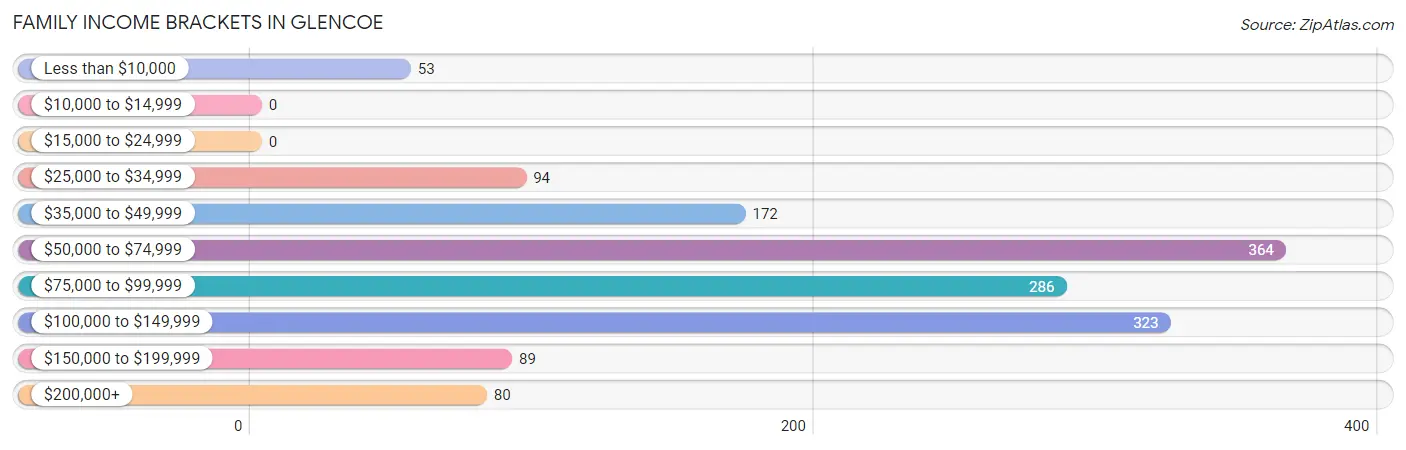
Family Income Brackets in Glencoe
According to the Glencoe family income data, there are 364 families falling into the $50,000 to $74,999 income range, which is the most common income bracket and makes up 24.9% of all families.
| Income Bracket | # Families | % Families |
| Less than $10,000 | 53 | 3.6% |
| $10,000 to $14,999 | 0 | 0.0% |
| $15,000 to $24,999 | 0 | 0.0% |
| $25,000 to $34,999 | 94 | 6.4% |
| $35,000 to $49,999 | 172 | 11.8% |
| $50,000 to $74,999 | 364 | 24.9% |
| $75,000 to $99,999 | 286 | 19.6% |
| $100,000 to $149,999 | 323 | 22.1% |
| $150,000 to $199,999 | 89 | 6.1% |
| $200,000+ | 80 | 5.5% |
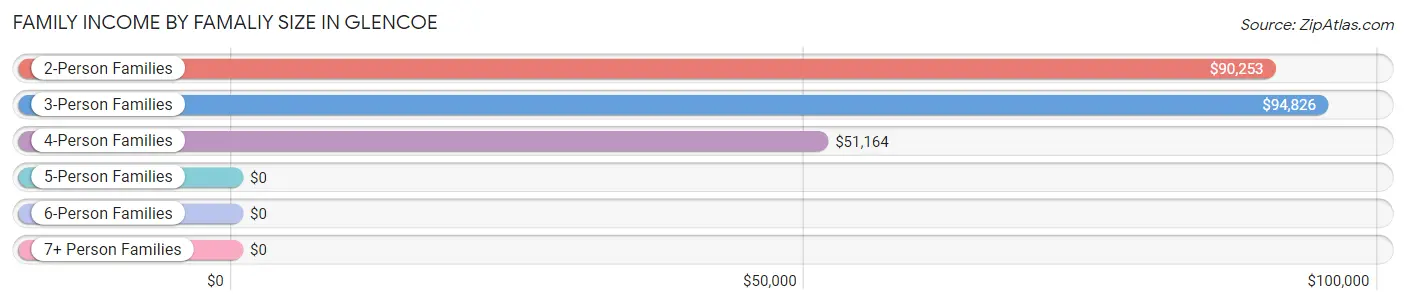
Family Income by Famaliy Size in Glencoe
3-person families (198 | 13.6%) account for the highest median family income in Glencoe with $94,826 per family, while 2-person families (803 | 55.0%) have the highest median income of $45,126 per family member.
| Income Bracket | # Families | Median Income |
| 2-Person Families | 803 (55.0%) | $90,253 |
| 3-Person Families | 198 (13.6%) | $94,826 |
| 4-Person Families | 319 (21.8%) | $51,164 |
| 5-Person Families | 108 (7.4%) | $0 |
| 6-Person Families | 21 (1.4%) | $0 |
| 7+ Person Families | 12 (0.8%) | $0 |
| Total | 1,461 (100.0%) | $83,484 |
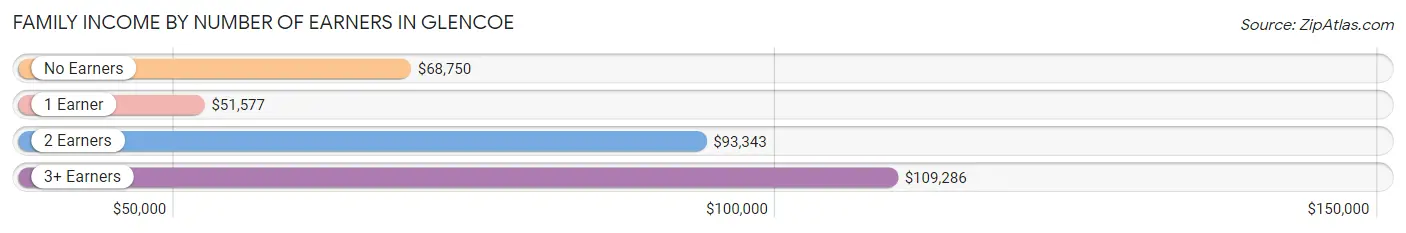
Family Income by Number of Earners in Glencoe
The median family income in Glencoe is $83,484, with families comprising 3+ earners (152) having the highest median family income of $109,286, while families with 1 earner (451) have the lowest median family income of $51,577, accounting for 10.4% and 30.9% of families, respectively.
| Number of Earners | # Families | Median Income |
| No Earners | 243 (16.6%) | $68,750 |
| 1 Earner | 451 (30.9%) | $51,577 |
| 2 Earners | 615 (42.1%) | $93,343 |
| 3+ Earners | 152 (10.4%) | $109,286 |
| Total | 1,461 (100.0%) | $83,484 |
Household Income in Glencoe
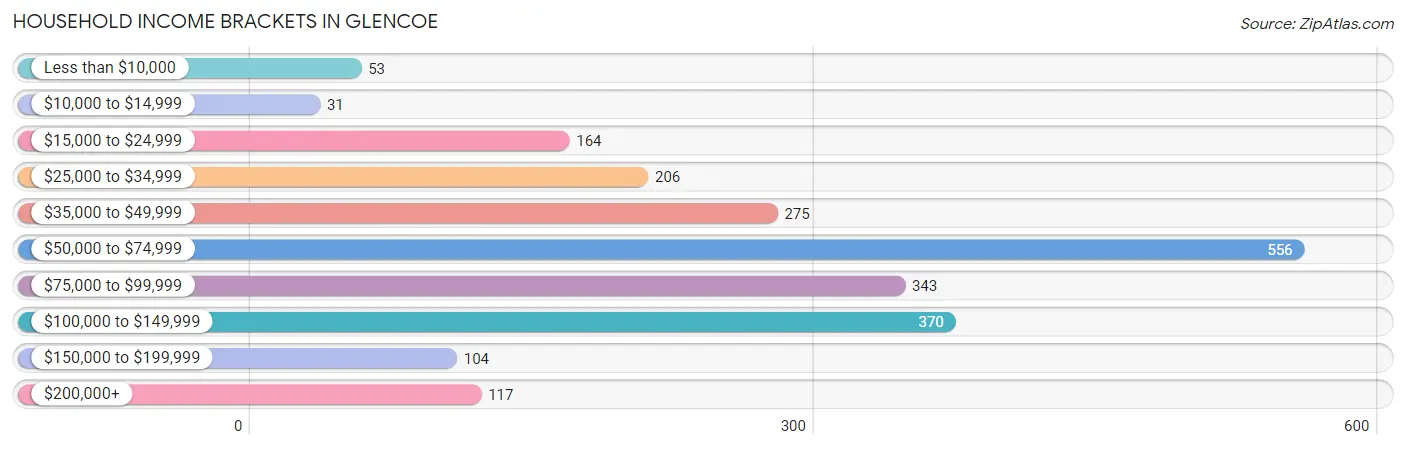
Household Income Brackets in Glencoe
With 556 households falling in the category, the $50,000 to $74,999 income range is the most frequent in Glencoe, accounting for 25.1% of all households. In contrast, only 31 households (1.4%) fall into the $10,000 to $14,999 income bracket, making it the least populous group.
| Income Bracket | # Households | % Households |
| Less than $10,000 | 53 | 2.4% |
| $10,000 to $14,999 | 31 | 1.4% |
| $15,000 to $24,999 | 164 | 7.4% |
| $25,000 to $34,999 | 206 | 9.3% |
| $35,000 to $49,999 | 275 | 12.4% |
| $50,000 to $74,999 | 556 | 25.1% |
| $75,000 to $99,999 | 343 | 15.5% |
| $100,000 to $149,999 | 370 | 16.7% |
| $150,000 to $199,999 | 104 | 4.7% |
| $200,000+ | 117 | 5.3% |
Household Income by Householder Age in Glencoe
The median household income in Glencoe is $67,547, with the highest median household income of $74,783 found in the 45 to 64 years age bracket for the primary householder. A total of 814 households (36.7%) fall into this category. Meanwhile, the 65+ years age bracket for the primary householder has the lowest median household income of $48,143, with 694 households (31.3%) in this group.
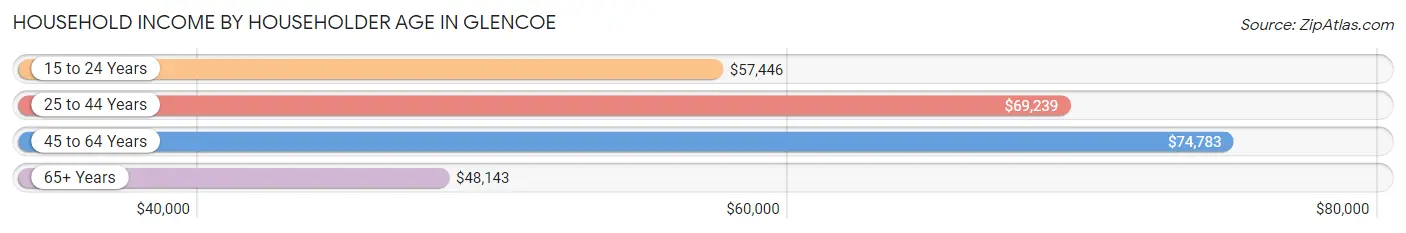
| Income Bracket | # Households | Median Income |
| 15 to 24 Years | 45 (2.0%) | $57,446 |
| 25 to 44 Years | 662 (29.9%) | $69,239 |
| 45 to 64 Years | 814 (36.7%) | $74,783 |
| 65+ Years | 694 (31.3%) | $48,143 |
| Total | 2,215 (100.0%) | $67,547 |
Poverty in Glencoe
Income Below Poverty by Sex and Age in Glencoe
With 2.9% poverty level for males and 8.8% for females among the residents of Glencoe, 6 to 11 year old males and 5 year old females are the most vulnerable to poverty, with 64 males (28.3%) and 41 females (100.0%) in their respective age groups living below the poverty level.
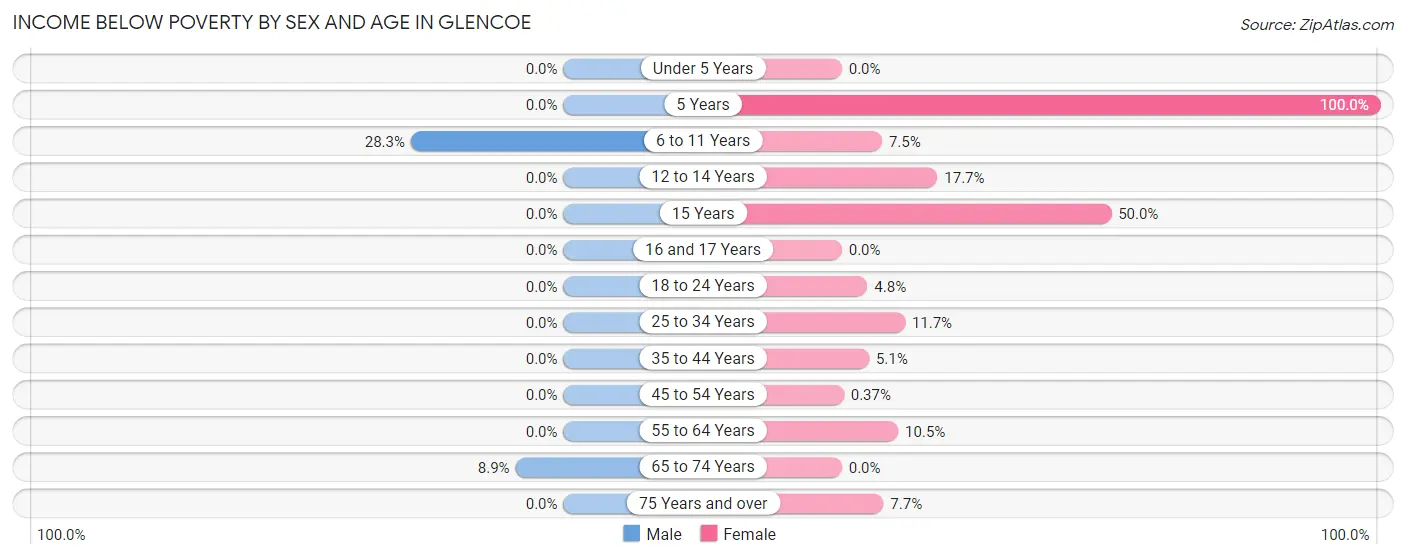
| Age Bracket | Male | Female |
| Under 5 Years | 0 (0.0%) | 0 (0.0%) |
| 5 Years | 0 (0.0%) | 41 (100.0%) |
| 6 to 11 Years | 64 (28.3%) | 22 (7.5%) |
| 12 to 14 Years | 0 (0.0%) | 22 (17.7%) |
| 15 Years | 0 (0.0%) | 22 (50.0%) |
| 16 and 17 Years | 0 (0.0%) | 0 (0.0%) |
| 18 to 24 Years | 0 (0.0%) | 14 (4.8%) |
| 25 to 34 Years | 0 (0.0%) | 32 (11.7%) |
| 35 to 44 Years | 0 (0.0%) | 20 (5.1%) |
| 45 to 54 Years | 0 (0.0%) | 1 (0.4%) |
| 55 to 64 Years | 0 (0.0%) | 34 (10.5%) |
| 65 to 74 Years | 20 (8.9%) | 0 (0.0%) |
| 75 Years and over | 0 (0.0%) | 23 (7.7%) |
| Total | 84 (2.9%) | 231 (8.8%) |
Income Above Poverty by Sex and Age in Glencoe
According to the poverty statistics in Glencoe, males aged under 5 years and females aged 16 and 17 years are the age groups that are most secure financially, with 100.0% of males and 100.0% of females in these age groups living above the poverty line.
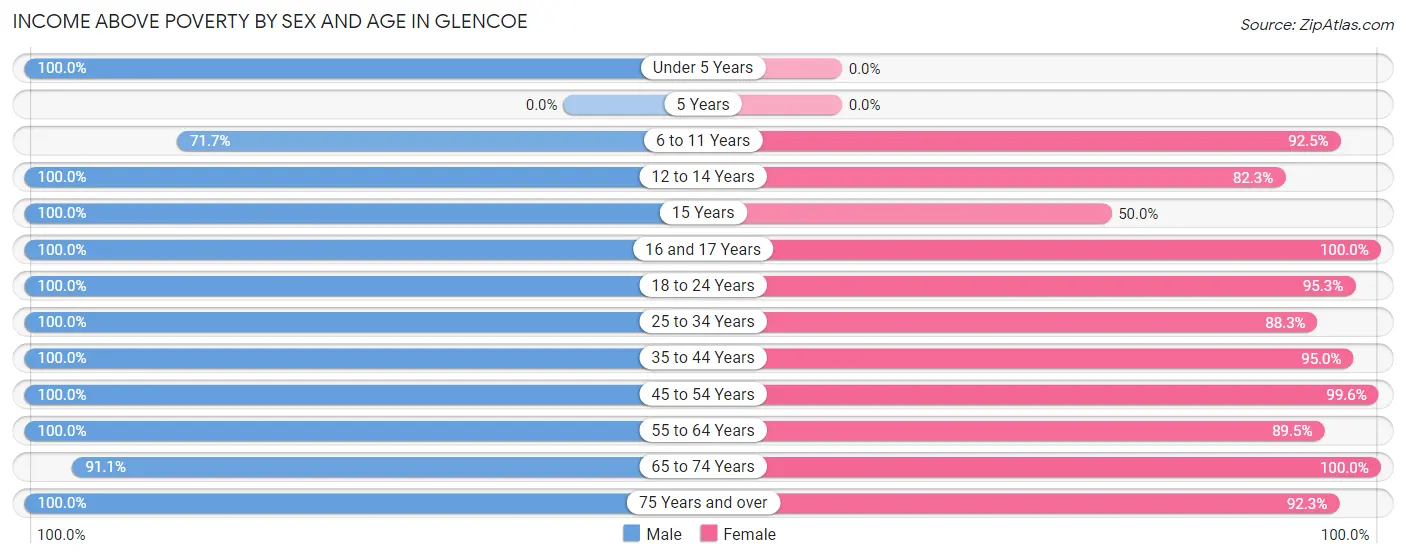
| Age Bracket | Male | Female |
| Under 5 Years | 227 (100.0%) | 0 (0.0%) |
| 5 Years | 0 (0.0%) | 0 (0.0%) |
| 6 to 11 Years | 162 (71.7%) | 273 (92.5%) |
| 12 to 14 Years | 158 (100.0%) | 102 (82.3%) |
| 15 Years | 29 (100.0%) | 22 (50.0%) |
| 16 and 17 Years | 117 (100.0%) | 30 (100.0%) |
| 18 to 24 Years | 195 (100.0%) | 281 (95.3%) |
| 25 to 34 Years | 501 (100.0%) | 241 (88.3%) |
| 35 to 44 Years | 302 (100.0%) | 376 (95.0%) |
| 45 to 54 Years | 353 (100.0%) | 266 (99.6%) |
| 55 to 64 Years | 293 (100.0%) | 291 (89.5%) |
| 65 to 74 Years | 205 (91.1%) | 244 (100.0%) |
| 75 Years and over | 254 (100.0%) | 275 (92.3%) |
| Total | 2,796 (97.1%) | 2,401 (91.2%) |
Income Below Poverty Among Married-Couple Families in Glencoe
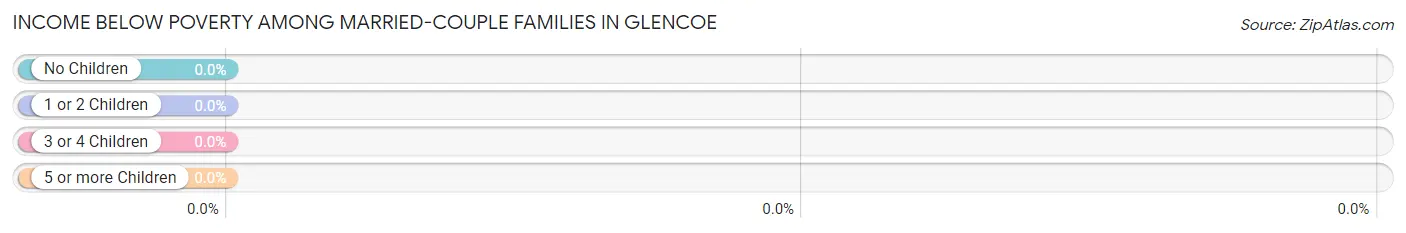
| Children | Above Poverty | Below Poverty |
| No Children | 655 (100.0%) | 0 (0.0%) |
| 1 or 2 Children | 228 (100.0%) | 0 (0.0%) |
| 3 or 4 Children | 74 (100.0%) | 0 (0.0%) |
| 5 or more Children | 12 (100.0%) | 0 (0.0%) |
| Total | 969 (100.0%) | 0 (0.0%) |
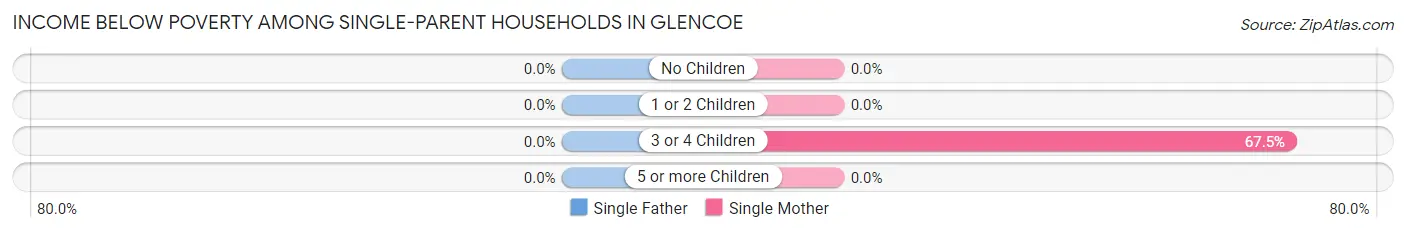
Income Below Poverty Among Single-Parent Households in Glencoe
| Children | Single Father | Single Mother |
| No Children | 0 (0.0%) | 0 (0.0%) |
| 1 or 2 Children | 0 (0.0%) | 0 (0.0%) |
| 3 or 4 Children | 0 (0.0%) | 52 (67.5%) |
| 5 or more Children | 0 (0.0%) | 0 (0.0%) |
| Total | 0 (0.0%) | 52 (14.5%) |
Income Below Poverty Among Married-Couple vs Single-Parent Households in Glencoe
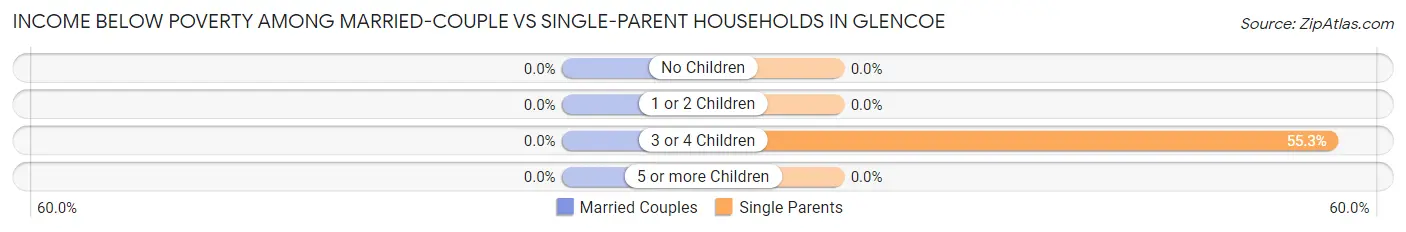
| Children | Married-Couple Families | Single-Parent Households |
| No Children | 0 (0.0%) | 0 (0.0%) |
| 1 or 2 Children | 0 (0.0%) | 0 (0.0%) |
| 3 or 4 Children | 0 (0.0%) | 52 (55.3%) |
| 5 or more Children | 0 (0.0%) | 0 (0.0%) |
| Total | 0 (0.0%) | 52 (10.6%) |
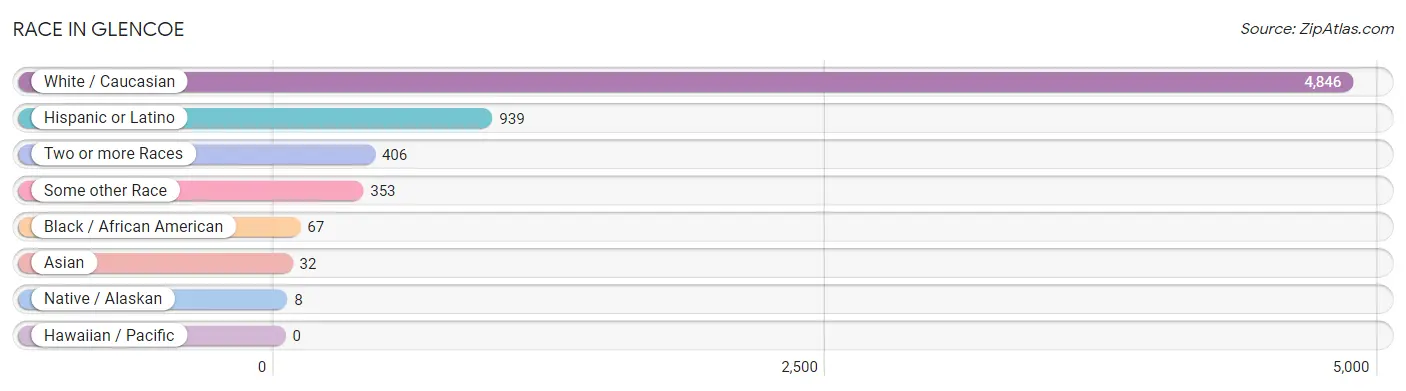
Race in Glencoe
The most populous races in Glencoe are White / Caucasian (4,846 | 84.8%), Hispanic or Latino (939 | 16.4%), and Two or more Races (406 | 7.1%).
| Race | # Population | % Population |
| Asian | 32 | 0.6% |
| Black / African American | 67 | 1.2% |
| Hawaiian / Pacific | 0 | 0.0% |
| Hispanic or Latino | 939 | 16.4% |
| Native / Alaskan | 8 | 0.1% |
| White / Caucasian | 4,846 | 84.8% |
| Two or more Races | 406 | 7.1% |
| Some other Race | 353 | 6.2% |
| Total | 5,712 | 100.0% |
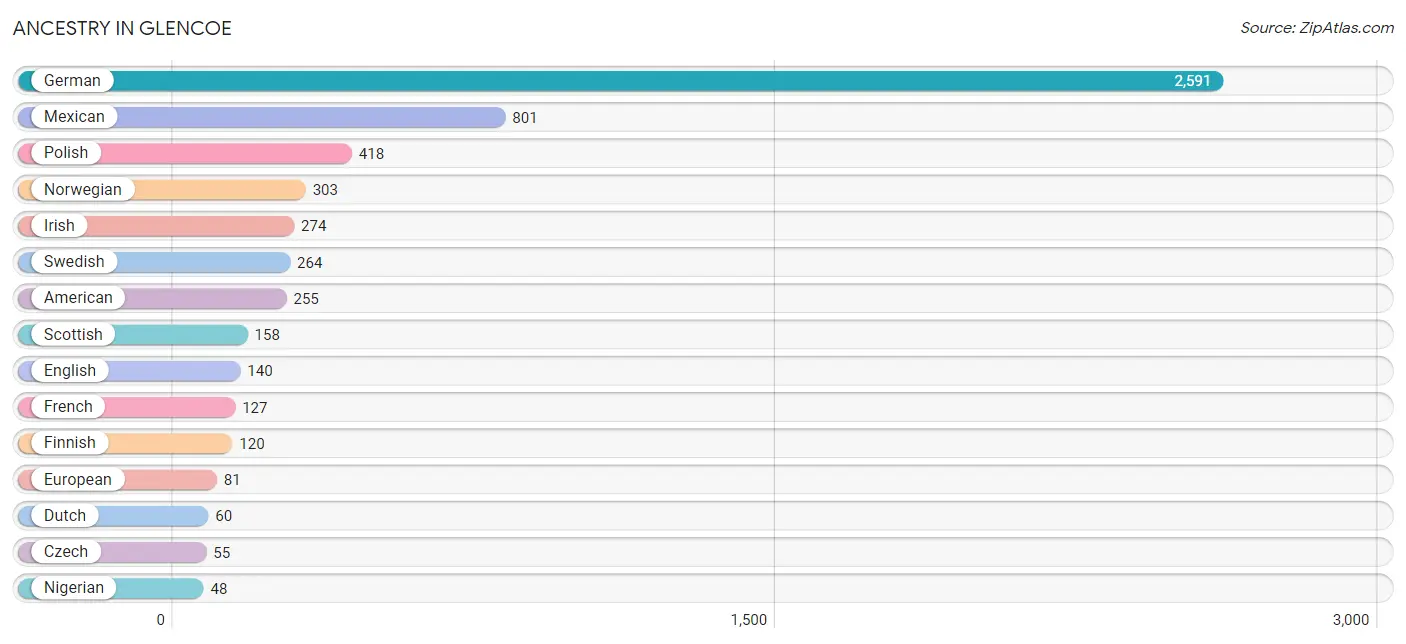
Ancestry in Glencoe
The most populous ancestries reported in Glencoe are German (2,591 | 45.4%), Mexican (801 | 14.0%), Polish (418 | 7.3%), Norwegian (303 | 5.3%), and Irish (274 | 4.8%), together accounting for 76.8% of all Glencoe residents.
| Ancestry | # Population | % Population |
| American | 255 | 4.5% |
| British | 14 | 0.3% |
| Burmese | 32 | 0.6% |
| Cherokee | 30 | 0.5% |
| Czech | 55 | 1.0% |
| Danish | 26 | 0.5% |
| Dutch | 60 | 1.1% |
| Eastern European | 19 | 0.3% |
| English | 140 | 2.5% |
| European | 81 | 1.4% |
| Finnish | 120 | 2.1% |
| French | 127 | 2.2% |
| German | 2,591 | 45.4% |
| Hungarian | 5 | 0.1% |
| Irish | 274 | 4.8% |
| Latvian | 12 | 0.2% |
| Mexican | 801 | 14.0% |
| Nigerian | 48 | 0.8% |
| Norwegian | 303 | 5.3% |
| Polish | 418 | 7.3% |
| Scandinavian | 15 | 0.3% |
| Scotch-Irish | 35 | 0.6% |
| Scottish | 158 | 2.8% |
| Slavic | 14 | 0.3% |
| Subsaharan African | 48 | 0.8% |
| Swedish | 264 | 4.6% |
| Swiss | 20 | 0.4% | View All 27 Rows |
Immigrants in Glencoe
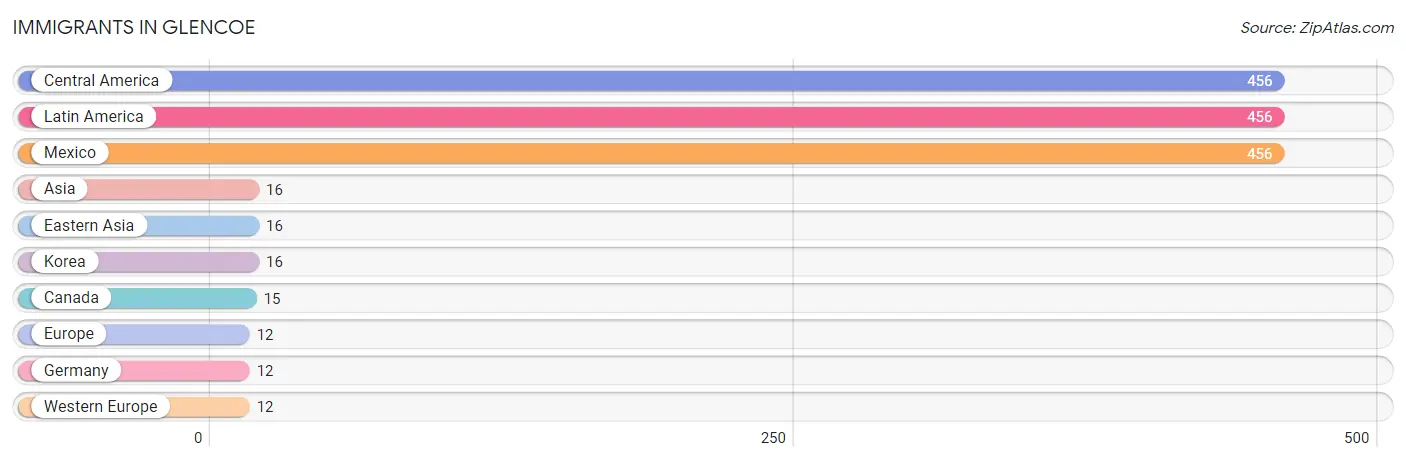
The most numerous immigrant groups reported in Glencoe came from Central America (456 | 8.0%), Latin America (456 | 8.0%), Mexico (456 | 8.0%), Asia (16 | 0.3%), and Eastern Asia (16 | 0.3%), together accounting for 24.5% of all Glencoe residents.
| Immigration Origin | # Population | % Population |
| Asia | 16 | 0.3% |
| Canada | 15 | 0.3% |
| Central America | 456 | 8.0% |
| Eastern Asia | 16 | 0.3% |
| Europe | 12 | 0.2% |
| Germany | 12 | 0.2% |
| Korea | 16 | 0.3% |
| Latin America | 456 | 8.0% |
| Mexico | 456 | 8.0% |
| Western Europe | 12 | 0.2% | View All 10 Rows |
Sex and Age in Glencoe
Sex and Age in Glencoe
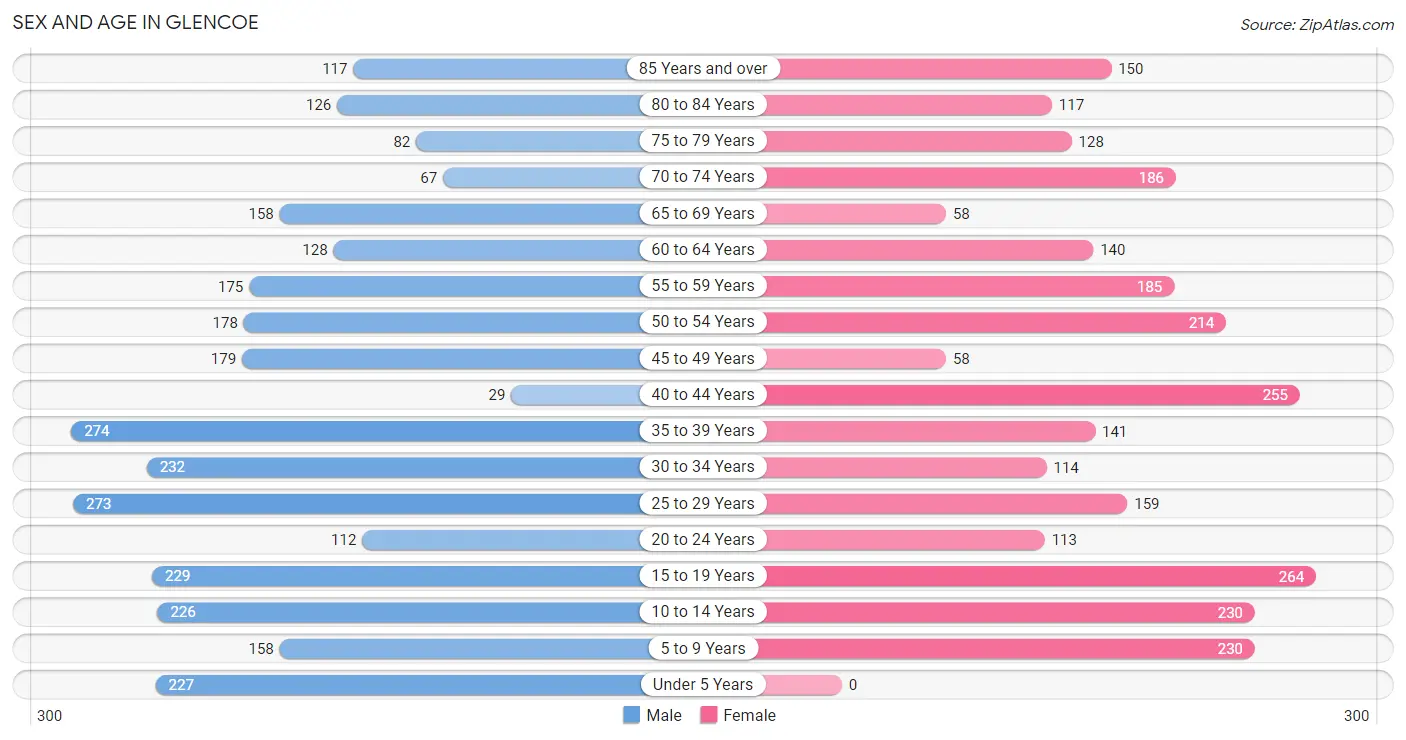
The most populous age groups in Glencoe are 35 to 39 Years (274 | 9.2%) for men and 15 to 19 Years (264 | 9.6%) for women.
| Age Bracket | Male | Female |
| Under 5 Years | 227 (7.6%) | 0 (0.0%) |
| 5 to 9 Years | 158 (5.3%) | 230 (8.4%) |
| 10 to 14 Years | 226 (7.6%) | 230 (8.4%) |
| 15 to 19 Years | 229 (7.7%) | 264 (9.6%) |
| 20 to 24 Years | 112 (3.8%) | 113 (4.1%) |
| 25 to 29 Years | 273 (9.2%) | 159 (5.8%) |
| 30 to 34 Years | 232 (7.8%) | 114 (4.2%) |
| 35 to 39 Years | 274 (9.2%) | 141 (5.1%) |
| 40 to 44 Years | 29 (1.0%) | 255 (9.3%) |
| 45 to 49 Years | 179 (6.0%) | 58 (2.1%) |
| 50 to 54 Years | 178 (6.0%) | 214 (7.8%) |
| 55 to 59 Years | 175 (5.9%) | 185 (6.8%) |
| 60 to 64 Years | 128 (4.3%) | 140 (5.1%) |
| 65 to 69 Years | 158 (5.3%) | 58 (2.1%) |
| 70 to 74 Years | 67 (2.3%) | 186 (6.8%) |
| 75 to 79 Years | 82 (2.8%) | 128 (4.7%) |
| 80 to 84 Years | 126 (4.2%) | 117 (4.3%) |
| 85 Years and over | 117 (3.9%) | 150 (5.5%) |
| Total | 2,970 (100.0%) | 2,742 (100.0%) |
Families and Households in Glencoe
Median Family Size in Glencoe
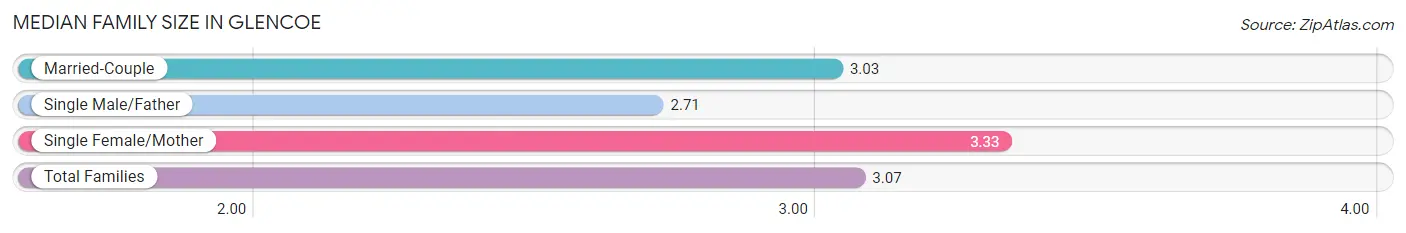
The median family size in Glencoe is 3.07 persons per family, with single female/mother families (358 | 24.5%) accounting for the largest median family size of 3.33 persons per family. On the other hand, single male/father families (134 | 9.2%) represent the smallest median family size with 2.71 persons per family.
| Family Type | # Families | Family Size |
| Married-Couple | 969 (66.3%) | 3.03 |
| Single Male/Father | 134 (9.2%) | 2.71 |
| Single Female/Mother | 358 (24.5%) | 3.33 |
| Total Families | 1,461 (100.0%) | 3.07 |
Median Household Size in Glencoe
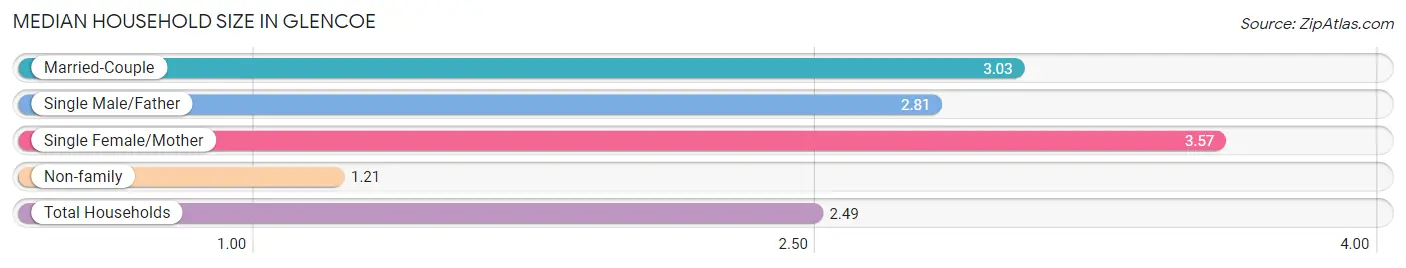
The median household size in Glencoe is 2.49 persons per household, with single female/mother households (358 | 16.2%) accounting for the largest median household size of 3.57 persons per household. non-family households (754 | 34.0%) represent the smallest median household size with 1.21 persons per household.
| Household Type | # Households | Household Size |
| Married-Couple | 969 (43.8%) | 3.03 |
| Single Male/Father | 134 (6.0%) | 2.81 |
| Single Female/Mother | 358 (16.2%) | 3.57 |
| Non-family | 754 (34.0%) | 1.21 |
| Total Households | 2,215 (100.0%) | 2.49 |
Household Size by Marriage Status in Glencoe
Out of a total of 2,215 households in Glencoe, 1,461 (66.0%) are family households, while 754 (34.0%) are nonfamily households. The most numerous type of family households are 2-person households, comprising 769, and the most common type of nonfamily households are 1-person households, comprising 658.
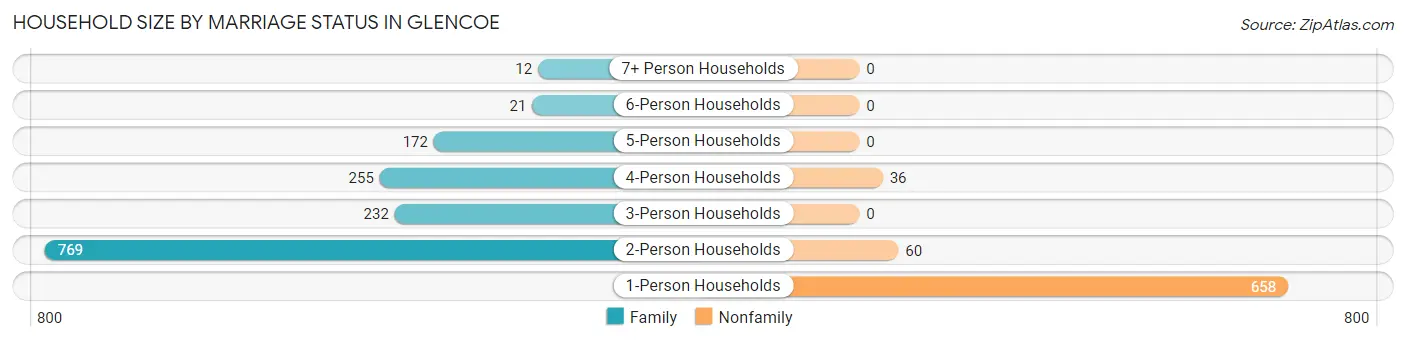
| Household Size | Family Households | Nonfamily Households |
| 1-Person Households | - | 658 (29.7%) |
| 2-Person Households | 769 (34.7%) | 60 (2.7%) |
| 3-Person Households | 232 (10.5%) | 0 (0.0%) |
| 4-Person Households | 255 (11.5%) | 36 (1.6%) |
| 5-Person Households | 172 (7.8%) | 0 (0.0%) |
| 6-Person Households | 21 (0.9%) | 0 (0.0%) |
| 7+ Person Households | 12 (0.5%) | 0 (0.0%) |
| Total | 1,461 (66.0%) | 754 (34.0%) |
Female Fertility in Glencoe
Fertility by Age in Glencoe
Average fertility rate in Glencoe is 115.0 births per 1,000 women. Women in the age bracket of 20 to 34 years have the highest fertility rate with 244.0 births per 1,000 women. Women in the age bracket of 20 to 34 years acount for 72.3% of all women with births.
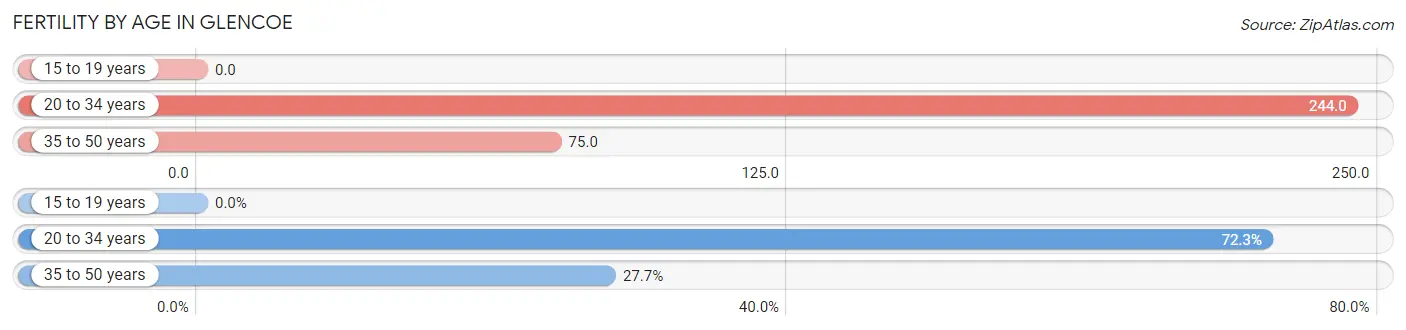
| Age Bracket | Women with Births | Births / 1,000 Women |
| 15 to 19 years | 0 (0.0%) | 0.0 |
| 20 to 34 years | 94 (72.3%) | 244.0 |
| 35 to 50 years | 36 (27.7%) | 75.0 |
| Total | 130 (100.0%) | 115.0 |
Fertility by Age by Marriage Status in Glencoe
44.6% of women with births (130) in Glencoe are married. The highest percentage of unmarried women with births falls into 20 to 34 years age bracket with 76.6% of them unmarried at the time of birth, while the lowest percentage of unmarried women with births belong to 35 to 50 years age bracket with 0.0% of them unmarried.
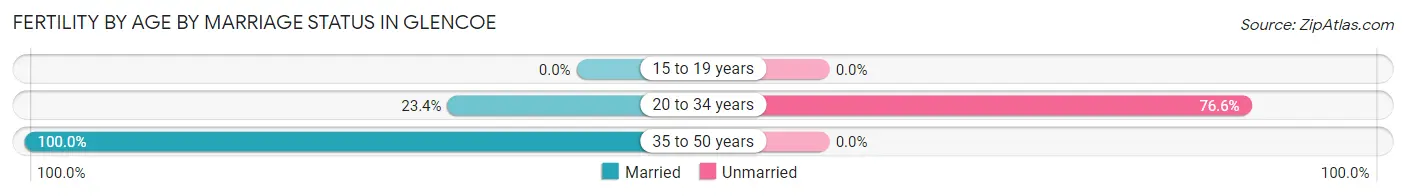
| Age Bracket | Married | Unmarried |
| 15 to 19 years | 0 (0.0%) | 0 (0.0%) |
| 20 to 34 years | 22 (23.4%) | 72 (76.6%) |
| 35 to 50 years | 36 (100.0%) | 0 (0.0%) |
| Total | 58 (44.6%) | 72 (55.4%) |
Fertility by Education in Glencoe
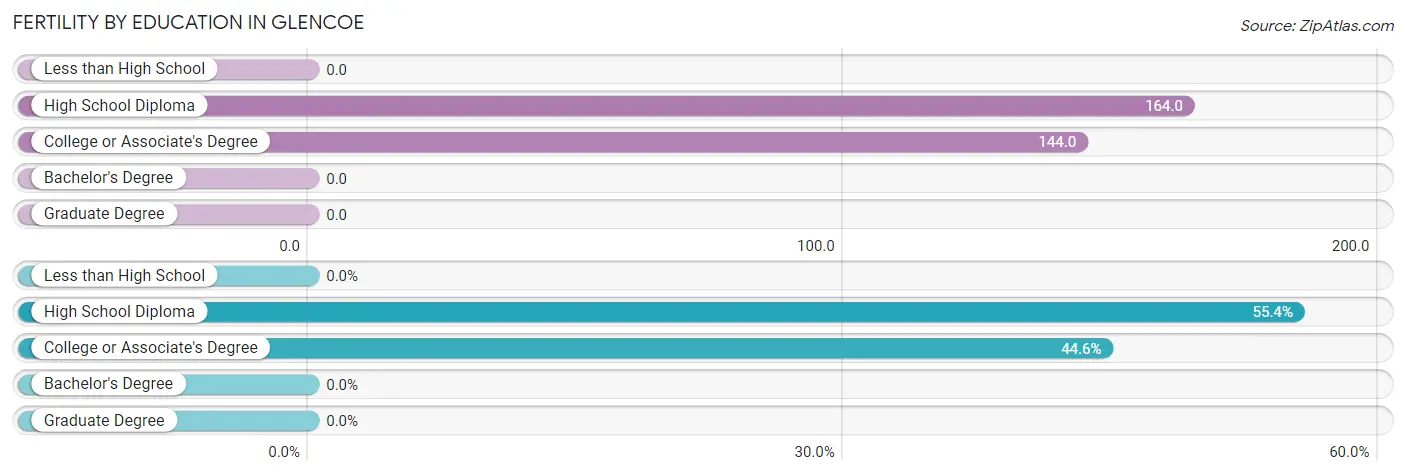
| Educational Attainment | Women with Births | Births / 1,000 Women |
| Less than High School | 0 (0.0%) | 0.0 |
| High School Diploma | 72 (55.4%) | 164.0 |
| College or Associate's Degree | 58 (44.6%) | 144.0 |
| Bachelor's Degree | 0 (0.0%) | 0.0 |
| Graduate Degree | 0 (0.0%) | 0.0 |
| Total | 130 (100.0%) | 115.0 |
Fertility by Education by Marriage Status in Glencoe
55.4% of women with births in Glencoe are unmarried. Women with the educational attainment of college or associate's degree are most likely to be married with 100.0% of them married at childbirth, while women with the educational attainment of high school diploma are least likely to be married with 100.0% of them unmarried at childbirth.
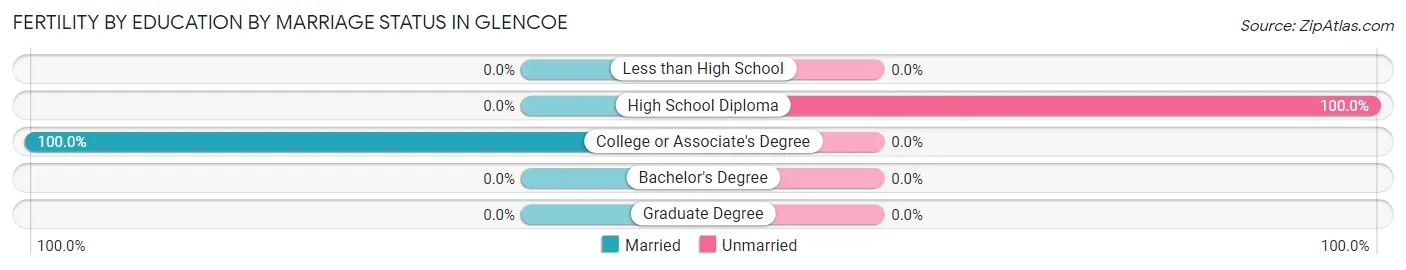
| Educational Attainment | Married | Unmarried |
| Less than High School | 0 (0.0%) | 0 (0.0%) |
| High School Diploma | 0 (0.0%) | 72 (100.0%) |
| College or Associate's Degree | 58 (100.0%) | 0 (0.0%) |
| Bachelor's Degree | 0 (0.0%) | 0 (0.0%) |
| Graduate Degree | 0 (0.0%) | 0 (0.0%) |
| Total | 58 (44.6%) | 72 (55.4%) |
Employment Characteristics in Glencoe
Employment by Class of Employer in Glencoe
Among the 2,891 employed individuals in Glencoe, private company employees (2,106 | 72.9%), local government employees (243 | 8.4%), and self-employed (not incorporated) (221 | 7.6%) make up the most common classes of employment.
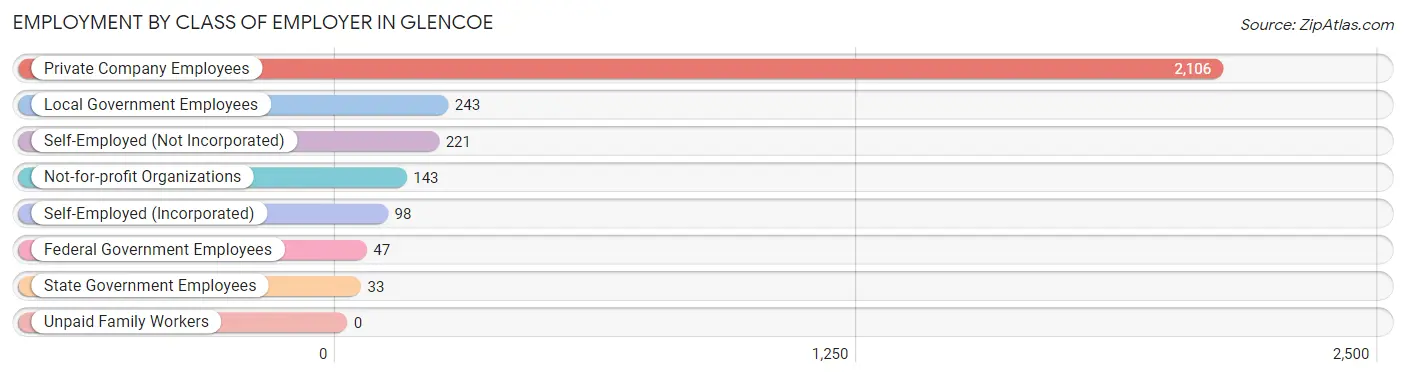
| Employer Class | # Employees | % Employees |
| Private Company Employees | 2,106 | 72.9% |
| Self-Employed (Incorporated) | 98 | 3.4% |
| Self-Employed (Not Incorporated) | 221 | 7.6% |
| Not-for-profit Organizations | 143 | 5.0% |
| Local Government Employees | 243 | 8.4% |
| State Government Employees | 33 | 1.1% |
| Federal Government Employees | 47 | 1.6% |
| Unpaid Family Workers | 0 | 0.0% |
| Total | 2,891 | 100.0% |
Employment Status by Age in Glencoe
According to the labor force statistics for Glencoe, out of the total population over 16 years of age (4,568), 64.6% or 2,951 individuals are in the labor force, with 2.1% or 62 of them unemployed. The age group with the highest labor force participation rate is 35 to 44 years, with 99.9% or 698 individuals in the labor force. Within the labor force, the 16 to 19 years age range has the highest percentage of unemployed individuals, with 5.5% or 18 of them being unemployed.
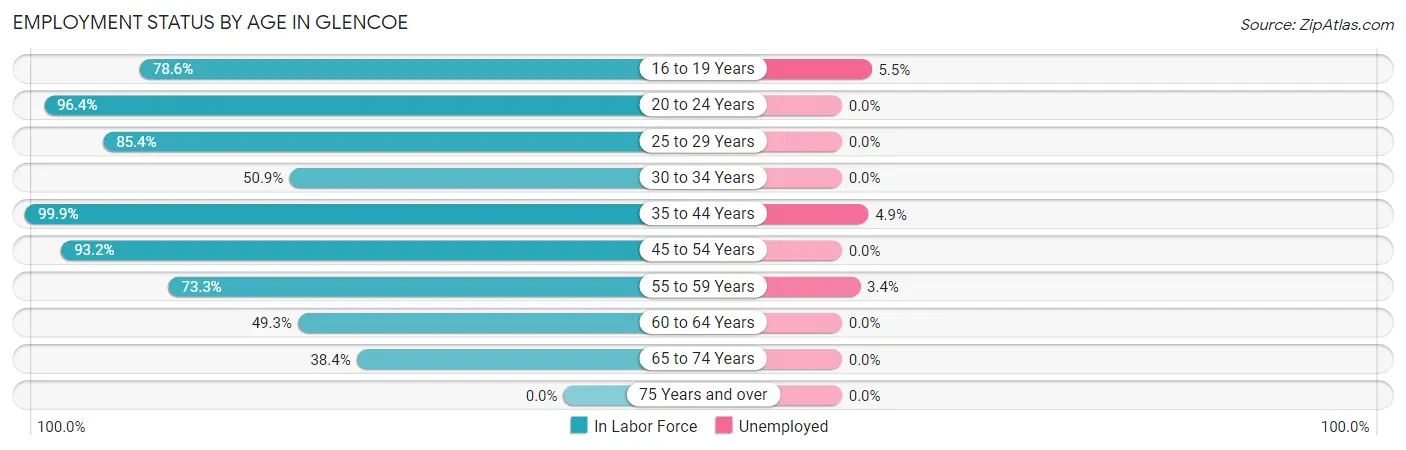
| Age Bracket | In Labor Force | Unemployed |
| 16 to 19 Years | 330 (78.6%) | 18 (5.5%) |
| 20 to 24 Years | 217 (96.4%) | 0 (0.0%) |
| 25 to 29 Years | 369 (85.4%) | 0 (0.0%) |
| 30 to 34 Years | 176 (50.9%) | 0 (0.0%) |
| 35 to 44 Years | 698 (99.9%) | 34 (4.9%) |
| 45 to 54 Years | 586 (93.2%) | 0 (0.0%) |
| 55 to 59 Years | 264 (73.3%) | 9 (3.4%) |
| 60 to 64 Years | 132 (49.3%) | 0 (0.0%) |
| 65 to 74 Years | 180 (38.4%) | 0 (0.0%) |
| 75 Years and over | 0 (0.0%) | 0 (0.0%) |
| Total | 2,951 (64.6%) | 62 (2.1%) |
Employment Status by Educational Attainment in Glencoe
According to labor force statistics for Glencoe, 81.4% of individuals (2,225) out of the total population between 25 and 64 years of age (2,734) are in the labor force, with 1.9% or 42 of them being unemployed. The group with the highest labor force participation rate are those with the educational attainment of bachelor's degree or higher, with 90.4% or 263 individuals in the labor force. Within the labor force, individuals with high school diploma education have the highest percentage of unemployment, with 2.8% or 23 of them being unemployed.
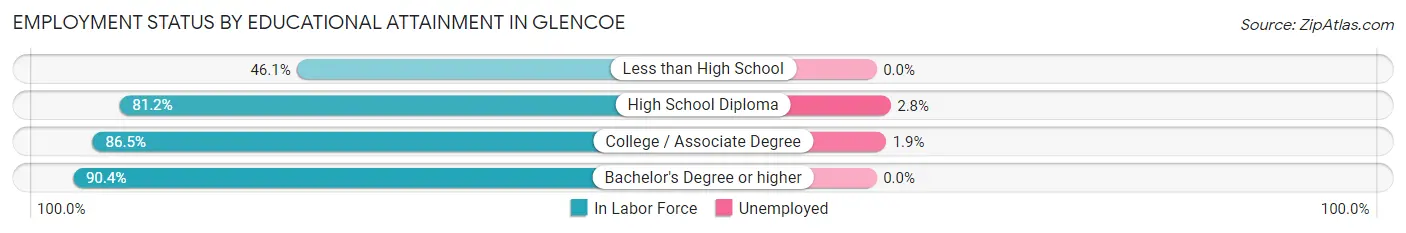
| Educational Attainment | In Labor Force | Unemployed |
| Less than High School | 112 (46.1%) | 0 (0.0%) |
| High School Diploma | 808 (81.2%) | 28 (2.8%) |
| College / Associate Degree | 1,042 (86.5%) | 23 (1.9%) |
| Bachelor's Degree or higher | 263 (90.4%) | 0 (0.0%) |
| Total | 2,225 (81.4%) | 52 (1.9%) |
Employment Occupations by Sex in Glencoe
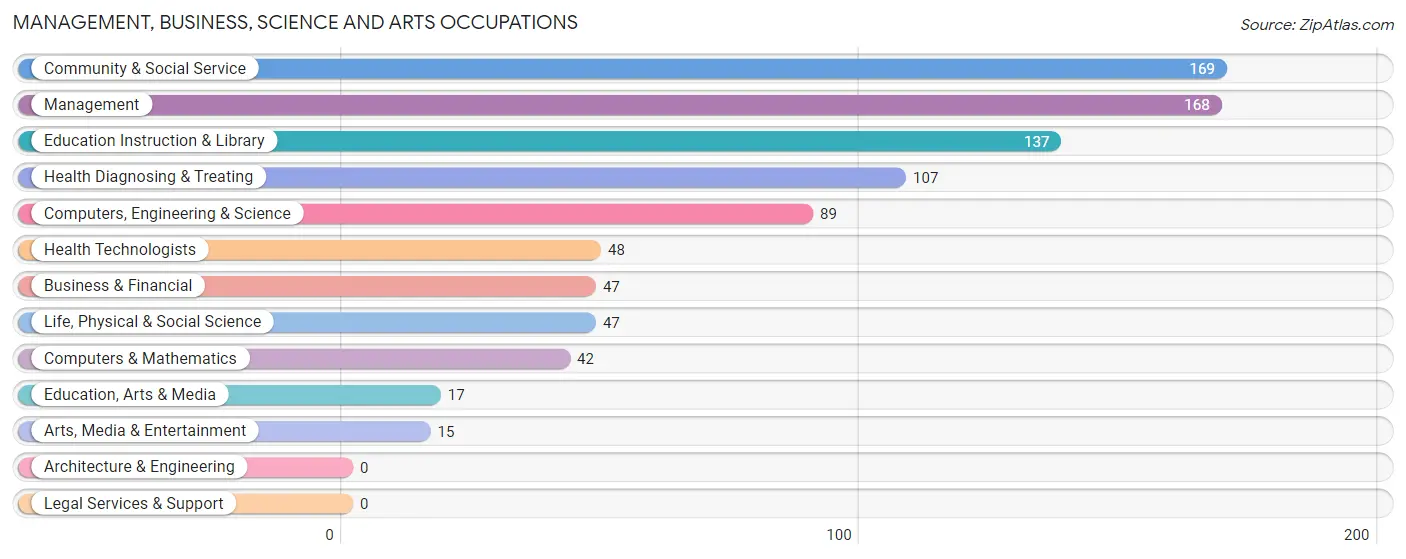
Management, Business, Science and Arts Occupations
The most common Management, Business, Science and Arts occupations in Glencoe are Community & Social Service (169 | 5.9%), Management (168 | 5.8%), Education Instruction & Library (137 | 4.7%), Health Diagnosing & Treating (107 | 3.7%), and Computers, Engineering & Science (89 | 3.1%).
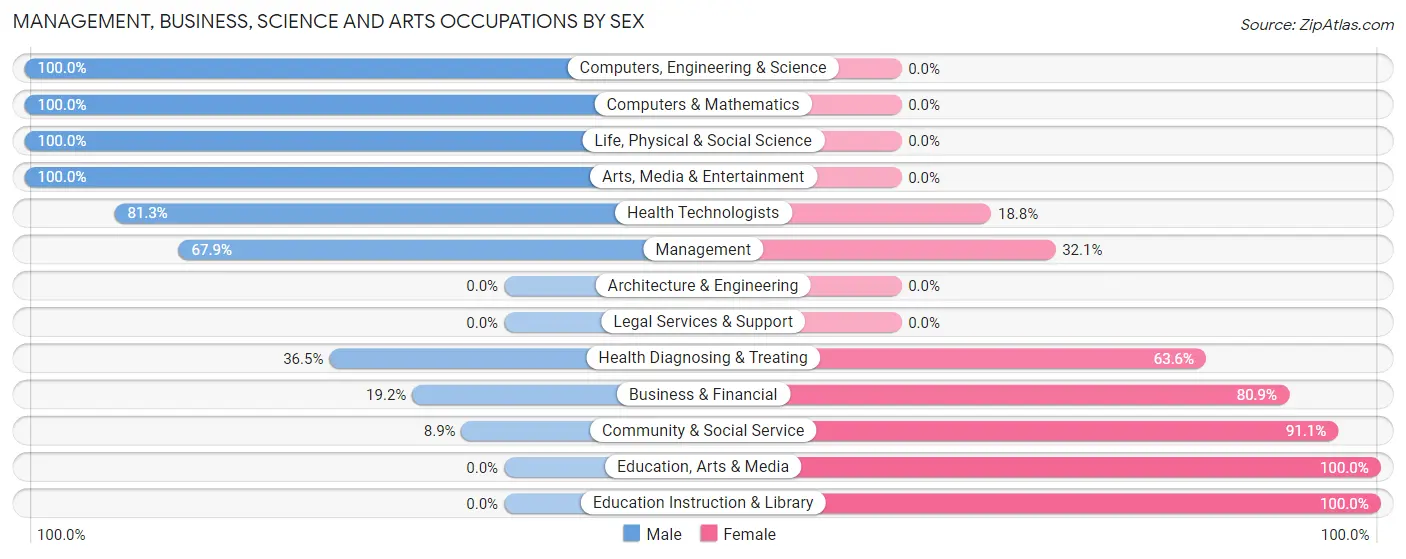
Management, Business, Science and Arts Occupations by Sex
Within the Management, Business, Science and Arts occupations in Glencoe, the most male-oriented occupations are Computers, Engineering & Science (100.0%), Computers & Mathematics (100.0%), and Life, Physical & Social Science (100.0%), while the most female-oriented occupations are Education, Arts & Media (100.0%), Education Instruction & Library (100.0%), and Community & Social Service (91.1%).
| Occupation | Male | Female |
| Management | 114 (67.9%) | 54 (32.1%) |
| Business & Financial | 9 (19.2%) | 38 (80.8%) |
| Computers, Engineering & Science | 89 (100.0%) | 0 (0.0%) |
| Computers & Mathematics | 42 (100.0%) | 0 (0.0%) |
| Architecture & Engineering | 0 (0.0%) | 0 (0.0%) |
| Life, Physical & Social Science | 47 (100.0%) | 0 (0.0%) |
| Community & Social Service | 15 (8.9%) | 154 (91.1%) |
| Education, Arts & Media | 0 (0.0%) | 17 (100.0%) |
| Legal Services & Support | 0 (0.0%) | 0 (0.0%) |
| Education Instruction & Library | 0 (0.0%) | 137 (100.0%) |
| Arts, Media & Entertainment | 15 (100.0%) | 0 (0.0%) |
| Health Diagnosing & Treating | 39 (36.4%) | 68 (63.5%) |
| Health Technologists | 39 (81.2%) | 9 (18.8%) |
| Total (Category) | 266 (45.9%) | 314 (54.1%) |
| Total (Overall) | 1,591 (55.0%) | 1,300 (45.0%) |
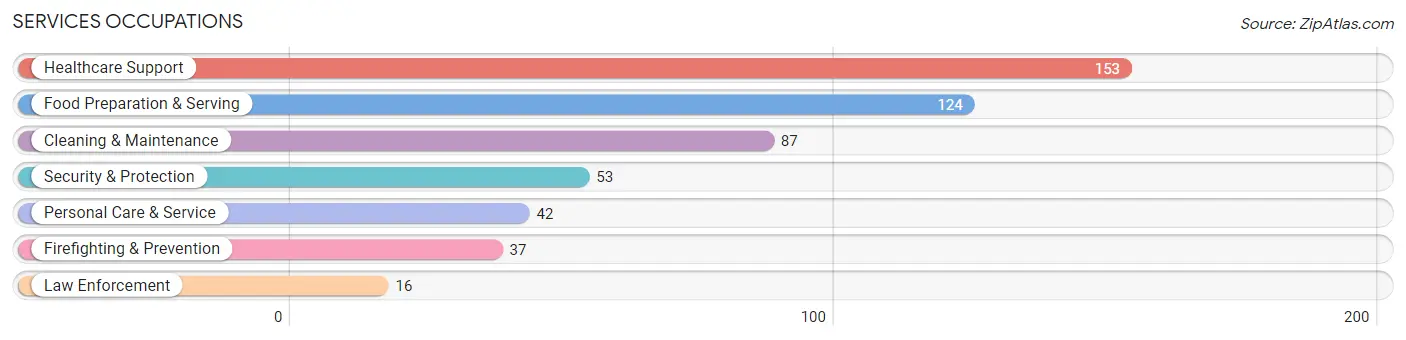
Services Occupations
The most common Services occupations in Glencoe are Healthcare Support (153 | 5.3%), Food Preparation & Serving (124 | 4.3%), Cleaning & Maintenance (87 | 3.0%), Security & Protection (53 | 1.8%), and Personal Care & Service (42 | 1.5%).
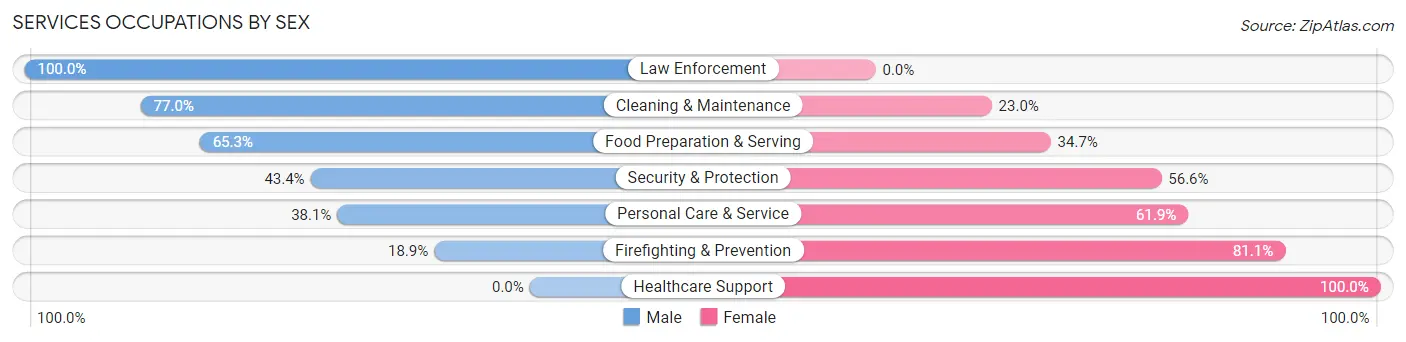
Services Occupations by Sex
Within the Services occupations in Glencoe, the most male-oriented occupations are Law Enforcement (100.0%), Cleaning & Maintenance (77.0%), and Food Preparation & Serving (65.3%), while the most female-oriented occupations are Healthcare Support (100.0%), Firefighting & Prevention (81.1%), and Personal Care & Service (61.9%).
| Occupation | Male | Female |
| Healthcare Support | 0 (0.0%) | 153 (100.0%) |
| Security & Protection | 23 (43.4%) | 30 (56.6%) |
| Firefighting & Prevention | 7 (18.9%) | 30 (81.1%) |
| Law Enforcement | 16 (100.0%) | 0 (0.0%) |
| Food Preparation & Serving | 81 (65.3%) | 43 (34.7%) |
| Cleaning & Maintenance | 67 (77.0%) | 20 (23.0%) |
| Personal Care & Service | 16 (38.1%) | 26 (61.9%) |
| Total (Category) | 187 (40.7%) | 272 (59.3%) |
| Total (Overall) | 1,591 (55.0%) | 1,300 (45.0%) |
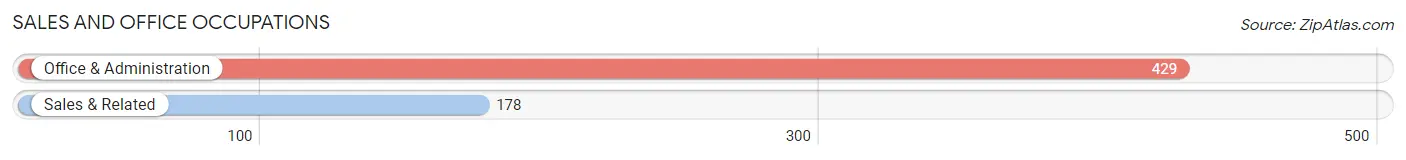
Sales and Office Occupations
The most common Sales and Office occupations in Glencoe are Office & Administration (429 | 14.8%), and Sales & Related (178 | 6.2%).
Sales and Office Occupations by Sex
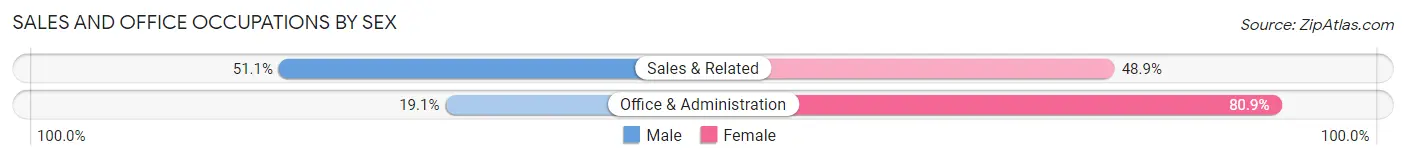
| Occupation | Male | Female |
| Sales & Related | 91 (51.1%) | 87 (48.9%) |
| Office & Administration | 82 (19.1%) | 347 (80.9%) |
| Total (Category) | 173 (28.5%) | 434 (71.5%) |
| Total (Overall) | 1,591 (55.0%) | 1,300 (45.0%) |
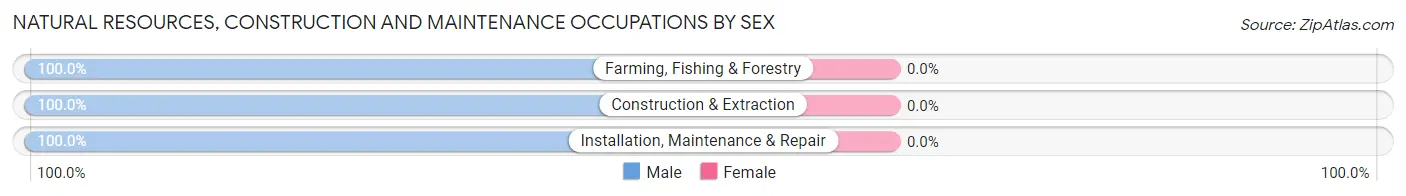
Natural Resources, Construction and Maintenance Occupations
The most common Natural Resources, Construction and Maintenance occupations in Glencoe are Construction & Extraction (303 | 10.5%), Installation, Maintenance & Repair (166 | 5.7%), and Farming, Fishing & Forestry (21 | 0.7%).

Natural Resources, Construction and Maintenance Occupations by Sex
| Occupation | Male | Female |
| Farming, Fishing & Forestry | 21 (100.0%) | 0 (0.0%) |
| Construction & Extraction | 303 (100.0%) | 0 (0.0%) |
| Installation, Maintenance & Repair | 166 (100.0%) | 0 (0.0%) |
| Total (Category) | 490 (100.0%) | 0 (0.0%) |
| Total (Overall) | 1,591 (55.0%) | 1,300 (45.0%) |
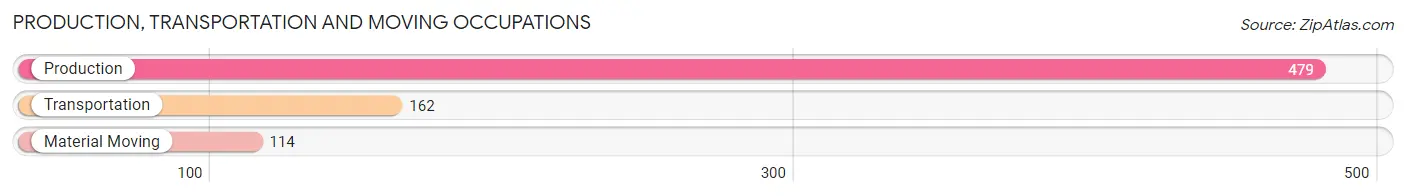
Production, Transportation and Moving Occupations
The most common Production, Transportation and Moving occupations in Glencoe are Production (479 | 16.6%), Transportation (162 | 5.6%), and Material Moving (114 | 3.9%).
Production, Transportation and Moving Occupations by Sex
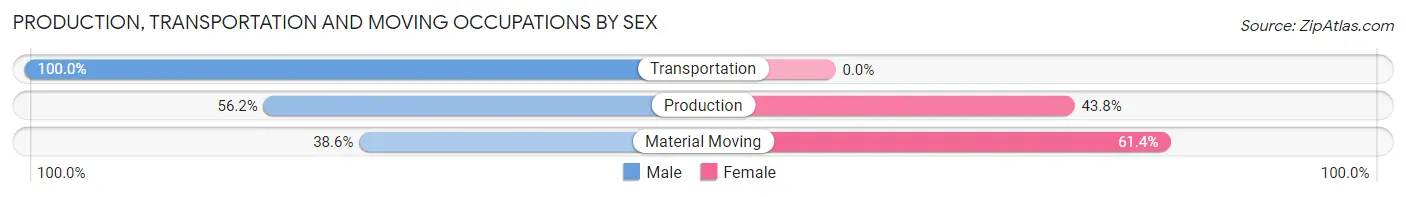
| Occupation | Male | Female |
| Production | 269 (56.2%) | 210 (43.8%) |
| Transportation | 162 (100.0%) | 0 (0.0%) |
| Material Moving | 44 (38.6%) | 70 (61.4%) |
| Total (Category) | 475 (62.9%) | 280 (37.1%) |
| Total (Overall) | 1,591 (55.0%) | 1,300 (45.0%) |
Employment Industries by Sex in Glencoe
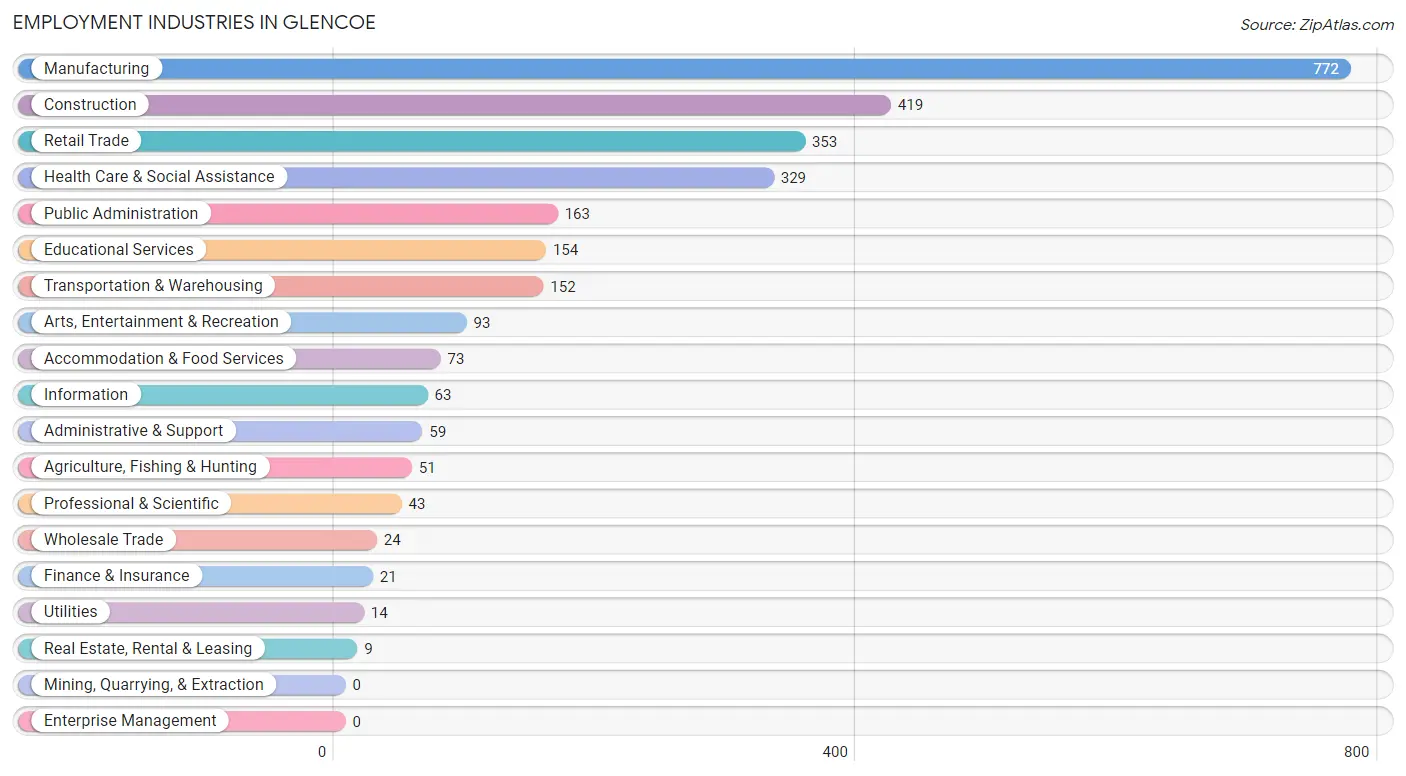
Employment Industries in Glencoe
The major employment industries in Glencoe include Manufacturing (772 | 26.7%), Construction (419 | 14.5%), Retail Trade (353 | 12.2%), Health Care & Social Assistance (329 | 11.4%), and Public Administration (163 | 5.6%).
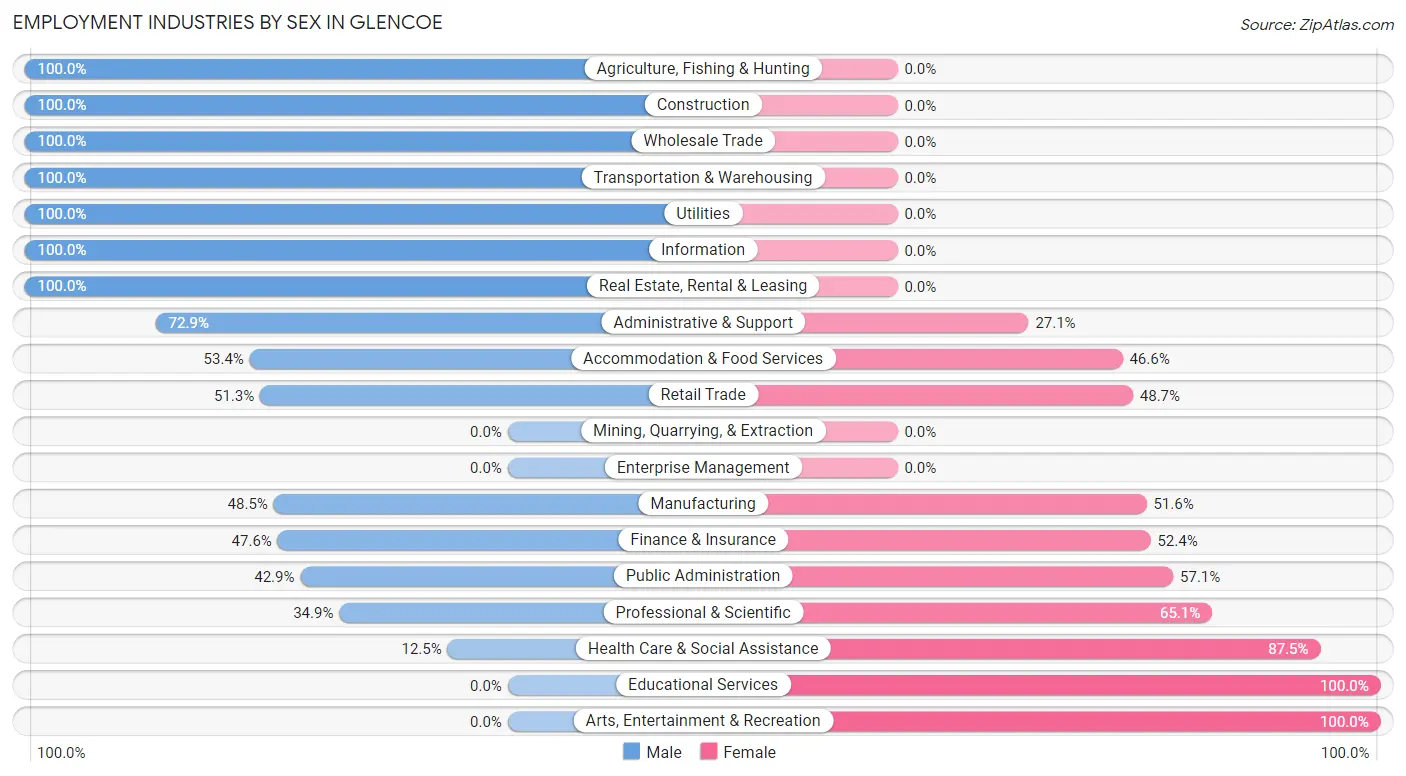
Employment Industries by Sex in Glencoe
The Glencoe industries that see more men than women are Agriculture, Fishing & Hunting (100.0%), Construction (100.0%), and Wholesale Trade (100.0%), whereas the industries that tend to have a higher number of women are Educational Services (100.0%), Arts, Entertainment & Recreation (100.0%), and Health Care & Social Assistance (87.5%).
| Industry | Male | Female |
| Agriculture, Fishing & Hunting | 51 (100.0%) | 0 (0.0%) |
| Mining, Quarrying, & Extraction | 0 (0.0%) | 0 (0.0%) |
| Construction | 419 (100.0%) | 0 (0.0%) |
| Manufacturing | 374 (48.4%) | 398 (51.5%) |
| Wholesale Trade | 24 (100.0%) | 0 (0.0%) |
| Retail Trade | 181 (51.3%) | 172 (48.7%) |
| Transportation & Warehousing | 152 (100.0%) | 0 (0.0%) |
| Utilities | 14 (100.0%) | 0 (0.0%) |
| Information | 63 (100.0%) | 0 (0.0%) |
| Finance & Insurance | 10 (47.6%) | 11 (52.4%) |
| Real Estate, Rental & Leasing | 9 (100.0%) | 0 (0.0%) |
| Professional & Scientific | 15 (34.9%) | 28 (65.1%) |
| Enterprise Management | 0 (0.0%) | 0 (0.0%) |
| Administrative & Support | 43 (72.9%) | 16 (27.1%) |
| Educational Services | 0 (0.0%) | 154 (100.0%) |
| Health Care & Social Assistance | 41 (12.5%) | 288 (87.5%) |
| Arts, Entertainment & Recreation | 0 (0.0%) | 93 (100.0%) |
| Accommodation & Food Services | 39 (53.4%) | 34 (46.6%) |
| Public Administration | 70 (42.9%) | 93 (57.1%) |
| Total | 1,591 (55.0%) | 1,300 (45.0%) |
Education in Glencoe
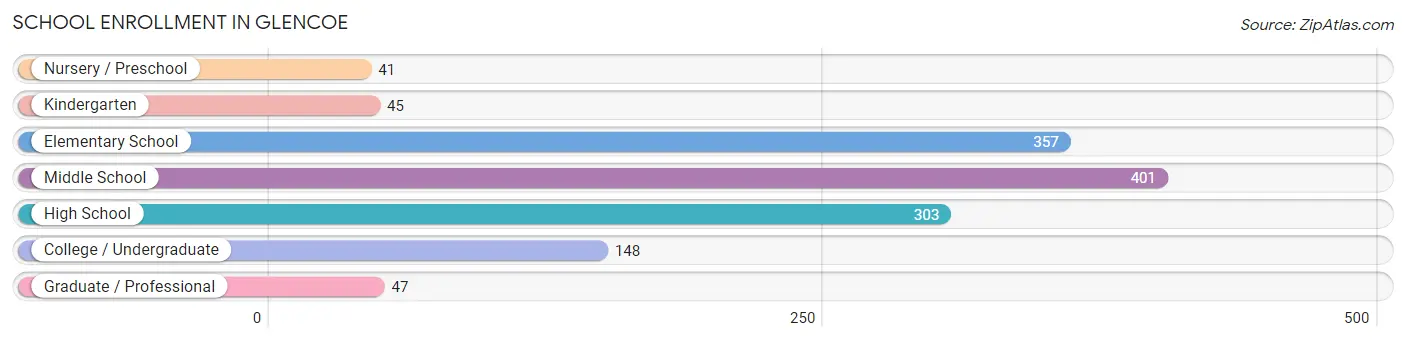
School Enrollment in Glencoe
The most common levels of schooling among the 1,342 students in Glencoe are middle school (401 | 29.9%), elementary school (357 | 26.6%), and high school (303 | 22.6%).
| School Level | # Students | % Students |
| Nursery / Preschool | 41 | 3.1% |
| Kindergarten | 45 | 3.4% |
| Elementary School | 357 | 26.6% |
| Middle School | 401 | 29.9% |
| High School | 303 | 22.6% |
| College / Undergraduate | 148 | 11.0% |
| Graduate / Professional | 47 | 3.5% |
| Total | 1,342 | 100.0% |
School Enrollment by Age by Funding Source in Glencoe
Out of a total of 1,342 students who are enrolled in schools in Glencoe, 317 (23.6%) attend a private institution, while the remaining 1,025 (76.4%) are enrolled in public schools. The age group of 35 years and over has the highest likelihood of being enrolled in private schools, with 28 (43.8% in the age bracket) enrolled. Conversely, the age group of 20 to 24 year olds has the lowest likelihood of being enrolled in a private school, with 45 (100.0% in the age bracket) attending a public institution.
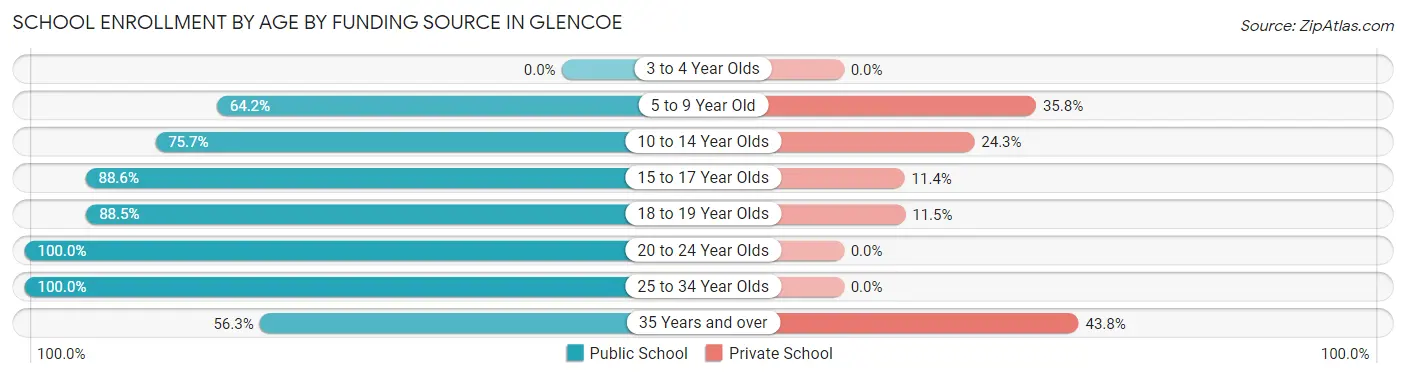
| Age Bracket | Public School | Private School |
| 3 to 4 Year Olds | 0 (0.0%) | 0 (0.0%) |
| 5 to 9 Year Old | 249 (64.2%) | 139 (35.8%) |
| 10 to 14 Year Olds | 345 (75.7%) | 111 (24.3%) |
| 15 to 17 Year Olds | 195 (88.6%) | 25 (11.4%) |
| 18 to 19 Year Olds | 108 (88.5%) | 14 (11.5%) |
| 20 to 24 Year Olds | 45 (100.0%) | 0 (0.0%) |
| 25 to 34 Year Olds | 47 (100.0%) | 0 (0.0%) |
| 35 Years and over | 36 (56.2%) | 28 (43.8%) |
| Total | 1,025 (76.4%) | 317 (23.6%) |
Educational Attainment by Field of Study in Glencoe
Education (136 | 27.3%), business (79 | 15.8%), liberal arts & history (71 | 14.2%), literature & languages (51 | 10.2%), and arts & humanities (47 | 9.4%) are the most common fields of study among 499 individuals in Glencoe who have obtained a bachelor's degree or higher.
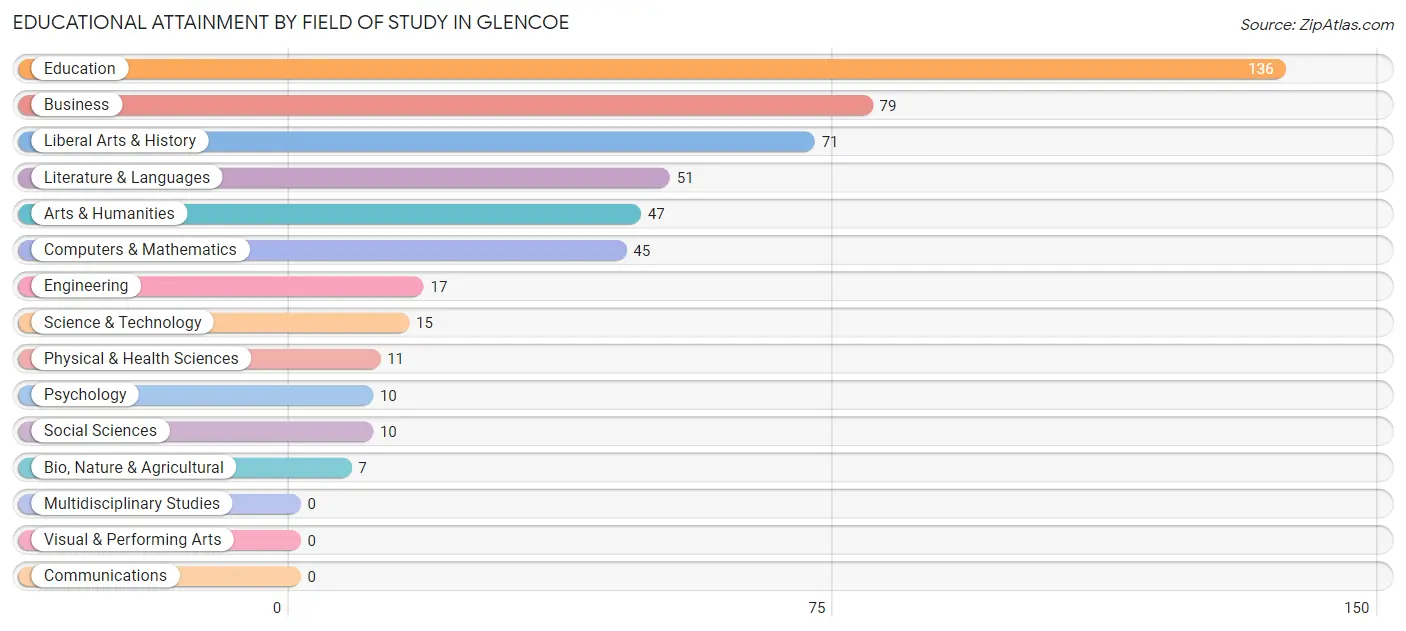
| Field of Study | # Graduates | % Graduates |
| Computers & Mathematics | 45 | 9.0% |
| Bio, Nature & Agricultural | 7 | 1.4% |
| Physical & Health Sciences | 11 | 2.2% |
| Psychology | 10 | 2.0% |
| Social Sciences | 10 | 2.0% |
| Engineering | 17 | 3.4% |
| Multidisciplinary Studies | 0 | 0.0% |
| Science & Technology | 15 | 3.0% |
| Business | 79 | 15.8% |
| Education | 136 | 27.3% |
| Literature & Languages | 51 | 10.2% |
| Liberal Arts & History | 71 | 14.2% |
| Visual & Performing Arts | 0 | 0.0% |
| Communications | 0 | 0.0% |
| Arts & Humanities | 47 | 9.4% |
| Total | 499 | 100.0% |
Transportation & Commute in Glencoe
Vehicle Availability by Sex in Glencoe
The most prevalent vehicle ownership categories in Glencoe are males with 2 vehicles (814, accounting for 51.2%) and females with 2 vehicles (586, making up 62.8%).
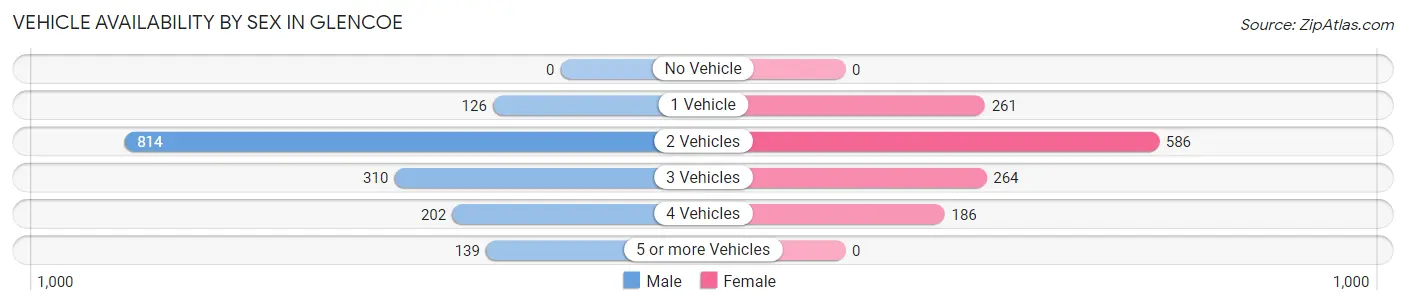
| Vehicles Available | Male | Female |
| No Vehicle | 0 (0.0%) | 0 (0.0%) |
| 1 Vehicle | 126 (7.9%) | 261 (20.1%) |
| 2 Vehicles | 814 (51.2%) | 586 (45.2%) |
| 3 Vehicles | 310 (19.5%) | 264 (20.3%) |
| 4 Vehicles | 202 (12.7%) | 186 (14.3%) |
| 5 or more Vehicles | 139 (8.7%) | 0 (0.0%) |
| Total | 1,591 (100.0%) | 1,297 (100.0%) |
Commute Time in Glencoe
The most frequently occuring commute durations in Glencoe are 5 to 9 minutes (711 commuters, 25.5%), 45 to 59 minutes (340 commuters, 12.2%), and 15 to 19 minutes (330 commuters, 11.8%).
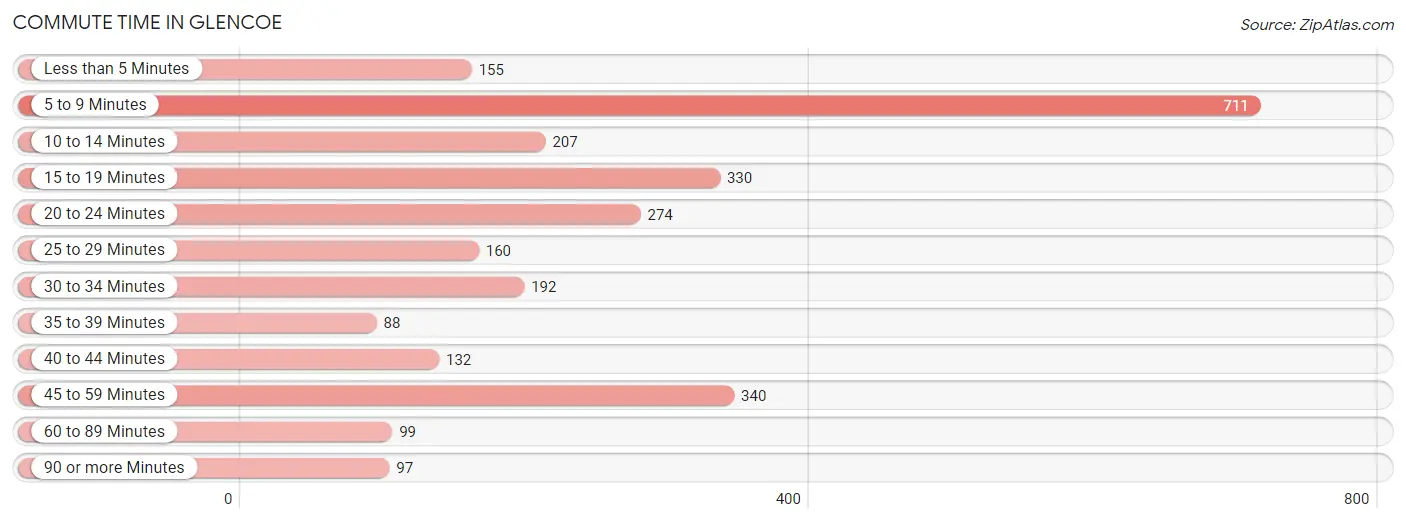
| Commute Time | # Commuters | % Commuters |
| Less than 5 Minutes | 155 | 5.6% |
| 5 to 9 Minutes | 711 | 25.5% |
| 10 to 14 Minutes | 207 | 7.4% |
| 15 to 19 Minutes | 330 | 11.8% |
| 20 to 24 Minutes | 274 | 9.8% |
| 25 to 29 Minutes | 160 | 5.8% |
| 30 to 34 Minutes | 192 | 6.9% |
| 35 to 39 Minutes | 88 | 3.2% |
| 40 to 44 Minutes | 132 | 4.7% |
| 45 to 59 Minutes | 340 | 12.2% |
| 60 to 89 Minutes | 99 | 3.5% |
| 90 or more Minutes | 97 | 3.5% |
Commute Time by Sex in Glencoe
The most common commute times in Glencoe are 5 to 9 minutes (283 commuters, 19.1%) for males and 5 to 9 minutes (428 commuters, 32.9%) for females.
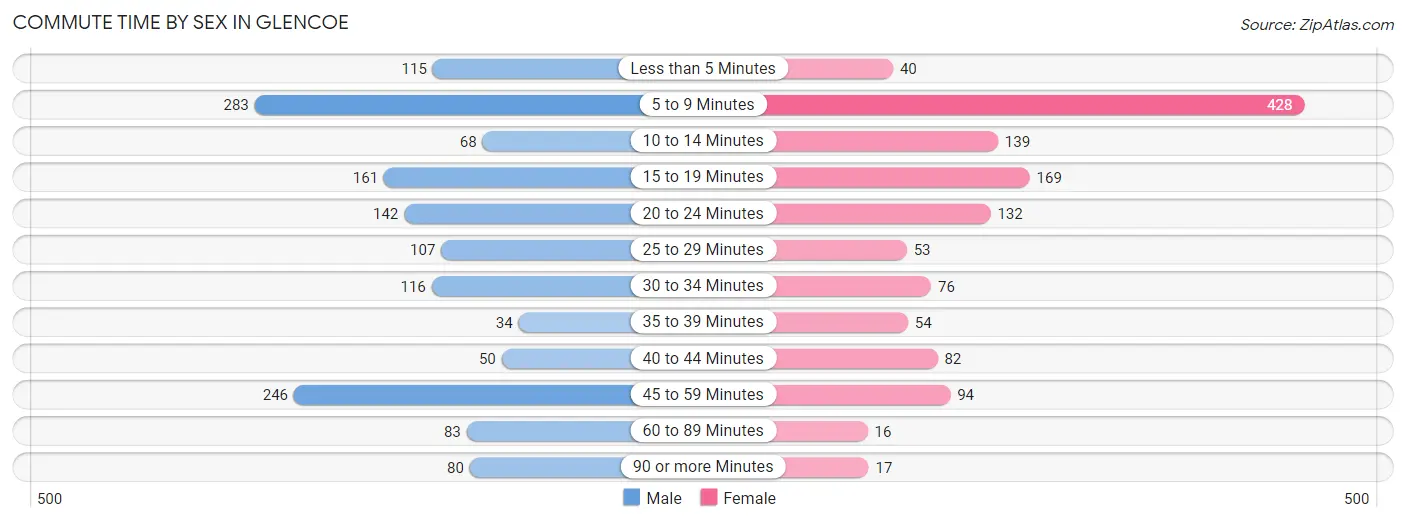
| Commute Time | Male | Female |
| Less than 5 Minutes | 115 (7.7%) | 40 (3.1%) |
| 5 to 9 Minutes | 283 (19.1%) | 428 (32.9%) |
| 10 to 14 Minutes | 68 (4.6%) | 139 (10.7%) |
| 15 to 19 Minutes | 161 (10.8%) | 169 (13.0%) |
| 20 to 24 Minutes | 142 (9.6%) | 132 (10.2%) |
| 25 to 29 Minutes | 107 (7.2%) | 53 (4.1%) |
| 30 to 34 Minutes | 116 (7.8%) | 76 (5.9%) |
| 35 to 39 Minutes | 34 (2.3%) | 54 (4.2%) |
| 40 to 44 Minutes | 50 (3.4%) | 82 (6.3%) |
| 45 to 59 Minutes | 246 (16.6%) | 94 (7.2%) |
| 60 to 89 Minutes | 83 (5.6%) | 16 (1.2%) |
| 90 or more Minutes | 80 (5.4%) | 17 (1.3%) |
Time of Departure to Work by Sex in Glencoe
The most frequent times of departure to work in Glencoe are 12:00 AM to 4:59 AM (312, 21.0%) for males and 6:00 AM to 6:29 AM (284, 21.8%) for females.
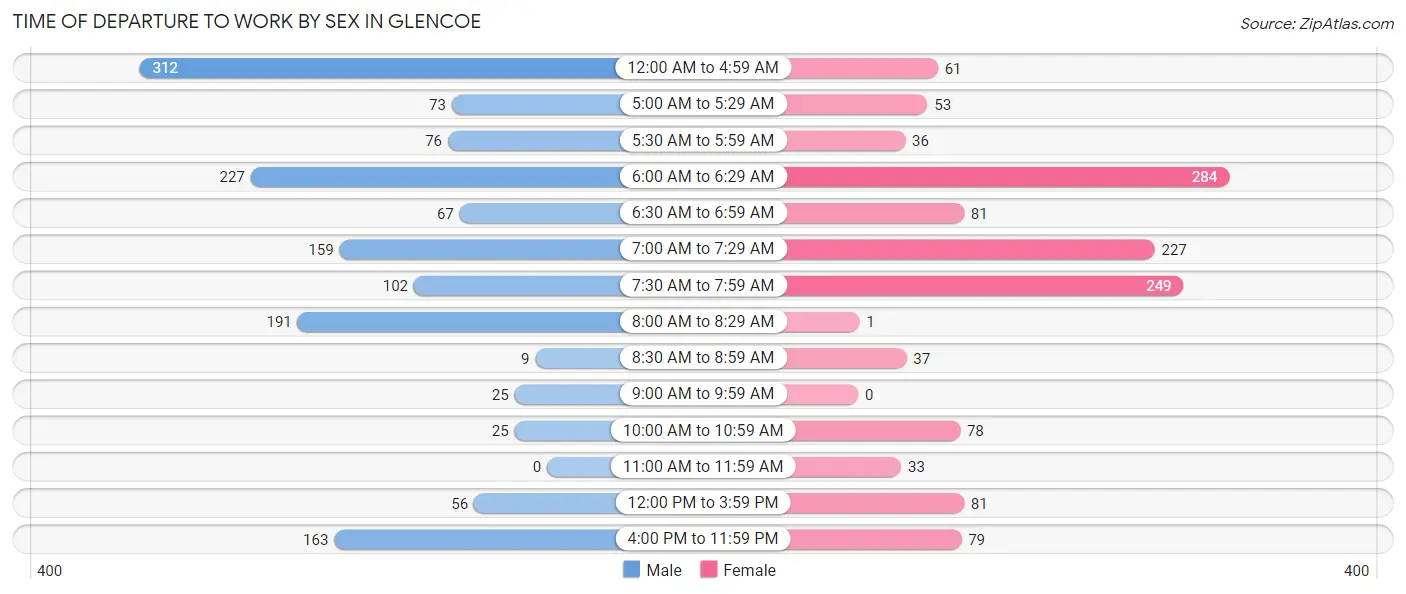
| Time of Departure | Male | Female |
| 12:00 AM to 4:59 AM | 312 (21.0%) | 61 (4.7%) |
| 5:00 AM to 5:29 AM | 73 (4.9%) | 53 (4.1%) |
| 5:30 AM to 5:59 AM | 76 (5.1%) | 36 (2.8%) |
| 6:00 AM to 6:29 AM | 227 (15.3%) | 284 (21.8%) |
| 6:30 AM to 6:59 AM | 67 (4.5%) | 81 (6.2%) |
| 7:00 AM to 7:29 AM | 159 (10.7%) | 227 (17.5%) |
| 7:30 AM to 7:59 AM | 102 (6.9%) | 249 (19.2%) |
| 8:00 AM to 8:29 AM | 191 (12.9%) | 1 (0.1%) |
| 8:30 AM to 8:59 AM | 9 (0.6%) | 37 (2.9%) |
| 9:00 AM to 9:59 AM | 25 (1.7%) | 0 (0.0%) |
| 10:00 AM to 10:59 AM | 25 (1.7%) | 78 (6.0%) |
| 11:00 AM to 11:59 AM | 0 (0.0%) | 33 (2.5%) |
| 12:00 PM to 3:59 PM | 56 (3.8%) | 81 (6.2%) |
| 4:00 PM to 11:59 PM | 163 (11.0%) | 79 (6.1%) |
| Total | 1,485 (100.0%) | 1,300 (100.0%) |
Housing Occupancy in Glencoe
Occupancy by Ownership in Glencoe
Of the total 2,215 dwellings in Glencoe, owner-occupied units account for 1,538 (69.4%), while renter-occupied units make up 677 (30.6%).
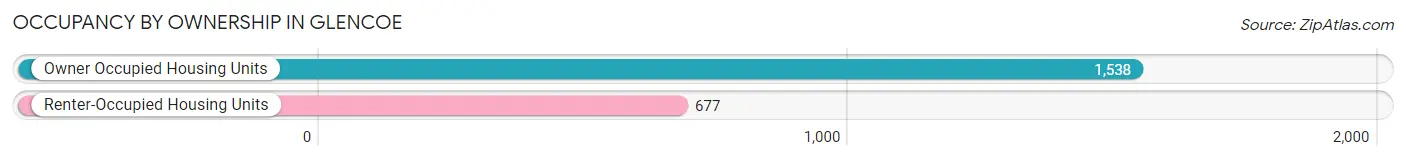
| Occupancy | # Housing Units | % Housing Units |
| Owner Occupied Housing Units | 1,538 | 69.4% |
| Renter-Occupied Housing Units | 677 | 30.6% |
| Total Occupied Housing Units | 2,215 | 100.0% |
Occupancy by Household Size in Glencoe
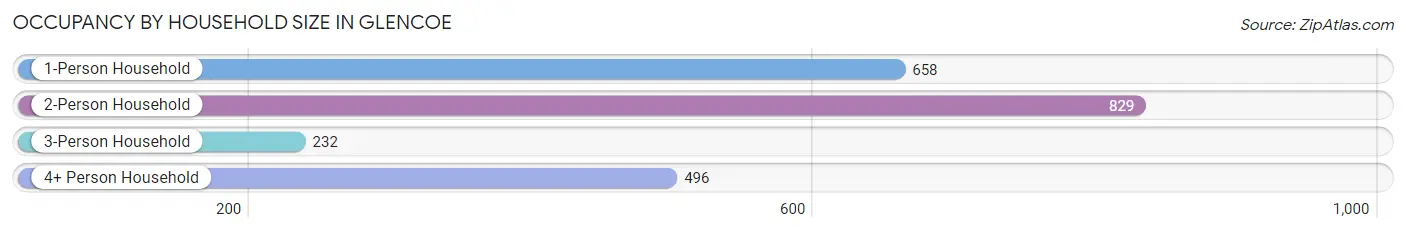
| Household Size | # Housing Units | % Housing Units |
| 1-Person Household | 658 | 29.7% |
| 2-Person Household | 829 | 37.4% |
| 3-Person Household | 232 | 10.5% |
| 4+ Person Household | 496 | 22.4% |
| Total Housing Units | 2,215 | 100.0% |
Occupancy by Ownership by Household Size in Glencoe
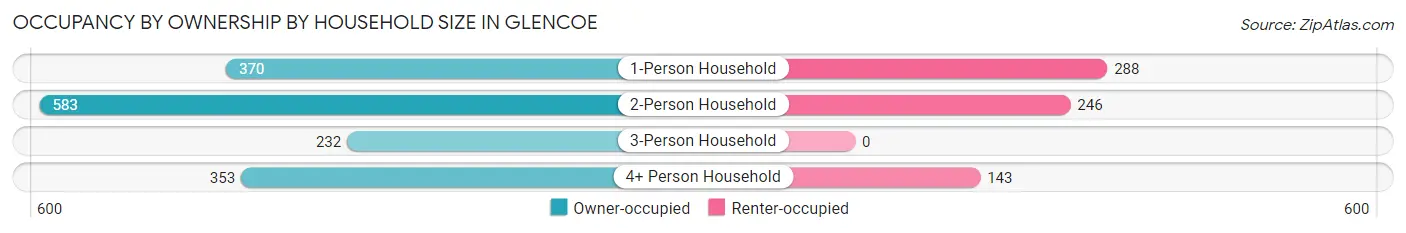
| Household Size | Owner-occupied | Renter-occupied |
| 1-Person Household | 370 (56.2%) | 288 (43.8%) |
| 2-Person Household | 583 (70.3%) | 246 (29.7%) |
| 3-Person Household | 232 (100.0%) | 0 (0.0%) |
| 4+ Person Household | 353 (71.2%) | 143 (28.8%) |
| Total Housing Units | 1,538 (69.4%) | 677 (30.6%) |
Occupancy by Educational Attainment in Glencoe
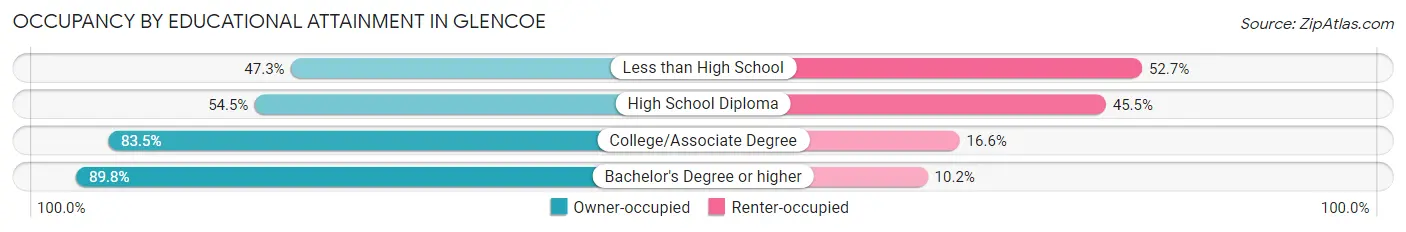
| Household Size | Owner-occupied | Renter-occupied |
| Less than High School | 70 (47.3%) | 78 (52.7%) |
| High School Diploma | 511 (54.5%) | 427 (45.5%) |
| College/Associate Degree | 746 (83.5%) | 148 (16.6%) |
| Bachelor's Degree or higher | 211 (89.8%) | 24 (10.2%) |
Occupancy by Age of Householder in Glencoe
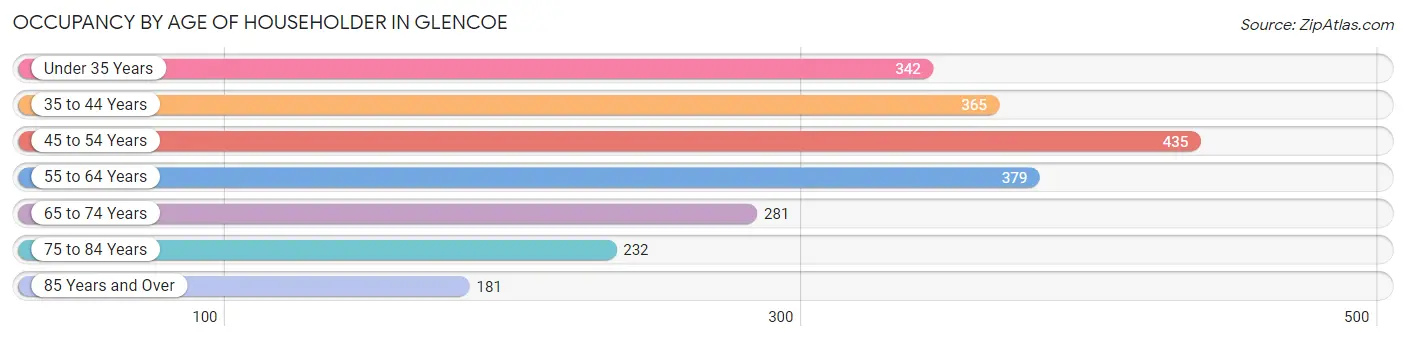
| Age Bracket | # Households | % Households |
| Under 35 Years | 342 | 15.4% |
| 35 to 44 Years | 365 | 16.5% |
| 45 to 54 Years | 435 | 19.6% |
| 55 to 64 Years | 379 | 17.1% |
| 65 to 74 Years | 281 | 12.7% |
| 75 to 84 Years | 232 | 10.5% |
| 85 Years and Over | 181 | 8.2% |
| Total | 2,215 | 100.0% |
Housing Finances in Glencoe
Median Income by Occupancy in Glencoe
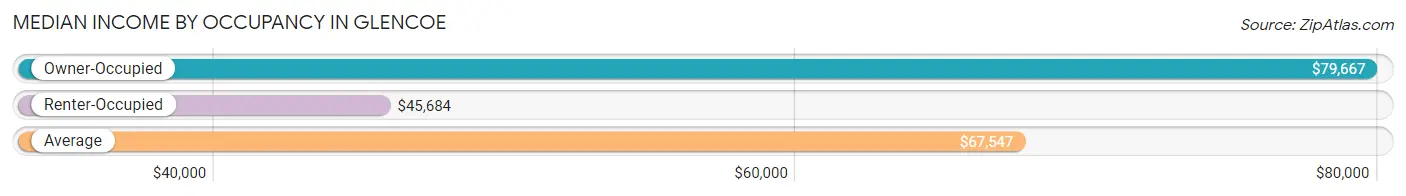
| Occupancy Type | # Households | Median Income |
| Owner-Occupied | 1,538 (69.4%) | $79,667 |
| Renter-Occupied | 677 (30.6%) | $45,684 |
| Average | 2,215 (100.0%) | $67,547 |
Occupancy by Householder Income Bracket in Glencoe
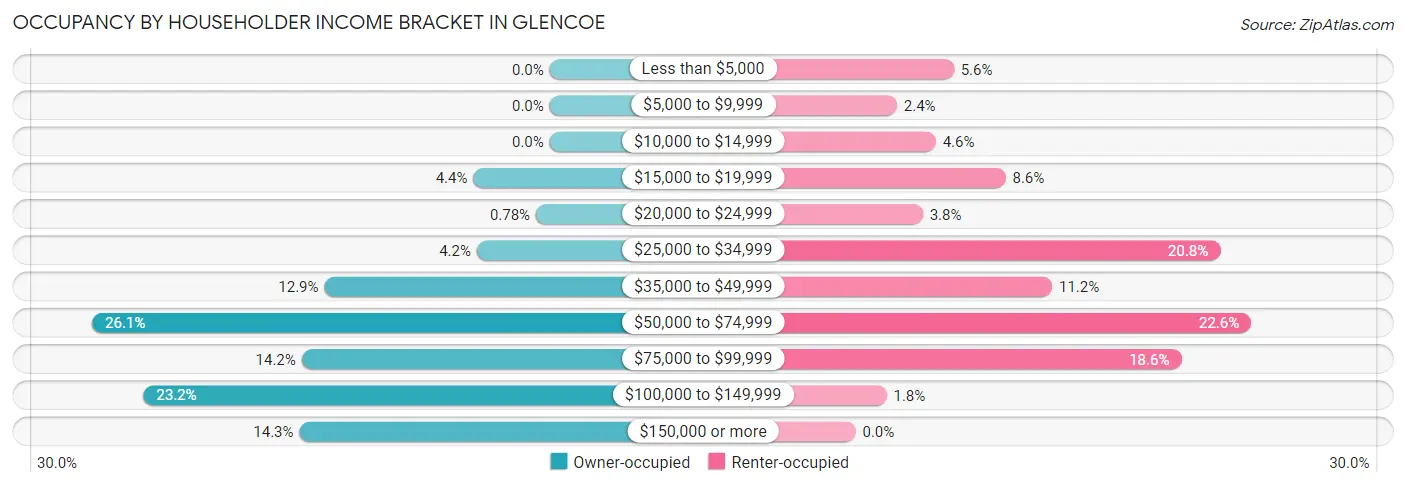
| Income Bracket | Owner-occupied | Renter-occupied |
| Less than $5,000 | 0 (0.0%) | 38 (5.6%) |
| $5,000 to $9,999 | 0 (0.0%) | 16 (2.4%) |
| $10,000 to $14,999 | 0 (0.0%) | 31 (4.6%) |
| $15,000 to $19,999 | 67 (4.4%) | 58 (8.6%) |
| $20,000 to $24,999 | 12 (0.8%) | 26 (3.8%) |
| $25,000 to $34,999 | 64 (4.2%) | 141 (20.8%) |
| $35,000 to $49,999 | 198 (12.9%) | 76 (11.2%) |
| $50,000 to $74,999 | 402 (26.1%) | 153 (22.6%) |
| $75,000 to $99,999 | 218 (14.2%) | 126 (18.6%) |
| $100,000 to $149,999 | 357 (23.2%) | 12 (1.8%) |
| $150,000 or more | 220 (14.3%) | 0 (0.0%) |
| Total | 1,538 (100.0%) | 677 (100.0%) |
Monthly Housing Cost Tiers in Glencoe
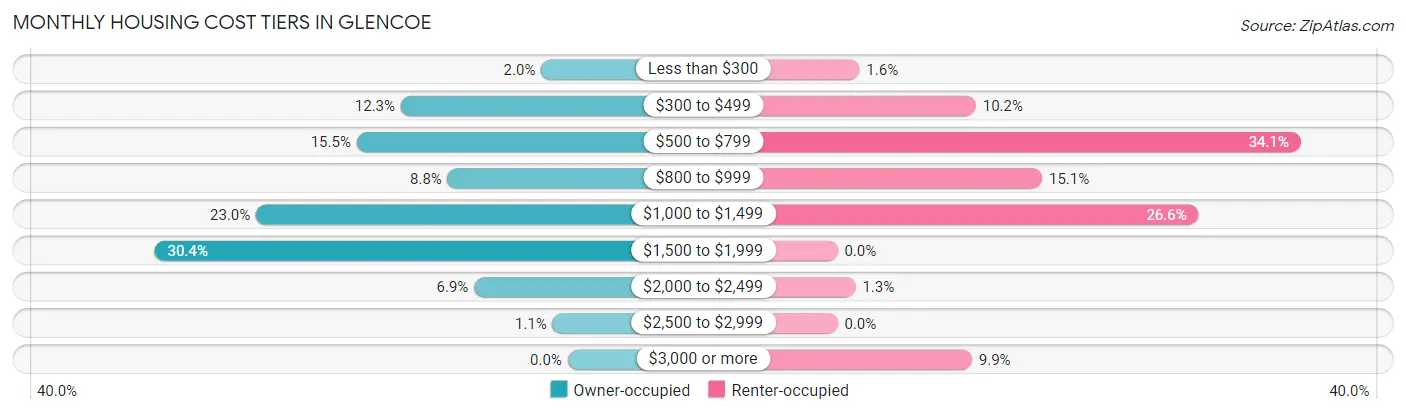
| Monthly Cost | Owner-occupied | Renter-occupied |
| Less than $300 | 30 (1.9%) | 11 (1.6%) |
| $300 to $499 | 189 (12.3%) | 69 (10.2%) |
| $500 to $799 | 239 (15.5%) | 231 (34.1%) |
| $800 to $999 | 136 (8.8%) | 102 (15.1%) |
| $1,000 to $1,499 | 353 (23.0%) | 180 (26.6%) |
| $1,500 to $1,999 | 468 (30.4%) | 0 (0.0%) |
| $2,000 to $2,499 | 106 (6.9%) | 9 (1.3%) |
| $2,500 to $2,999 | 17 (1.1%) | 0 (0.0%) |
| $3,000 or more | 0 (0.0%) | 67 (9.9%) |
| Total | 1,538 (100.0%) | 677 (100.0%) |
Physical Housing Characteristics in Glencoe
Housing Structures in Glencoe
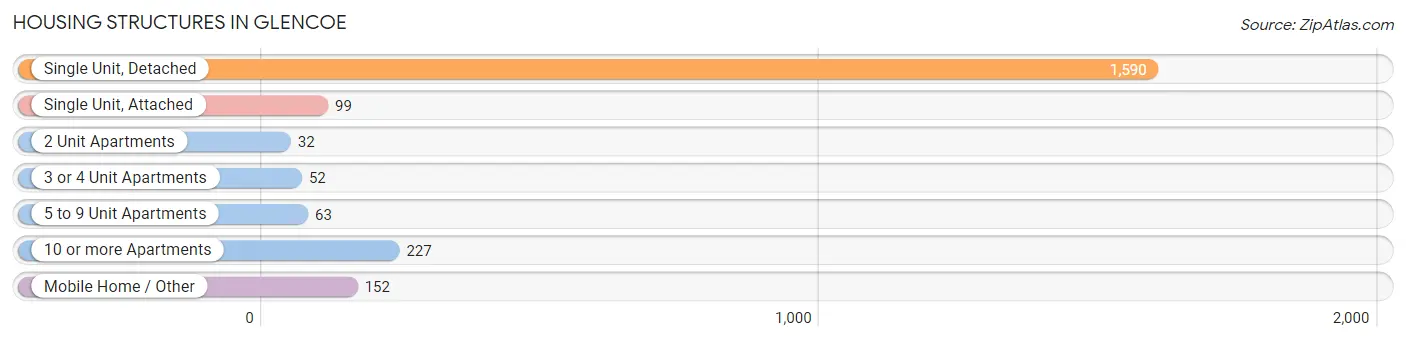
| Structure Type | # Housing Units | % Housing Units |
| Single Unit, Detached | 1,590 | 71.8% |
| Single Unit, Attached | 99 | 4.5% |
| 2 Unit Apartments | 32 | 1.4% |
| 3 or 4 Unit Apartments | 52 | 2.4% |
| 5 to 9 Unit Apartments | 63 | 2.8% |
| 10 or more Apartments | 227 | 10.2% |
| Mobile Home / Other | 152 | 6.9% |
| Total | 2,215 | 100.0% |
Housing Structures by Occupancy in Glencoe
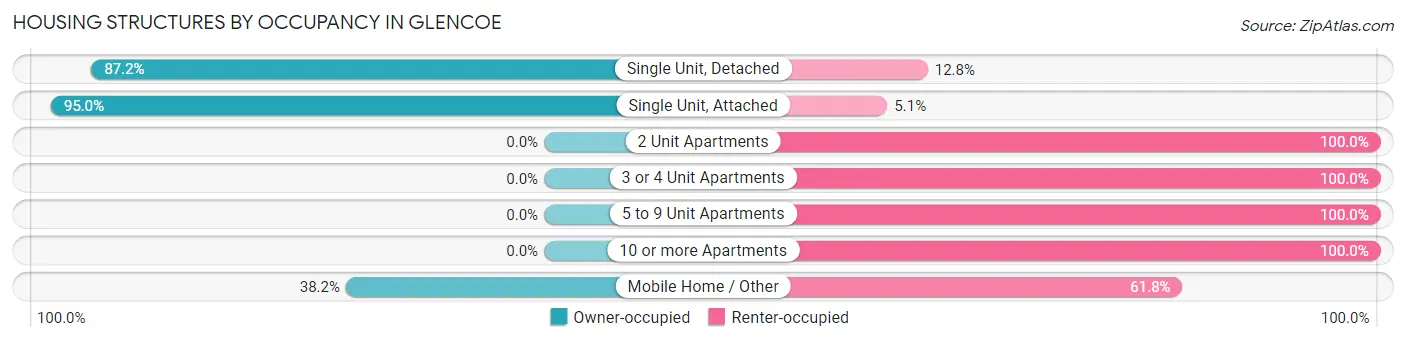
| Structure Type | Owner-occupied | Renter-occupied |
| Single Unit, Detached | 1,386 (87.2%) | 204 (12.8%) |
| Single Unit, Attached | 94 (95.0%) | 5 (5.1%) |
| 2 Unit Apartments | 0 (0.0%) | 32 (100.0%) |
| 3 or 4 Unit Apartments | 0 (0.0%) | 52 (100.0%) |
| 5 to 9 Unit Apartments | 0 (0.0%) | 63 (100.0%) |
| 10 or more Apartments | 0 (0.0%) | 227 (100.0%) |
| Mobile Home / Other | 58 (38.2%) | 94 (61.8%) |
| Total | 1,538 (69.4%) | 677 (30.6%) |
Housing Structures by Number of Rooms in Glencoe
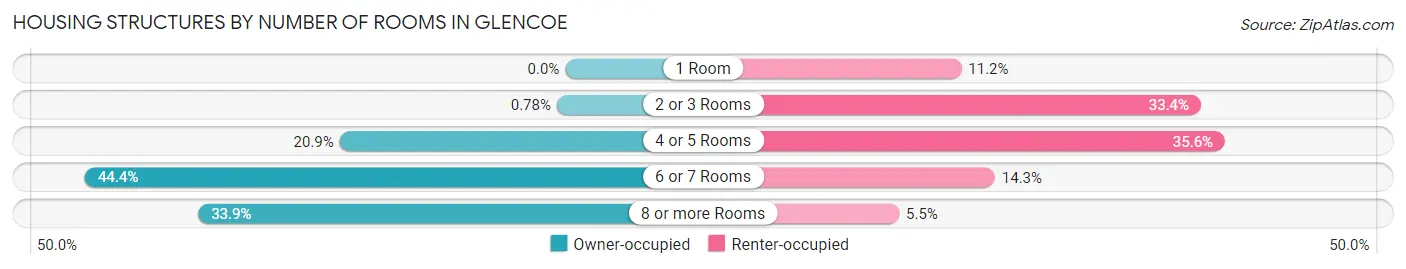
| Number of Rooms | Owner-occupied | Renter-occupied |
| 1 Room | 0 (0.0%) | 76 (11.2%) |
| 2 or 3 Rooms | 12 (0.8%) | 226 (33.4%) |
| 4 or 5 Rooms | 321 (20.9%) | 241 (35.6%) |
| 6 or 7 Rooms | 683 (44.4%) | 97 (14.3%) |
| 8 or more Rooms | 522 (33.9%) | 37 (5.5%) |
| Total | 1,538 (100.0%) | 677 (100.0%) |
Housing Structure by Heating Type in Glencoe
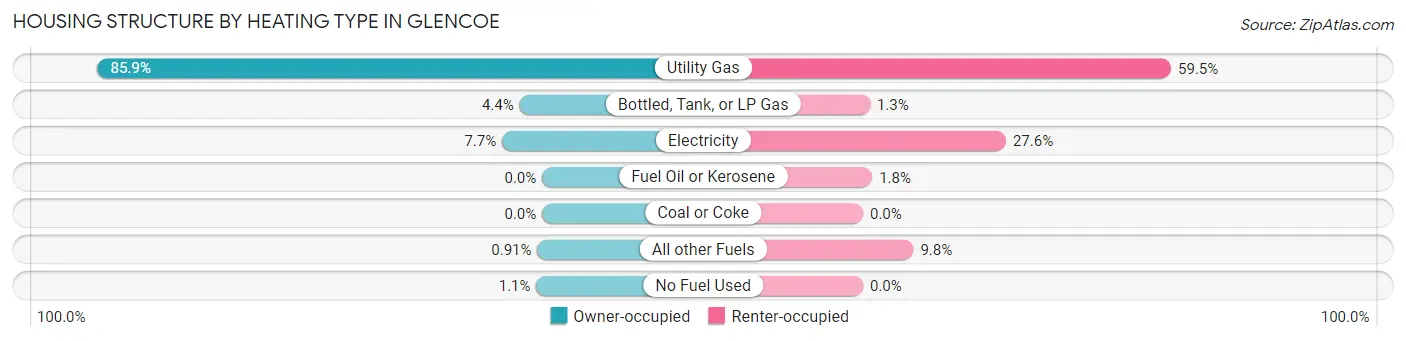
| Heating Type | Owner-occupied | Renter-occupied |
| Utility Gas | 1,321 (85.9%) | 403 (59.5%) |
| Bottled, Tank, or LP Gas | 67 (4.4%) | 9 (1.3%) |
| Electricity | 119 (7.7%) | 187 (27.6%) |
| Fuel Oil or Kerosene | 0 (0.0%) | 12 (1.8%) |
| Coal or Coke | 0 (0.0%) | 0 (0.0%) |
| All other Fuels | 14 (0.9%) | 66 (9.8%) |
| No Fuel Used | 17 (1.1%) | 0 (0.0%) |
| Total | 1,538 (100.0%) | 677 (100.0%) |
Household Vehicle Usage in Glencoe
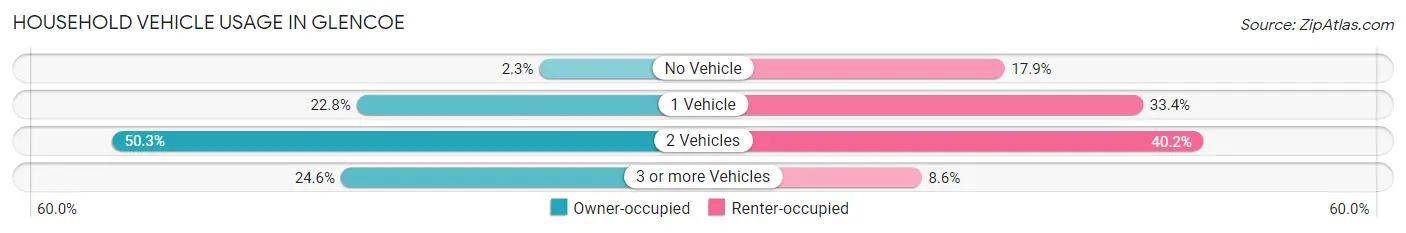
| Vehicles per Household | Owner-occupied | Renter-occupied |
| No Vehicle | 36 (2.3%) | 121 (17.9%) |
| 1 Vehicle | 351 (22.8%) | 226 (33.4%) |
| 2 Vehicles | 773 (50.3%) | 272 (40.2%) |
| 3 or more Vehicles | 378 (24.6%) | 58 (8.6%) |
| Total | 1,538 (100.0%) | 677 (100.0%) |
Real Estate & Mortgages in Glencoe
Real Estate and Mortgage Overview in Glencoe
| Characteristic | Without Mortgage | With Mortgage |
| Housing Units | 562 | 976 |
| Median Property Value | $175,600 | $221,400 |
| Median Household Income | $54,375 | $152 |
| Monthly Housing Costs | $598 | $0 |
| Real Estate Taxes | $1,955 | $0 |
Property Value by Mortgage Status in Glencoe
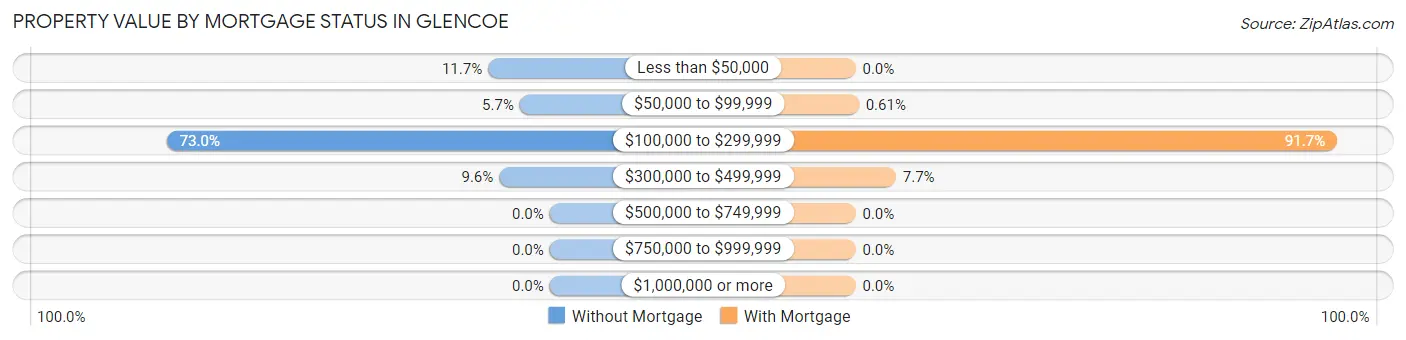
| Property Value | Without Mortgage | With Mortgage |
| Less than $50,000 | 66 (11.7%) | 0 (0.0%) |
| $50,000 to $99,999 | 32 (5.7%) | 6 (0.6%) |
| $100,000 to $299,999 | 410 (73.0%) | 895 (91.7%) |
| $300,000 to $499,999 | 54 (9.6%) | 75 (7.7%) |
| $500,000 to $749,999 | 0 (0.0%) | 0 (0.0%) |
| $750,000 to $999,999 | 0 (0.0%) | 0 (0.0%) |
| $1,000,000 or more | 0 (0.0%) | 0 (0.0%) |
| Total | 562 (100.0%) | 976 (100.0%) |
Household Income by Mortgage Status in Glencoe
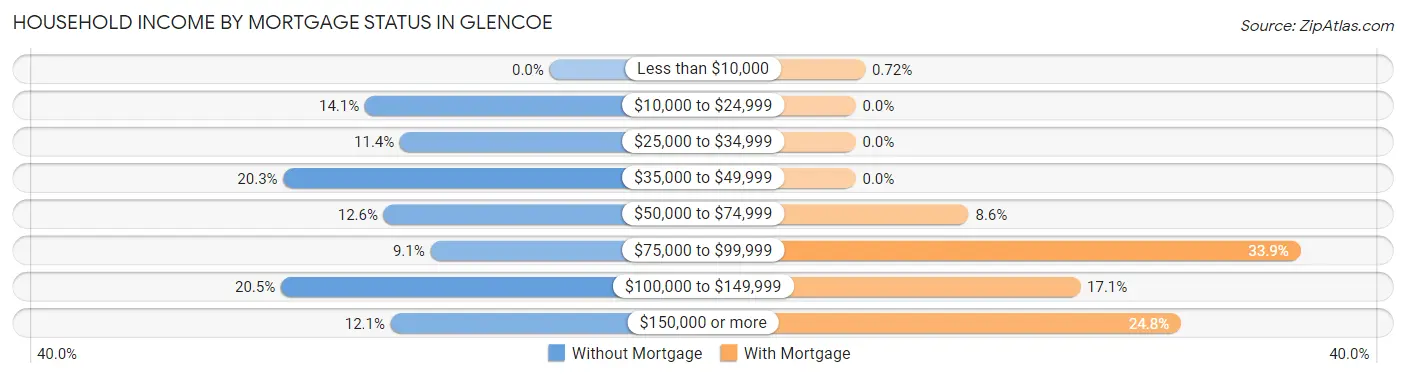
| Household Income | Without Mortgage | With Mortgage |
| Less than $10,000 | 0 (0.0%) | 7 (0.7%) |
| $10,000 to $24,999 | 79 (14.1%) | 0 (0.0%) |
| $25,000 to $34,999 | 64 (11.4%) | 0 (0.0%) |
| $35,000 to $49,999 | 114 (20.3%) | 0 (0.0%) |
| $50,000 to $74,999 | 71 (12.6%) | 84 (8.6%) |
| $75,000 to $99,999 | 51 (9.1%) | 331 (33.9%) |
| $100,000 to $149,999 | 115 (20.5%) | 167 (17.1%) |
| $150,000 or more | 68 (12.1%) | 242 (24.8%) |
| Total | 562 (100.0%) | 976 (100.0%) |
Property Value to Household Income Ratio in Glencoe
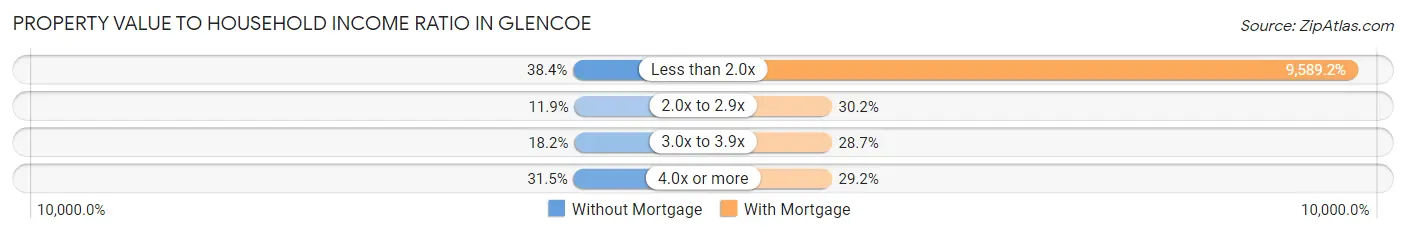
| Value-to-Income Ratio | Without Mortgage | With Mortgage |
| Less than 2.0x | 216 (38.4%) | 93,591 (9,589.2%) |
| 2.0x to 2.9x | 67 (11.9%) | 295 (30.2%) |
| 3.0x to 3.9x | 102 (18.1%) | 280 (28.7%) |
| 4.0x or more | 177 (31.5%) | 285 (29.2%) |
| Total | 562 (100.0%) | 976 (100.0%) |
Real Estate Taxes by Mortgage Status in Glencoe
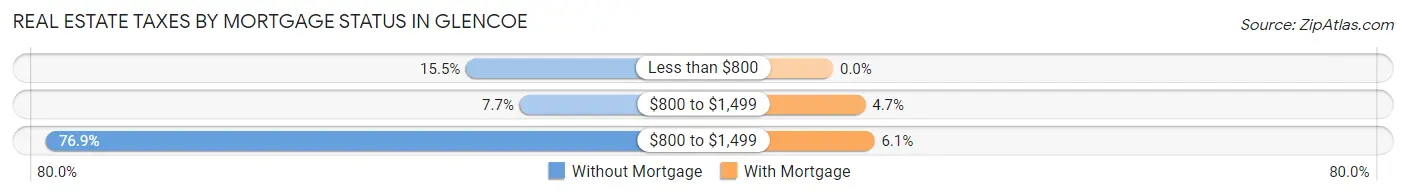
| Property Taxes | Without Mortgage | With Mortgage |
| Less than $800 | 87 (15.5%) | 0 (0.0%) |
| $800 to $1,499 | 43 (7.6%) | 46 (4.7%) |
| $800 to $1,499 | 432 (76.9%) | 59 (6.0%) |
| Total | 562 (100.0%) | 976 (100.0%) |
Health & Disability in Glencoe
Health Insurance Coverage by Age in Glencoe
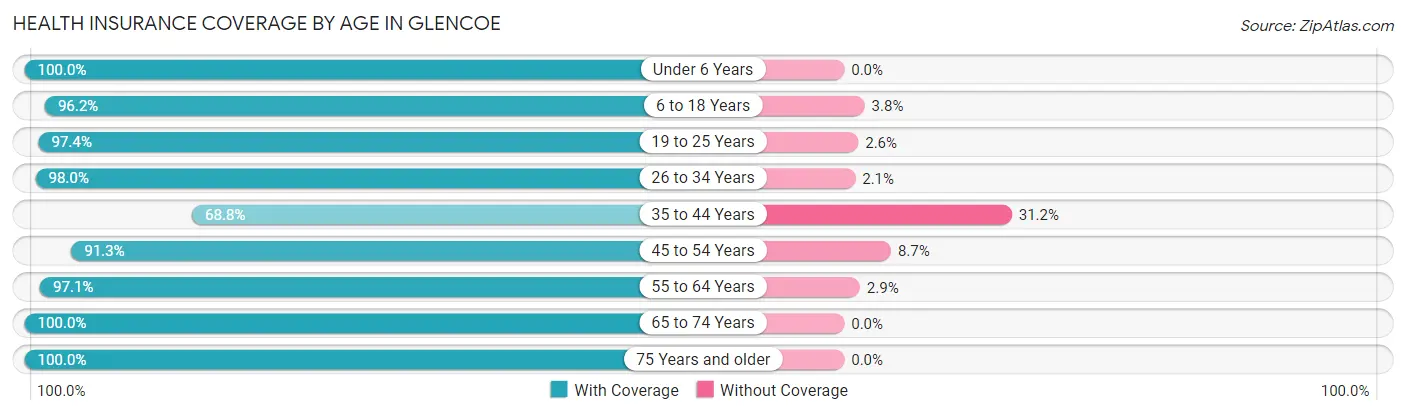
| Age Bracket | With Coverage | Without Coverage |
| Under 6 Years | 268 (100.0%) | 0 (0.0%) |
| 6 to 18 Years | 1,064 (96.2%) | 42 (3.8%) |
| 19 to 25 Years | 486 (97.4%) | 13 (2.6%) |
| 26 to 34 Years | 668 (98.0%) | 14 (2.1%) |
| 35 to 44 Years | 480 (68.8%) | 218 (31.2%) |
| 45 to 54 Years | 566 (91.3%) | 54 (8.7%) |
| 55 to 64 Years | 600 (97.1%) | 18 (2.9%) |
| 65 to 74 Years | 469 (100.0%) | 0 (0.0%) |
| 75 Years and older | 552 (100.0%) | 0 (0.0%) |
| Total | 5,153 (93.5%) | 359 (6.5%) |
Health Insurance Coverage by Citizenship Status in Glencoe
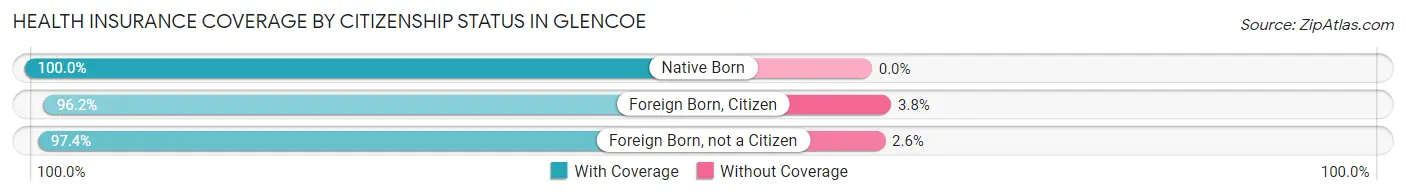
| Citizenship Status | With Coverage | Without Coverage |
| Native Born | 268 (100.0%) | 0 (0.0%) |
| Foreign Born, Citizen | 1,064 (96.2%) | 42 (3.8%) |
| Foreign Born, not a Citizen | 486 (97.4%) | 13 (2.6%) |
Health Insurance Coverage by Household Income in Glencoe
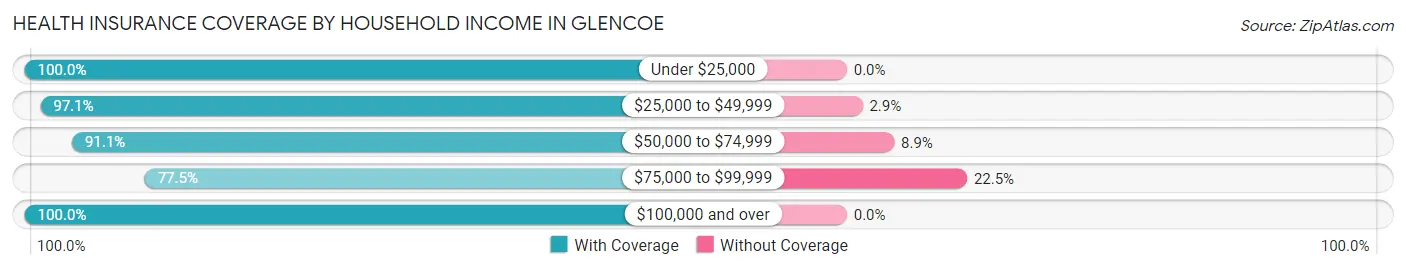
| Household Income | With Coverage | Without Coverage |
| Under $25,000 | 248 (100.0%) | 0 (0.0%) |
| $25,000 to $49,999 | 1,055 (97.1%) | 32 (2.9%) |
| $50,000 to $74,999 | 1,295 (91.1%) | 126 (8.9%) |
| $75,000 to $99,999 | 692 (77.5%) | 201 (22.5%) |
| $100,000 and over | 1,858 (100.0%) | 0 (0.0%) |
Public vs Private Health Insurance Coverage by Age in Glencoe
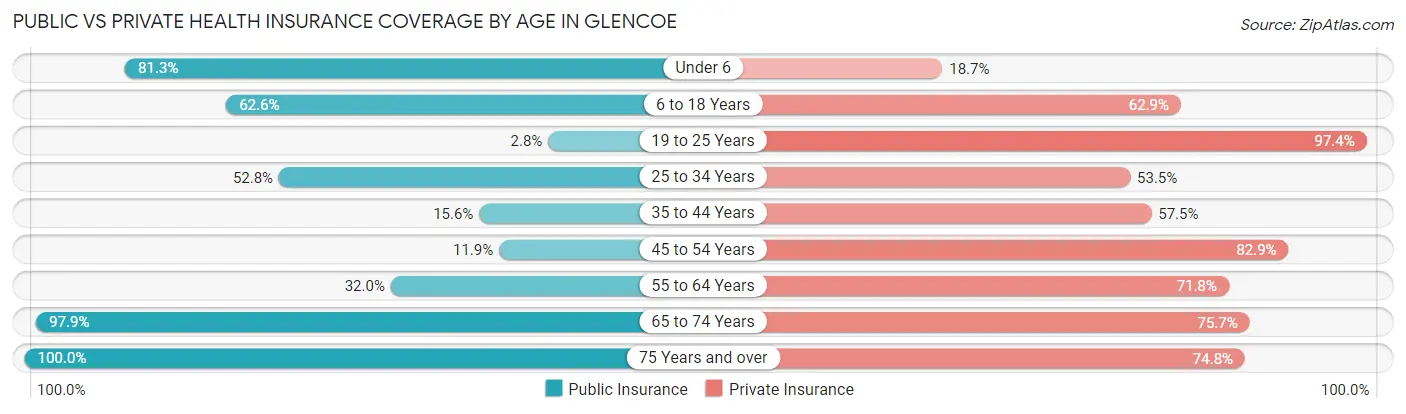
| Age Bracket | Public Insurance | Private Insurance |
| Under 6 | 218 (81.3%) | 50 (18.7%) |
| 6 to 18 Years | 692 (62.6%) | 696 (62.9%) |
| 19 to 25 Years | 14 (2.8%) | 486 (97.4%) |
| 25 to 34 Years | 360 (52.8%) | 365 (53.5%) |
| 35 to 44 Years | 109 (15.6%) | 401 (57.5%) |
| 45 to 54 Years | 74 (11.9%) | 514 (82.9%) |
| 55 to 64 Years | 198 (32.0%) | 444 (71.8%) |
| 65 to 74 Years | 459 (97.9%) | 355 (75.7%) |
| 75 Years and over | 552 (100.0%) | 413 (74.8%) |
| Total | 2,676 (48.5%) | 3,724 (67.6%) |
Disability Status by Sex by Age in Glencoe
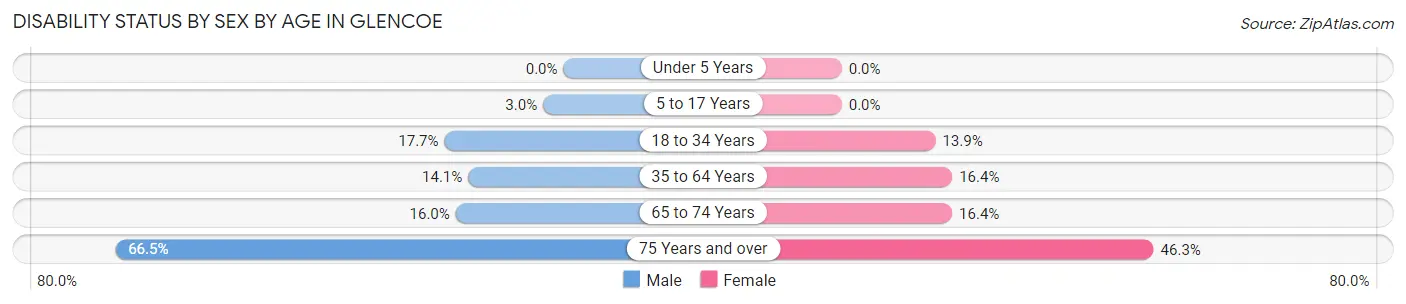
| Age Bracket | Male | Female |
| Under 5 Years | 0 (0.0%) | 0 (0.0%) |
| 5 to 17 Years | 16 (3.0%) | 0 (0.0%) |
| 18 to 34 Years | 123 (17.7%) | 79 (13.9%) |
| 35 to 64 Years | 134 (14.1%) | 162 (16.4%) |
| 65 to 74 Years | 36 (16.0%) | 40 (16.4%) |
| 75 Years and over | 169 (66.5%) | 138 (46.3%) |
Disability Class by Sex by Age in Glencoe
Disability Class: Hearing Difficulty
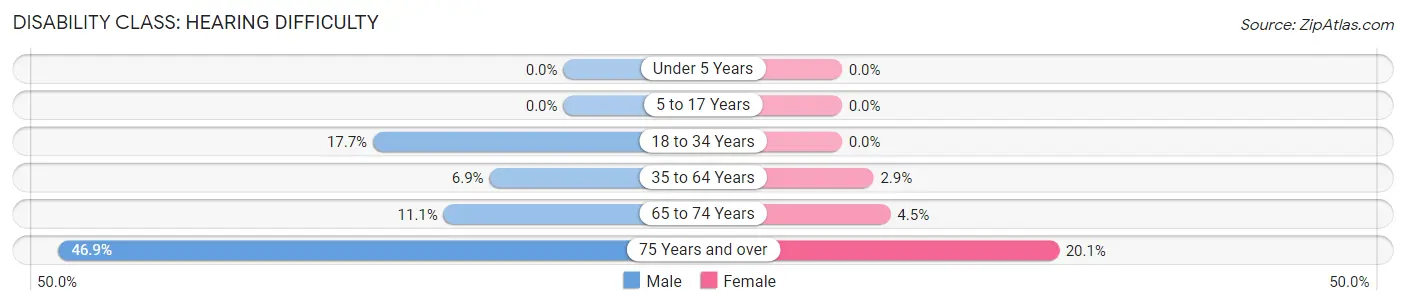
| Age Bracket | Male | Female |
| Under 5 Years | 0 (0.0%) | 0 (0.0%) |
| 5 to 17 Years | 0 (0.0%) | 0 (0.0%) |
| 18 to 34 Years | 123 (17.7%) | 0 (0.0%) |
| 35 to 64 Years | 65 (6.9%) | 29 (2.9%) |
| 65 to 74 Years | 25 (11.1%) | 11 (4.5%) |
| 75 Years and over | 119 (46.9%) | 60 (20.1%) |
Disability Class: Vision Difficulty
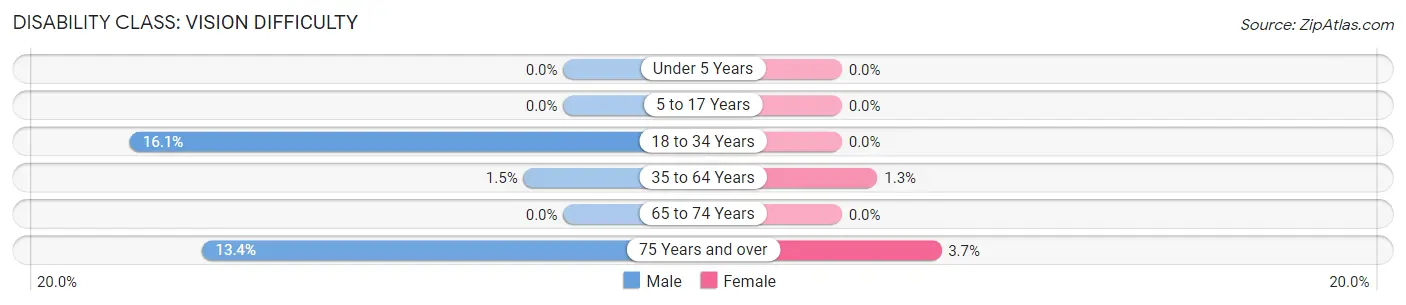
| Age Bracket | Male | Female |
| Under 5 Years | 0 (0.0%) | 0 (0.0%) |
| 5 to 17 Years | 0 (0.0%) | 0 (0.0%) |
| 18 to 34 Years | 112 (16.1%) | 0 (0.0%) |
| 35 to 64 Years | 14 (1.5%) | 13 (1.3%) |
| 65 to 74 Years | 0 (0.0%) | 0 (0.0%) |
| 75 Years and over | 34 (13.4%) | 11 (3.7%) |
Disability Class: Cognitive Difficulty
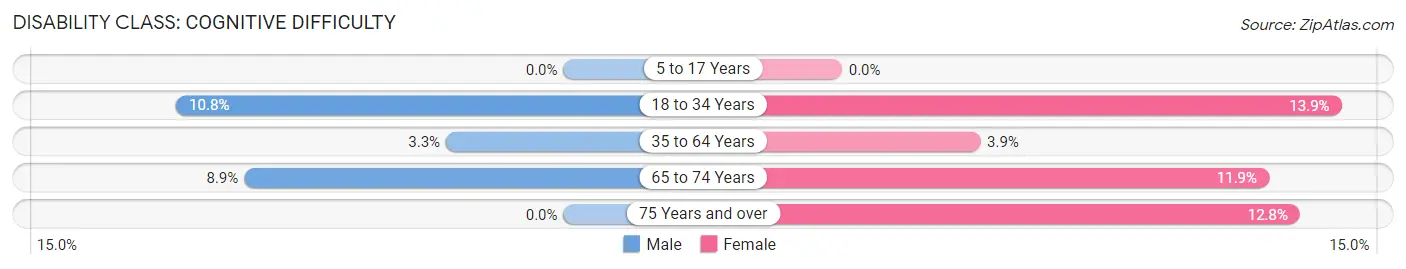
| Age Bracket | Male | Female |
| 5 to 17 Years | 0 (0.0%) | 0 (0.0%) |
| 18 to 34 Years | 75 (10.8%) | 79 (13.9%) |
| 35 to 64 Years | 31 (3.3%) | 38 (3.8%) |
| 65 to 74 Years | 20 (8.9%) | 29 (11.9%) |
| 75 Years and over | 0 (0.0%) | 38 (12.8%) |
Disability Class: Ambulatory Difficulty
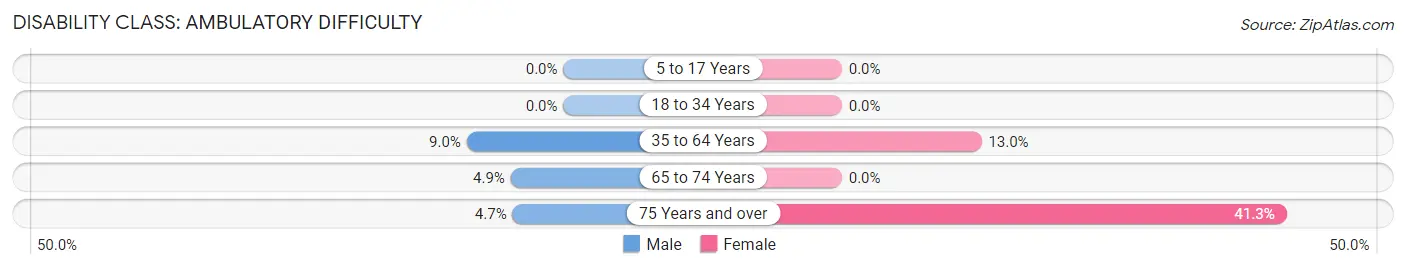
| Age Bracket | Male | Female |
| 5 to 17 Years | 0 (0.0%) | 0 (0.0%) |
| 18 to 34 Years | 0 (0.0%) | 0 (0.0%) |
| 35 to 64 Years | 85 (9.0%) | 128 (13.0%) |
| 65 to 74 Years | 11 (4.9%) | 0 (0.0%) |
| 75 Years and over | 12 (4.7%) | 123 (41.3%) |
Disability Class: Self-Care Difficulty
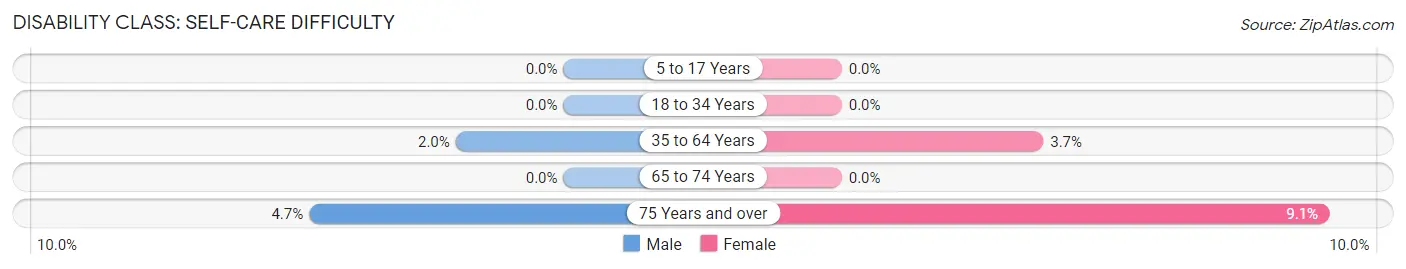
| Age Bracket | Male | Female |
| 5 to 17 Years | 0 (0.0%) | 0 (0.0%) |
| 18 to 34 Years | 0 (0.0%) | 0 (0.0%) |
| 35 to 64 Years | 19 (2.0%) | 37 (3.7%) |
| 65 to 74 Years | 0 (0.0%) | 0 (0.0%) |
| 75 Years and over | 12 (4.7%) | 27 (9.1%) |
Technology Access in Glencoe
Computing Device Access in Glencoe
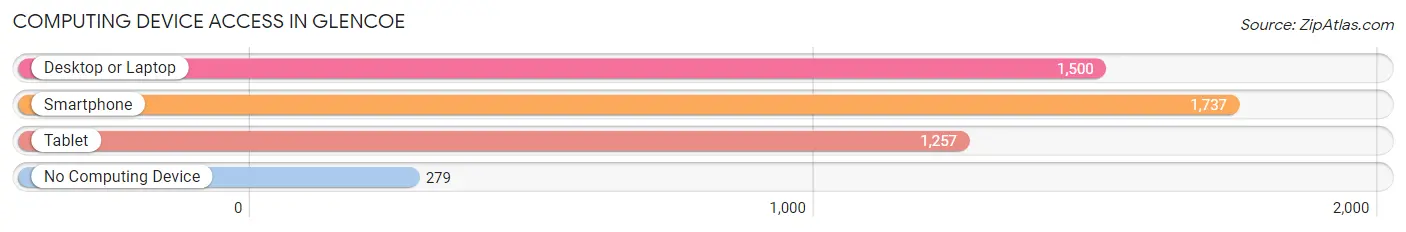
| Device Type | # Households | % Households |
| Desktop or Laptop | 1,500 | 67.7% |
| Smartphone | 1,737 | 78.4% |
| Tablet | 1,257 | 56.8% |
| No Computing Device | 279 | 12.6% |
| Total | 2,215 | 100.0% |
Internet Access in Glencoe
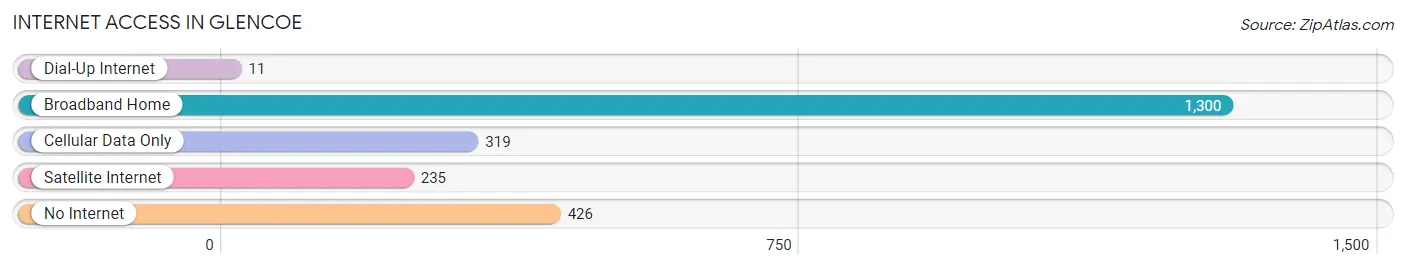
| Internet Type | # Households | % Households |
| Dial-Up Internet | 11 | 0.5% |
| Broadband Home | 1,300 | 58.7% |
| Cellular Data Only | 319 | 14.4% |
| Satellite Internet | 235 | 10.6% |
| No Internet | 426 | 19.2% |
| Total | 2,215 | 100.0% |
Glencoe Summary
Glencoe, Minnesota is a small city located in McLeod County, in the south-central part of the state. It is situated on the banks of the Crow River, about 40 miles west of Minneapolis. The city has a population of 5,521, according to the 2010 census.
Geography
Glencoe is located in the rolling hills of the Minnesota River Valley. The city is situated on the banks of the Crow River, which flows through the city from east to west. The city is surrounded by farmland and is located near the junction of State Highways 22 and 212. The city is located in McLeod County, which is part of the Twin Cities metropolitan area.
History
Glencoe was founded in 1856 by a group of settlers from New England. The city was named after the Scottish town of Glencoe, which was the birthplace of one of the settlers. The city was incorporated in 1872 and has since grown to become a thriving community.
Economy
Glencoe is a small city with a diverse economy. The city is home to several manufacturing companies, including a paper mill, a printing company, and a plastics manufacturer. The city also has a strong agricultural sector, with several dairy farms and grain elevators located in the area. The city is also home to several retail stores, restaurants, and other businesses.
Demographics
According to the 2010 census, the population of Glencoe was 5,521. The median age of the population was 43.7 years, and the median household income was $50,945. The city is predominantly white, with 91.3% of the population identifying as white. The city also has a small Hispanic population, with 4.3% of the population identifying as Hispanic or Latino.
Conclusion
Glencoe, Minnesota is a small city located in McLeod County, in the south-central part of the state. It is situated on the banks of the Crow River, about 40 miles west of Minneapolis. The city has a population of 5,521, according to the 2010 census. The city has a diverse economy, with several manufacturing companies, agricultural businesses, and retail stores located in the area. The population of Glencoe is predominantly white, with 91.3% of the population identifying as white. The city also has a small Hispanic population, with 4.3% of the population identifying as Hispanic or Latino.
Common Questions
What is Per Capita Income in Glencoe?
Per Capita income in Glencoe is $32,665.
What is the Median Family Income in Glencoe?
Median Family Income in Glencoe is $83,484.
What is the Median Household income in Glencoe?
Median Household Income in Glencoe is $67,547.
What is Income or Wage Gap in Glencoe?
Income or Wage Gap in Glencoe is 26.6%.
Women in Glencoe earn 73.4 cents for every dollar earned by a man.
What is Inequality or Gini Index in Glencoe?
Inequality or Gini Index in Glencoe is 0.37.
What is the Total Population of Glencoe?
Total Population of Glencoe is 5,712.
What is the Total Male Population of Glencoe?
Total Male Population of Glencoe is 2,970.
What is the Total Female Population of Glencoe?
Total Female Population of Glencoe is 2,742.
What is the Ratio of Males per 100 Females in Glencoe?
There are 108.32 Males per 100 Females in Glencoe.
What is the Ratio of Females per 100 Males in Glencoe?
There are 92.32 Females per 100 Males in Glencoe.
What is the Median Population Age in Glencoe?
Median Population Age in Glencoe is 37.6 Years.
What is the Average Family Size in Glencoe
Average Family Size in Glencoe is 3.1 People.
What is the Average Household Size in Glencoe
Average Household Size in Glencoe is 2.5 People.
How Large is the Labor Force in Glencoe?
There are 2,951 People in the Labor Forcein in Glencoe.
What is the Percentage of People in the Labor Force in Glencoe?
64.6% of People are in the Labor Force in Glencoe.
What is the Unemployment Rate in Glencoe?
Unemployment Rate in Glencoe is 2.1%.