Mora, MN Map & Demographics
Mora Map
Mora Overview
$29,021
PER CAPITA INCOME
$61,382
AVG FAMILY INCOME
$51,577
AVG HOUSEHOLD INCOME
2.7%
WAGE / INCOME GAP [ % ]
97.3¢/ $1
WAGE / INCOME GAP [ $ ]
0.40
INEQUALITY / GINI INDEX
3,685
TOTAL POPULATION
1,839
MALE POPULATION
1,846
FEMALE POPULATION
99.62
MALES / 100 FEMALES
100.38
FEMALES / 100 MALES
40.8
MEDIAN AGE
3.0
AVG FAMILY SIZE
2.3
AVG HOUSEHOLD SIZE
1,673
LABOR FORCE [ PEOPLE ]
55.4%
PERCENT IN LABOR FORCE
2.4%
UNEMPLOYMENT RATE
Mora Zip Codes
Mora Area Codes
Income in Mora
Income Overview in Mora
Per Capita Income in Mora is $29,021, while median incomes of families and households are $61,382 and $51,577 respectively.
| Characteristic | Number | Measure |
| Per Capita Income | 3,685 | $29,021 |
| Median Family Income | 831 | $61,382 |
| Mean Family Income | 831 | $73,445 |
| Median Household Income | 1,509 | $51,577 |
| Mean Household Income | 1,509 | $64,969 |
| Income Deficit | 831 | $0 |
| Wage / Income Gap (%) | 3,685 | 2.74% |
| Wage / Income Gap ($) | 3,685 | 97.26¢ per $1 |
| Gini / Inequality Index | 3,685 | 0.40 |
Earnings by Sex in Mora
Average Earnings in Mora are $31,957, $32,446 for men and $31,557 for women, a difference of 2.7%.
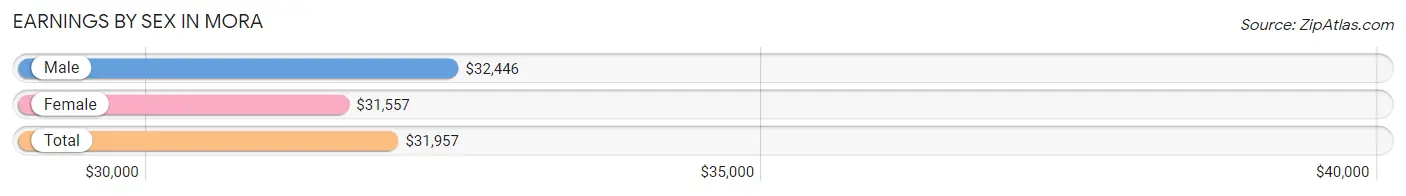
| Sex | Number | Average Earnings |
| Male | 980 (54.9%) | $32,446 |
| Female | 806 (45.1%) | $31,557 |
| Total | 1,786 (100.0%) | $31,957 |
Earnings by Sex by Income Bracket in Mora
The most common earnings brackets in Mora are $20,000 to $22,499 for men (122 | 12.4%) and $30,000 to $34,999 for women (165 | 20.5%).
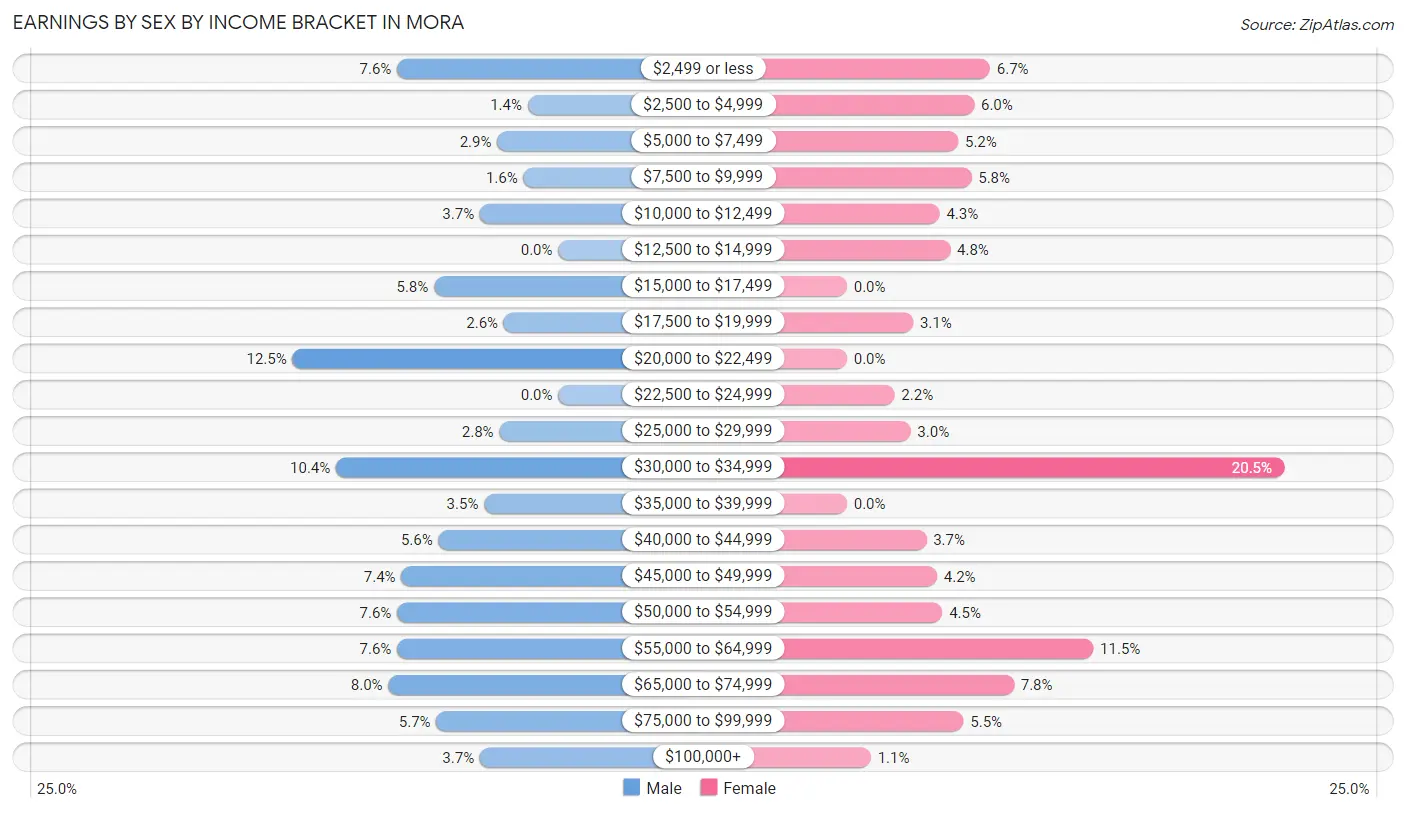
| Income | Male | Female |
| $2,499 or less | 74 (7.5%) | 54 (6.7%) |
| $2,500 to $4,999 | 14 (1.4%) | 48 (6.0%) |
| $5,000 to $7,499 | 28 (2.9%) | 42 (5.2%) |
| $7,500 to $9,999 | 16 (1.6%) | 47 (5.8%) |
| $10,000 to $12,499 | 36 (3.7%) | 35 (4.3%) |
| $12,500 to $14,999 | 0 (0.0%) | 39 (4.8%) |
| $15,000 to $17,499 | 57 (5.8%) | 0 (0.0%) |
| $17,500 to $19,999 | 25 (2.5%) | 25 (3.1%) |
| $20,000 to $22,499 | 122 (12.4%) | 0 (0.0%) |
| $22,500 to $24,999 | 0 (0.0%) | 18 (2.2%) |
| $25,000 to $29,999 | 27 (2.8%) | 24 (3.0%) |
| $30,000 to $34,999 | 102 (10.4%) | 165 (20.5%) |
| $35,000 to $39,999 | 34 (3.5%) | 0 (0.0%) |
| $40,000 to $44,999 | 55 (5.6%) | 30 (3.7%) |
| $45,000 to $49,999 | 72 (7.3%) | 34 (4.2%) |
| $50,000 to $54,999 | 74 (7.5%) | 36 (4.5%) |
| $55,000 to $64,999 | 74 (7.5%) | 93 (11.5%) |
| $65,000 to $74,999 | 78 (8.0%) | 63 (7.8%) |
| $75,000 to $99,999 | 56 (5.7%) | 44 (5.5%) |
| $100,000+ | 36 (3.7%) | 9 (1.1%) |
| Total | 980 (100.0%) | 806 (100.0%) |
Earnings by Sex by Educational Attainment in Mora
Average earnings in Mora are $41,042 for men and $33,799 for women, a difference of 17.6%. Men with an educational attainment of bachelor's degree enjoy the highest average annual earnings of $69,667, while those with less than high school education earn the least with $31,393. Women with an educational attainment of bachelor's degree earn the most with the average annual earnings of $61,597, while those with high school diploma education have the smallest earnings of $31,141.
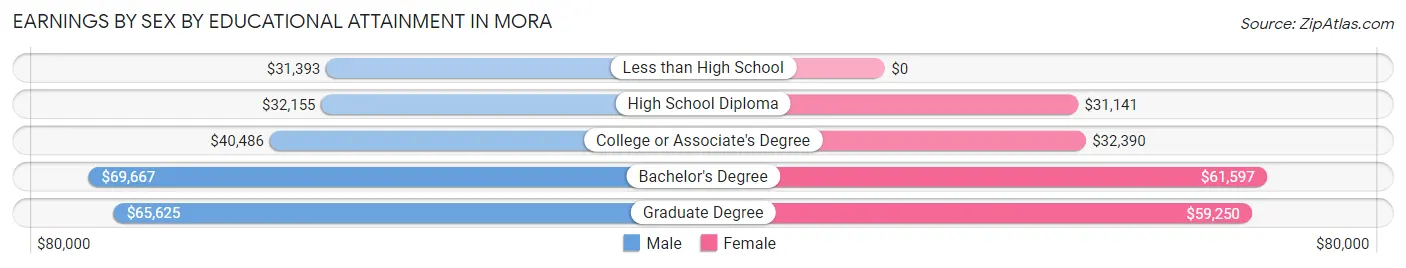
| Educational Attainment | Male Income | Female Income |
| Less than High School | $31,393 | $0 |
| High School Diploma | $32,155 | $31,141 |
| College or Associate's Degree | $40,486 | $32,390 |
| Bachelor's Degree | $69,667 | $61,597 |
| Graduate Degree | $65,625 | $59,250 |
| Total | $41,042 | $33,799 |
Family Income in Mora
Family Income Brackets in Mora
According to the Mora family income data, there are 166 families falling into the $75,000 to $99,999 income range, which is the most common income bracket and makes up 20.0% of all families. Conversely, the $10,000 to $14,999 income bracket is the least frequent group with only 8 families (1.0%) belonging to this category.
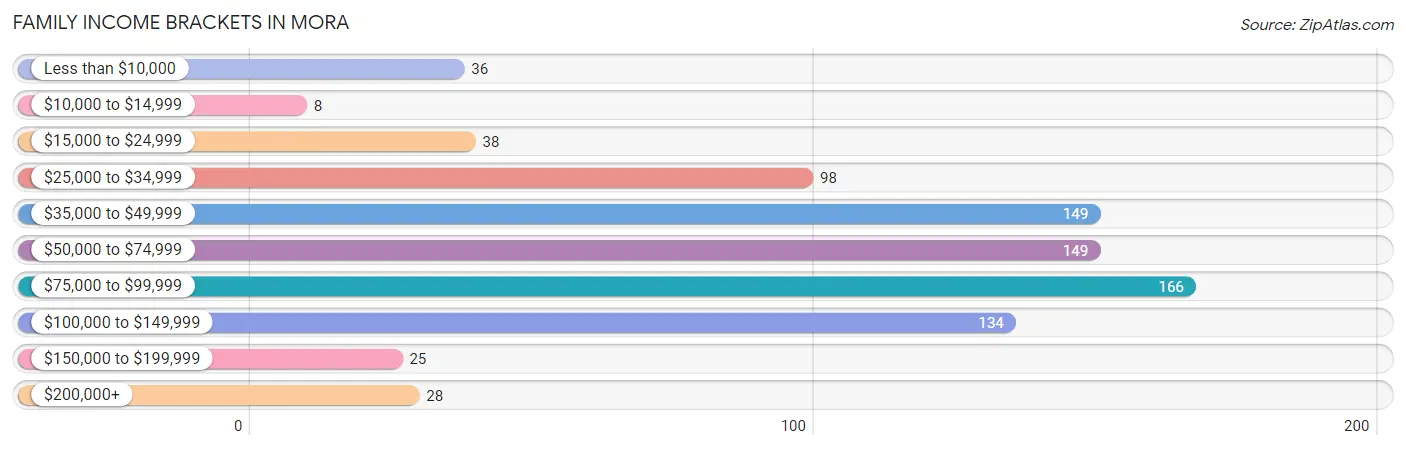
| Income Bracket | # Families | % Families |
| Less than $10,000 | 36 | 4.3% |
| $10,000 to $14,999 | 8 | 1.0% |
| $15,000 to $24,999 | 38 | 4.6% |
| $25,000 to $34,999 | 98 | 11.8% |
| $35,000 to $49,999 | 149 | 17.9% |
| $50,000 to $74,999 | 149 | 17.9% |
| $75,000 to $99,999 | 166 | 20.0% |
| $100,000 to $149,999 | 134 | 16.1% |
| $150,000 to $199,999 | 25 | 3.0% |
| $200,000+ | 28 | 3.4% |
Family Income by Famaliy Size in Mora
6-person families (55 | 6.6%) account for the highest median family income in Mora with $108,098 per family, while 3-person families (125 | 15.0%) have the highest median income of $32,227 per family member.
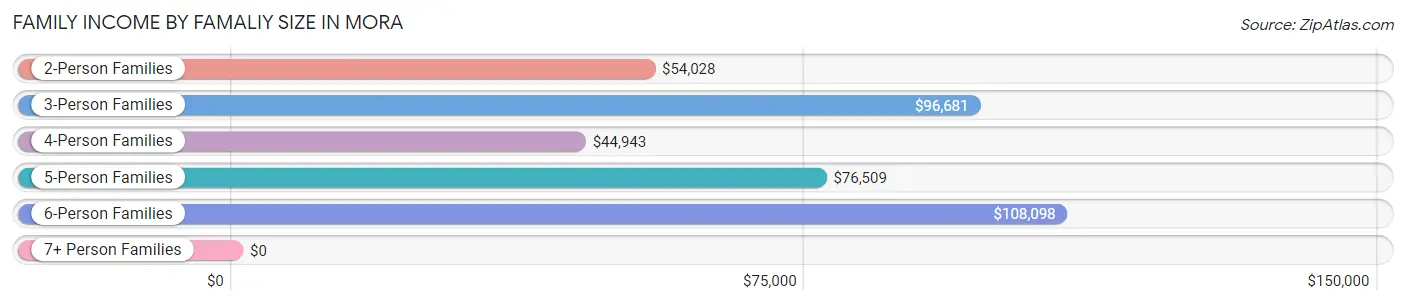
| Income Bracket | # Families | Median Income |
| 2-Person Families | 461 (55.5%) | $54,028 |
| 3-Person Families | 125 (15.0%) | $96,681 |
| 4-Person Families | 119 (14.3%) | $44,943 |
| 5-Person Families | 71 (8.5%) | $76,509 |
| 6-Person Families | 55 (6.6%) | $108,098 |
| 7+ Person Families | 0 (0.0%) | $0 |
| Total | 831 (100.0%) | $61,382 |
Family Income by Number of Earners in Mora
The median family income in Mora is $61,382, with families comprising 3+ earners (97) having the highest median family income of $132,863, while families with no earners (131) have the lowest median family income of $40,855, accounting for 11.7% and 15.8% of families, respectively.
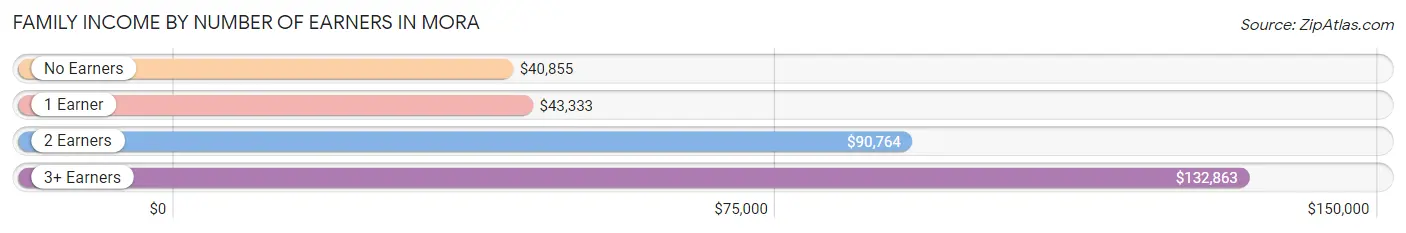
| Number of Earners | # Families | Median Income |
| No Earners | 131 (15.8%) | $40,855 |
| 1 Earner | 292 (35.1%) | $43,333 |
| 2 Earners | 311 (37.4%) | $90,764 |
| 3+ Earners | 97 (11.7%) | $132,863 |
| Total | 831 (100.0%) | $61,382 |
Household Income in Mora
Household Income Brackets in Mora
With 303 households falling in the category, the $50,000 to $74,999 income range is the most frequent in Mora, accounting for 20.1% of all households. In contrast, only 29 households (1.9%) fall into the $200,000+ income bracket, making it the least populous group.
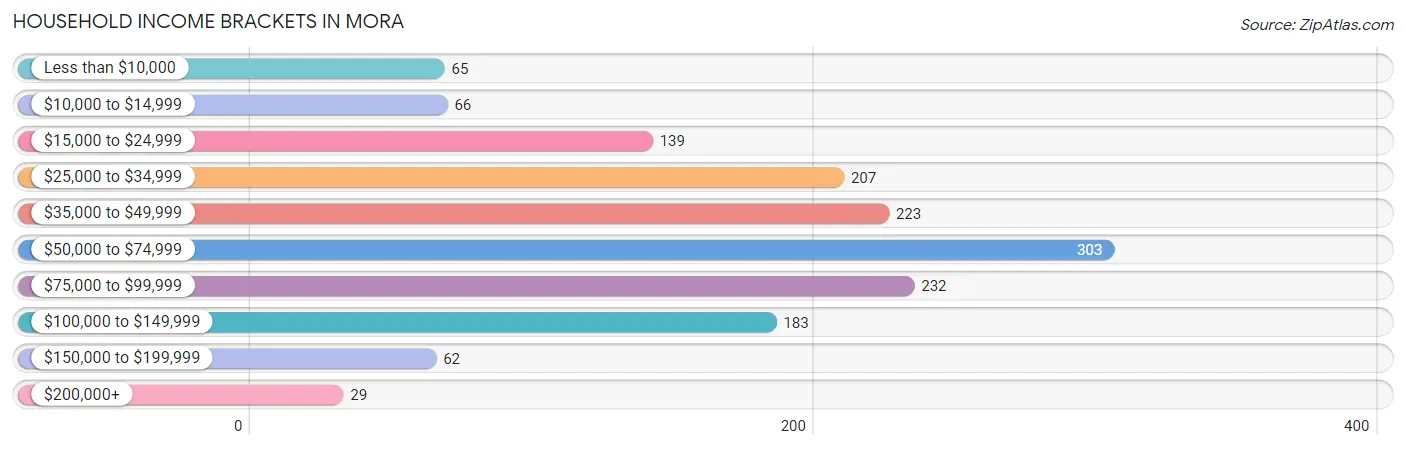
| Income Bracket | # Households | % Households |
| Less than $10,000 | 65 | 4.3% |
| $10,000 to $14,999 | 66 | 4.4% |
| $15,000 to $24,999 | 139 | 9.2% |
| $25,000 to $34,999 | 207 | 13.7% |
| $35,000 to $49,999 | 223 | 14.8% |
| $50,000 to $74,999 | 303 | 20.1% |
| $75,000 to $99,999 | 232 | 15.4% |
| $100,000 to $149,999 | 183 | 12.1% |
| $150,000 to $199,999 | 62 | 4.1% |
| $200,000+ | 29 | 1.9% |
Household Income by Householder Age in Mora
The median household income in Mora is $51,577, with the highest median household income of $76,078 found in the 25 to 44 years age bracket for the primary householder. A total of 440 households (29.2%) fall into this category. Meanwhile, the 15 to 24 years age bracket for the primary householder has the lowest median household income of $0, with 31 households (2.1%) in this group.
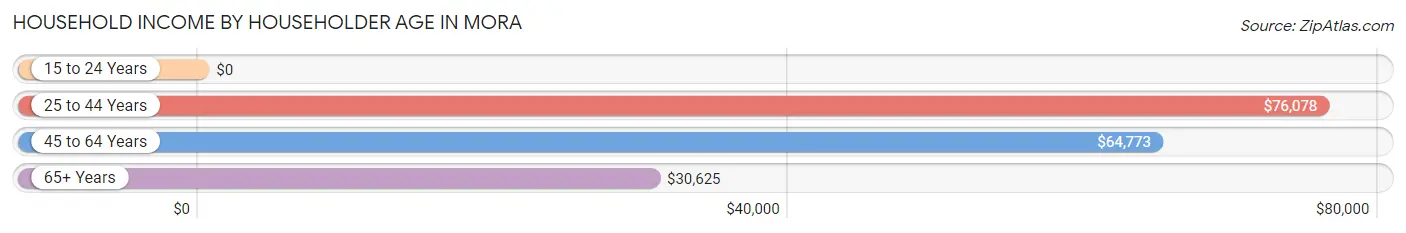
| Income Bracket | # Households | Median Income |
| 15 to 24 Years | 31 (2.1%) | $0 |
| 25 to 44 Years | 440 (29.2%) | $76,078 |
| 45 to 64 Years | 480 (31.8%) | $64,773 |
| 65+ Years | 558 (37.0%) | $30,625 |
| Total | 1,509 (100.0%) | $51,577 |
Poverty in Mora
Income Below Poverty by Sex and Age in Mora
With 14.9% poverty level for males and 14.1% for females among the residents of Mora, 5 year old males and 5 year old females are the most vulnerable to poverty, with 7 males (100.0%) and 13 females (54.2%) in their respective age groups living below the poverty level.
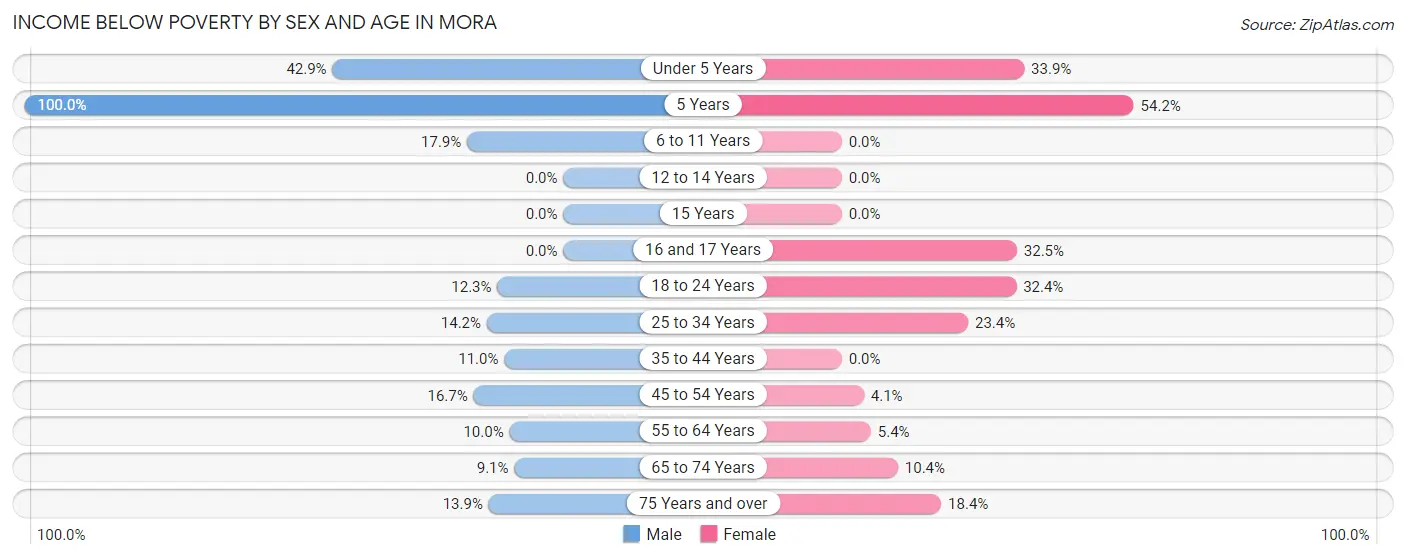
| Age Bracket | Male | Female |
| Under 5 Years | 57 (42.9%) | 22 (33.9%) |
| 5 Years | 7 (100.0%) | 13 (54.2%) |
| 6 to 11 Years | 40 (17.9%) | 0 (0.0%) |
| 12 to 14 Years | 0 (0.0%) | 0 (0.0%) |
| 15 Years | 0 (0.0%) | 0 (0.0%) |
| 16 and 17 Years | 0 (0.0%) | 13 (32.5%) |
| 18 to 24 Years | 25 (12.2%) | 45 (32.4%) |
| 25 to 34 Years | 25 (14.2%) | 56 (23.4%) |
| 35 to 44 Years | 26 (11.0%) | 0 (0.0%) |
| 45 to 54 Years | 29 (16.7%) | 7 (4.1%) |
| 55 to 64 Years | 23 (10.0%) | 9 (5.4%) |
| 65 to 74 Years | 11 (9.1%) | 23 (10.4%) |
| 75 Years and over | 18 (13.9%) | 59 (18.4%) |
| Total | 261 (14.9%) | 247 (14.1%) |
Income Above Poverty by Sex and Age in Mora
According to the poverty statistics in Mora, males aged 12 to 14 years and females aged 6 to 11 years are the age groups that are most secure financially, with 100.0% of males and 100.0% of females in these age groups living above the poverty line.
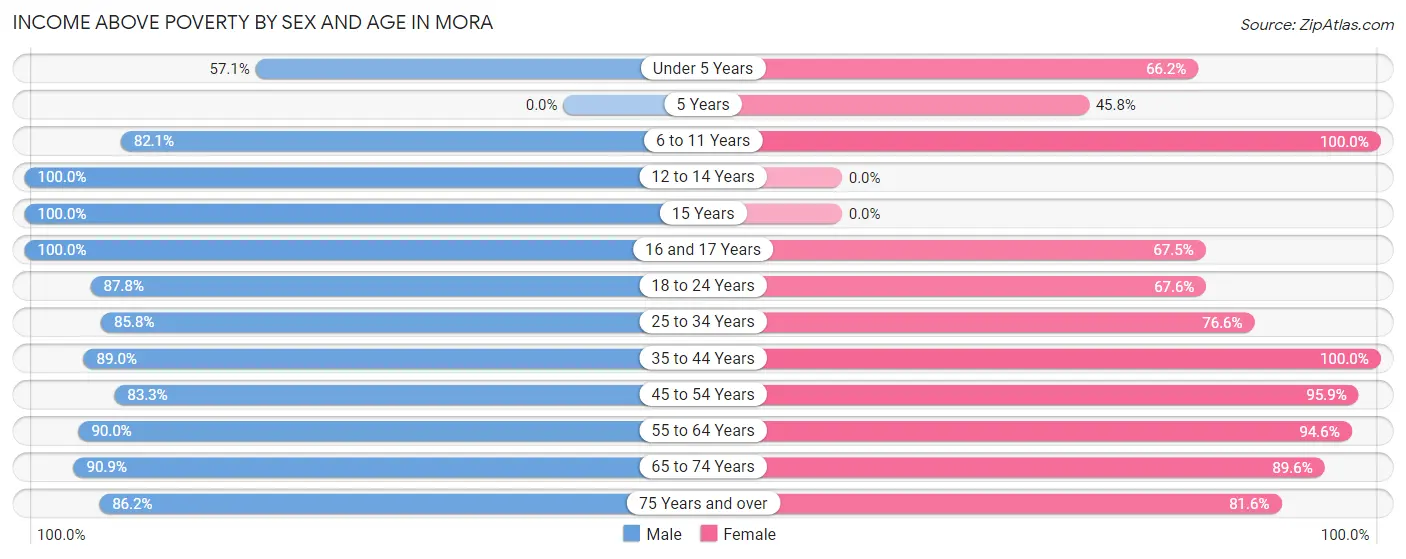
| Age Bracket | Male | Female |
| Under 5 Years | 76 (57.1%) | 43 (66.1%) |
| 5 Years | 0 (0.0%) | 11 (45.8%) |
| 6 to 11 Years | 184 (82.1%) | 130 (100.0%) |
| 12 to 14 Years | 53 (100.0%) | 0 (0.0%) |
| 15 Years | 10 (100.0%) | 0 (0.0%) |
| 16 and 17 Years | 53 (100.0%) | 27 (67.5%) |
| 18 to 24 Years | 179 (87.7%) | 94 (67.6%) |
| 25 to 34 Years | 151 (85.8%) | 183 (76.6%) |
| 35 to 44 Years | 211 (89.0%) | 233 (100.0%) |
| 45 to 54 Years | 145 (83.3%) | 164 (95.9%) |
| 55 to 64 Years | 207 (90.0%) | 158 (94.6%) |
| 65 to 74 Years | 110 (90.9%) | 198 (89.6%) |
| 75 Years and over | 112 (86.2%) | 261 (81.6%) |
| Total | 1,491 (85.1%) | 1,502 (85.9%) |
Income Below Poverty Among Married-Couple Families in Mora
The poverty statistics for married-couple families in Mora show that 6.2% or 34 of the total 551 families live below the poverty line. Families with 3 or 4 children have the highest poverty rate of 20.4%, comprising of 22 families. On the other hand, families with 1 or 2 children have the lowest poverty rate of 0.0%, which includes 0 families.
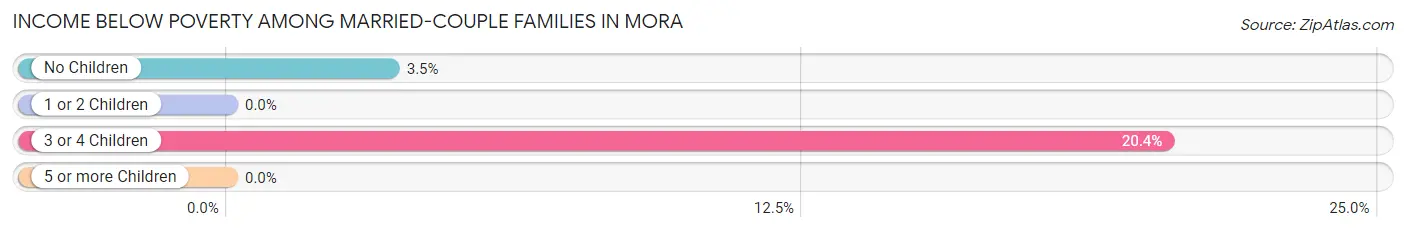
| Children | Above Poverty | Below Poverty |
| No Children | 329 (96.5%) | 12 (3.5%) |
| 1 or 2 Children | 102 (100.0%) | 0 (0.0%) |
| 3 or 4 Children | 86 (79.6%) | 22 (20.4%) |
| 5 or more Children | 0 (0.0%) | 0 (0.0%) |
| Total | 517 (93.8%) | 34 (6.2%) |
Income Below Poverty Among Single-Parent Households in Mora
According to the poverty data in Mora, 63.3% or 50 single-father households and 4.0% or 8 single-mother households are living below the poverty line. Among single-father households, those with 3 or 4 children have the highest poverty rate, with 26 households (100.0%) experiencing poverty. Likewise, among single-mother households, those with 1 or 2 children have the highest poverty rate, with 8 households (8.7%) falling below the poverty line.
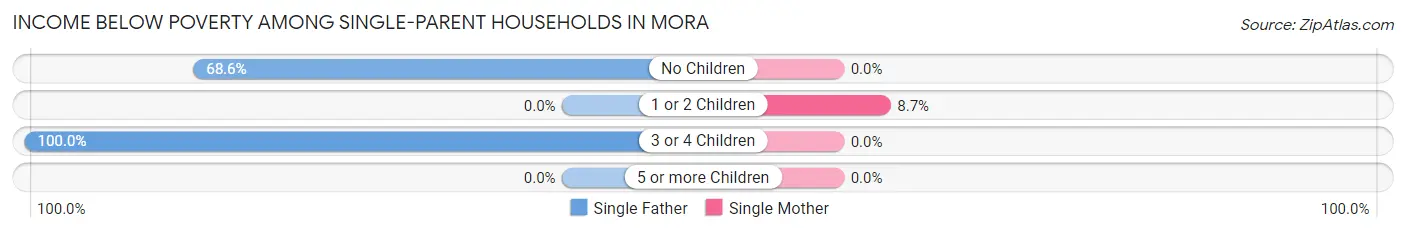
| Children | Single Father | Single Mother |
| No Children | 24 (68.6%) | 0 (0.0%) |
| 1 or 2 Children | 0 (0.0%) | 8 (8.7%) |
| 3 or 4 Children | 26 (100.0%) | 0 (0.0%) |
| 5 or more Children | 0 (0.0%) | 0 (0.0%) |
| Total | 50 (63.3%) | 8 (4.0%) |
Income Below Poverty Among Married-Couple vs Single-Parent Households in Mora
The poverty data for Mora shows that 34 of the married-couple family households (6.2%) and 58 of the single-parent households (20.7%) are living below the poverty level. Within the married-couple family households, those with 3 or 4 children have the highest poverty rate, with 22 households (20.4%) falling below the poverty line. Among the single-parent households, those with 3 or 4 children have the highest poverty rate, with 26 household (46.4%) living below poverty.
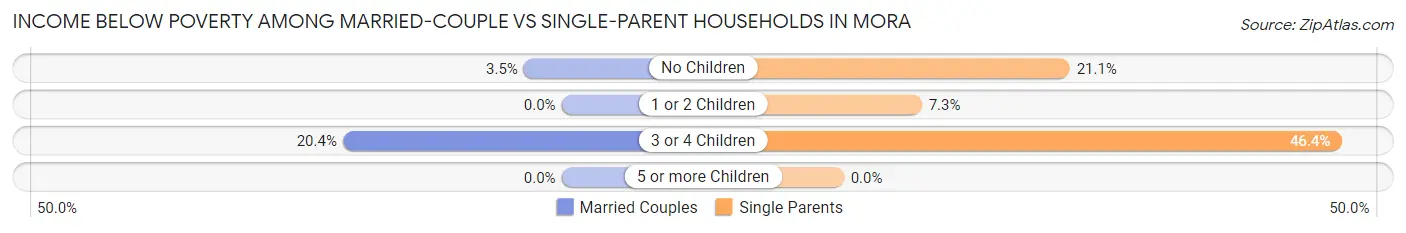
| Children | Married-Couple Families | Single-Parent Households |
| No Children | 12 (3.5%) | 24 (21.0%) |
| 1 or 2 Children | 0 (0.0%) | 8 (7.3%) |
| 3 or 4 Children | 22 (20.4%) | 26 (46.4%) |
| 5 or more Children | 0 (0.0%) | 0 (0.0%) |
| Total | 34 (6.2%) | 58 (20.7%) |
Race in Mora
The most populous races in Mora are White / Caucasian (3,440 | 93.3%), Two or more Races (188 | 5.1%), and Hispanic or Latino (73 | 2.0%).
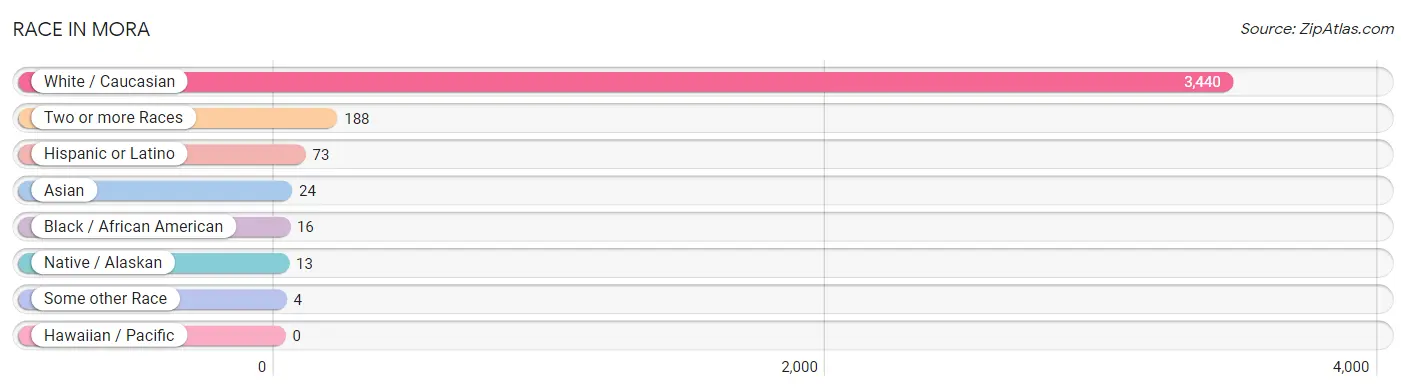
| Race | # Population | % Population |
| Asian | 24 | 0.6% |
| Black / African American | 16 | 0.4% |
| Hawaiian / Pacific | 0 | 0.0% |
| Hispanic or Latino | 73 | 2.0% |
| Native / Alaskan | 13 | 0.4% |
| White / Caucasian | 3,440 | 93.3% |
| Two or more Races | 188 | 5.1% |
| Some other Race | 4 | 0.1% |
| Total | 3,685 | 100.0% |
Ancestry in Mora
The most populous ancestries reported in Mora are German (1,474 | 40.0%), Swedish (571 | 15.5%), Irish (403 | 10.9%), Norwegian (262 | 7.1%), and English (241 | 6.5%), together accounting for 80.1% of all Mora residents.
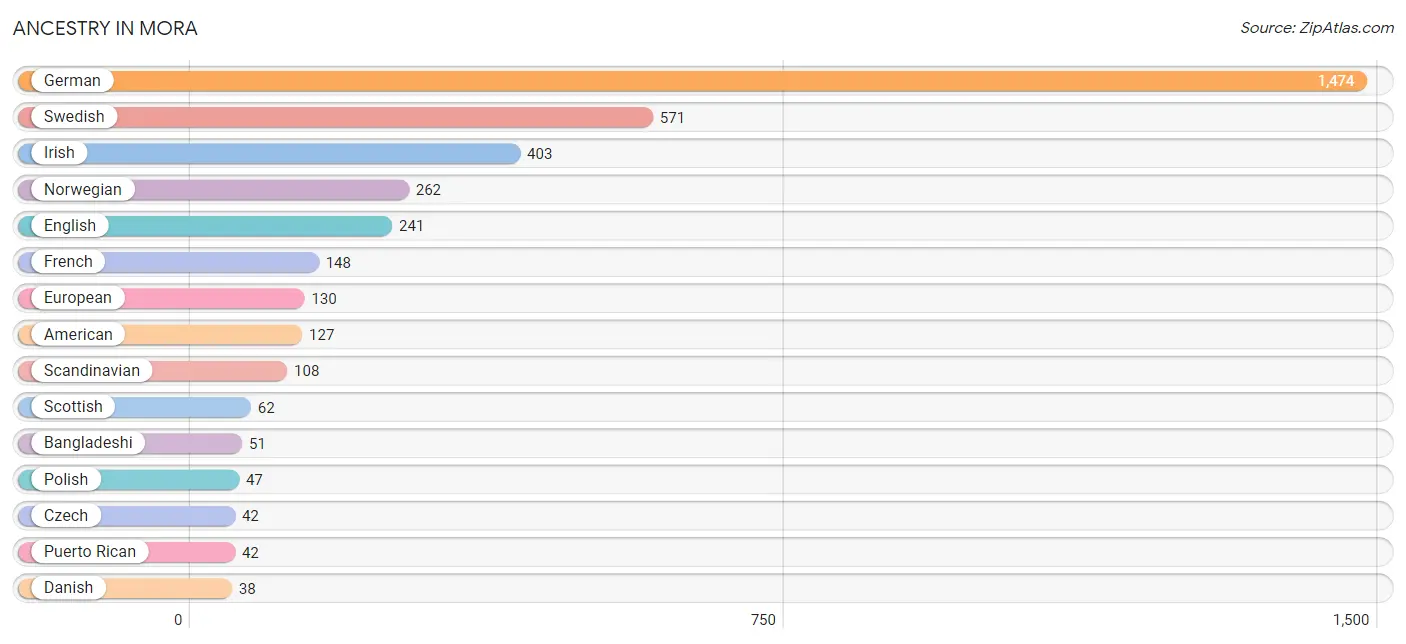
| Ancestry | # Population | % Population |
| American | 127 | 3.5% |
| Bangladeshi | 51 | 1.4% |
| Canadian | 9 | 0.2% |
| Chippewa | 9 | 0.2% |
| Czech | 42 | 1.1% |
| Czechoslovakian | 8 | 0.2% |
| Danish | 38 | 1.0% |
| Dutch | 5 | 0.1% |
| English | 241 | 6.5% |
| European | 130 | 3.5% |
| Finnish | 9 | 0.2% |
| French | 148 | 4.0% |
| French Canadian | 20 | 0.5% |
| German | 1,474 | 40.0% |
| Irish | 403 | 10.9% |
| Italian | 25 | 0.7% |
| Korean | 14 | 0.4% |
| Mexican | 31 | 0.8% |
| Northern European | 4 | 0.1% |
| Norwegian | 262 | 7.1% |
| Polish | 47 | 1.3% |
| Puerto Rican | 42 | 1.1% |
| Russian | 12 | 0.3% |
| Scandinavian | 108 | 2.9% |
| Scotch-Irish | 29 | 0.8% |
| Scottish | 62 | 1.7% |
| Sioux | 4 | 0.1% |
| Slavic | 7 | 0.2% |
| Subsaharan African | 34 | 0.9% |
| Swedish | 571 | 15.5% |
| Swiss | 22 | 0.6% |
| Welsh | 7 | 0.2% | View All 32 Rows |
Immigrants in Mora
The most numerous immigrant groups reported in Mora came from Asia (20 | 0.5%), South Eastern Asia (20 | 0.5%), Laos (10 | 0.3%), Philippines (10 | 0.3%), and Africa (8 | 0.2%), together accounting for 1.8% of all Mora residents.
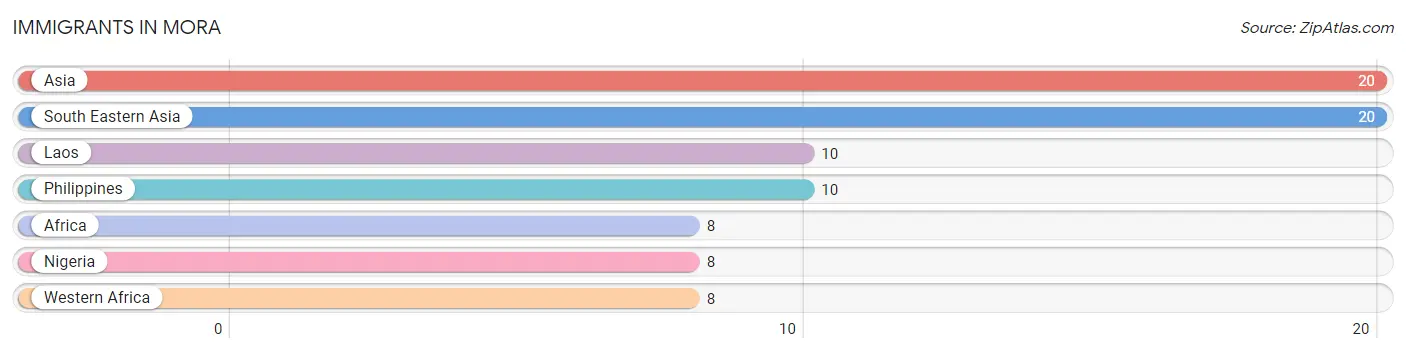
| Immigration Origin | # Population | % Population |
| Africa | 8 | 0.2% |
| Asia | 20 | 0.5% |
| Laos | 10 | 0.3% |
| Nigeria | 8 | 0.2% |
| Philippines | 10 | 0.3% |
| South Eastern Asia | 20 | 0.5% |
| Western Africa | 8 | 0.2% | View All 7 Rows |
Sex and Age in Mora
Sex and Age in Mora
The most populous age groups in Mora are 5 to 9 Years (176 | 9.6%) for men and 30 to 34 Years (203 | 11.0%) for women.
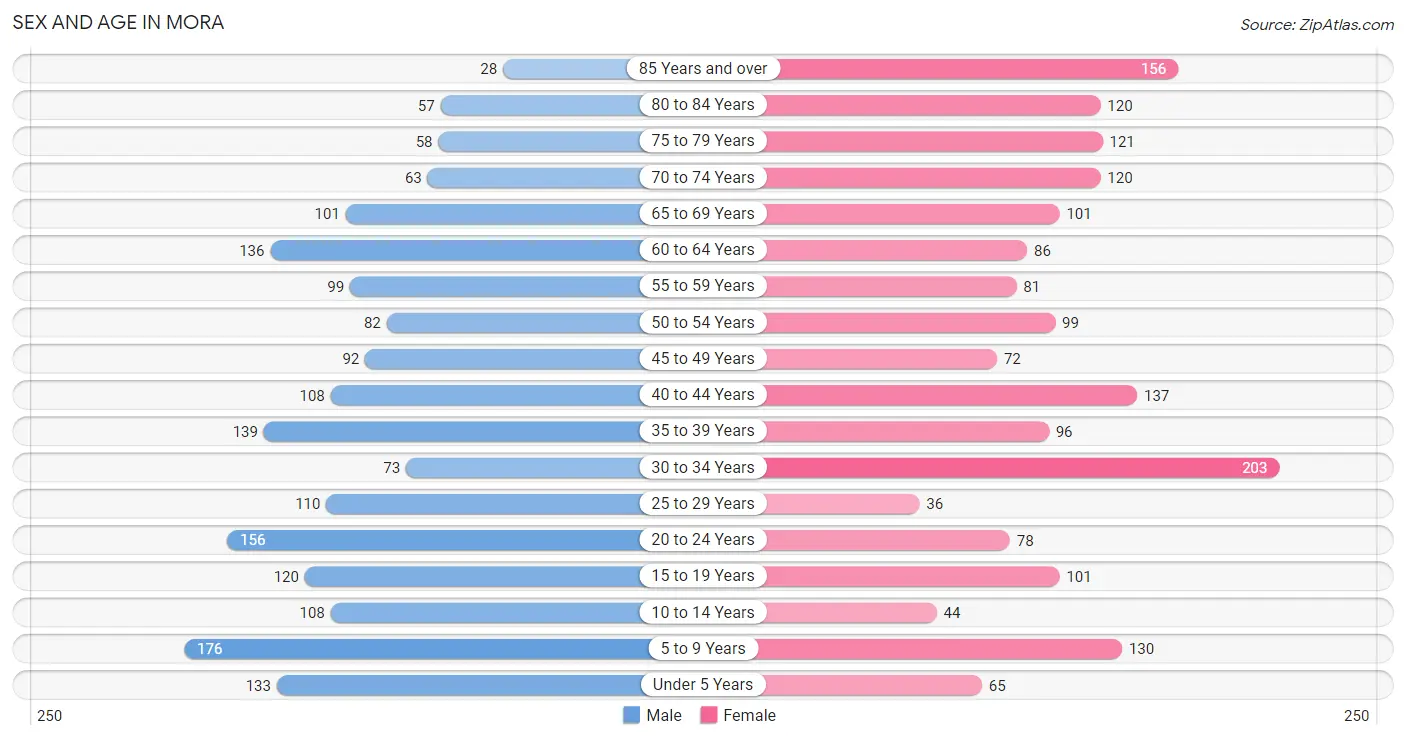
| Age Bracket | Male | Female |
| Under 5 Years | 133 (7.2%) | 65 (3.5%) |
| 5 to 9 Years | 176 (9.6%) | 130 (7.0%) |
| 10 to 14 Years | 108 (5.9%) | 44 (2.4%) |
| 15 to 19 Years | 120 (6.5%) | 101 (5.5%) |
| 20 to 24 Years | 156 (8.5%) | 78 (4.2%) |
| 25 to 29 Years | 110 (6.0%) | 36 (1.9%) |
| 30 to 34 Years | 73 (4.0%) | 203 (11.0%) |
| 35 to 39 Years | 139 (7.6%) | 96 (5.2%) |
| 40 to 44 Years | 108 (5.9%) | 137 (7.4%) |
| 45 to 49 Years | 92 (5.0%) | 72 (3.9%) |
| 50 to 54 Years | 82 (4.5%) | 99 (5.4%) |
| 55 to 59 Years | 99 (5.4%) | 81 (4.4%) |
| 60 to 64 Years | 136 (7.4%) | 86 (4.7%) |
| 65 to 69 Years | 101 (5.5%) | 101 (5.5%) |
| 70 to 74 Years | 63 (3.4%) | 120 (6.5%) |
| 75 to 79 Years | 58 (3.2%) | 121 (6.6%) |
| 80 to 84 Years | 57 (3.1%) | 120 (6.5%) |
| 85 Years and over | 28 (1.5%) | 156 (8.5%) |
| Total | 1,839 (100.0%) | 1,846 (100.0%) |
Families and Households in Mora
Median Family Size in Mora
The median family size in Mora is 2.96 persons per family, with married-couple families (551 | 66.3%) accounting for the largest median family size of 3.03 persons per family. On the other hand, single male/father families (79 | 9.5%) represent the smallest median family size with 2.63 persons per family.
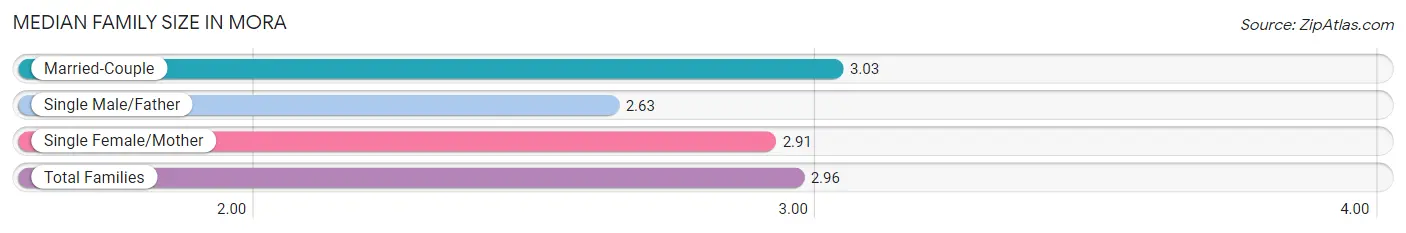
| Family Type | # Families | Family Size |
| Married-Couple | 551 (66.3%) | 3.03 |
| Single Male/Father | 79 (9.5%) | 2.63 |
| Single Female/Mother | 201 (24.2%) | 2.91 |
| Total Families | 831 (100.0%) | 2.96 |
Median Household Size in Mora
The median household size in Mora is 2.27 persons per household, with single female/mother households (201 | 13.3%) accounting for the largest median household size of 3.44 persons per household. non-family households (678 | 44.9%) represent the smallest median household size with 1.13 persons per household.
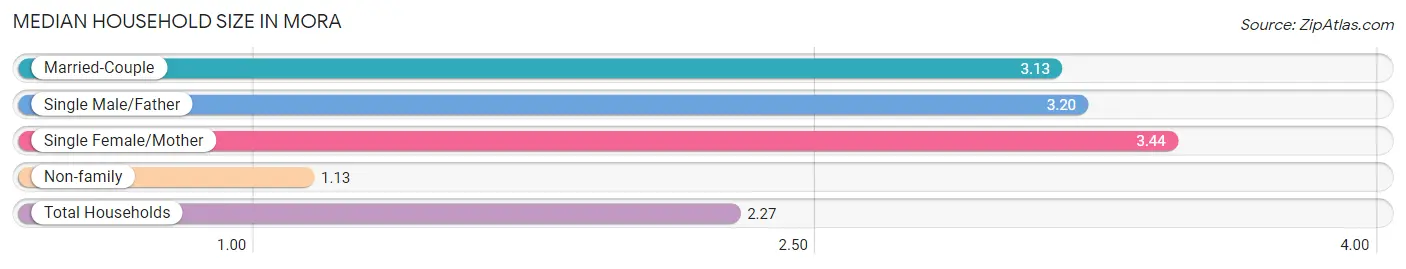
| Household Type | # Households | Household Size |
| Married-Couple | 551 (36.5%) | 3.13 |
| Single Male/Father | 79 (5.2%) | 3.20 |
| Single Female/Mother | 201 (13.3%) | 3.44 |
| Non-family | 678 (44.9%) | 1.13 |
| Total Households | 1,509 (100.0%) | 2.27 |
Household Size by Marriage Status in Mora
Out of a total of 1,509 households in Mora, 831 (55.1%) are family households, while 678 (44.9%) are nonfamily households. The most numerous type of family households are 2-person households, comprising 430, and the most common type of nonfamily households are 1-person households, comprising 603.
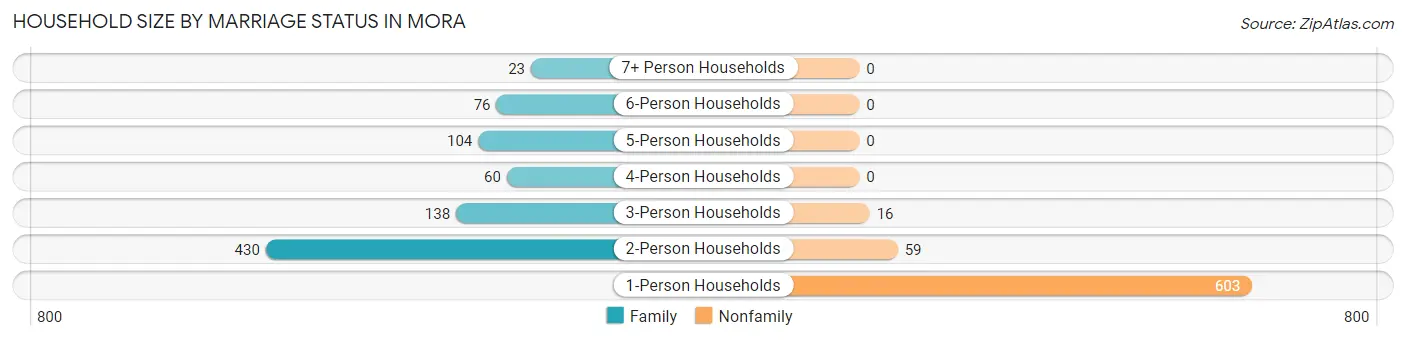
| Household Size | Family Households | Nonfamily Households |
| 1-Person Households | - | 603 (40.0%) |
| 2-Person Households | 430 (28.5%) | 59 (3.9%) |
| 3-Person Households | 138 (9.1%) | 16 (1.1%) |
| 4-Person Households | 60 (4.0%) | 0 (0.0%) |
| 5-Person Households | 104 (6.9%) | 0 (0.0%) |
| 6-Person Households | 76 (5.0%) | 0 (0.0%) |
| 7+ Person Households | 23 (1.5%) | 0 (0.0%) |
| Total | 831 (55.1%) | 678 (44.9%) |
Female Fertility in Mora
Fertility by Age in Mora
Average fertility rate in Mora is 41.0 births per 1,000 women. Women in the age bracket of 20 to 34 years have the highest fertility rate with 69.0 births per 1,000 women. Women in the age bracket of 20 to 34 years acount for 73.3% of all women with births.
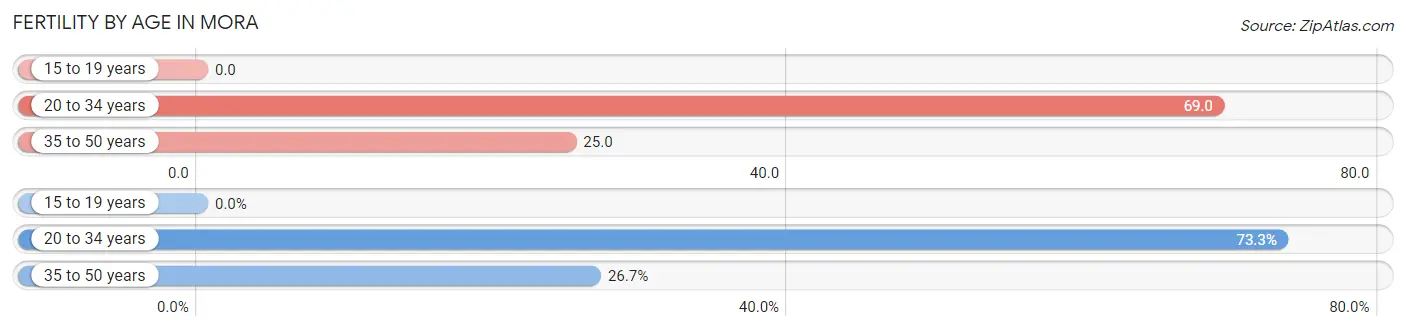
| Age Bracket | Women with Births | Births / 1,000 Women |
| 15 to 19 years | 0 (0.0%) | 0.0 |
| 20 to 34 years | 22 (73.3%) | 69.0 |
| 35 to 50 years | 8 (26.7%) | 25.0 |
| Total | 30 (100.0%) | 41.0 |
Fertility by Age by Marriage Status in Mora
46.7% of women with births (30) in Mora are married. The highest percentage of unmarried women with births falls into 35 to 50 years age bracket with 100.0% of them unmarried at the time of birth, while the lowest percentage of unmarried women with births belong to 20 to 34 years age bracket with 36.4% of them unmarried.
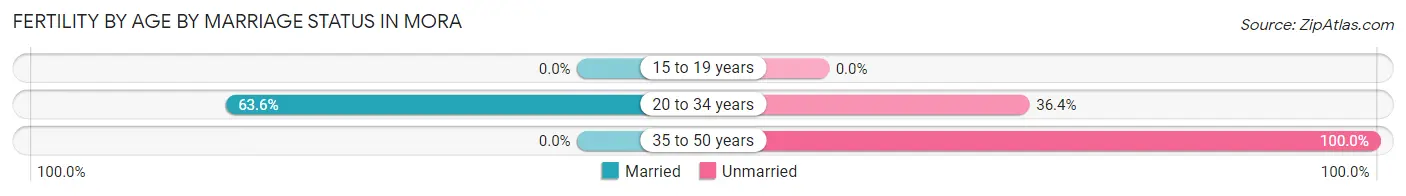
| Age Bracket | Married | Unmarried |
| 15 to 19 years | 0 (0.0%) | 0 (0.0%) |
| 20 to 34 years | 14 (63.6%) | 8 (36.4%) |
| 35 to 50 years | 0 (0.0%) | 8 (100.0%) |
| Total | 14 (46.7%) | 16 (53.3%) |
Fertility by Education in Mora
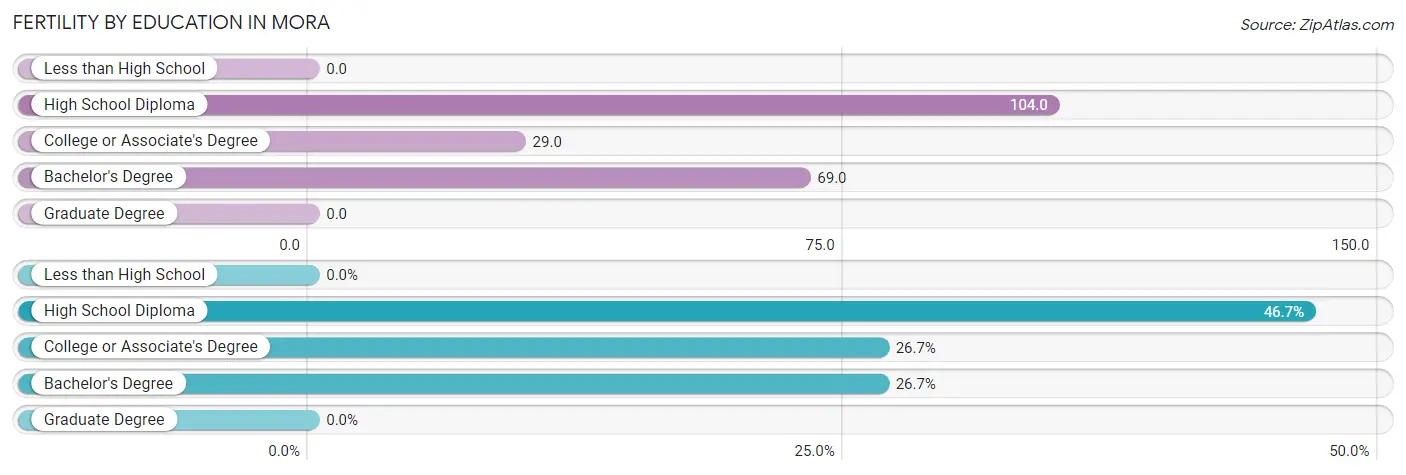
| Educational Attainment | Women with Births | Births / 1,000 Women |
| Less than High School | 0 (0.0%) | 0.0 |
| High School Diploma | 14 (46.7%) | 104.0 |
| College or Associate's Degree | 8 (26.7%) | 29.0 |
| Bachelor's Degree | 8 (26.7%) | 69.0 |
| Graduate Degree | 0 (0.0%) | 0.0 |
| Total | 30 (100.0%) | 41.0 |
Fertility by Education by Marriage Status in Mora
53.3% of women with births in Mora are unmarried. Women with the educational attainment of high school diploma are most likely to be married with 100.0% of them married at childbirth, while women with the educational attainment of college or associate's degree are least likely to be married with 100.0% of them unmarried at childbirth.
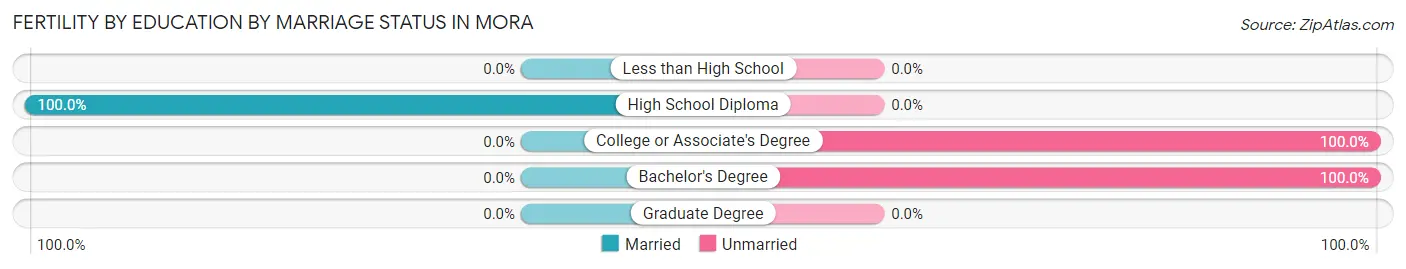
| Educational Attainment | Married | Unmarried |
| Less than High School | 0 (0.0%) | 0 (0.0%) |
| High School Diploma | 14 (100.0%) | 0 (0.0%) |
| College or Associate's Degree | 0 (0.0%) | 8 (100.0%) |
| Bachelor's Degree | 0 (0.0%) | 8 (100.0%) |
| Graduate Degree | 0 (0.0%) | 0 (0.0%) |
| Total | 14 (46.7%) | 16 (53.3%) |
Employment Characteristics in Mora
Employment by Class of Employer in Mora
Among the 1,618 employed individuals in Mora, private company employees (957 | 59.2%), local government employees (255 | 15.8%), and not-for-profit organizations (122 | 7.5%) make up the most common classes of employment.
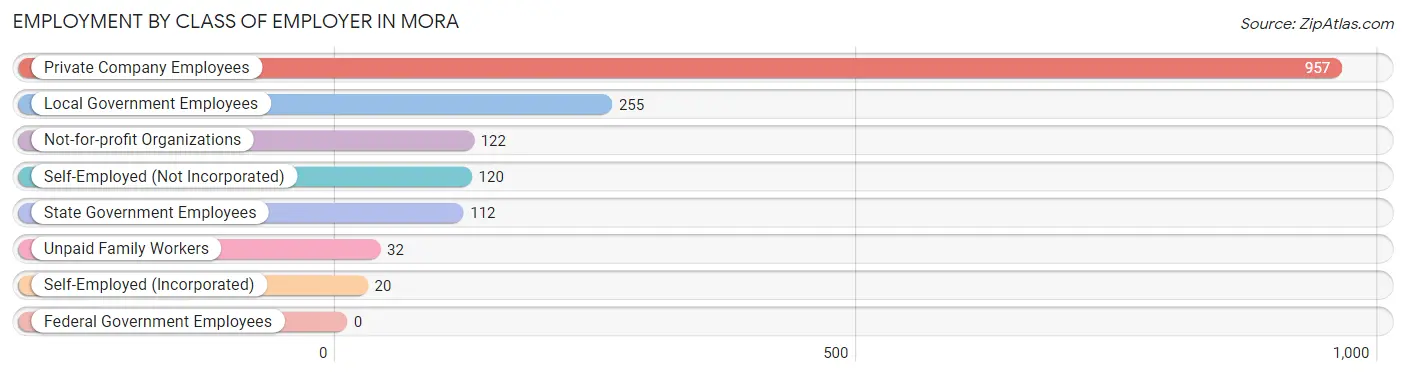
| Employer Class | # Employees | % Employees |
| Private Company Employees | 957 | 59.2% |
| Self-Employed (Incorporated) | 20 | 1.2% |
| Self-Employed (Not Incorporated) | 120 | 7.4% |
| Not-for-profit Organizations | 122 | 7.5% |
| Local Government Employees | 255 | 15.8% |
| State Government Employees | 112 | 6.9% |
| Federal Government Employees | 0 | 0.0% |
| Unpaid Family Workers | 32 | 2.0% |
| Total | 1,618 | 100.0% |
Employment Status by Age in Mora
According to the labor force statistics for Mora, out of the total population over 16 years of age (3,019), 55.4% or 1,673 individuals are in the labor force, with 2.4% or 40 of them unemployed. The age group with the highest labor force participation rate is 20 to 24 years, with 97.9% or 229 individuals in the labor force. Within the labor force, the 25 to 29 years age range has the highest percentage of unemployed individuals, with 10.1% or 11 of them being unemployed.
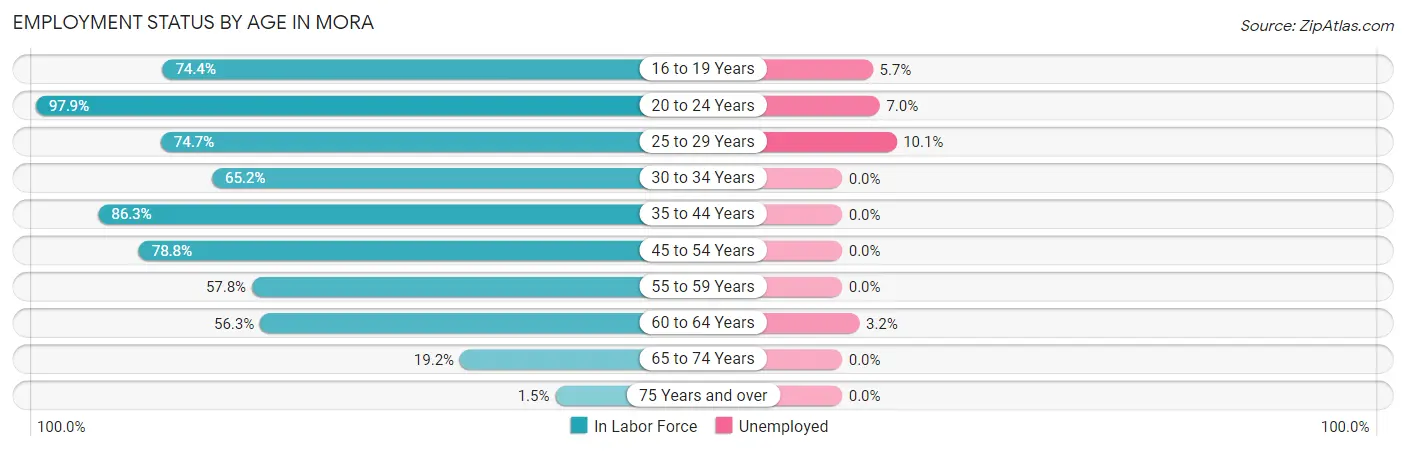
| Age Bracket | In Labor Force | Unemployed |
| 16 to 19 Years | 157 (74.4%) | 9 (5.7%) |
| 20 to 24 Years | 229 (97.9%) | 16 (7.0%) |
| 25 to 29 Years | 109 (74.7%) | 11 (10.1%) |
| 30 to 34 Years | 180 (65.2%) | 0 (0.0%) |
| 35 to 44 Years | 414 (86.3%) | 0 (0.0%) |
| 45 to 54 Years | 272 (78.8%) | 0 (0.0%) |
| 55 to 59 Years | 104 (57.8%) | 0 (0.0%) |
| 60 to 64 Years | 125 (56.3%) | 4 (3.2%) |
| 65 to 74 Years | 74 (19.2%) | 0 (0.0%) |
| 75 Years and over | 8 (1.5%) | 0 (0.0%) |
| Total | 1,673 (55.4%) | 40 (2.4%) |
Employment Status by Educational Attainment in Mora
According to labor force statistics for Mora, 73.0% of individuals (1,204) out of the total population between 25 and 64 years of age (1,649) are in the labor force, with 1.2% or 14 of them being unemployed. The group with the highest labor force participation rate are those with the educational attainment of bachelor's degree or higher, with 90.0% or 298 individuals in the labor force. Within the labor force, individuals with college / associate degree education have the highest percentage of unemployment, with 3.1% or 15 of them being unemployed.
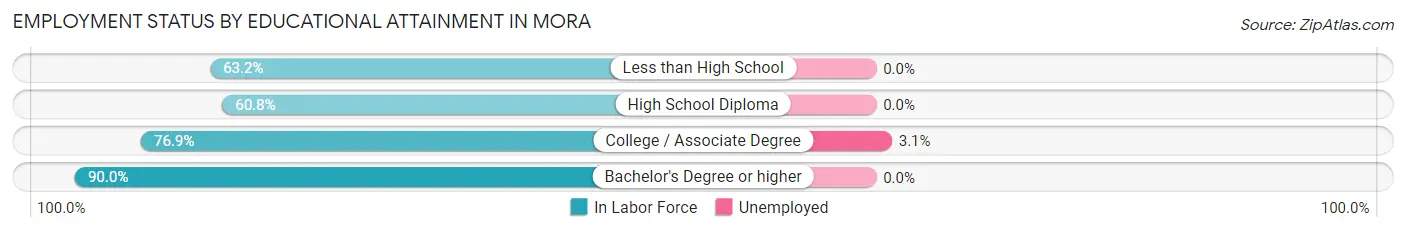
| Educational Attainment | In Labor Force | Unemployed |
| Less than High School | 67 (63.2%) | 0 (0.0%) |
| High School Diploma | 350 (60.8%) | 0 (0.0%) |
| College / Associate Degree | 489 (76.9%) | 20 (3.1%) |
| Bachelor's Degree or higher | 298 (90.0%) | 0 (0.0%) |
| Total | 1,204 (73.0%) | 20 (1.2%) |
Employment Occupations by Sex in Mora
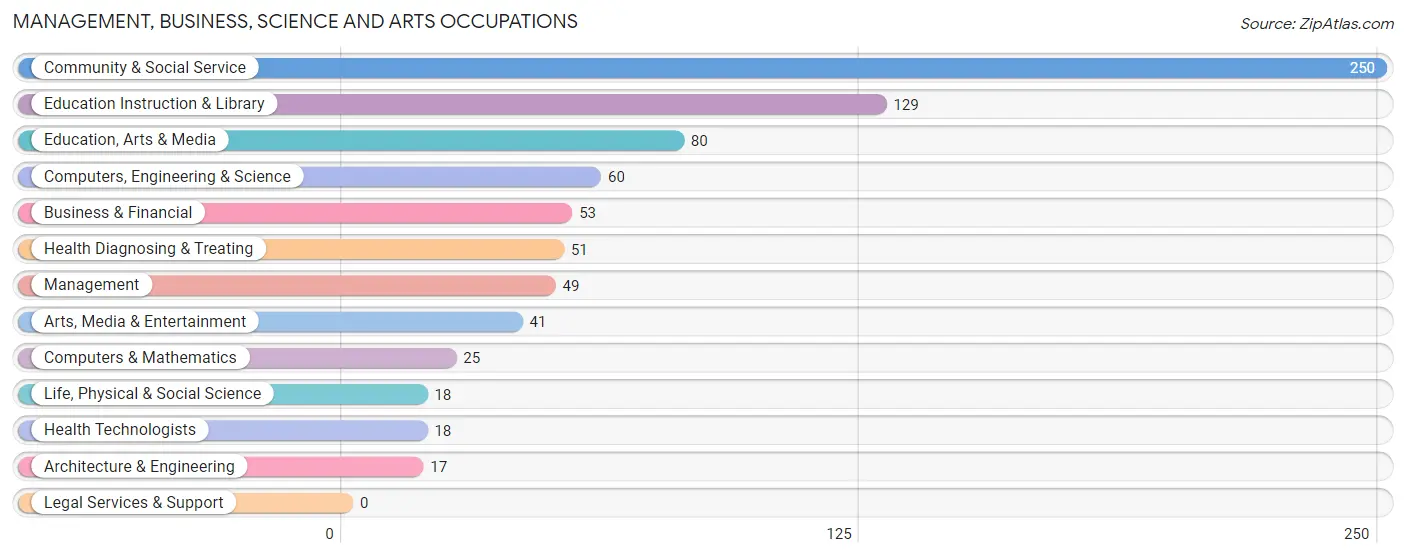
Management, Business, Science and Arts Occupations
The most common Management, Business, Science and Arts occupations in Mora are Community & Social Service (250 | 15.3%), Education Instruction & Library (129 | 7.9%), Education, Arts & Media (80 | 4.9%), Computers, Engineering & Science (60 | 3.7%), and Business & Financial (53 | 3.3%).
Management, Business, Science and Arts Occupations by Sex
Within the Management, Business, Science and Arts occupations in Mora, the most male-oriented occupations are Computers & Mathematics (100.0%), Architecture & Engineering (100.0%), and Computers, Engineering & Science (70.0%), while the most female-oriented occupations are Life, Physical & Social Science (100.0%), Education Instruction & Library (100.0%), and Management (87.8%).
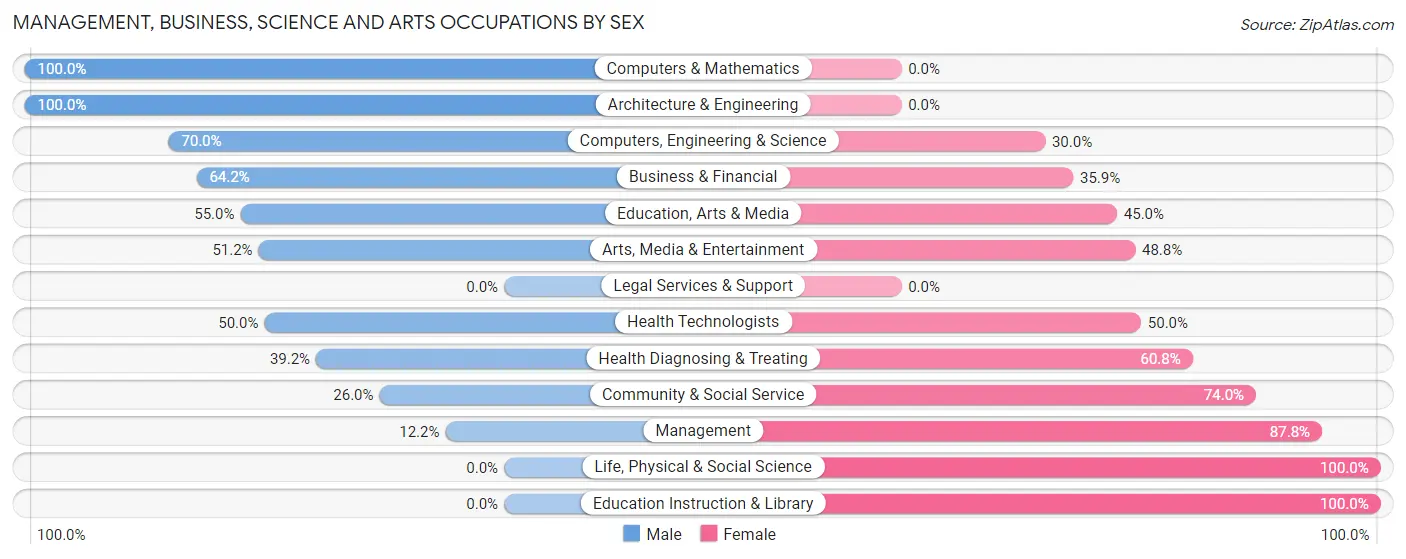
| Occupation | Male | Female |
| Management | 6 (12.2%) | 43 (87.8%) |
| Business & Financial | 34 (64.1%) | 19 (35.8%) |
| Computers, Engineering & Science | 42 (70.0%) | 18 (30.0%) |
| Computers & Mathematics | 25 (100.0%) | 0 (0.0%) |
| Architecture & Engineering | 17 (100.0%) | 0 (0.0%) |
| Life, Physical & Social Science | 0 (0.0%) | 18 (100.0%) |
| Community & Social Service | 65 (26.0%) | 185 (74.0%) |
| Education, Arts & Media | 44 (55.0%) | 36 (45.0%) |
| Legal Services & Support | 0 (0.0%) | 0 (0.0%) |
| Education Instruction & Library | 0 (0.0%) | 129 (100.0%) |
| Arts, Media & Entertainment | 21 (51.2%) | 20 (48.8%) |
| Health Diagnosing & Treating | 20 (39.2%) | 31 (60.8%) |
| Health Technologists | 9 (50.0%) | 9 (50.0%) |
| Total (Category) | 167 (36.1%) | 296 (63.9%) |
| Total (Overall) | 902 (55.3%) | 730 (44.7%) |
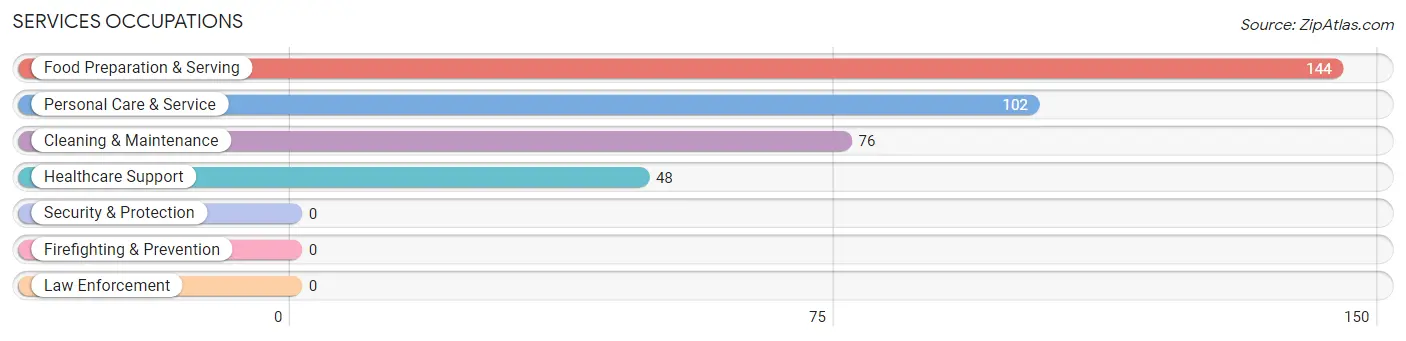
Services Occupations
The most common Services occupations in Mora are Food Preparation & Serving (144 | 8.8%), Personal Care & Service (102 | 6.2%), Cleaning & Maintenance (76 | 4.7%), and Healthcare Support (48 | 2.9%).
Services Occupations by Sex
Within the Services occupations in Mora, the most male-oriented occupations are Personal Care & Service (49.0%), Food Preparation & Serving (41.7%), and Cleaning & Maintenance (36.8%), while the most female-oriented occupations are Healthcare Support (100.0%), Cleaning & Maintenance (63.2%), and Food Preparation & Serving (58.3%).
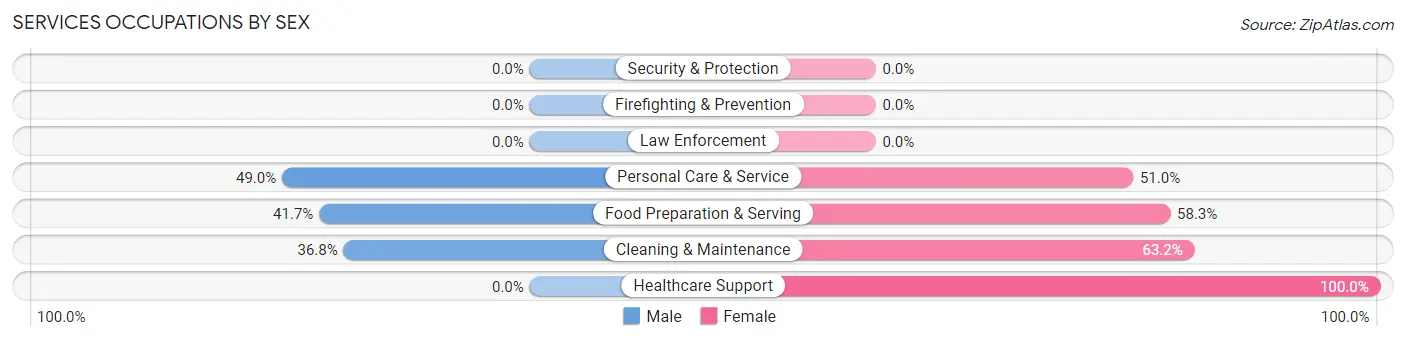
| Occupation | Male | Female |
| Healthcare Support | 0 (0.0%) | 48 (100.0%) |
| Security & Protection | 0 (0.0%) | 0 (0.0%) |
| Firefighting & Prevention | 0 (0.0%) | 0 (0.0%) |
| Law Enforcement | 0 (0.0%) | 0 (0.0%) |
| Food Preparation & Serving | 60 (41.7%) | 84 (58.3%) |
| Cleaning & Maintenance | 28 (36.8%) | 48 (63.2%) |
| Personal Care & Service | 50 (49.0%) | 52 (51.0%) |
| Total (Category) | 138 (37.3%) | 232 (62.7%) |
| Total (Overall) | 902 (55.3%) | 730 (44.7%) |
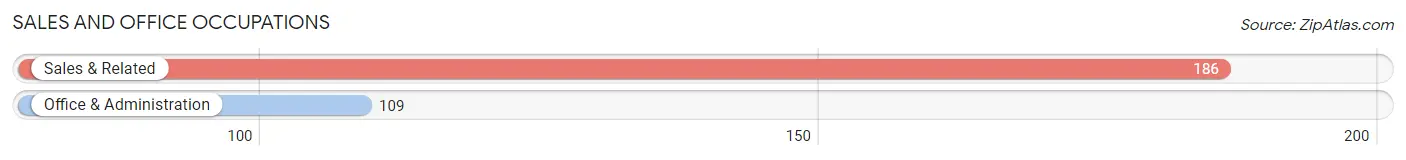
Sales and Office Occupations
The most common Sales and Office occupations in Mora are Sales & Related (186 | 11.4%), and Office & Administration (109 | 6.7%).
Sales and Office Occupations by Sex
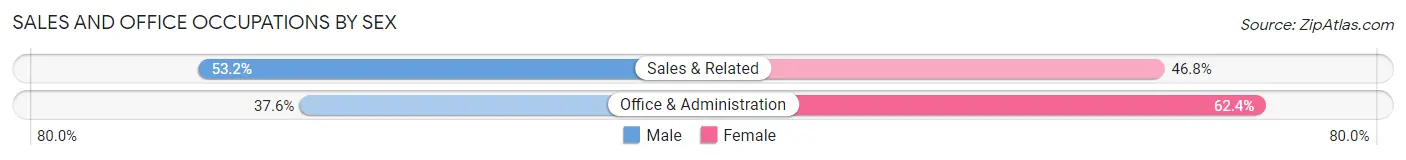
| Occupation | Male | Female |
| Sales & Related | 99 (53.2%) | 87 (46.8%) |
| Office & Administration | 41 (37.6%) | 68 (62.4%) |
| Total (Category) | 140 (47.5%) | 155 (52.5%) |
| Total (Overall) | 902 (55.3%) | 730 (44.7%) |
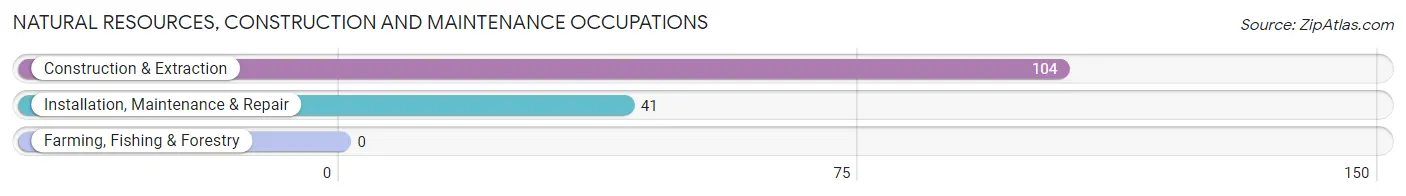
Natural Resources, Construction and Maintenance Occupations
The most common Natural Resources, Construction and Maintenance occupations in Mora are Construction & Extraction (104 | 6.4%), and Installation, Maintenance & Repair (41 | 2.5%).
Natural Resources, Construction and Maintenance Occupations by Sex
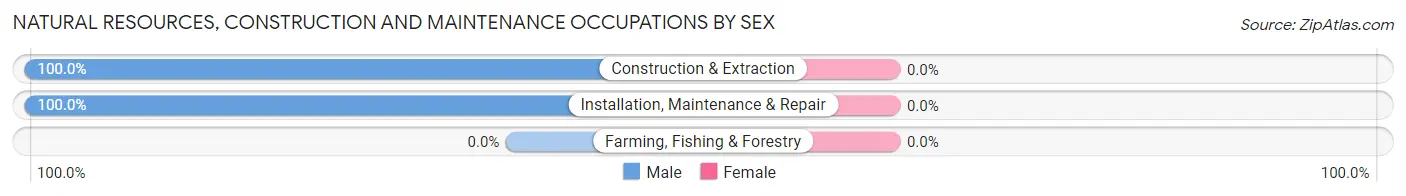
| Occupation | Male | Female |
| Farming, Fishing & Forestry | 0 (0.0%) | 0 (0.0%) |
| Construction & Extraction | 104 (100.0%) | 0 (0.0%) |
| Installation, Maintenance & Repair | 41 (100.0%) | 0 (0.0%) |
| Total (Category) | 145 (100.0%) | 0 (0.0%) |
| Total (Overall) | 902 (55.3%) | 730 (44.7%) |
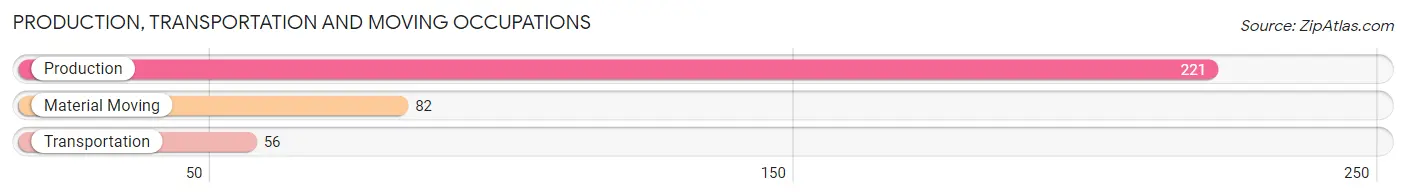
Production, Transportation and Moving Occupations
The most common Production, Transportation and Moving occupations in Mora are Production (221 | 13.5%), Material Moving (82 | 5.0%), and Transportation (56 | 3.4%).
Production, Transportation and Moving Occupations by Sex
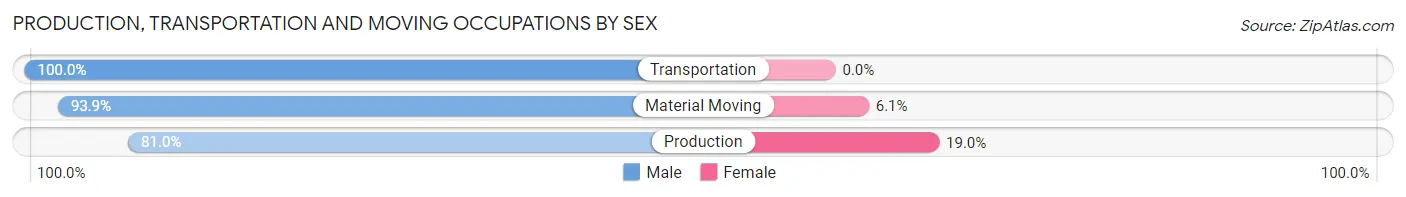
| Occupation | Male | Female |
| Production | 179 (81.0%) | 42 (19.0%) |
| Transportation | 56 (100.0%) | 0 (0.0%) |
| Material Moving | 77 (93.9%) | 5 (6.1%) |
| Total (Category) | 312 (86.9%) | 47 (13.1%) |
| Total (Overall) | 902 (55.3%) | 730 (44.7%) |
Employment Industries by Sex in Mora
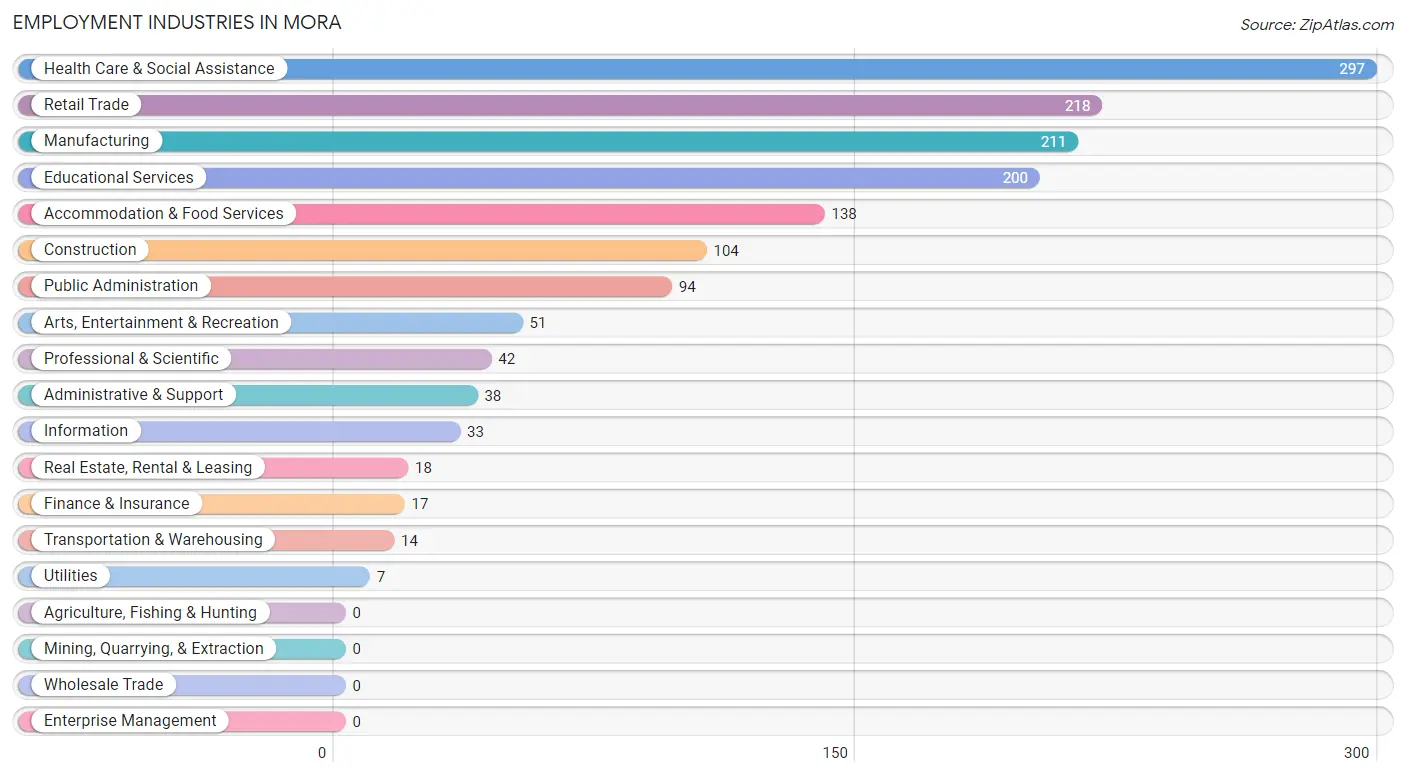
Employment Industries in Mora
The major employment industries in Mora include Health Care & Social Assistance (297 | 18.2%), Retail Trade (218 | 13.4%), Manufacturing (211 | 12.9%), Educational Services (200 | 12.2%), and Accommodation & Food Services (138 | 8.5%).
Employment Industries by Sex in Mora
The Mora industries that see more men than women are Construction (100.0%), Transportation & Warehousing (100.0%), and Utilities (100.0%), whereas the industries that tend to have a higher number of women are Educational Services (84.0%), Finance & Insurance (70.6%), and Health Care & Social Assistance (68.0%).
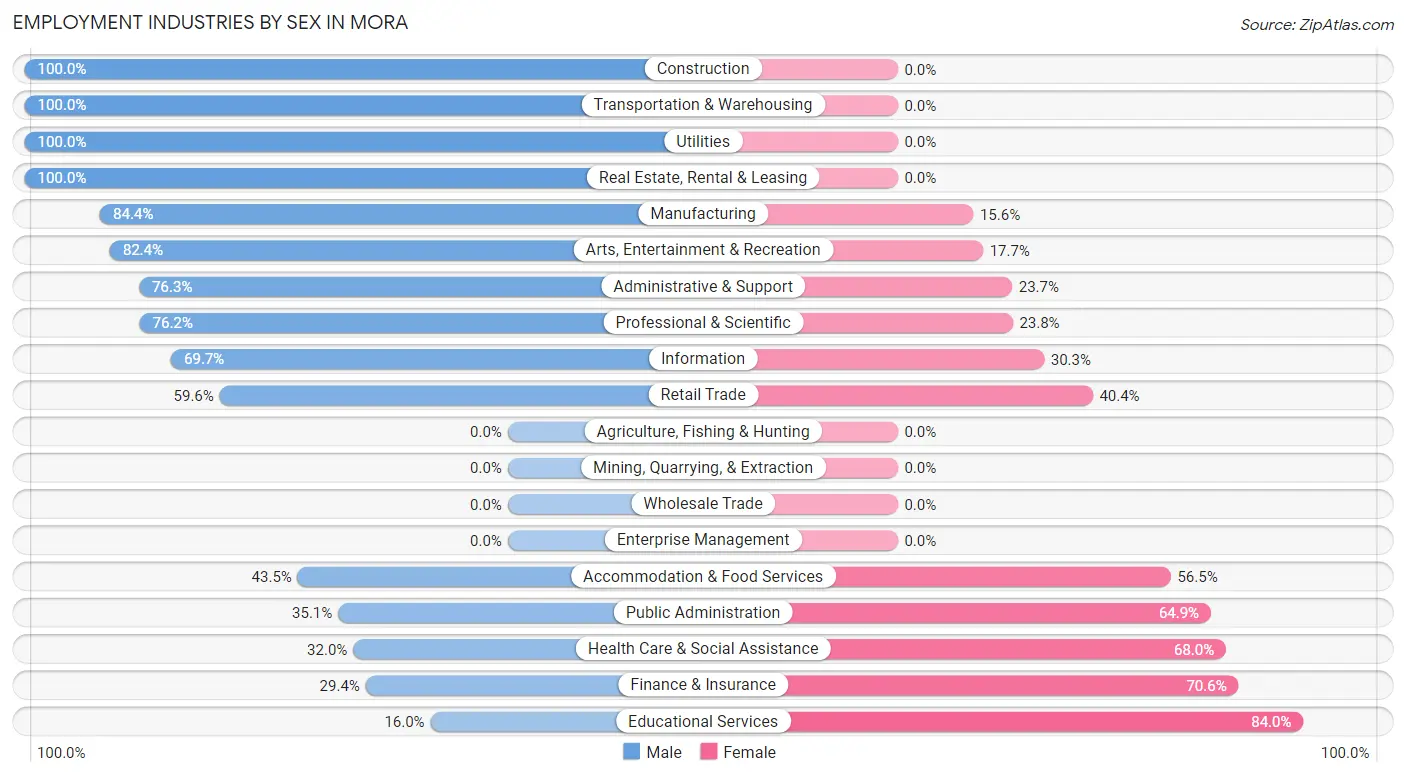
| Industry | Male | Female |
| Agriculture, Fishing & Hunting | 0 (0.0%) | 0 (0.0%) |
| Mining, Quarrying, & Extraction | 0 (0.0%) | 0 (0.0%) |
| Construction | 104 (100.0%) | 0 (0.0%) |
| Manufacturing | 178 (84.4%) | 33 (15.6%) |
| Wholesale Trade | 0 (0.0%) | 0 (0.0%) |
| Retail Trade | 130 (59.6%) | 88 (40.4%) |
| Transportation & Warehousing | 14 (100.0%) | 0 (0.0%) |
| Utilities | 7 (100.0%) | 0 (0.0%) |
| Information | 23 (69.7%) | 10 (30.3%) |
| Finance & Insurance | 5 (29.4%) | 12 (70.6%) |
| Real Estate, Rental & Leasing | 18 (100.0%) | 0 (0.0%) |
| Professional & Scientific | 32 (76.2%) | 10 (23.8%) |
| Enterprise Management | 0 (0.0%) | 0 (0.0%) |
| Administrative & Support | 29 (76.3%) | 9 (23.7%) |
| Educational Services | 32 (16.0%) | 168 (84.0%) |
| Health Care & Social Assistance | 95 (32.0%) | 202 (68.0%) |
| Arts, Entertainment & Recreation | 42 (82.4%) | 9 (17.6%) |
| Accommodation & Food Services | 60 (43.5%) | 78 (56.5%) |
| Public Administration | 33 (35.1%) | 61 (64.9%) |
| Total | 902 (55.3%) | 730 (44.7%) |
Education in Mora
School Enrollment in Mora
The most common levels of schooling among the 775 students in Mora are elementary school (239 | 30.8%), college / undergraduate (147 | 19.0%), and high school (141 | 18.2%).
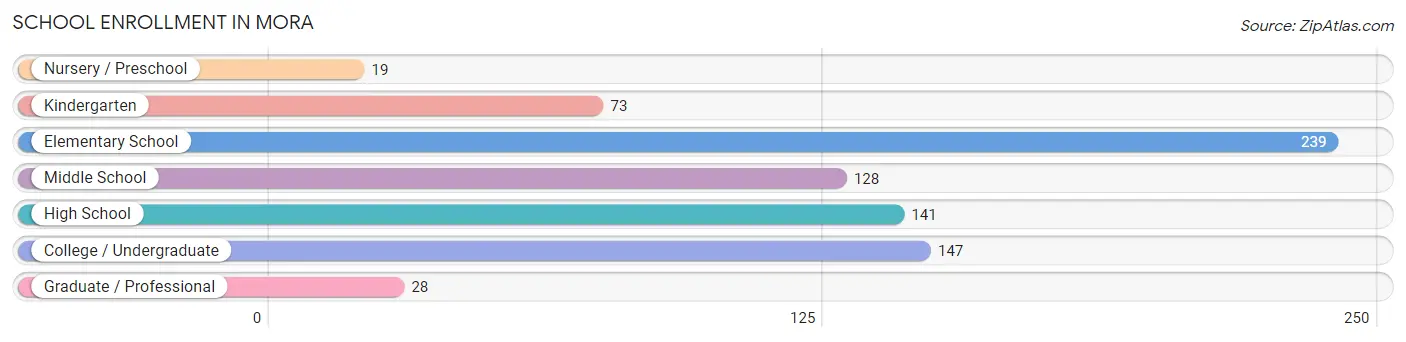
| School Level | # Students | % Students |
| Nursery / Preschool | 19 | 2.5% |
| Kindergarten | 73 | 9.4% |
| Elementary School | 239 | 30.8% |
| Middle School | 128 | 16.5% |
| High School | 141 | 18.2% |
| College / Undergraduate | 147 | 19.0% |
| Graduate / Professional | 28 | 3.6% |
| Total | 775 | 100.0% |
School Enrollment by Age by Funding Source in Mora
Out of a total of 775 students who are enrolled in schools in Mora, 83 (10.7%) attend a private institution, while the remaining 692 (89.3%) are enrolled in public schools. The age group of 10 to 14 year olds has the highest likelihood of being enrolled in private schools, with 47 (30.9% in the age bracket) enrolled. Conversely, the age group of 3 to 4 year olds has the lowest likelihood of being enrolled in a private school, with 8 (100.0% in the age bracket) attending a public institution.
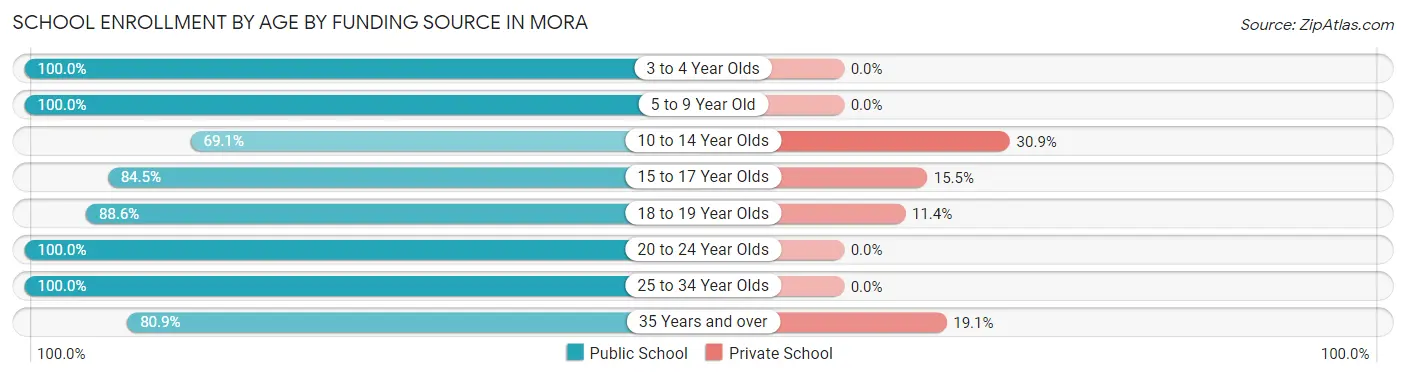
| Age Bracket | Public School | Private School |
| 3 to 4 Year Olds | 8 (100.0%) | 0 (0.0%) |
| 5 to 9 Year Old | 299 (100.0%) | 0 (0.0%) |
| 10 to 14 Year Olds | 105 (69.1%) | 47 (30.9%) |
| 15 to 17 Year Olds | 60 (84.5%) | 11 (15.5%) |
| 18 to 19 Year Olds | 93 (88.6%) | 12 (11.4%) |
| 20 to 24 Year Olds | 44 (100.0%) | 0 (0.0%) |
| 25 to 34 Year Olds | 28 (100.0%) | 0 (0.0%) |
| 35 Years and over | 55 (80.9%) | 13 (19.1%) |
| Total | 692 (89.3%) | 83 (10.7%) |
Educational Attainment by Field of Study in Mora
Education (160 | 33.8%), science & technology (48 | 10.2%), social sciences (43 | 9.1%), liberal arts & history (37 | 7.8%), and psychology (36 | 7.6%) are the most common fields of study among 473 individuals in Mora who have obtained a bachelor's degree or higher.
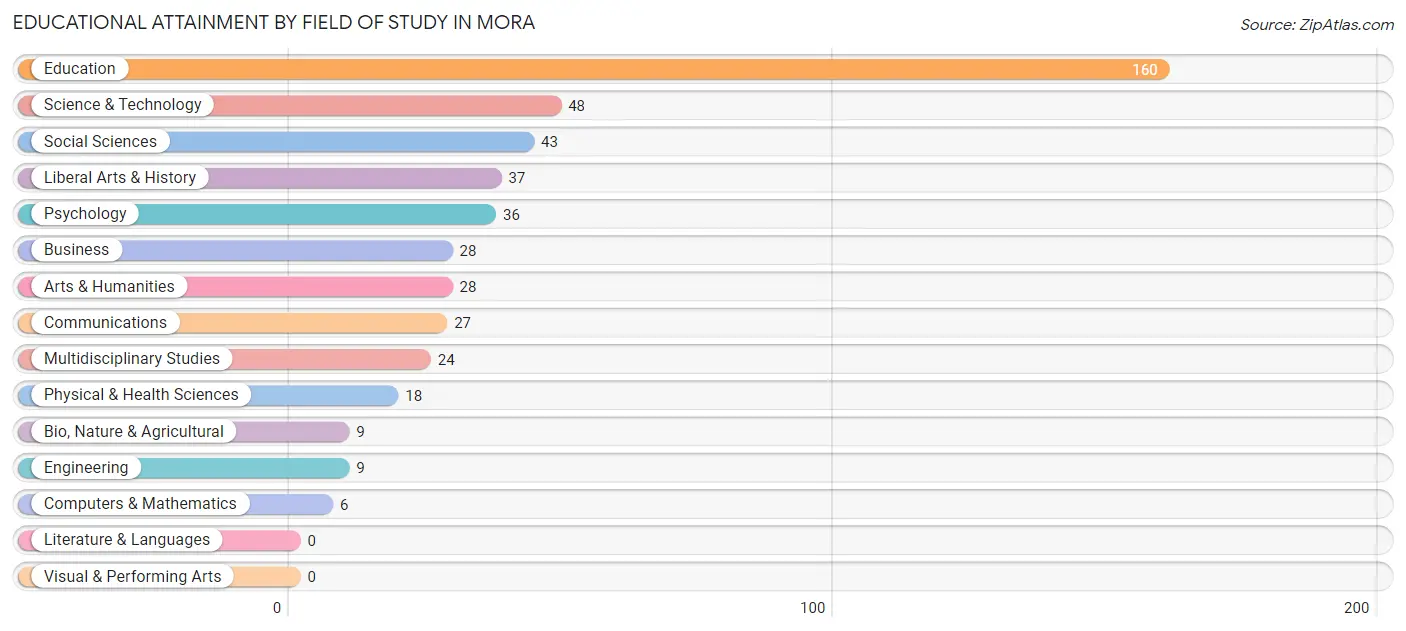
| Field of Study | # Graduates | % Graduates |
| Computers & Mathematics | 6 | 1.3% |
| Bio, Nature & Agricultural | 9 | 1.9% |
| Physical & Health Sciences | 18 | 3.8% |
| Psychology | 36 | 7.6% |
| Social Sciences | 43 | 9.1% |
| Engineering | 9 | 1.9% |
| Multidisciplinary Studies | 24 | 5.1% |
| Science & Technology | 48 | 10.2% |
| Business | 28 | 5.9% |
| Education | 160 | 33.8% |
| Literature & Languages | 0 | 0.0% |
| Liberal Arts & History | 37 | 7.8% |
| Visual & Performing Arts | 0 | 0.0% |
| Communications | 27 | 5.7% |
| Arts & Humanities | 28 | 5.9% |
| Total | 473 | 100.0% |
Transportation & Commute in Mora
Vehicle Availability by Sex in Mora
The most prevalent vehicle ownership categories in Mora are males with 2 vehicles (387, accounting for 44.5%) and females with 2 vehicles (328, making up 55.0%).
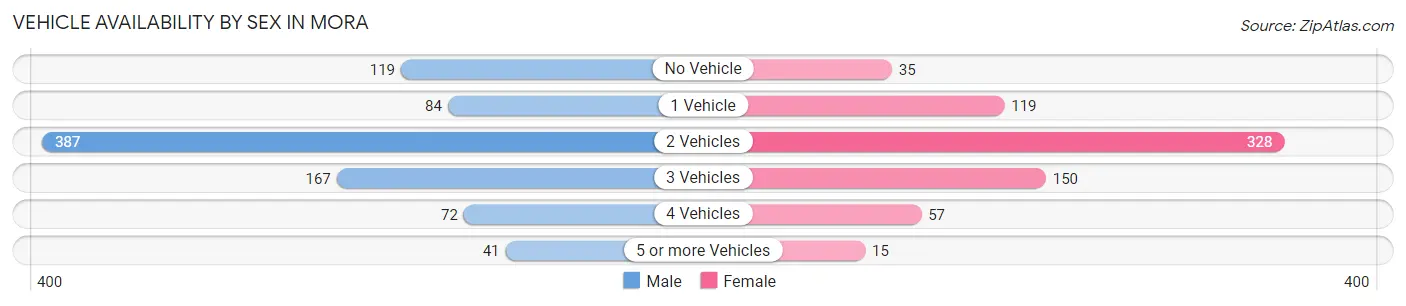
| Vehicles Available | Male | Female |
| No Vehicle | 119 (13.7%) | 35 (5.0%) |
| 1 Vehicle | 84 (9.7%) | 119 (16.9%) |
| 2 Vehicles | 387 (44.5%) | 328 (46.6%) |
| 3 Vehicles | 167 (19.2%) | 150 (21.3%) |
| 4 Vehicles | 72 (8.3%) | 57 (8.1%) |
| 5 or more Vehicles | 41 (4.7%) | 15 (2.1%) |
| Total | 870 (100.0%) | 704 (100.0%) |
Commute Time in Mora
The most frequently occuring commute durations in Mora are 5 to 9 minutes (385 commuters, 24.7%), 10 to 14 minutes (282 commuters, 18.1%), and less than 5 minutes (169 commuters, 10.8%).
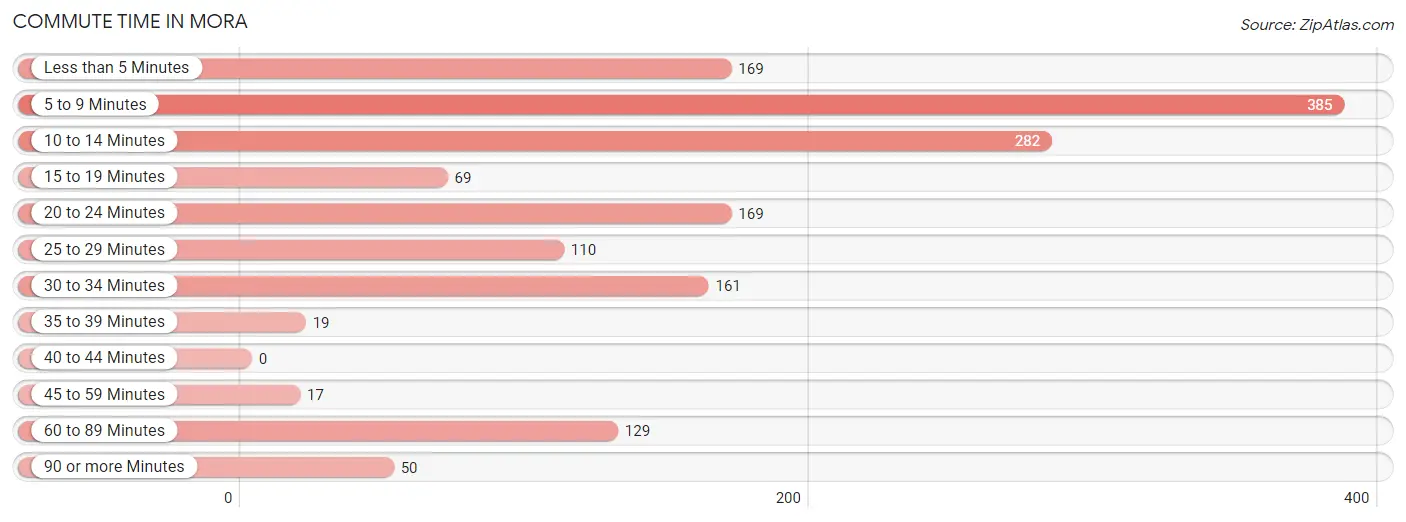
| Commute Time | # Commuters | % Commuters |
| Less than 5 Minutes | 169 | 10.8% |
| 5 to 9 Minutes | 385 | 24.7% |
| 10 to 14 Minutes | 282 | 18.1% |
| 15 to 19 Minutes | 69 | 4.4% |
| 20 to 24 Minutes | 169 | 10.8% |
| 25 to 29 Minutes | 110 | 7.0% |
| 30 to 34 Minutes | 161 | 10.3% |
| 35 to 39 Minutes | 19 | 1.2% |
| 40 to 44 Minutes | 0 | 0.0% |
| 45 to 59 Minutes | 17 | 1.1% |
| 60 to 89 Minutes | 129 | 8.3% |
| 90 or more Minutes | 50 | 3.2% |
Commute Time by Sex in Mora
The most common commute times in Mora are 5 to 9 minutes (255 commuters, 28.7%) for males and 10 to 14 minutes (154 commuters, 22.9%) for females.
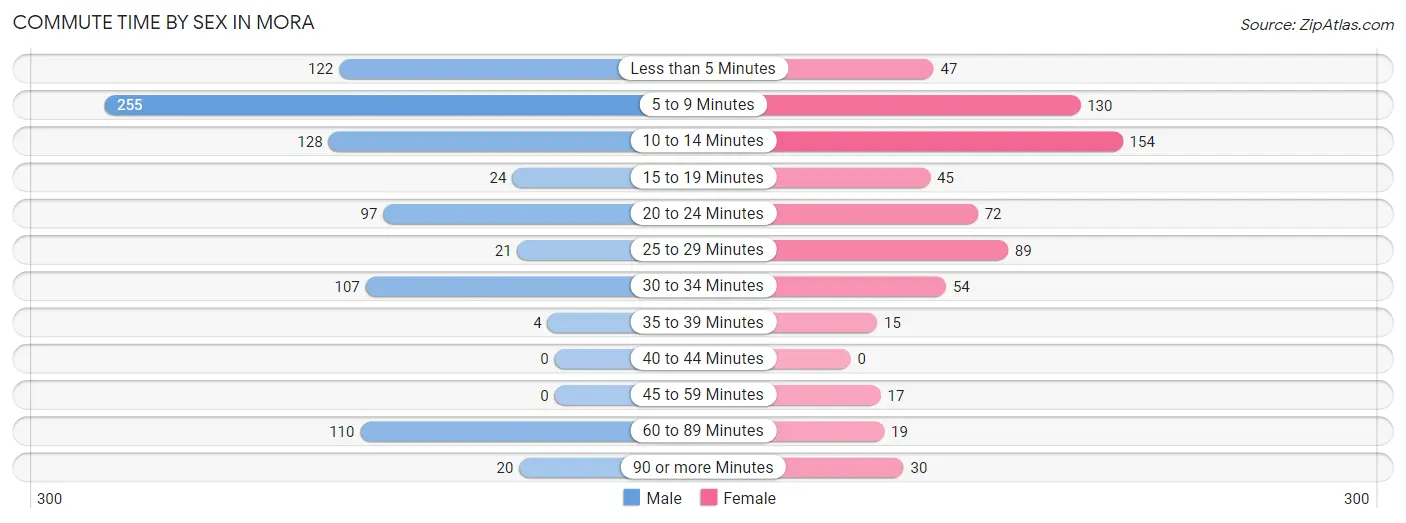
| Commute Time | Male | Female |
| Less than 5 Minutes | 122 (13.7%) | 47 (7.0%) |
| 5 to 9 Minutes | 255 (28.7%) | 130 (19.4%) |
| 10 to 14 Minutes | 128 (14.4%) | 154 (22.9%) |
| 15 to 19 Minutes | 24 (2.7%) | 45 (6.7%) |
| 20 to 24 Minutes | 97 (10.9%) | 72 (10.7%) |
| 25 to 29 Minutes | 21 (2.4%) | 89 (13.2%) |
| 30 to 34 Minutes | 107 (12.0%) | 54 (8.0%) |
| 35 to 39 Minutes | 4 (0.4%) | 15 (2.2%) |
| 40 to 44 Minutes | 0 (0.0%) | 0 (0.0%) |
| 45 to 59 Minutes | 0 (0.0%) | 17 (2.5%) |
| 60 to 89 Minutes | 110 (12.4%) | 19 (2.8%) |
| 90 or more Minutes | 20 (2.2%) | 30 (4.5%) |
Time of Departure to Work by Sex in Mora
The most frequent times of departure to work in Mora are 12:00 AM to 4:59 AM (137, 15.4%) for males and 12:00 PM to 3:59 PM (138, 20.5%) for females.
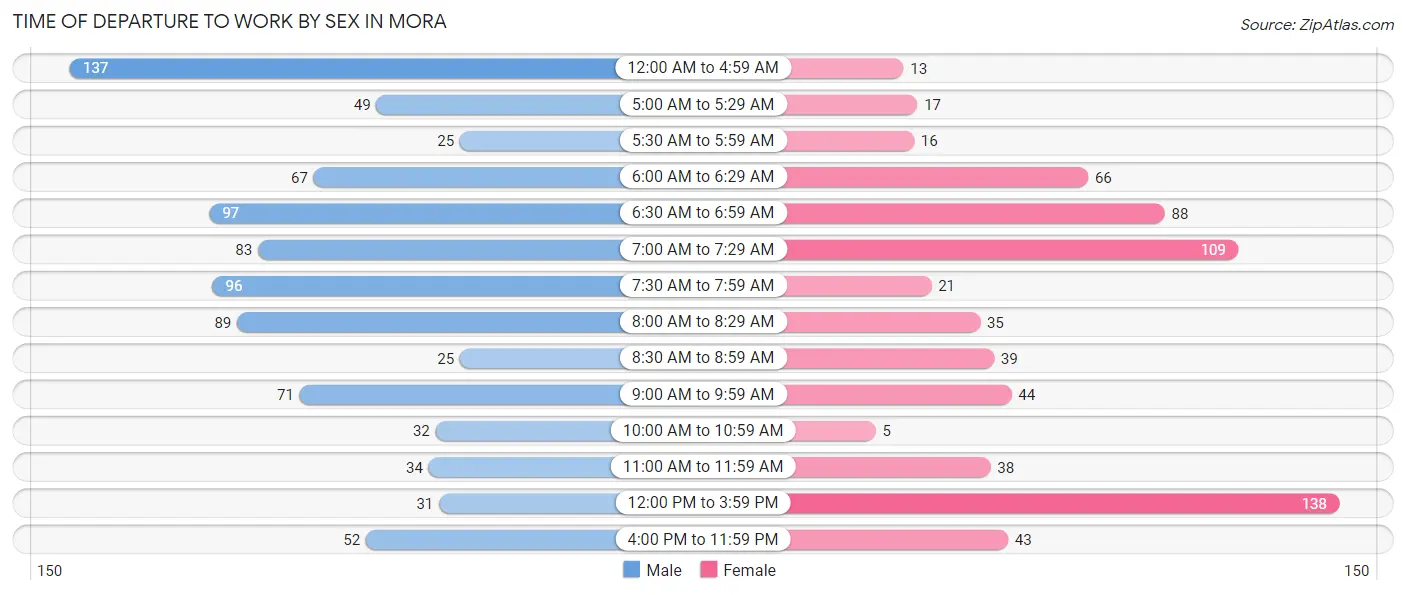
| Time of Departure | Male | Female |
| 12:00 AM to 4:59 AM | 137 (15.4%) | 13 (1.9%) |
| 5:00 AM to 5:29 AM | 49 (5.5%) | 17 (2.5%) |
| 5:30 AM to 5:59 AM | 25 (2.8%) | 16 (2.4%) |
| 6:00 AM to 6:29 AM | 67 (7.5%) | 66 (9.8%) |
| 6:30 AM to 6:59 AM | 97 (10.9%) | 88 (13.1%) |
| 7:00 AM to 7:29 AM | 83 (9.3%) | 109 (16.2%) |
| 7:30 AM to 7:59 AM | 96 (10.8%) | 21 (3.1%) |
| 8:00 AM to 8:29 AM | 89 (10.0%) | 35 (5.2%) |
| 8:30 AM to 8:59 AM | 25 (2.8%) | 39 (5.8%) |
| 9:00 AM to 9:59 AM | 71 (8.0%) | 44 (6.6%) |
| 10:00 AM to 10:59 AM | 32 (3.6%) | 5 (0.7%) |
| 11:00 AM to 11:59 AM | 34 (3.8%) | 38 (5.7%) |
| 12:00 PM to 3:59 PM | 31 (3.5%) | 138 (20.5%) |
| 4:00 PM to 11:59 PM | 52 (5.9%) | 43 (6.4%) |
| Total | 888 (100.0%) | 672 (100.0%) |
Housing Occupancy in Mora
Occupancy by Ownership in Mora
Of the total 1,509 dwellings in Mora, owner-occupied units account for 946 (62.7%), while renter-occupied units make up 563 (37.3%).
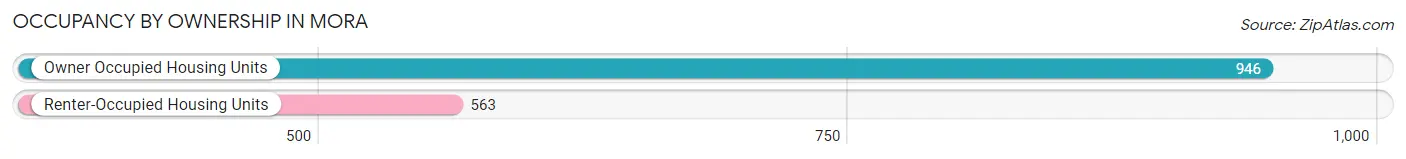
| Occupancy | # Housing Units | % Housing Units |
| Owner Occupied Housing Units | 946 | 62.7% |
| Renter-Occupied Housing Units | 563 | 37.3% |
| Total Occupied Housing Units | 1,509 | 100.0% |
Occupancy by Household Size in Mora
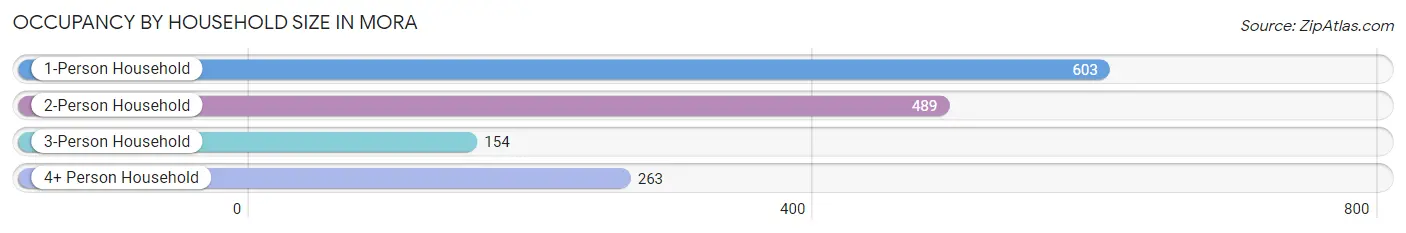
| Household Size | # Housing Units | % Housing Units |
| 1-Person Household | 603 | 40.0% |
| 2-Person Household | 489 | 32.4% |
| 3-Person Household | 154 | 10.2% |
| 4+ Person Household | 263 | 17.4% |
| Total Housing Units | 1,509 | 100.0% |
Occupancy by Ownership by Household Size in Mora
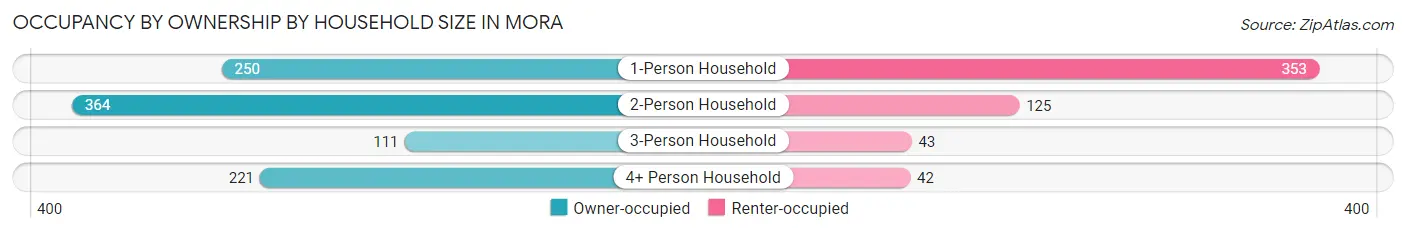
| Household Size | Owner-occupied | Renter-occupied |
| 1-Person Household | 250 (41.5%) | 353 (58.5%) |
| 2-Person Household | 364 (74.4%) | 125 (25.6%) |
| 3-Person Household | 111 (72.1%) | 43 (27.9%) |
| 4+ Person Household | 221 (84.0%) | 42 (16.0%) |
| Total Housing Units | 946 (62.7%) | 563 (37.3%) |
Occupancy by Educational Attainment in Mora
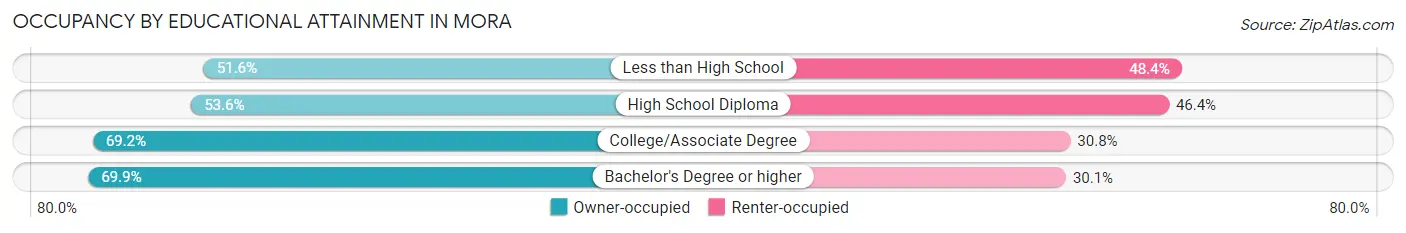
| Household Size | Owner-occupied | Renter-occupied |
| Less than High School | 49 (51.6%) | 46 (48.4%) |
| High School Diploma | 286 (53.6%) | 248 (46.4%) |
| College/Associate Degree | 402 (69.2%) | 179 (30.8%) |
| Bachelor's Degree or higher | 209 (69.9%) | 90 (30.1%) |
Occupancy by Age of Householder in Mora
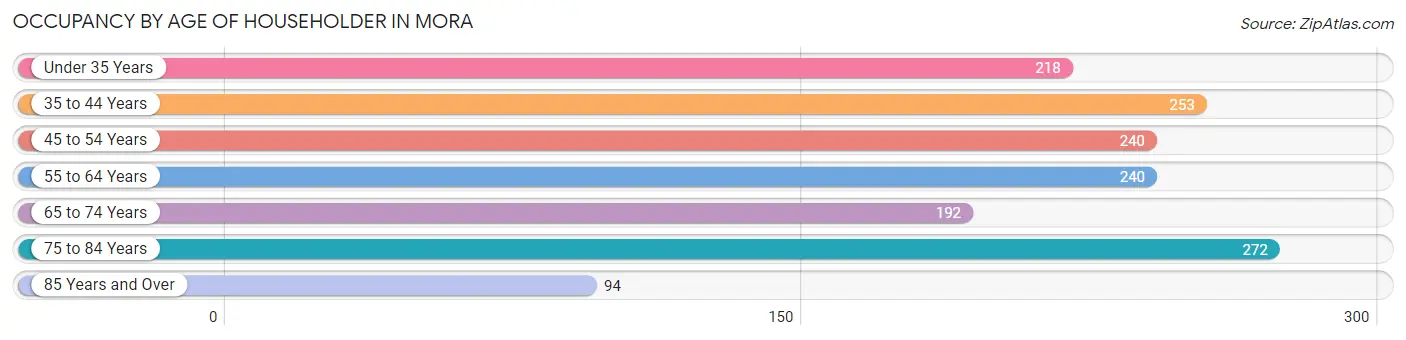
| Age Bracket | # Households | % Households |
| Under 35 Years | 218 | 14.4% |
| 35 to 44 Years | 253 | 16.8% |
| 45 to 54 Years | 240 | 15.9% |
| 55 to 64 Years | 240 | 15.9% |
| 65 to 74 Years | 192 | 12.7% |
| 75 to 84 Years | 272 | 18.0% |
| 85 Years and Over | 94 | 6.2% |
| Total | 1,509 | 100.0% |
Housing Finances in Mora
Median Income by Occupancy in Mora
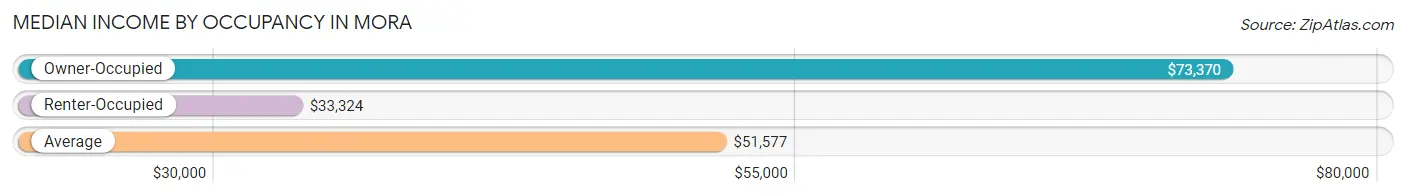
| Occupancy Type | # Households | Median Income |
| Owner-Occupied | 946 (62.7%) | $73,370 |
| Renter-Occupied | 563 (37.3%) | $33,324 |
| Average | 1,509 (100.0%) | $51,577 |
Occupancy by Householder Income Bracket in Mora
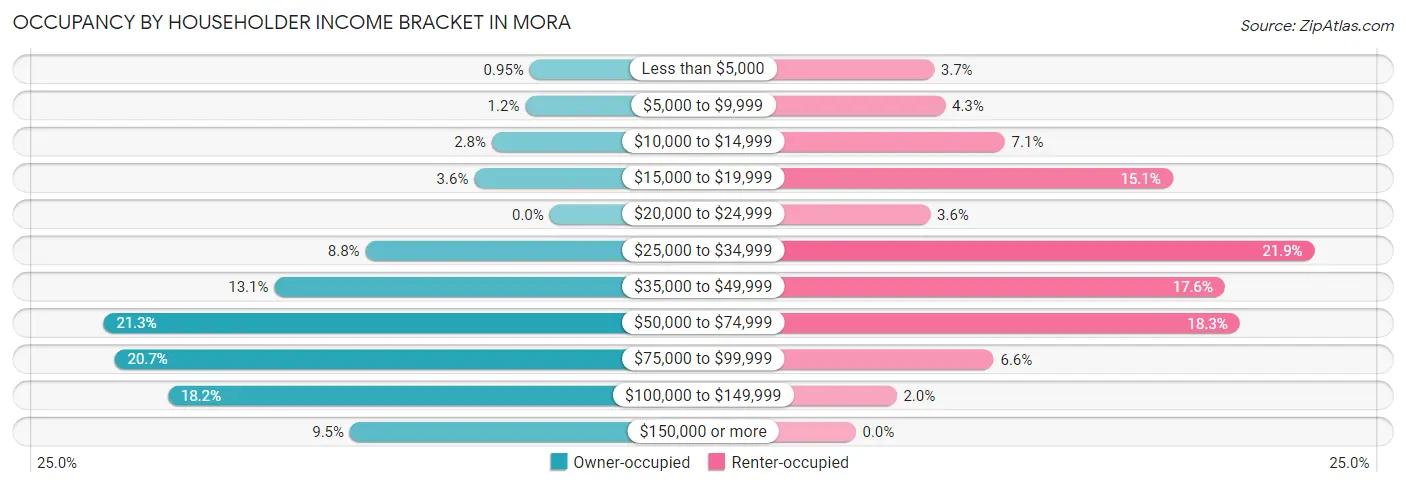
| Income Bracket | Owner-occupied | Renter-occupied |
| Less than $5,000 | 9 (0.9%) | 21 (3.7%) |
| $5,000 to $9,999 | 11 (1.2%) | 24 (4.3%) |
| $10,000 to $14,999 | 26 (2.8%) | 40 (7.1%) |
| $15,000 to $19,999 | 34 (3.6%) | 85 (15.1%) |
| $20,000 to $24,999 | 0 (0.0%) | 20 (3.5%) |
| $25,000 to $34,999 | 83 (8.8%) | 123 (21.8%) |
| $35,000 to $49,999 | 124 (13.1%) | 99 (17.6%) |
| $50,000 to $74,999 | 201 (21.2%) | 103 (18.3%) |
| $75,000 to $99,999 | 196 (20.7%) | 37 (6.6%) |
| $100,000 to $149,999 | 172 (18.2%) | 11 (1.9%) |
| $150,000 or more | 90 (9.5%) | 0 (0.0%) |
| Total | 946 (100.0%) | 563 (100.0%) |
Monthly Housing Cost Tiers in Mora
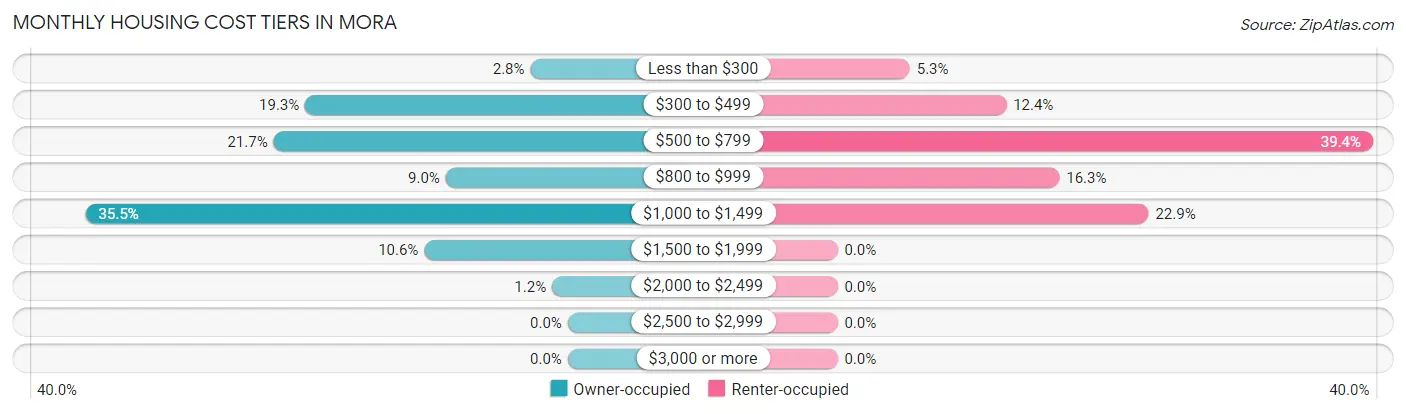
| Monthly Cost | Owner-occupied | Renter-occupied |
| Less than $300 | 26 (2.8%) | 30 (5.3%) |
| $300 to $499 | 183 (19.3%) | 70 (12.4%) |
| $500 to $799 | 205 (21.7%) | 222 (39.4%) |
| $800 to $999 | 85 (9.0%) | 92 (16.3%) |
| $1,000 to $1,499 | 336 (35.5%) | 129 (22.9%) |
| $1,500 to $1,999 | 100 (10.6%) | 0 (0.0%) |
| $2,000 to $2,499 | 11 (1.2%) | 0 (0.0%) |
| $2,500 to $2,999 | 0 (0.0%) | 0 (0.0%) |
| $3,000 or more | 0 (0.0%) | 0 (0.0%) |
| Total | 946 (100.0%) | 563 (100.0%) |
Physical Housing Characteristics in Mora
Housing Structures in Mora
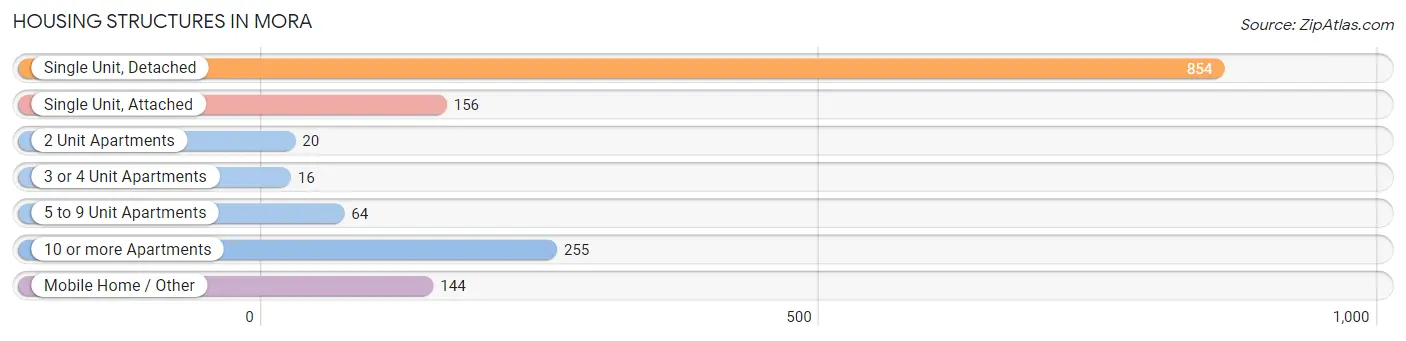
| Structure Type | # Housing Units | % Housing Units |
| Single Unit, Detached | 854 | 56.6% |
| Single Unit, Attached | 156 | 10.3% |
| 2 Unit Apartments | 20 | 1.3% |
| 3 or 4 Unit Apartments | 16 | 1.1% |
| 5 to 9 Unit Apartments | 64 | 4.2% |
| 10 or more Apartments | 255 | 16.9% |
| Mobile Home / Other | 144 | 9.5% |
| Total | 1,509 | 100.0% |
Housing Structures by Occupancy in Mora
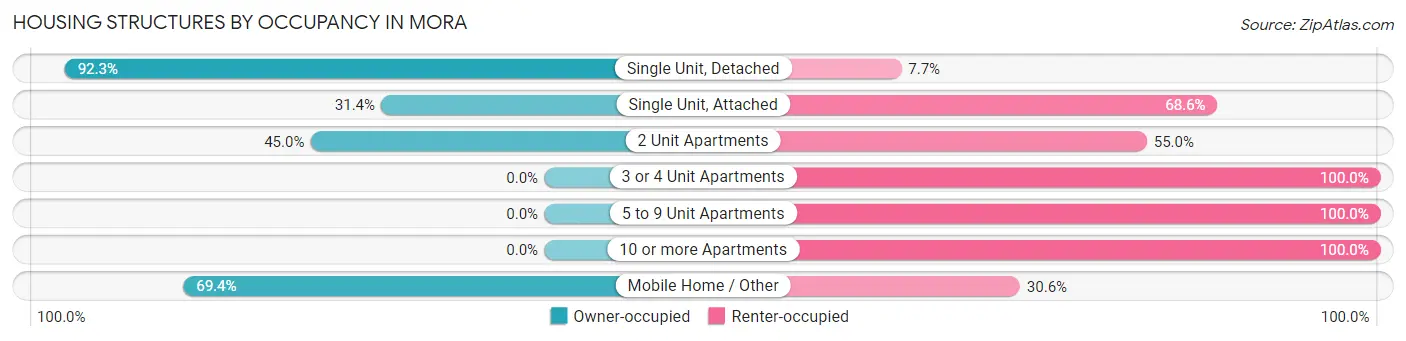
| Structure Type | Owner-occupied | Renter-occupied |
| Single Unit, Detached | 788 (92.3%) | 66 (7.7%) |
| Single Unit, Attached | 49 (31.4%) | 107 (68.6%) |
| 2 Unit Apartments | 9 (45.0%) | 11 (55.0%) |
| 3 or 4 Unit Apartments | 0 (0.0%) | 16 (100.0%) |
| 5 to 9 Unit Apartments | 0 (0.0%) | 64 (100.0%) |
| 10 or more Apartments | 0 (0.0%) | 255 (100.0%) |
| Mobile Home / Other | 100 (69.4%) | 44 (30.6%) |
| Total | 946 (62.7%) | 563 (37.3%) |
Housing Structures by Number of Rooms in Mora
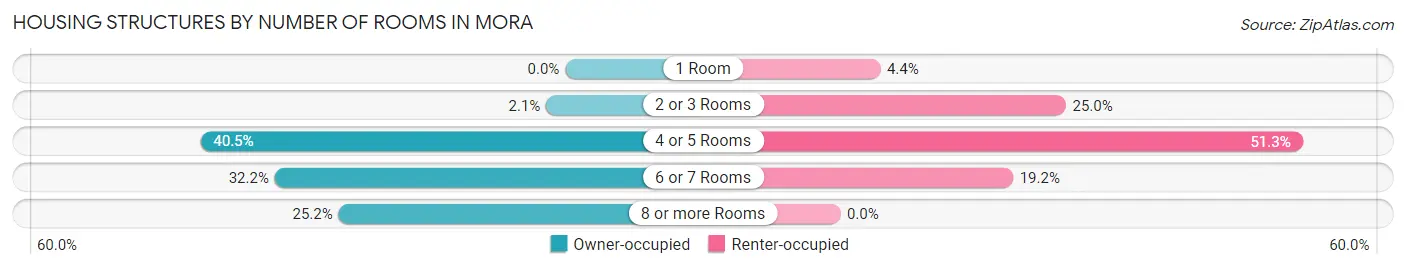
| Number of Rooms | Owner-occupied | Renter-occupied |
| 1 Room | 0 (0.0%) | 25 (4.4%) |
| 2 or 3 Rooms | 20 (2.1%) | 141 (25.0%) |
| 4 or 5 Rooms | 383 (40.5%) | 289 (51.3%) |
| 6 or 7 Rooms | 305 (32.2%) | 108 (19.2%) |
| 8 or more Rooms | 238 (25.2%) | 0 (0.0%) |
| Total | 946 (100.0%) | 563 (100.0%) |
Housing Structure by Heating Type in Mora
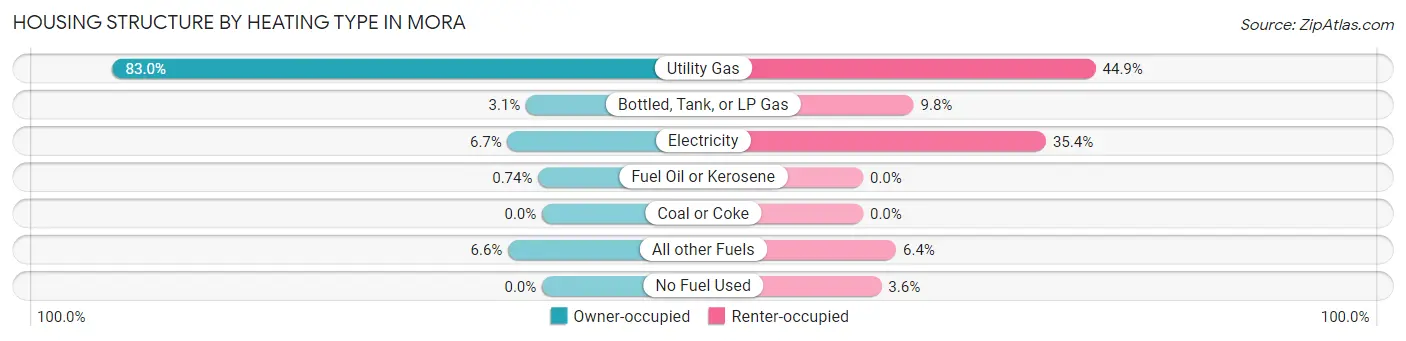
| Heating Type | Owner-occupied | Renter-occupied |
| Utility Gas | 785 (83.0%) | 253 (44.9%) |
| Bottled, Tank, or LP Gas | 29 (3.1%) | 55 (9.8%) |
| Electricity | 63 (6.7%) | 199 (35.3%) |
| Fuel Oil or Kerosene | 7 (0.7%) | 0 (0.0%) |
| Coal or Coke | 0 (0.0%) | 0 (0.0%) |
| All other Fuels | 62 (6.6%) | 36 (6.4%) |
| No Fuel Used | 0 (0.0%) | 20 (3.5%) |
| Total | 946 (100.0%) | 563 (100.0%) |
Household Vehicle Usage in Mora
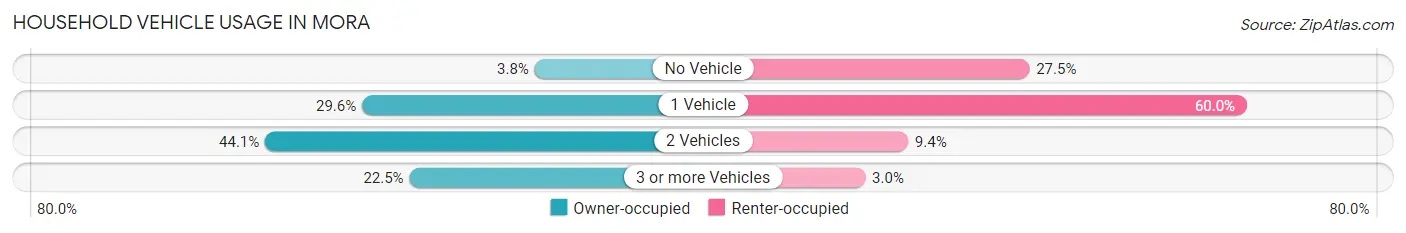
| Vehicles per Household | Owner-occupied | Renter-occupied |
| No Vehicle | 36 (3.8%) | 155 (27.5%) |
| 1 Vehicle | 280 (29.6%) | 338 (60.0%) |
| 2 Vehicles | 417 (44.1%) | 53 (9.4%) |
| 3 or more Vehicles | 213 (22.5%) | 17 (3.0%) |
| Total | 946 (100.0%) | 563 (100.0%) |
Real Estate & Mortgages in Mora
Real Estate and Mortgage Overview in Mora
| Characteristic | Without Mortgage | With Mortgage |
| Housing Units | 391 | 555 |
| Median Property Value | $159,500 | $160,600 |
| Median Household Income | $58,650 | $38 |
| Monthly Housing Costs | $485 | $0 |
| Real Estate Taxes | $2,130 | $22 |
Property Value by Mortgage Status in Mora
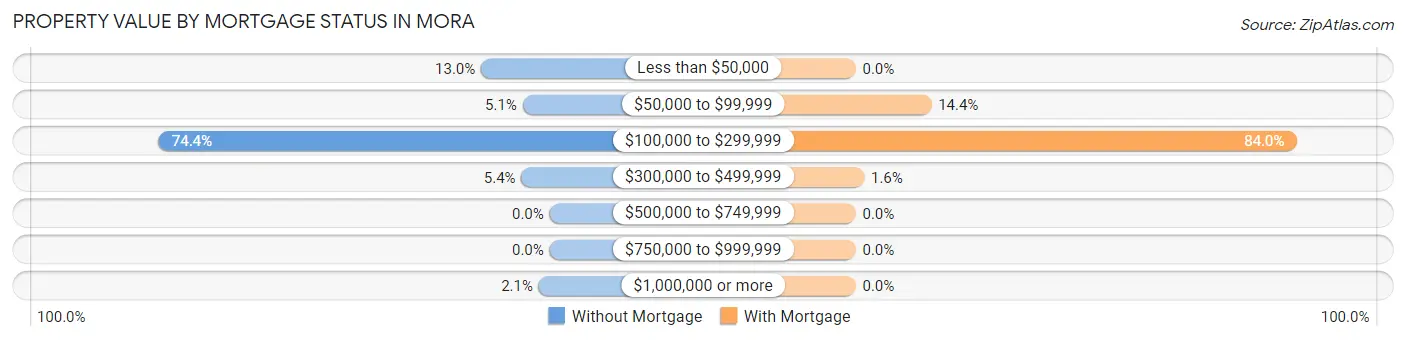
| Property Value | Without Mortgage | With Mortgage |
| Less than $50,000 | 51 (13.0%) | 0 (0.0%) |
| $50,000 to $99,999 | 20 (5.1%) | 80 (14.4%) |
| $100,000 to $299,999 | 291 (74.4%) | 466 (84.0%) |
| $300,000 to $499,999 | 21 (5.4%) | 9 (1.6%) |
| $500,000 to $749,999 | 0 (0.0%) | 0 (0.0%) |
| $750,000 to $999,999 | 0 (0.0%) | 0 (0.0%) |
| $1,000,000 or more | 8 (2.1%) | 0 (0.0%) |
| Total | 391 (100.0%) | 555 (100.0%) |
Household Income by Mortgage Status in Mora
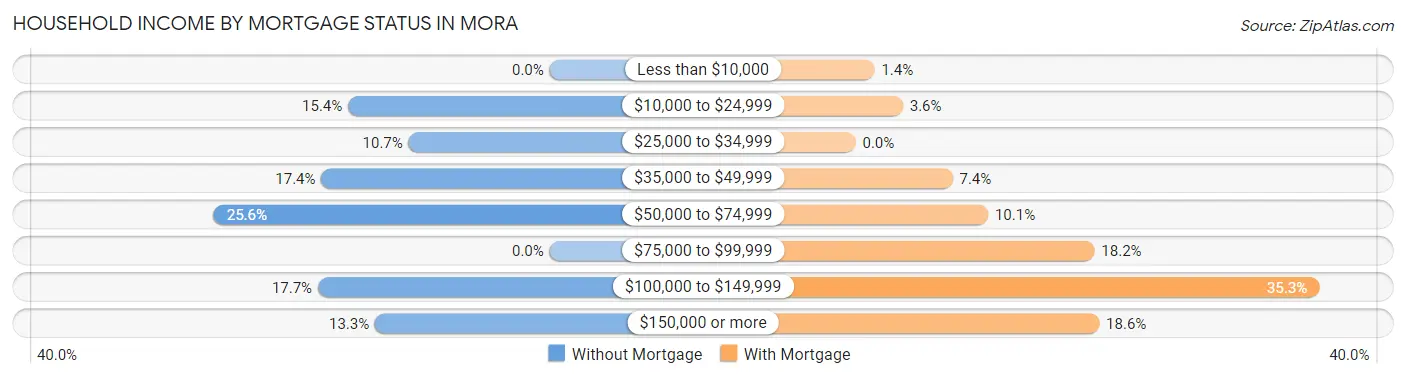
| Household Income | Without Mortgage | With Mortgage |
| Less than $10,000 | 0 (0.0%) | 8 (1.4%) |
| $10,000 to $24,999 | 60 (15.3%) | 20 (3.6%) |
| $25,000 to $34,999 | 42 (10.7%) | 0 (0.0%) |
| $35,000 to $49,999 | 68 (17.4%) | 41 (7.4%) |
| $50,000 to $74,999 | 100 (25.6%) | 56 (10.1%) |
| $75,000 to $99,999 | 0 (0.0%) | 101 (18.2%) |
| $100,000 to $149,999 | 69 (17.6%) | 196 (35.3%) |
| $150,000 or more | 52 (13.3%) | 103 (18.6%) |
| Total | 391 (100.0%) | 555 (100.0%) |
Property Value to Household Income Ratio in Mora
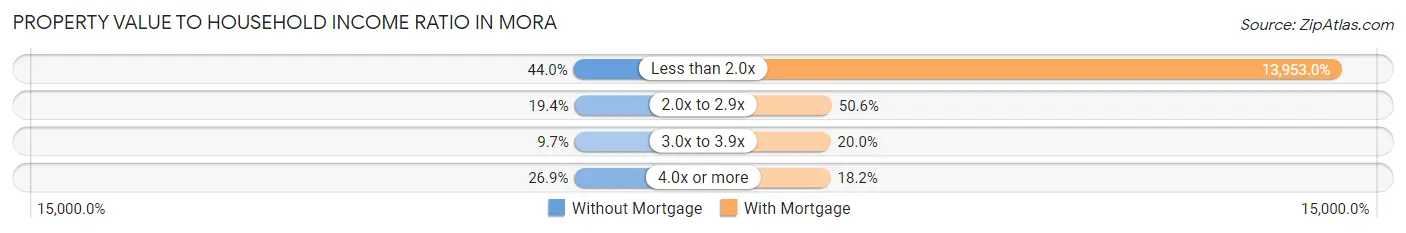
| Value-to-Income Ratio | Without Mortgage | With Mortgage |
| Less than 2.0x | 172 (44.0%) | 77,439 (13,953.0%) |
| 2.0x to 2.9x | 76 (19.4%) | 281 (50.6%) |
| 3.0x to 3.9x | 38 (9.7%) | 111 (20.0%) |
| 4.0x or more | 105 (26.9%) | 101 (18.2%) |
| Total | 391 (100.0%) | 555 (100.0%) |
Real Estate Taxes by Mortgage Status in Mora
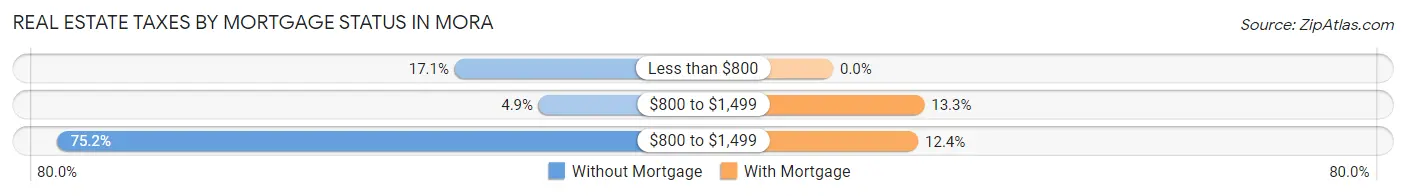
| Property Taxes | Without Mortgage | With Mortgage |
| Less than $800 | 67 (17.1%) | 0 (0.0%) |
| $800 to $1,499 | 19 (4.9%) | 74 (13.3%) |
| $800 to $1,499 | 294 (75.2%) | 69 (12.4%) |
| Total | 391 (100.0%) | 555 (100.0%) |
Health & Disability in Mora
Health Insurance Coverage by Age in Mora
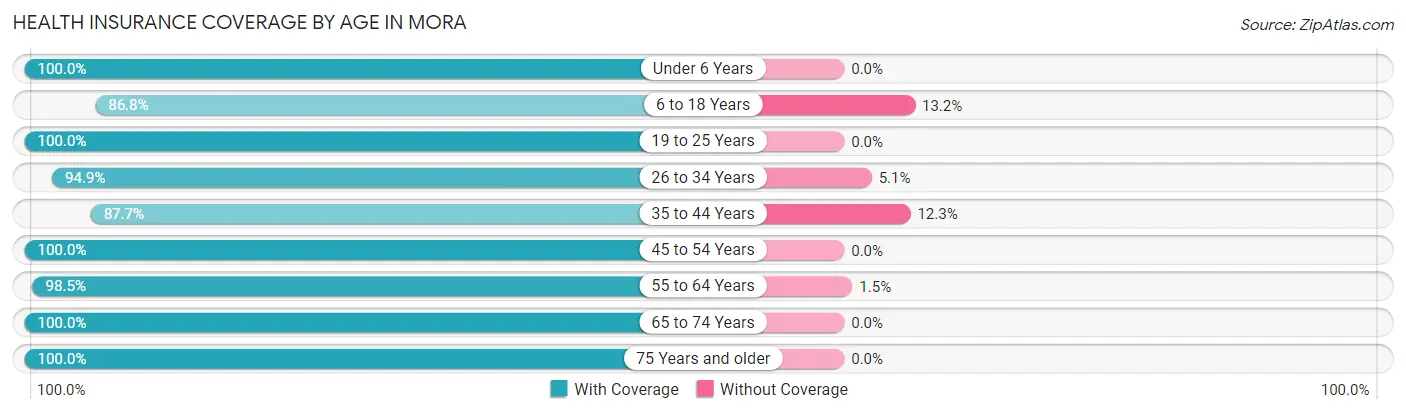
| Age Bracket | With Coverage | Without Coverage |
| Under 6 Years | 229 (100.0%) | 0 (0.0%) |
| 6 to 18 Years | 520 (86.8%) | 79 (13.2%) |
| 19 to 25 Years | 298 (100.0%) | 0 (0.0%) |
| 26 to 34 Years | 371 (94.9%) | 20 (5.1%) |
| 35 to 44 Years | 412 (87.7%) | 58 (12.3%) |
| 45 to 54 Years | 345 (100.0%) | 0 (0.0%) |
| 55 to 64 Years | 391 (98.5%) | 6 (1.5%) |
| 65 to 74 Years | 342 (100.0%) | 0 (0.0%) |
| 75 Years and older | 450 (100.0%) | 0 (0.0%) |
| Total | 3,358 (95.4%) | 163 (4.6%) |
Health Insurance Coverage by Citizenship Status in Mora
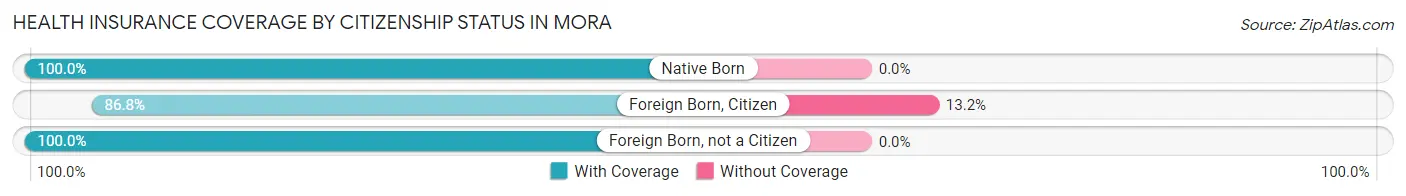
| Citizenship Status | With Coverage | Without Coverage |
| Native Born | 229 (100.0%) | 0 (0.0%) |
| Foreign Born, Citizen | 520 (86.8%) | 79 (13.2%) |
| Foreign Born, not a Citizen | 298 (100.0%) | 0 (0.0%) |
Health Insurance Coverage by Household Income in Mora
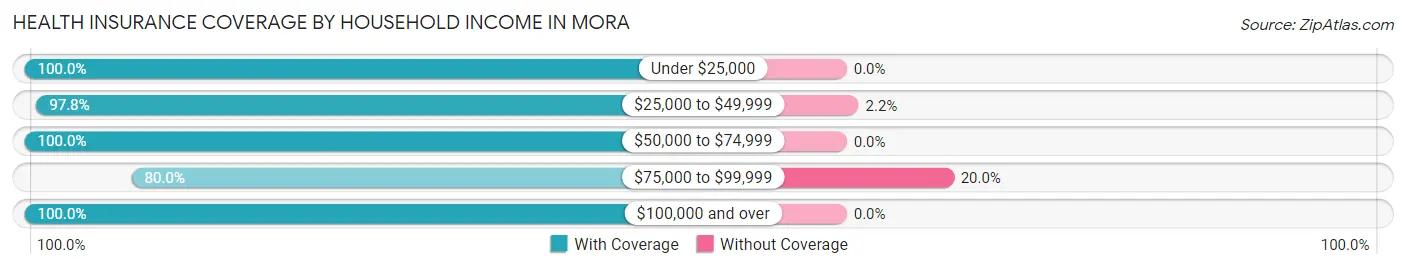
| Household Income | With Coverage | Without Coverage |
| Under $25,000 | 331 (100.0%) | 0 (0.0%) |
| $25,000 to $49,999 | 883 (97.8%) | 20 (2.2%) |
| $50,000 to $74,999 | 661 (100.0%) | 0 (0.0%) |
| $75,000 to $99,999 | 571 (80.0%) | 143 (20.0%) |
| $100,000 and over | 822 (100.0%) | 0 (0.0%) |
Public vs Private Health Insurance Coverage by Age in Mora
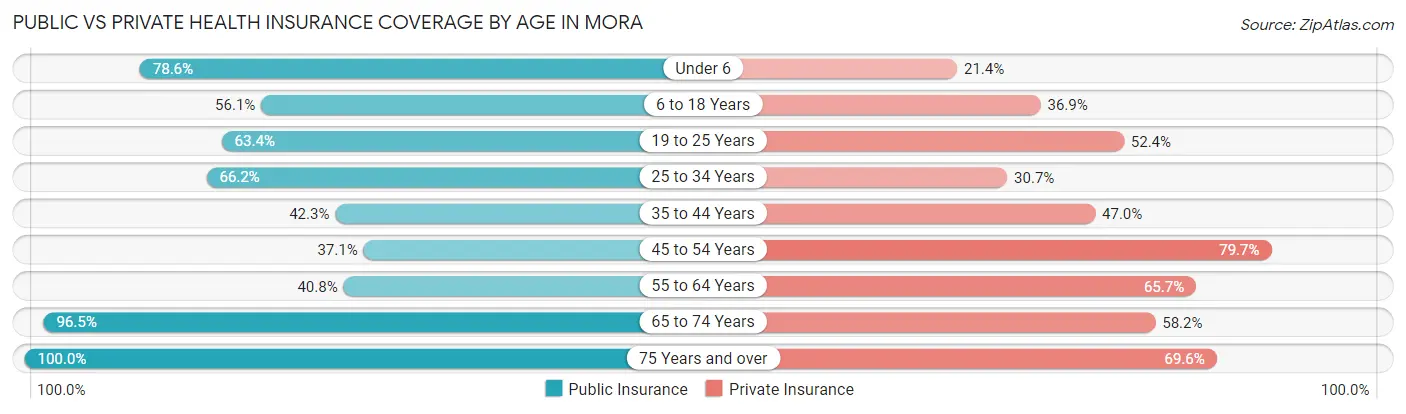
| Age Bracket | Public Insurance | Private Insurance |
| Under 6 | 180 (78.6%) | 49 (21.4%) |
| 6 to 18 Years | 336 (56.1%) | 221 (36.9%) |
| 19 to 25 Years | 189 (63.4%) | 156 (52.3%) |
| 25 to 34 Years | 259 (66.2%) | 120 (30.7%) |
| 35 to 44 Years | 199 (42.3%) | 221 (47.0%) |
| 45 to 54 Years | 128 (37.1%) | 275 (79.7%) |
| 55 to 64 Years | 162 (40.8%) | 261 (65.7%) |
| 65 to 74 Years | 330 (96.5%) | 199 (58.2%) |
| 75 Years and over | 450 (100.0%) | 313 (69.6%) |
| Total | 2,233 (63.4%) | 1,815 (51.5%) |
Disability Status by Sex by Age in Mora
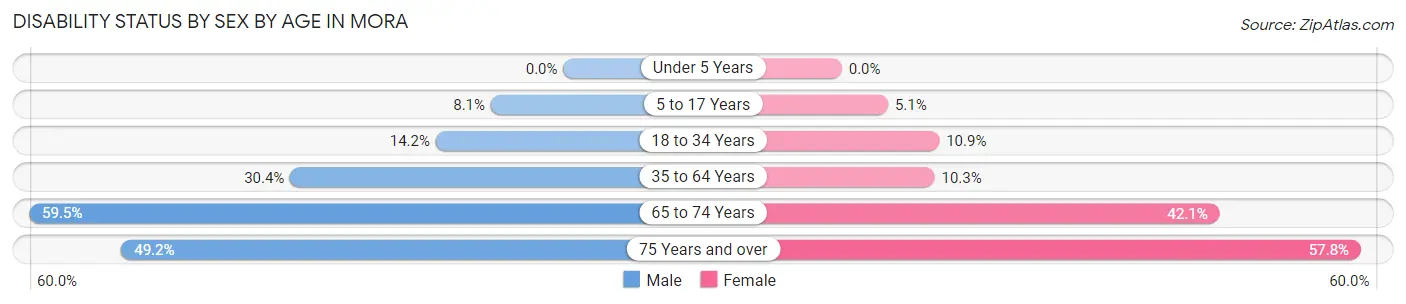
| Age Bracket | Male | Female |
| Under 5 Years | 0 (0.0%) | 0 (0.0%) |
| 5 to 17 Years | 28 (8.1%) | 11 (5.1%) |
| 18 to 34 Years | 54 (14.2%) | 41 (10.8%) |
| 35 to 64 Years | 195 (30.4%) | 59 (10.3%) |
| 65 to 74 Years | 72 (59.5%) | 93 (42.1%) |
| 75 Years and over | 64 (49.2%) | 185 (57.8%) |
Disability Class by Sex by Age in Mora
Disability Class: Hearing Difficulty
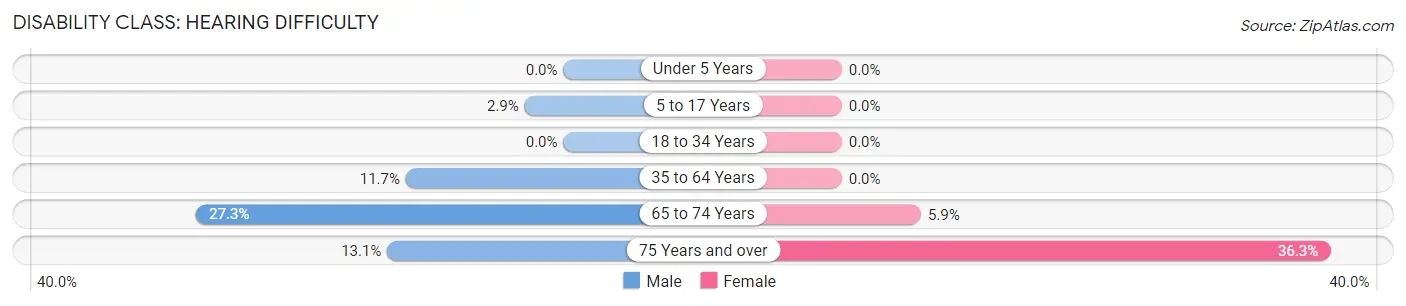
| Age Bracket | Male | Female |
| Under 5 Years | 0 (0.0%) | 0 (0.0%) |
| 5 to 17 Years | 10 (2.9%) | 0 (0.0%) |
| 18 to 34 Years | 0 (0.0%) | 0 (0.0%) |
| 35 to 64 Years | 75 (11.7%) | 0 (0.0%) |
| 65 to 74 Years | 33 (27.3%) | 13 (5.9%) |
| 75 Years and over | 17 (13.1%) | 116 (36.2%) |
Disability Class: Vision Difficulty
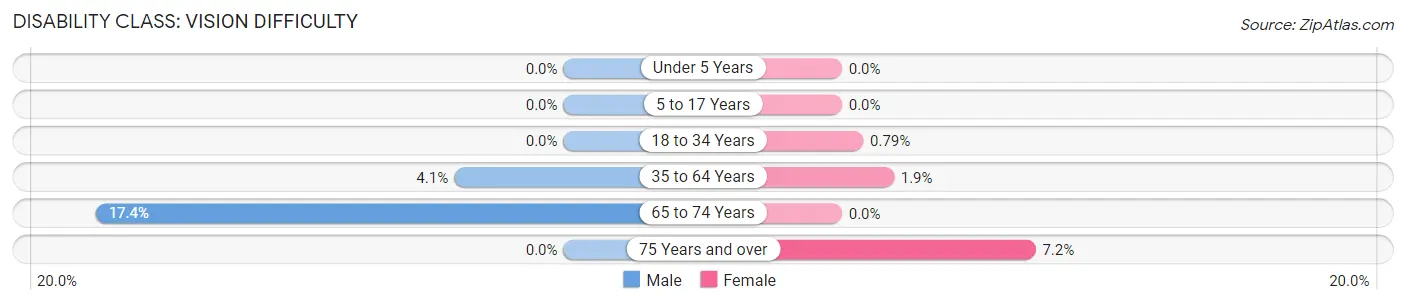
| Age Bracket | Male | Female |
| Under 5 Years | 0 (0.0%) | 0 (0.0%) |
| 5 to 17 Years | 0 (0.0%) | 0 (0.0%) |
| 18 to 34 Years | 0 (0.0%) | 3 (0.8%) |
| 35 to 64 Years | 26 (4.1%) | 11 (1.9%) |
| 65 to 74 Years | 21 (17.4%) | 0 (0.0%) |
| 75 Years and over | 0 (0.0%) | 23 (7.2%) |
Disability Class: Cognitive Difficulty
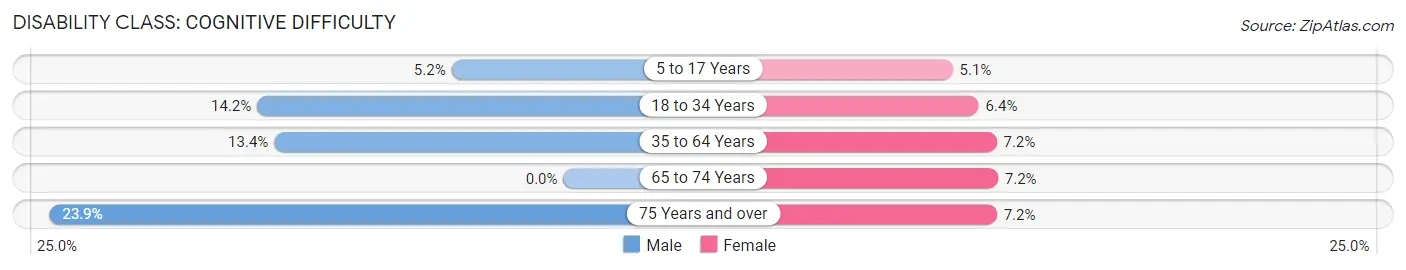
| Age Bracket | Male | Female |
| 5 to 17 Years | 18 (5.2%) | 11 (5.1%) |
| 18 to 34 Years | 54 (14.2%) | 24 (6.4%) |
| 35 to 64 Years | 86 (13.4%) | 41 (7.2%) |
| 65 to 74 Years | 0 (0.0%) | 16 (7.2%) |
| 75 Years and over | 31 (23.8%) | 23 (7.2%) |
Disability Class: Ambulatory Difficulty
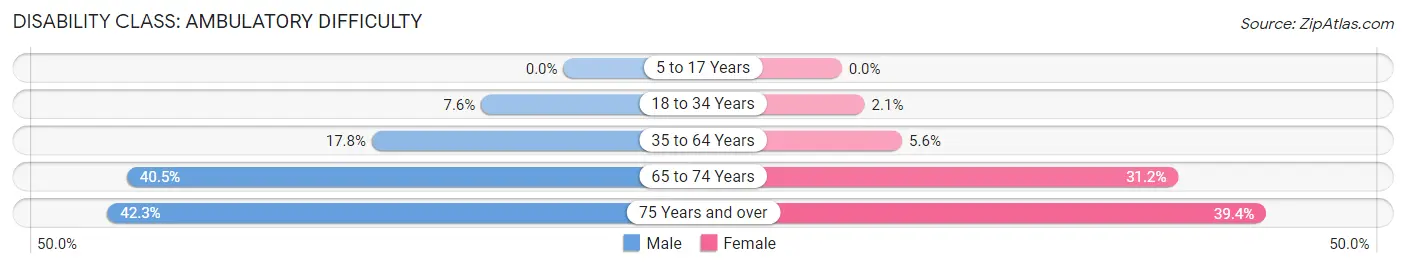
| Age Bracket | Male | Female |
| 5 to 17 Years | 0 (0.0%) | 0 (0.0%) |
| 18 to 34 Years | 29 (7.6%) | 8 (2.1%) |
| 35 to 64 Years | 114 (17.8%) | 32 (5.6%) |
| 65 to 74 Years | 49 (40.5%) | 69 (31.2%) |
| 75 Years and over | 55 (42.3%) | 126 (39.4%) |
Disability Class: Self-Care Difficulty
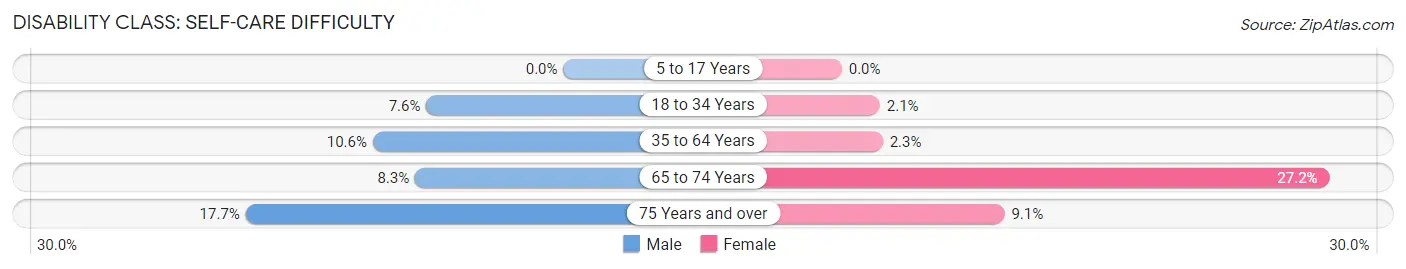
| Age Bracket | Male | Female |
| 5 to 17 Years | 0 (0.0%) | 0 (0.0%) |
| 18 to 34 Years | 29 (7.6%) | 8 (2.1%) |
| 35 to 64 Years | 68 (10.6%) | 13 (2.3%) |
| 65 to 74 Years | 10 (8.3%) | 60 (27.2%) |
| 75 Years and over | 23 (17.7%) | 29 (9.1%) |
Technology Access in Mora
Computing Device Access in Mora
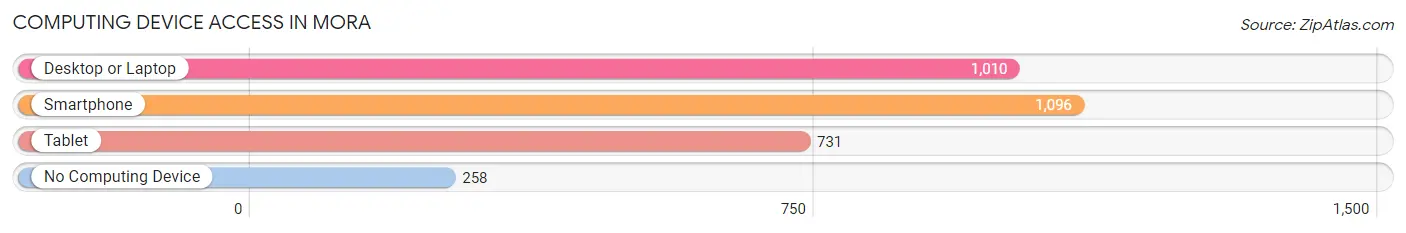
| Device Type | # Households | % Households |
| Desktop or Laptop | 1,010 | 66.9% |
| Smartphone | 1,096 | 72.6% |
| Tablet | 731 | 48.4% |
| No Computing Device | 258 | 17.1% |
| Total | 1,509 | 100.0% |
Internet Access in Mora
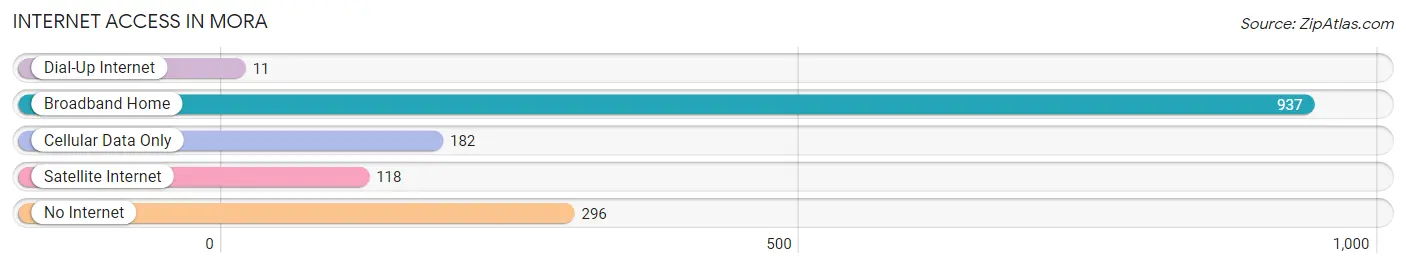
| Internet Type | # Households | % Households |
| Dial-Up Internet | 11 | 0.7% |
| Broadband Home | 937 | 62.1% |
| Cellular Data Only | 182 | 12.1% |
| Satellite Internet | 118 | 7.8% |
| No Internet | 296 | 19.6% |
| Total | 1,509 | 100.0% |
Mora Summary
Mora, Minnesota is a small city located in Kanabec County, in the east-central part of the state. It is situated on the Snake River, about 50 miles north of Minneapolis. The city has a population of approximately 3,000 people and is the county seat of Kanabec County.
History
Mora was founded in 1887 by Swedish immigrants who were looking for a place to settle and start a new life. The city was named after Mora, Sweden, the hometown of many of the settlers. The first settlers built a sawmill and a gristmill, and the city quickly grew. By the early 1900s, Mora had become a thriving community with a variety of businesses, including a bank, a hotel, a newspaper, and a variety of stores.
In the early 1900s, the city was also home to a large logging industry. Logging was the main source of income for many of the residents, and the city was known as the “Lumber Capital of Minnesota.” The logging industry declined in the 1950s, and the city’s economy shifted to tourism and recreation.
Geography
Mora is located in east-central Minnesota, about 50 miles north of Minneapolis. The city is situated on the Snake River, and is surrounded by rolling hills and forests. The city is located in the heart of the Chippewa National Forest, and is a popular destination for outdoor recreation.
The climate in Mora is typical of the Upper Midwest, with cold winters and warm summers. The average temperature in January is around 10 degrees Fahrenheit, and the average temperature in July is around 75 degrees Fahrenheit.
Economy
Mora’s economy is largely based on tourism and recreation. The city is home to a variety of outdoor activities, including fishing, hunting, camping, and hiking. The city is also home to a number of small businesses, including restaurants, retail stores, and service providers.
The city is also home to a number of manufacturing companies, including a paper mill, a wood products plant, and a metal fabrication plant. The city is also home to a number of government offices, including the Kanabec County Courthouse and the Mora Public Library.
Demographics
As of the 2010 census, the population of Mora was 3,068. The racial makeup of the city was 95.3% White, 0.7% African American, 0.3% Native American, 0.3% Asian, 0.1% Pacific Islander, 1.2% from other races, and 2.3% from two or more races. Hispanic or Latino of any race were 3.2% of the population.
The median household income in Mora was $41,944, and the median family income was $50,917. The per capita income for the city was $20,845. About 11.2% of families and 14.2% of the population were below the poverty line, including 18.2% of those under age 18 and 8.2% of those age 65 or over.
Mora is a small city with a rich history and a vibrant economy. The city is home to a variety of outdoor activities, and is a popular destination for tourists and outdoor enthusiasts. The city is also home to a number of small businesses, manufacturing companies, and government offices. The city has a diverse population, with a mix of races and ethnicities.
Common Questions
What is Per Capita Income in Mora?
Per Capita income in Mora is $29,021.
What is the Median Family Income in Mora?
Median Family Income in Mora is $61,382.
What is the Median Household income in Mora?
Median Household Income in Mora is $51,577.
What is Income or Wage Gap in Mora?
Income or Wage Gap in Mora is 2.7%.
Women in Mora earn 97.3 cents for every dollar earned by a man.
What is Inequality or Gini Index in Mora?
Inequality or Gini Index in Mora is 0.40.
What is the Total Population of Mora?
Total Population of Mora is 3,685.
What is the Total Male Population of Mora?
Total Male Population of Mora is 1,839.
What is the Total Female Population of Mora?
Total Female Population of Mora is 1,846.
What is the Ratio of Males per 100 Females in Mora?
There are 99.62 Males per 100 Females in Mora.
What is the Ratio of Females per 100 Males in Mora?
There are 100.38 Females per 100 Males in Mora.
What is the Median Population Age in Mora?
Median Population Age in Mora is 40.8 Years.
What is the Average Family Size in Mora
Average Family Size in Mora is 3.0 People.
What is the Average Household Size in Mora
Average Household Size in Mora is 2.3 People.
How Large is the Labor Force in Mora?
There are 1,673 People in the Labor Forcein in Mora.
What is the Percentage of People in the Labor Force in Mora?
55.4% of People are in the Labor Force in Mora.
What is the Unemployment Rate in Mora?
Unemployment Rate in Mora is 2.4%.