Hermantown, MN Map & Demographics
Hermantown Map
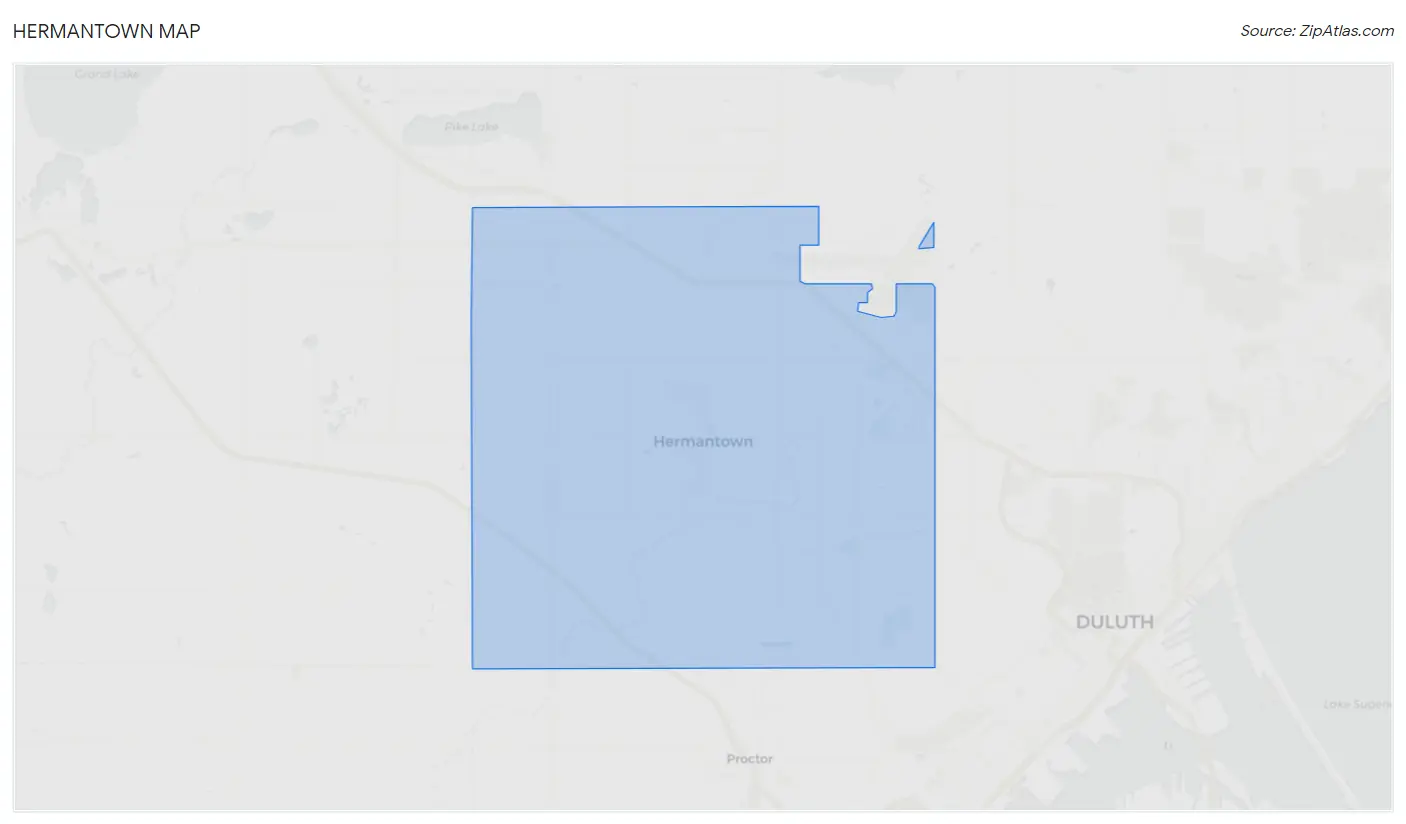
Hermantown Overview
$48,076
PER CAPITA INCOME
$102,350
AVG FAMILY INCOME
$85,417
AVG HOUSEHOLD INCOME
23.8%
WAGE / INCOME GAP [ % ]
76.2¢/ $1
WAGE / INCOME GAP [ $ ]
0.48
INEQUALITY / GINI INDEX
10,135
TOTAL POPULATION
5,156
MALE POPULATION
4,979
FEMALE POPULATION
103.55
MALES / 100 FEMALES
96.57
FEMALES / 100 MALES
38.0
MEDIAN AGE
3.0
AVG FAMILY SIZE
2.6
AVG HOUSEHOLD SIZE
5,041
LABOR FORCE [ PEOPLE ]
65.4%
PERCENT IN LABOR FORCE
1.8%
UNEMPLOYMENT RATE
Hermantown Area Codes
Income in Hermantown
Income Overview in Hermantown
Per Capita Income in Hermantown is $48,076, while median incomes of families and households are $102,350 and $85,417 respectively.
| Characteristic | Number | Measure |
| Per Capita Income | 10,135 | $48,076 |
| Median Family Income | 2,764 | $102,350 |
| Mean Family Income | 2,764 | $150,696 |
| Median Household Income | 3,738 | $85,417 |
| Mean Household Income | 3,738 | $127,133 |
| Income Deficit | 2,764 | $0 |
| Wage / Income Gap (%) | 10,135 | 23.75% |
| Wage / Income Gap ($) | 10,135 | 76.25¢ per $1 |
| Gini / Inequality Index | 10,135 | 0.48 |
Earnings by Sex in Hermantown
Average Earnings in Hermantown are $48,298, $54,353 for men and $41,442 for women, a difference of 23.7%.
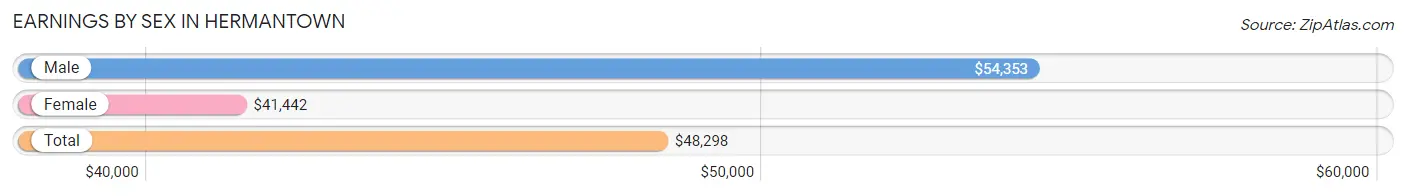
| Sex | Number | Average Earnings |
| Male | 3,072 (55.8%) | $54,353 |
| Female | 2,437 (44.2%) | $41,442 |
| Total | 5,509 (100.0%) | $48,298 |
Earnings by Sex by Income Bracket in Hermantown
The most common earnings brackets in Hermantown are $100,000+ for men (747 | 24.3%) and $55,000 to $64,999 for women (300 | 12.3%).
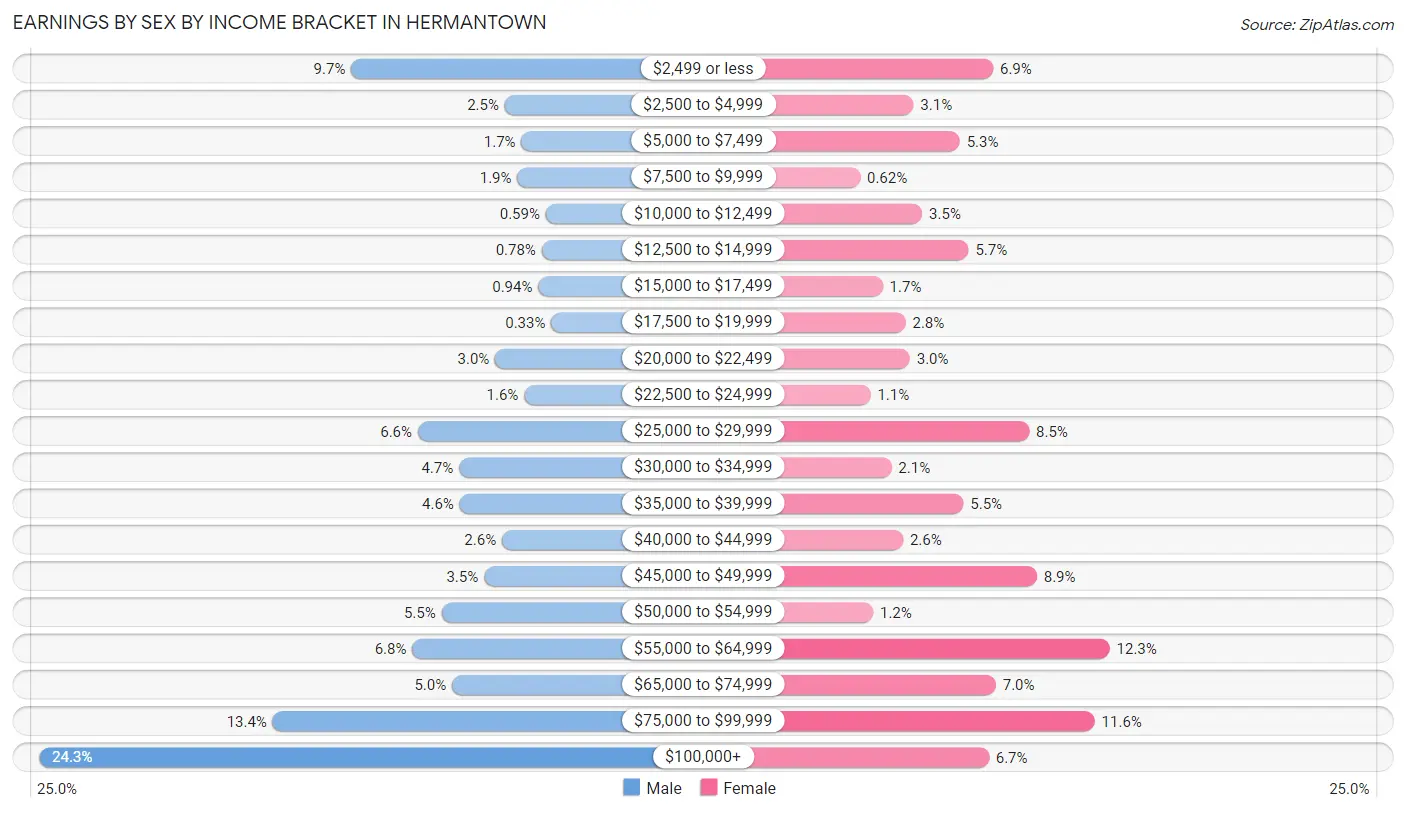
| Income | Male | Female |
| $2,499 or less | 298 (9.7%) | 167 (6.9%) |
| $2,500 to $4,999 | 77 (2.5%) | 76 (3.1%) |
| $5,000 to $7,499 | 53 (1.7%) | 129 (5.3%) |
| $7,500 to $9,999 | 59 (1.9%) | 15 (0.6%) |
| $10,000 to $12,499 | 18 (0.6%) | 86 (3.5%) |
| $12,500 to $14,999 | 24 (0.8%) | 139 (5.7%) |
| $15,000 to $17,499 | 29 (0.9%) | 41 (1.7%) |
| $17,500 to $19,999 | 10 (0.3%) | 67 (2.8%) |
| $20,000 to $22,499 | 91 (3.0%) | 72 (2.9%) |
| $22,500 to $24,999 | 49 (1.6%) | 27 (1.1%) |
| $25,000 to $29,999 | 202 (6.6%) | 208 (8.5%) |
| $30,000 to $34,999 | 143 (4.6%) | 51 (2.1%) |
| $35,000 to $39,999 | 142 (4.6%) | 133 (5.5%) |
| $40,000 to $44,999 | 81 (2.6%) | 64 (2.6%) |
| $45,000 to $49,999 | 107 (3.5%) | 217 (8.9%) |
| $50,000 to $54,999 | 168 (5.5%) | 30 (1.2%) |
| $55,000 to $64,999 | 210 (6.8%) | 300 (12.3%) |
| $65,000 to $74,999 | 153 (5.0%) | 170 (7.0%) |
| $75,000 to $99,999 | 411 (13.4%) | 283 (11.6%) |
| $100,000+ | 747 (24.3%) | 162 (6.7%) |
| Total | 3,072 (100.0%) | 2,437 (100.0%) |
Earnings by Sex by Educational Attainment in Hermantown
Average earnings in Hermantown are $70,815 for men and $46,698 for women, a difference of 34.1%. Men with an educational attainment of bachelor's degree enjoy the highest average annual earnings of $92,337, while those with college or associate's degree education earn the least with $51,319. Women with an educational attainment of graduate degree earn the most with the average annual earnings of $71,190, while those with high school diploma education have the smallest earnings of $28,545.
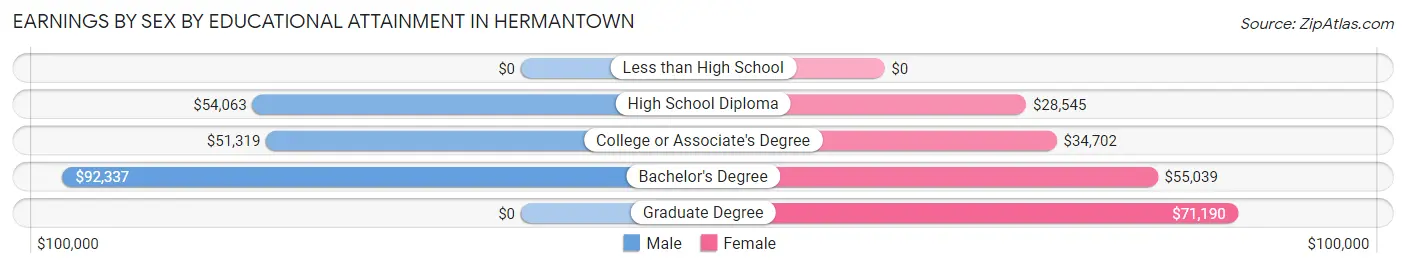
| Educational Attainment | Male Income | Female Income |
| Less than High School | - | - |
| High School Diploma | $54,063 | $28,545 |
| College or Associate's Degree | $51,319 | $34,702 |
| Bachelor's Degree | $92,337 | $55,039 |
| Graduate Degree | - | - |
| Total | $70,815 | $46,698 |
Family Income in Hermantown
Family Income Brackets in Hermantown
According to the Hermantown family income data, there are 550 families falling into the $100,000 to $149,999 income range, which is the most common income bracket and makes up 19.9% of all families. Conversely, the $15,000 to $24,999 income bracket is the least frequent group with only 14 families (0.5%) belonging to this category.
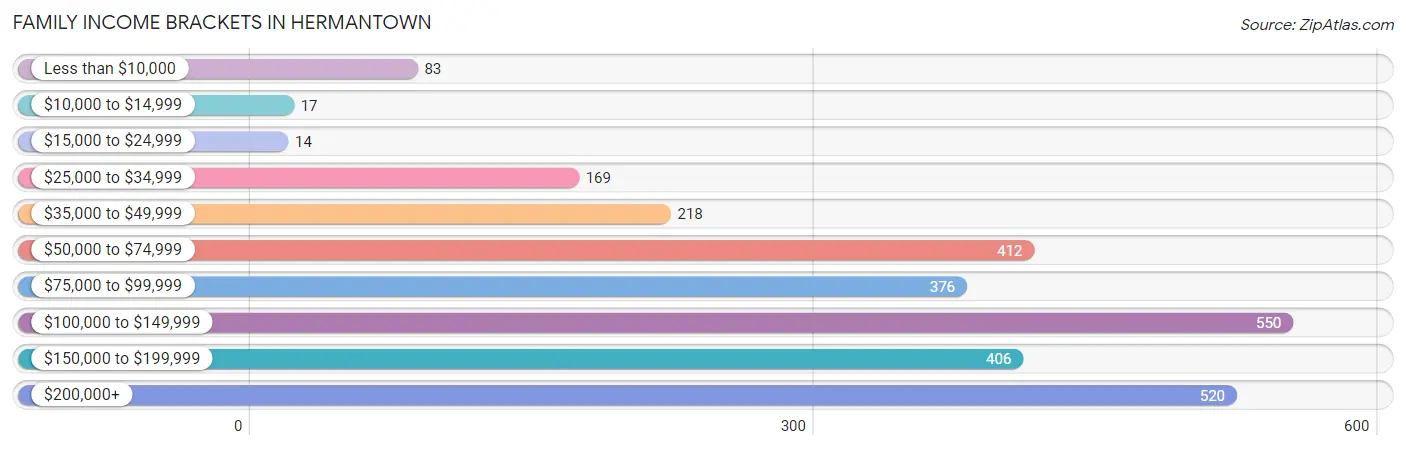
| Income Bracket | # Families | % Families |
| Less than $10,000 | 83 | 3.0% |
| $10,000 to $14,999 | 17 | 0.6% |
| $15,000 to $24,999 | 14 | 0.5% |
| $25,000 to $34,999 | 169 | 6.1% |
| $35,000 to $49,999 | 218 | 7.9% |
| $50,000 to $74,999 | 412 | 14.9% |
| $75,000 to $99,999 | 376 | 13.6% |
| $100,000 to $149,999 | 550 | 19.9% |
| $150,000 to $199,999 | 406 | 14.7% |
| $200,000+ | 520 | 18.8% |
Family Income by Famaliy Size in Hermantown
5-person families (290 | 10.5%) account for the highest median family income in Hermantown with $230,667 per family, while 5-person families (290 | 10.5%) have the highest median income of $46,133 per family member.
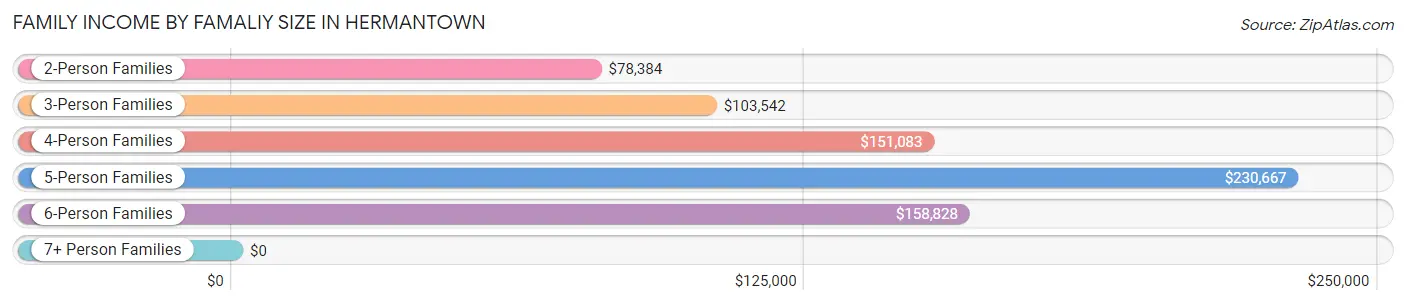
| Income Bracket | # Families | Median Income |
| 2-Person Families | 1,314 (47.5%) | $78,384 |
| 3-Person Families | 558 (20.2%) | $103,542 |
| 4-Person Families | 579 (20.9%) | $151,083 |
| 5-Person Families | 290 (10.5%) | $230,667 |
| 6-Person Families | 23 (0.8%) | $158,828 |
| 7+ Person Families | 0 (0.0%) | $0 |
| Total | 2,764 (100.0%) | $102,350 |
Family Income by Number of Earners in Hermantown
The median family income in Hermantown is $102,350, with families comprising 3+ earners (299) having the highest median family income of $158,185, while families with 1 earner (857) have the lowest median family income of $60,293, accounting for 10.8% and 31.0% of families, respectively.
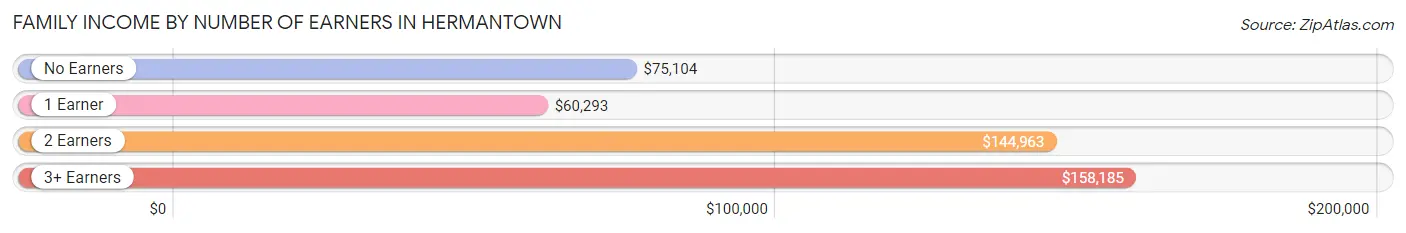
| Number of Earners | # Families | Median Income |
| No Earners | 417 (15.1%) | $75,104 |
| 1 Earner | 857 (31.0%) | $60,293 |
| 2 Earners | 1,191 (43.1%) | $144,963 |
| 3+ Earners | 299 (10.8%) | $158,185 |
| Total | 2,764 (100.0%) | $102,350 |
Household Income in Hermantown
Household Income Brackets in Hermantown
With 703 households falling in the category, the $100,000 to $149,999 income range is the most frequent in Hermantown, accounting for 18.8% of all households. In contrast, only 26 households (0.7%) fall into the $10,000 to $14,999 income bracket, making it the least populous group.
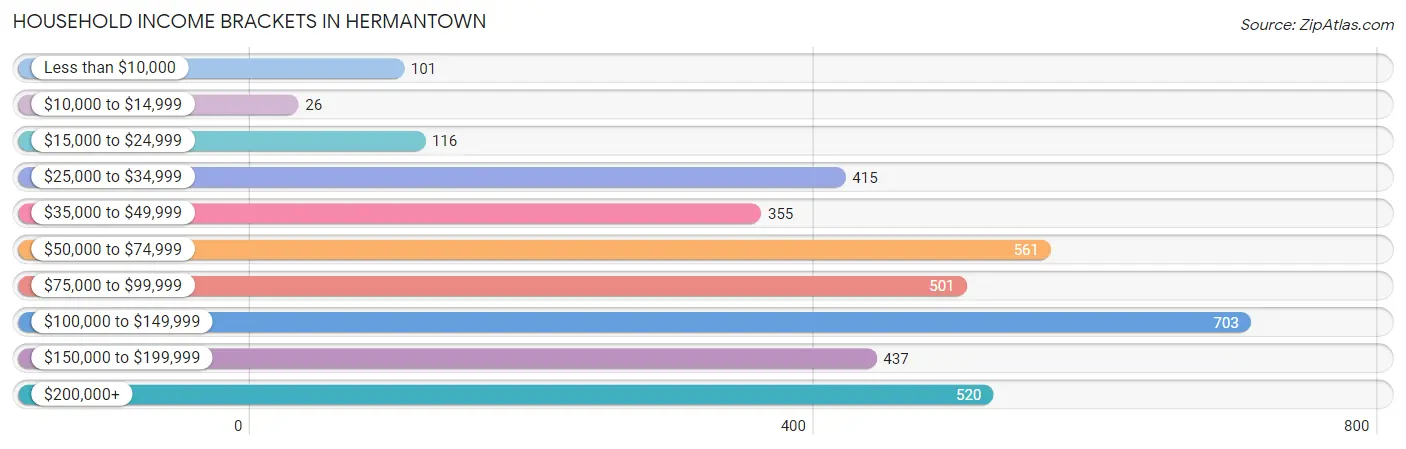
| Income Bracket | # Households | % Households |
| Less than $10,000 | 101 | 2.7% |
| $10,000 to $14,999 | 26 | 0.7% |
| $15,000 to $24,999 | 116 | 3.1% |
| $25,000 to $34,999 | 415 | 11.1% |
| $35,000 to $49,999 | 355 | 9.5% |
| $50,000 to $74,999 | 561 | 15.0% |
| $75,000 to $99,999 | 501 | 13.4% |
| $100,000 to $149,999 | 703 | 18.8% |
| $150,000 to $199,999 | 437 | 11.7% |
| $200,000+ | 520 | 13.9% |
Household Income by Householder Age in Hermantown
The median household income in Hermantown is $85,417, with the highest median household income of $116,583 found in the 45 to 64 years age bracket for the primary householder. A total of 1,291 households (34.5%) fall into this category. Meanwhile, the 15 to 24 years age bracket for the primary householder has the lowest median household income of $31,311, with 280 households (7.5%) in this group.
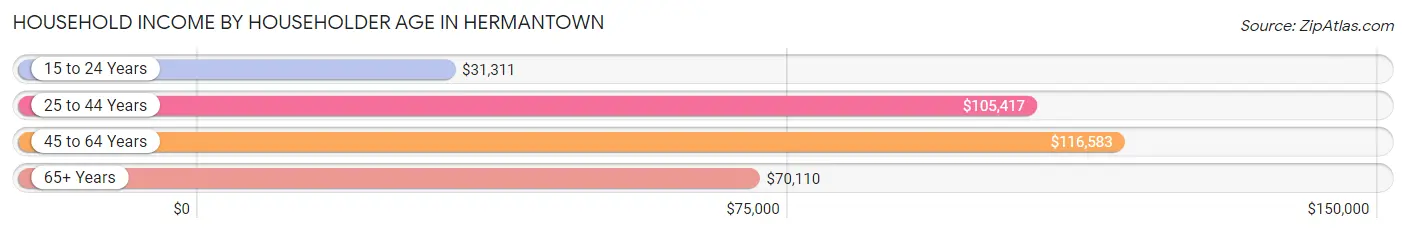
| Income Bracket | # Households | Median Income |
| 15 to 24 Years | 280 (7.5%) | $31,311 |
| 25 to 44 Years | 1,272 (34.0%) | $105,417 |
| 45 to 64 Years | 1,291 (34.5%) | $116,583 |
| 65+ Years | 895 (23.9%) | $70,110 |
| Total | 3,738 (100.0%) | $85,417 |
Poverty in Hermantown
Income Below Poverty by Sex and Age in Hermantown
With 5.0% poverty level for males and 5.1% for females among the residents of Hermantown, under 5 year old males and 25 to 34 year old females are the most vulnerable to poverty, with 48 males (14.9%) and 125 females (23.3%) in their respective age groups living below the poverty level.
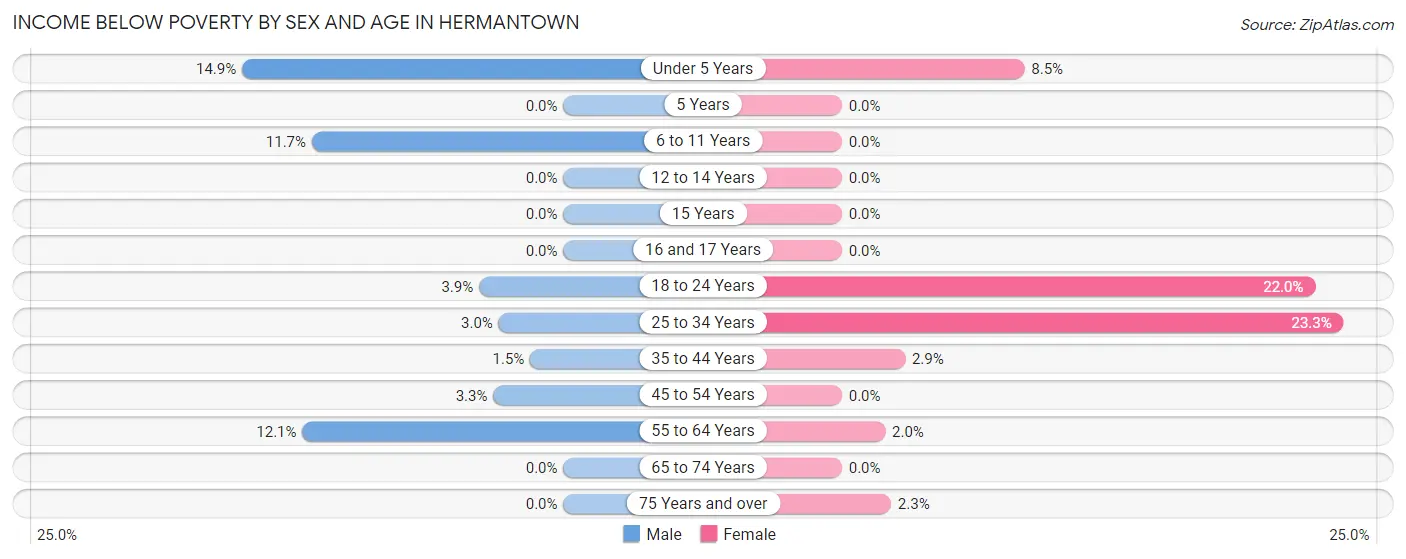
| Age Bracket | Male | Female |
| Under 5 Years | 48 (14.9%) | 25 (8.5%) |
| 5 Years | 0 (0.0%) | 0 (0.0%) |
| 6 to 11 Years | 67 (11.7%) | 0 (0.0%) |
| 12 to 14 Years | 0 (0.0%) | 0 (0.0%) |
| 15 Years | 0 (0.0%) | 0 (0.0%) |
| 16 and 17 Years | 0 (0.0%) | 0 (0.0%) |
| 18 to 24 Years | 18 (3.9%) | 58 (22.0%) |
| 25 to 34 Years | 13 (3.0%) | 125 (23.3%) |
| 35 to 44 Years | 13 (1.5%) | 23 (2.9%) |
| 45 to 54 Years | 16 (3.3%) | 0 (0.0%) |
| 55 to 64 Years | 62 (12.1%) | 10 (2.0%) |
| 65 to 74 Years | 0 (0.0%) | 0 (0.0%) |
| 75 Years and over | 0 (0.0%) | 10 (2.3%) |
| Total | 237 (5.0%) | 251 (5.1%) |
Income Above Poverty by Sex and Age in Hermantown
According to the poverty statistics in Hermantown, males aged 5 years and females aged 5 years are the age groups that are most secure financially, with 100.0% of males and 100.0% of females in these age groups living above the poverty line.
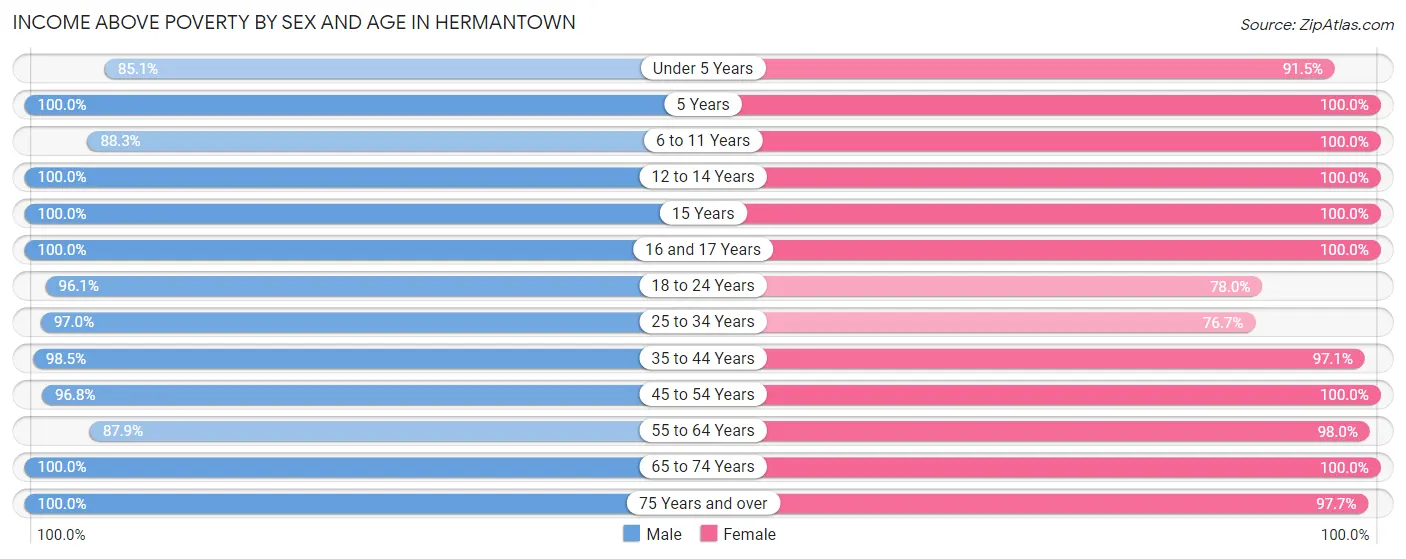
| Age Bracket | Male | Female |
| Under 5 Years | 274 (85.1%) | 270 (91.5%) |
| 5 Years | 38 (100.0%) | 146 (100.0%) |
| 6 to 11 Years | 507 (88.3%) | 535 (100.0%) |
| 12 to 14 Years | 147 (100.0%) | 289 (100.0%) |
| 15 Years | 46 (100.0%) | 31 (100.0%) |
| 16 and 17 Years | 217 (100.0%) | 99 (100.0%) |
| 18 to 24 Years | 442 (96.1%) | 206 (78.0%) |
| 25 to 34 Years | 421 (97.0%) | 412 (76.7%) |
| 35 to 44 Years | 830 (98.5%) | 763 (97.1%) |
| 45 to 54 Years | 477 (96.8%) | 592 (100.0%) |
| 55 to 64 Years | 450 (87.9%) | 488 (98.0%) |
| 65 to 74 Years | 386 (100.0%) | 400 (100.0%) |
| 75 Years and over | 283 (100.0%) | 428 (97.7%) |
| Total | 4,518 (95.0%) | 4,659 (94.9%) |
Income Below Poverty Among Married-Couple Families in Hermantown
The poverty statistics for married-couple families in Hermantown show that 0.5% or 10 of the total 2,119 families live below the poverty line. Families with no children have the highest poverty rate of 0.9%, comprising of 10 families. On the other hand, families with 1 or 2 children have the lowest poverty rate of 0.0%, which includes 0 families.
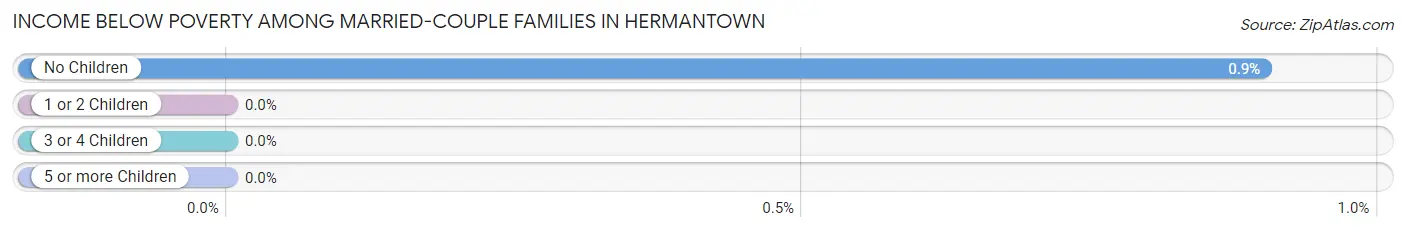
| Children | Above Poverty | Below Poverty |
| No Children | 1,099 (99.1%) | 10 (0.9%) |
| 1 or 2 Children | 774 (100.0%) | 0 (0.0%) |
| 3 or 4 Children | 236 (100.0%) | 0 (0.0%) |
| 5 or more Children | 0 (0.0%) | 0 (0.0%) |
| Total | 2,109 (99.5%) | 10 (0.5%) |
Income Below Poverty Among Single-Parent Households in Hermantown
According to the poverty data in Hermantown, 10.3% or 21 single-father households and 18.6% or 82 single-mother households are living below the poverty line. Among single-father households, those with 1 or 2 children have the highest poverty rate, with 15 households (11.0%) experiencing poverty. Likewise, among single-mother households, those with 1 or 2 children have the highest poverty rate, with 82 households (26.5%) falling below the poverty line.
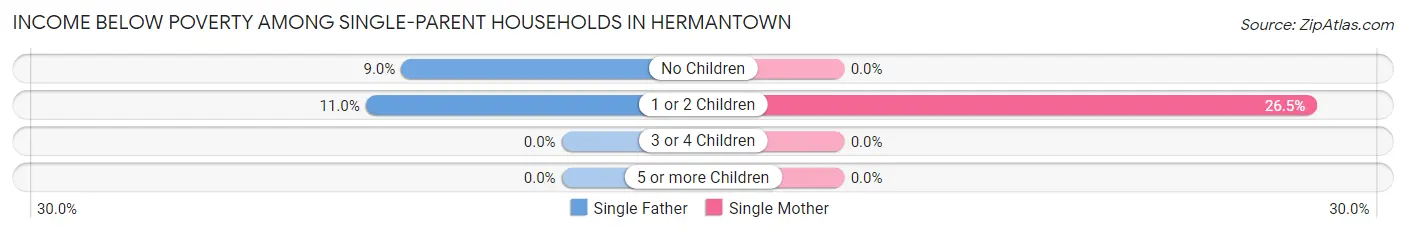
| Children | Single Father | Single Mother |
| No Children | 6 (9.0%) | 0 (0.0%) |
| 1 or 2 Children | 15 (11.0%) | 82 (26.5%) |
| 3 or 4 Children | 0 (0.0%) | 0 (0.0%) |
| 5 or more Children | 0 (0.0%) | 0 (0.0%) |
| Total | 21 (10.3%) | 82 (18.6%) |
Income Below Poverty Among Married-Couple vs Single-Parent Households in Hermantown
The poverty data for Hermantown shows that 10 of the married-couple family households (0.5%) and 103 of the single-parent households (16.0%) are living below the poverty level. Within the married-couple family households, those with no children have the highest poverty rate, with 10 households (0.9%) falling below the poverty line. Among the single-parent households, those with 1 or 2 children have the highest poverty rate, with 97 household (21.7%) living below poverty.
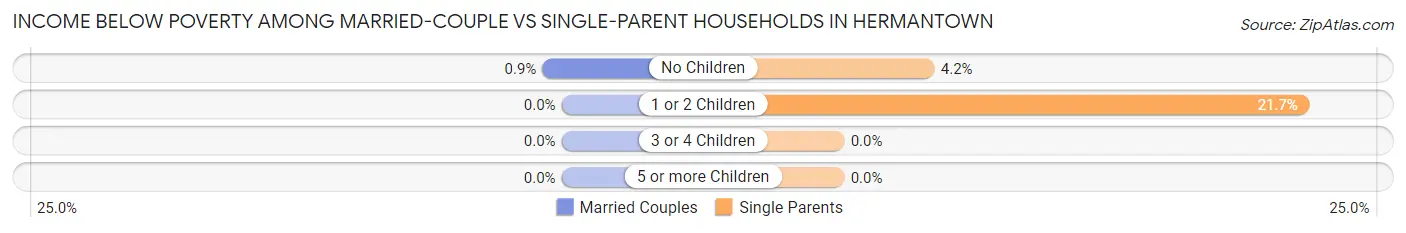
| Children | Married-Couple Families | Single-Parent Households |
| No Children | 10 (0.9%) | 6 (4.2%) |
| 1 or 2 Children | 0 (0.0%) | 97 (21.7%) |
| 3 or 4 Children | 0 (0.0%) | 0 (0.0%) |
| 5 or more Children | 0 (0.0%) | 0 (0.0%) |
| Total | 10 (0.5%) | 103 (16.0%) |
Race in Hermantown
The most populous races in Hermantown are White / Caucasian (8,964 | 88.4%), Two or more Races (666 | 6.6%), and Black / African American (276 | 2.7%).
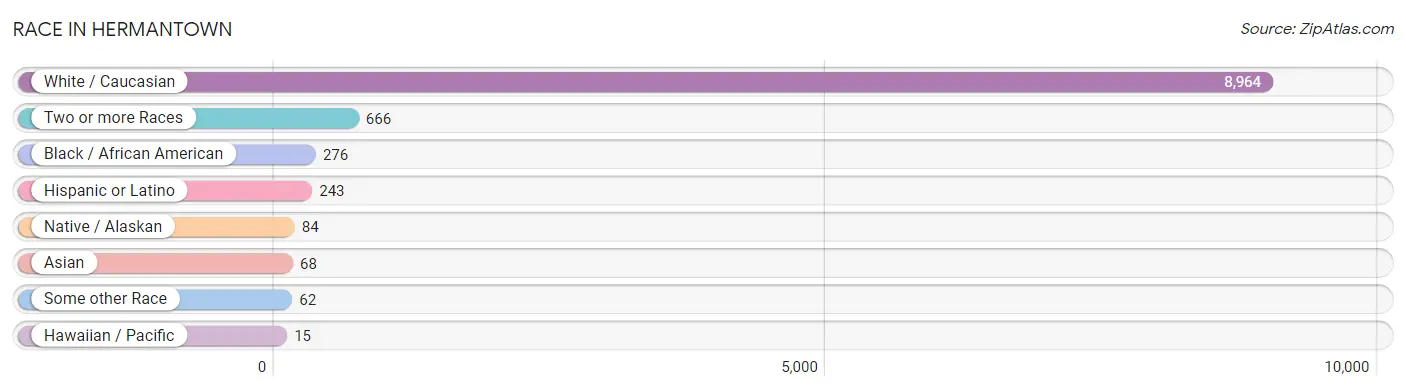
| Race | # Population | % Population |
| Asian | 68 | 0.7% |
| Black / African American | 276 | 2.7% |
| Hawaiian / Pacific | 15 | 0.2% |
| Hispanic or Latino | 243 | 2.4% |
| Native / Alaskan | 84 | 0.8% |
| White / Caucasian | 8,964 | 88.4% |
| Two or more Races | 666 | 6.6% |
| Some other Race | 62 | 0.6% |
| Total | 10,135 | 100.0% |
Ancestry in Hermantown
The most populous ancestries reported in Hermantown are German (2,373 | 23.4%), Norwegian (1,369 | 13.5%), Swedish (1,205 | 11.9%), English (720 | 7.1%), and European (687 | 6.8%), together accounting for 62.7% of all Hermantown residents.
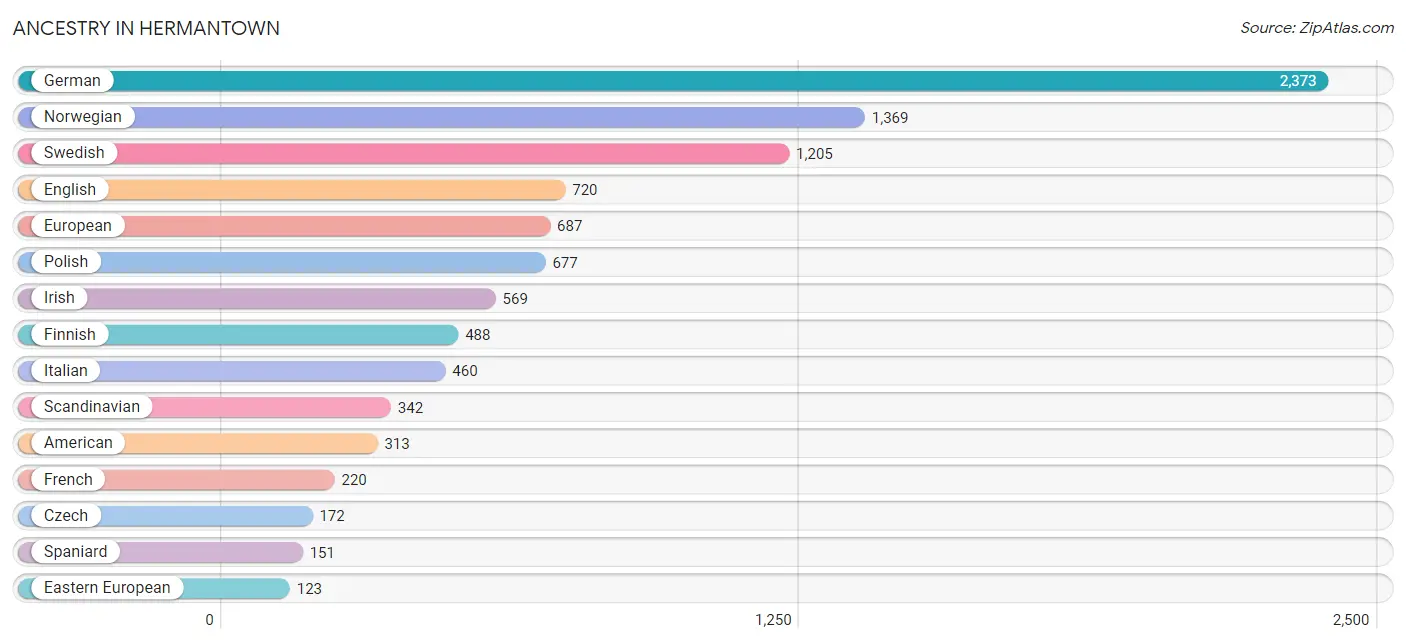
| Ancestry | # Population | % Population |
| American | 313 | 3.1% |
| Arab | 103 | 1.0% |
| Austrian | 52 | 0.5% |
| Belgian | 45 | 0.4% |
| Bhutanese | 25 | 0.3% |
| Burmese | 48 | 0.5% |
| Canadian | 10 | 0.1% |
| Cherokee | 35 | 0.4% |
| Croatian | 16 | 0.2% |
| Czech | 172 | 1.7% |
| Danish | 82 | 0.8% |
| Dutch | 35 | 0.4% |
| Eastern European | 123 | 1.2% |
| English | 720 | 7.1% |
| European | 687 | 6.8% |
| Finnish | 488 | 4.8% |
| French | 220 | 2.2% |
| French Canadian | 75 | 0.7% |
| German | 2,373 | 23.4% |
| Haitian | 83 | 0.8% |
| Irish | 569 | 5.6% |
| Iroquois | 6 | 0.1% |
| Italian | 460 | 4.5% |
| Korean | 98 | 1.0% |
| Lebanese | 95 | 0.9% |
| Mexican | 62 | 0.6% |
| Native Hawaiian | 15 | 0.2% |
| Nigerian | 10 | 0.1% |
| Norwegian | 1,369 | 13.5% |
| Ottawa | 14 | 0.1% |
| Palestinian | 8 | 0.1% |
| Pennsylvania German | 41 | 0.4% |
| Polish | 677 | 6.7% |
| Portuguese | 4 | 0.0% |
| Russian | 23 | 0.2% |
| Scandinavian | 342 | 3.4% |
| Scotch-Irish | 114 | 1.1% |
| Scottish | 109 | 1.1% |
| Serbian | 30 | 0.3% |
| Sioux | 17 | 0.2% |
| Slovene | 69 | 0.7% |
| Somali | 1 | 0.0% |
| Spaniard | 151 | 1.5% |
| Subsaharan African | 11 | 0.1% |
| Swedish | 1,205 | 11.9% |
| Swiss | 9 | 0.1% |
| Syrian | 65 | 0.6% |
| Thai | 63 | 0.6% |
| Welsh | 19 | 0.2% | View All 49 Rows |
Immigrants in Hermantown
The most numerous immigrant groups reported in Hermantown came from Europe (61 | 0.6%), Canada (58 | 0.6%), Germany (38 | 0.4%), Western Europe (38 | 0.4%), and Asia (34 | 0.3%), together accounting for 2.2% of all Hermantown residents.
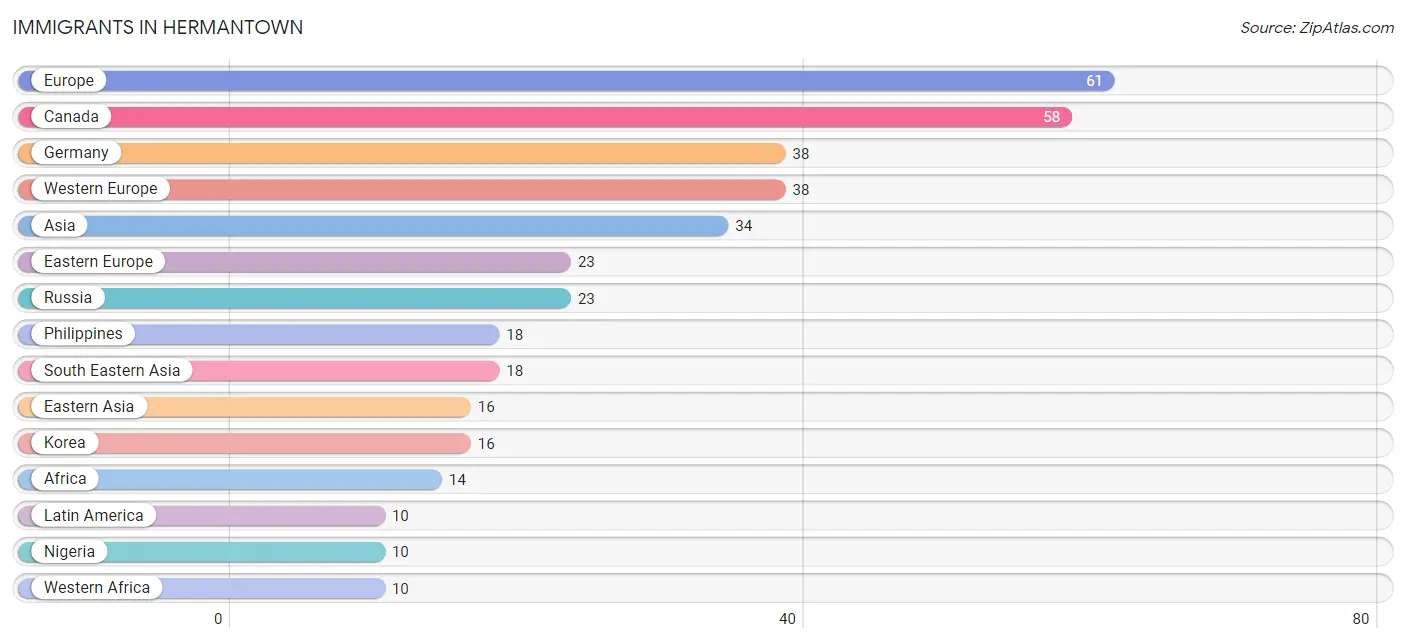
| Immigration Origin | # Population | % Population |
| Africa | 14 | 0.1% |
| Asia | 34 | 0.3% |
| Brazil | 6 | 0.1% |
| Canada | 58 | 0.6% |
| Caribbean | 1 | 0.0% |
| Central America | 3 | 0.0% |
| Eastern Asia | 16 | 0.2% |
| Eastern Europe | 23 | 0.2% |
| Europe | 61 | 0.6% |
| Germany | 38 | 0.4% |
| Haiti | 1 | 0.0% |
| Korea | 16 | 0.2% |
| Latin America | 10 | 0.1% |
| Mexico | 3 | 0.0% |
| Nigeria | 10 | 0.1% |
| Philippines | 18 | 0.2% |
| Russia | 23 | 0.2% |
| South Africa | 4 | 0.0% |
| South America | 6 | 0.1% |
| South Eastern Asia | 18 | 0.2% |
| Western Africa | 10 | 0.1% |
| Western Europe | 38 | 0.4% | View All 22 Rows |
Sex and Age in Hermantown
Sex and Age in Hermantown
The most populous age groups in Hermantown are 35 to 39 Years (562 | 10.9%) for men and 5 to 9 Years (626 | 12.6%) for women.
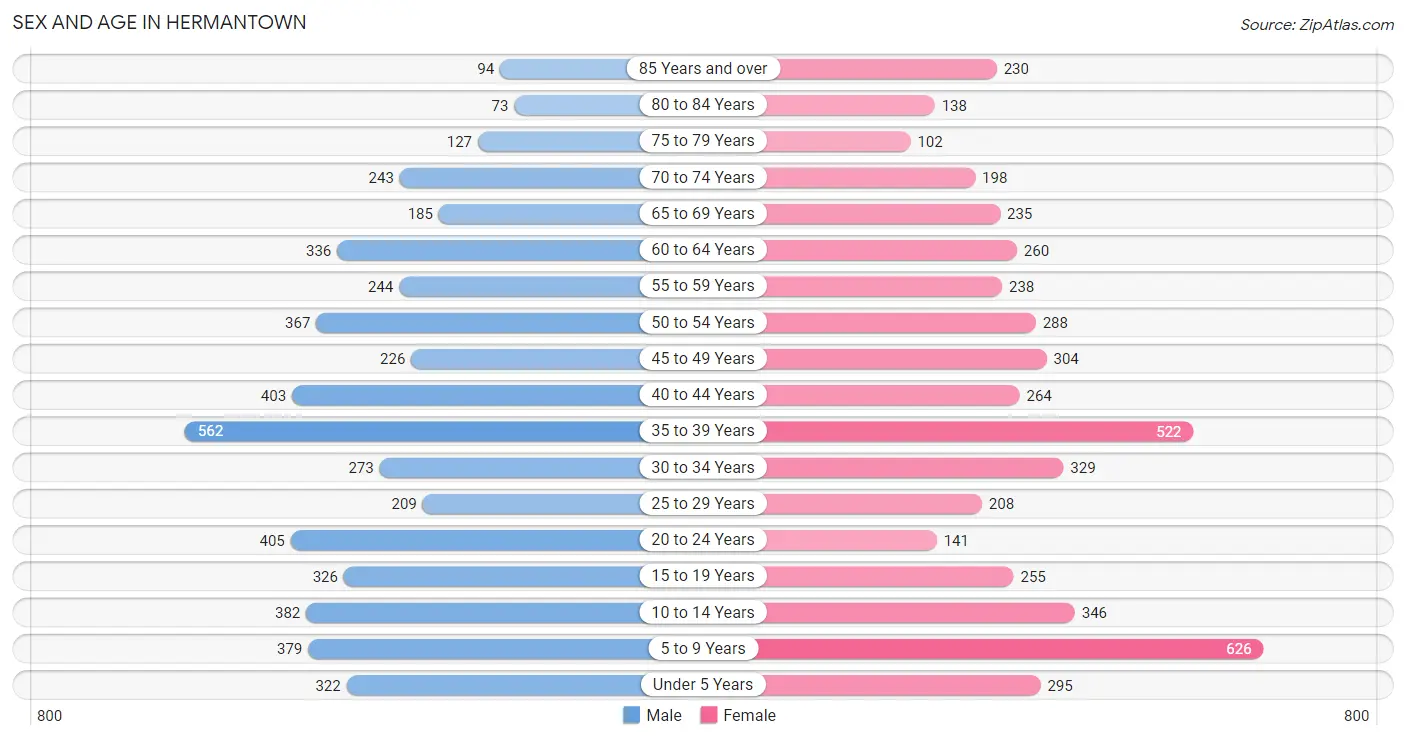
| Age Bracket | Male | Female |
| Under 5 Years | 322 (6.2%) | 295 (5.9%) |
| 5 to 9 Years | 379 (7.3%) | 626 (12.6%) |
| 10 to 14 Years | 382 (7.4%) | 346 (7.0%) |
| 15 to 19 Years | 326 (6.3%) | 255 (5.1%) |
| 20 to 24 Years | 405 (7.9%) | 141 (2.8%) |
| 25 to 29 Years | 209 (4.1%) | 208 (4.2%) |
| 30 to 34 Years | 273 (5.3%) | 329 (6.6%) |
| 35 to 39 Years | 562 (10.9%) | 522 (10.5%) |
| 40 to 44 Years | 403 (7.8%) | 264 (5.3%) |
| 45 to 49 Years | 226 (4.4%) | 304 (6.1%) |
| 50 to 54 Years | 367 (7.1%) | 288 (5.8%) |
| 55 to 59 Years | 244 (4.7%) | 238 (4.8%) |
| 60 to 64 Years | 336 (6.5%) | 260 (5.2%) |
| 65 to 69 Years | 185 (3.6%) | 235 (4.7%) |
| 70 to 74 Years | 243 (4.7%) | 198 (4.0%) |
| 75 to 79 Years | 127 (2.5%) | 102 (2.1%) |
| 80 to 84 Years | 73 (1.4%) | 138 (2.8%) |
| 85 Years and over | 94 (1.8%) | 230 (4.6%) |
| Total | 5,156 (100.0%) | 4,979 (100.0%) |
Families and Households in Hermantown
Median Family Size in Hermantown
The median family size in Hermantown is 2.98 persons per family, with married-couple families (2,119 | 76.7%) accounting for the largest median family size of 3.12 persons per family. On the other hand, single male/father families (204 | 7.4%) represent the smallest median family size with 2.19 persons per family.
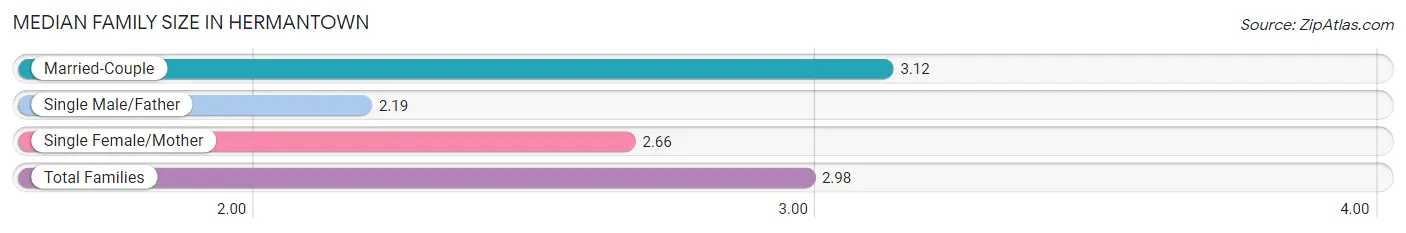
| Family Type | # Families | Family Size |
| Married-Couple | 2,119 (76.7%) | 3.12 |
| Single Male/Father | 204 (7.4%) | 2.19 |
| Single Female/Mother | 441 (16.0%) | 2.66 |
| Total Families | 2,764 (100.0%) | 2.98 |
Median Household Size in Hermantown
The median household size in Hermantown is 2.57 persons per household, with married-couple households (2,119 | 56.7%) accounting for the largest median household size of 3.12 persons per household. non-family households (974 | 26.1%) represent the smallest median household size with 1.24 persons per household.
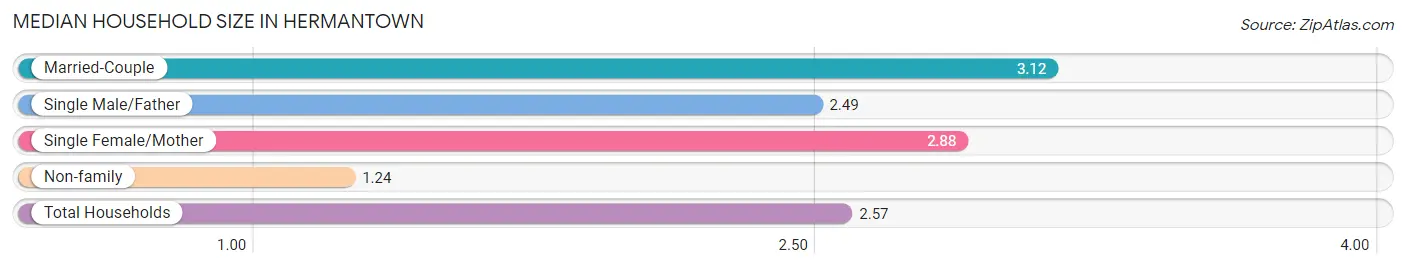
| Household Type | # Households | Household Size |
| Married-Couple | 2,119 (56.7%) | 3.12 |
| Single Male/Father | 204 (5.5%) | 2.49 |
| Single Female/Mother | 441 (11.8%) | 2.88 |
| Non-family | 974 (26.1%) | 1.24 |
| Total Households | 3,738 (100.0%) | 2.57 |
Household Size by Marriage Status in Hermantown
Out of a total of 3,738 households in Hermantown, 2,764 (73.9%) are family households, while 974 (26.1%) are nonfamily households. The most numerous type of family households are 2-person households, comprising 1,224, and the most common type of nonfamily households are 1-person households, comprising 641.
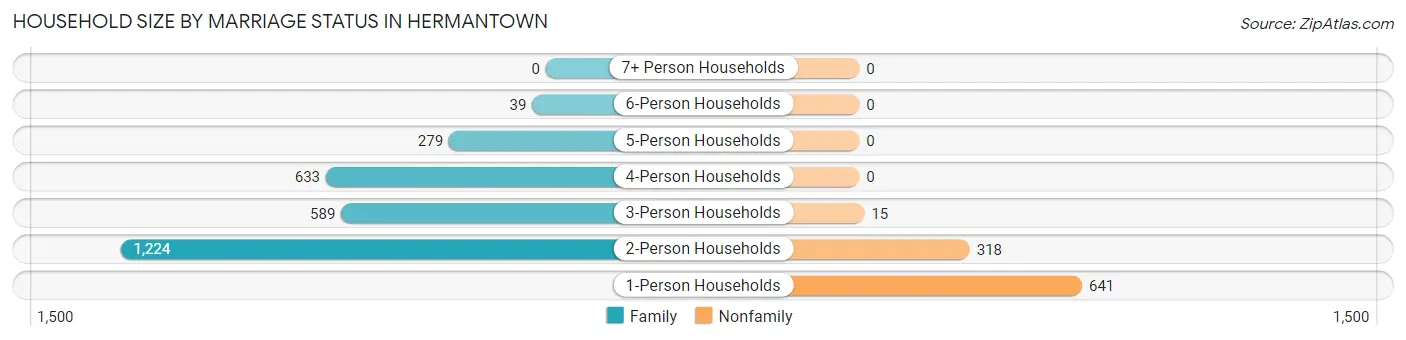
| Household Size | Family Households | Nonfamily Households |
| 1-Person Households | - | 641 (17.2%) |
| 2-Person Households | 1,224 (32.7%) | 318 (8.5%) |
| 3-Person Households | 589 (15.8%) | 15 (0.4%) |
| 4-Person Households | 633 (16.9%) | 0 (0.0%) |
| 5-Person Households | 279 (7.5%) | 0 (0.0%) |
| 6-Person Households | 39 (1.0%) | 0 (0.0%) |
| 7+ Person Households | 0 (0.0%) | 0 (0.0%) |
| Total | 2,764 (73.9%) | 974 (26.1%) |
Female Fertility in Hermantown
Fertility by Age in Hermantown
Average fertility rate in Hermantown is 39.0 births per 1,000 women. Women in the age bracket of 20 to 34 years have the highest fertility rate with 93.0 births per 1,000 women. Women in the age bracket of 20 to 34 years acount for 79.7% of all women with births.
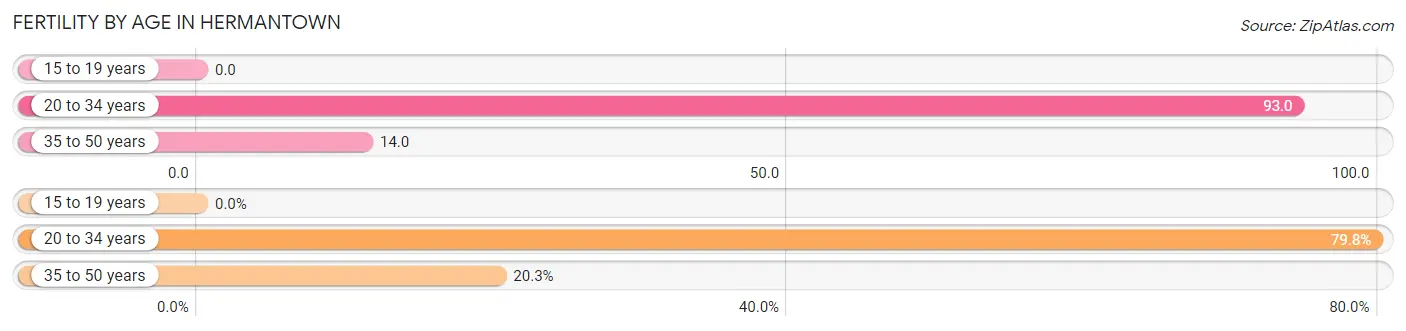
| Age Bracket | Women with Births | Births / 1,000 Women |
| 15 to 19 years | 0 (0.0%) | 0.0 |
| 20 to 34 years | 63 (79.7%) | 93.0 |
| 35 to 50 years | 16 (20.3%) | 14.0 |
| Total | 79 (100.0%) | 39.0 |
Fertility by Age by Marriage Status in Hermantown
79.7% of women with births (79) in Hermantown are married. The highest percentage of unmarried women with births falls into 35 to 50 years age bracket with 100.0% of them unmarried at the time of birth, while the lowest percentage of unmarried women with births belong to 20 to 34 years age bracket with 0.0% of them unmarried.
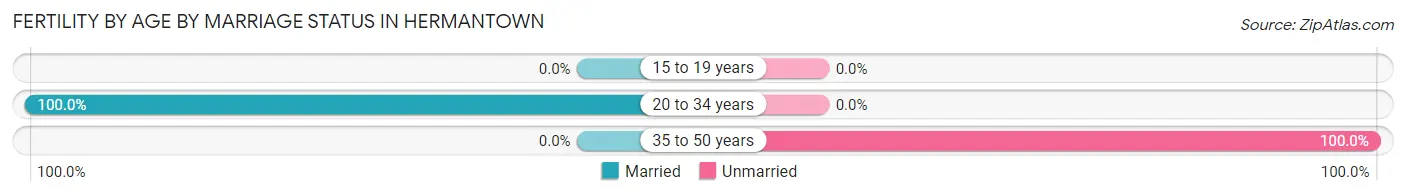
| Age Bracket | Married | Unmarried |
| 15 to 19 years | 0 (0.0%) | 0 (0.0%) |
| 20 to 34 years | 63 (100.0%) | 0 (0.0%) |
| 35 to 50 years | 0 (0.0%) | 16 (100.0%) |
| Total | 63 (79.7%) | 16 (20.3%) |
Fertility by Education in Hermantown
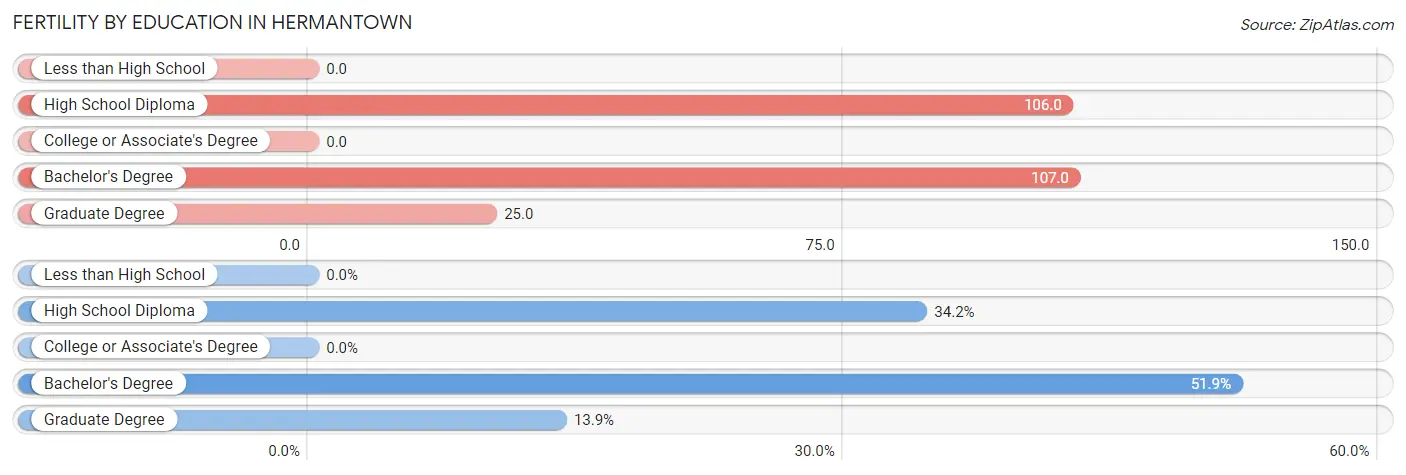
| Educational Attainment | Women with Births | Births / 1,000 Women |
| Less than High School | 0 (0.0%) | 0.0 |
| High School Diploma | 27 (34.2%) | 106.0 |
| College or Associate's Degree | 0 (0.0%) | 0.0 |
| Bachelor's Degree | 41 (51.9%) | 107.0 |
| Graduate Degree | 11 (13.9%) | 25.0 |
| Total | 79 (100.0%) | 39.0 |
Fertility by Education by Marriage Status in Hermantown
20.3% of women with births in Hermantown are unmarried. Women with the educational attainment of high school diploma are most likely to be married with 100.0% of them married at childbirth, while women with the educational attainment of bachelor's degree are least likely to be married with 39.0% of them unmarried at childbirth.
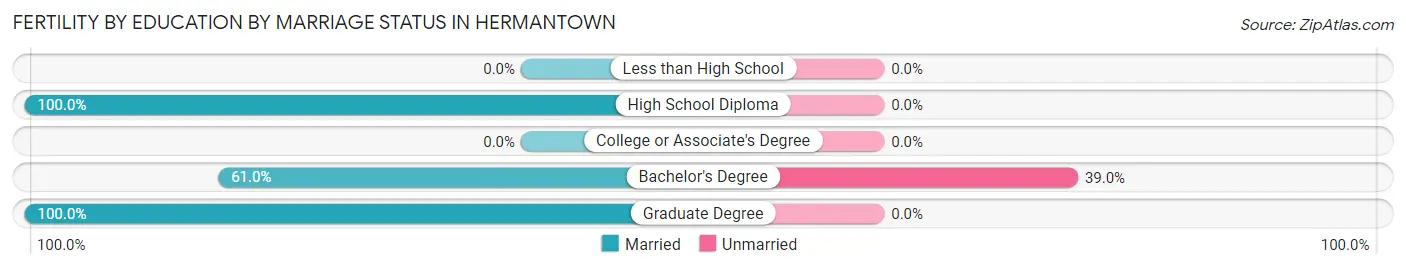
| Educational Attainment | Married | Unmarried |
| Less than High School | 0 (0.0%) | 0 (0.0%) |
| High School Diploma | 27 (100.0%) | 0 (0.0%) |
| College or Associate's Degree | 0 (0.0%) | 0 (0.0%) |
| Bachelor's Degree | 25 (61.0%) | 16 (39.0%) |
| Graduate Degree | 11 (100.0%) | 0 (0.0%) |
| Total | 63 (79.7%) | 16 (20.3%) |
Employment Characteristics in Hermantown
Employment by Class of Employer in Hermantown
Among the 4,916 employed individuals in Hermantown, private company employees (2,933 | 59.7%), not-for-profit organizations (920 | 18.7%), and state government employees (323 | 6.6%) make up the most common classes of employment.
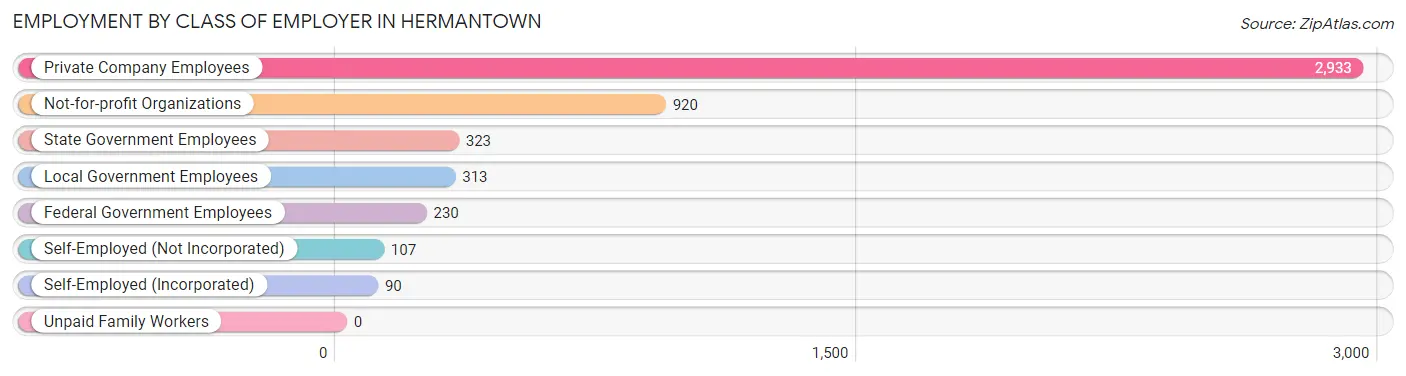
| Employer Class | # Employees | % Employees |
| Private Company Employees | 2,933 | 59.7% |
| Self-Employed (Incorporated) | 90 | 1.8% |
| Self-Employed (Not Incorporated) | 107 | 2.2% |
| Not-for-profit Organizations | 920 | 18.7% |
| Local Government Employees | 313 | 6.4% |
| State Government Employees | 323 | 6.6% |
| Federal Government Employees | 230 | 4.7% |
| Unpaid Family Workers | 0 | 0.0% |
| Total | 4,916 | 100.0% |
Employment Status by Age in Hermantown
According to the labor force statistics for Hermantown, out of the total population over 16 years of age (7,708), 65.4% or 5,041 individuals are in the labor force, with 1.8% or 91 of them unemployed. The age group with the highest labor force participation rate is 30 to 34 years, with 93.0% or 560 individuals in the labor force. Within the labor force, the 30 to 34 years age range has the highest percentage of unemployed individuals, with 8.8% or 49 of them being unemployed.
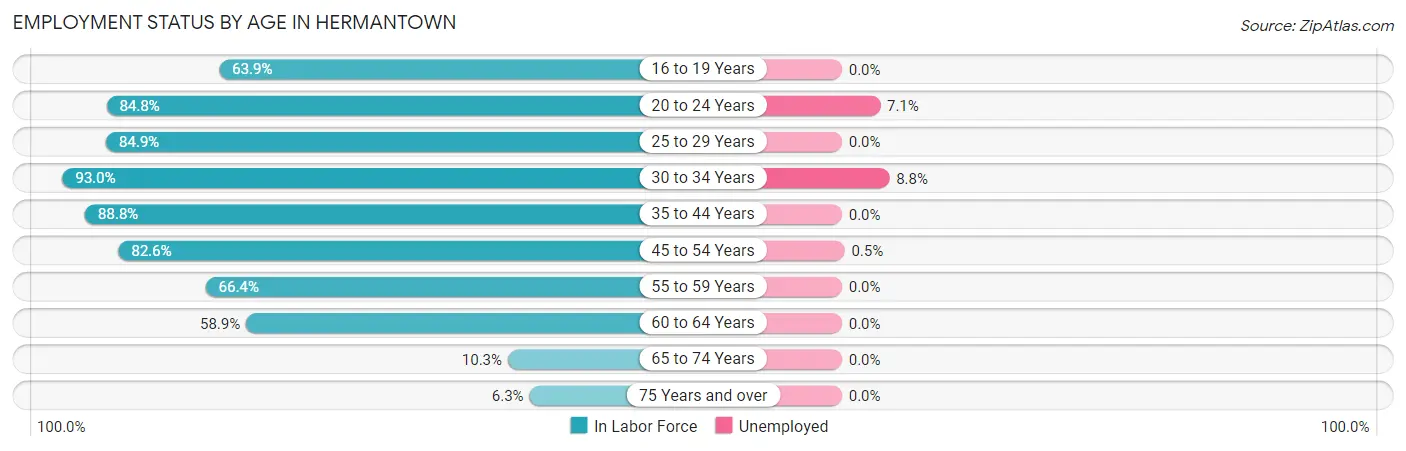
| Age Bracket | In Labor Force | Unemployed |
| 16 to 19 Years | 322 (63.9%) | 0 (0.0%) |
| 20 to 24 Years | 463 (84.8%) | 33 (7.1%) |
| 25 to 29 Years | 354 (84.9%) | 0 (0.0%) |
| 30 to 34 Years | 560 (93.0%) | 49 (8.8%) |
| 35 to 44 Years | 1,555 (88.8%) | 0 (0.0%) |
| 45 to 54 Years | 979 (82.6%) | 5 (0.5%) |
| 55 to 59 Years | 320 (66.4%) | 0 (0.0%) |
| 60 to 64 Years | 351 (58.9%) | 0 (0.0%) |
| 65 to 74 Years | 89 (10.3%) | 0 (0.0%) |
| 75 Years and over | 48 (6.3%) | 0 (0.0%) |
| Total | 5,041 (65.4%) | 91 (1.8%) |
Employment Status by Educational Attainment in Hermantown
According to labor force statistics for Hermantown, 81.8% of individuals (4,117) out of the total population between 25 and 64 years of age (5,033) are in the labor force, with 1.3% or 54 of them being unemployed. The group with the highest labor force participation rate are those with the educational attainment of bachelor's degree or higher, with 93.6% or 2,101 individuals in the labor force. Within the labor force, individuals with college / associate degree education have the highest percentage of unemployment, with 3.3% or 52 of them being unemployed.
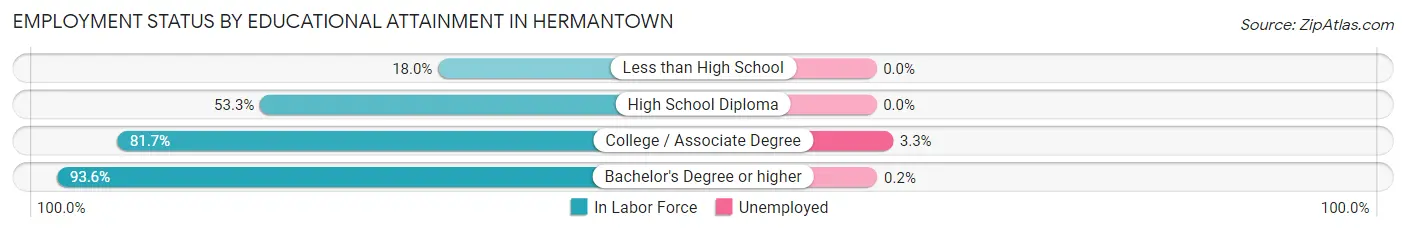
| Educational Attainment | In Labor Force | Unemployed |
| Less than High School | 9 (18.0%) | 0 (0.0%) |
| High School Diploma | 430 (53.3%) | 0 (0.0%) |
| College / Associate Degree | 1,578 (81.7%) | 64 (3.3%) |
| Bachelor's Degree or higher | 2,101 (93.6%) | 4 (0.2%) |
| Total | 4,117 (81.8%) | 65 (1.3%) |
Employment Occupations by Sex in Hermantown
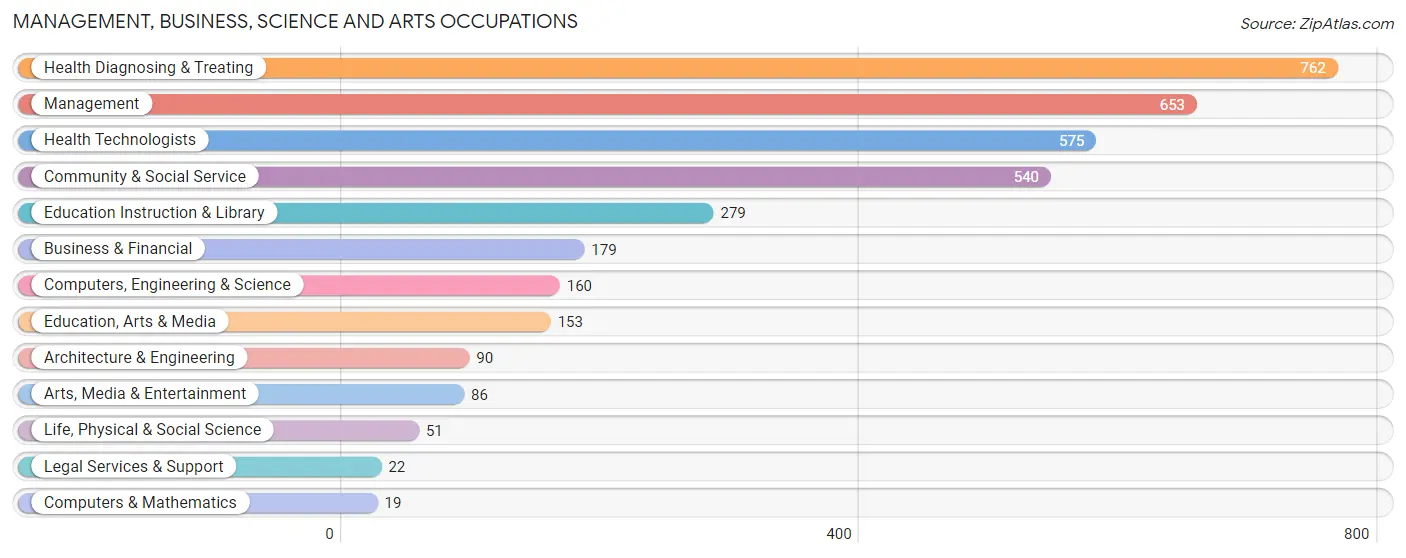
Management, Business, Science and Arts Occupations
The most common Management, Business, Science and Arts occupations in Hermantown are Health Diagnosing & Treating (762 | 15.7%), Management (653 | 13.5%), Health Technologists (575 | 11.8%), Community & Social Service (540 | 11.1%), and Education Instruction & Library (279 | 5.8%).
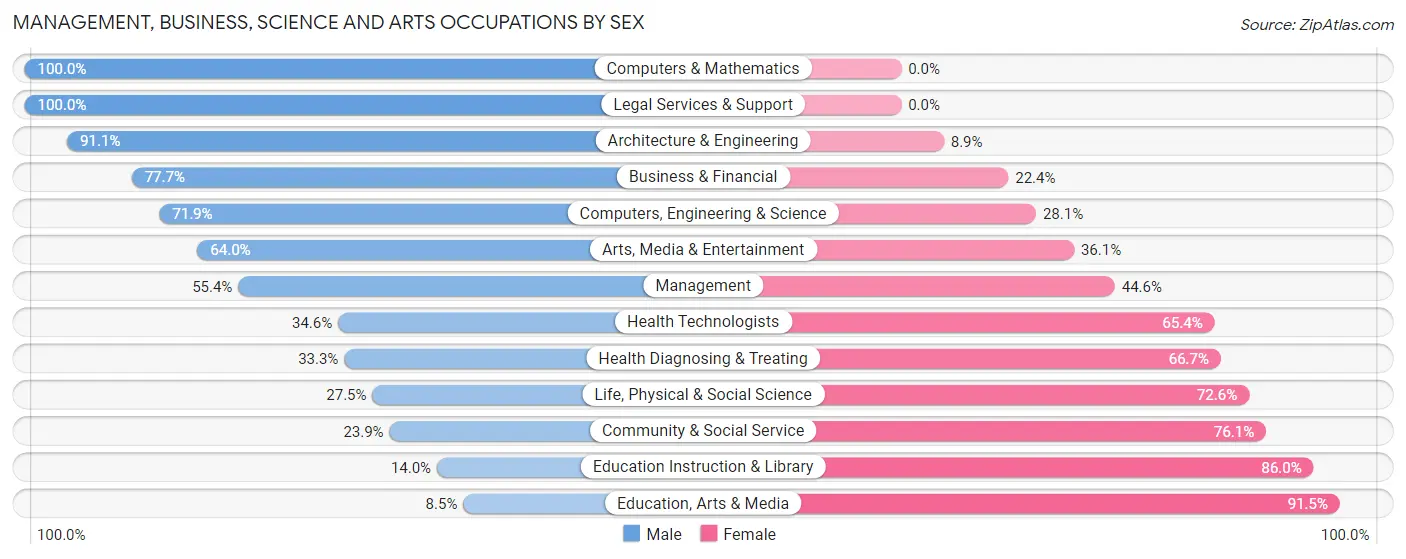
Management, Business, Science and Arts Occupations by Sex
Within the Management, Business, Science and Arts occupations in Hermantown, the most male-oriented occupations are Computers & Mathematics (100.0%), Legal Services & Support (100.0%), and Architecture & Engineering (91.1%), while the most female-oriented occupations are Education, Arts & Media (91.5%), Education Instruction & Library (86.0%), and Community & Social Service (76.1%).
| Occupation | Male | Female |
| Management | 362 (55.4%) | 291 (44.6%) |
| Business & Financial | 139 (77.6%) | 40 (22.4%) |
| Computers, Engineering & Science | 115 (71.9%) | 45 (28.1%) |
| Computers & Mathematics | 19 (100.0%) | 0 (0.0%) |
| Architecture & Engineering | 82 (91.1%) | 8 (8.9%) |
| Life, Physical & Social Science | 14 (27.5%) | 37 (72.6%) |
| Community & Social Service | 129 (23.9%) | 411 (76.1%) |
| Education, Arts & Media | 13 (8.5%) | 140 (91.5%) |
| Legal Services & Support | 22 (100.0%) | 0 (0.0%) |
| Education Instruction & Library | 39 (14.0%) | 240 (86.0%) |
| Arts, Media & Entertainment | 55 (63.9%) | 31 (36.0%) |
| Health Diagnosing & Treating | 254 (33.3%) | 508 (66.7%) |
| Health Technologists | 199 (34.6%) | 376 (65.4%) |
| Total (Category) | 999 (43.5%) | 1,295 (56.5%) |
| Total (Overall) | 2,597 (53.5%) | 2,259 (46.5%) |
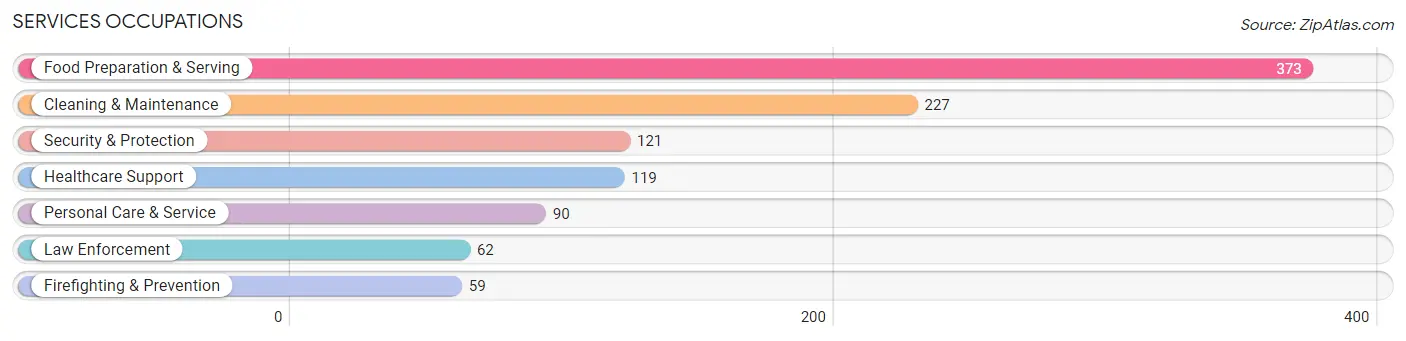
Services Occupations
The most common Services occupations in Hermantown are Food Preparation & Serving (373 | 7.7%), Cleaning & Maintenance (227 | 4.7%), Security & Protection (121 | 2.5%), Healthcare Support (119 | 2.5%), and Personal Care & Service (90 | 1.8%).
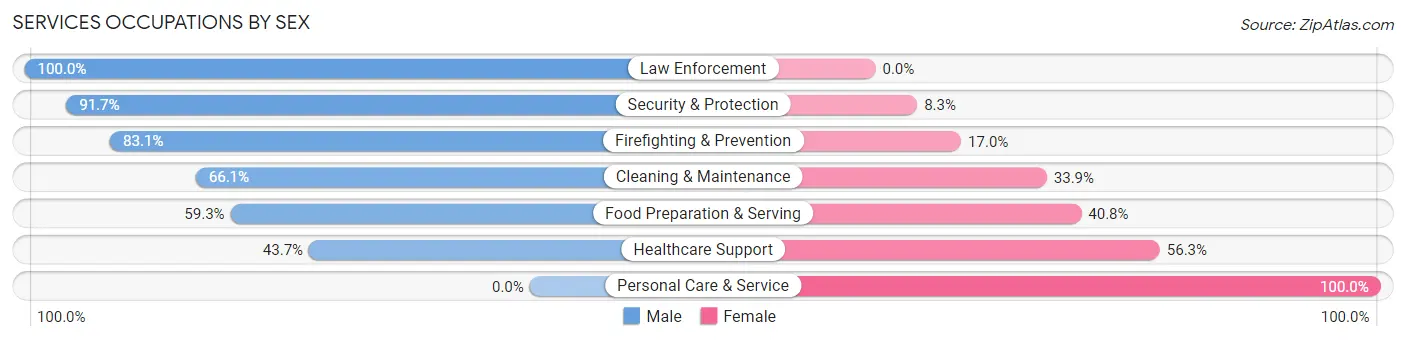
Services Occupations by Sex
Within the Services occupations in Hermantown, the most male-oriented occupations are Law Enforcement (100.0%), Security & Protection (91.7%), and Firefighting & Prevention (83.1%), while the most female-oriented occupations are Personal Care & Service (100.0%), Healthcare Support (56.3%), and Food Preparation & Serving (40.7%).
| Occupation | Male | Female |
| Healthcare Support | 52 (43.7%) | 67 (56.3%) |
| Security & Protection | 111 (91.7%) | 10 (8.3%) |
| Firefighting & Prevention | 49 (83.1%) | 10 (17.0%) |
| Law Enforcement | 62 (100.0%) | 0 (0.0%) |
| Food Preparation & Serving | 221 (59.3%) | 152 (40.7%) |
| Cleaning & Maintenance | 150 (66.1%) | 77 (33.9%) |
| Personal Care & Service | 0 (0.0%) | 90 (100.0%) |
| Total (Category) | 534 (57.4%) | 396 (42.6%) |
| Total (Overall) | 2,597 (53.5%) | 2,259 (46.5%) |
Sales and Office Occupations
The most common Sales and Office occupations in Hermantown are Sales & Related (616 | 12.7%), and Office & Administration (435 | 9.0%).
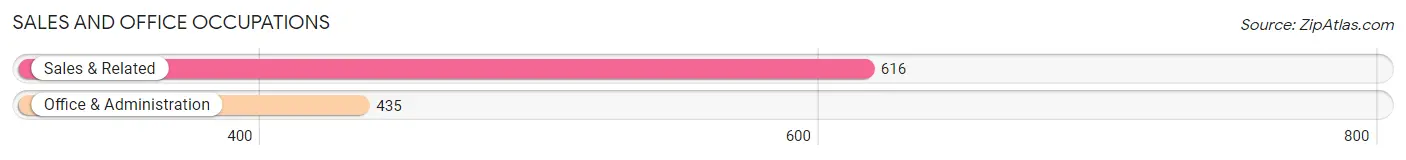
Sales and Office Occupations by Sex
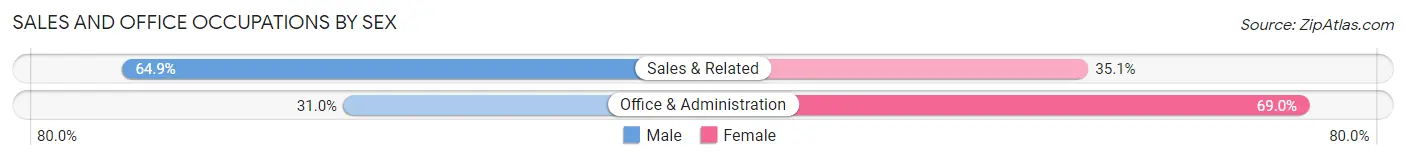
| Occupation | Male | Female |
| Sales & Related | 400 (64.9%) | 216 (35.1%) |
| Office & Administration | 135 (31.0%) | 300 (69.0%) |
| Total (Category) | 535 (50.9%) | 516 (49.1%) |
| Total (Overall) | 2,597 (53.5%) | 2,259 (46.5%) |
Natural Resources, Construction and Maintenance Occupations
The most common Natural Resources, Construction and Maintenance occupations in Hermantown are Construction & Extraction (208 | 4.3%), and Installation, Maintenance & Repair (88 | 1.8%).
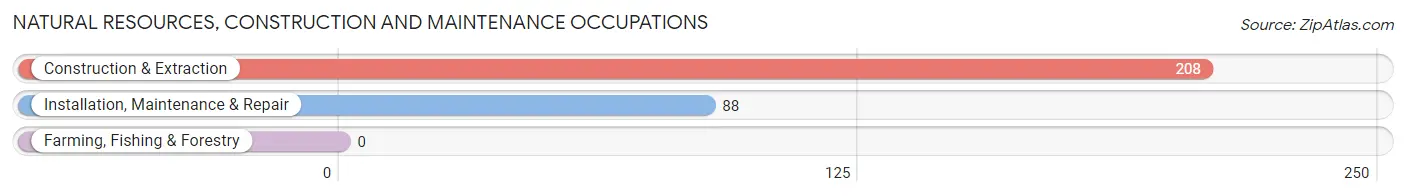
Natural Resources, Construction and Maintenance Occupations by Sex
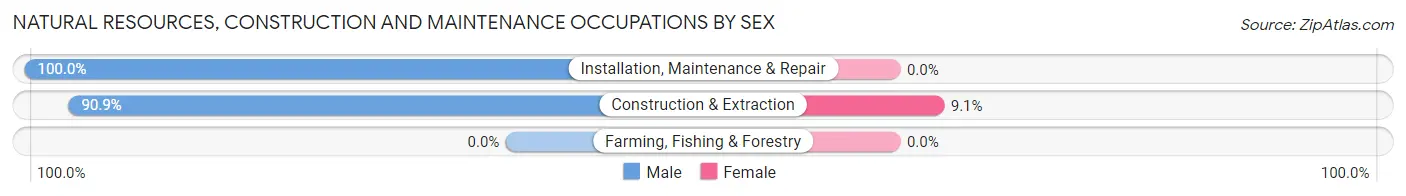
| Occupation | Male | Female |
| Farming, Fishing & Forestry | 0 (0.0%) | 0 (0.0%) |
| Construction & Extraction | 189 (90.9%) | 19 (9.1%) |
| Installation, Maintenance & Repair | 88 (100.0%) | 0 (0.0%) |
| Total (Category) | 277 (93.6%) | 19 (6.4%) |
| Total (Overall) | 2,597 (53.5%) | 2,259 (46.5%) |
Production, Transportation and Moving Occupations
The most common Production, Transportation and Moving occupations in Hermantown are Transportation (173 | 3.6%), Production (92 | 1.9%), and Material Moving (20 | 0.4%).
Production, Transportation and Moving Occupations by Sex
| Occupation | Male | Female |
| Production | 67 (72.8%) | 25 (27.2%) |
| Transportation | 173 (100.0%) | 0 (0.0%) |
| Material Moving | 12 (60.0%) | 8 (40.0%) |
| Total (Category) | 252 (88.4%) | 33 (11.6%) |
| Total (Overall) | 2,597 (53.5%) | 2,259 (46.5%) |
Employment Industries by Sex in Hermantown
Employment Industries in Hermantown
The major employment industries in Hermantown include Health Care & Social Assistance (1,227 | 25.3%), Retail Trade (661 | 13.6%), Educational Services (429 | 8.8%), Accommodation & Food Services (372 | 7.7%), and Public Administration (355 | 7.3%).
Employment Industries by Sex in Hermantown
The Hermantown industries that see more men than women are Mining, Quarrying, & Extraction (100.0%), Transportation & Warehousing (100.0%), and Information (100.0%), whereas the industries that tend to have a higher number of women are Educational Services (79.2%), Health Care & Social Assistance (72.4%), and Finance & Insurance (55.0%).
| Industry | Male | Female |
| Agriculture, Fishing & Hunting | 0 (0.0%) | 0 (0.0%) |
| Mining, Quarrying, & Extraction | 15 (100.0%) | 0 (0.0%) |
| Construction | 241 (78.8%) | 65 (21.2%) |
| Manufacturing | 269 (96.4%) | 10 (3.6%) |
| Wholesale Trade | 51 (73.9%) | 18 (26.1%) |
| Retail Trade | 366 (55.4%) | 295 (44.6%) |
| Transportation & Warehousing | 295 (100.0%) | 0 (0.0%) |
| Utilities | 104 (82.5%) | 22 (17.5%) |
| Information | 4 (100.0%) | 0 (0.0%) |
| Finance & Insurance | 67 (45.0%) | 82 (55.0%) |
| Real Estate, Rental & Leasing | 33 (55.9%) | 26 (44.1%) |
| Professional & Scientific | 94 (75.8%) | 30 (24.2%) |
| Enterprise Management | 0 (0.0%) | 0 (0.0%) |
| Administrative & Support | 63 (75.0%) | 21 (25.0%) |
| Educational Services | 89 (20.7%) | 340 (79.2%) |
| Health Care & Social Assistance | 339 (27.6%) | 888 (72.4%) |
| Arts, Entertainment & Recreation | 82 (68.9%) | 37 (31.1%) |
| Accommodation & Food Services | 236 (63.4%) | 136 (36.6%) |
| Public Administration | 224 (63.1%) | 131 (36.9%) |
| Total | 2,597 (53.5%) | 2,259 (46.5%) |
Education in Hermantown
School Enrollment in Hermantown
The most common levels of schooling among the 2,588 students in Hermantown are elementary school (683 | 26.4%), high school (590 | 22.8%), and middle school (547 | 21.1%).
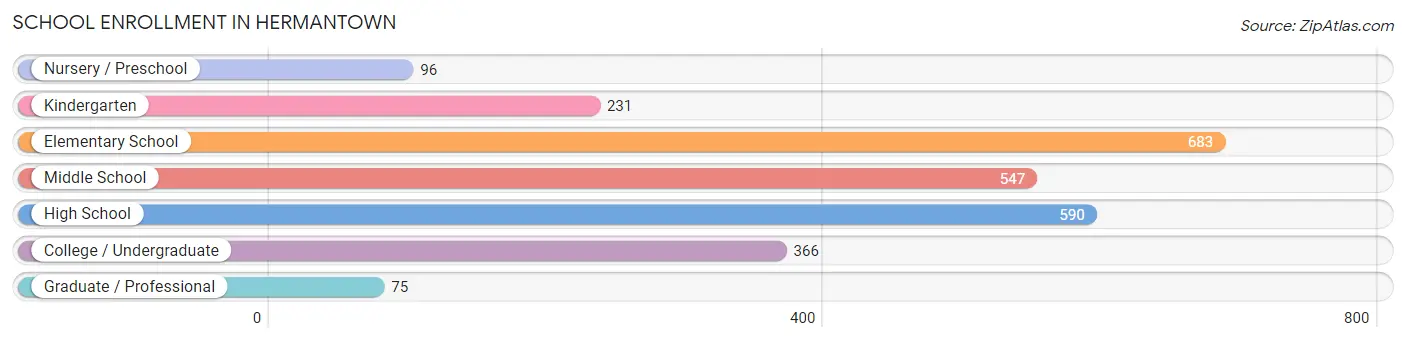
| School Level | # Students | % Students |
| Nursery / Preschool | 96 | 3.7% |
| Kindergarten | 231 | 8.9% |
| Elementary School | 683 | 26.4% |
| Middle School | 547 | 21.1% |
| High School | 590 | 22.8% |
| College / Undergraduate | 366 | 14.1% |
| Graduate / Professional | 75 | 2.9% |
| Total | 2,588 | 100.0% |
School Enrollment by Age by Funding Source in Hermantown
Out of a total of 2,588 students who are enrolled in schools in Hermantown, 168 (6.5%) attend a private institution, while the remaining 2,420 (93.5%) are enrolled in public schools. The age group of 35 years and over has the highest likelihood of being enrolled in private schools, with 20 (30.3% in the age bracket) enrolled. Conversely, the age group of 3 to 4 year olds has the lowest likelihood of being enrolled in a private school, with 35 (100.0% in the age bracket) attending a public institution.
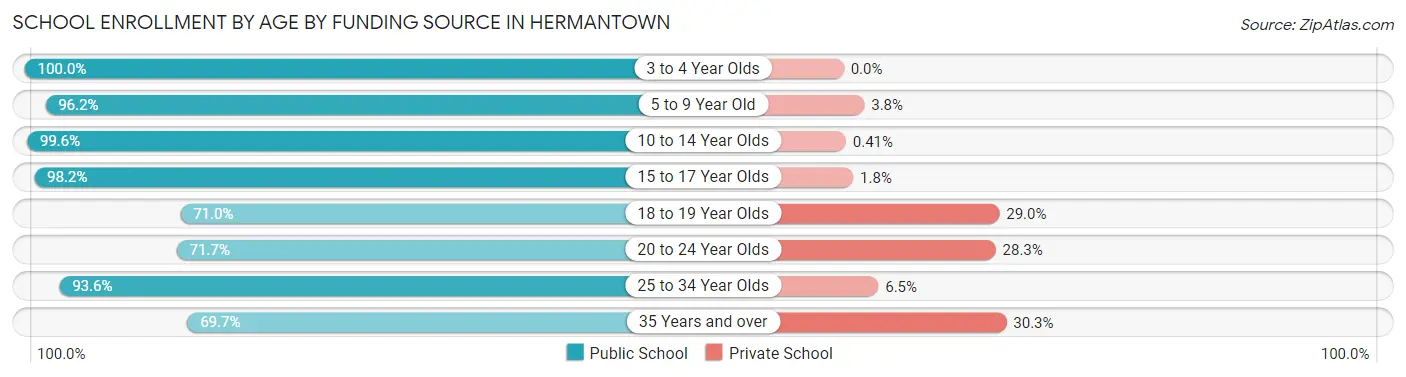
| Age Bracket | Public School | Private School |
| 3 to 4 Year Olds | 35 (100.0%) | 0 (0.0%) |
| 5 to 9 Year Old | 876 (96.2%) | 35 (3.8%) |
| 10 to 14 Year Olds | 725 (99.6%) | 3 (0.4%) |
| 15 to 17 Year Olds | 389 (98.2%) | 7 (1.8%) |
| 18 to 19 Year Olds | 120 (71.0%) | 49 (29.0%) |
| 20 to 24 Year Olds | 114 (71.7%) | 45 (28.3%) |
| 25 to 34 Year Olds | 116 (93.5%) | 8 (6.5%) |
| 35 Years and over | 46 (69.7%) | 20 (30.3%) |
| Total | 2,420 (93.5%) | 168 (6.5%) |
Educational Attainment by Field of Study in Hermantown
Business (433 | 14.7%), science & technology (345 | 11.7%), bio, nature & agricultural (324 | 11.0%), education (294 | 10.0%), and arts & humanities (287 | 9.7%) are the most common fields of study among 2,946 individuals in Hermantown who have obtained a bachelor's degree or higher.
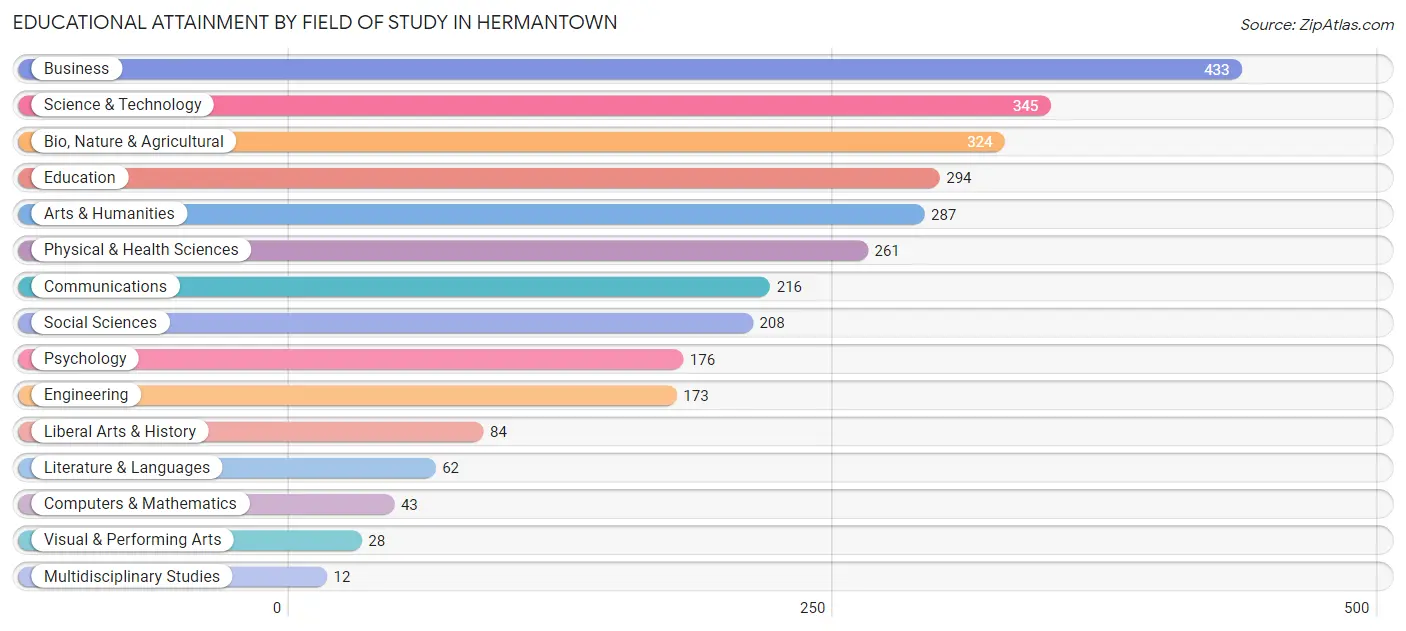
| Field of Study | # Graduates | % Graduates |
| Computers & Mathematics | 43 | 1.5% |
| Bio, Nature & Agricultural | 324 | 11.0% |
| Physical & Health Sciences | 261 | 8.9% |
| Psychology | 176 | 6.0% |
| Social Sciences | 208 | 7.1% |
| Engineering | 173 | 5.9% |
| Multidisciplinary Studies | 12 | 0.4% |
| Science & Technology | 345 | 11.7% |
| Business | 433 | 14.7% |
| Education | 294 | 10.0% |
| Literature & Languages | 62 | 2.1% |
| Liberal Arts & History | 84 | 2.9% |
| Visual & Performing Arts | 28 | 0.9% |
| Communications | 216 | 7.3% |
| Arts & Humanities | 287 | 9.7% |
| Total | 2,946 | 100.0% |
Transportation & Commute in Hermantown
Vehicle Availability by Sex in Hermantown
The most prevalent vehicle ownership categories in Hermantown are males with 2 vehicles (1,261, accounting for 47.6%) and females with 2 vehicles (1,019, making up 56.6%).
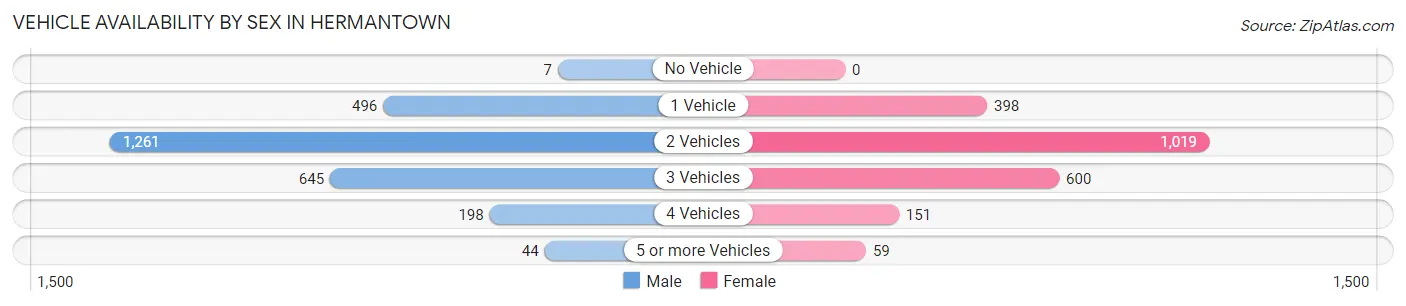
| Vehicles Available | Male | Female |
| No Vehicle | 7 (0.3%) | 0 (0.0%) |
| 1 Vehicle | 496 (18.7%) | 398 (17.9%) |
| 2 Vehicles | 1,261 (47.6%) | 1,019 (45.8%) |
| 3 Vehicles | 645 (24.3%) | 600 (26.9%) |
| 4 Vehicles | 198 (7.5%) | 151 (6.8%) |
| 5 or more Vehicles | 44 (1.7%) | 59 (2.6%) |
| Total | 2,651 (100.0%) | 2,227 (100.0%) |
Commute Time in Hermantown
The most frequently occuring commute durations in Hermantown are 15 to 19 minutes (1,211 commuters, 27.2%), 10 to 14 minutes (979 commuters, 22.0%), and 20 to 24 minutes (906 commuters, 20.3%).
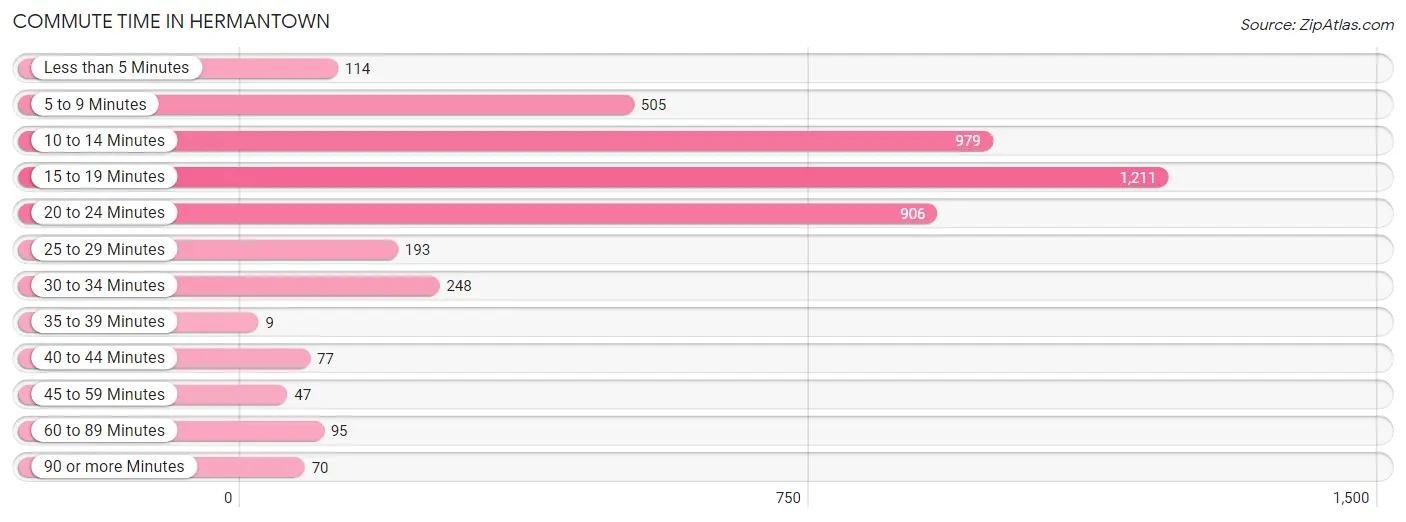
| Commute Time | # Commuters | % Commuters |
| Less than 5 Minutes | 114 | 2.6% |
| 5 to 9 Minutes | 505 | 11.3% |
| 10 to 14 Minutes | 979 | 22.0% |
| 15 to 19 Minutes | 1,211 | 27.2% |
| 20 to 24 Minutes | 906 | 20.3% |
| 25 to 29 Minutes | 193 | 4.3% |
| 30 to 34 Minutes | 248 | 5.6% |
| 35 to 39 Minutes | 9 | 0.2% |
| 40 to 44 Minutes | 77 | 1.7% |
| 45 to 59 Minutes | 47 | 1.1% |
| 60 to 89 Minutes | 95 | 2.1% |
| 90 or more Minutes | 70 | 1.6% |
Commute Time by Sex in Hermantown
The most common commute times in Hermantown are 15 to 19 minutes (760 commuters, 31.2%) for males and 20 to 24 minutes (553 commuters, 27.4%) for females.
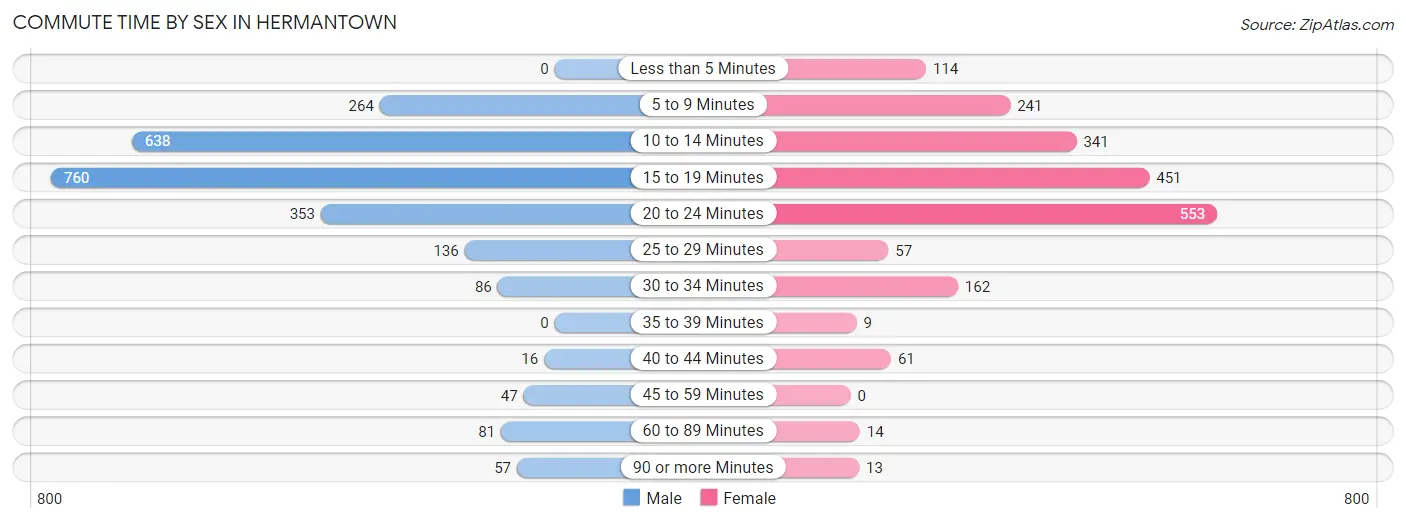
| Commute Time | Male | Female |
| Less than 5 Minutes | 0 (0.0%) | 114 (5.7%) |
| 5 to 9 Minutes | 264 (10.8%) | 241 (11.9%) |
| 10 to 14 Minutes | 638 (26.2%) | 341 (16.9%) |
| 15 to 19 Minutes | 760 (31.2%) | 451 (22.4%) |
| 20 to 24 Minutes | 353 (14.5%) | 553 (27.4%) |
| 25 to 29 Minutes | 136 (5.6%) | 57 (2.8%) |
| 30 to 34 Minutes | 86 (3.5%) | 162 (8.0%) |
| 35 to 39 Minutes | 0 (0.0%) | 9 (0.4%) |
| 40 to 44 Minutes | 16 (0.7%) | 61 (3.0%) |
| 45 to 59 Minutes | 47 (1.9%) | 0 (0.0%) |
| 60 to 89 Minutes | 81 (3.3%) | 14 (0.7%) |
| 90 or more Minutes | 57 (2.3%) | 13 (0.6%) |
Time of Departure to Work by Sex in Hermantown
The most frequent times of departure to work in Hermantown are 7:30 AM to 7:59 AM (466, 19.1%) for males and 7:00 AM to 7:29 AM (422, 20.9%) for females.
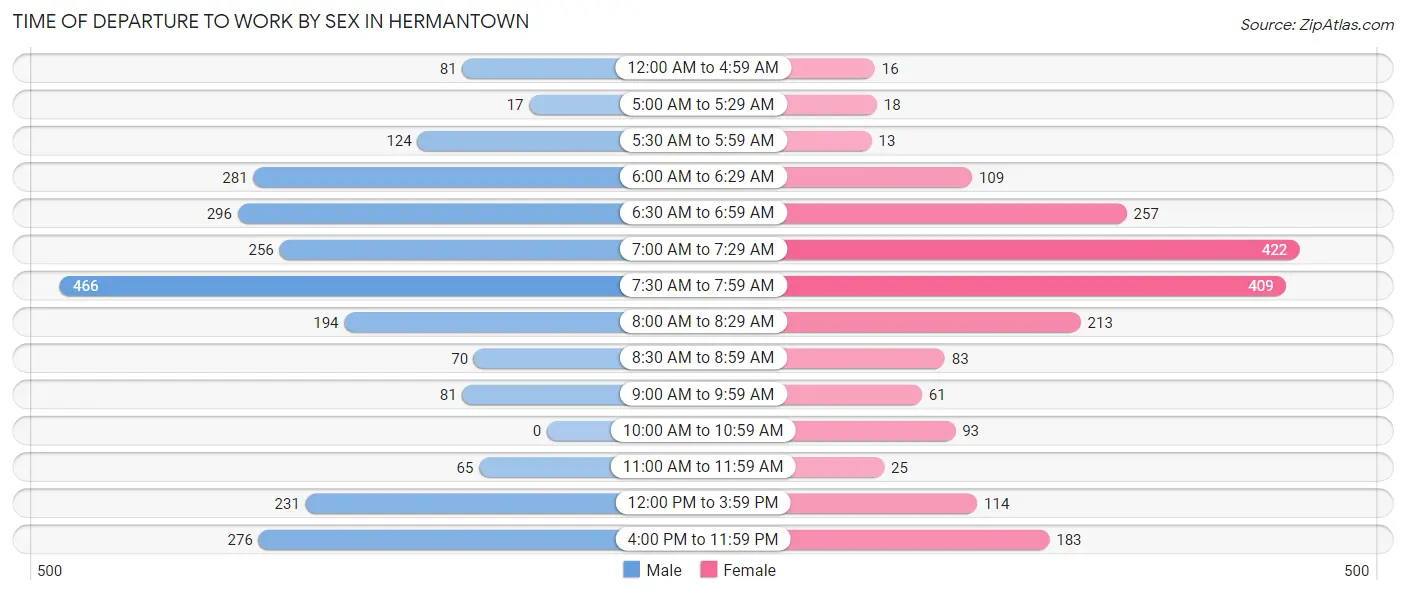
| Time of Departure | Male | Female |
| 12:00 AM to 4:59 AM | 81 (3.3%) | 16 (0.8%) |
| 5:00 AM to 5:29 AM | 17 (0.7%) | 18 (0.9%) |
| 5:30 AM to 5:59 AM | 124 (5.1%) | 13 (0.6%) |
| 6:00 AM to 6:29 AM | 281 (11.5%) | 109 (5.4%) |
| 6:30 AM to 6:59 AM | 296 (12.1%) | 257 (12.8%) |
| 7:00 AM to 7:29 AM | 256 (10.5%) | 422 (20.9%) |
| 7:30 AM to 7:59 AM | 466 (19.1%) | 409 (20.3%) |
| 8:00 AM to 8:29 AM | 194 (8.0%) | 213 (10.6%) |
| 8:30 AM to 8:59 AM | 70 (2.9%) | 83 (4.1%) |
| 9:00 AM to 9:59 AM | 81 (3.3%) | 61 (3.0%) |
| 10:00 AM to 10:59 AM | 0 (0.0%) | 93 (4.6%) |
| 11:00 AM to 11:59 AM | 65 (2.7%) | 25 (1.2%) |
| 12:00 PM to 3:59 PM | 231 (9.5%) | 114 (5.7%) |
| 4:00 PM to 11:59 PM | 276 (11.3%) | 183 (9.1%) |
| Total | 2,438 (100.0%) | 2,016 (100.0%) |
Housing Occupancy in Hermantown
Occupancy by Ownership in Hermantown
Of the total 3,738 dwellings in Hermantown, owner-occupied units account for 2,849 (76.2%), while renter-occupied units make up 889 (23.8%).
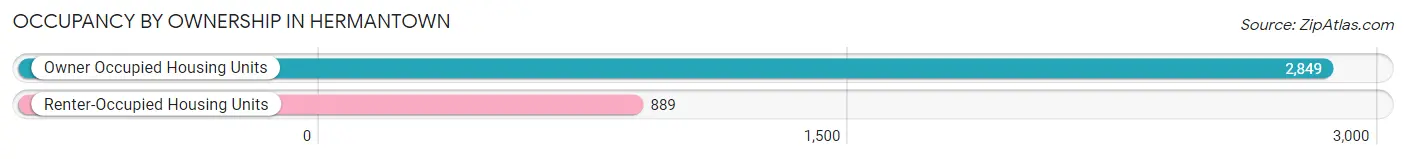
| Occupancy | # Housing Units | % Housing Units |
| Owner Occupied Housing Units | 2,849 | 76.2% |
| Renter-Occupied Housing Units | 889 | 23.8% |
| Total Occupied Housing Units | 3,738 | 100.0% |
Occupancy by Household Size in Hermantown
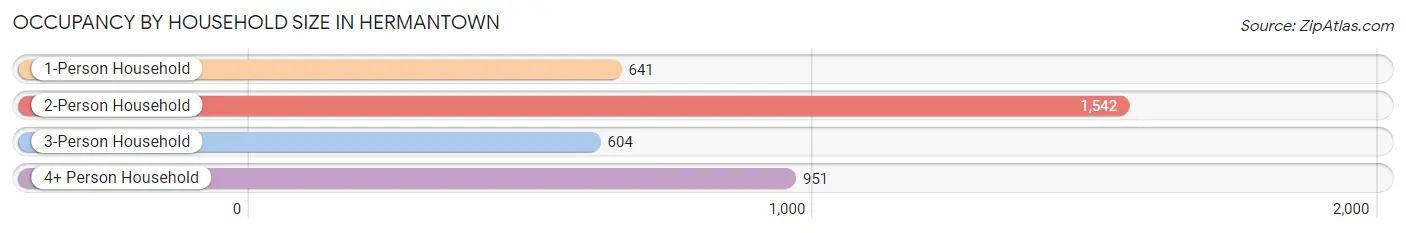
| Household Size | # Housing Units | % Housing Units |
| 1-Person Household | 641 | 17.2% |
| 2-Person Household | 1,542 | 41.2% |
| 3-Person Household | 604 | 16.2% |
| 4+ Person Household | 951 | 25.4% |
| Total Housing Units | 3,738 | 100.0% |
Occupancy by Ownership by Household Size in Hermantown
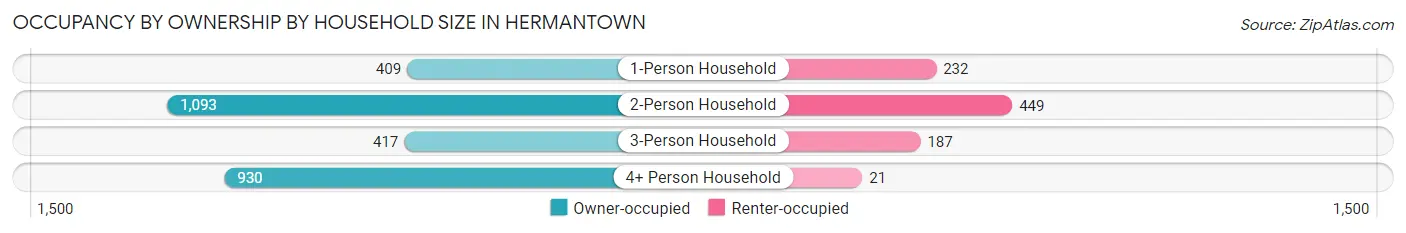
| Household Size | Owner-occupied | Renter-occupied |
| 1-Person Household | 409 (63.8%) | 232 (36.2%) |
| 2-Person Household | 1,093 (70.9%) | 449 (29.1%) |
| 3-Person Household | 417 (69.0%) | 187 (31.0%) |
| 4+ Person Household | 930 (97.8%) | 21 (2.2%) |
| Total Housing Units | 2,849 (76.2%) | 889 (23.8%) |
Occupancy by Educational Attainment in Hermantown
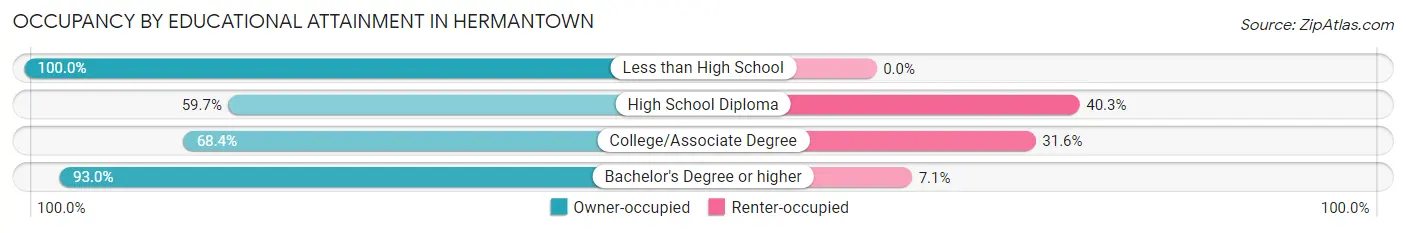
| Household Size | Owner-occupied | Renter-occupied |
| Less than High School | 13 (100.0%) | 0 (0.0%) |
| High School Diploma | 537 (59.7%) | 362 (40.3%) |
| College/Associate Degree | 915 (68.4%) | 422 (31.6%) |
| Bachelor's Degree or higher | 1,384 (92.9%) | 105 (7.0%) |
Occupancy by Age of Householder in Hermantown
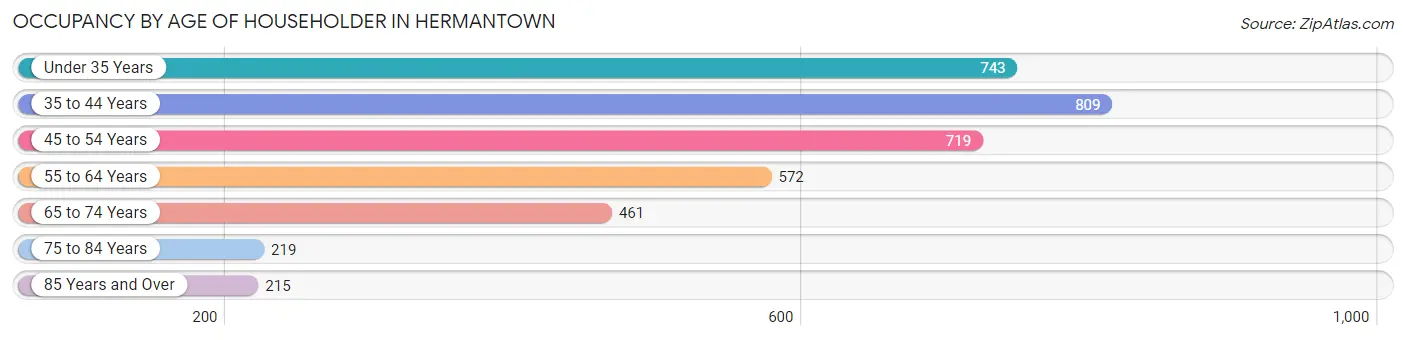
| Age Bracket | # Households | % Households |
| Under 35 Years | 743 | 19.9% |
| 35 to 44 Years | 809 | 21.6% |
| 45 to 54 Years | 719 | 19.2% |
| 55 to 64 Years | 572 | 15.3% |
| 65 to 74 Years | 461 | 12.3% |
| 75 to 84 Years | 219 | 5.9% |
| 85 Years and Over | 215 | 5.8% |
| Total | 3,738 | 100.0% |
Housing Finances in Hermantown
Median Income by Occupancy in Hermantown
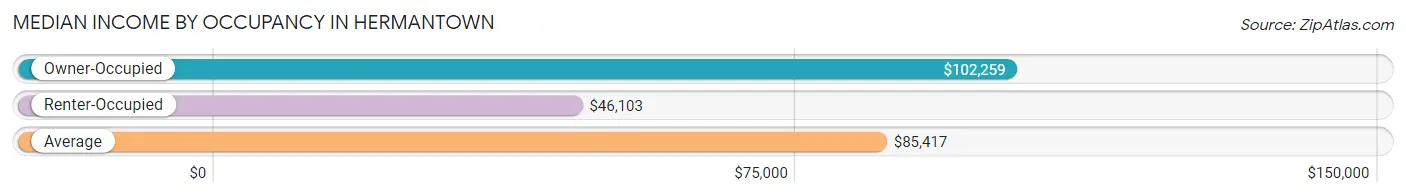
| Occupancy Type | # Households | Median Income |
| Owner-Occupied | 2,849 (76.2%) | $102,259 |
| Renter-Occupied | 889 (23.8%) | $46,103 |
| Average | 3,738 (100.0%) | $85,417 |
Occupancy by Householder Income Bracket in Hermantown
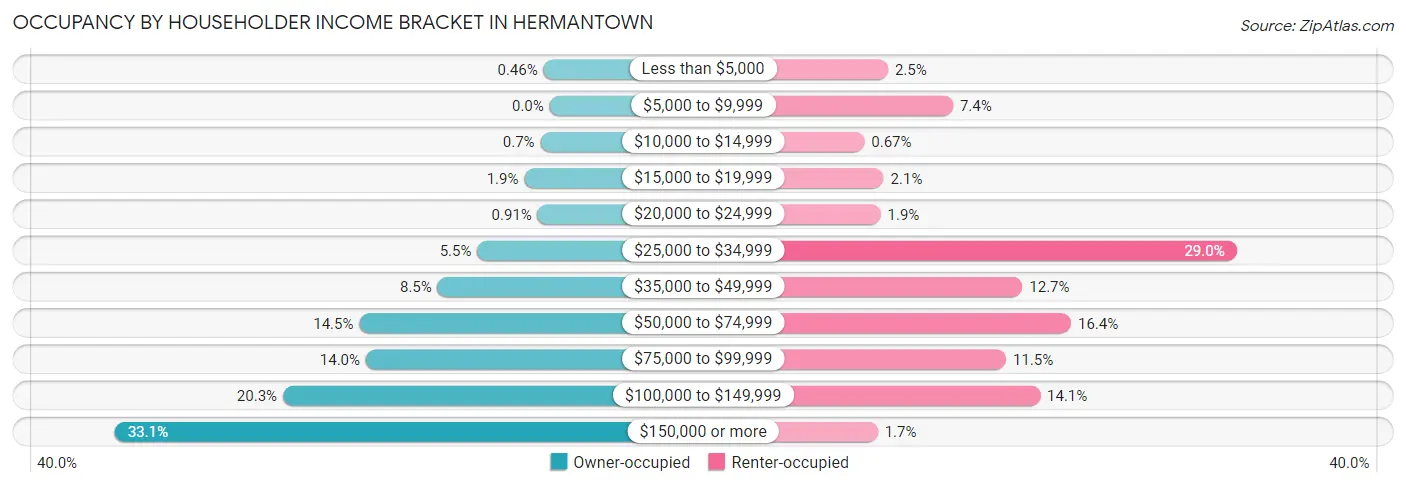
| Income Bracket | Owner-occupied | Renter-occupied |
| Less than $5,000 | 13 (0.5%) | 22 (2.5%) |
| $5,000 to $9,999 | 0 (0.0%) | 66 (7.4%) |
| $10,000 to $14,999 | 20 (0.7%) | 6 (0.7%) |
| $15,000 to $19,999 | 55 (1.9%) | 19 (2.1%) |
| $20,000 to $24,999 | 26 (0.9%) | 17 (1.9%) |
| $25,000 to $34,999 | 157 (5.5%) | 258 (29.0%) |
| $35,000 to $49,999 | 243 (8.5%) | 113 (12.7%) |
| $50,000 to $74,999 | 413 (14.5%) | 146 (16.4%) |
| $75,000 to $99,999 | 399 (14.0%) | 102 (11.5%) |
| $100,000 to $149,999 | 579 (20.3%) | 125 (14.1%) |
| $150,000 or more | 944 (33.1%) | 15 (1.7%) |
| Total | 2,849 (100.0%) | 889 (100.0%) |
Monthly Housing Cost Tiers in Hermantown
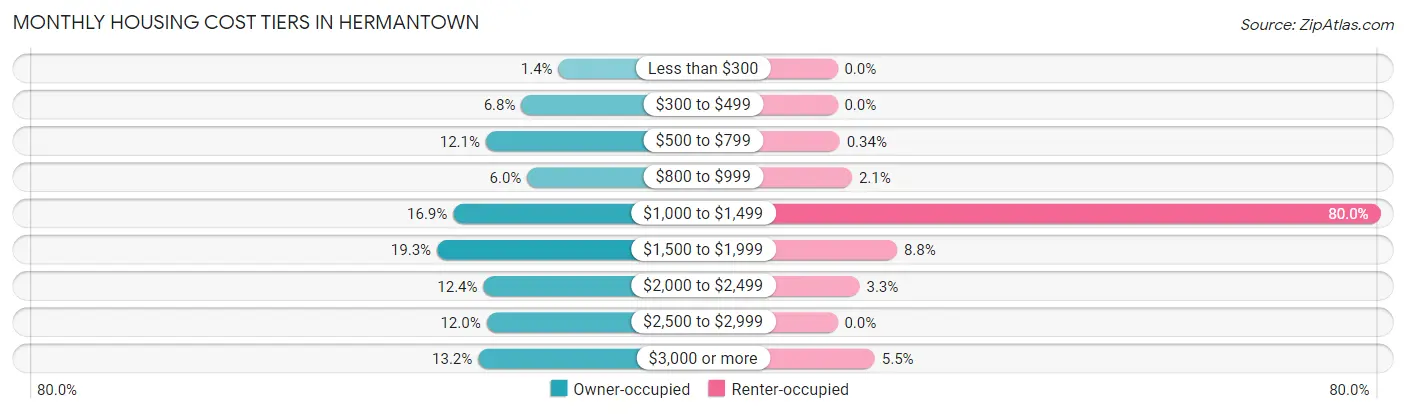
| Monthly Cost | Owner-occupied | Renter-occupied |
| Less than $300 | 39 (1.4%) | 0 (0.0%) |
| $300 to $499 | 195 (6.8%) | 0 (0.0%) |
| $500 to $799 | 344 (12.1%) | 3 (0.3%) |
| $800 to $999 | 170 (6.0%) | 19 (2.1%) |
| $1,000 to $1,499 | 481 (16.9%) | 711 (80.0%) |
| $1,500 to $1,999 | 549 (19.3%) | 78 (8.8%) |
| $2,000 to $2,499 | 354 (12.4%) | 29 (3.3%) |
| $2,500 to $2,999 | 341 (12.0%) | 0 (0.0%) |
| $3,000 or more | 376 (13.2%) | 49 (5.5%) |
| Total | 2,849 (100.0%) | 889 (100.0%) |
Physical Housing Characteristics in Hermantown
Housing Structures in Hermantown
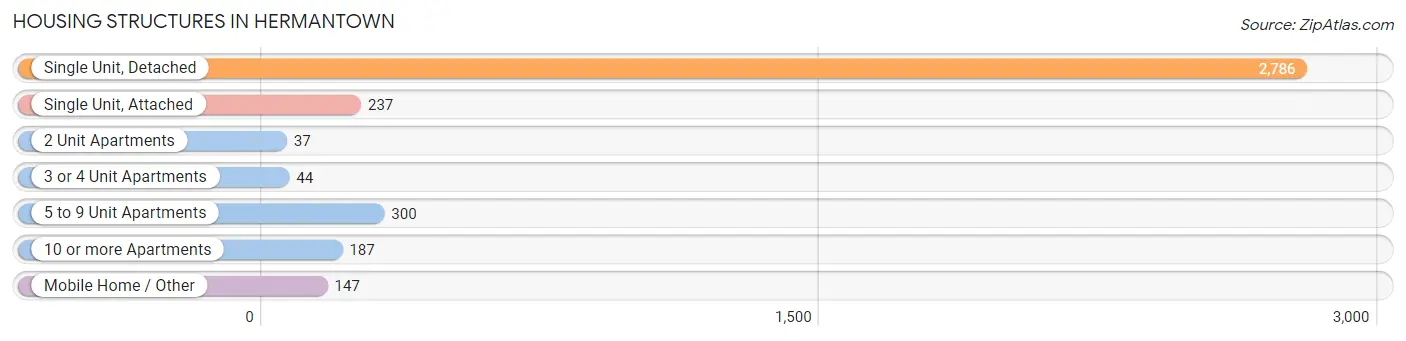
| Structure Type | # Housing Units | % Housing Units |
| Single Unit, Detached | 2,786 | 74.5% |
| Single Unit, Attached | 237 | 6.3% |
| 2 Unit Apartments | 37 | 1.0% |
| 3 or 4 Unit Apartments | 44 | 1.2% |
| 5 to 9 Unit Apartments | 300 | 8.0% |
| 10 or more Apartments | 187 | 5.0% |
| Mobile Home / Other | 147 | 3.9% |
| Total | 3,738 | 100.0% |
Housing Structures by Occupancy in Hermantown
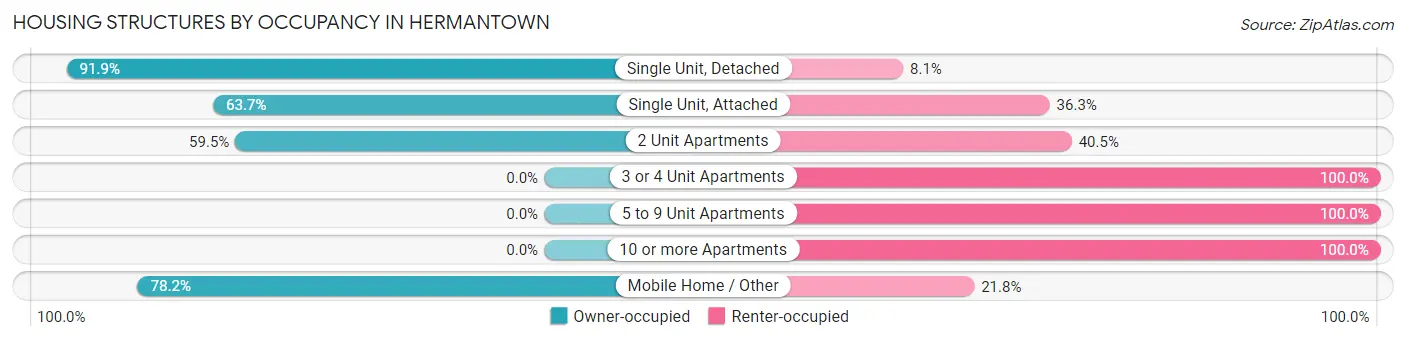
| Structure Type | Owner-occupied | Renter-occupied |
| Single Unit, Detached | 2,561 (91.9%) | 225 (8.1%) |
| Single Unit, Attached | 151 (63.7%) | 86 (36.3%) |
| 2 Unit Apartments | 22 (59.5%) | 15 (40.5%) |
| 3 or 4 Unit Apartments | 0 (0.0%) | 44 (100.0%) |
| 5 to 9 Unit Apartments | 0 (0.0%) | 300 (100.0%) |
| 10 or more Apartments | 0 (0.0%) | 187 (100.0%) |
| Mobile Home / Other | 115 (78.2%) | 32 (21.8%) |
| Total | 2,849 (76.2%) | 889 (23.8%) |
Housing Structures by Number of Rooms in Hermantown
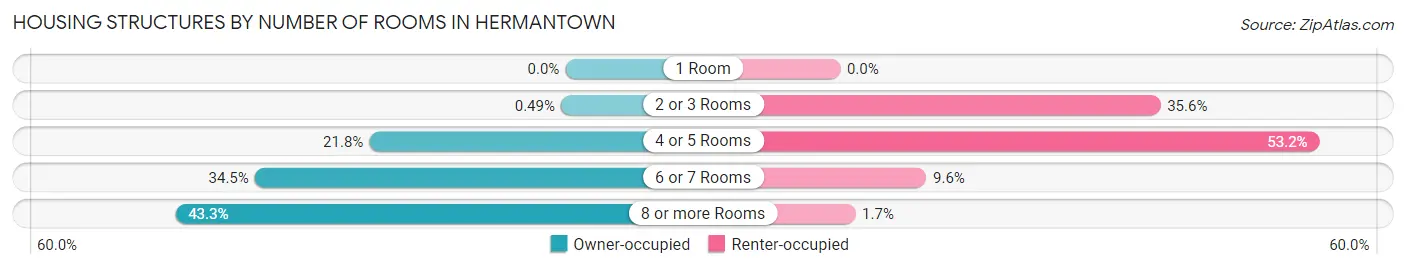
| Number of Rooms | Owner-occupied | Renter-occupied |
| 1 Room | 0 (0.0%) | 0 (0.0%) |
| 2 or 3 Rooms | 14 (0.5%) | 316 (35.5%) |
| 4 or 5 Rooms | 620 (21.8%) | 473 (53.2%) |
| 6 or 7 Rooms | 982 (34.5%) | 85 (9.6%) |
| 8 or more Rooms | 1,233 (43.3%) | 15 (1.7%) |
| Total | 2,849 (100.0%) | 889 (100.0%) |
Housing Structure by Heating Type in Hermantown
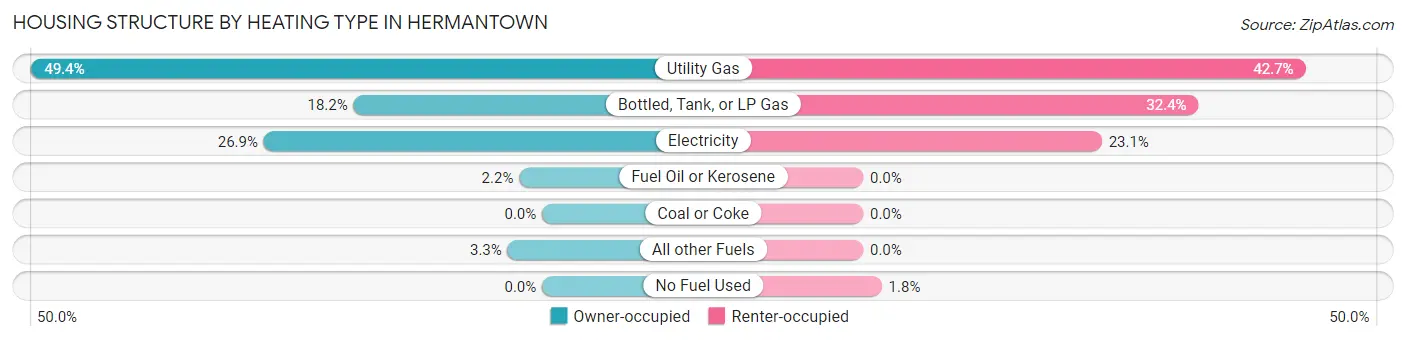
| Heating Type | Owner-occupied | Renter-occupied |
| Utility Gas | 1,406 (49.3%) | 380 (42.7%) |
| Bottled, Tank, or LP Gas | 519 (18.2%) | 288 (32.4%) |
| Electricity | 766 (26.9%) | 205 (23.1%) |
| Fuel Oil or Kerosene | 63 (2.2%) | 0 (0.0%) |
| Coal or Coke | 0 (0.0%) | 0 (0.0%) |
| All other Fuels | 95 (3.3%) | 0 (0.0%) |
| No Fuel Used | 0 (0.0%) | 16 (1.8%) |
| Total | 2,849 (100.0%) | 889 (100.0%) |
Household Vehicle Usage in Hermantown
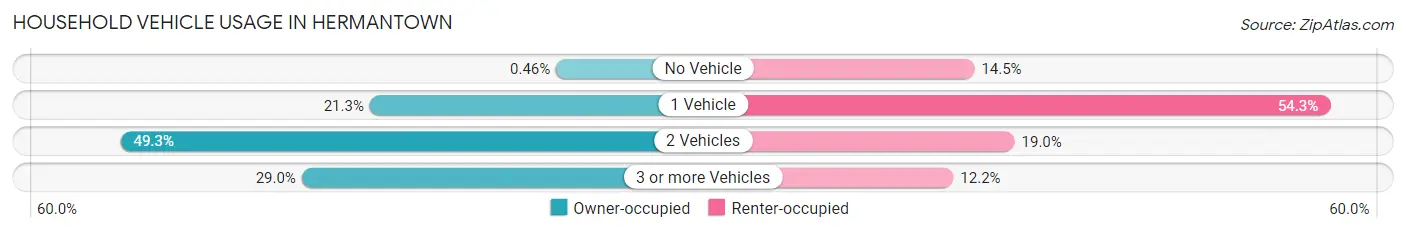
| Vehicles per Household | Owner-occupied | Renter-occupied |
| No Vehicle | 13 (0.5%) | 129 (14.5%) |
| 1 Vehicle | 608 (21.3%) | 483 (54.3%) |
| 2 Vehicles | 1,403 (49.2%) | 169 (19.0%) |
| 3 or more Vehicles | 825 (29.0%) | 108 (12.1%) |
| Total | 2,849 (100.0%) | 889 (100.0%) |
Real Estate & Mortgages in Hermantown
Real Estate and Mortgage Overview in Hermantown
| Characteristic | Without Mortgage | With Mortgage |
| Housing Units | 776 | 2,073 |
| Median Property Value | $237,700 | $364,700 |
| Median Household Income | $61,000 | $891 |
| Monthly Housing Costs | $587 | $376 |
| Real Estate Taxes | $2,707 | $0 |
Property Value by Mortgage Status in Hermantown
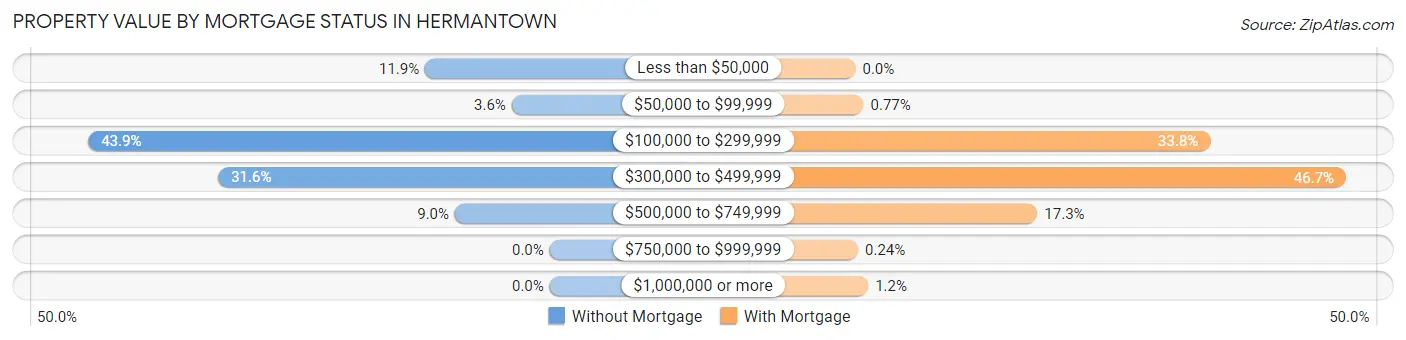
| Property Value | Without Mortgage | With Mortgage |
| Less than $50,000 | 92 (11.9%) | 0 (0.0%) |
| $50,000 to $99,999 | 28 (3.6%) | 16 (0.8%) |
| $100,000 to $299,999 | 341 (43.9%) | 700 (33.8%) |
| $300,000 to $499,999 | 245 (31.6%) | 968 (46.7%) |
| $500,000 to $749,999 | 70 (9.0%) | 359 (17.3%) |
| $750,000 to $999,999 | 0 (0.0%) | 5 (0.2%) |
| $1,000,000 or more | 0 (0.0%) | 25 (1.2%) |
| Total | 776 (100.0%) | 2,073 (100.0%) |
Household Income by Mortgage Status in Hermantown
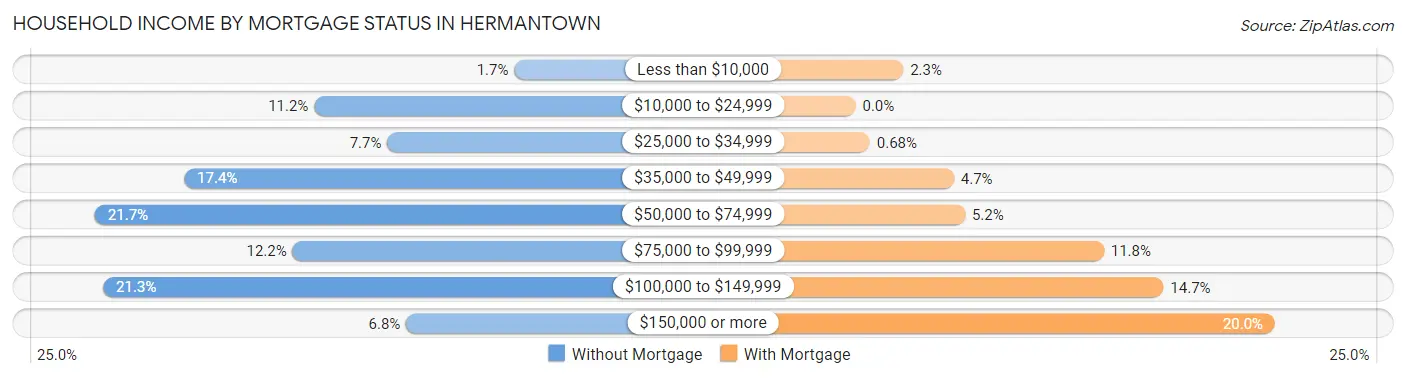
| Household Income | Without Mortgage | With Mortgage |
| Less than $10,000 | 13 (1.7%) | 47 (2.3%) |
| $10,000 to $24,999 | 87 (11.2%) | 0 (0.0%) |
| $25,000 to $34,999 | 60 (7.7%) | 14 (0.7%) |
| $35,000 to $49,999 | 135 (17.4%) | 97 (4.7%) |
| $50,000 to $74,999 | 168 (21.6%) | 108 (5.2%) |
| $75,000 to $99,999 | 95 (12.2%) | 245 (11.8%) |
| $100,000 to $149,999 | 165 (21.3%) | 304 (14.7%) |
| $150,000 or more | 53 (6.8%) | 414 (20.0%) |
| Total | 776 (100.0%) | 2,073 (100.0%) |
Property Value to Household Income Ratio in Hermantown
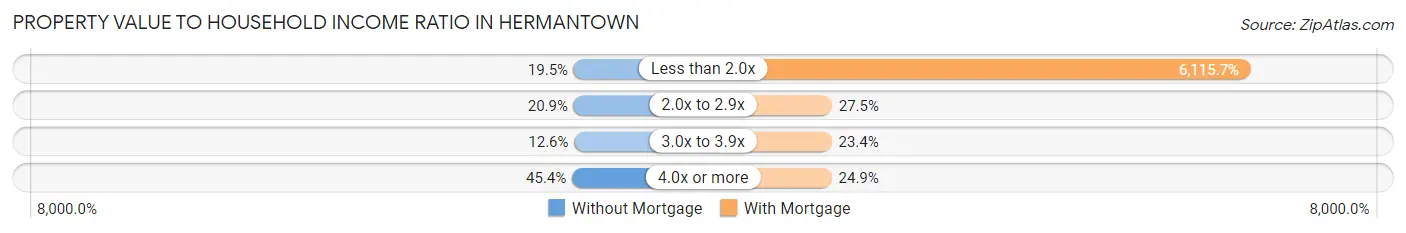
| Value-to-Income Ratio | Without Mortgage | With Mortgage |
| Less than 2.0x | 151 (19.5%) | 126,779 (6,115.7%) |
| 2.0x to 2.9x | 162 (20.9%) | 569 (27.5%) |
| 3.0x to 3.9x | 98 (12.6%) | 484 (23.4%) |
| 4.0x or more | 352 (45.4%) | 517 (24.9%) |
| Total | 776 (100.0%) | 2,073 (100.0%) |
Real Estate Taxes by Mortgage Status in Hermantown
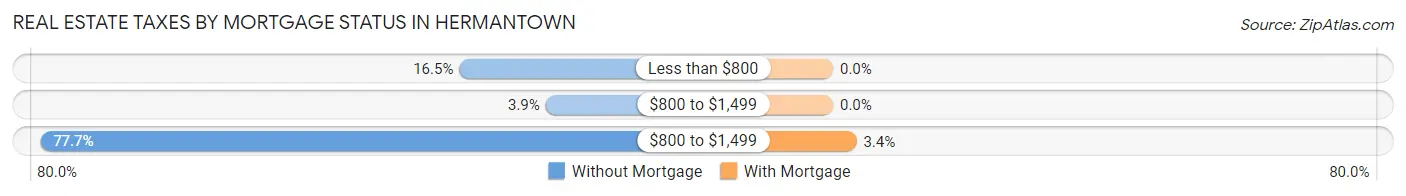
| Property Taxes | Without Mortgage | With Mortgage |
| Less than $800 | 128 (16.5%) | 0 (0.0%) |
| $800 to $1,499 | 30 (3.9%) | 0 (0.0%) |
| $800 to $1,499 | 603 (77.7%) | 71 (3.4%) |
| Total | 776 (100.0%) | 2,073 (100.0%) |
Health & Disability in Hermantown
Health Insurance Coverage by Age in Hermantown
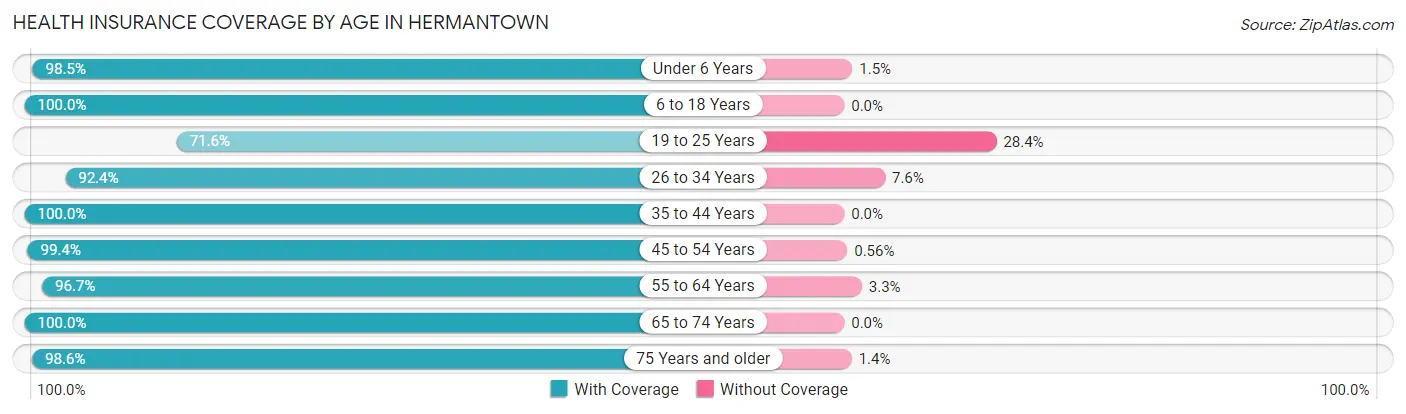
| Age Bracket | With Coverage | Without Coverage |
| Under 6 Years | 789 (98.5%) | 12 (1.5%) |
| 6 to 18 Years | 2,034 (100.0%) | 0 (0.0%) |
| 19 to 25 Years | 467 (71.6%) | 185 (28.4%) |
| 26 to 34 Years | 875 (92.4%) | 72 (7.6%) |
| 35 to 44 Years | 1,553 (100.0%) | 0 (0.0%) |
| 45 to 54 Years | 1,057 (99.4%) | 6 (0.6%) |
| 55 to 64 Years | 977 (96.7%) | 33 (3.3%) |
| 65 to 74 Years | 786 (100.0%) | 0 (0.0%) |
| 75 Years and older | 711 (98.6%) | 10 (1.4%) |
| Total | 9,249 (96.7%) | 318 (3.3%) |
Health Insurance Coverage by Citizenship Status in Hermantown
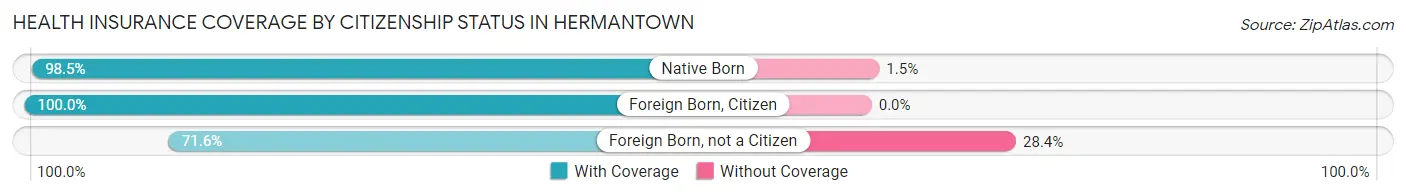
| Citizenship Status | With Coverage | Without Coverage |
| Native Born | 789 (98.5%) | 12 (1.5%) |
| Foreign Born, Citizen | 2,034 (100.0%) | 0 (0.0%) |
| Foreign Born, not a Citizen | 467 (71.6%) | 185 (28.4%) |
Health Insurance Coverage by Household Income in Hermantown
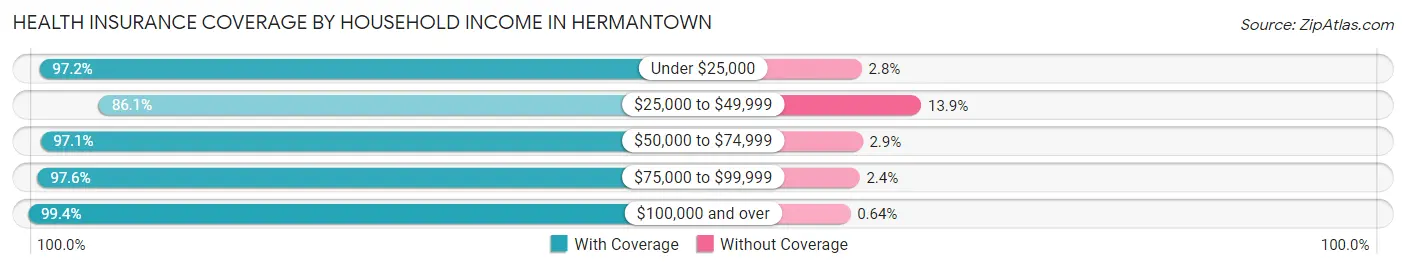
| Household Income | With Coverage | Without Coverage |
| Under $25,000 | 350 (97.2%) | 10 (2.8%) |
| $25,000 to $49,999 | 1,238 (86.1%) | 200 (13.9%) |
| $50,000 to $74,999 | 1,125 (97.1%) | 34 (2.9%) |
| $75,000 to $99,999 | 1,026 (97.6%) | 25 (2.4%) |
| $100,000 and over | 5,449 (99.4%) | 35 (0.6%) |
Public vs Private Health Insurance Coverage by Age in Hermantown
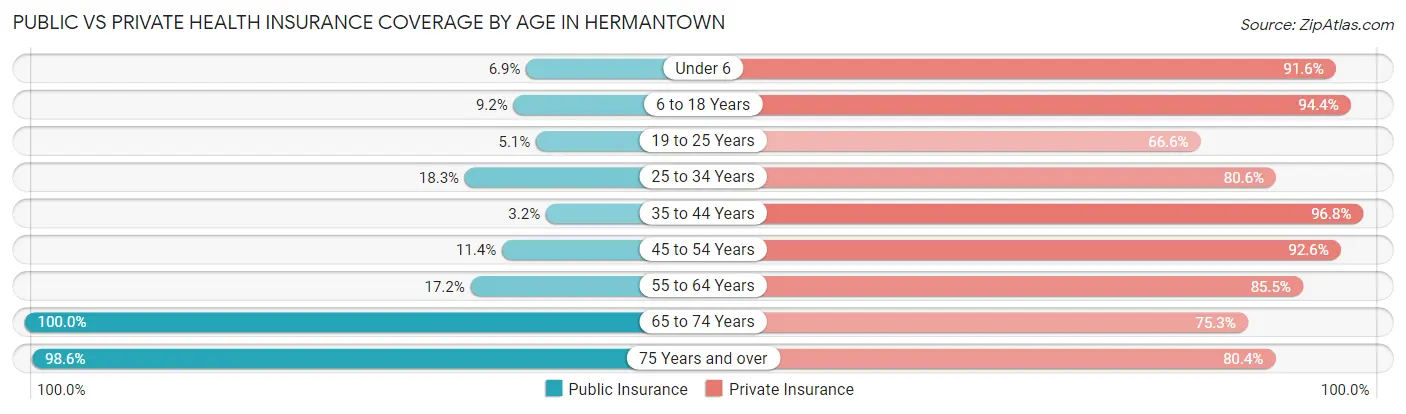
| Age Bracket | Public Insurance | Private Insurance |
| Under 6 | 55 (6.9%) | 734 (91.6%) |
| 6 to 18 Years | 188 (9.2%) | 1,921 (94.4%) |
| 19 to 25 Years | 33 (5.1%) | 434 (66.6%) |
| 25 to 34 Years | 173 (18.3%) | 763 (80.6%) |
| 35 to 44 Years | 50 (3.2%) | 1,503 (96.8%) |
| 45 to 54 Years | 121 (11.4%) | 984 (92.6%) |
| 55 to 64 Years | 174 (17.2%) | 864 (85.5%) |
| 65 to 74 Years | 786 (100.0%) | 592 (75.3%) |
| 75 Years and over | 711 (98.6%) | 580 (80.4%) |
| Total | 2,291 (23.9%) | 8,375 (87.5%) |
Disability Status by Sex by Age in Hermantown
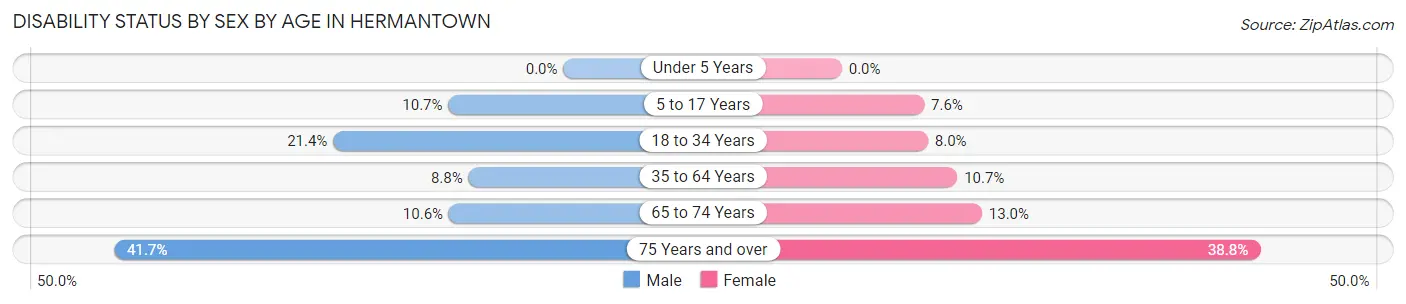
| Age Bracket | Male | Female |
| Under 5 Years | 0 (0.0%) | 0 (0.0%) |
| 5 to 17 Years | 109 (10.7%) | 84 (7.6%) |
| 18 to 34 Years | 191 (21.4%) | 64 (8.0%) |
| 35 to 64 Years | 154 (8.8%) | 201 (10.7%) |
| 65 to 74 Years | 41 (10.6%) | 52 (13.0%) |
| 75 Years and over | 118 (41.7%) | 170 (38.8%) |
Disability Class by Sex by Age in Hermantown
Disability Class: Hearing Difficulty
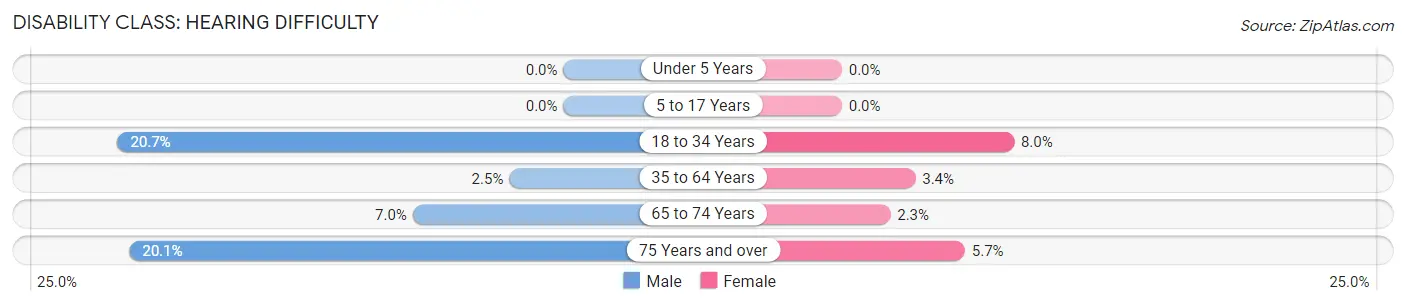
| Age Bracket | Male | Female |
| Under 5 Years | 0 (0.0%) | 0 (0.0%) |
| 5 to 17 Years | 0 (0.0%) | 0 (0.0%) |
| 18 to 34 Years | 185 (20.7%) | 64 (8.0%) |
| 35 to 64 Years | 44 (2.5%) | 64 (3.4%) |
| 65 to 74 Years | 27 (7.0%) | 9 (2.2%) |
| 75 Years and over | 57 (20.1%) | 25 (5.7%) |
Disability Class: Vision Difficulty
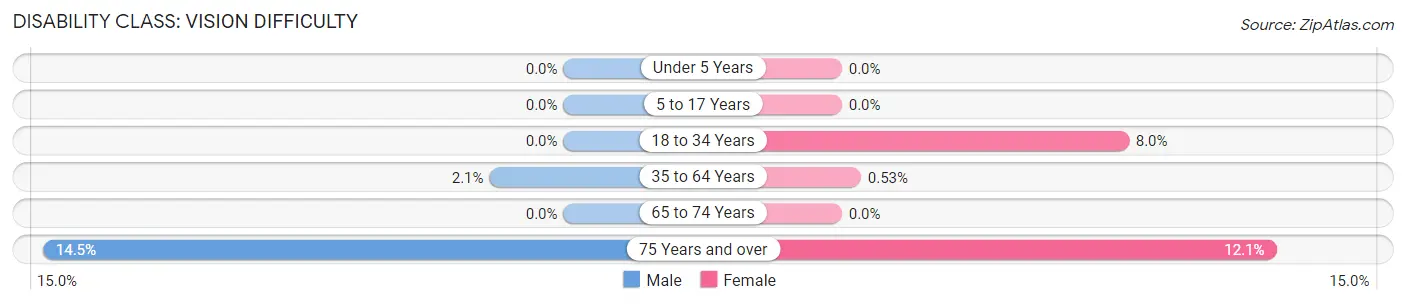
| Age Bracket | Male | Female |
| Under 5 Years | 0 (0.0%) | 0 (0.0%) |
| 5 to 17 Years | 0 (0.0%) | 0 (0.0%) |
| 18 to 34 Years | 0 (0.0%) | 64 (8.0%) |
| 35 to 64 Years | 36 (2.1%) | 10 (0.5%) |
| 65 to 74 Years | 0 (0.0%) | 0 (0.0%) |
| 75 Years and over | 41 (14.5%) | 53 (12.1%) |
Disability Class: Cognitive Difficulty
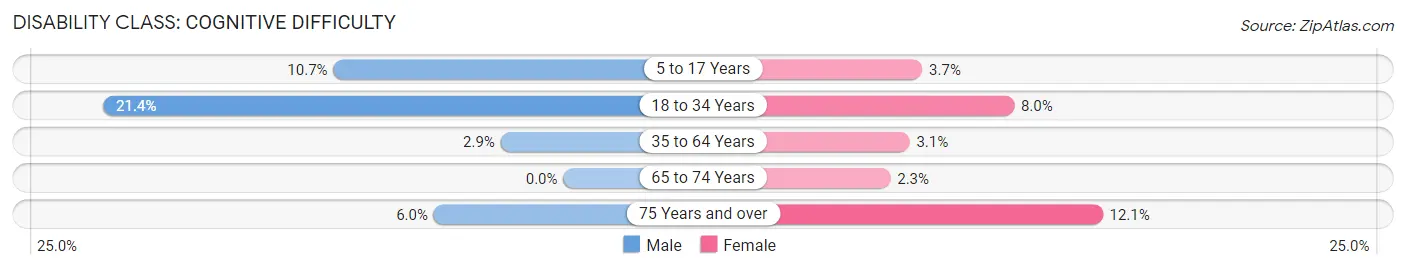
| Age Bracket | Male | Female |
| 5 to 17 Years | 109 (10.7%) | 41 (3.7%) |
| 18 to 34 Years | 191 (21.4%) | 64 (8.0%) |
| 35 to 64 Years | 51 (2.9%) | 59 (3.1%) |
| 65 to 74 Years | 0 (0.0%) | 9 (2.2%) |
| 75 Years and over | 17 (6.0%) | 53 (12.1%) |
Disability Class: Ambulatory Difficulty
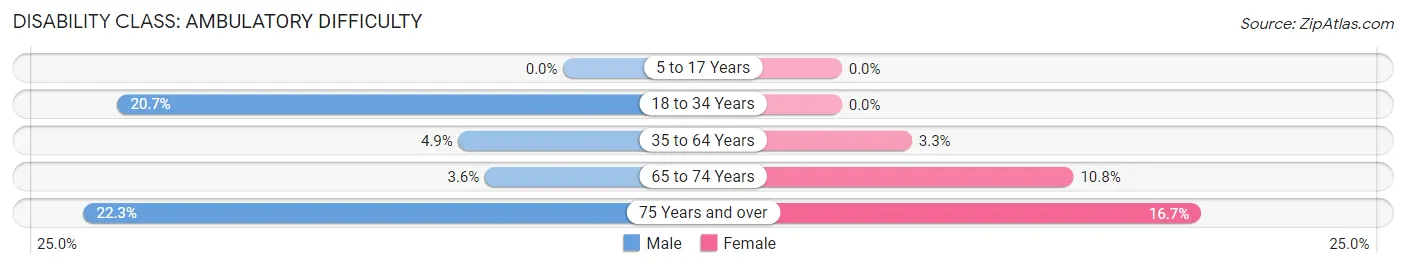
| Age Bracket | Male | Female |
| 5 to 17 Years | 0 (0.0%) | 0 (0.0%) |
| 18 to 34 Years | 185 (20.7%) | 0 (0.0%) |
| 35 to 64 Years | 85 (4.9%) | 61 (3.3%) |
| 65 to 74 Years | 14 (3.6%) | 43 (10.7%) |
| 75 Years and over | 63 (22.3%) | 73 (16.7%) |
Disability Class: Self-Care Difficulty
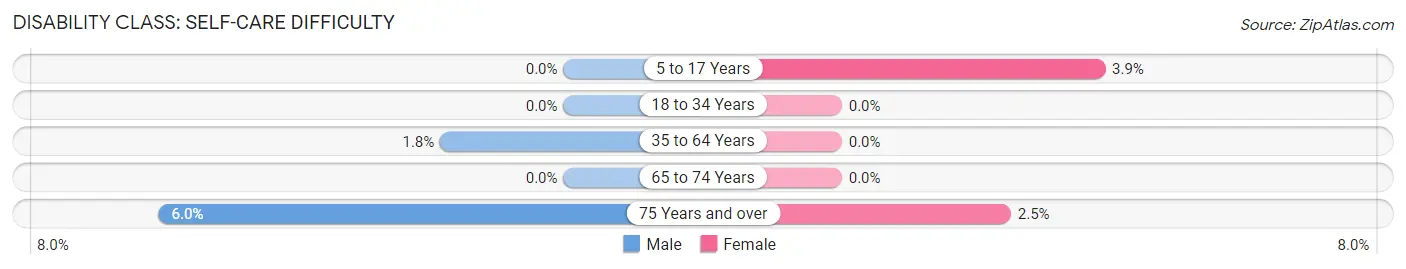
| Age Bracket | Male | Female |
| 5 to 17 Years | 0 (0.0%) | 43 (3.9%) |
| 18 to 34 Years | 0 (0.0%) | 0 (0.0%) |
| 35 to 64 Years | 32 (1.8%) | 0 (0.0%) |
| 65 to 74 Years | 0 (0.0%) | 0 (0.0%) |
| 75 Years and over | 17 (6.0%) | 11 (2.5%) |
Technology Access in Hermantown
Computing Device Access in Hermantown
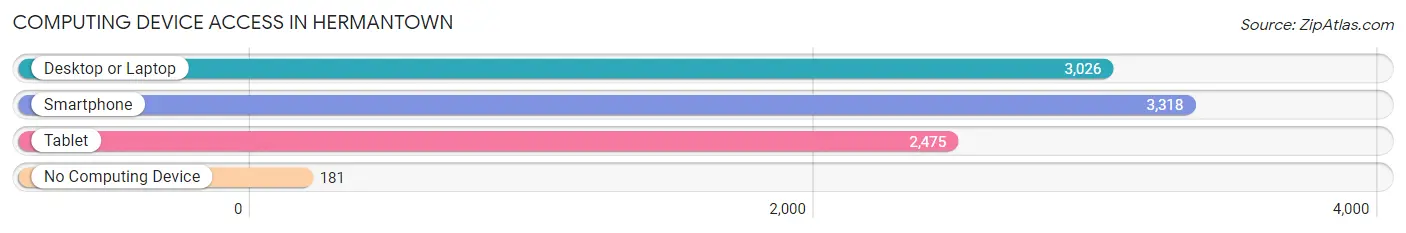
| Device Type | # Households | % Households |
| Desktop or Laptop | 3,026 | 80.9% |
| Smartphone | 3,318 | 88.8% |
| Tablet | 2,475 | 66.2% |
| No Computing Device | 181 | 4.8% |
| Total | 3,738 | 100.0% |
Internet Access in Hermantown
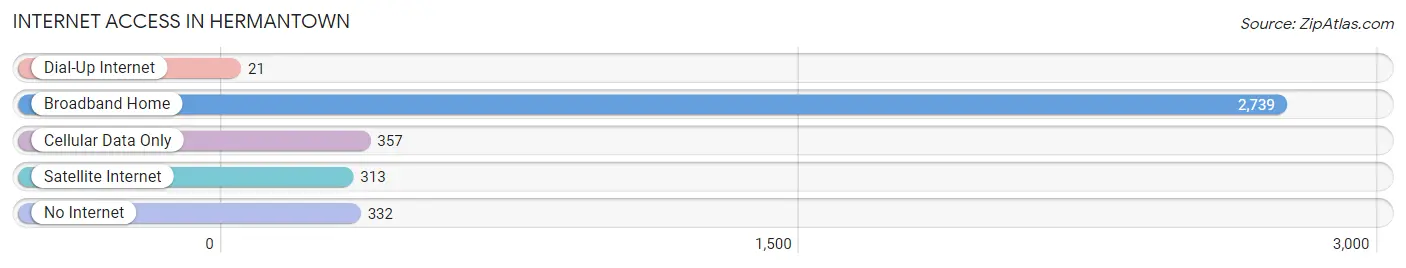
| Internet Type | # Households | % Households |
| Dial-Up Internet | 21 | 0.6% |
| Broadband Home | 2,739 | 73.3% |
| Cellular Data Only | 357 | 9.6% |
| Satellite Internet | 313 | 8.4% |
| No Internet | 332 | 8.9% |
| Total | 3,738 | 100.0% |
Hermantown Summary
Hemantown, Minnesota is a small city located in the northeastern part of the state, just south of Duluth. It is part of the Twin Cities metropolitan area and is home to a population of approximately 19,000 people. The city is known for its strong sense of community and its commitment to preserving its natural environment.
History
Hemantown was founded in 1854 by a group of settlers from Sweden. The settlers named the town after their leader, Hemant Anderson. The town was originally a farming community, but it soon developed into a small industrial center. The first industry in Hemantown was a sawmill, which was built in 1856. The sawmill was followed by a gristmill, a brickyard, and a tannery.
In the late 19th century, Hemantown began to grow rapidly. The city was incorporated in 1887 and the population had grown to over 1,000 by 1900. The city continued to grow throughout the 20th century, reaching a peak population of over 20,000 in the 1970s.
Geography
Hemantown is located in the northeastern part of Minnesota, just south of Duluth. The city is situated on the banks of the St. Louis River, which flows through the city and into Lake Superior. The city is surrounded by rolling hills and forests, and is home to several parks and nature preserves.
The climate in Hemantown is typical of the Upper Midwest, with cold winters and warm summers. The average temperature in January is around 10°F (-12°C), while the average temperature in July is around 70°F (21°C).
Economy
Hemantown’s economy is largely based on manufacturing and services. The city is home to several large manufacturing companies, including a paper mill, a steel mill, and a printing plant. The city is also home to several small businesses, including restaurants, retail stores, and professional services.
The city is also home to several educational institutions, including the University of Minnesota Duluth, the College of St. Scholastica, and the Lake Superior College.
Demographics
As of the 2010 census, the population of Hemantown was 19,039. The racial makeup of the city was 91.3% White, 3.2% African American, 0.7% Native American, 1.2% Asian, 0.1% Pacific Islander, 1.3% from other races, and 2.4% from two or more races. Hispanic or Latino of any race were 4.2% of the population.
The median household income in Hemantown was $45,845, and the median family income was $54,845. The per capita income for the city was $22,845. About 8.3% of families and 11.2% of the population were below the poverty line, including 15.2% of those under age 18 and 6.2% of those age 65 or over.
Hemantown is a diverse and vibrant city with a strong sense of community. The city is committed to preserving its natural environment and providing its citizens with a high quality of life. The city is home to a variety of businesses, educational institutions, and recreational opportunities, making it an ideal place to live and work.
Common Questions
What is Per Capita Income in Hermantown?
Per Capita income in Hermantown is $48,076.
What is the Median Family Income in Hermantown?
Median Family Income in Hermantown is $102,350.
What is the Median Household income in Hermantown?
Median Household Income in Hermantown is $85,417.
What is Income or Wage Gap in Hermantown?
Income or Wage Gap in Hermantown is 23.8%.
Women in Hermantown earn 76.2 cents for every dollar earned by a man.
What is Inequality or Gini Index in Hermantown?
Inequality or Gini Index in Hermantown is 0.48.
What is the Total Population of Hermantown?
Total Population of Hermantown is 10,135.
What is the Total Male Population of Hermantown?
Total Male Population of Hermantown is 5,156.
What is the Total Female Population of Hermantown?
Total Female Population of Hermantown is 4,979.
What is the Ratio of Males per 100 Females in Hermantown?
There are 103.55 Males per 100 Females in Hermantown.
What is the Ratio of Females per 100 Males in Hermantown?
There are 96.57 Females per 100 Males in Hermantown.
What is the Median Population Age in Hermantown?
Median Population Age in Hermantown is 38.0 Years.
What is the Average Family Size in Hermantown
Average Family Size in Hermantown is 3.0 People.
What is the Average Household Size in Hermantown
Average Household Size in Hermantown is 2.6 People.
How Large is the Labor Force in Hermantown?
There are 5,041 People in the Labor Forcein in Hermantown.
What is the Percentage of People in the Labor Force in Hermantown?
65.4% of People are in the Labor Force in Hermantown.
What is the Unemployment Rate in Hermantown?
Unemployment Rate in Hermantown is 1.8%.