Albany, MN Map & Demographics
Albany Map
Albany Overview
$39,964
PER CAPITA INCOME
$110,042
AVG FAMILY INCOME
$78,977
AVG HOUSEHOLD INCOME
27.5%
WAGE / INCOME GAP [ % ]
72.5¢/ $1
WAGE / INCOME GAP [ $ ]
$10,511
FAMILY INCOME DEFICIT
0.45
INEQUALITY / GINI INDEX
2,795
TOTAL POPULATION
1,158
MALE POPULATION
1,637
FEMALE POPULATION
70.74
MALES / 100 FEMALES
141.36
FEMALES / 100 MALES
40.1
MEDIAN AGE
3.0
AVG FAMILY SIZE
2.4
AVG HOUSEHOLD SIZE
1,335
LABOR FORCE [ PEOPLE ]
64.5%
PERCENT IN LABOR FORCE
0.7%
UNEMPLOYMENT RATE
Albany Zip Codes
Albany Area Codes
Income in Albany
Income Overview in Albany
Per Capita Income in Albany is $39,964, while median incomes of families and households are $110,042 and $78,977 respectively.
| Characteristic | Number | Measure |
| Per Capita Income | 2,795 | $39,964 |
| Median Family Income | 725 | $110,042 |
| Mean Family Income | 725 | $119,935 |
| Median Household Income | 1,149 | $78,977 |
| Mean Household Income | 1,149 | $94,467 |
| Income Deficit | 725 | $10,511 |
| Wage / Income Gap (%) | 2,795 | 27.54% |
| Wage / Income Gap ($) | 2,795 | 72.46¢ per $1 |
| Gini / Inequality Index | 2,795 | 0.45 |
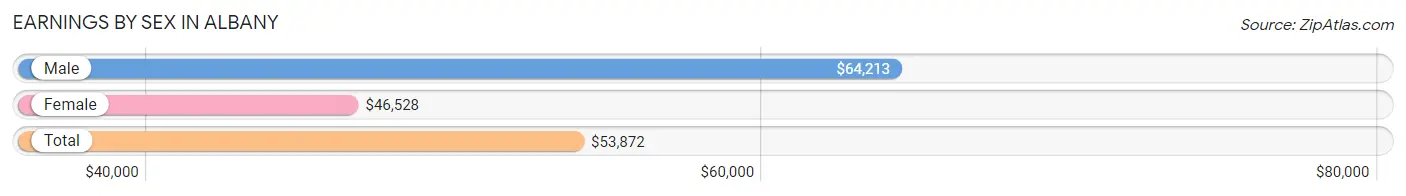
Earnings by Sex in Albany
Average Earnings in Albany are $53,872, $64,213 for men and $46,528 for women, a difference of 27.5%.
| Sex | Number | Average Earnings |
| Male | 661 (46.7%) | $64,213 |
| Female | 756 (53.3%) | $46,528 |
| Total | 1,417 (100.0%) | $53,872 |
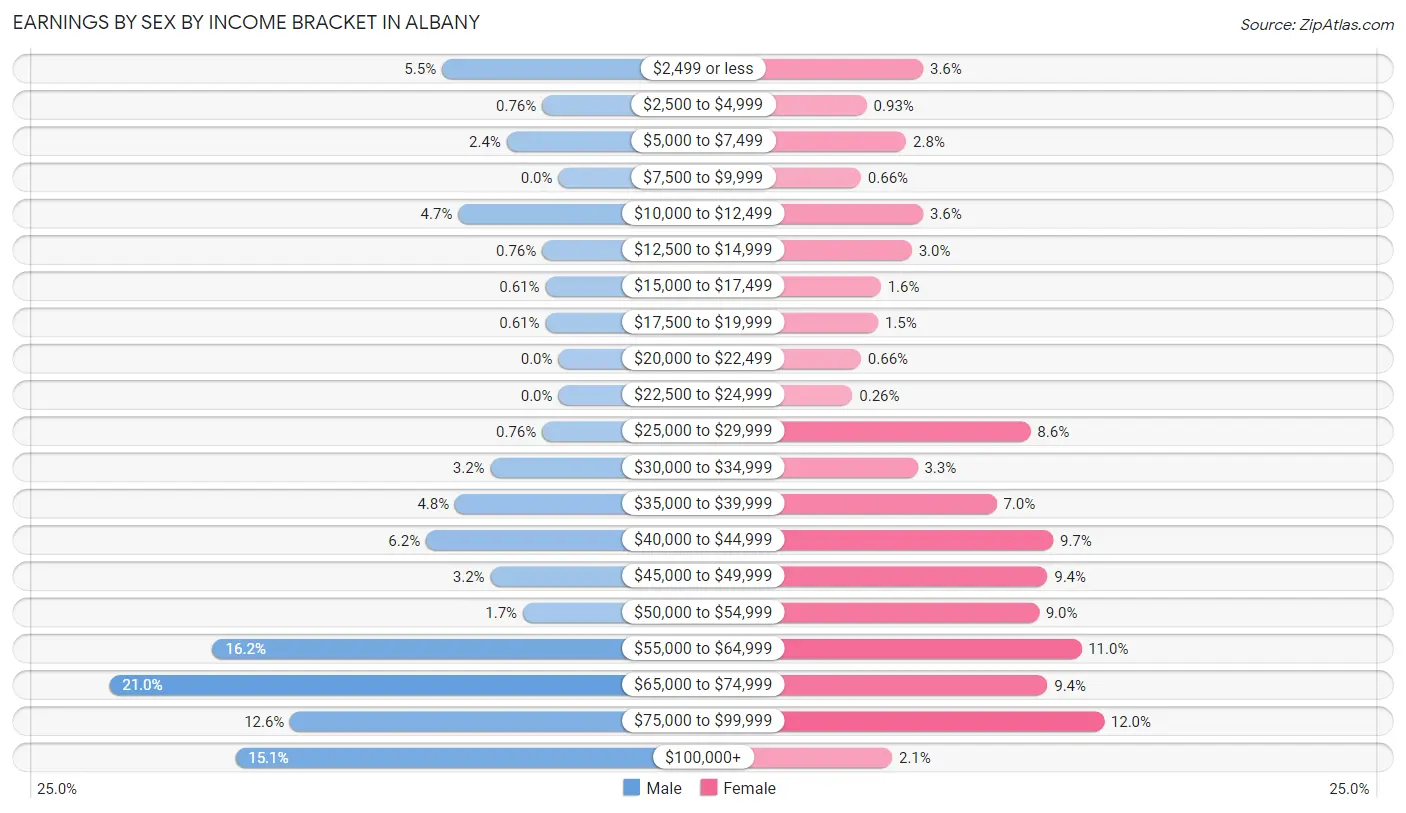
Earnings by Sex by Income Bracket in Albany
The most common earnings brackets in Albany are $65,000 to $74,999 for men (139 | 21.0%) and $75,000 to $99,999 for women (91 | 12.0%).
| Income | Male | Female |
| $2,499 or less | 36 (5.4%) | 27 (3.6%) |
| $2,500 to $4,999 | 5 (0.8%) | 7 (0.9%) |
| $5,000 to $7,499 | 16 (2.4%) | 21 (2.8%) |
| $7,500 to $9,999 | 0 (0.0%) | 5 (0.7%) |
| $10,000 to $12,499 | 31 (4.7%) | 27 (3.6%) |
| $12,500 to $14,999 | 5 (0.8%) | 23 (3.0%) |
| $15,000 to $17,499 | 4 (0.6%) | 12 (1.6%) |
| $17,500 to $19,999 | 4 (0.6%) | 11 (1.5%) |
| $20,000 to $22,499 | 0 (0.0%) | 5 (0.7%) |
| $22,500 to $24,999 | 0 (0.0%) | 2 (0.3%) |
| $25,000 to $29,999 | 5 (0.8%) | 65 (8.6%) |
| $30,000 to $34,999 | 21 (3.2%) | 25 (3.3%) |
| $35,000 to $39,999 | 32 (4.8%) | 53 (7.0%) |
| $40,000 to $44,999 | 41 (6.2%) | 73 (9.7%) |
| $45,000 to $49,999 | 21 (3.2%) | 71 (9.4%) |
| $50,000 to $54,999 | 11 (1.7%) | 68 (9.0%) |
| $55,000 to $64,999 | 107 (16.2%) | 83 (11.0%) |
| $65,000 to $74,999 | 139 (21.0%) | 71 (9.4%) |
| $75,000 to $99,999 | 83 (12.6%) | 91 (12.0%) |
| $100,000+ | 100 (15.1%) | 16 (2.1%) |
| Total | 661 (100.0%) | 756 (100.0%) |
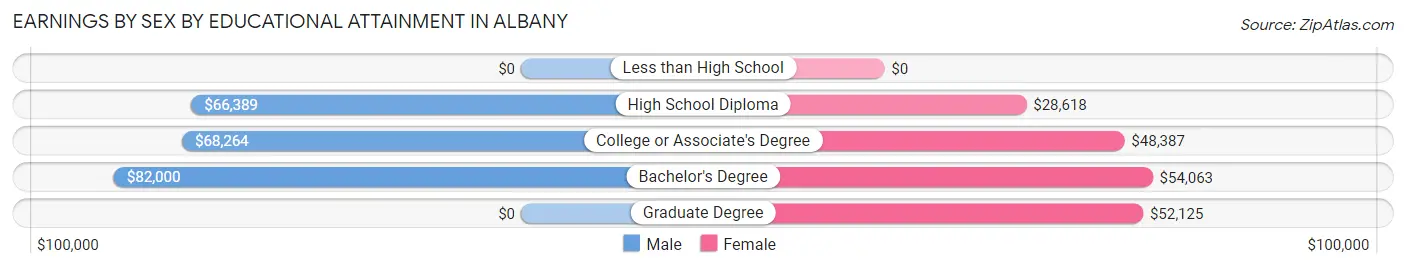
Earnings by Sex by Educational Attainment in Albany
Average earnings in Albany are $67,454 for men and $48,750 for women, a difference of 27.7%. Men with an educational attainment of bachelor's degree enjoy the highest average annual earnings of $82,000, while those with high school diploma education earn the least with $66,389. Women with an educational attainment of bachelor's degree earn the most with the average annual earnings of $54,063, while those with high school diploma education have the smallest earnings of $28,618.
| Educational Attainment | Male Income | Female Income |
| Less than High School | - | - |
| High School Diploma | $66,389 | $28,618 |
| College or Associate's Degree | $68,264 | $48,387 |
| Bachelor's Degree | $82,000 | $54,063 |
| Graduate Degree | - | - |
| Total | $67,454 | $48,750 |
Family Income in Albany
Family Income Brackets in Albany
According to the Albany family income data, there are 284 families falling into the $100,000 to $149,999 income range, which is the most common income bracket and makes up 39.2% of all families.
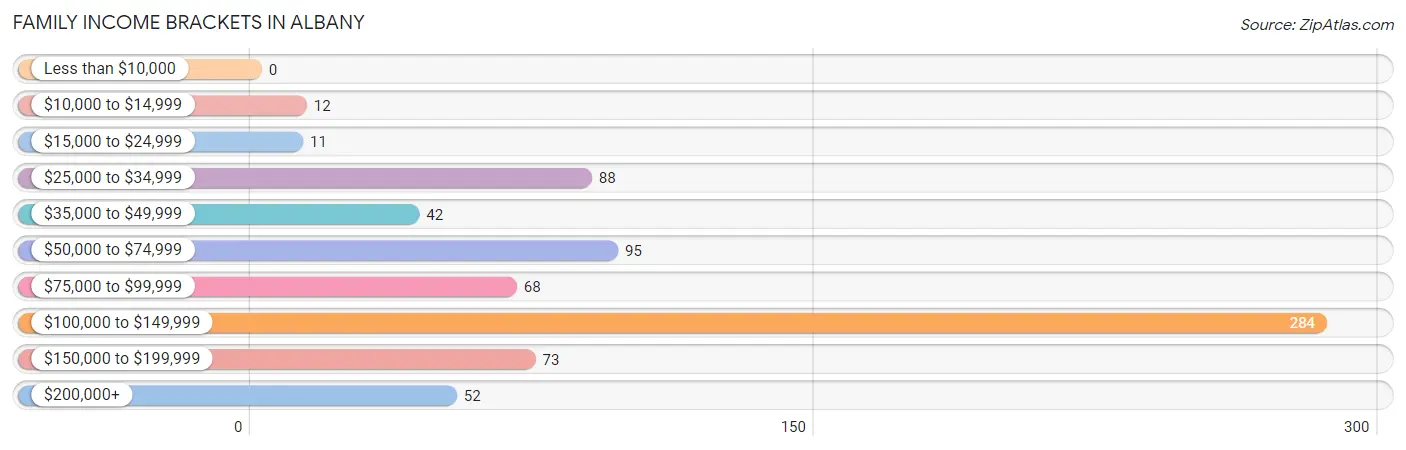
| Income Bracket | # Families | % Families |
| Less than $10,000 | 0 | 0.0% |
| $10,000 to $14,999 | 12 | 1.7% |
| $15,000 to $24,999 | 11 | 1.5% |
| $25,000 to $34,999 | 88 | 12.1% |
| $35,000 to $49,999 | 42 | 5.8% |
| $50,000 to $74,999 | 95 | 13.1% |
| $75,000 to $99,999 | 68 | 9.4% |
| $100,000 to $149,999 | 284 | 39.2% |
| $150,000 to $199,999 | 73 | 10.1% |
| $200,000+ | 52 | 7.2% |
Family Income by Famaliy Size in Albany
6-person families (18 | 2.5%) account for the highest median family income in Albany with $250,001 per family, while 6-person families (18 | 2.5%) have the highest median income of $41,667 per family member.
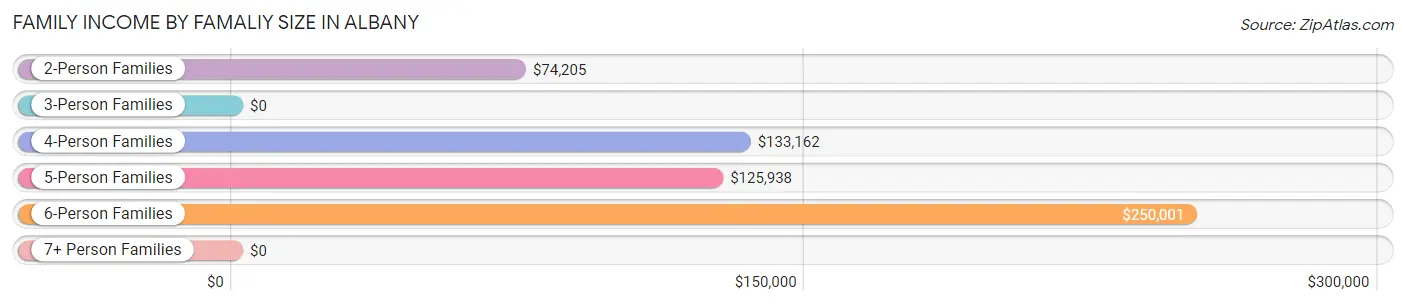
| Income Bracket | # Families | Median Income |
| 2-Person Families | 359 (49.5%) | $74,205 |
| 3-Person Families | 103 (14.2%) | $0 |
| 4-Person Families | 170 (23.4%) | $133,162 |
| 5-Person Families | 75 (10.3%) | $125,938 |
| 6-Person Families | 18 (2.5%) | $250,001 |
| 7+ Person Families | 0 (0.0%) | $0 |
| Total | 725 (100.0%) | $110,042 |
Family Income by Number of Earners in Albany
The median family income in Albany is $110,042, with families comprising 3+ earners (60) having the highest median family income of $136,250, while families with no earners (107) have the lowest median family income of $32,721, accounting for 8.3% and 14.8% of families, respectively.
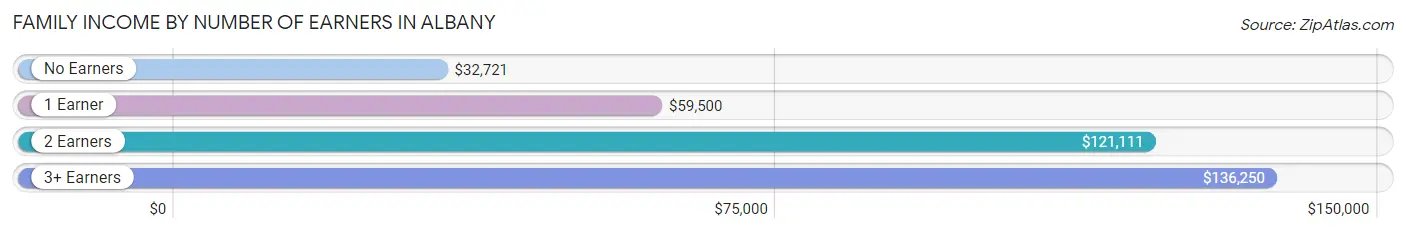
| Number of Earners | # Families | Median Income |
| No Earners | 107 (14.8%) | $32,721 |
| 1 Earner | 156 (21.5%) | $59,500 |
| 2 Earners | 402 (55.4%) | $121,111 |
| 3+ Earners | 60 (8.3%) | $136,250 |
| Total | 725 (100.0%) | $110,042 |
Household Income in Albany
Household Income Brackets in Albany
With 364 households falling in the category, the $100,000 to $149,999 income range is the most frequent in Albany, accounting for 31.7% of all households. In contrast, only 22 households (1.9%) fall into the less than $10,000 income bracket, making it the least populous group.
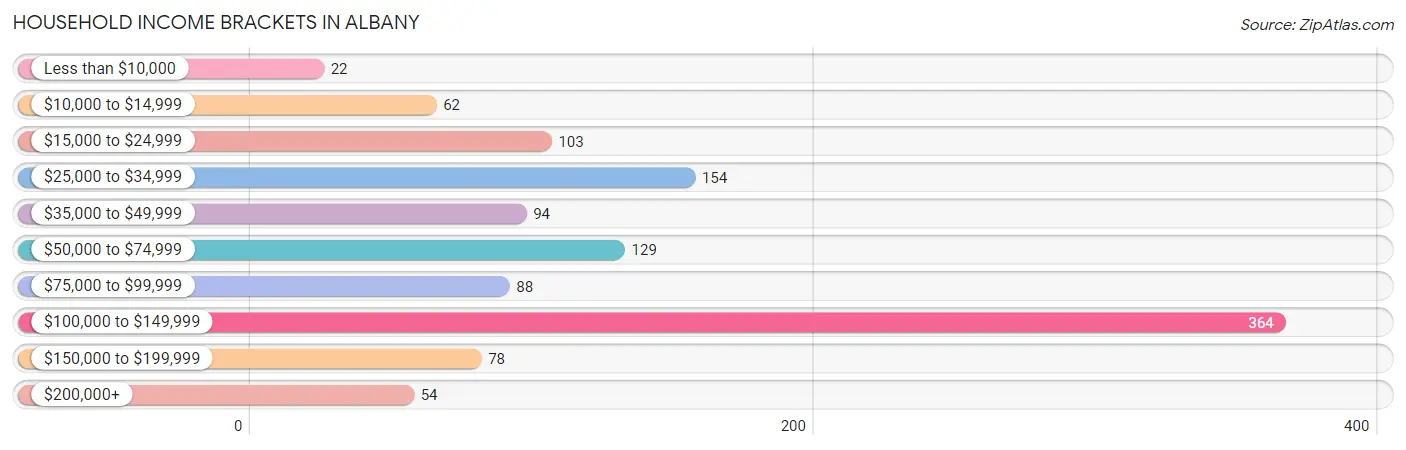
| Income Bracket | # Households | % Households |
| Less than $10,000 | 22 | 1.9% |
| $10,000 to $14,999 | 62 | 5.4% |
| $15,000 to $24,999 | 103 | 9.0% |
| $25,000 to $34,999 | 154 | 13.4% |
| $35,000 to $49,999 | 94 | 8.2% |
| $50,000 to $74,999 | 129 | 11.2% |
| $75,000 to $99,999 | 88 | 7.7% |
| $100,000 to $149,999 | 364 | 31.7% |
| $150,000 to $199,999 | 78 | 6.8% |
| $200,000+ | 54 | 4.7% |
Household Income by Householder Age in Albany
The median household income in Albany is $78,977, with the highest median household income of $125,240 found in the 25 to 44 years age bracket for the primary householder. A total of 355 households (30.9%) fall into this category. Meanwhile, the 65+ years age bracket for the primary householder has the lowest median household income of $28,984, with 420 households (36.5%) in this group.
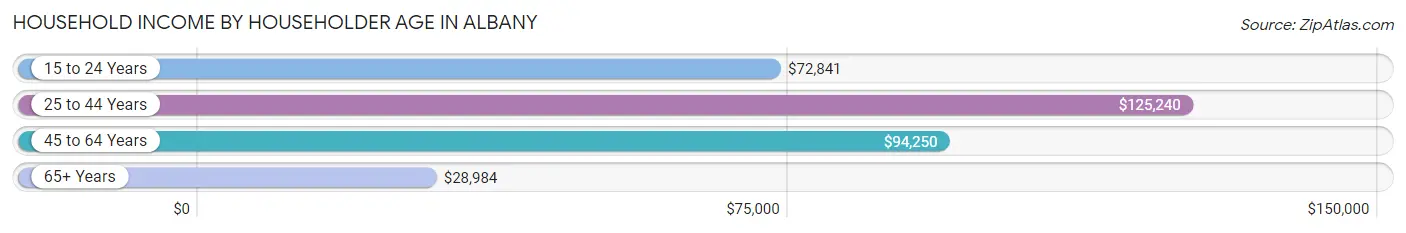
| Income Bracket | # Households | Median Income |
| 15 to 24 Years | 57 (5.0%) | $72,841 |
| 25 to 44 Years | 355 (30.9%) | $125,240 |
| 45 to 64 Years | 317 (27.6%) | $94,250 |
| 65+ Years | 420 (36.5%) | $28,984 |
| Total | 1,149 (100.0%) | $78,977 |
Poverty in Albany
Income Below Poverty by Sex and Age in Albany
With 3.6% poverty level for males and 4.1% for females among the residents of Albany, 16 and 17 year old males and 18 to 24 year old females are the most vulnerable to poverty, with 6 males (33.3%) and 8 females (9.5%) in their respective age groups living below the poverty level.
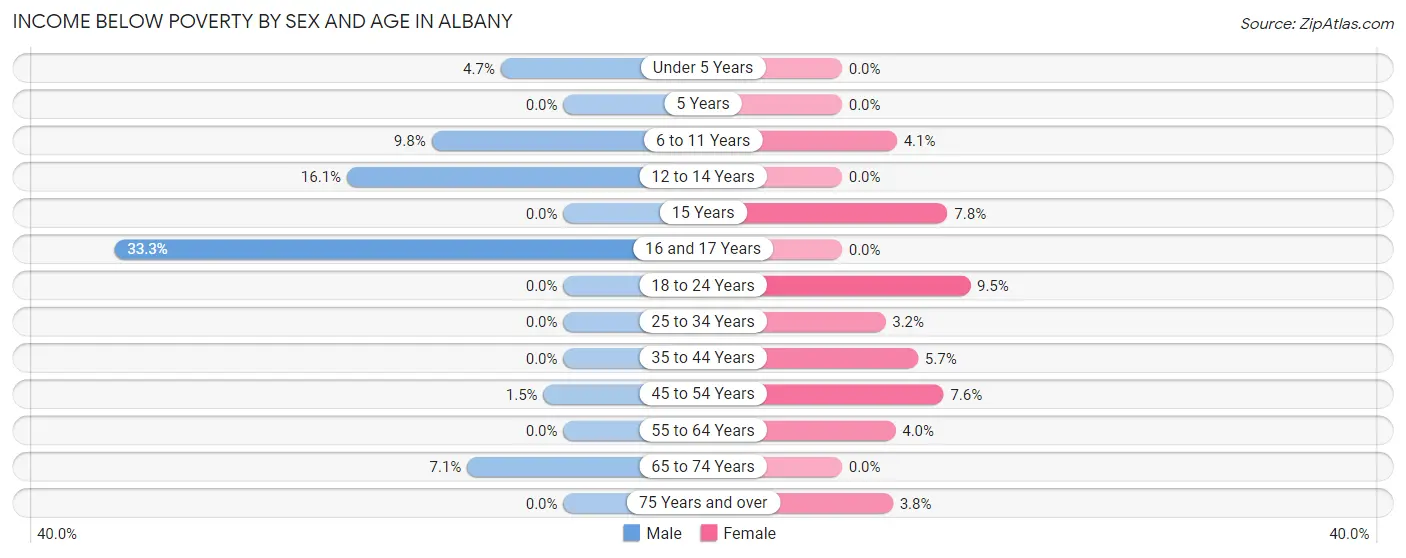
| Age Bracket | Male | Female |
| Under 5 Years | 4 (4.6%) | 0 (0.0%) |
| 5 Years | 0 (0.0%) | 0 (0.0%) |
| 6 to 11 Years | 14 (9.8%) | 8 (4.1%) |
| 12 to 14 Years | 9 (16.1%) | 0 (0.0%) |
| 15 Years | 0 (0.0%) | 4 (7.8%) |
| 16 and 17 Years | 6 (33.3%) | 0 (0.0%) |
| 18 to 24 Years | 0 (0.0%) | 8 (9.5%) |
| 25 to 34 Years | 0 (0.0%) | 5 (3.2%) |
| 35 to 44 Years | 0 (0.0%) | 13 (5.7%) |
| 45 to 54 Years | 2 (1.5%) | 12 (7.5%) |
| 55 to 64 Years | 0 (0.0%) | 5 (4.0%) |
| 65 to 74 Years | 5 (7.1%) | 0 (0.0%) |
| 75 Years and over | 0 (0.0%) | 11 (3.8%) |
| Total | 40 (3.6%) | 66 (4.1%) |
Income Above Poverty by Sex and Age in Albany
According to the poverty statistics in Albany, males aged 5 years and females aged under 5 years are the age groups that are most secure financially, with 100.0% of males and 100.0% of females in these age groups living above the poverty line.
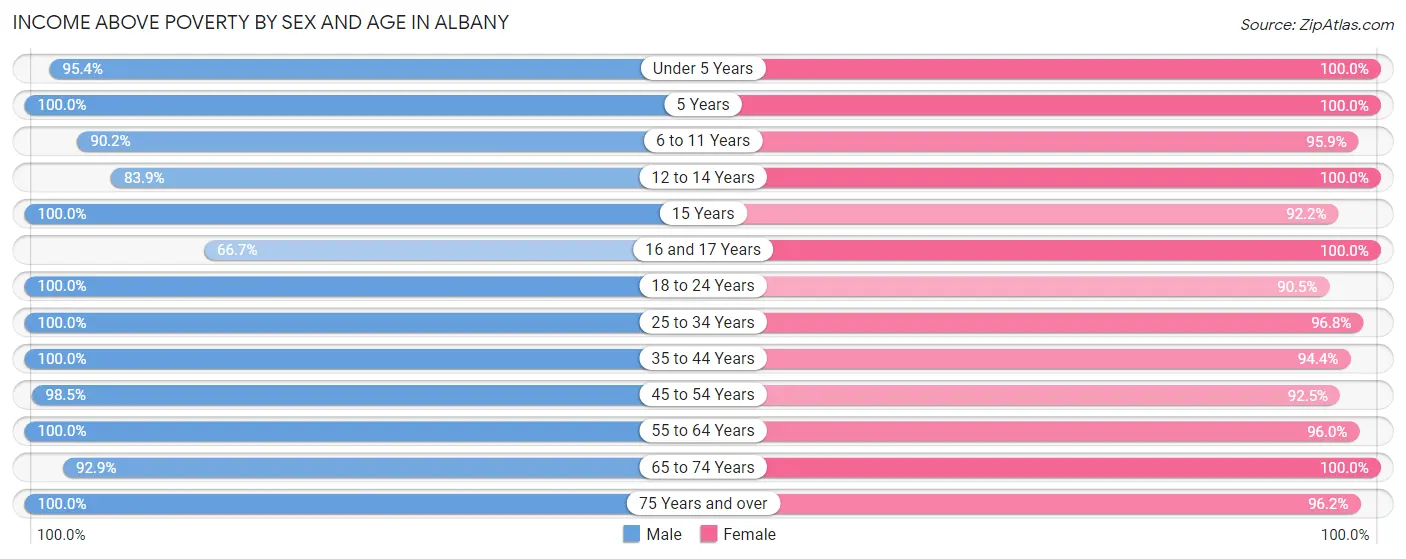
| Age Bracket | Male | Female |
| Under 5 Years | 82 (95.4%) | 42 (100.0%) |
| 5 Years | 4 (100.0%) | 15 (100.0%) |
| 6 to 11 Years | 129 (90.2%) | 188 (95.9%) |
| 12 to 14 Years | 47 (83.9%) | 106 (100.0%) |
| 15 Years | 22 (100.0%) | 47 (92.2%) |
| 16 and 17 Years | 12 (66.7%) | 26 (100.0%) |
| 18 to 24 Years | 105 (100.0%) | 76 (90.5%) |
| 25 to 34 Years | 102 (100.0%) | 150 (96.8%) |
| 35 to 44 Years | 193 (100.0%) | 217 (94.4%) |
| 45 to 54 Years | 133 (98.5%) | 147 (92.4%) |
| 55 to 64 Years | 111 (100.0%) | 121 (96.0%) |
| 65 to 74 Years | 65 (92.9%) | 129 (100.0%) |
| 75 Years and over | 66 (100.0%) | 280 (96.2%) |
| Total | 1,071 (96.4%) | 1,544 (95.9%) |
Income Below Poverty Among Married-Couple Families in Albany
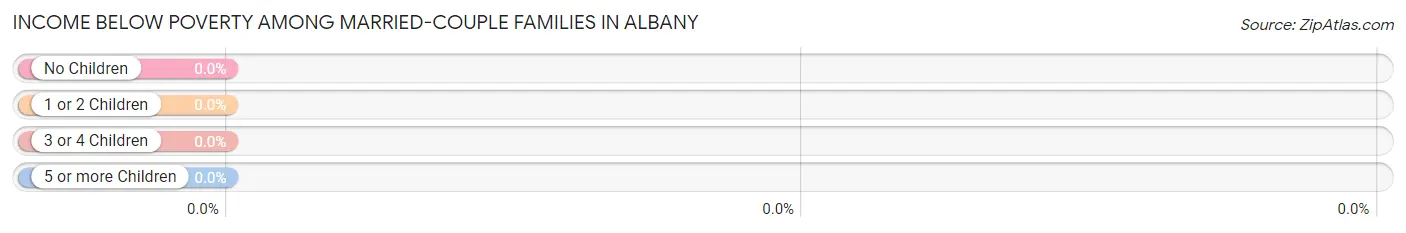
| Children | Above Poverty | Below Poverty |
| No Children | 281 (100.0%) | 0 (0.0%) |
| 1 or 2 Children | 183 (100.0%) | 0 (0.0%) |
| 3 or 4 Children | 89 (100.0%) | 0 (0.0%) |
| 5 or more Children | 0 (0.0%) | 0 (0.0%) |
| Total | 553 (100.0%) | 0 (0.0%) |
Income Below Poverty Among Single-Parent Households in Albany
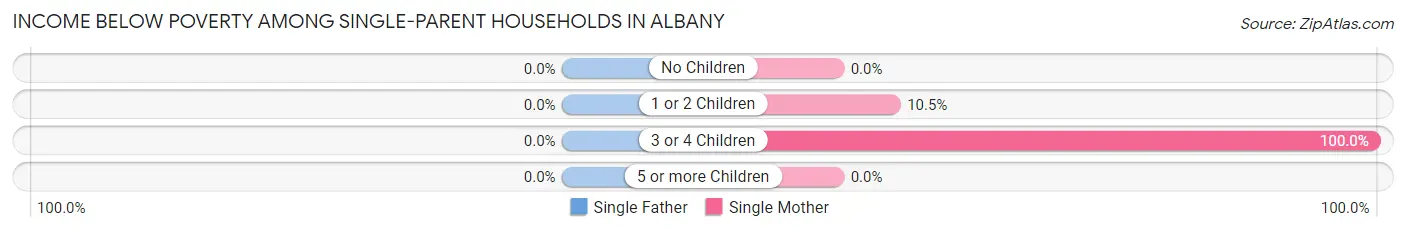
| Children | Single Father | Single Mother |
| No Children | 0 (0.0%) | 0 (0.0%) |
| 1 or 2 Children | 0 (0.0%) | 12 (10.5%) |
| 3 or 4 Children | 0 (0.0%) | 6 (100.0%) |
| 5 or more Children | 0 (0.0%) | 0 (0.0%) |
| Total | 0 (0.0%) | 18 (12.0%) |
Income Below Poverty Among Married-Couple vs Single-Parent Households in Albany
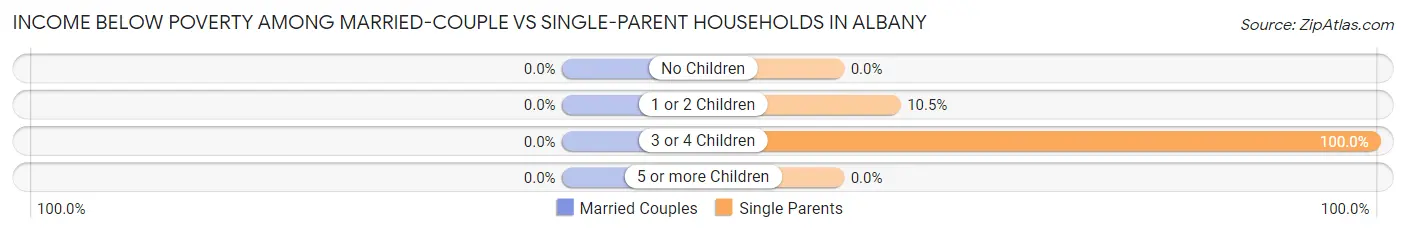
| Children | Married-Couple Families | Single-Parent Households |
| No Children | 0 (0.0%) | 0 (0.0%) |
| 1 or 2 Children | 0 (0.0%) | 12 (10.5%) |
| 3 or 4 Children | 0 (0.0%) | 6 (100.0%) |
| 5 or more Children | 0 (0.0%) | 0 (0.0%) |
| Total | 0 (0.0%) | 18 (10.5%) |
Race in Albany
The most populous races in Albany are White / Caucasian (2,667 | 95.4%), Two or more Races (83 | 3.0%), and Asian (34 | 1.2%).
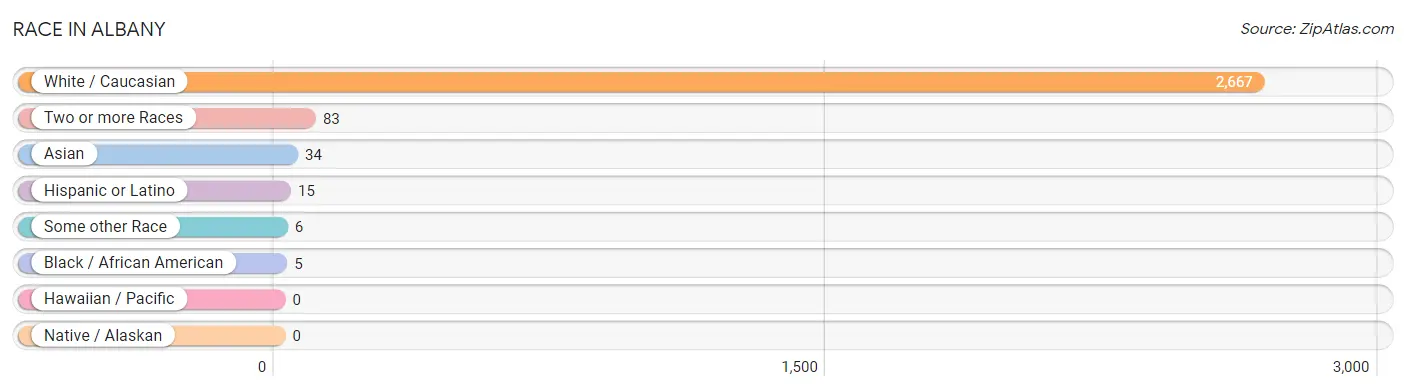
| Race | # Population | % Population |
| Asian | 34 | 1.2% |
| Black / African American | 5 | 0.2% |
| Hawaiian / Pacific | 0 | 0.0% |
| Hispanic or Latino | 15 | 0.5% |
| Native / Alaskan | 0 | 0.0% |
| White / Caucasian | 2,667 | 95.4% |
| Two or more Races | 83 | 3.0% |
| Some other Race | 6 | 0.2% |
| Total | 2,795 | 100.0% |
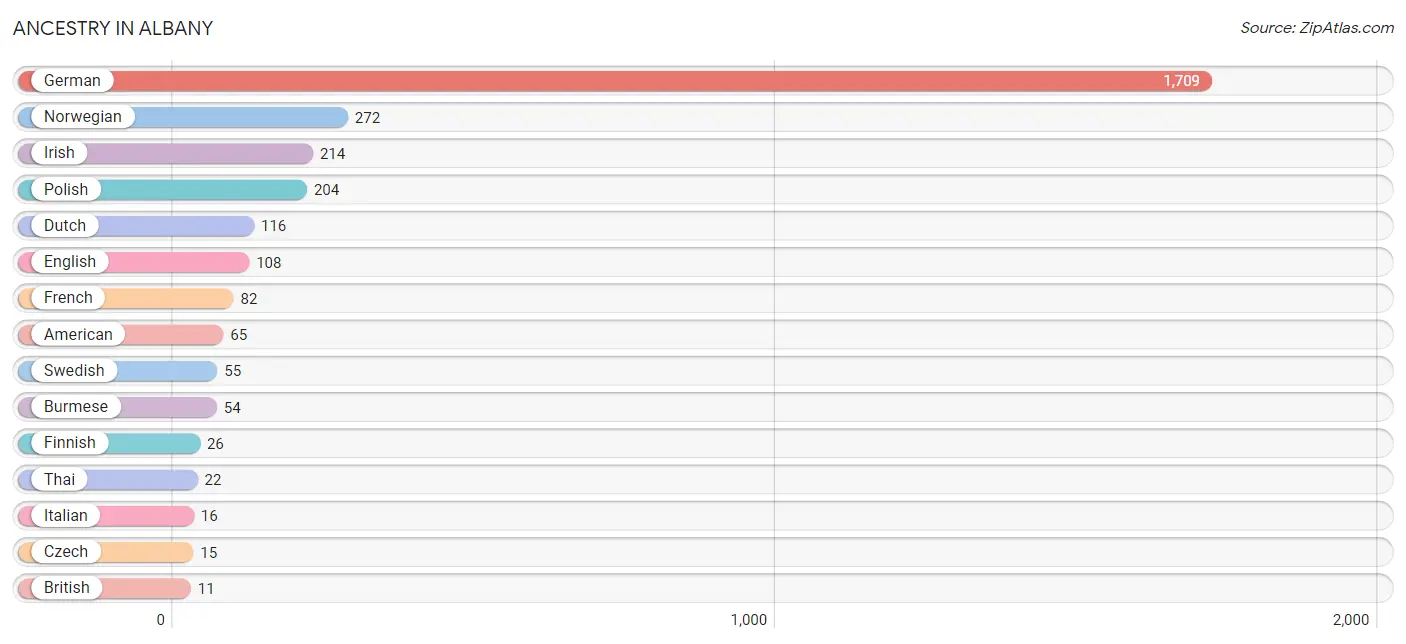
Ancestry in Albany
The most populous ancestries reported in Albany are German (1,709 | 61.1%), Norwegian (272 | 9.7%), Irish (214 | 7.7%), Polish (204 | 7.3%), and Dutch (116 | 4.2%), together accounting for 90.0% of all Albany residents.
| Ancestry | # Population | % Population |
| American | 65 | 2.3% |
| British | 11 | 0.4% |
| Burmese | 54 | 1.9% |
| Czech | 15 | 0.5% |
| Dutch | 116 | 4.2% |
| English | 108 | 3.9% |
| European | 4 | 0.1% |
| Finnish | 26 | 0.9% |
| French | 82 | 2.9% |
| German | 1,709 | 61.1% |
| Irish | 214 | 7.7% |
| Italian | 16 | 0.6% |
| Luxembourger | 2 | 0.1% |
| Mexican | 6 | 0.2% |
| Northern European | 9 | 0.3% |
| Norwegian | 272 | 9.7% |
| Polish | 204 | 7.3% |
| Scandinavian | 6 | 0.2% |
| Scottish | 8 | 0.3% |
| Spaniard | 9 | 0.3% |
| Swedish | 55 | 2.0% |
| Thai | 22 | 0.8% |
| Ukrainian | 2 | 0.1% | View All 23 Rows |
Immigrants in Albany
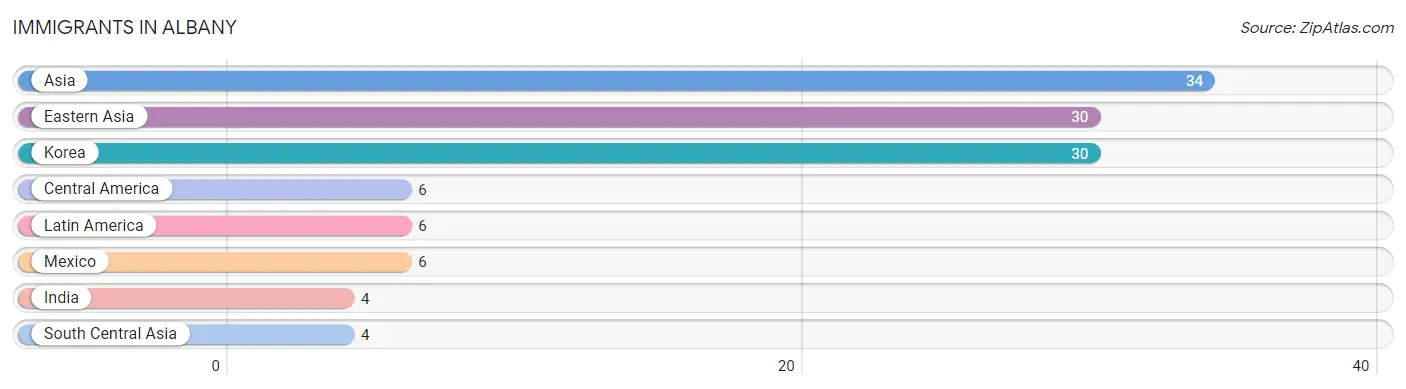
The most numerous immigrant groups reported in Albany came from Asia (34 | 1.2%), Eastern Asia (30 | 1.1%), Korea (30 | 1.1%), Central America (6 | 0.2%), and Latin America (6 | 0.2%), together accounting for 3.8% of all Albany residents.
| Immigration Origin | # Population | % Population |
| Asia | 34 | 1.2% |
| Central America | 6 | 0.2% |
| Eastern Asia | 30 | 1.1% |
| India | 4 | 0.1% |
| Korea | 30 | 1.1% |
| Latin America | 6 | 0.2% |
| Mexico | 6 | 0.2% |
| South Central Asia | 4 | 0.1% | View All 8 Rows |
Sex and Age in Albany
Sex and Age in Albany
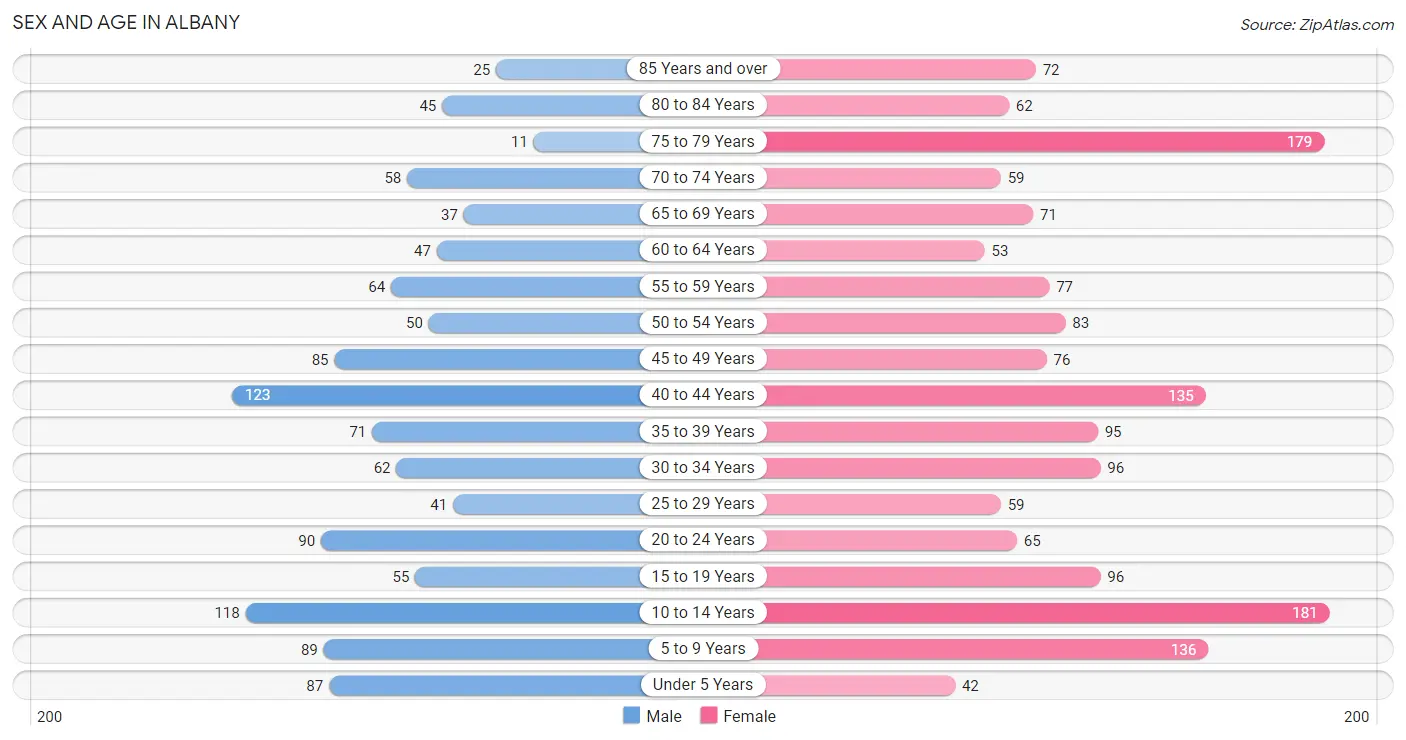
The most populous age groups in Albany are 40 to 44 Years (123 | 10.6%) for men and 10 to 14 Years (181 | 11.1%) for women.
| Age Bracket | Male | Female |
| Under 5 Years | 87 (7.5%) | 42 (2.6%) |
| 5 to 9 Years | 89 (7.7%) | 136 (8.3%) |
| 10 to 14 Years | 118 (10.2%) | 181 (11.1%) |
| 15 to 19 Years | 55 (4.8%) | 96 (5.9%) |
| 20 to 24 Years | 90 (7.8%) | 65 (4.0%) |
| 25 to 29 Years | 41 (3.5%) | 59 (3.6%) |
| 30 to 34 Years | 62 (5.3%) | 96 (5.9%) |
| 35 to 39 Years | 71 (6.1%) | 95 (5.8%) |
| 40 to 44 Years | 123 (10.6%) | 135 (8.3%) |
| 45 to 49 Years | 85 (7.3%) | 76 (4.6%) |
| 50 to 54 Years | 50 (4.3%) | 83 (5.1%) |
| 55 to 59 Years | 64 (5.5%) | 77 (4.7%) |
| 60 to 64 Years | 47 (4.1%) | 53 (3.2%) |
| 65 to 69 Years | 37 (3.2%) | 71 (4.3%) |
| 70 to 74 Years | 58 (5.0%) | 59 (3.6%) |
| 75 to 79 Years | 11 (0.9%) | 179 (10.9%) |
| 80 to 84 Years | 45 (3.9%) | 62 (3.8%) |
| 85 Years and over | 25 (2.2%) | 72 (4.4%) |
| Total | 1,158 (100.0%) | 1,637 (100.0%) |
Families and Households in Albany
Median Family Size in Albany
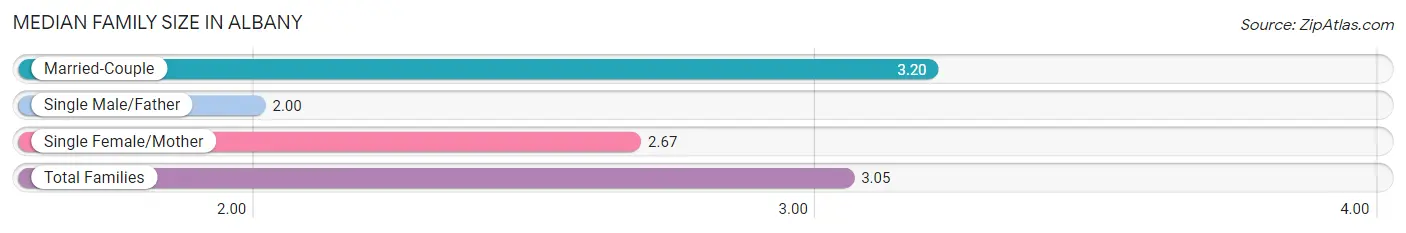
The median family size in Albany is 3.05 persons per family, with married-couple families (553 | 76.3%) accounting for the largest median family size of 3.2 persons per family. On the other hand, single male/father families (22 | 3.0%) represent the smallest median family size with 2.00 persons per family.
| Family Type | # Families | Family Size |
| Married-Couple | 553 (76.3%) | 3.20 |
| Single Male/Father | 22 (3.0%) | 2.00 |
| Single Female/Mother | 150 (20.7%) | 2.67 |
| Total Families | 725 (100.0%) | 3.05 |
Median Household Size in Albany
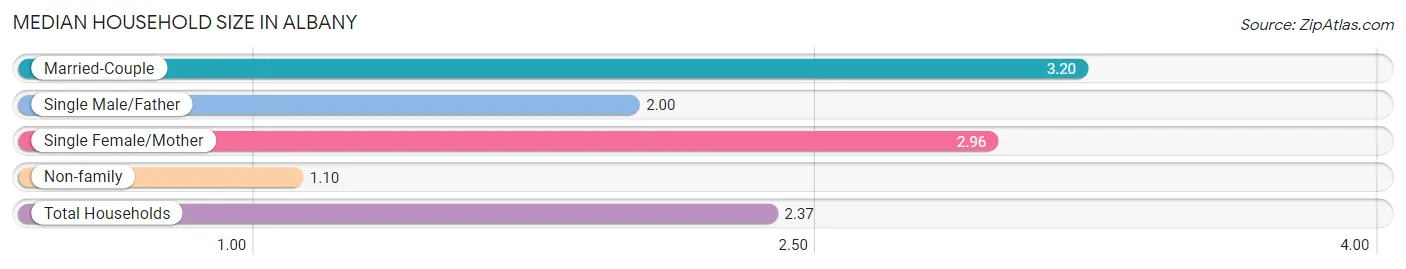
The median household size in Albany is 2.37 persons per household, with married-couple households (553 | 48.1%) accounting for the largest median household size of 3.2 persons per household. non-family households (424 | 36.9%) represent the smallest median household size with 1.10 persons per household.
| Household Type | # Households | Household Size |
| Married-Couple | 553 (48.1%) | 3.20 |
| Single Male/Father | 22 (1.9%) | 2.00 |
| Single Female/Mother | 150 (13.1%) | 2.96 |
| Non-family | 424 (36.9%) | 1.10 |
| Total Households | 1,149 (100.0%) | 2.37 |
Household Size by Marriage Status in Albany
Out of a total of 1,149 households in Albany, 725 (63.1%) are family households, while 424 (36.9%) are nonfamily households. The most numerous type of family households are 2-person households, comprising 340, and the most common type of nonfamily households are 1-person households, comprising 403.
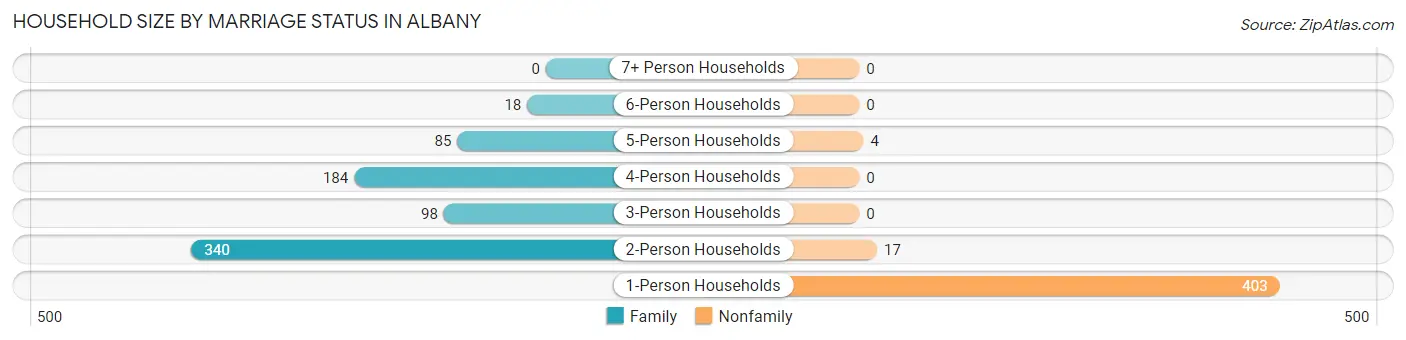
| Household Size | Family Households | Nonfamily Households |
| 1-Person Households | - | 403 (35.1%) |
| 2-Person Households | 340 (29.6%) | 17 (1.5%) |
| 3-Person Households | 98 (8.5%) | 0 (0.0%) |
| 4-Person Households | 184 (16.0%) | 0 (0.0%) |
| 5-Person Households | 85 (7.4%) | 4 (0.4%) |
| 6-Person Households | 18 (1.6%) | 0 (0.0%) |
| 7+ Person Households | 0 (0.0%) | 0 (0.0%) |
| Total | 725 (63.1%) | 424 (36.9%) |
Female Fertility in Albany
Fertility by Age in Albany
Average fertility rate in Albany is 33.0 births per 1,000 women. Women in the age bracket of 20 to 34 years have the highest fertility rate with 73.0 births per 1,000 women. Women in the age bracket of 20 to 34 years acount for 76.2% of all women with births.
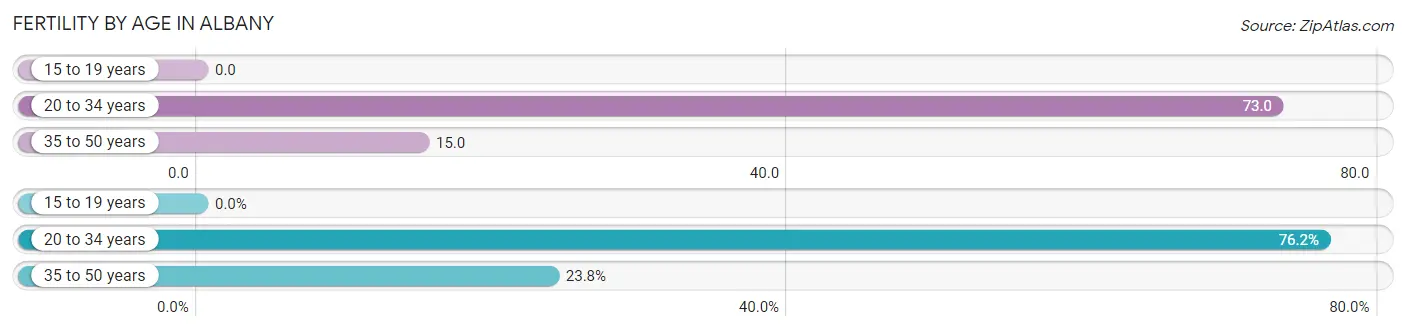
| Age Bracket | Women with Births | Births / 1,000 Women |
| 15 to 19 years | 0 (0.0%) | 0.0 |
| 20 to 34 years | 16 (76.2%) | 73.0 |
| 35 to 50 years | 5 (23.8%) | 15.0 |
| Total | 21 (100.0%) | 33.0 |
Fertility by Age by Marriage Status in Albany
47.6% of women with births (21) in Albany are married. The highest percentage of unmarried women with births falls into 35 to 50 years age bracket with 100.0% of them unmarried at the time of birth, while the lowest percentage of unmarried women with births belong to 20 to 34 years age bracket with 37.5% of them unmarried.
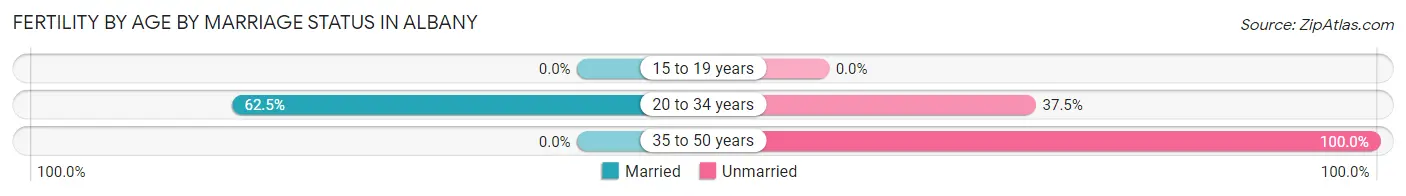
| Age Bracket | Married | Unmarried |
| 15 to 19 years | 0 (0.0%) | 0 (0.0%) |
| 20 to 34 years | 10 (62.5%) | 6 (37.5%) |
| 35 to 50 years | 0 (0.0%) | 5 (100.0%) |
| Total | 10 (47.6%) | 11 (52.4%) |
Fertility by Education in Albany
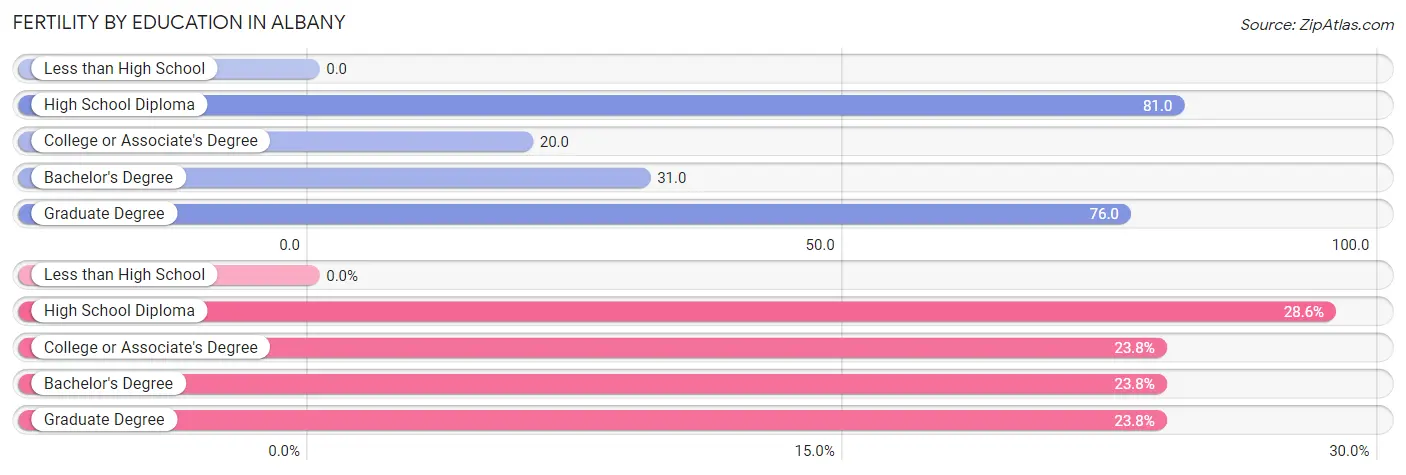
| Educational Attainment | Women with Births | Births / 1,000 Women |
| Less than High School | 0 (0.0%) | 0.0 |
| High School Diploma | 6 (28.6%) | 81.0 |
| College or Associate's Degree | 5 (23.8%) | 20.0 |
| Bachelor's Degree | 5 (23.8%) | 31.0 |
| Graduate Degree | 5 (23.8%) | 76.0 |
| Total | 21 (100.0%) | 33.0 |
Fertility by Education by Marriage Status in Albany
52.4% of women with births in Albany are unmarried. Women with the educational attainment of bachelor's degree are most likely to be married with 100.0% of them married at childbirth, while women with the educational attainment of high school diploma are least likely to be married with 100.0% of them unmarried at childbirth.
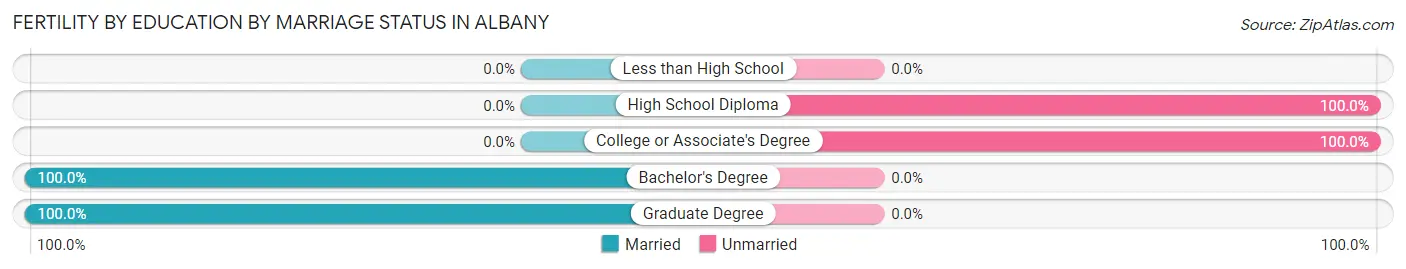
| Educational Attainment | Married | Unmarried |
| Less than High School | 0 (0.0%) | 0 (0.0%) |
| High School Diploma | 0 (0.0%) | 6 (100.0%) |
| College or Associate's Degree | 0 (0.0%) | 5 (100.0%) |
| Bachelor's Degree | 5 (100.0%) | 0 (0.0%) |
| Graduate Degree | 5 (100.0%) | 0 (0.0%) |
| Total | 10 (47.6%) | 11 (52.4%) |
Employment Characteristics in Albany
Employment by Class of Employer in Albany
Among the 1,316 employed individuals in Albany, private company employees (929 | 70.6%), not-for-profit organizations (143 | 10.9%), and self-employed (incorporated) (56 | 4.3%) make up the most common classes of employment.
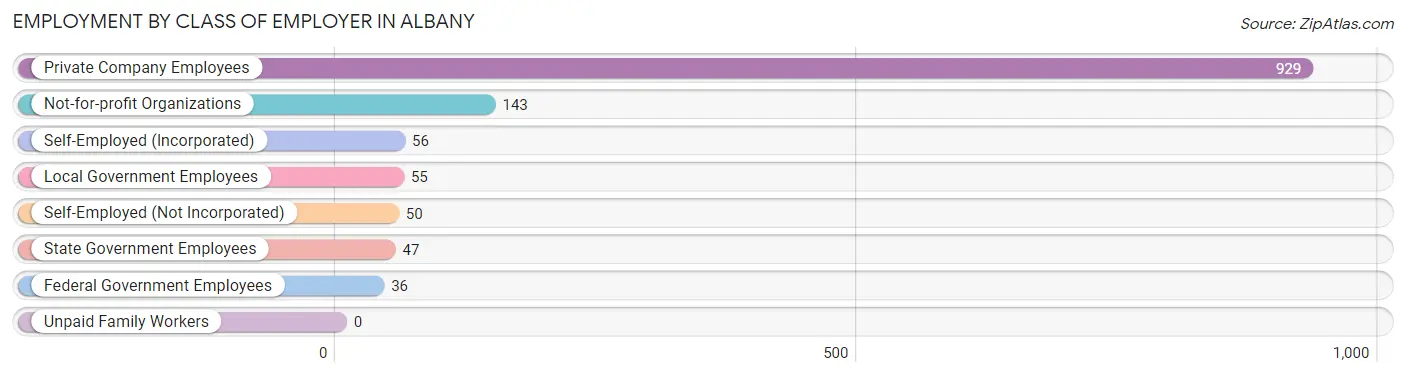
| Employer Class | # Employees | % Employees |
| Private Company Employees | 929 | 70.6% |
| Self-Employed (Incorporated) | 56 | 4.3% |
| Self-Employed (Not Incorporated) | 50 | 3.8% |
| Not-for-profit Organizations | 143 | 10.9% |
| Local Government Employees | 55 | 4.2% |
| State Government Employees | 47 | 3.6% |
| Federal Government Employees | 36 | 2.7% |
| Unpaid Family Workers | 0 | 0.0% |
| Total | 1,316 | 100.0% |
Employment Status by Age in Albany
According to the labor force statistics for Albany, out of the total population over 16 years of age (2,069), 64.5% or 1,335 individuals are in the labor force, with 0.7% or 9 of them unemployed. The age group with the highest labor force participation rate is 25 to 29 years, with 100.0% or 100 individuals in the labor force. Within the labor force, the 30 to 34 years age range has the highest percentage of unemployed individuals, with 2.5% or 4 of them being unemployed.
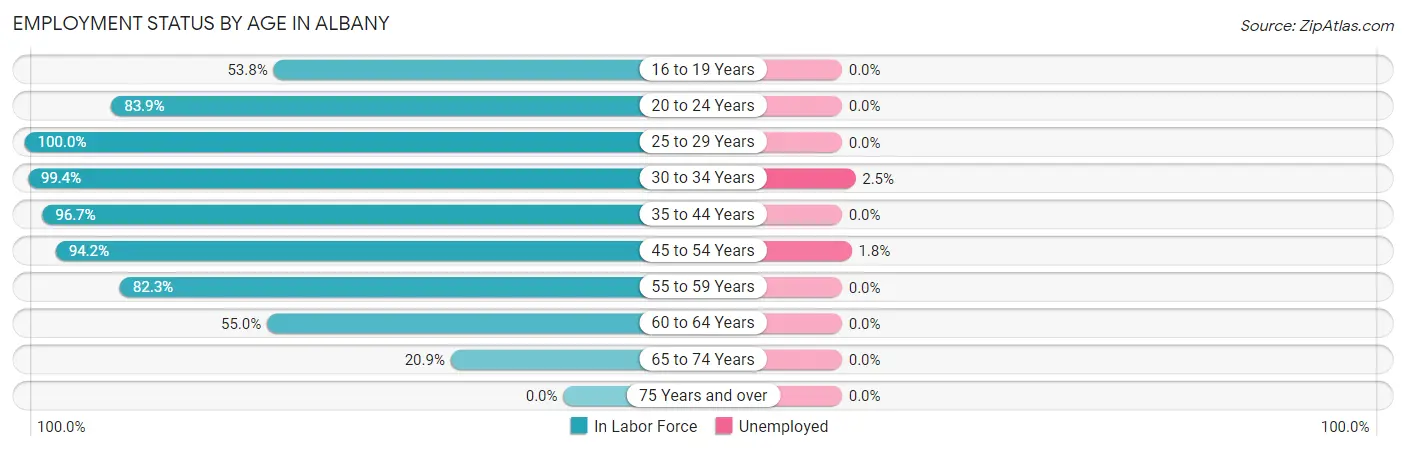
| Age Bracket | In Labor Force | Unemployed |
| 16 to 19 Years | 42 (53.8%) | 0 (0.0%) |
| 20 to 24 Years | 130 (83.9%) | 0 (0.0%) |
| 25 to 29 Years | 100 (100.0%) | 0 (0.0%) |
| 30 to 34 Years | 157 (99.4%) | 4 (2.5%) |
| 35 to 44 Years | 410 (96.7%) | 0 (0.0%) |
| 45 to 54 Years | 277 (94.2%) | 5 (1.8%) |
| 55 to 59 Years | 116 (82.3%) | 0 (0.0%) |
| 60 to 64 Years | 55 (55.0%) | 0 (0.0%) |
| 65 to 74 Years | 47 (20.9%) | 0 (0.0%) |
| 75 Years and over | 0 (0.0%) | 0 (0.0%) |
| Total | 1,335 (64.5%) | 9 (0.7%) |
Employment Status by Educational Attainment in Albany
According to labor force statistics for Albany, 91.6% of individuals (1,115) out of the total population between 25 and 64 years of age (1,217) are in the labor force, with 0.8% or 9 of them being unemployed. The group with the highest labor force participation rate are those with the educational attainment of bachelor's degree or higher, with 98.3% or 357 individuals in the labor force. Within the labor force, individuals with bachelor's degree or higher education have the highest percentage of unemployment, with 1.4% or 5 of them being unemployed.
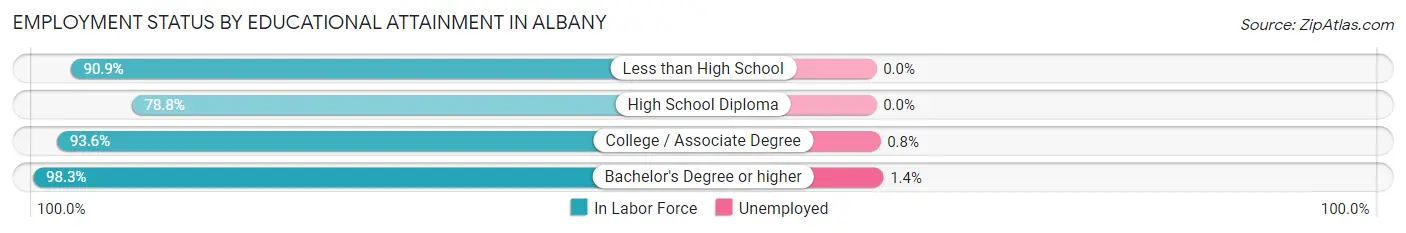
| Educational Attainment | In Labor Force | Unemployed |
| Less than High School | 10 (90.9%) | 0 (0.0%) |
| High School Diploma | 219 (78.8%) | 0 (0.0%) |
| College / Associate Degree | 529 (93.6%) | 5 (0.8%) |
| Bachelor's Degree or higher | 357 (98.3%) | 5 (1.4%) |
| Total | 1,115 (91.6%) | 10 (0.8%) |
Employment Occupations by Sex in Albany
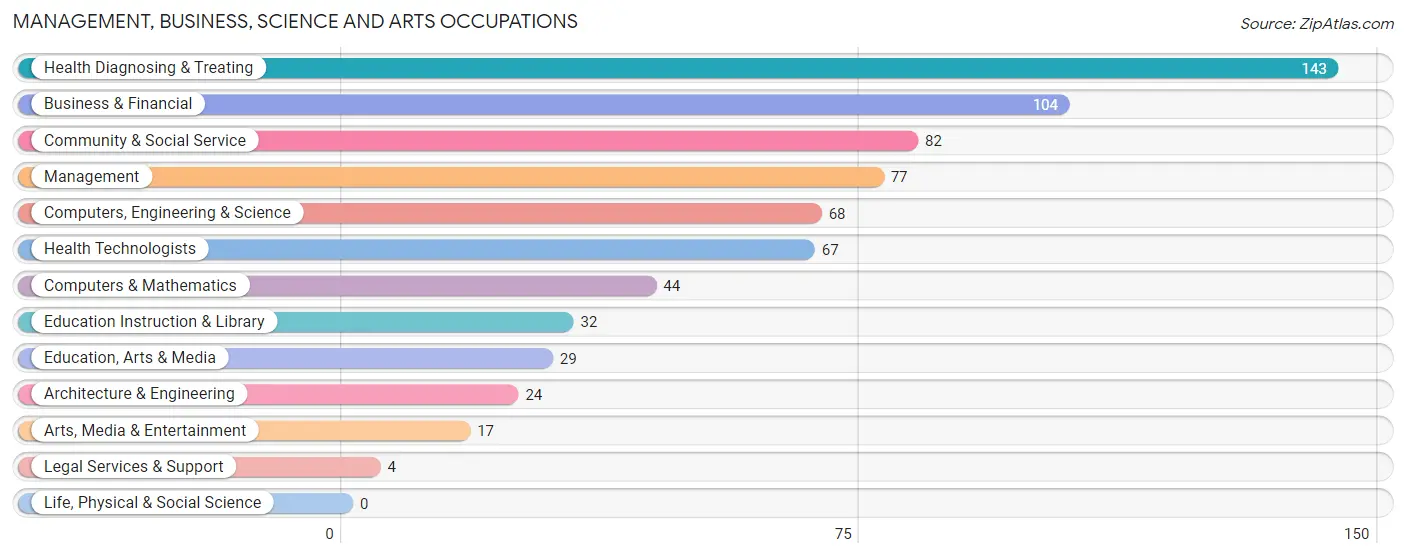
Management, Business, Science and Arts Occupations
The most common Management, Business, Science and Arts occupations in Albany are Health Diagnosing & Treating (143 | 10.8%), Business & Financial (104 | 7.9%), Community & Social Service (82 | 6.2%), Management (77 | 5.8%), and Computers, Engineering & Science (68 | 5.1%).
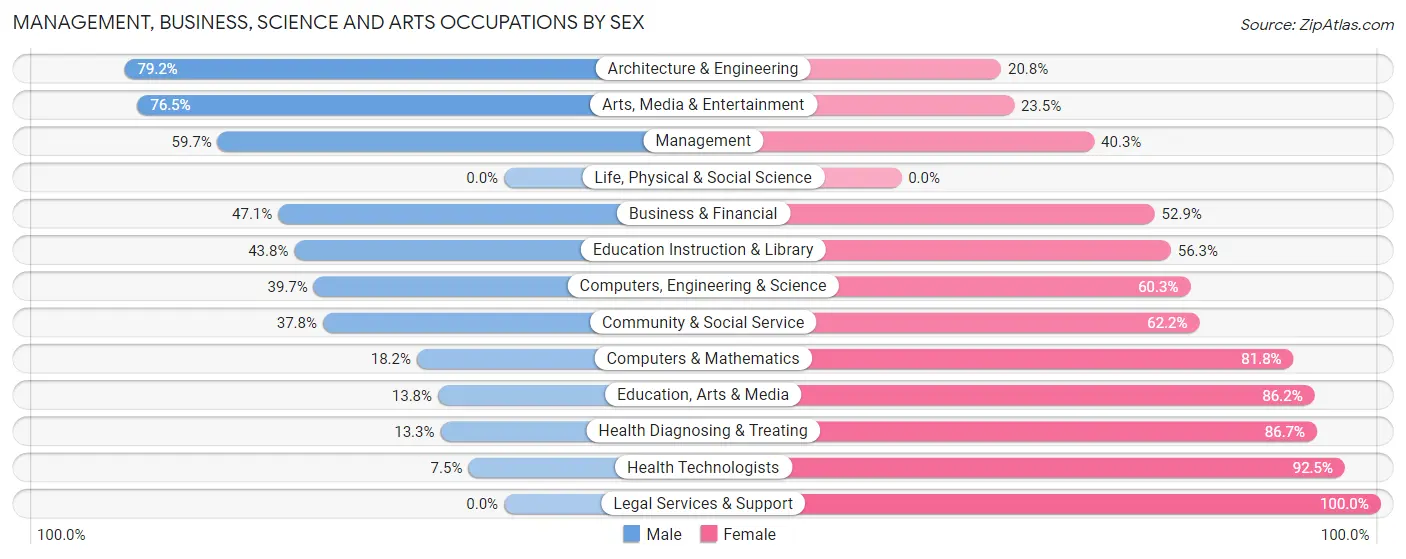
Management, Business, Science and Arts Occupations by Sex
Within the Management, Business, Science and Arts occupations in Albany, the most male-oriented occupations are Architecture & Engineering (79.2%), Arts, Media & Entertainment (76.5%), and Management (59.7%), while the most female-oriented occupations are Legal Services & Support (100.0%), Health Technologists (92.5%), and Health Diagnosing & Treating (86.7%).
| Occupation | Male | Female |
| Management | 46 (59.7%) | 31 (40.3%) |
| Business & Financial | 49 (47.1%) | 55 (52.9%) |
| Computers, Engineering & Science | 27 (39.7%) | 41 (60.3%) |
| Computers & Mathematics | 8 (18.2%) | 36 (81.8%) |
| Architecture & Engineering | 19 (79.2%) | 5 (20.8%) |
| Life, Physical & Social Science | 0 (0.0%) | 0 (0.0%) |
| Community & Social Service | 31 (37.8%) | 51 (62.2%) |
| Education, Arts & Media | 4 (13.8%) | 25 (86.2%) |
| Legal Services & Support | 0 (0.0%) | 4 (100.0%) |
| Education Instruction & Library | 14 (43.8%) | 18 (56.2%) |
| Arts, Media & Entertainment | 13 (76.5%) | 4 (23.5%) |
| Health Diagnosing & Treating | 19 (13.3%) | 124 (86.7%) |
| Health Technologists | 5 (7.5%) | 62 (92.5%) |
| Total (Category) | 172 (36.3%) | 302 (63.7%) |
| Total (Overall) | 614 (46.3%) | 711 (53.7%) |
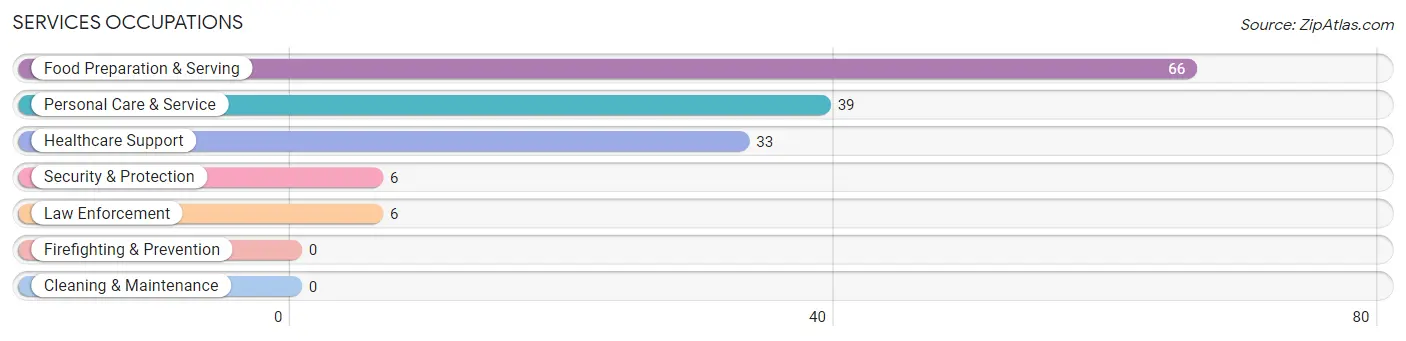
Services Occupations
The most common Services occupations in Albany are Food Preparation & Serving (66 | 5.0%), Personal Care & Service (39 | 2.9%), Healthcare Support (33 | 2.5%), Security & Protection (6 | 0.4%), and Law Enforcement (6 | 0.4%).
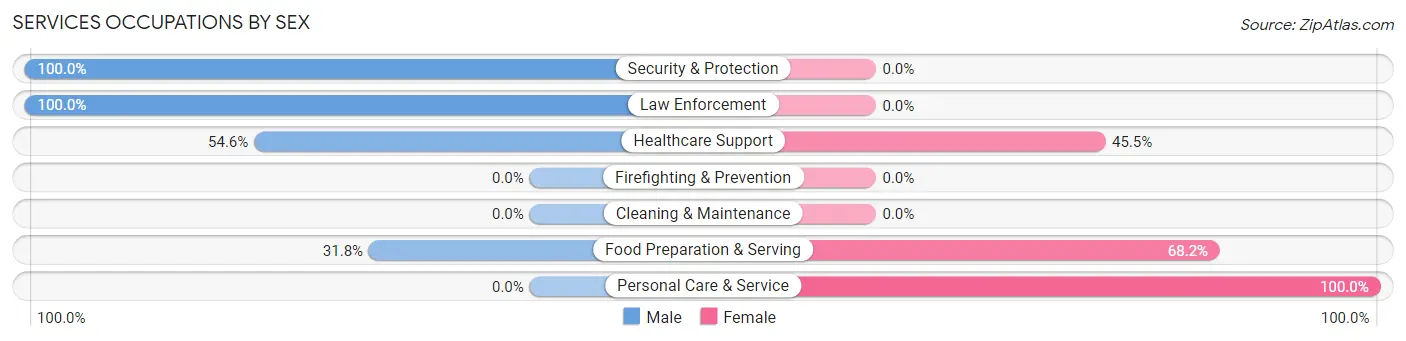
Services Occupations by Sex
Within the Services occupations in Albany, the most male-oriented occupations are Security & Protection (100.0%), Law Enforcement (100.0%), and Healthcare Support (54.5%), while the most female-oriented occupations are Personal Care & Service (100.0%), Food Preparation & Serving (68.2%), and Healthcare Support (45.5%).
| Occupation | Male | Female |
| Healthcare Support | 18 (54.5%) | 15 (45.5%) |
| Security & Protection | 6 (100.0%) | 0 (0.0%) |
| Firefighting & Prevention | 0 (0.0%) | 0 (0.0%) |
| Law Enforcement | 6 (100.0%) | 0 (0.0%) |
| Food Preparation & Serving | 21 (31.8%) | 45 (68.2%) |
| Cleaning & Maintenance | 0 (0.0%) | 0 (0.0%) |
| Personal Care & Service | 0 (0.0%) | 39 (100.0%) |
| Total (Category) | 45 (31.2%) | 99 (68.8%) |
| Total (Overall) | 614 (46.3%) | 711 (53.7%) |
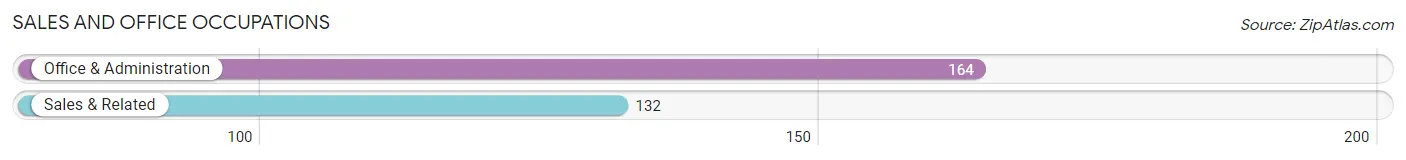
Sales and Office Occupations
The most common Sales and Office occupations in Albany are Office & Administration (164 | 12.4%), and Sales & Related (132 | 10.0%).
Sales and Office Occupations by Sex
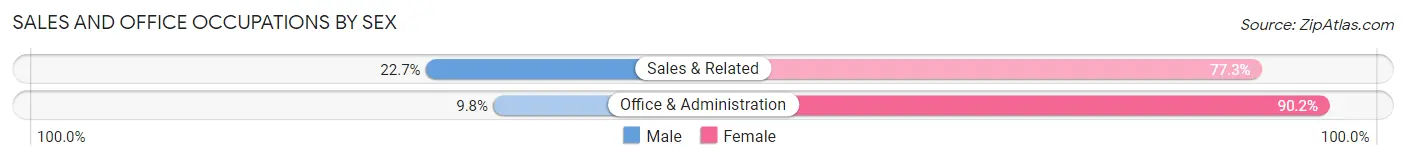
| Occupation | Male | Female |
| Sales & Related | 30 (22.7%) | 102 (77.3%) |
| Office & Administration | 16 (9.8%) | 148 (90.2%) |
| Total (Category) | 46 (15.5%) | 250 (84.5%) |
| Total (Overall) | 614 (46.3%) | 711 (53.7%) |
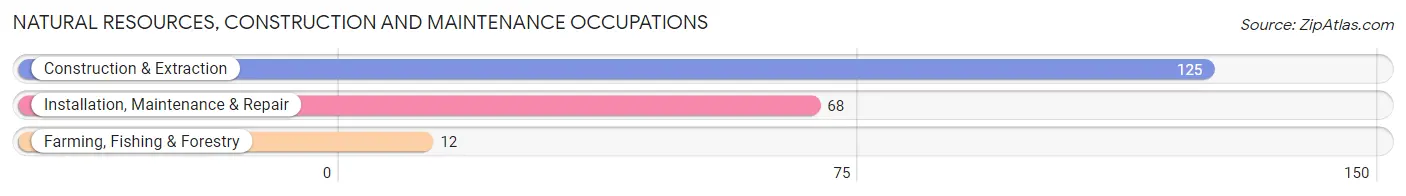
Natural Resources, Construction and Maintenance Occupations
The most common Natural Resources, Construction and Maintenance occupations in Albany are Construction & Extraction (125 | 9.4%), Installation, Maintenance & Repair (68 | 5.1%), and Farming, Fishing & Forestry (12 | 0.9%).
Natural Resources, Construction and Maintenance Occupations by Sex
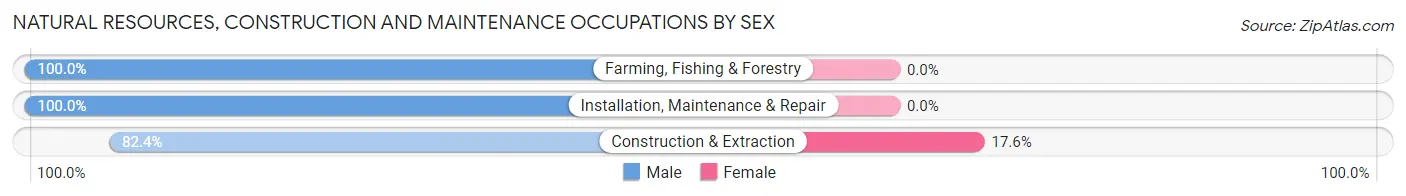
| Occupation | Male | Female |
| Farming, Fishing & Forestry | 12 (100.0%) | 0 (0.0%) |
| Construction & Extraction | 103 (82.4%) | 22 (17.6%) |
| Installation, Maintenance & Repair | 68 (100.0%) | 0 (0.0%) |
| Total (Category) | 183 (89.3%) | 22 (10.7%) |
| Total (Overall) | 614 (46.3%) | 711 (53.7%) |
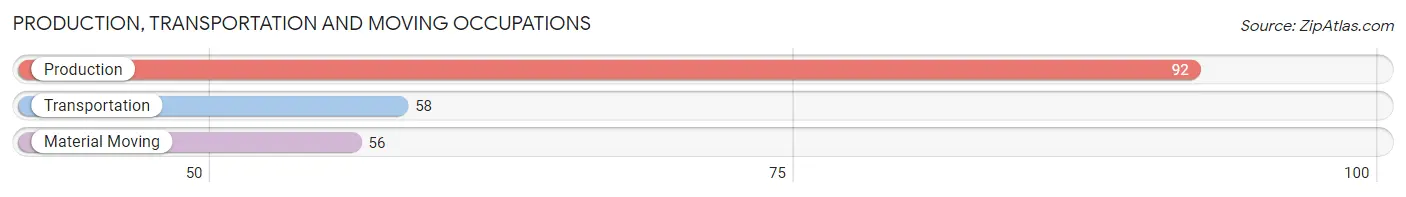
Production, Transportation and Moving Occupations
The most common Production, Transportation and Moving occupations in Albany are Production (92 | 6.9%), Transportation (58 | 4.4%), and Material Moving (56 | 4.2%).
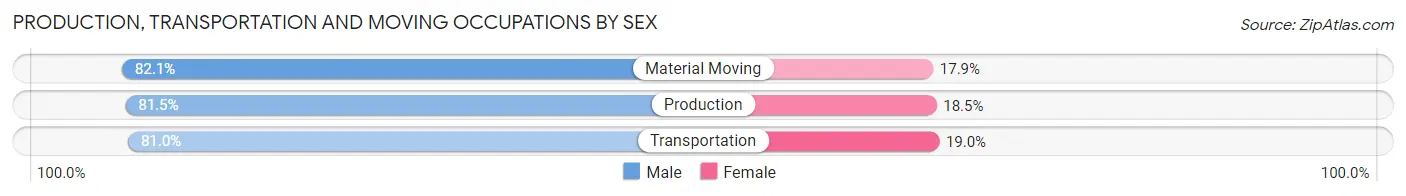
Production, Transportation and Moving Occupations by Sex
| Occupation | Male | Female |
| Production | 75 (81.5%) | 17 (18.5%) |
| Transportation | 47 (81.0%) | 11 (19.0%) |
| Material Moving | 46 (82.1%) | 10 (17.9%) |
| Total (Category) | 168 (81.6%) | 38 (18.4%) |
| Total (Overall) | 614 (46.3%) | 711 (53.7%) |
Employment Industries by Sex in Albany
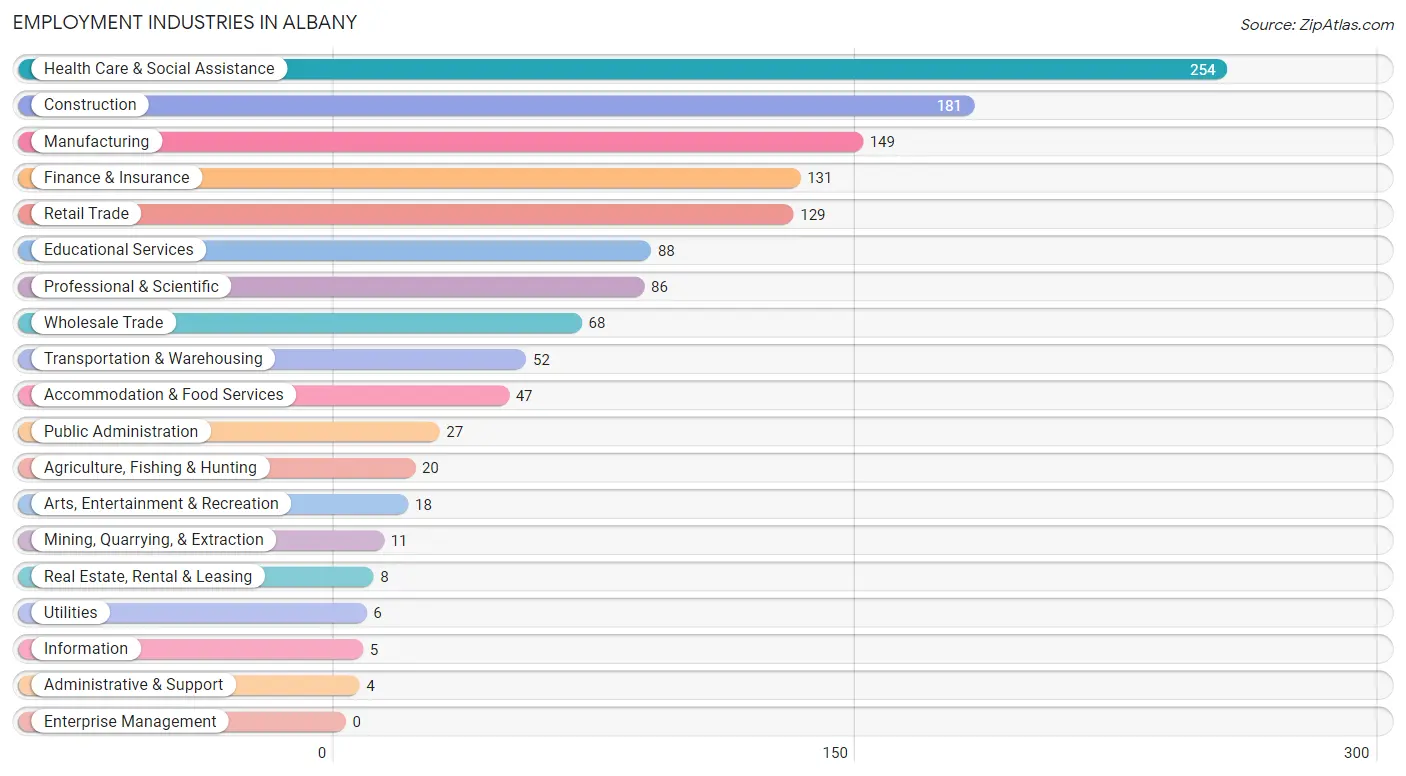
Employment Industries in Albany
The major employment industries in Albany include Health Care & Social Assistance (254 | 19.2%), Construction (181 | 13.7%), Manufacturing (149 | 11.3%), Finance & Insurance (131 | 9.9%), and Retail Trade (129 | 9.7%).
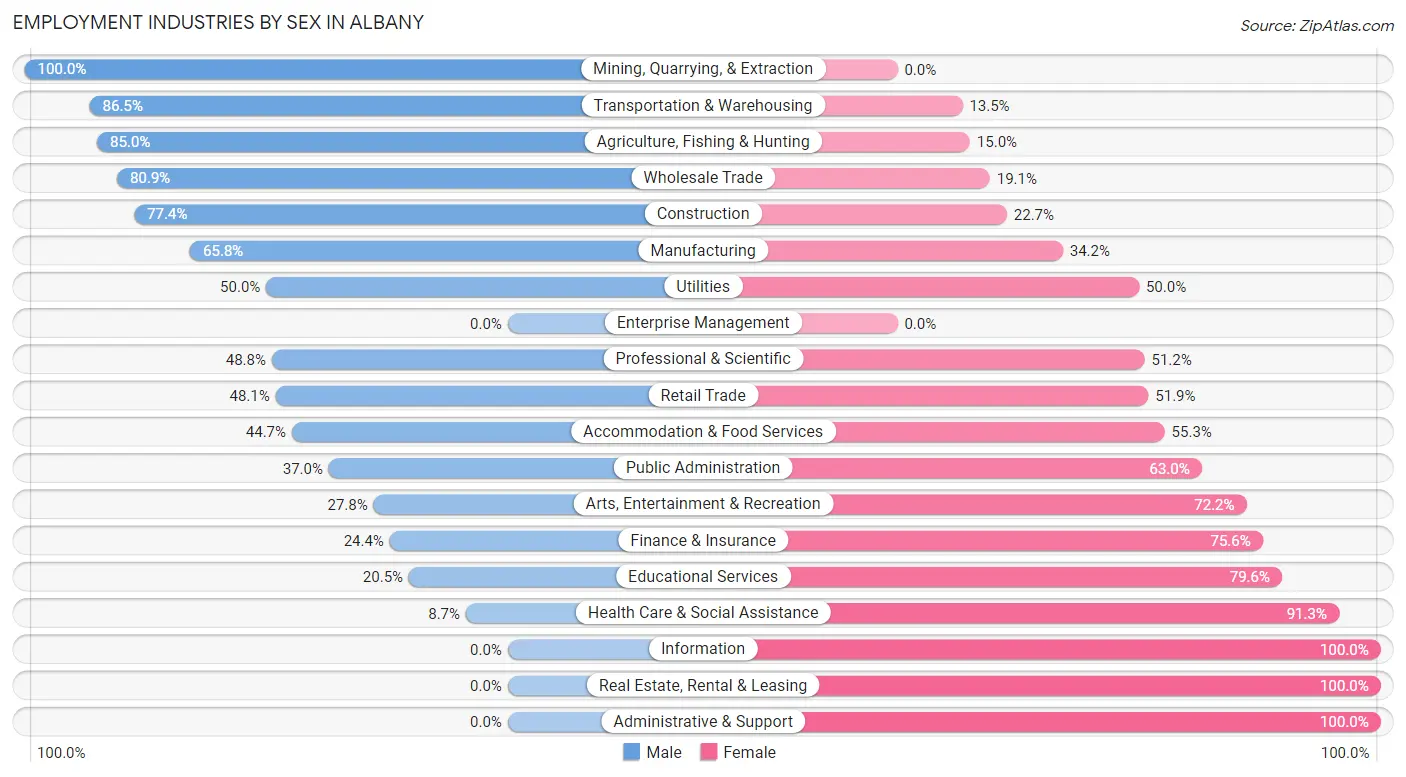
Employment Industries by Sex in Albany
The Albany industries that see more men than women are Mining, Quarrying, & Extraction (100.0%), Transportation & Warehousing (86.5%), and Agriculture, Fishing & Hunting (85.0%), whereas the industries that tend to have a higher number of women are Information (100.0%), Real Estate, Rental & Leasing (100.0%), and Administrative & Support (100.0%).
| Industry | Male | Female |
| Agriculture, Fishing & Hunting | 17 (85.0%) | 3 (15.0%) |
| Mining, Quarrying, & Extraction | 11 (100.0%) | 0 (0.0%) |
| Construction | 140 (77.3%) | 41 (22.7%) |
| Manufacturing | 98 (65.8%) | 51 (34.2%) |
| Wholesale Trade | 55 (80.9%) | 13 (19.1%) |
| Retail Trade | 62 (48.1%) | 67 (51.9%) |
| Transportation & Warehousing | 45 (86.5%) | 7 (13.5%) |
| Utilities | 3 (50.0%) | 3 (50.0%) |
| Information | 0 (0.0%) | 5 (100.0%) |
| Finance & Insurance | 32 (24.4%) | 99 (75.6%) |
| Real Estate, Rental & Leasing | 0 (0.0%) | 8 (100.0%) |
| Professional & Scientific | 42 (48.8%) | 44 (51.2%) |
| Enterprise Management | 0 (0.0%) | 0 (0.0%) |
| Administrative & Support | 0 (0.0%) | 4 (100.0%) |
| Educational Services | 18 (20.4%) | 70 (79.5%) |
| Health Care & Social Assistance | 22 (8.7%) | 232 (91.3%) |
| Arts, Entertainment & Recreation | 5 (27.8%) | 13 (72.2%) |
| Accommodation & Food Services | 21 (44.7%) | 26 (55.3%) |
| Public Administration | 10 (37.0%) | 17 (63.0%) |
| Total | 614 (46.3%) | 711 (53.7%) |
Education in Albany
School Enrollment in Albany
The most common levels of schooling among the 736 students in Albany are middle school (242 | 32.9%), elementary school (181 | 24.6%), and high school (154 | 20.9%).
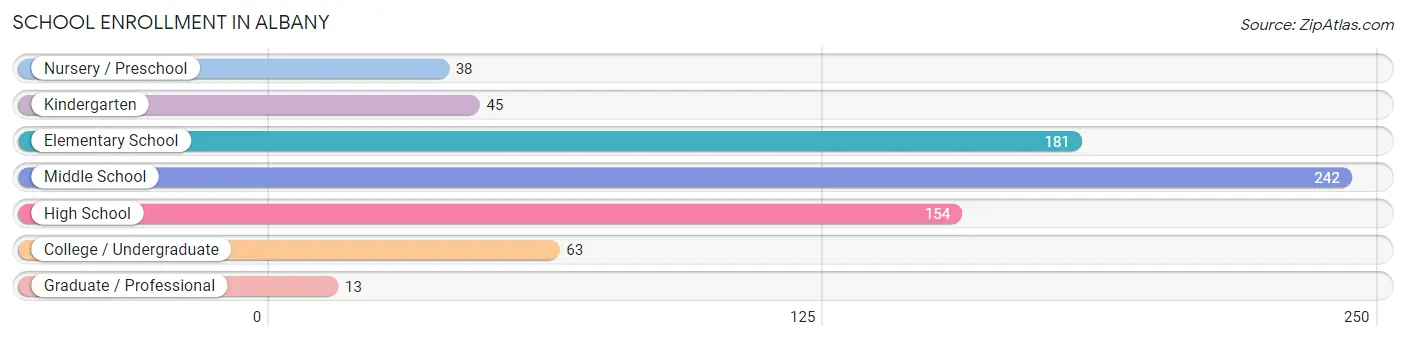
| School Level | # Students | % Students |
| Nursery / Preschool | 38 | 5.2% |
| Kindergarten | 45 | 6.1% |
| Elementary School | 181 | 24.6% |
| Middle School | 242 | 32.9% |
| High School | 154 | 20.9% |
| College / Undergraduate | 63 | 8.6% |
| Graduate / Professional | 13 | 1.8% |
| Total | 736 | 100.0% |
School Enrollment by Age by Funding Source in Albany
Out of a total of 736 students who are enrolled in schools in Albany, 87 (11.8%) attend a private institution, while the remaining 649 (88.2%) are enrolled in public schools. The age group of 5 to 9 year old has the highest likelihood of being enrolled in private schools, with 48 (24.1% in the age bracket) enrolled. Conversely, the age group of 3 to 4 year olds has the lowest likelihood of being enrolled in a private school, with 19 (100.0% in the age bracket) attending a public institution.
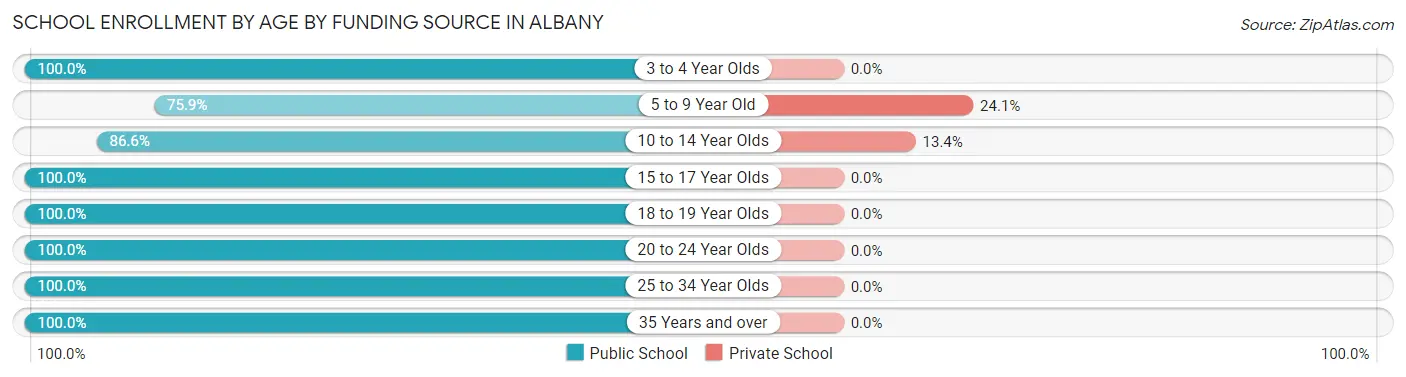
| Age Bracket | Public School | Private School |
| 3 to 4 Year Olds | 19 (100.0%) | 0 (0.0%) |
| 5 to 9 Year Old | 151 (75.9%) | 48 (24.1%) |
| 10 to 14 Year Olds | 252 (86.6%) | 39 (13.4%) |
| 15 to 17 Year Olds | 117 (100.0%) | 0 (0.0%) |
| 18 to 19 Year Olds | 34 (100.0%) | 0 (0.0%) |
| 20 to 24 Year Olds | 36 (100.0%) | 0 (0.0%) |
| 25 to 34 Year Olds | 25 (100.0%) | 0 (0.0%) |
| 35 Years and over | 15 (100.0%) | 0 (0.0%) |
| Total | 649 (88.2%) | 87 (11.8%) |
Educational Attainment by Field of Study in Albany
Business (146 | 29.0%), science & technology (108 | 21.5%), education (89 | 17.7%), arts & humanities (58 | 11.5%), and psychology (25 | 5.0%) are the most common fields of study among 503 individuals in Albany who have obtained a bachelor's degree or higher.
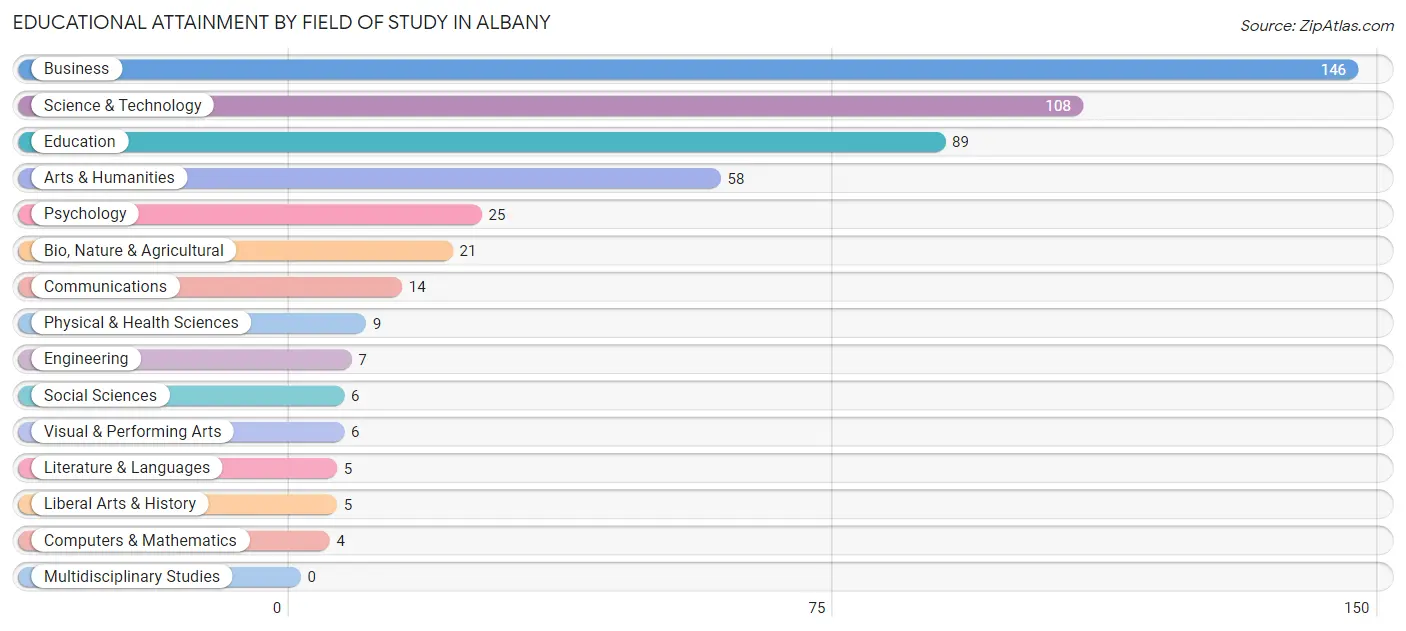
| Field of Study | # Graduates | % Graduates |
| Computers & Mathematics | 4 | 0.8% |
| Bio, Nature & Agricultural | 21 | 4.2% |
| Physical & Health Sciences | 9 | 1.8% |
| Psychology | 25 | 5.0% |
| Social Sciences | 6 | 1.2% |
| Engineering | 7 | 1.4% |
| Multidisciplinary Studies | 0 | 0.0% |
| Science & Technology | 108 | 21.5% |
| Business | 146 | 29.0% |
| Education | 89 | 17.7% |
| Literature & Languages | 5 | 1.0% |
| Liberal Arts & History | 5 | 1.0% |
| Visual & Performing Arts | 6 | 1.2% |
| Communications | 14 | 2.8% |
| Arts & Humanities | 58 | 11.5% |
| Total | 503 | 100.0% |
Transportation & Commute in Albany
Vehicle Availability by Sex in Albany
The most prevalent vehicle ownership categories in Albany are males with 3 vehicles (284, accounting for 46.9%) and females with 3 vehicles (250, making up 39.9%).
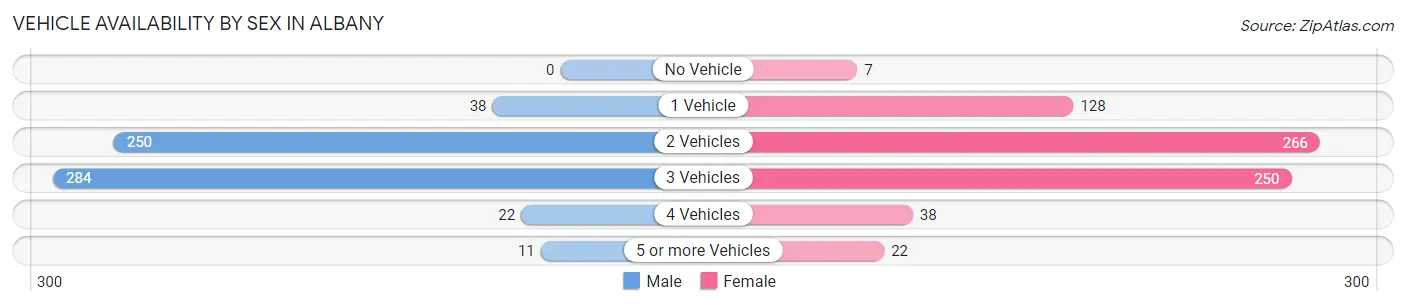
| Vehicles Available | Male | Female |
| No Vehicle | 0 (0.0%) | 7 (1.0%) |
| 1 Vehicle | 38 (6.3%) | 128 (18.0%) |
| 2 Vehicles | 250 (41.3%) | 266 (37.4%) |
| 3 Vehicles | 284 (46.9%) | 250 (35.2%) |
| 4 Vehicles | 22 (3.6%) | 38 (5.3%) |
| 5 or more Vehicles | 11 (1.8%) | 22 (3.1%) |
| Total | 605 (100.0%) | 711 (100.0%) |
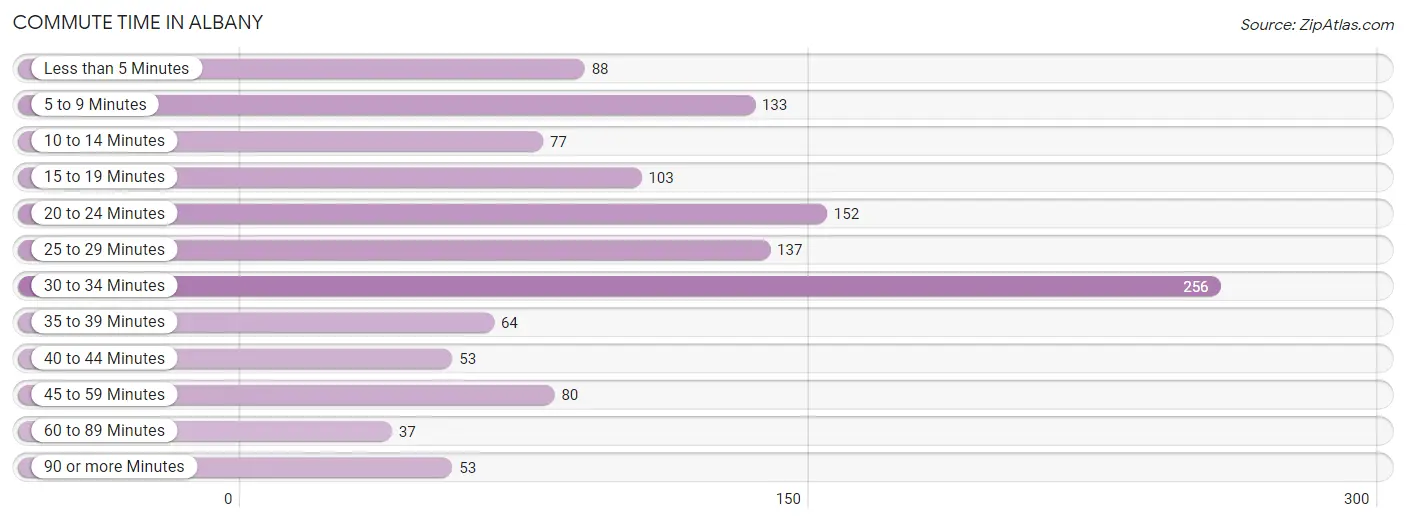
Commute Time in Albany
The most frequently occuring commute durations in Albany are 30 to 34 minutes (256 commuters, 20.8%), 20 to 24 minutes (152 commuters, 12.3%), and 25 to 29 minutes (137 commuters, 11.1%).
| Commute Time | # Commuters | % Commuters |
| Less than 5 Minutes | 88 | 7.1% |
| 5 to 9 Minutes | 133 | 10.8% |
| 10 to 14 Minutes | 77 | 6.2% |
| 15 to 19 Minutes | 103 | 8.4% |
| 20 to 24 Minutes | 152 | 12.3% |
| 25 to 29 Minutes | 137 | 11.1% |
| 30 to 34 Minutes | 256 | 20.8% |
| 35 to 39 Minutes | 64 | 5.2% |
| 40 to 44 Minutes | 53 | 4.3% |
| 45 to 59 Minutes | 80 | 6.5% |
| 60 to 89 Minutes | 37 | 3.0% |
| 90 or more Minutes | 53 | 4.3% |
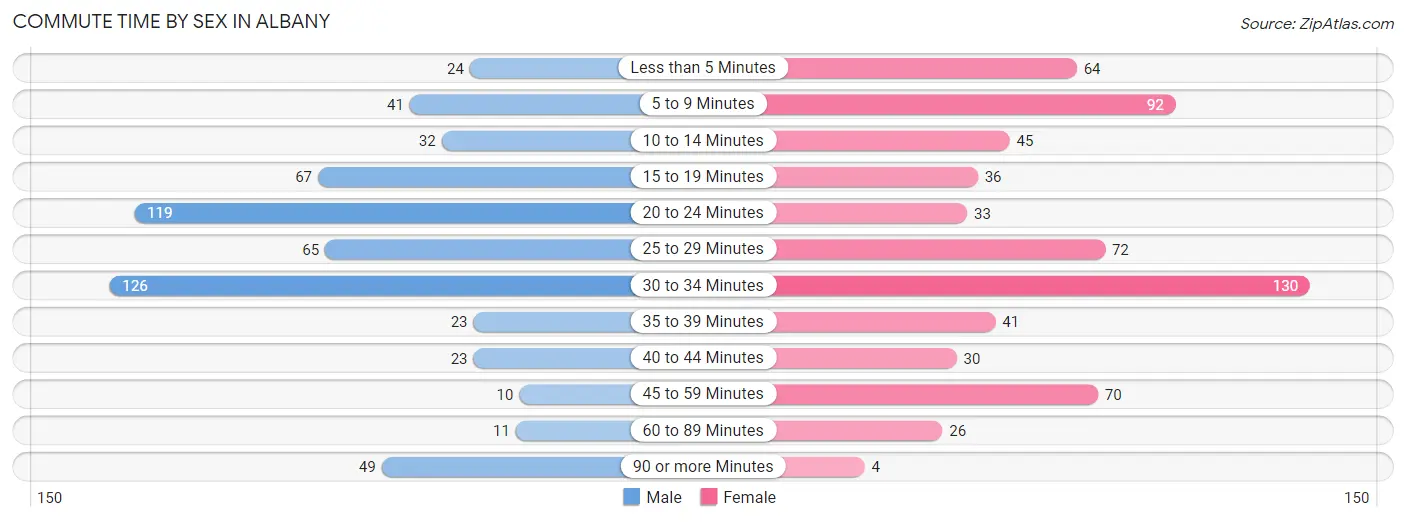
Commute Time by Sex in Albany
The most common commute times in Albany are 30 to 34 minutes (126 commuters, 21.4%) for males and 30 to 34 minutes (130 commuters, 20.2%) for females.
| Commute Time | Male | Female |
| Less than 5 Minutes | 24 (4.1%) | 64 (10.0%) |
| 5 to 9 Minutes | 41 (7.0%) | 92 (14.3%) |
| 10 to 14 Minutes | 32 (5.4%) | 45 (7.0%) |
| 15 to 19 Minutes | 67 (11.4%) | 36 (5.6%) |
| 20 to 24 Minutes | 119 (20.2%) | 33 (5.1%) |
| 25 to 29 Minutes | 65 (11.0%) | 72 (11.2%) |
| 30 to 34 Minutes | 126 (21.4%) | 130 (20.2%) |
| 35 to 39 Minutes | 23 (3.9%) | 41 (6.4%) |
| 40 to 44 Minutes | 23 (3.9%) | 30 (4.7%) |
| 45 to 59 Minutes | 10 (1.7%) | 70 (10.9%) |
| 60 to 89 Minutes | 11 (1.9%) | 26 (4.0%) |
| 90 or more Minutes | 49 (8.3%) | 4 (0.6%) |
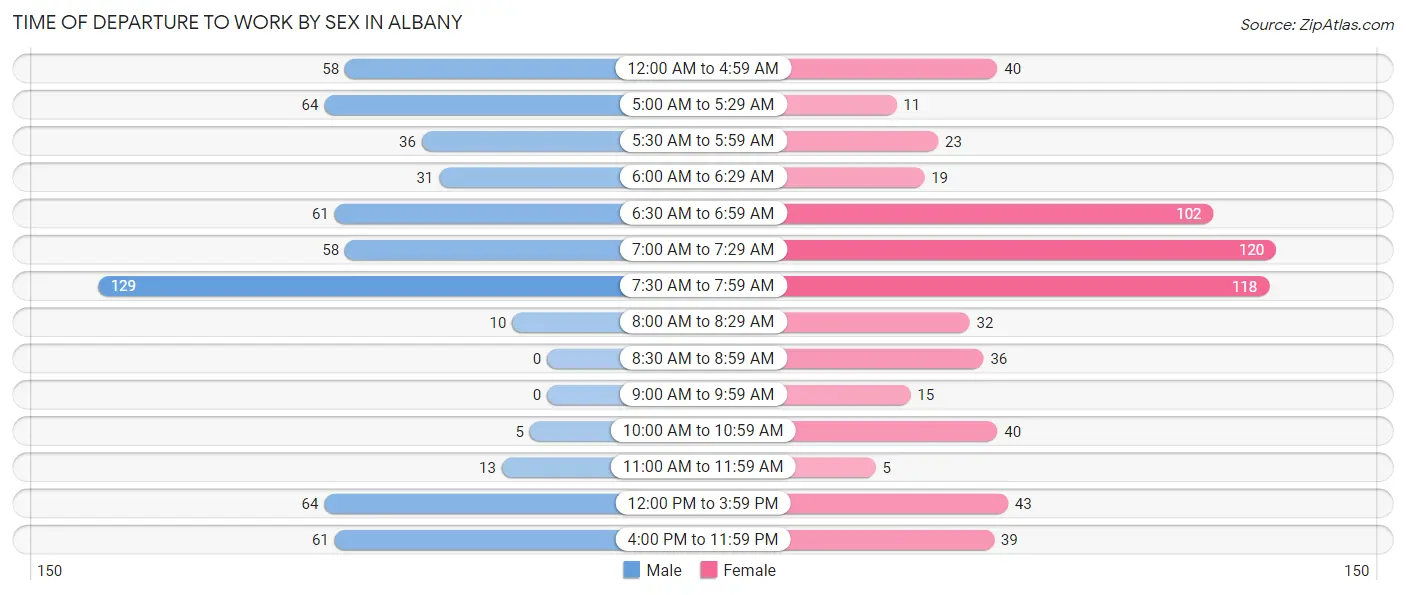
Time of Departure to Work by Sex in Albany
The most frequent times of departure to work in Albany are 7:30 AM to 7:59 AM (129, 21.9%) for males and 7:00 AM to 7:29 AM (120, 18.7%) for females.
| Time of Departure | Male | Female |
| 12:00 AM to 4:59 AM | 58 (9.8%) | 40 (6.2%) |
| 5:00 AM to 5:29 AM | 64 (10.8%) | 11 (1.7%) |
| 5:30 AM to 5:59 AM | 36 (6.1%) | 23 (3.6%) |
| 6:00 AM to 6:29 AM | 31 (5.2%) | 19 (2.9%) |
| 6:30 AM to 6:59 AM | 61 (10.3%) | 102 (15.9%) |
| 7:00 AM to 7:29 AM | 58 (9.8%) | 120 (18.7%) |
| 7:30 AM to 7:59 AM | 129 (21.9%) | 118 (18.3%) |
| 8:00 AM to 8:29 AM | 10 (1.7%) | 32 (5.0%) |
| 8:30 AM to 8:59 AM | 0 (0.0%) | 36 (5.6%) |
| 9:00 AM to 9:59 AM | 0 (0.0%) | 15 (2.3%) |
| 10:00 AM to 10:59 AM | 5 (0.9%) | 40 (6.2%) |
| 11:00 AM to 11:59 AM | 13 (2.2%) | 5 (0.8%) |
| 12:00 PM to 3:59 PM | 64 (10.8%) | 43 (6.7%) |
| 4:00 PM to 11:59 PM | 61 (10.3%) | 39 (6.1%) |
| Total | 590 (100.0%) | 643 (100.0%) |
Housing Occupancy in Albany
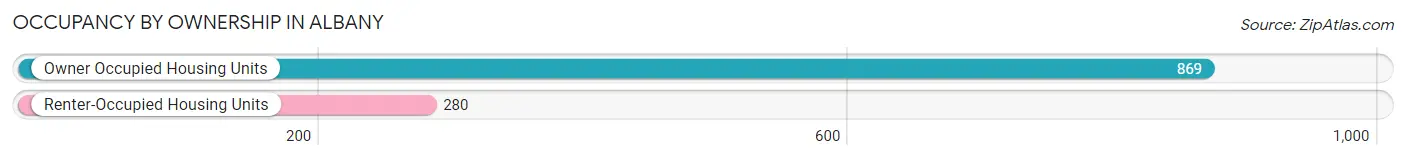
Occupancy by Ownership in Albany
Of the total 1,149 dwellings in Albany, owner-occupied units account for 869 (75.6%), while renter-occupied units make up 280 (24.4%).
| Occupancy | # Housing Units | % Housing Units |
| Owner Occupied Housing Units | 869 | 75.6% |
| Renter-Occupied Housing Units | 280 | 24.4% |
| Total Occupied Housing Units | 1,149 | 100.0% |
Occupancy by Household Size in Albany
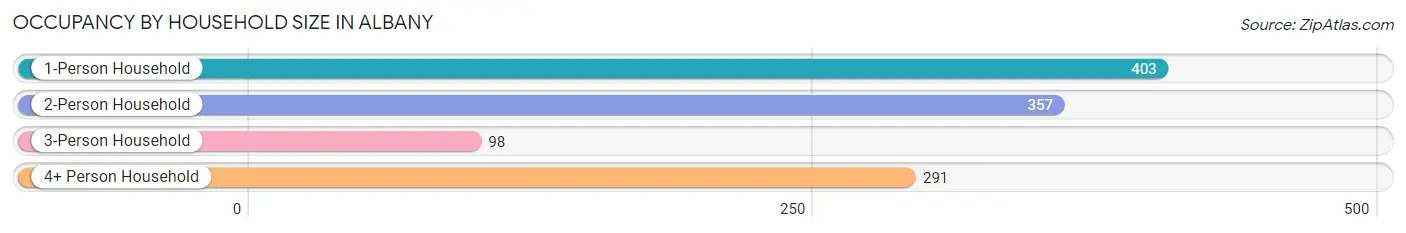
| Household Size | # Housing Units | % Housing Units |
| 1-Person Household | 403 | 35.1% |
| 2-Person Household | 357 | 31.1% |
| 3-Person Household | 98 | 8.5% |
| 4+ Person Household | 291 | 25.3% |
| Total Housing Units | 1,149 | 100.0% |
Occupancy by Ownership by Household Size in Albany
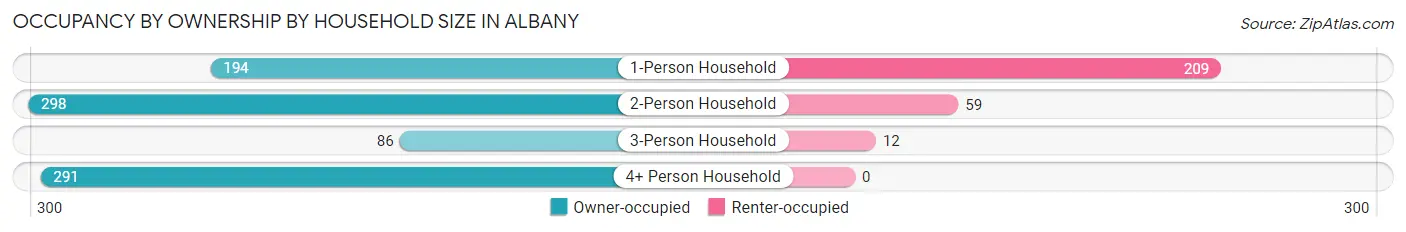
| Household Size | Owner-occupied | Renter-occupied |
| 1-Person Household | 194 (48.1%) | 209 (51.9%) |
| 2-Person Household | 298 (83.5%) | 59 (16.5%) |
| 3-Person Household | 86 (87.8%) | 12 (12.2%) |
| 4+ Person Household | 291 (100.0%) | 0 (0.0%) |
| Total Housing Units | 869 (75.6%) | 280 (24.4%) |
Occupancy by Educational Attainment in Albany
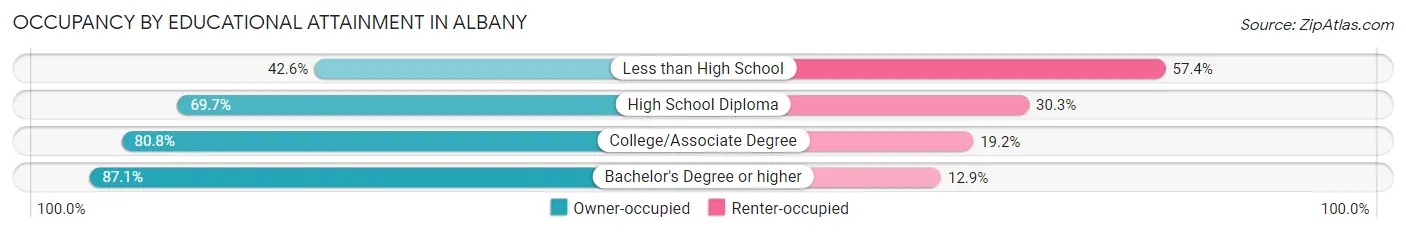
| Household Size | Owner-occupied | Renter-occupied |
| Less than High School | 49 (42.6%) | 66 (57.4%) |
| High School Diploma | 216 (69.7%) | 94 (30.3%) |
| College/Associate Degree | 340 (80.8%) | 81 (19.2%) |
| Bachelor's Degree or higher | 264 (87.1%) | 39 (12.9%) |
Occupancy by Age of Householder in Albany
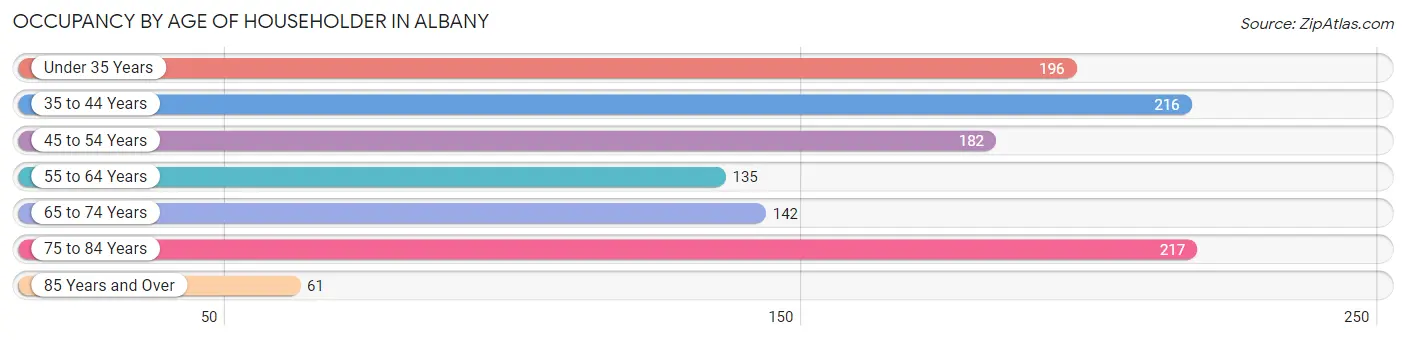
| Age Bracket | # Households | % Households |
| Under 35 Years | 196 | 17.1% |
| 35 to 44 Years | 216 | 18.8% |
| 45 to 54 Years | 182 | 15.8% |
| 55 to 64 Years | 135 | 11.7% |
| 65 to 74 Years | 142 | 12.4% |
| 75 to 84 Years | 217 | 18.9% |
| 85 Years and Over | 61 | 5.3% |
| Total | 1,149 | 100.0% |
Housing Finances in Albany
Median Income by Occupancy in Albany
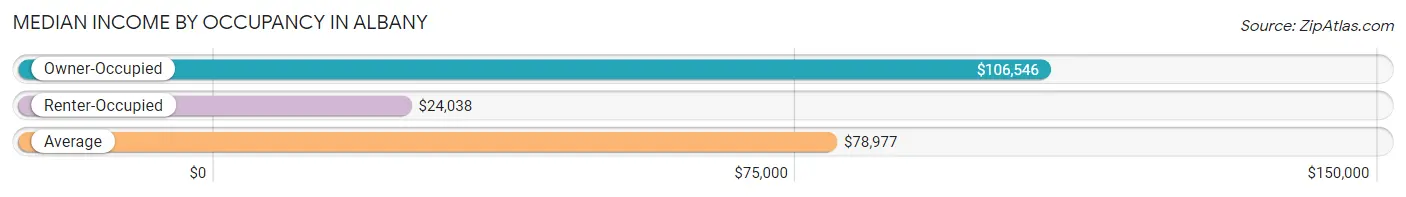
| Occupancy Type | # Households | Median Income |
| Owner-Occupied | 869 (75.6%) | $106,546 |
| Renter-Occupied | 280 (24.4%) | $24,038 |
| Average | 1,149 (100.0%) | $78,977 |
Occupancy by Householder Income Bracket in Albany
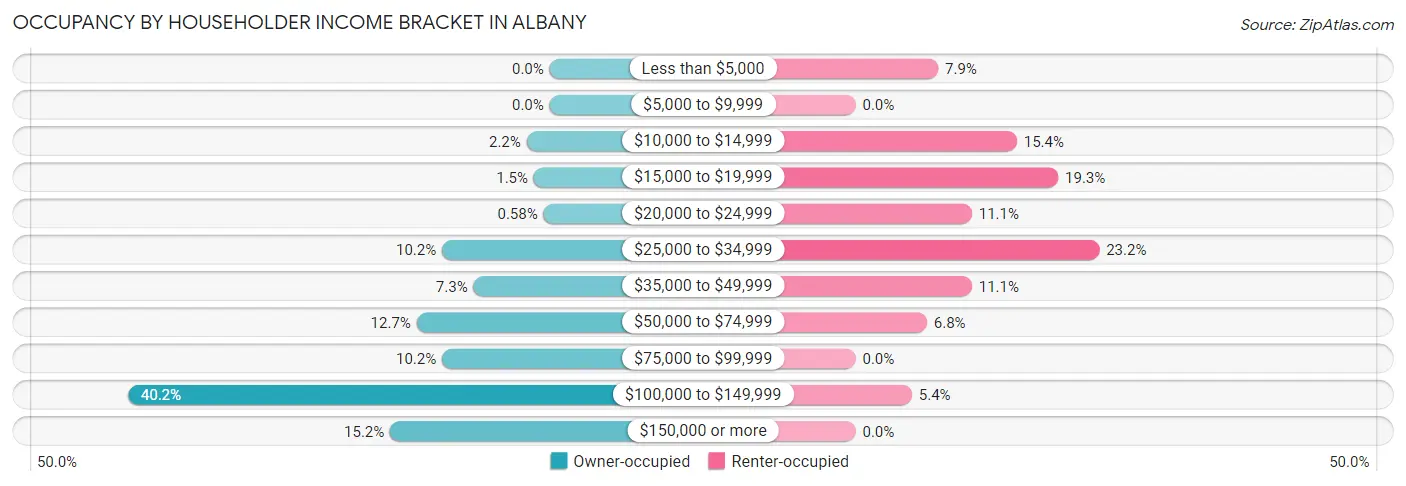
| Income Bracket | Owner-occupied | Renter-occupied |
| Less than $5,000 | 0 (0.0%) | 22 (7.9%) |
| $5,000 to $9,999 | 0 (0.0%) | 0 (0.0%) |
| $10,000 to $14,999 | 19 (2.2%) | 43 (15.4%) |
| $15,000 to $19,999 | 13 (1.5%) | 54 (19.3%) |
| $20,000 to $24,999 | 5 (0.6%) | 31 (11.1%) |
| $25,000 to $34,999 | 89 (10.2%) | 65 (23.2%) |
| $35,000 to $49,999 | 63 (7.2%) | 31 (11.1%) |
| $50,000 to $74,999 | 110 (12.7%) | 19 (6.8%) |
| $75,000 to $99,999 | 89 (10.2%) | 0 (0.0%) |
| $100,000 to $149,999 | 349 (40.2%) | 15 (5.4%) |
| $150,000 or more | 132 (15.2%) | 0 (0.0%) |
| Total | 869 (100.0%) | 280 (100.0%) |
Monthly Housing Cost Tiers in Albany
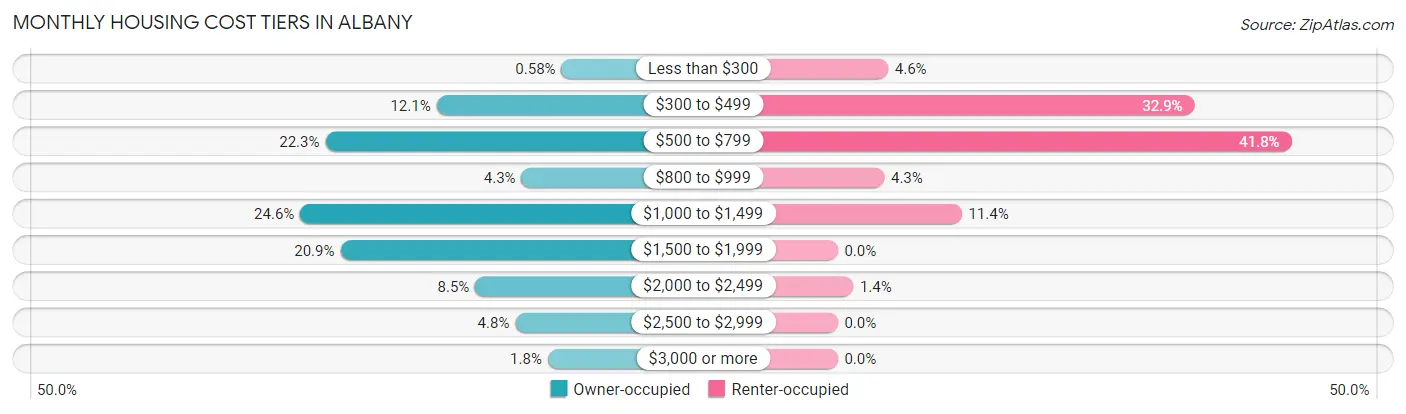
| Monthly Cost | Owner-occupied | Renter-occupied |
| Less than $300 | 5 (0.6%) | 13 (4.6%) |
| $300 to $499 | 105 (12.1%) | 92 (32.9%) |
| $500 to $799 | 194 (22.3%) | 117 (41.8%) |
| $800 to $999 | 37 (4.3%) | 12 (4.3%) |
| $1,000 to $1,499 | 214 (24.6%) | 32 (11.4%) |
| $1,500 to $1,999 | 182 (20.9%) | 0 (0.0%) |
| $2,000 to $2,499 | 74 (8.5%) | 4 (1.4%) |
| $2,500 to $2,999 | 42 (4.8%) | 0 (0.0%) |
| $3,000 or more | 16 (1.8%) | 0 (0.0%) |
| Total | 869 (100.0%) | 280 (100.0%) |
Physical Housing Characteristics in Albany
Housing Structures in Albany
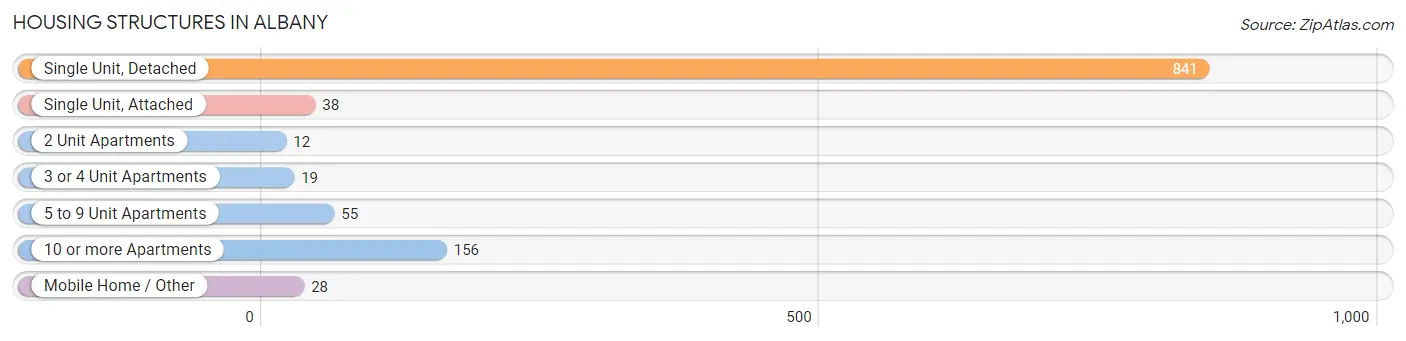
| Structure Type | # Housing Units | % Housing Units |
| Single Unit, Detached | 841 | 73.2% |
| Single Unit, Attached | 38 | 3.3% |
| 2 Unit Apartments | 12 | 1.0% |
| 3 or 4 Unit Apartments | 19 | 1.7% |
| 5 to 9 Unit Apartments | 55 | 4.8% |
| 10 or more Apartments | 156 | 13.6% |
| Mobile Home / Other | 28 | 2.4% |
| Total | 1,149 | 100.0% |
Housing Structures by Occupancy in Albany
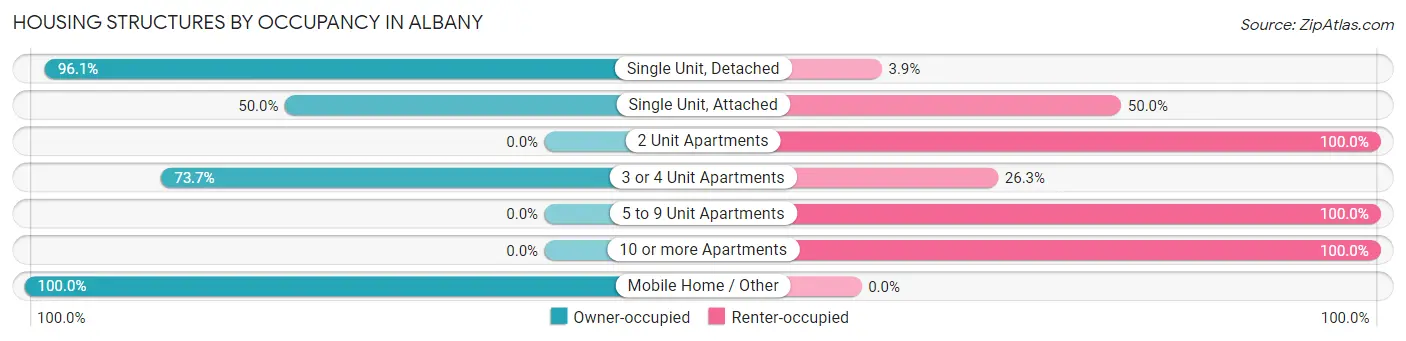
| Structure Type | Owner-occupied | Renter-occupied |
| Single Unit, Detached | 808 (96.1%) | 33 (3.9%) |
| Single Unit, Attached | 19 (50.0%) | 19 (50.0%) |
| 2 Unit Apartments | 0 (0.0%) | 12 (100.0%) |
| 3 or 4 Unit Apartments | 14 (73.7%) | 5 (26.3%) |
| 5 to 9 Unit Apartments | 0 (0.0%) | 55 (100.0%) |
| 10 or more Apartments | 0 (0.0%) | 156 (100.0%) |
| Mobile Home / Other | 28 (100.0%) | 0 (0.0%) |
| Total | 869 (75.6%) | 280 (24.4%) |
Housing Structures by Number of Rooms in Albany
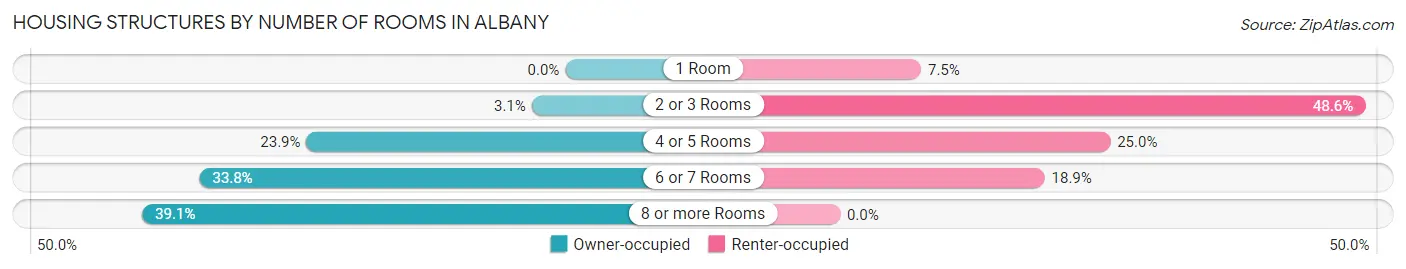
| Number of Rooms | Owner-occupied | Renter-occupied |
| 1 Room | 0 (0.0%) | 21 (7.5%) |
| 2 or 3 Rooms | 27 (3.1%) | 136 (48.6%) |
| 4 or 5 Rooms | 208 (23.9%) | 70 (25.0%) |
| 6 or 7 Rooms | 294 (33.8%) | 53 (18.9%) |
| 8 or more Rooms | 340 (39.1%) | 0 (0.0%) |
| Total | 869 (100.0%) | 280 (100.0%) |
Housing Structure by Heating Type in Albany
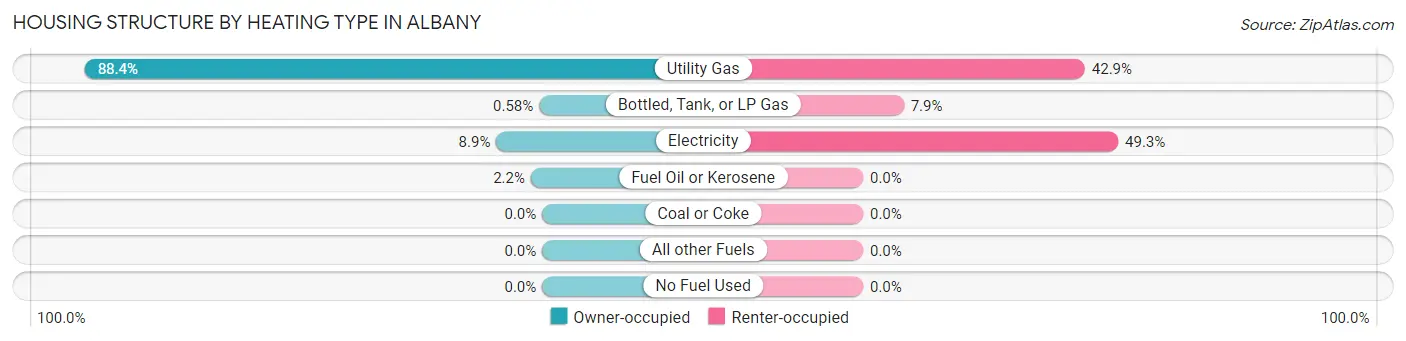
| Heating Type | Owner-occupied | Renter-occupied |
| Utility Gas | 768 (88.4%) | 120 (42.9%) |
| Bottled, Tank, or LP Gas | 5 (0.6%) | 22 (7.9%) |
| Electricity | 77 (8.9%) | 138 (49.3%) |
| Fuel Oil or Kerosene | 19 (2.2%) | 0 (0.0%) |
| Coal or Coke | 0 (0.0%) | 0 (0.0%) |
| All other Fuels | 0 (0.0%) | 0 (0.0%) |
| No Fuel Used | 0 (0.0%) | 0 (0.0%) |
| Total | 869 (100.0%) | 280 (100.0%) |
Household Vehicle Usage in Albany
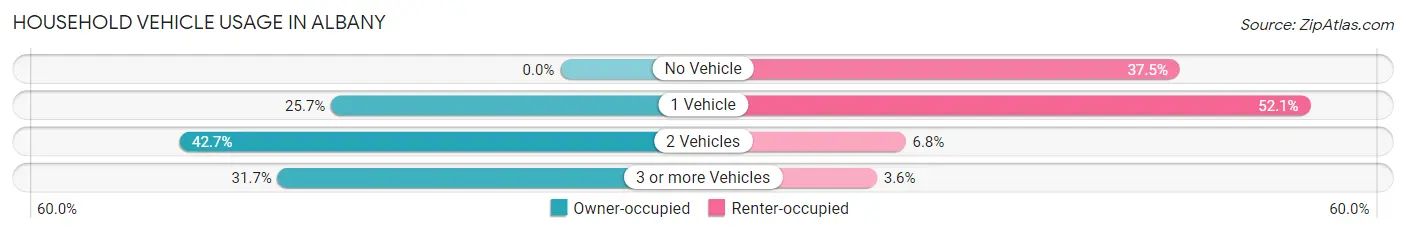
| Vehicles per Household | Owner-occupied | Renter-occupied |
| No Vehicle | 0 (0.0%) | 105 (37.5%) |
| 1 Vehicle | 223 (25.7%) | 146 (52.1%) |
| 2 Vehicles | 371 (42.7%) | 19 (6.8%) |
| 3 or more Vehicles | 275 (31.7%) | 10 (3.6%) |
| Total | 869 (100.0%) | 280 (100.0%) |
Real Estate & Mortgages in Albany
Real Estate and Mortgage Overview in Albany
| Characteristic | Without Mortgage | With Mortgage |
| Housing Units | 326 | 543 |
| Median Property Value | $213,300 | $202,800 |
| Median Household Income | $73,750 | $105 |
| Monthly Housing Costs | $551 | $0 |
| Real Estate Taxes | $2,010 | $14 |
Property Value by Mortgage Status in Albany
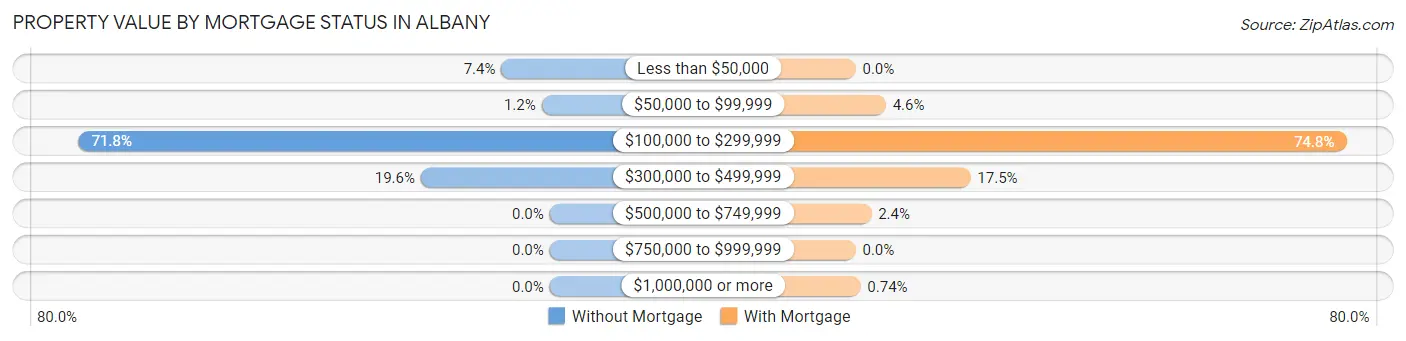
| Property Value | Without Mortgage | With Mortgage |
| Less than $50,000 | 24 (7.4%) | 0 (0.0%) |
| $50,000 to $99,999 | 4 (1.2%) | 25 (4.6%) |
| $100,000 to $299,999 | 234 (71.8%) | 406 (74.8%) |
| $300,000 to $499,999 | 64 (19.6%) | 95 (17.5%) |
| $500,000 to $749,999 | 0 (0.0%) | 13 (2.4%) |
| $750,000 to $999,999 | 0 (0.0%) | 0 (0.0%) |
| $1,000,000 or more | 0 (0.0%) | 4 (0.7%) |
| Total | 326 (100.0%) | 543 (100.0%) |
Household Income by Mortgage Status in Albany
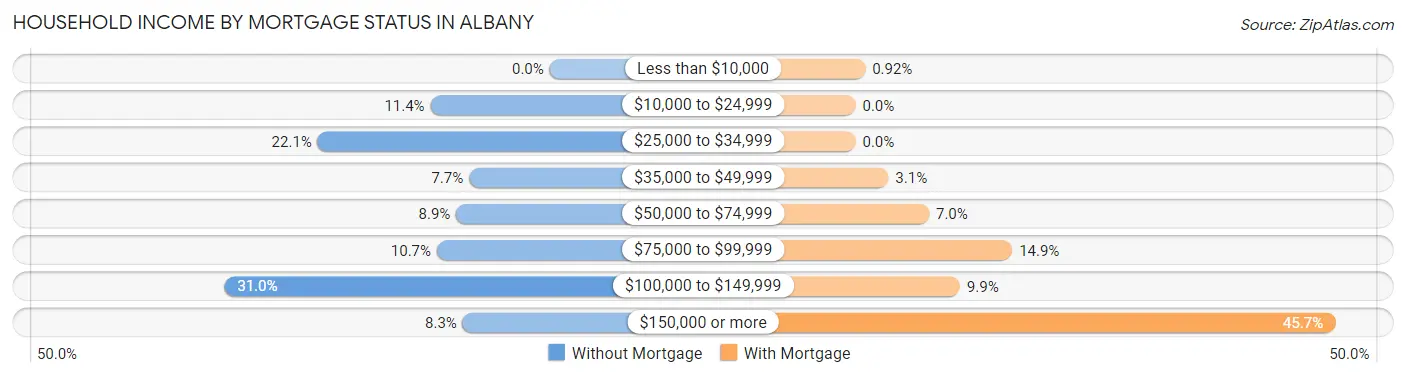
| Household Income | Without Mortgage | With Mortgage |
| Less than $10,000 | 0 (0.0%) | 5 (0.9%) |
| $10,000 to $24,999 | 37 (11.4%) | 0 (0.0%) |
| $25,000 to $34,999 | 72 (22.1%) | 0 (0.0%) |
| $35,000 to $49,999 | 25 (7.7%) | 17 (3.1%) |
| $50,000 to $74,999 | 29 (8.9%) | 38 (7.0%) |
| $75,000 to $99,999 | 35 (10.7%) | 81 (14.9%) |
| $100,000 to $149,999 | 101 (31.0%) | 54 (9.9%) |
| $150,000 or more | 27 (8.3%) | 248 (45.7%) |
| Total | 326 (100.0%) | 543 (100.0%) |
Property Value to Household Income Ratio in Albany
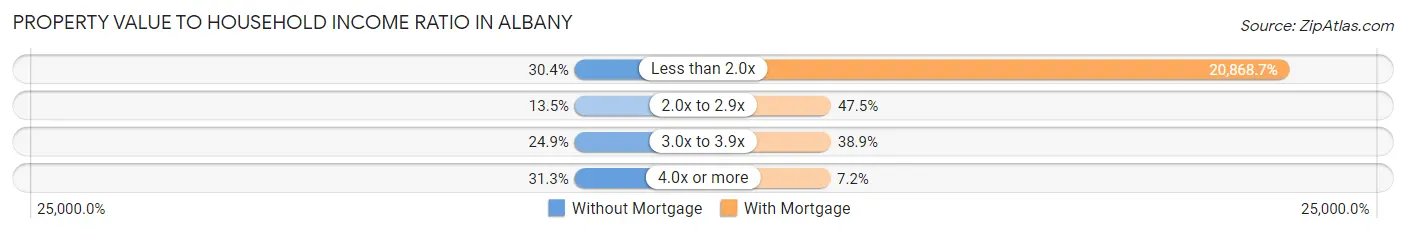
| Value-to-Income Ratio | Without Mortgage | With Mortgage |
| Less than 2.0x | 99 (30.4%) | 113,317 (20,868.7%) |
| 2.0x to 2.9x | 44 (13.5%) | 258 (47.5%) |
| 3.0x to 3.9x | 81 (24.8%) | 211 (38.9%) |
| 4.0x or more | 102 (31.3%) | 39 (7.2%) |
| Total | 326 (100.0%) | 543 (100.0%) |
Real Estate Taxes by Mortgage Status in Albany
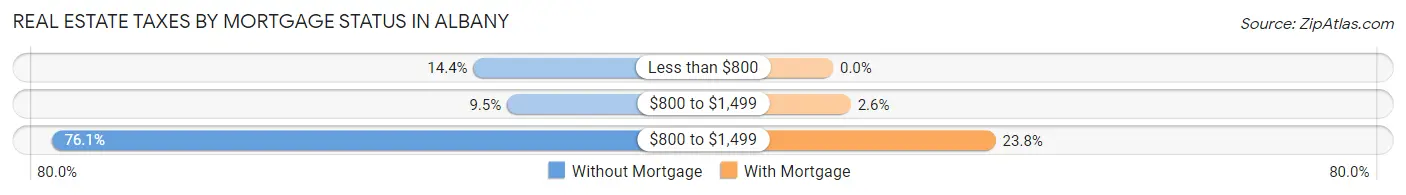
| Property Taxes | Without Mortgage | With Mortgage |
| Less than $800 | 47 (14.4%) | 0 (0.0%) |
| $800 to $1,499 | 31 (9.5%) | 14 (2.6%) |
| $800 to $1,499 | 248 (76.1%) | 129 (23.8%) |
| Total | 326 (100.0%) | 543 (100.0%) |
Health & Disability in Albany
Health Insurance Coverage by Age in Albany
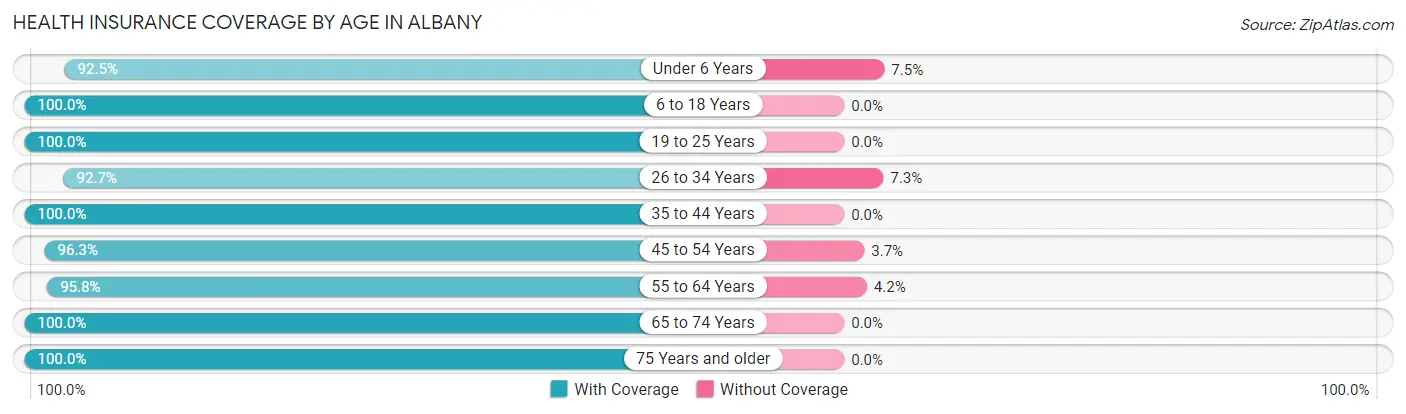
| Age Bracket | With Coverage | Without Coverage |
| Under 6 Years | 136 (92.5%) | 11 (7.5%) |
| 6 to 18 Years | 656 (100.0%) | 0 (0.0%) |
| 19 to 25 Years | 165 (100.0%) | 0 (0.0%) |
| 26 to 34 Years | 229 (92.7%) | 18 (7.3%) |
| 35 to 44 Years | 423 (100.0%) | 0 (0.0%) |
| 45 to 54 Years | 283 (96.3%) | 11 (3.7%) |
| 55 to 64 Years | 227 (95.8%) | 10 (4.2%) |
| 65 to 74 Years | 199 (100.0%) | 0 (0.0%) |
| 75 Years and older | 357 (100.0%) | 0 (0.0%) |
| Total | 2,675 (98.2%) | 50 (1.8%) |
Health Insurance Coverage by Citizenship Status in Albany
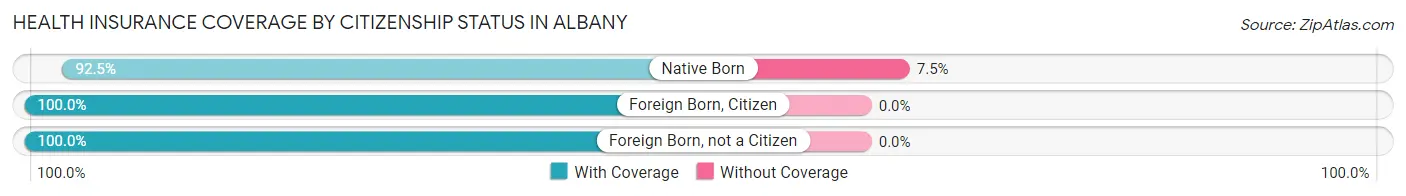
| Citizenship Status | With Coverage | Without Coverage |
| Native Born | 136 (92.5%) | 11 (7.5%) |
| Foreign Born, Citizen | 656 (100.0%) | 0 (0.0%) |
| Foreign Born, not a Citizen | 165 (100.0%) | 0 (0.0%) |
Health Insurance Coverage by Household Income in Albany
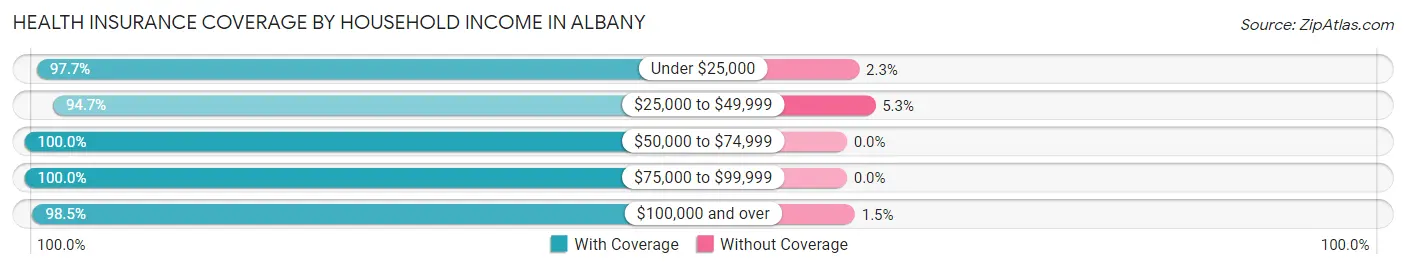
| Household Income | With Coverage | Without Coverage |
| Under $25,000 | 211 (97.7%) | 5 (2.3%) |
| $25,000 to $49,999 | 374 (94.7%) | 21 (5.3%) |
| $50,000 to $74,999 | 297 (100.0%) | 0 (0.0%) |
| $75,000 to $99,999 | 218 (100.0%) | 0 (0.0%) |
| $100,000 and over | 1,575 (98.5%) | 24 (1.5%) |
Public vs Private Health Insurance Coverage by Age in Albany
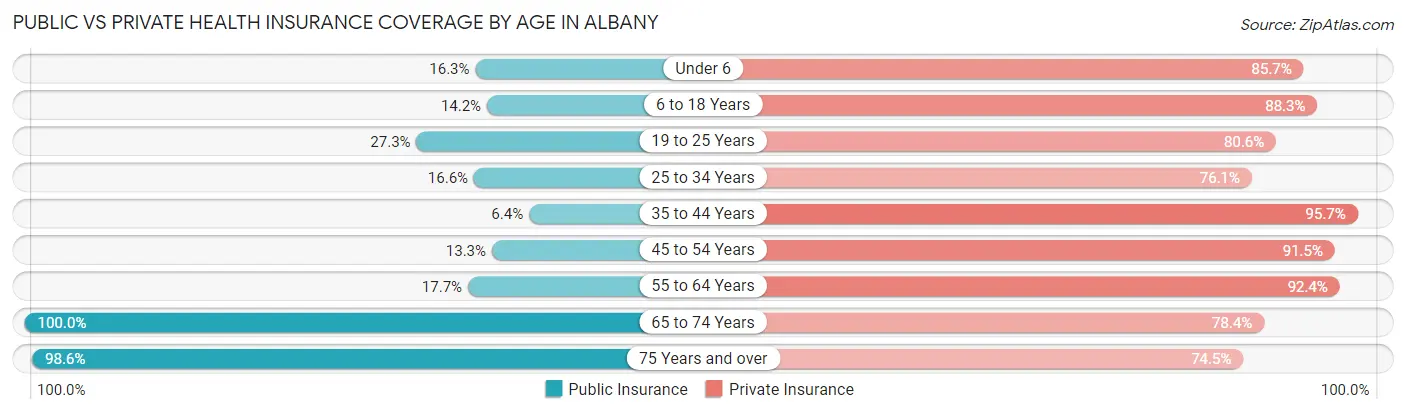
| Age Bracket | Public Insurance | Private Insurance |
| Under 6 | 24 (16.3%) | 126 (85.7%) |
| 6 to 18 Years | 93 (14.2%) | 579 (88.3%) |
| 19 to 25 Years | 45 (27.3%) | 133 (80.6%) |
| 25 to 34 Years | 41 (16.6%) | 188 (76.1%) |
| 35 to 44 Years | 27 (6.4%) | 405 (95.7%) |
| 45 to 54 Years | 39 (13.3%) | 269 (91.5%) |
| 55 to 64 Years | 42 (17.7%) | 219 (92.4%) |
| 65 to 74 Years | 199 (100.0%) | 156 (78.4%) |
| 75 Years and over | 352 (98.6%) | 266 (74.5%) |
| Total | 862 (31.6%) | 2,341 (85.9%) |
Disability Status by Sex by Age in Albany
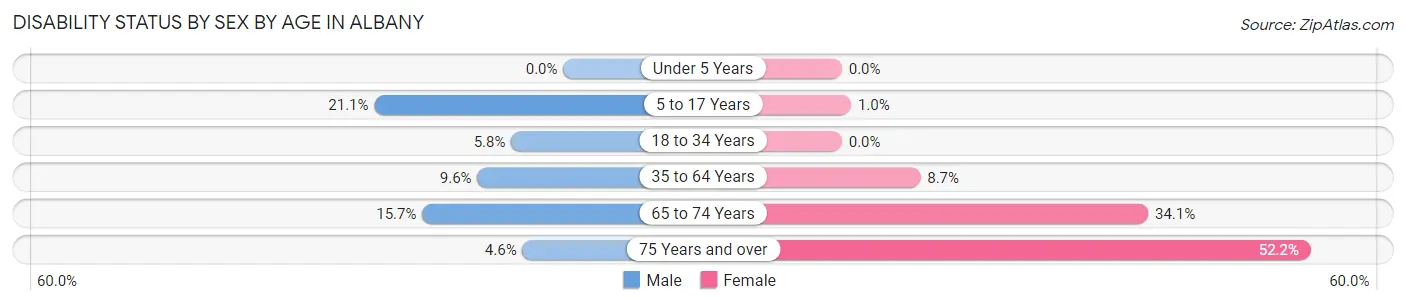
| Age Bracket | Male | Female |
| Under 5 Years | 0 (0.0%) | 0 (0.0%) |
| 5 to 17 Years | 52 (21.0%) | 4 (1.0%) |
| 18 to 34 Years | 12 (5.8%) | 0 (0.0%) |
| 35 to 64 Years | 42 (9.6%) | 45 (8.7%) |
| 65 to 74 Years | 11 (15.7%) | 44 (34.1%) |
| 75 Years and over | 3 (4.5%) | 152 (52.2%) |
Disability Class by Sex by Age in Albany
Disability Class: Hearing Difficulty
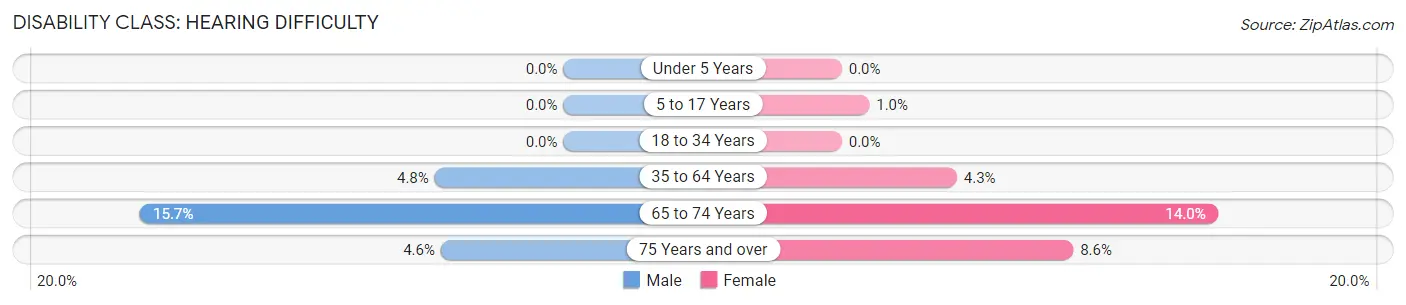
| Age Bracket | Male | Female |
| Under 5 Years | 0 (0.0%) | 0 (0.0%) |
| 5 to 17 Years | 0 (0.0%) | 4 (1.0%) |
| 18 to 34 Years | 0 (0.0%) | 0 (0.0%) |
| 35 to 64 Years | 21 (4.8%) | 22 (4.3%) |
| 65 to 74 Years | 11 (15.7%) | 18 (14.0%) |
| 75 Years and over | 3 (4.5%) | 25 (8.6%) |
Disability Class: Vision Difficulty
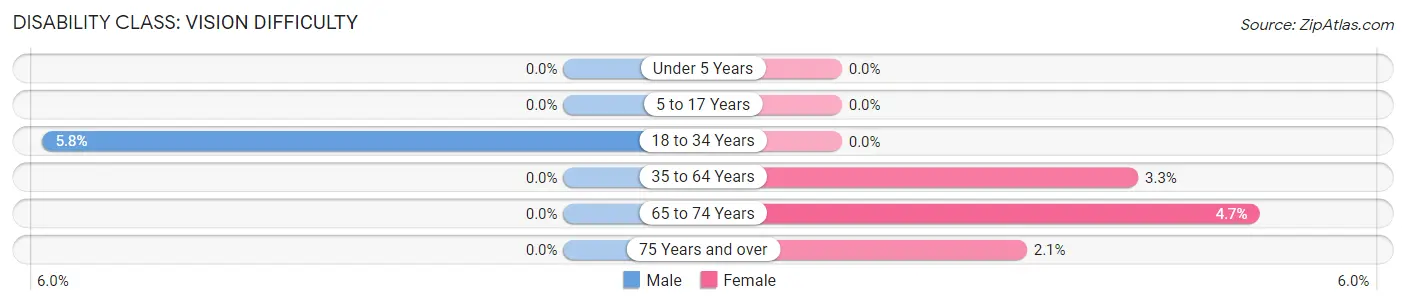
| Age Bracket | Male | Female |
| Under 5 Years | 0 (0.0%) | 0 (0.0%) |
| 5 to 17 Years | 0 (0.0%) | 0 (0.0%) |
| 18 to 34 Years | 12 (5.8%) | 0 (0.0%) |
| 35 to 64 Years | 0 (0.0%) | 17 (3.3%) |
| 65 to 74 Years | 0 (0.0%) | 6 (4.6%) |
| 75 Years and over | 0 (0.0%) | 6 (2.1%) |
Disability Class: Cognitive Difficulty
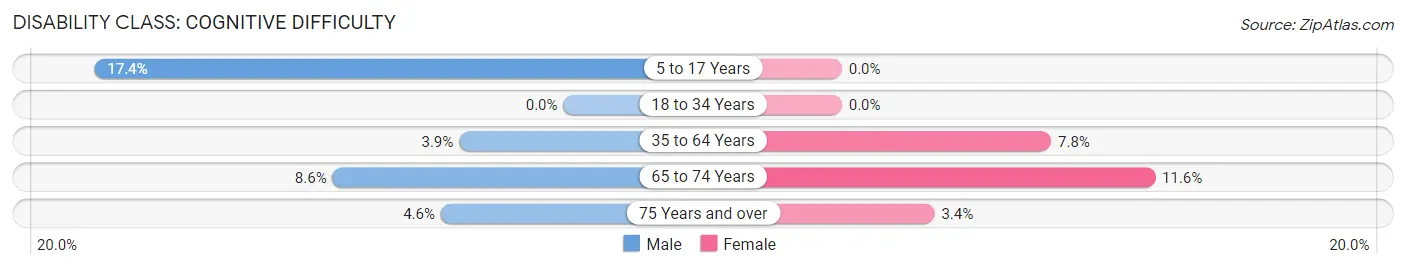
| Age Bracket | Male | Female |
| 5 to 17 Years | 43 (17.4%) | 0 (0.0%) |
| 18 to 34 Years | 0 (0.0%) | 0 (0.0%) |
| 35 to 64 Years | 17 (3.9%) | 40 (7.8%) |
| 65 to 74 Years | 6 (8.6%) | 15 (11.6%) |
| 75 Years and over | 3 (4.5%) | 10 (3.4%) |
Disability Class: Ambulatory Difficulty
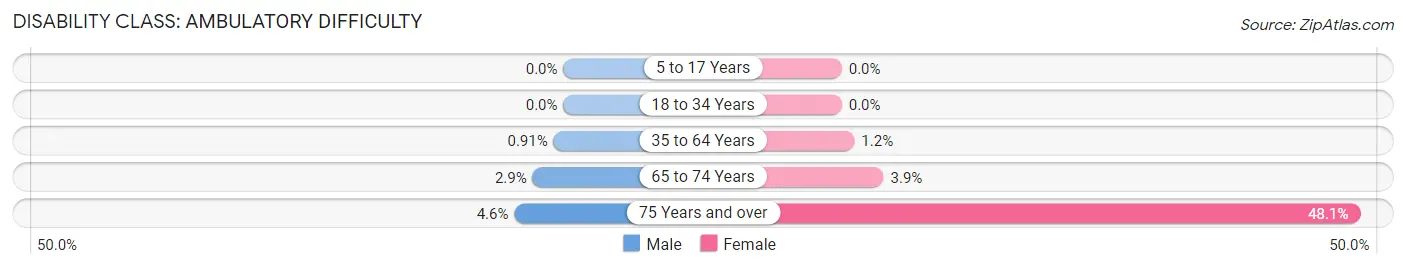
| Age Bracket | Male | Female |
| 5 to 17 Years | 0 (0.0%) | 0 (0.0%) |
| 18 to 34 Years | 0 (0.0%) | 0 (0.0%) |
| 35 to 64 Years | 4 (0.9%) | 6 (1.2%) |
| 65 to 74 Years | 2 (2.9%) | 5 (3.9%) |
| 75 Years and over | 3 (4.5%) | 140 (48.1%) |
Disability Class: Self-Care Difficulty
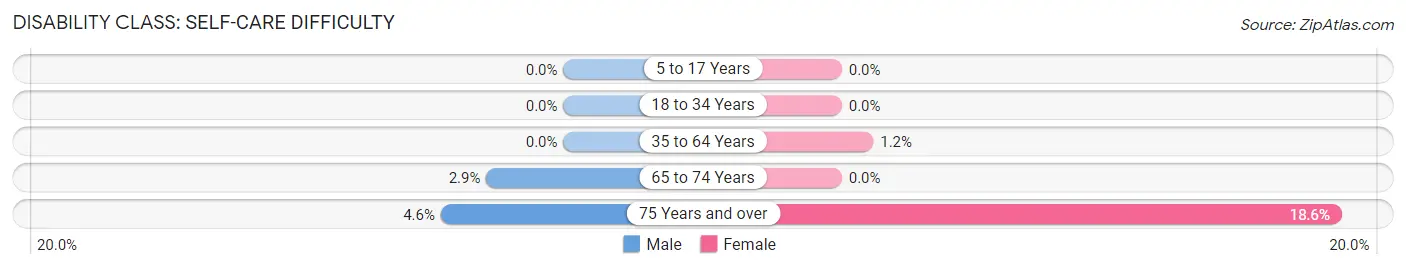
| Age Bracket | Male | Female |
| 5 to 17 Years | 0 (0.0%) | 0 (0.0%) |
| 18 to 34 Years | 0 (0.0%) | 0 (0.0%) |
| 35 to 64 Years | 0 (0.0%) | 6 (1.2%) |
| 65 to 74 Years | 2 (2.9%) | 0 (0.0%) |
| 75 Years and over | 3 (4.5%) | 54 (18.6%) |
Technology Access in Albany
Computing Device Access in Albany
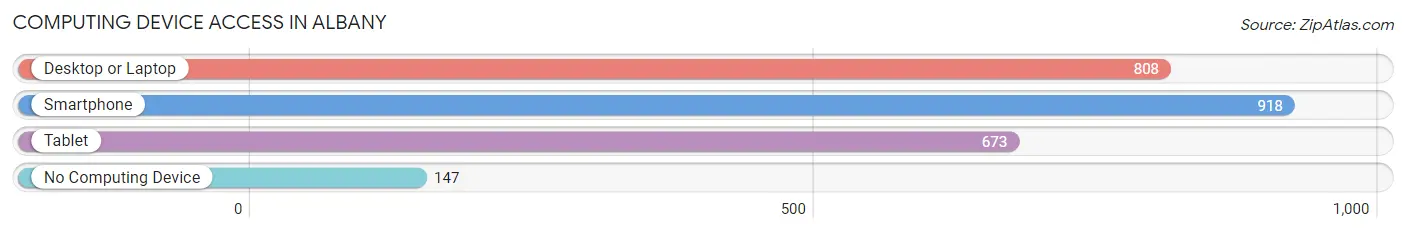
| Device Type | # Households | % Households |
| Desktop or Laptop | 808 | 70.3% |
| Smartphone | 918 | 79.9% |
| Tablet | 673 | 58.6% |
| No Computing Device | 147 | 12.8% |
| Total | 1,149 | 100.0% |
Internet Access in Albany
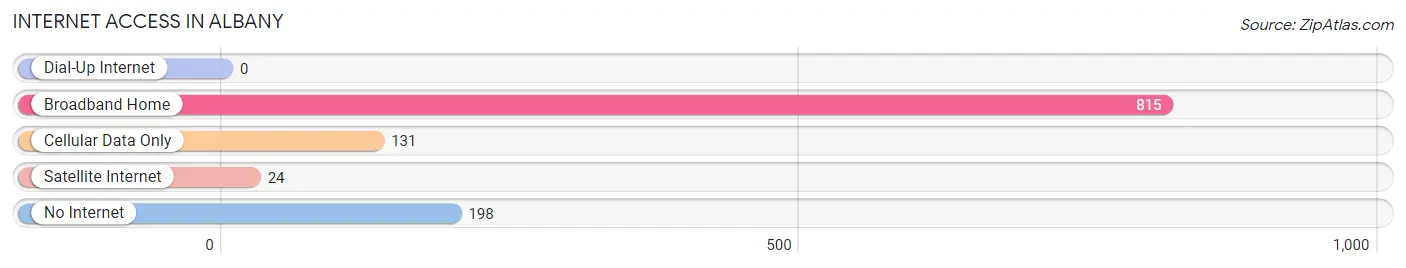
| Internet Type | # Households | % Households |
| Dial-Up Internet | 0 | 0.0% |
| Broadband Home | 815 | 70.9% |
| Cellular Data Only | 131 | 11.4% |
| Satellite Internet | 24 | 2.1% |
| No Internet | 198 | 17.2% |
| Total | 1,149 | 100.0% |
Albany Summary
Albany, Minnesota is a small city located in Stearns County, Minnesota, United States. It is situated on the Sauk River, approximately 40 miles northwest of St. Cloud and about 90 miles northwest of Minneapolis. The city has a population of 2,845 as of the 2010 census.
History
The area that is now Albany was first settled in 1856 by a group of German immigrants. The city was originally named Sauk Centre, but was later changed to Albany in 1872. The city was officially incorporated in 1876.
In the late 19th century, Albany was a major center for the lumber industry. The city was home to several sawmills and lumber yards, and the Sauk River was used to transport logs to the mills. The city also had a thriving brick-making industry, and several brickyards were located in the area.
In the early 20th century, Albany was a major center for the dairy industry. The city was home to several creameries, and the Sauk River was used to transport milk to the creameries.
Geography
Albany is located in Stearns County, Minnesota, United States. It is situated on the Sauk River, approximately 40 miles northwest of St. Cloud and about 90 miles northwest of Minneapolis. The city has a total area of 2.2 square miles, all of which is land.
Economy
Albany’s economy is largely based on agriculture and manufacturing. The city is home to several dairy farms, and the Sauk River is used to transport milk to the creameries. The city also has several manufacturing plants, including a paper mill, a plastics plant, and a metal fabrication plant.
Demographics
As of the 2010 census, Albany had a population of 2,845. The racial makeup of the city was 97.2% White, 0.7% African American, 0.3% Native American, 0.3% Asian, 0.2% from other races, and 1.5% from two or more races. Hispanic or Latino of any race were 1.2% of the population.
The median income for a household in the city was $45,938, and the median income for a family was $54,938. The per capita income for the city was $20,938. About 6.2% of families and 8.2% of the population were below the poverty line, including 10.2% of those under age 18 and 8.2% of those age 65 or over.
Common Questions
What is Per Capita Income in Albany?
Per Capita income in Albany is $39,964.
What is the Median Family Income in Albany?
Median Family Income in Albany is $110,042.
What is the Median Household income in Albany?
Median Household Income in Albany is $78,977.
What is Income or Wage Gap in Albany?
Income or Wage Gap in Albany is 27.5%.
Women in Albany earn 72.5 cents for every dollar earned by a man.
What is Family Income Deficit in Albany?
Family Income Deficit in Albany is $10,511.
Families that are below poverty line in Albany earn $10,511 less on average than the poverty threshold level.
What is Inequality or Gini Index in Albany?
Inequality or Gini Index in Albany is 0.45.
What is the Total Population of Albany?
Total Population of Albany is 2,795.
What is the Total Male Population of Albany?
Total Male Population of Albany is 1,158.
What is the Total Female Population of Albany?
Total Female Population of Albany is 1,637.
What is the Ratio of Males per 100 Females in Albany?
There are 70.74 Males per 100 Females in Albany.
What is the Ratio of Females per 100 Males in Albany?
There are 141.36 Females per 100 Males in Albany.
What is the Median Population Age in Albany?
Median Population Age in Albany is 40.1 Years.
What is the Average Family Size in Albany
Average Family Size in Albany is 3.0 People.
What is the Average Household Size in Albany
Average Household Size in Albany is 2.4 People.
How Large is the Labor Force in Albany?
There are 1,335 People in the Labor Forcein in Albany.
What is the Percentage of People in the Labor Force in Albany?
64.5% of People are in the Labor Force in Albany.
What is the Unemployment Rate in Albany?
Unemployment Rate in Albany is 0.7%.