Fergus Falls, MN Map & Demographics
Fergus Falls Map
Fergus Falls Overview
$31,823
PER CAPITA INCOME
$77,862
AVG FAMILY INCOME
$48,738
AVG HOUSEHOLD INCOME
36.9%
WAGE / INCOME GAP [ % ]
63.1¢/ $1
WAGE / INCOME GAP [ $ ]
$11,780
FAMILY INCOME DEFICIT
0.44
INEQUALITY / GINI INDEX
14,108
TOTAL POPULATION
6,443
MALE POPULATION
7,665
FEMALE POPULATION
84.06
MALES / 100 FEMALES
118.97
FEMALES / 100 MALES
42.0
MEDIAN AGE
2.9
AVG FAMILY SIZE
2.1
AVG HOUSEHOLD SIZE
7,046
LABOR FORCE [ PEOPLE ]
60.9%
PERCENT IN LABOR FORCE
6.9%
UNEMPLOYMENT RATE
Fergus Falls Zip Codes
Fergus Falls Area Codes
Income in Fergus Falls
Income Overview in Fergus Falls
Per Capita Income in Fergus Falls is $31,823, while median incomes of families and households are $77,862 and $48,738 respectively.
| Characteristic | Number | Measure |
| Per Capita Income | 14,108 | $31,823 |
| Median Family Income | 3,252 | $77,862 |
| Mean Family Income | 3,252 | $90,141 |
| Median Household Income | 6,403 | $48,738 |
| Mean Household Income | 6,403 | $66,985 |
| Income Deficit | 3,252 | $11,780 |
| Wage / Income Gap (%) | 14,108 | 36.90% |
| Wage / Income Gap ($) | 14,108 | 63.10¢ per $1 |
| Gini / Inequality Index | 14,108 | 0.44 |
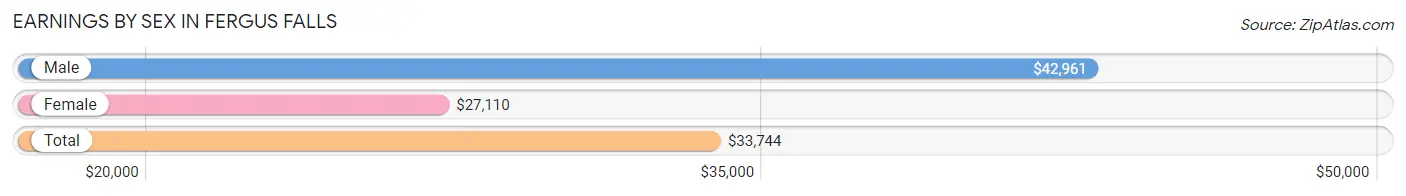
Earnings by Sex in Fergus Falls
Average Earnings in Fergus Falls are $33,744, $42,961 for men and $27,110 for women, a difference of 36.9%.
| Sex | Number | Average Earnings |
| Male | 3,580 (48.4%) | $42,961 |
| Female | 3,820 (51.6%) | $27,110 |
| Total | 7,400 (100.0%) | $33,744 |
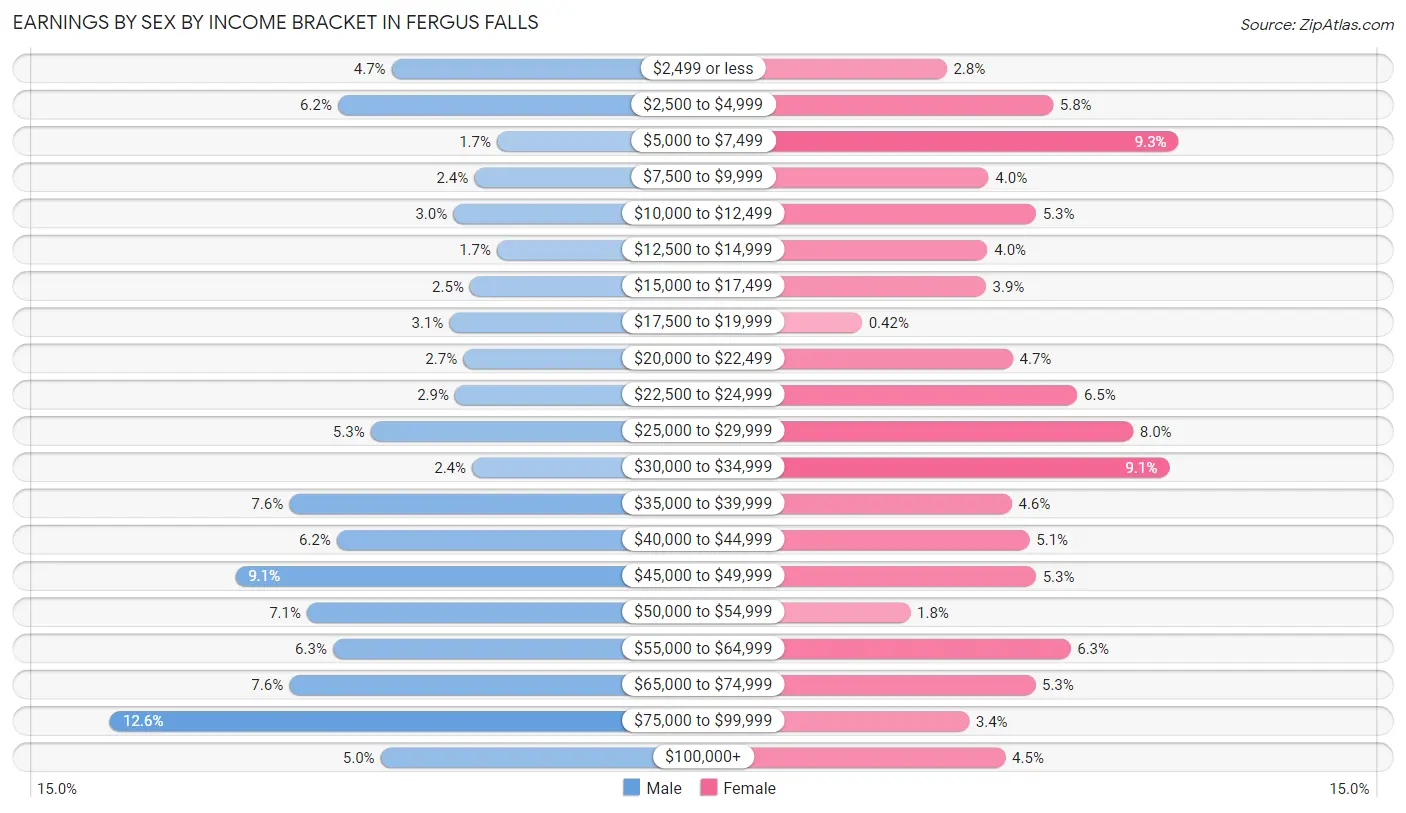
Earnings by Sex by Income Bracket in Fergus Falls
The most common earnings brackets in Fergus Falls are $75,000 to $99,999 for men (451 | 12.6%) and $5,000 to $7,499 for women (356 | 9.3%).
| Income | Male | Female |
| $2,499 or less | 168 (4.7%) | 107 (2.8%) |
| $2,500 to $4,999 | 222 (6.2%) | 221 (5.8%) |
| $5,000 to $7,499 | 62 (1.7%) | 356 (9.3%) |
| $7,500 to $9,999 | 85 (2.4%) | 152 (4.0%) |
| $10,000 to $12,499 | 106 (3.0%) | 203 (5.3%) |
| $12,500 to $14,999 | 62 (1.7%) | 151 (4.0%) |
| $15,000 to $17,499 | 89 (2.5%) | 149 (3.9%) |
| $17,500 to $19,999 | 110 (3.1%) | 16 (0.4%) |
| $20,000 to $22,499 | 96 (2.7%) | 178 (4.7%) |
| $22,500 to $24,999 | 104 (2.9%) | 247 (6.5%) |
| $25,000 to $29,999 | 189 (5.3%) | 307 (8.0%) |
| $30,000 to $34,999 | 87 (2.4%) | 346 (9.1%) |
| $35,000 to $39,999 | 271 (7.6%) | 177 (4.6%) |
| $40,000 to $44,999 | 223 (6.2%) | 196 (5.1%) |
| $45,000 to $49,999 | 325 (9.1%) | 203 (5.3%) |
| $50,000 to $54,999 | 253 (7.1%) | 68 (1.8%) |
| $55,000 to $64,999 | 227 (6.3%) | 240 (6.3%) |
| $65,000 to $74,999 | 271 (7.6%) | 202 (5.3%) |
| $75,000 to $99,999 | 451 (12.6%) | 131 (3.4%) |
| $100,000+ | 179 (5.0%) | 170 (4.4%) |
| Total | 3,580 (100.0%) | 3,820 (100.0%) |
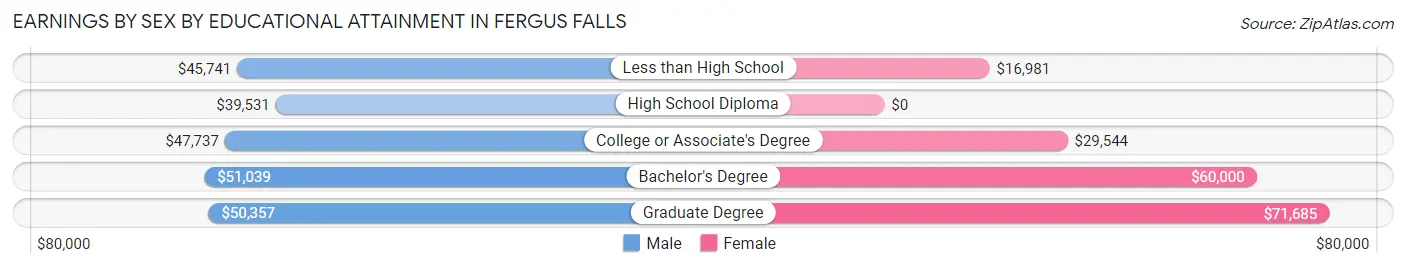
Earnings by Sex by Educational Attainment in Fergus Falls
Average earnings in Fergus Falls are $47,808 for men and $30,064 for women, a difference of 37.1%. Men with an educational attainment of bachelor's degree enjoy the highest average annual earnings of $51,039, while those with high school diploma education earn the least with $39,531. Women with an educational attainment of graduate degree earn the most with the average annual earnings of $71,685, while those with less than high school education have the smallest earnings of $16,981.
| Educational Attainment | Male Income | Female Income |
| Less than High School | $45,741 | $16,981 |
| High School Diploma | $39,531 | $0 |
| College or Associate's Degree | $47,737 | $29,544 |
| Bachelor's Degree | $51,039 | $60,000 |
| Graduate Degree | $50,357 | $71,685 |
| Total | $47,808 | $30,064 |
Family Income in Fergus Falls
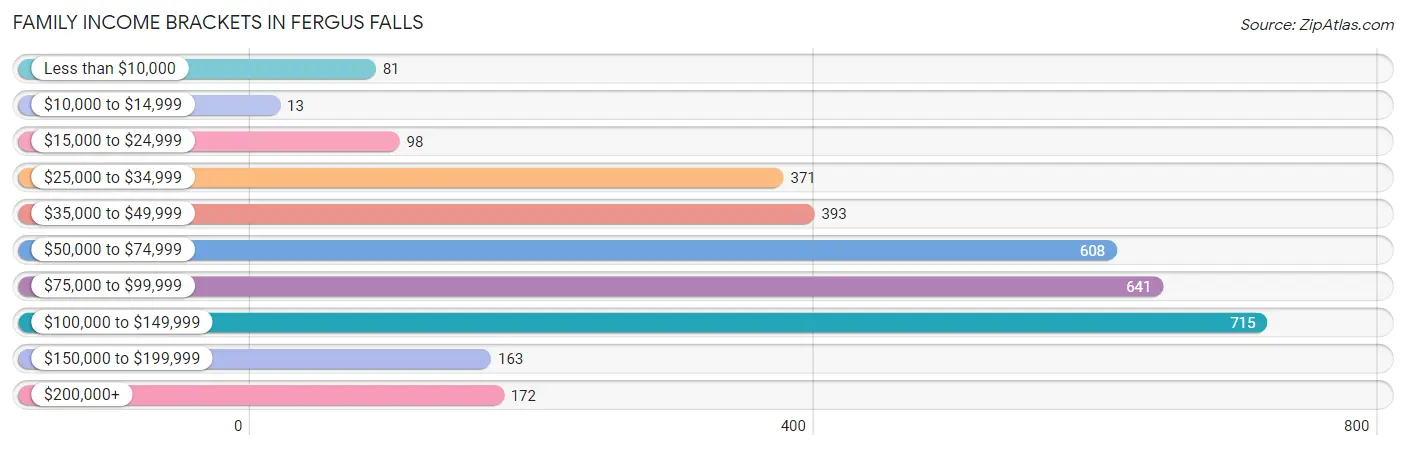
Family Income Brackets in Fergus Falls
According to the Fergus Falls family income data, there are 715 families falling into the $100,000 to $149,999 income range, which is the most common income bracket and makes up 22.0% of all families. Conversely, the $10,000 to $14,999 income bracket is the least frequent group with only 13 families (0.4%) belonging to this category.
| Income Bracket | # Families | % Families |
| Less than $10,000 | 81 | 2.5% |
| $10,000 to $14,999 | 13 | 0.4% |
| $15,000 to $24,999 | 98 | 3.0% |
| $25,000 to $34,999 | 371 | 11.4% |
| $35,000 to $49,999 | 393 | 12.1% |
| $50,000 to $74,999 | 608 | 18.7% |
| $75,000 to $99,999 | 641 | 19.7% |
| $100,000 to $149,999 | 715 | 22.0% |
| $150,000 to $199,999 | 163 | 5.0% |
| $200,000+ | 172 | 5.3% |
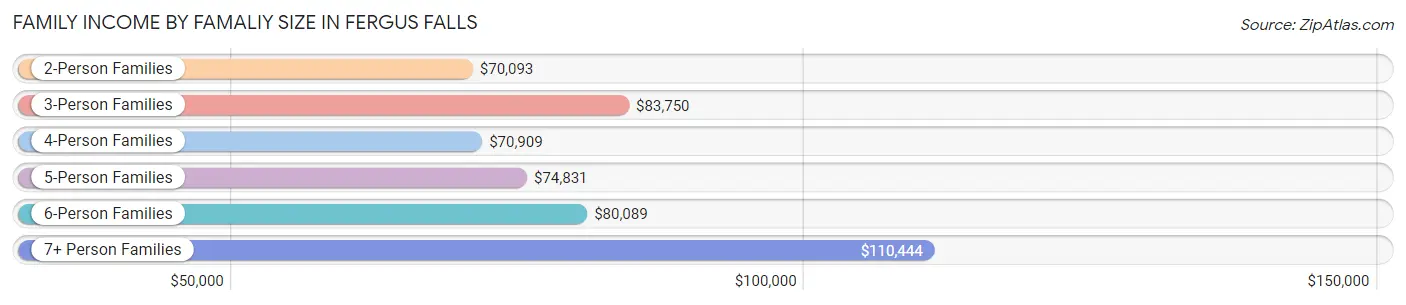
Family Income by Famaliy Size in Fergus Falls
7+ person families (75 | 2.3%) account for the highest median family income in Fergus Falls with $110,444 per family, while 2-person families (1,822 | 56.0%) have the highest median income of $35,046 per family member.
| Income Bracket | # Families | Median Income |
| 2-Person Families | 1,822 (56.0%) | $70,093 |
| 3-Person Families | 598 (18.4%) | $83,750 |
| 4-Person Families | 478 (14.7%) | $70,909 |
| 5-Person Families | 187 (5.8%) | $74,831 |
| 6-Person Families | 92 (2.8%) | $80,089 |
| 7+ Person Families | 75 (2.3%) | $110,444 |
| Total | 3,252 (100.0%) | $77,862 |
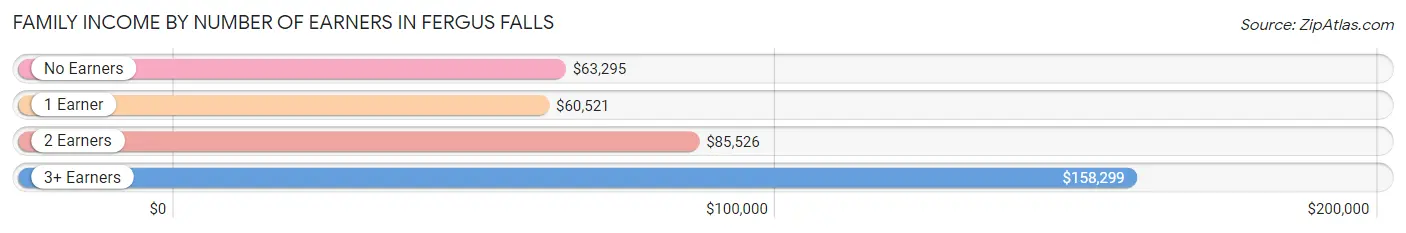
Family Income by Number of Earners in Fergus Falls
The median family income in Fergus Falls is $77,862, with families comprising 3+ earners (207) having the highest median family income of $158,299, while families with 1 earner (923) have the lowest median family income of $60,521, accounting for 6.4% and 28.4% of families, respectively.
| Number of Earners | # Families | Median Income |
| No Earners | 596 (18.3%) | $63,295 |
| 1 Earner | 923 (28.4%) | $60,521 |
| 2 Earners | 1,526 (46.9%) | $85,526 |
| 3+ Earners | 207 (6.4%) | $158,299 |
| Total | 3,252 (100.0%) | $77,862 |
Household Income in Fergus Falls
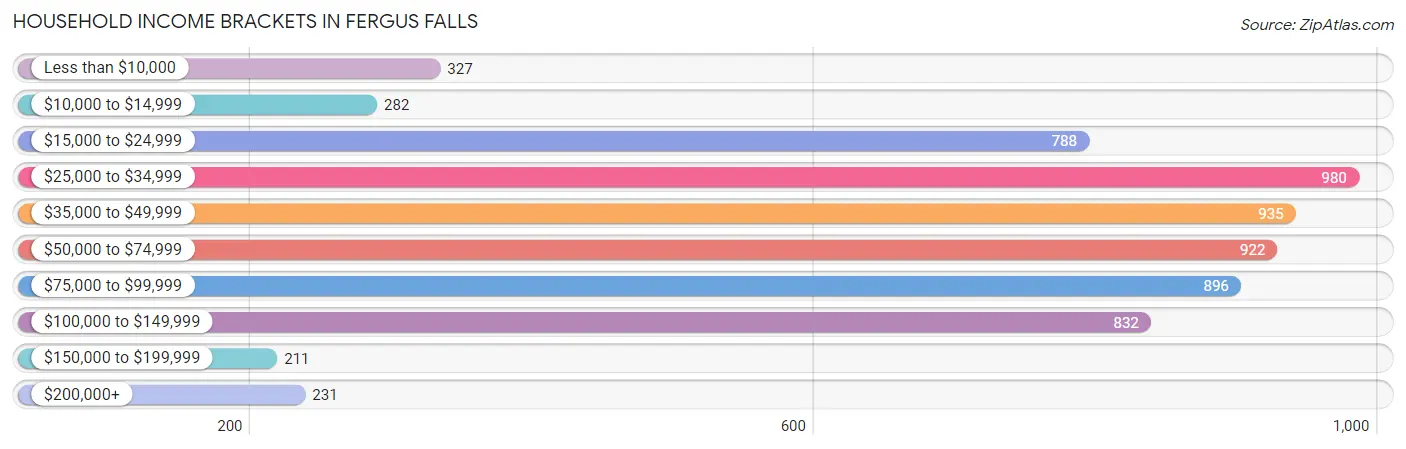
Household Income Brackets in Fergus Falls
With 980 households falling in the category, the $25,000 to $34,999 income range is the most frequent in Fergus Falls, accounting for 15.3% of all households. In contrast, only 211 households (3.3%) fall into the $150,000 to $199,999 income bracket, making it the least populous group.
| Income Bracket | # Households | % Households |
| Less than $10,000 | 327 | 5.1% |
| $10,000 to $14,999 | 282 | 4.4% |
| $15,000 to $24,999 | 788 | 12.3% |
| $25,000 to $34,999 | 980 | 15.3% |
| $35,000 to $49,999 | 935 | 14.6% |
| $50,000 to $74,999 | 922 | 14.4% |
| $75,000 to $99,999 | 896 | 14.0% |
| $100,000 to $149,999 | 832 | 13.0% |
| $150,000 to $199,999 | 211 | 3.3% |
| $200,000+ | 231 | 3.6% |
Household Income by Householder Age in Fergus Falls
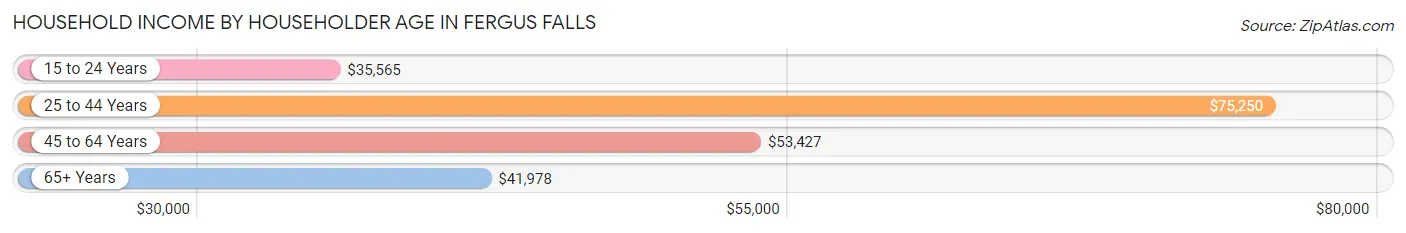
The median household income in Fergus Falls is $48,738, with the highest median household income of $75,250 found in the 25 to 44 years age bracket for the primary householder. A total of 1,701 households (26.6%) fall into this category. Meanwhile, the 15 to 24 years age bracket for the primary householder has the lowest median household income of $35,565, with 351 households (5.5%) in this group.
| Income Bracket | # Households | Median Income |
| 15 to 24 Years | 351 (5.5%) | $35,565 |
| 25 to 44 Years | 1,701 (26.6%) | $75,250 |
| 45 to 64 Years | 2,179 (34.0%) | $53,427 |
| 65+ Years | 2,172 (33.9%) | $41,978 |
| Total | 6,403 (100.0%) | $48,738 |
Poverty in Fergus Falls
Income Below Poverty by Sex and Age in Fergus Falls
With 9.8% poverty level for males and 8.7% for females among the residents of Fergus Falls, 18 to 24 year old males and 18 to 24 year old females are the most vulnerable to poverty, with 140 males (34.9%) and 129 females (19.9%) in their respective age groups living below the poverty level.
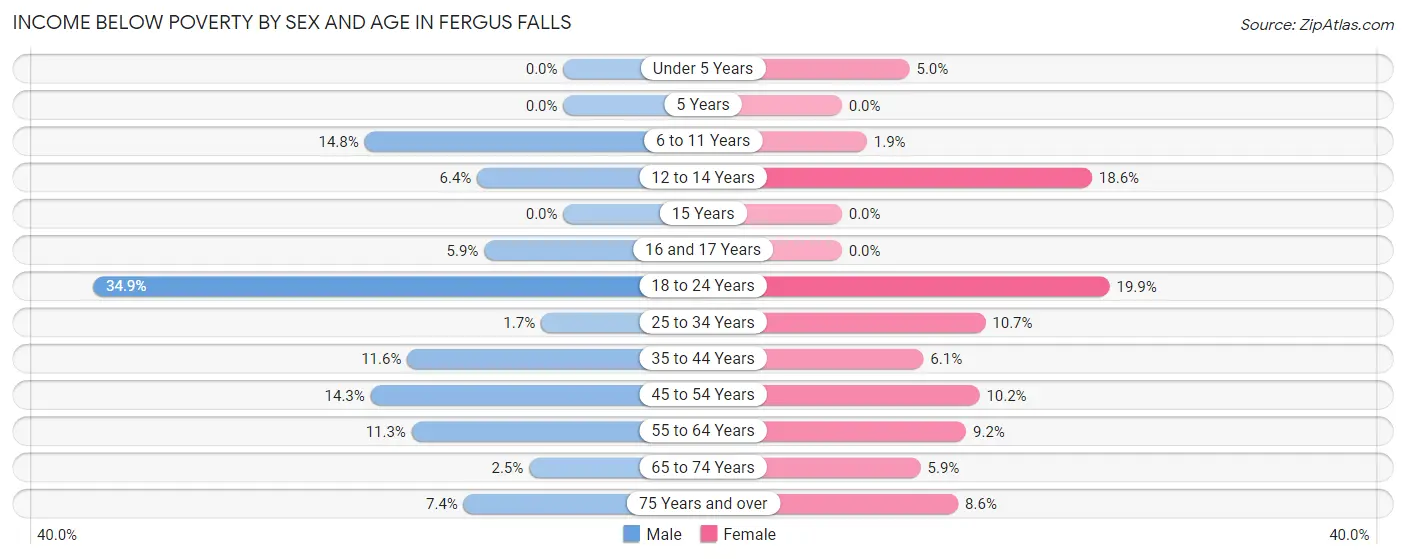
| Age Bracket | Male | Female |
| Under 5 Years | 0 (0.0%) | 19 (5.0%) |
| 5 Years | 0 (0.0%) | 0 (0.0%) |
| 6 to 11 Years | 89 (14.8%) | 10 (1.9%) |
| 12 to 14 Years | 8 (6.4%) | 39 (18.6%) |
| 15 Years | 0 (0.0%) | 0 (0.0%) |
| 16 and 17 Years | 8 (5.9%) | 0 (0.0%) |
| 18 to 24 Years | 140 (34.9%) | 129 (19.9%) |
| 25 to 34 Years | 13 (1.7%) | 91 (10.7%) |
| 35 to 44 Years | 105 (11.6%) | 47 (6.1%) |
| 45 to 54 Years | 81 (14.3%) | 64 (10.2%) |
| 55 to 64 Years | 98 (11.3%) | 110 (9.2%) |
| 65 to 74 Years | 16 (2.5%) | 46 (5.9%) |
| 75 Years and over | 54 (7.4%) | 87 (8.6%) |
| Total | 612 (9.8%) | 642 (8.7%) |
Income Above Poverty by Sex and Age in Fergus Falls
According to the poverty statistics in Fergus Falls, males aged under 5 years and females aged 5 years are the age groups that are most secure financially, with 100.0% of males and 100.0% of females in these age groups living above the poverty line.
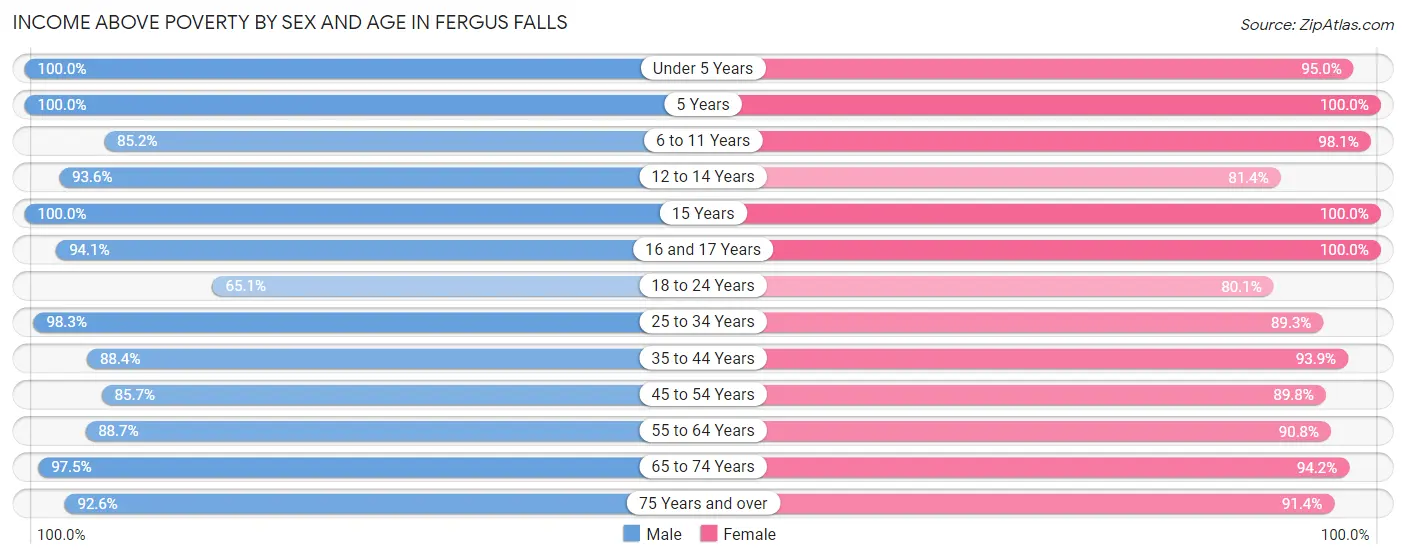
| Age Bracket | Male | Female |
| Under 5 Years | 364 (100.0%) | 359 (95.0%) |
| 5 Years | 59 (100.0%) | 141 (100.0%) |
| 6 to 11 Years | 514 (85.2%) | 528 (98.1%) |
| 12 to 14 Years | 117 (93.6%) | 171 (81.4%) |
| 15 Years | 55 (100.0%) | 65 (100.0%) |
| 16 and 17 Years | 128 (94.1%) | 143 (100.0%) |
| 18 to 24 Years | 261 (65.1%) | 520 (80.1%) |
| 25 to 34 Years | 768 (98.3%) | 763 (89.3%) |
| 35 to 44 Years | 801 (88.4%) | 729 (93.9%) |
| 45 to 54 Years | 485 (85.7%) | 562 (89.8%) |
| 55 to 64 Years | 772 (88.7%) | 1,082 (90.8%) |
| 65 to 74 Years | 614 (97.5%) | 740 (94.2%) |
| 75 Years and over | 676 (92.6%) | 920 (91.4%) |
| Total | 5,614 (90.2%) | 6,723 (91.3%) |
Income Below Poverty Among Married-Couple Families in Fergus Falls
The poverty statistics for married-couple families in Fergus Falls show that 1.6% or 37 of the total 2,342 families live below the poverty line. Families with no children have the highest poverty rate of 2.5%, comprising of 37 families. On the other hand, families with 1 or 2 children have the lowest poverty rate of 0.0%, which includes 0 families.
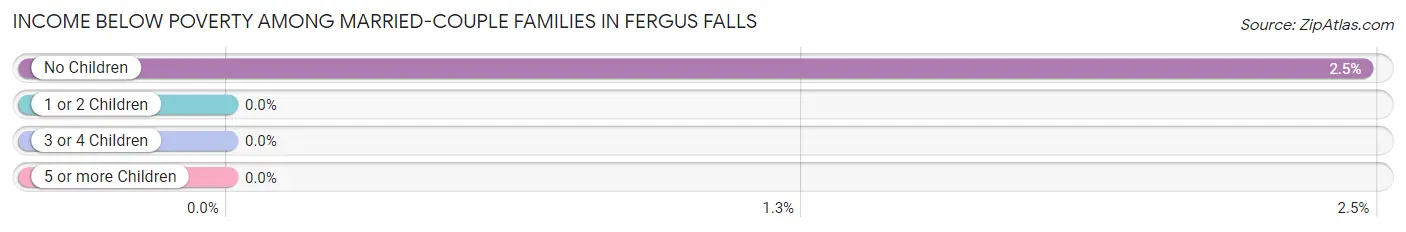
| Children | Above Poverty | Below Poverty |
| No Children | 1,464 (97.5%) | 37 (2.5%) |
| 1 or 2 Children | 541 (100.0%) | 0 (0.0%) |
| 3 or 4 Children | 237 (100.0%) | 0 (0.0%) |
| 5 or more Children | 63 (100.0%) | 0 (0.0%) |
| Total | 2,305 (98.4%) | 37 (1.6%) |
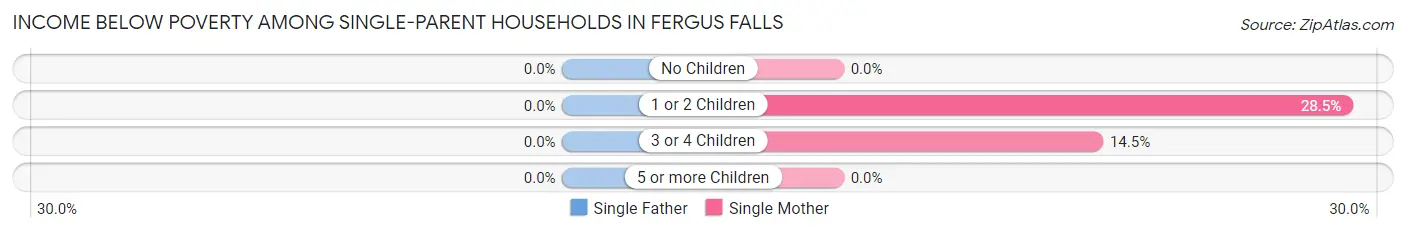
Income Below Poverty Among Single-Parent Households in Fergus Falls
| Children | Single Father | Single Mother |
| No Children | 0 (0.0%) | 0 (0.0%) |
| 1 or 2 Children | 0 (0.0%) | 76 (28.5%) |
| 3 or 4 Children | 0 (0.0%) | 10 (14.5%) |
| 5 or more Children | 0 (0.0%) | 0 (0.0%) |
| Total | 0 (0.0%) | 86 (12.7%) |
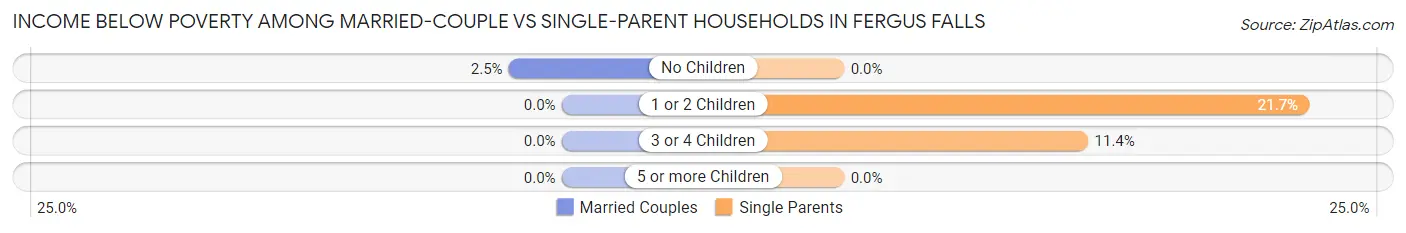
Income Below Poverty Among Married-Couple vs Single-Parent Households in Fergus Falls
The poverty data for Fergus Falls shows that 37 of the married-couple family households (1.6%) and 86 of the single-parent households (9.5%) are living below the poverty level. Within the married-couple family households, those with no children have the highest poverty rate, with 37 households (2.5%) falling below the poverty line. Among the single-parent households, those with 1 or 2 children have the highest poverty rate, with 76 household (21.7%) living below poverty.
| Children | Married-Couple Families | Single-Parent Households |
| No Children | 37 (2.5%) | 0 (0.0%) |
| 1 or 2 Children | 0 (0.0%) | 76 (21.7%) |
| 3 or 4 Children | 0 (0.0%) | 10 (11.4%) |
| 5 or more Children | 0 (0.0%) | 0 (0.0%) |
| Total | 37 (1.6%) | 86 (9.5%) |
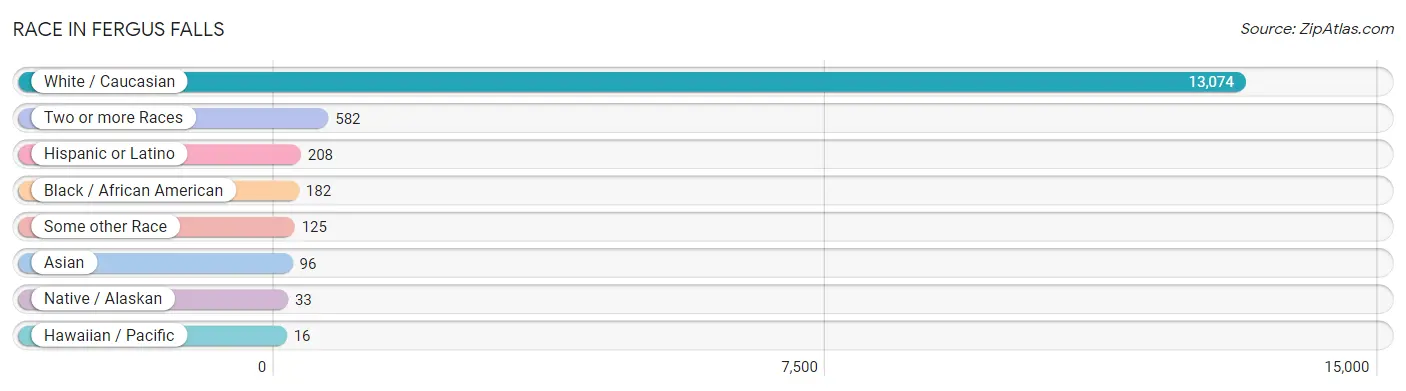
Race in Fergus Falls
The most populous races in Fergus Falls are White / Caucasian (13,074 | 92.7%), Two or more Races (582 | 4.1%), and Hispanic or Latino (208 | 1.5%).
| Race | # Population | % Population |
| Asian | 96 | 0.7% |
| Black / African American | 182 | 1.3% |
| Hawaiian / Pacific | 16 | 0.1% |
| Hispanic or Latino | 208 | 1.5% |
| Native / Alaskan | 33 | 0.2% |
| White / Caucasian | 13,074 | 92.7% |
| Two or more Races | 582 | 4.1% |
| Some other Race | 125 | 0.9% |
| Total | 14,108 | 100.0% |
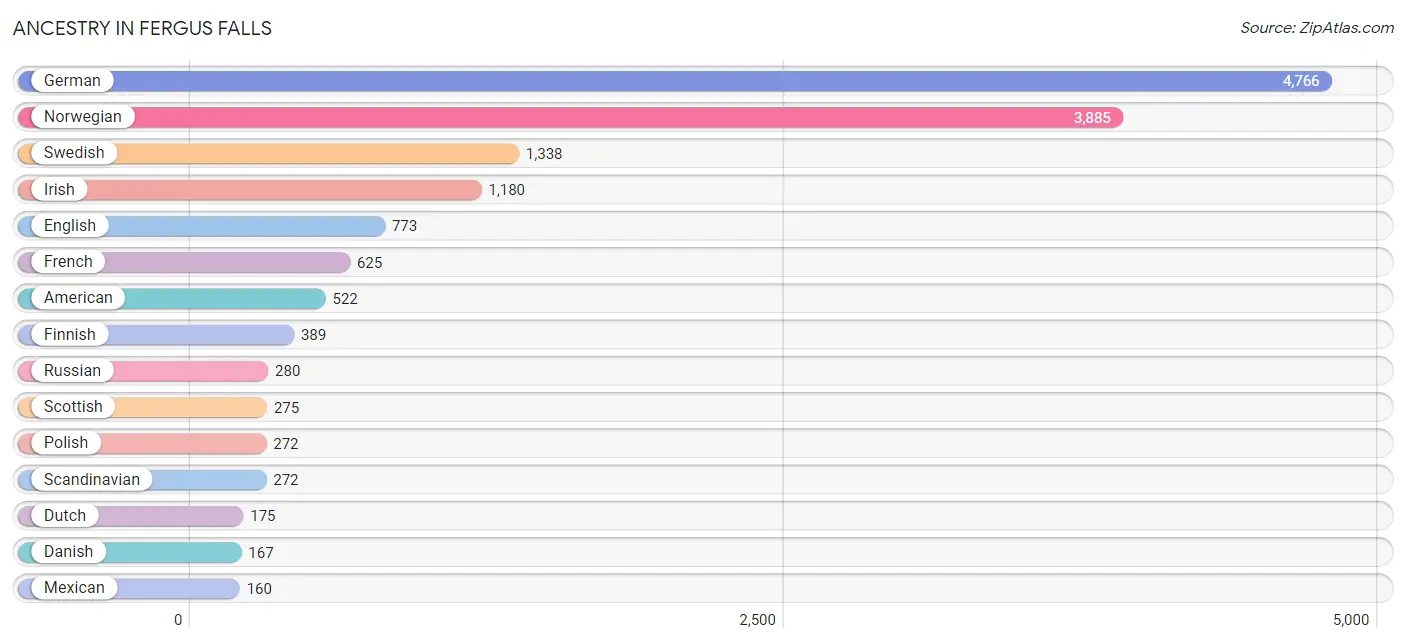
Ancestry in Fergus Falls
The most populous ancestries reported in Fergus Falls are German (4,766 | 33.8%), Norwegian (3,885 | 27.5%), Swedish (1,338 | 9.5%), Irish (1,180 | 8.4%), and English (773 | 5.5%), together accounting for 84.6% of all Fergus Falls residents.
| Ancestry | # Population | % Population |
| American | 522 | 3.7% |
| Austrian | 5 | 0.0% |
| Bangladeshi | 10 | 0.1% |
| Belgian | 28 | 0.2% |
| Bhutanese | 5 | 0.0% |
| British | 42 | 0.3% |
| Burmese | 42 | 0.3% |
| Canadian | 13 | 0.1% |
| Cherokee | 11 | 0.1% |
| Chippewa | 58 | 0.4% |
| Cuban | 12 | 0.1% |
| Czech | 84 | 0.6% |
| Czechoslovakian | 9 | 0.1% |
| Danish | 167 | 1.2% |
| Dutch | 175 | 1.2% |
| Eastern European | 29 | 0.2% |
| English | 773 | 5.5% |
| European | 115 | 0.8% |
| Filipino | 12 | 0.1% |
| Finnish | 389 | 2.8% |
| French | 625 | 4.4% |
| French Canadian | 86 | 0.6% |
| German | 4,766 | 33.8% |
| German Russian | 18 | 0.1% |
| Greek | 8 | 0.1% |
| Hungarian | 5 | 0.0% |
| Indian (Asian) | 42 | 0.3% |
| Irish | 1,180 | 8.4% |
| Italian | 132 | 0.9% |
| Jamaican | 11 | 0.1% |
| Korean | 28 | 0.2% |
| Menominee | 20 | 0.1% |
| Mexican | 160 | 1.1% |
| Mexican American Indian | 27 | 0.2% |
| Norwegian | 3,885 | 27.5% |
| Polish | 272 | 1.9% |
| Romanian | 6 | 0.0% |
| Russian | 280 | 2.0% |
| Samoan | 16 | 0.1% |
| Scandinavian | 272 | 1.9% |
| Scotch-Irish | 86 | 0.6% |
| Scottish | 275 | 1.9% |
| Serbian | 13 | 0.1% |
| Slovak | 20 | 0.1% |
| Somali | 15 | 0.1% |
| Spanish | 36 | 0.3% |
| Subsaharan African | 15 | 0.1% |
| Swedish | 1,338 | 9.5% |
| Swiss | 11 | 0.1% |
| Welsh | 38 | 0.3% | View All 50 Rows |
Immigrants in Fergus Falls
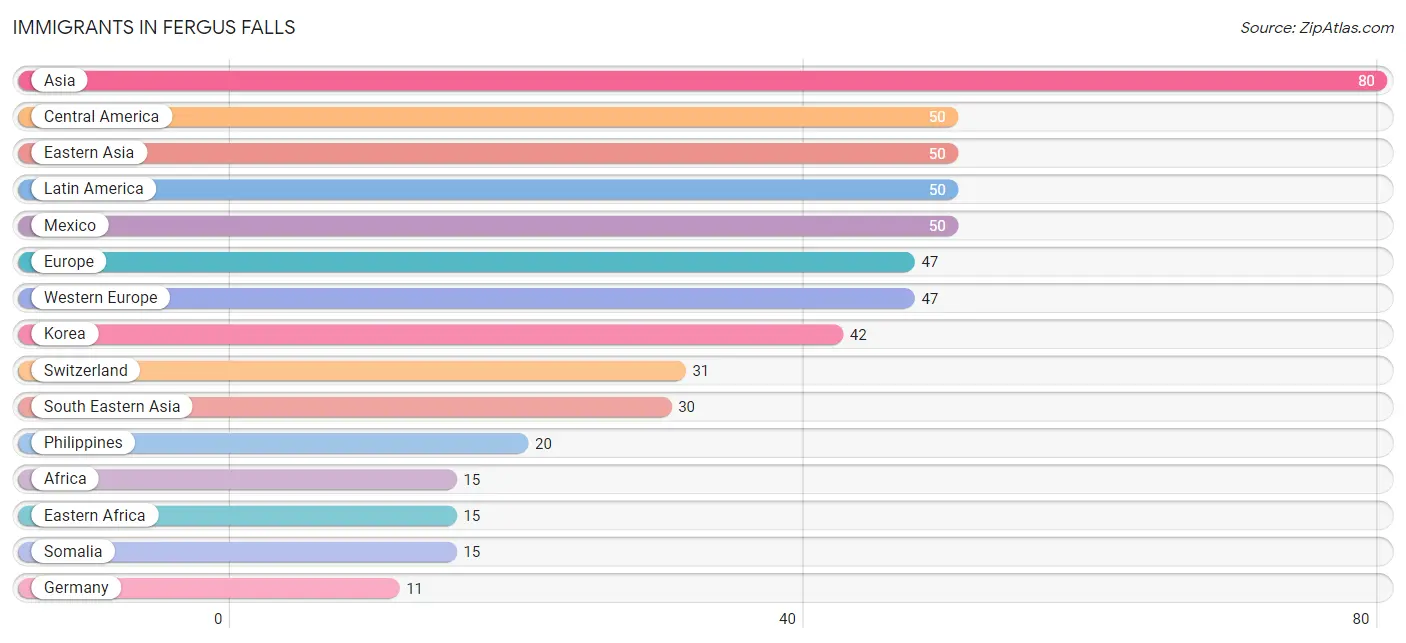
The most numerous immigrant groups reported in Fergus Falls came from Asia (80 | 0.6%), Central America (50 | 0.4%), Eastern Asia (50 | 0.4%), Latin America (50 | 0.4%), and Mexico (50 | 0.4%), together accounting for 2.0% of all Fergus Falls residents.
| Immigration Origin | # Population | % Population |
| Africa | 15 | 0.1% |
| Asia | 80 | 0.6% |
| Canada | 7 | 0.1% |
| Central America | 50 | 0.4% |
| China | 3 | 0.0% |
| Eastern Africa | 15 | 0.1% |
| Eastern Asia | 50 | 0.4% |
| Europe | 47 | 0.3% |
| Germany | 11 | 0.1% |
| Japan | 5 | 0.0% |
| Korea | 42 | 0.3% |
| Latin America | 50 | 0.4% |
| Mexico | 50 | 0.4% |
| Netherlands | 5 | 0.0% |
| Philippines | 20 | 0.1% |
| Somalia | 15 | 0.1% |
| South Eastern Asia | 30 | 0.2% |
| Switzerland | 31 | 0.2% |
| Vietnam | 10 | 0.1% |
| Western Europe | 47 | 0.3% | View All 20 Rows |
Sex and Age in Fergus Falls
Sex and Age in Fergus Falls
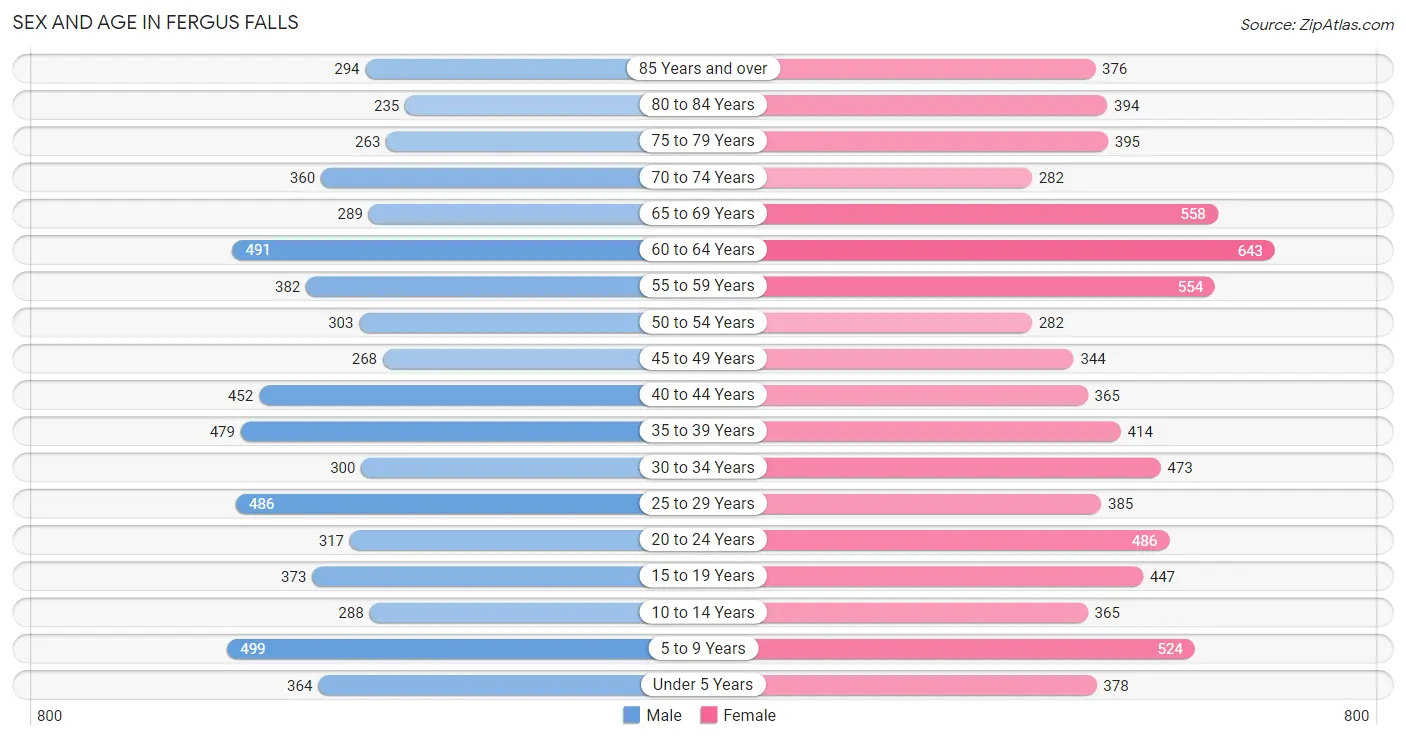
The most populous age groups in Fergus Falls are 5 to 9 Years (499 | 7.7%) for men and 60 to 64 Years (643 | 8.4%) for women.
| Age Bracket | Male | Female |
| Under 5 Years | 364 (5.7%) | 378 (4.9%) |
| 5 to 9 Years | 499 (7.7%) | 524 (6.8%) |
| 10 to 14 Years | 288 (4.5%) | 365 (4.8%) |
| 15 to 19 Years | 373 (5.8%) | 447 (5.8%) |
| 20 to 24 Years | 317 (4.9%) | 486 (6.3%) |
| 25 to 29 Years | 486 (7.5%) | 385 (5.0%) |
| 30 to 34 Years | 300 (4.7%) | 473 (6.2%) |
| 35 to 39 Years | 479 (7.4%) | 414 (5.4%) |
| 40 to 44 Years | 452 (7.0%) | 365 (4.8%) |
| 45 to 49 Years | 268 (4.2%) | 344 (4.5%) |
| 50 to 54 Years | 303 (4.7%) | 282 (3.7%) |
| 55 to 59 Years | 382 (5.9%) | 554 (7.2%) |
| 60 to 64 Years | 491 (7.6%) | 643 (8.4%) |
| 65 to 69 Years | 289 (4.5%) | 558 (7.3%) |
| 70 to 74 Years | 360 (5.6%) | 282 (3.7%) |
| 75 to 79 Years | 263 (4.1%) | 395 (5.1%) |
| 80 to 84 Years | 235 (3.6%) | 394 (5.1%) |
| 85 Years and over | 294 (4.6%) | 376 (4.9%) |
| Total | 6,443 (100.0%) | 7,665 (100.0%) |
Families and Households in Fergus Falls
Median Family Size in Fergus Falls
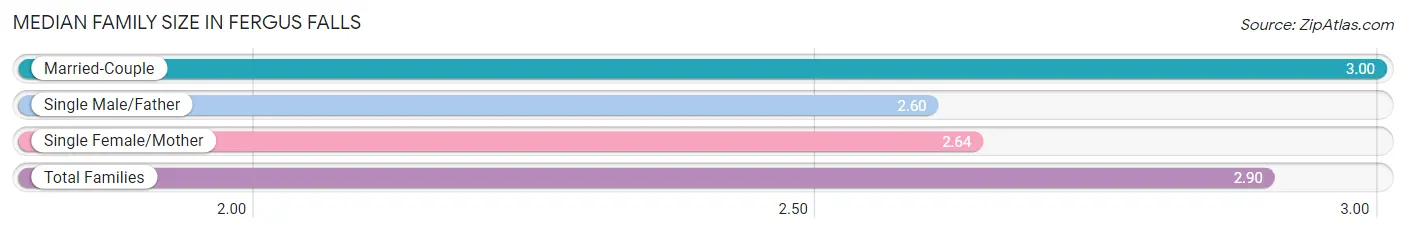
The median family size in Fergus Falls is 2.90 persons per family, with married-couple families (2,342 | 72.0%) accounting for the largest median family size of 3 persons per family. On the other hand, single male/father families (232 | 7.1%) represent the smallest median family size with 2.60 persons per family.
| Family Type | # Families | Family Size |
| Married-Couple | 2,342 (72.0%) | 3.00 |
| Single Male/Father | 232 (7.1%) | 2.60 |
| Single Female/Mother | 678 (20.8%) | 2.64 |
| Total Families | 3,252 (100.0%) | 2.90 |
Median Household Size in Fergus Falls
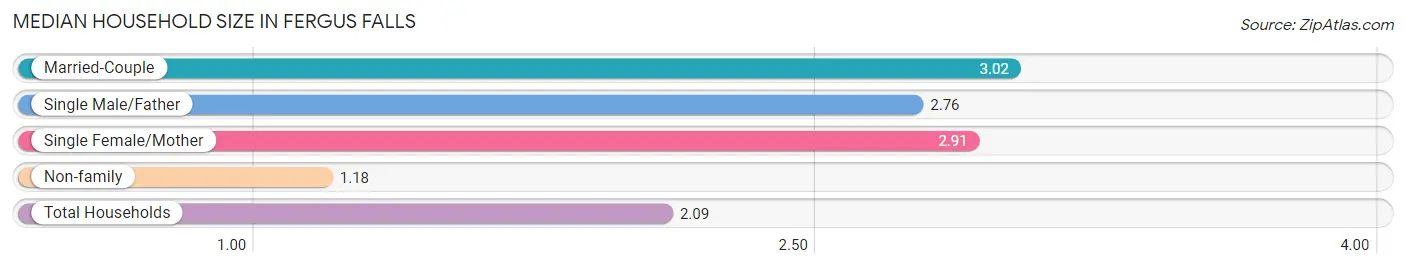
The median household size in Fergus Falls is 2.09 persons per household, with married-couple households (2,342 | 36.6%) accounting for the largest median household size of 3.02 persons per household. non-family households (3,151 | 49.2%) represent the smallest median household size with 1.18 persons per household.
| Household Type | # Households | Household Size |
| Married-Couple | 2,342 (36.6%) | 3.02 |
| Single Male/Father | 232 (3.6%) | 2.76 |
| Single Female/Mother | 678 (10.6%) | 2.91 |
| Non-family | 3,151 (49.2%) | 1.18 |
| Total Households | 6,403 (100.0%) | 2.09 |
Household Size by Marriage Status in Fergus Falls
Out of a total of 6,403 households in Fergus Falls, 3,252 (50.8%) are family households, while 3,151 (49.2%) are nonfamily households. The most numerous type of family households are 2-person households, comprising 1,733, and the most common type of nonfamily households are 1-person households, comprising 2,708.
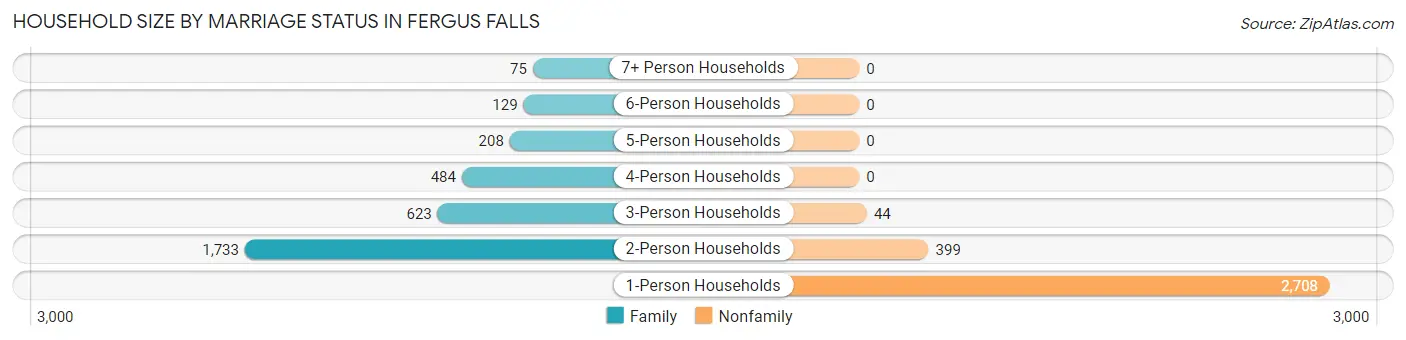
| Household Size | Family Households | Nonfamily Households |
| 1-Person Households | - | 2,708 (42.3%) |
| 2-Person Households | 1,733 (27.1%) | 399 (6.2%) |
| 3-Person Households | 623 (9.7%) | 44 (0.7%) |
| 4-Person Households | 484 (7.6%) | 0 (0.0%) |
| 5-Person Households | 208 (3.3%) | 0 (0.0%) |
| 6-Person Households | 129 (2.0%) | 0 (0.0%) |
| 7+ Person Households | 75 (1.2%) | 0 (0.0%) |
| Total | 3,252 (50.8%) | 3,151 (49.2%) |
Female Fertility in Fergus Falls
Fertility by Age in Fergus Falls
Average fertility rate in Fergus Falls is 51.0 births per 1,000 women. Women in the age bracket of 20 to 34 years have the highest fertility rate with 61.0 births per 1,000 women. Women in the age bracket of 20 to 34 years acount for 54.3% of all women with births.
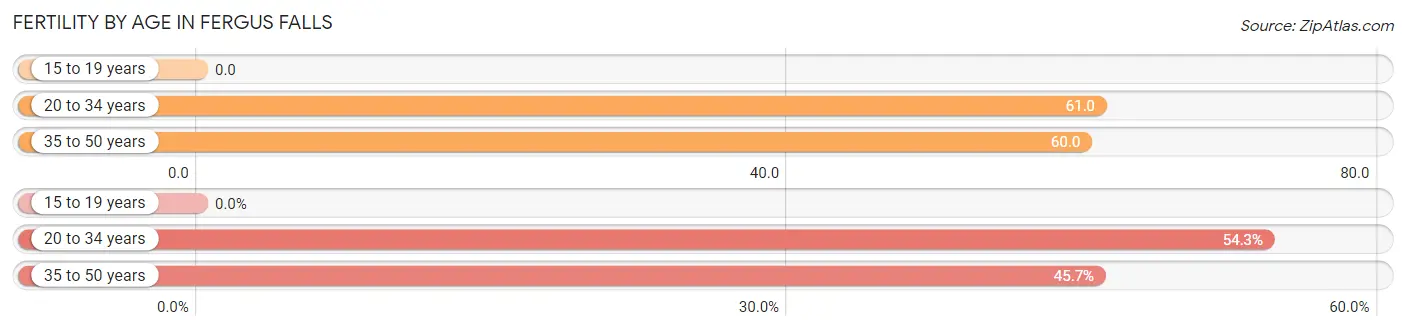
| Age Bracket | Women with Births | Births / 1,000 Women |
| 15 to 19 years | 0 (0.0%) | 0.0 |
| 20 to 34 years | 82 (54.3%) | 61.0 |
| 35 to 50 years | 69 (45.7%) | 60.0 |
| Total | 151 (100.0%) | 51.0 |
Fertility by Age by Marriage Status in Fergus Falls
70.9% of women with births (151) in Fergus Falls are married. The highest percentage of unmarried women with births falls into 35 to 50 years age bracket with 31.9% of them unmarried at the time of birth, while the lowest percentage of unmarried women with births belong to 20 to 34 years age bracket with 26.8% of them unmarried.
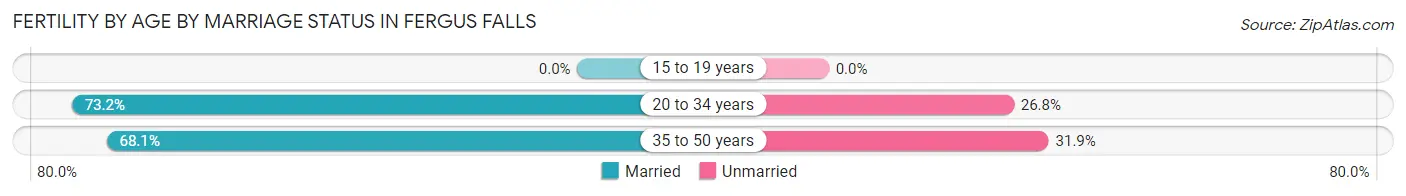
| Age Bracket | Married | Unmarried |
| 15 to 19 years | 0 (0.0%) | 0 (0.0%) |
| 20 to 34 years | 60 (73.2%) | 22 (26.8%) |
| 35 to 50 years | 47 (68.1%) | 22 (31.9%) |
| Total | 107 (70.9%) | 44 (29.1%) |
Fertility by Education in Fergus Falls
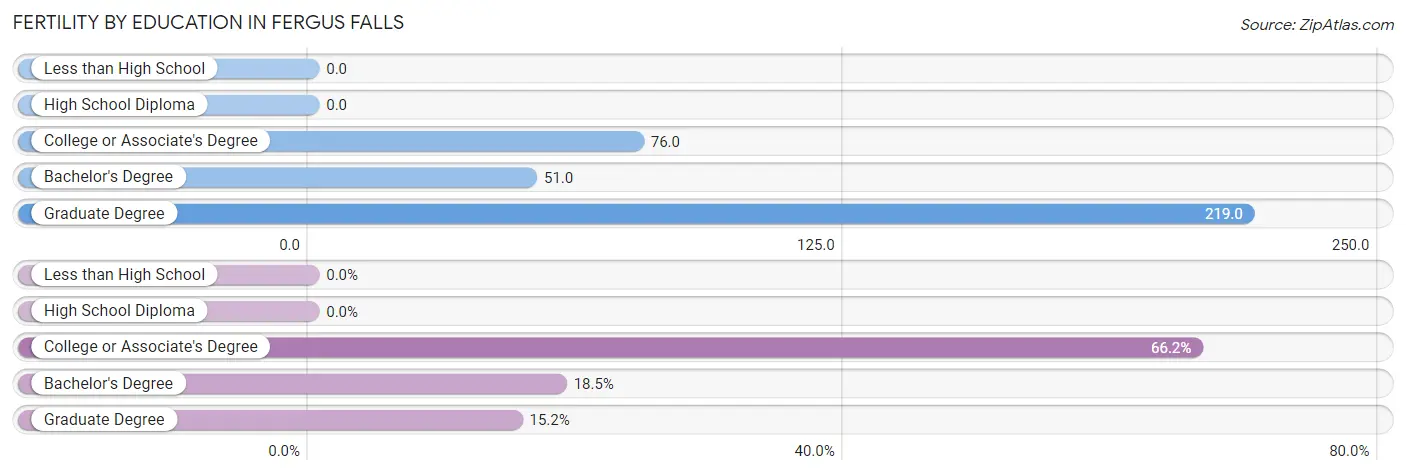
| Educational Attainment | Women with Births | Births / 1,000 Women |
| Less than High School | 0 (0.0%) | 0.0 |
| High School Diploma | 0 (0.0%) | 0.0 |
| College or Associate's Degree | 100 (66.2%) | 76.0 |
| Bachelor's Degree | 28 (18.5%) | 51.0 |
| Graduate Degree | 23 (15.2%) | 219.0 |
| Total | 151 (100.0%) | 51.0 |
Fertility by Education by Marriage Status in Fergus Falls
29.1% of women with births in Fergus Falls are unmarried. Women with the educational attainment of bachelor's degree are most likely to be married with 100.0% of them married at childbirth, while women with the educational attainment of college or associate's degree are least likely to be married with 44.0% of them unmarried at childbirth.
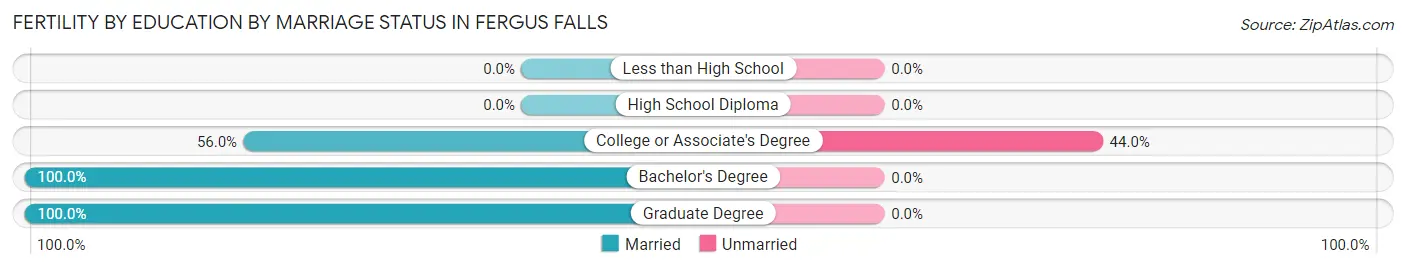
| Educational Attainment | Married | Unmarried |
| Less than High School | 0 (0.0%) | 0 (0.0%) |
| High School Diploma | 0 (0.0%) | 0 (0.0%) |
| College or Associate's Degree | 56 (56.0%) | 44 (44.0%) |
| Bachelor's Degree | 28 (100.0%) | 0 (0.0%) |
| Graduate Degree | 23 (100.0%) | 0 (0.0%) |
| Total | 107 (70.9%) | 44 (29.1%) |
Employment Characteristics in Fergus Falls
Employment by Class of Employer in Fergus Falls
Among the 6,523 employed individuals in Fergus Falls, private company employees (4,231 | 64.9%), not-for-profit organizations (807 | 12.4%), and local government employees (478 | 7.3%) make up the most common classes of employment.
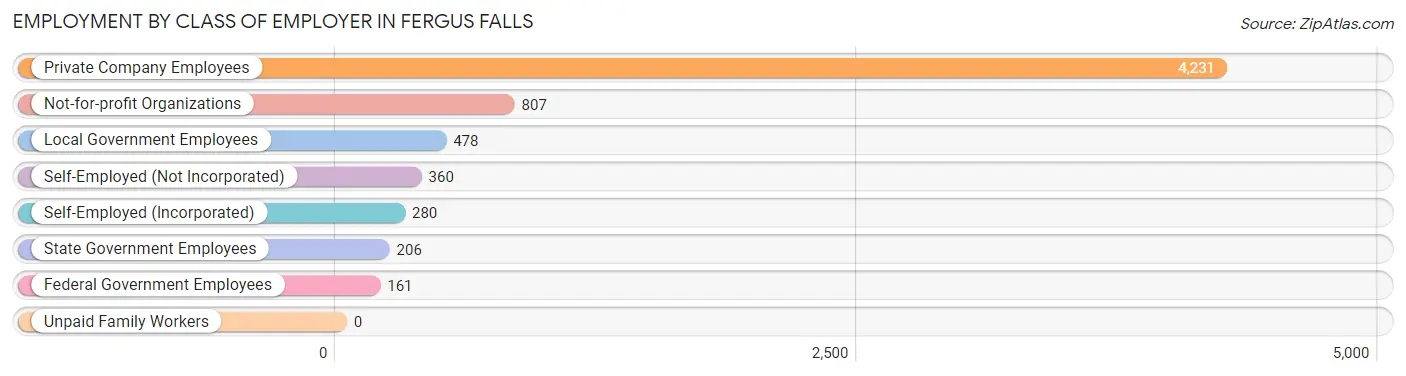
| Employer Class | # Employees | % Employees |
| Private Company Employees | 4,231 | 64.9% |
| Self-Employed (Incorporated) | 280 | 4.3% |
| Self-Employed (Not Incorporated) | 360 | 5.5% |
| Not-for-profit Organizations | 807 | 12.4% |
| Local Government Employees | 478 | 7.3% |
| State Government Employees | 206 | 3.2% |
| Federal Government Employees | 161 | 2.5% |
| Unpaid Family Workers | 0 | 0.0% |
| Total | 6,523 | 100.0% |
Employment Status by Age in Fergus Falls
According to the labor force statistics for Fergus Falls, out of the total population over 16 years of age (11,570), 60.9% or 7,046 individuals are in the labor force, with 6.9% or 486 of them unemployed. The age group with the highest labor force participation rate is 25 to 29 years, with 92.3% or 804 individuals in the labor force. Within the labor force, the 30 to 34 years age range has the highest percentage of unemployed individuals, with 21.7% or 150 of them being unemployed.
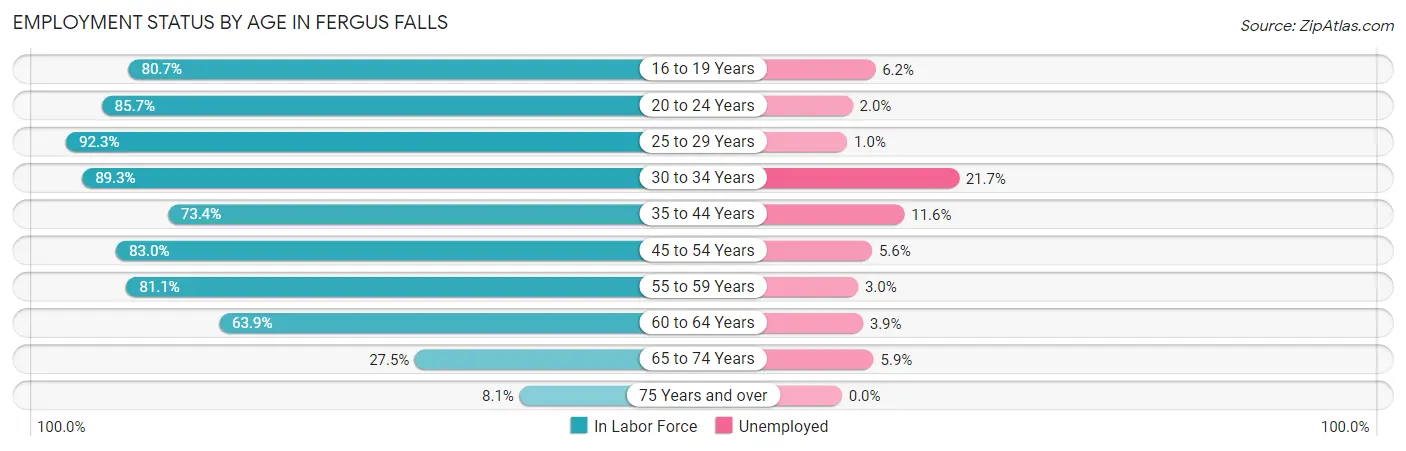
| Age Bracket | In Labor Force | Unemployed |
| 16 to 19 Years | 565 (80.7%) | 35 (6.2%) |
| 20 to 24 Years | 688 (85.7%) | 14 (2.0%) |
| 25 to 29 Years | 804 (92.3%) | 8 (1.0%) |
| 30 to 34 Years | 690 (89.3%) | 150 (21.7%) |
| 35 to 44 Years | 1,255 (73.4%) | 146 (11.6%) |
| 45 to 54 Years | 994 (83.0%) | 56 (5.6%) |
| 55 to 59 Years | 759 (81.1%) | 23 (3.0%) |
| 60 to 64 Years | 725 (63.9%) | 28 (3.9%) |
| 65 to 74 Years | 409 (27.5%) | 24 (5.9%) |
| 75 Years and over | 159 (8.1%) | 0 (0.0%) |
| Total | 7,046 (60.9%) | 486 (6.9%) |
Employment Status by Educational Attainment in Fergus Falls
According to labor force statistics for Fergus Falls, 78.9% of individuals (5,224) out of the total population between 25 and 64 years of age (6,621) are in the labor force, with 7.8% or 407 of them being unemployed. The group with the highest labor force participation rate are those with the educational attainment of bachelor's degree or higher, with 90.4% or 1,515 individuals in the labor force. Within the labor force, individuals with college / associate degree education have the highest percentage of unemployment, with 10.6% or 254 of them being unemployed.
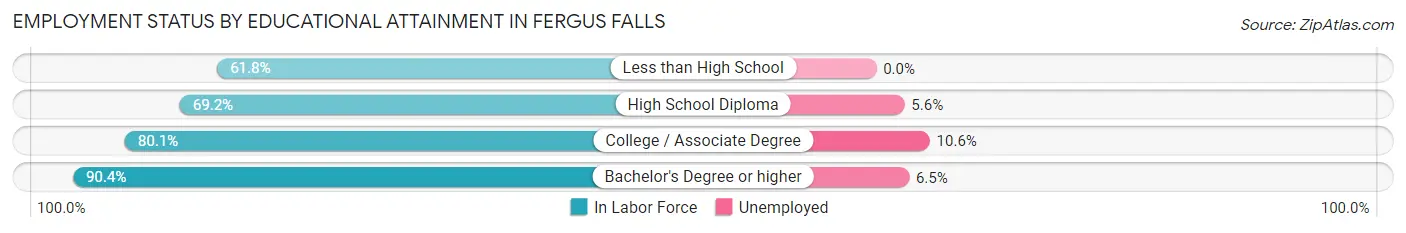
| Educational Attainment | In Labor Force | Unemployed |
| Less than High School | 303 (61.8%) | 0 (0.0%) |
| High School Diploma | 1,012 (69.2%) | 82 (5.6%) |
| College / Associate Degree | 2,397 (80.1%) | 317 (10.6%) |
| Bachelor's Degree or higher | 1,515 (90.4%) | 109 (6.5%) |
| Total | 5,224 (78.9%) | 516 (7.8%) |
Employment Occupations by Sex in Fergus Falls
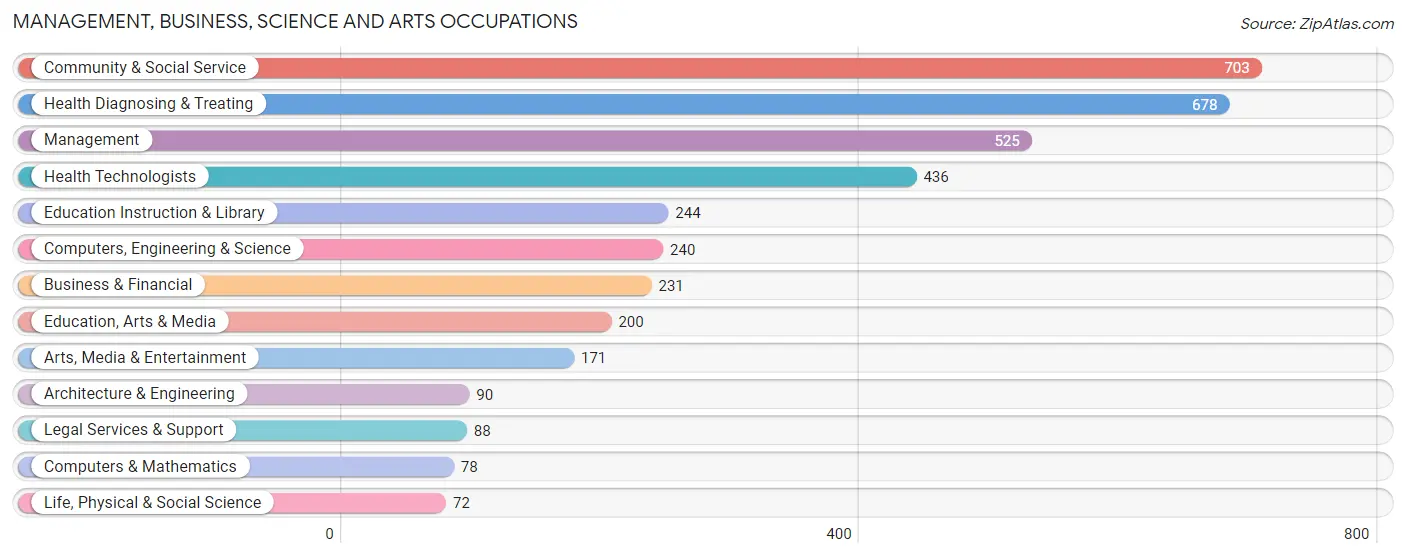
Management, Business, Science and Arts Occupations
The most common Management, Business, Science and Arts occupations in Fergus Falls are Community & Social Service (703 | 10.7%), Health Diagnosing & Treating (678 | 10.3%), Management (525 | 8.0%), Health Technologists (436 | 6.6%), and Education Instruction & Library (244 | 3.7%).
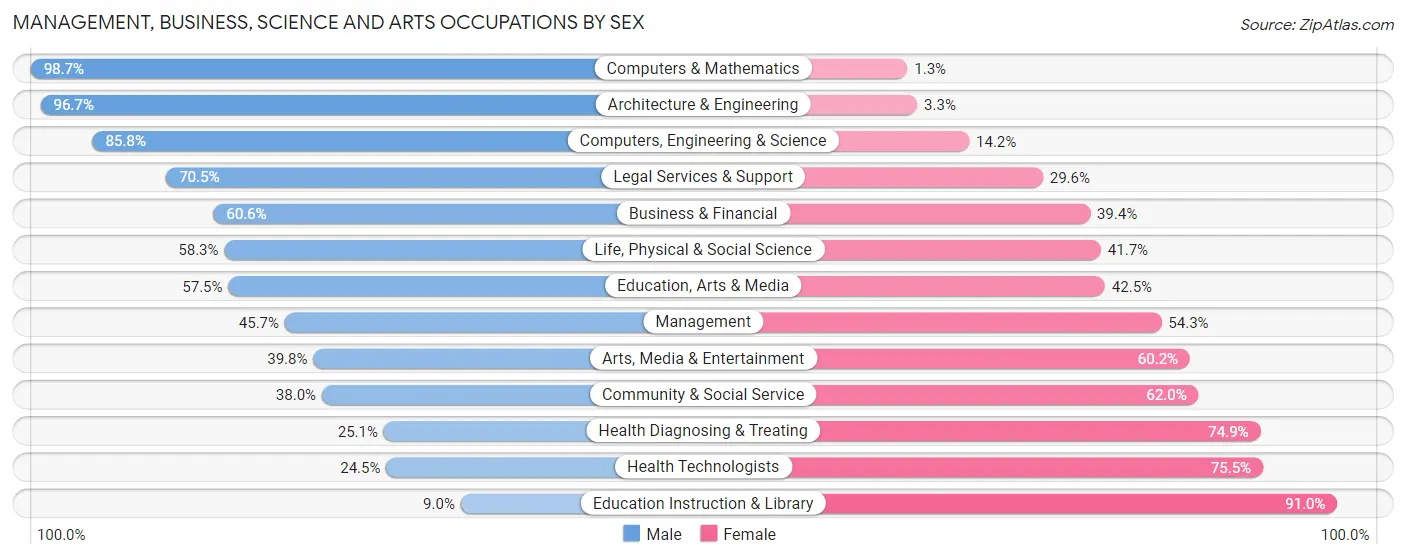
Management, Business, Science and Arts Occupations by Sex
Within the Management, Business, Science and Arts occupations in Fergus Falls, the most male-oriented occupations are Computers & Mathematics (98.7%), Architecture & Engineering (96.7%), and Computers, Engineering & Science (85.8%), while the most female-oriented occupations are Education Instruction & Library (91.0%), Health Technologists (75.5%), and Health Diagnosing & Treating (74.9%).
| Occupation | Male | Female |
| Management | 240 (45.7%) | 285 (54.3%) |
| Business & Financial | 140 (60.6%) | 91 (39.4%) |
| Computers, Engineering & Science | 206 (85.8%) | 34 (14.2%) |
| Computers & Mathematics | 77 (98.7%) | 1 (1.3%) |
| Architecture & Engineering | 87 (96.7%) | 3 (3.3%) |
| Life, Physical & Social Science | 42 (58.3%) | 30 (41.7%) |
| Community & Social Service | 267 (38.0%) | 436 (62.0%) |
| Education, Arts & Media | 115 (57.5%) | 85 (42.5%) |
| Legal Services & Support | 62 (70.5%) | 26 (29.5%) |
| Education Instruction & Library | 22 (9.0%) | 222 (91.0%) |
| Arts, Media & Entertainment | 68 (39.8%) | 103 (60.2%) |
| Health Diagnosing & Treating | 170 (25.1%) | 508 (74.9%) |
| Health Technologists | 107 (24.5%) | 329 (75.5%) |
| Total (Category) | 1,023 (43.0%) | 1,354 (57.0%) |
| Total (Overall) | 3,075 (46.8%) | 3,491 (53.2%) |
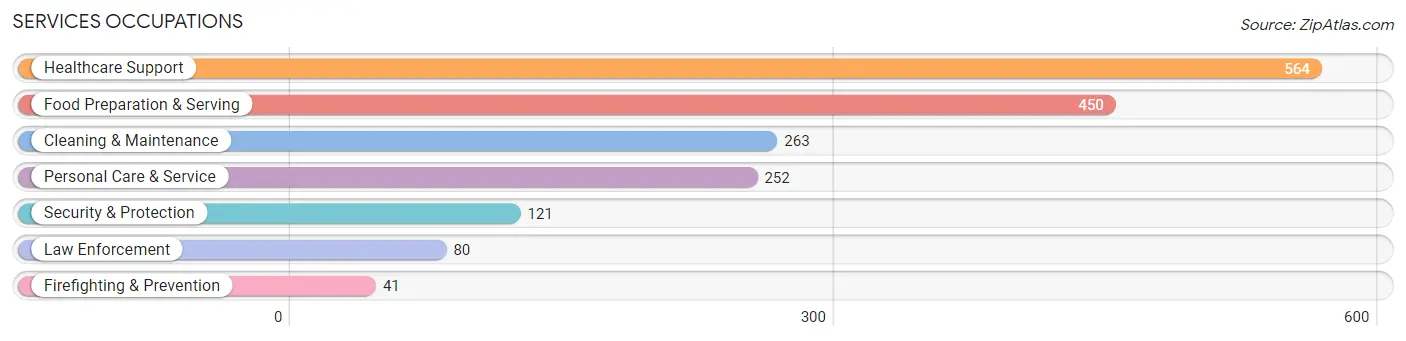
Services Occupations
The most common Services occupations in Fergus Falls are Healthcare Support (564 | 8.6%), Food Preparation & Serving (450 | 6.9%), Cleaning & Maintenance (263 | 4.0%), Personal Care & Service (252 | 3.8%), and Security & Protection (121 | 1.8%).
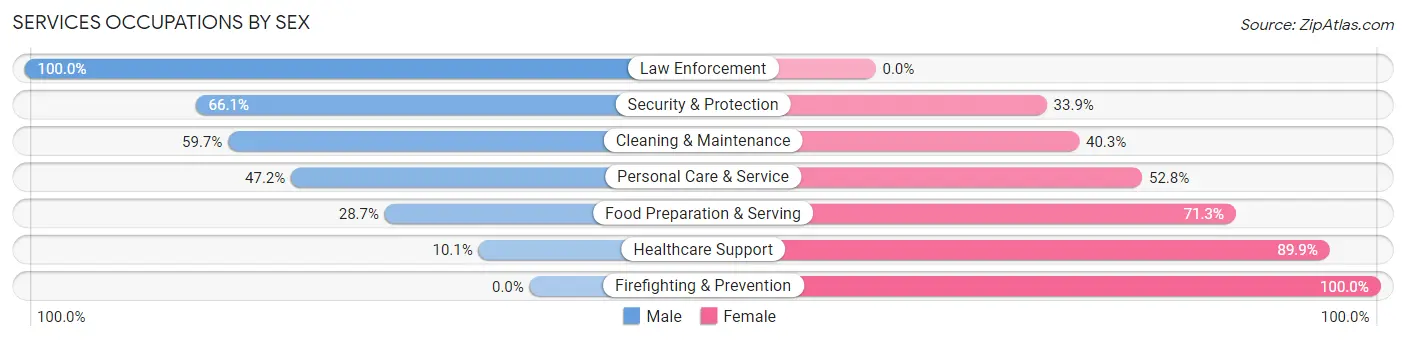
Services Occupations by Sex
Within the Services occupations in Fergus Falls, the most male-oriented occupations are Law Enforcement (100.0%), Security & Protection (66.1%), and Cleaning & Maintenance (59.7%), while the most female-oriented occupations are Firefighting & Prevention (100.0%), Healthcare Support (89.9%), and Food Preparation & Serving (71.3%).
| Occupation | Male | Female |
| Healthcare Support | 57 (10.1%) | 507 (89.9%) |
| Security & Protection | 80 (66.1%) | 41 (33.9%) |
| Firefighting & Prevention | 0 (0.0%) | 41 (100.0%) |
| Law Enforcement | 80 (100.0%) | 0 (0.0%) |
| Food Preparation & Serving | 129 (28.7%) | 321 (71.3%) |
| Cleaning & Maintenance | 157 (59.7%) | 106 (40.3%) |
| Personal Care & Service | 119 (47.2%) | 133 (52.8%) |
| Total (Category) | 542 (32.9%) | 1,108 (67.1%) |
| Total (Overall) | 3,075 (46.8%) | 3,491 (53.2%) |
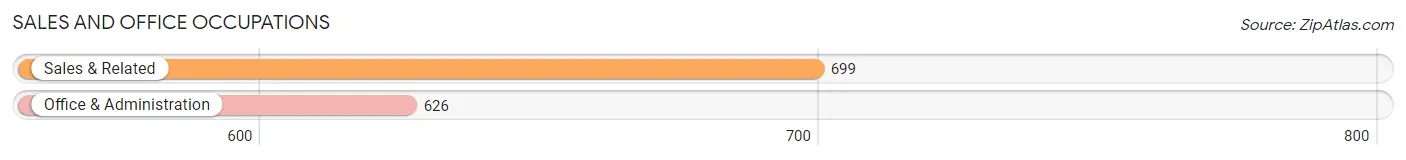
Sales and Office Occupations
The most common Sales and Office occupations in Fergus Falls are Sales & Related (699 | 10.6%), and Office & Administration (626 | 9.5%).
Sales and Office Occupations by Sex
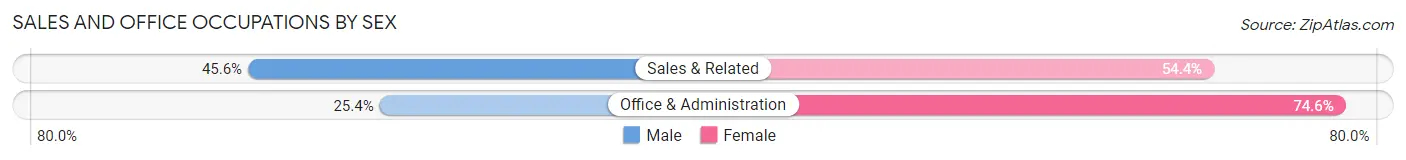
| Occupation | Male | Female |
| Sales & Related | 319 (45.6%) | 380 (54.4%) |
| Office & Administration | 159 (25.4%) | 467 (74.6%) |
| Total (Category) | 478 (36.1%) | 847 (63.9%) |
| Total (Overall) | 3,075 (46.8%) | 3,491 (53.2%) |
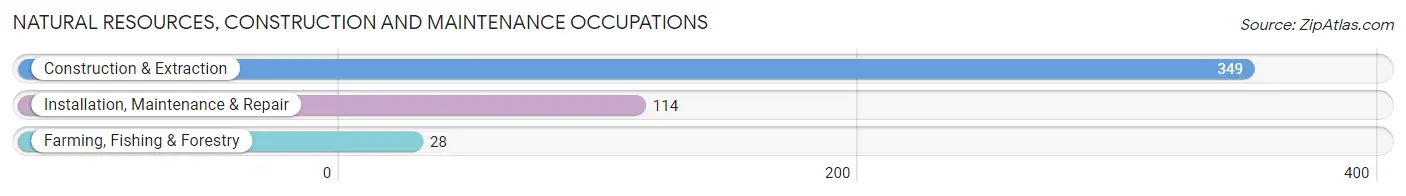
Natural Resources, Construction and Maintenance Occupations
The most common Natural Resources, Construction and Maintenance occupations in Fergus Falls are Construction & Extraction (349 | 5.3%), Installation, Maintenance & Repair (114 | 1.7%), and Farming, Fishing & Forestry (28 | 0.4%).
Natural Resources, Construction and Maintenance Occupations by Sex
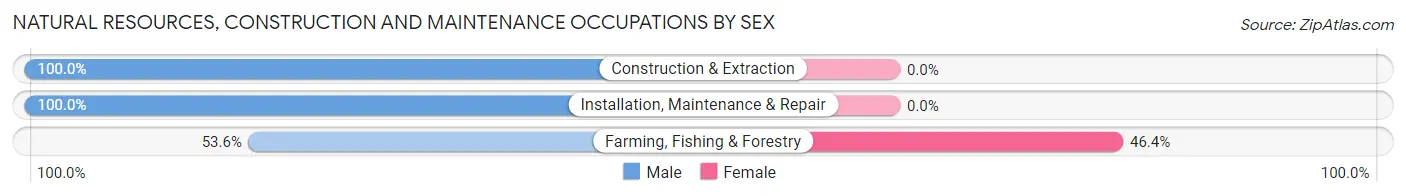
| Occupation | Male | Female |
| Farming, Fishing & Forestry | 15 (53.6%) | 13 (46.4%) |
| Construction & Extraction | 349 (100.0%) | 0 (0.0%) |
| Installation, Maintenance & Repair | 114 (100.0%) | 0 (0.0%) |
| Total (Category) | 478 (97.4%) | 13 (2.6%) |
| Total (Overall) | 3,075 (46.8%) | 3,491 (53.2%) |
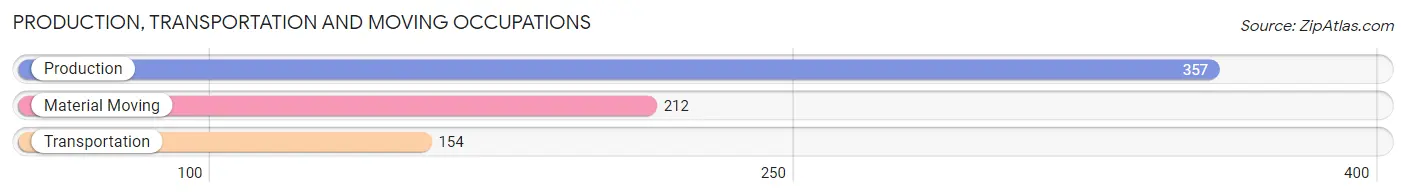
Production, Transportation and Moving Occupations
The most common Production, Transportation and Moving occupations in Fergus Falls are Production (357 | 5.4%), Material Moving (212 | 3.2%), and Transportation (154 | 2.4%).
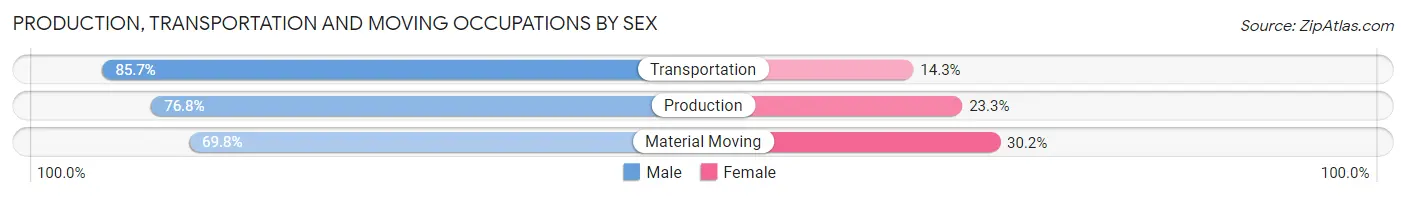
Production, Transportation and Moving Occupations by Sex
| Occupation | Male | Female |
| Production | 274 (76.7%) | 83 (23.3%) |
| Transportation | 132 (85.7%) | 22 (14.3%) |
| Material Moving | 148 (69.8%) | 64 (30.2%) |
| Total (Category) | 554 (76.6%) | 169 (23.4%) |
| Total (Overall) | 3,075 (46.8%) | 3,491 (53.2%) |
Employment Industries by Sex in Fergus Falls
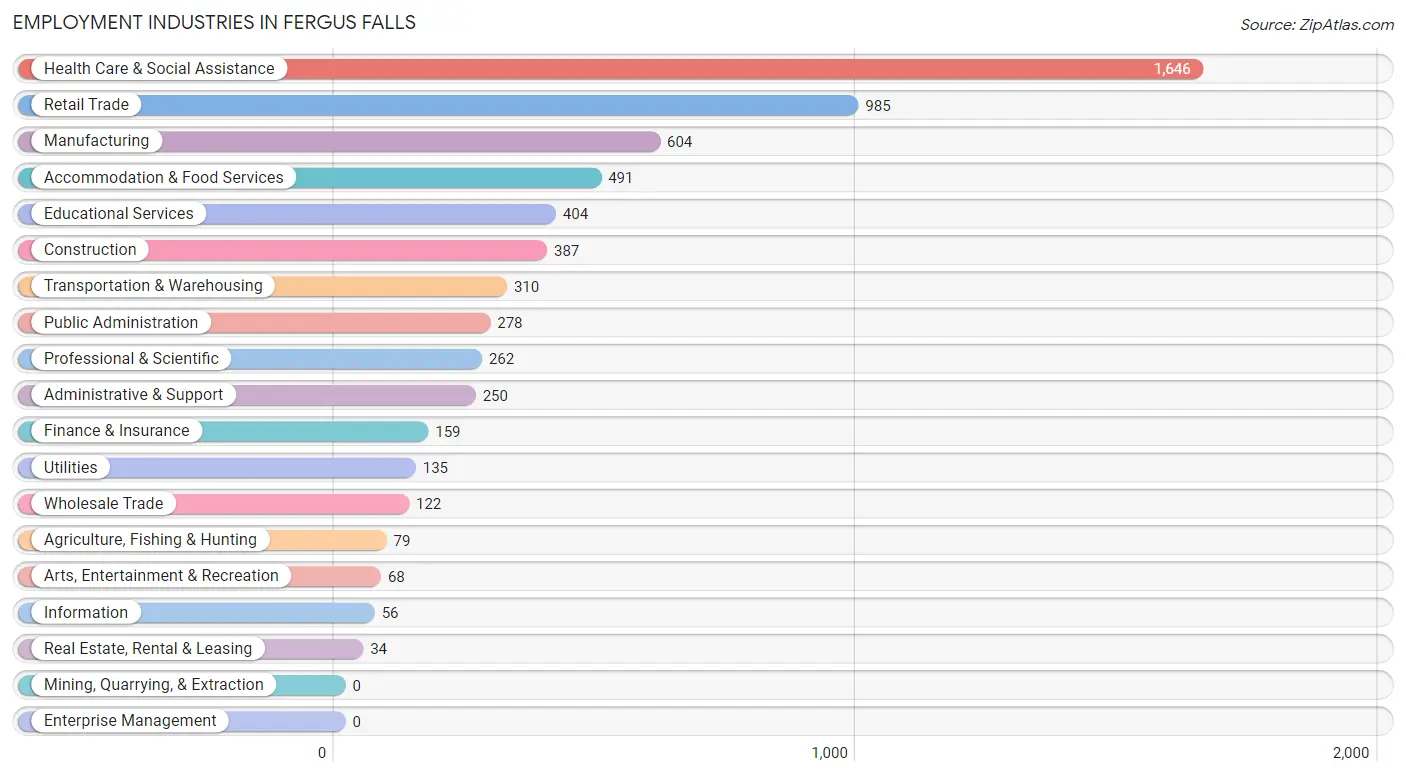
Employment Industries in Fergus Falls
The major employment industries in Fergus Falls include Health Care & Social Assistance (1,646 | 25.1%), Retail Trade (985 | 15.0%), Manufacturing (604 | 9.2%), Accommodation & Food Services (491 | 7.5%), and Educational Services (404 | 6.1%).
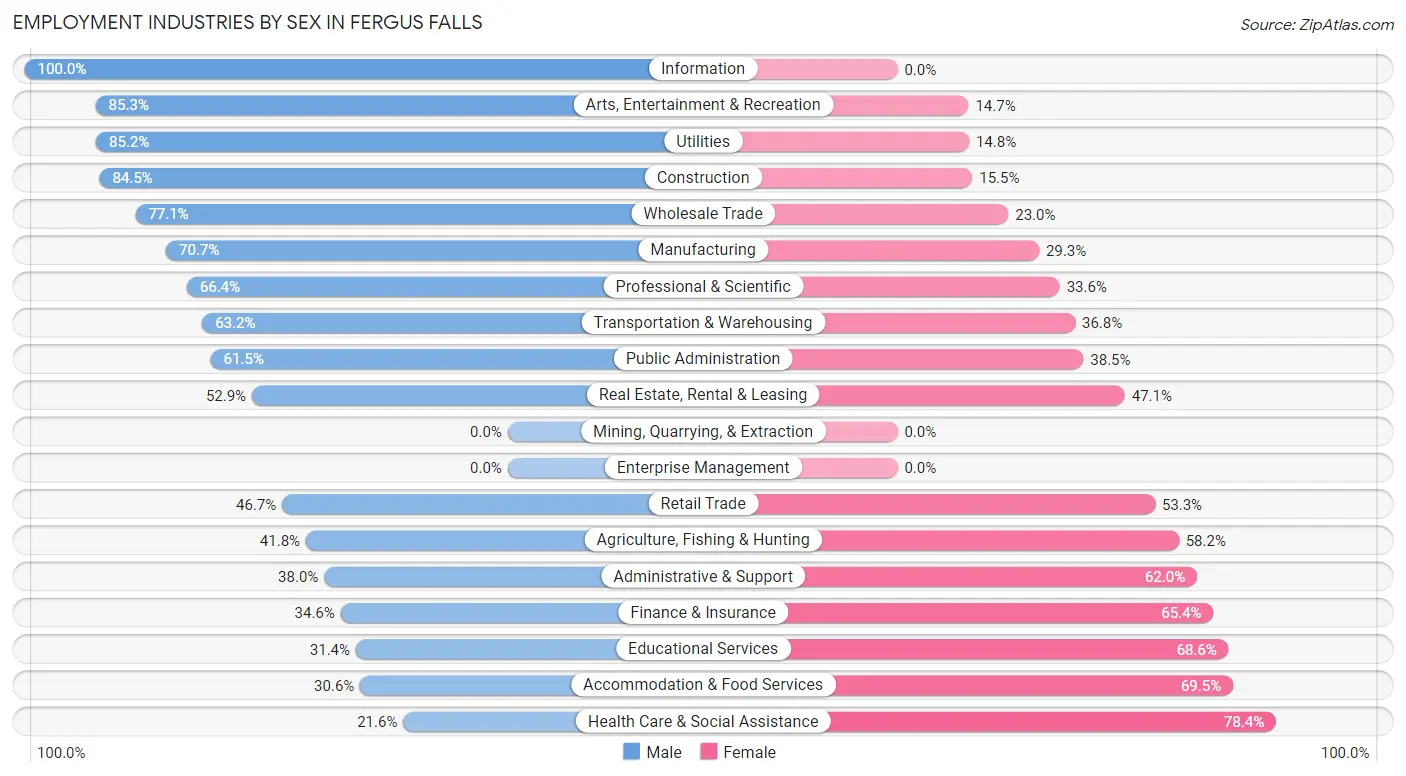
Employment Industries by Sex in Fergus Falls
The Fergus Falls industries that see more men than women are Information (100.0%), Arts, Entertainment & Recreation (85.3%), and Utilities (85.2%), whereas the industries that tend to have a higher number of women are Health Care & Social Assistance (78.4%), Accommodation & Food Services (69.5%), and Educational Services (68.6%).
| Industry | Male | Female |
| Agriculture, Fishing & Hunting | 33 (41.8%) | 46 (58.2%) |
| Mining, Quarrying, & Extraction | 0 (0.0%) | 0 (0.0%) |
| Construction | 327 (84.5%) | 60 (15.5%) |
| Manufacturing | 427 (70.7%) | 177 (29.3%) |
| Wholesale Trade | 94 (77.0%) | 28 (23.0%) |
| Retail Trade | 460 (46.7%) | 525 (53.3%) |
| Transportation & Warehousing | 196 (63.2%) | 114 (36.8%) |
| Utilities | 115 (85.2%) | 20 (14.8%) |
| Information | 56 (100.0%) | 0 (0.0%) |
| Finance & Insurance | 55 (34.6%) | 104 (65.4%) |
| Real Estate, Rental & Leasing | 18 (52.9%) | 16 (47.1%) |
| Professional & Scientific | 174 (66.4%) | 88 (33.6%) |
| Enterprise Management | 0 (0.0%) | 0 (0.0%) |
| Administrative & Support | 95 (38.0%) | 155 (62.0%) |
| Educational Services | 127 (31.4%) | 277 (68.6%) |
| Health Care & Social Assistance | 356 (21.6%) | 1,290 (78.4%) |
| Arts, Entertainment & Recreation | 58 (85.3%) | 10 (14.7%) |
| Accommodation & Food Services | 150 (30.5%) | 341 (69.5%) |
| Public Administration | 171 (61.5%) | 107 (38.5%) |
| Total | 3,075 (46.8%) | 3,491 (53.2%) |
Education in Fergus Falls
School Enrollment in Fergus Falls
The most common levels of schooling among the 2,717 students in Fergus Falls are elementary school (723 | 26.6%), middle school (565 | 20.8%), and high school (498 | 18.3%).
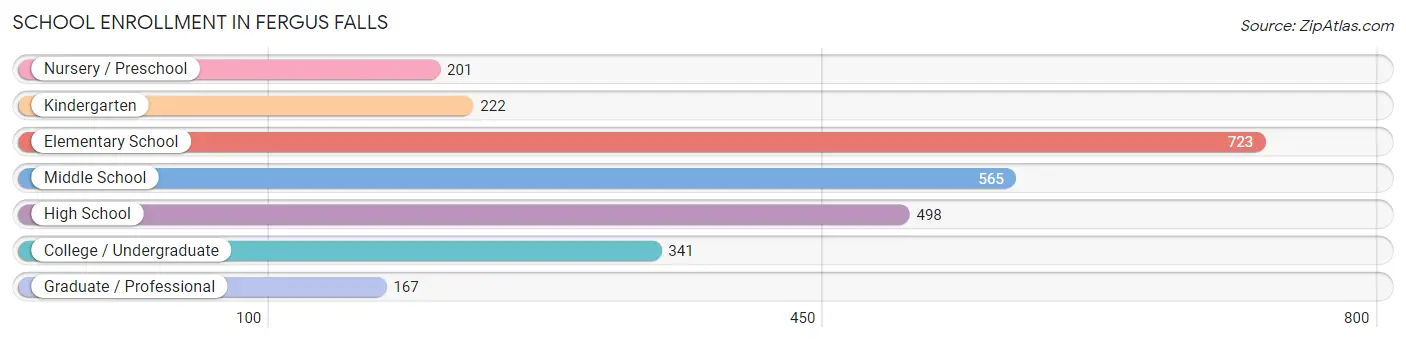
| School Level | # Students | % Students |
| Nursery / Preschool | 201 | 7.4% |
| Kindergarten | 222 | 8.2% |
| Elementary School | 723 | 26.6% |
| Middle School | 565 | 20.8% |
| High School | 498 | 18.3% |
| College / Undergraduate | 341 | 12.6% |
| Graduate / Professional | 167 | 6.1% |
| Total | 2,717 | 100.0% |
School Enrollment by Age by Funding Source in Fergus Falls
Out of a total of 2,717 students who are enrolled in schools in Fergus Falls, 617 (22.7%) attend a private institution, while the remaining 2,100 (77.3%) are enrolled in public schools. The age group of 3 to 4 year olds has the highest likelihood of being enrolled in private schools, with 75 (90.4% in the age bracket) enrolled. Conversely, the age group of 25 to 34 year olds has the lowest likelihood of being enrolled in a private school, with 85 (100.0% in the age bracket) attending a public institution.
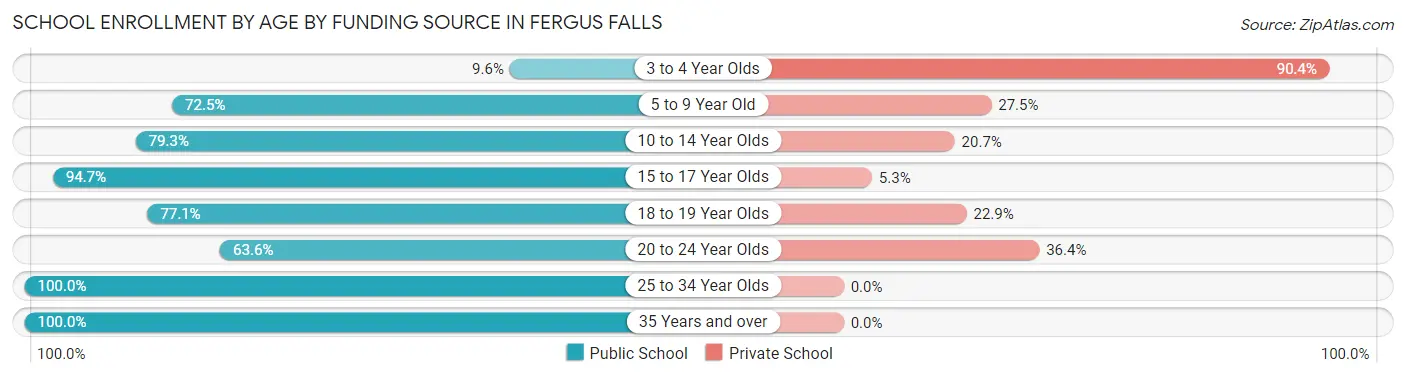
| Age Bracket | Public School | Private School |
| 3 to 4 Year Olds | 8 (9.6%) | 75 (90.4%) |
| 5 to 9 Year Old | 720 (72.5%) | 273 (27.5%) |
| 10 to 14 Year Olds | 518 (79.3%) | 135 (20.7%) |
| 15 to 17 Year Olds | 378 (94.7%) | 21 (5.3%) |
| 18 to 19 Year Olds | 209 (77.1%) | 62 (22.9%) |
| 20 to 24 Year Olds | 89 (63.6%) | 51 (36.4%) |
| 25 to 34 Year Olds | 85 (100.0%) | 0 (0.0%) |
| 35 Years and over | 93 (100.0%) | 0 (0.0%) |
| Total | 2,100 (77.3%) | 617 (22.7%) |
Educational Attainment by Field of Study in Fergus Falls
Education (650 | 22.7%), science & technology (602 | 21.1%), business (437 | 15.3%), arts & humanities (269 | 9.4%), and visual & performing arts (135 | 4.7%) are the most common fields of study among 2,858 individuals in Fergus Falls who have obtained a bachelor's degree or higher.
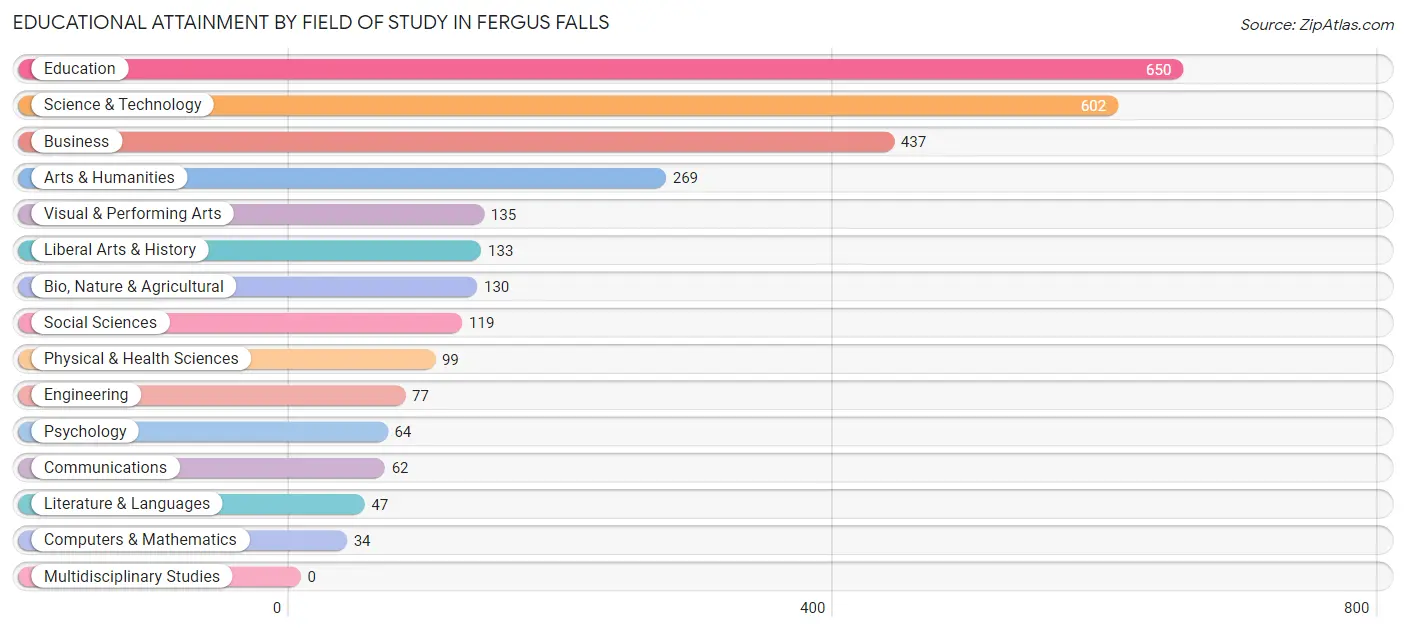
| Field of Study | # Graduates | % Graduates |
| Computers & Mathematics | 34 | 1.2% |
| Bio, Nature & Agricultural | 130 | 4.5% |
| Physical & Health Sciences | 99 | 3.5% |
| Psychology | 64 | 2.2% |
| Social Sciences | 119 | 4.2% |
| Engineering | 77 | 2.7% |
| Multidisciplinary Studies | 0 | 0.0% |
| Science & Technology | 602 | 21.1% |
| Business | 437 | 15.3% |
| Education | 650 | 22.7% |
| Literature & Languages | 47 | 1.6% |
| Liberal Arts & History | 133 | 4.6% |
| Visual & Performing Arts | 135 | 4.7% |
| Communications | 62 | 2.2% |
| Arts & Humanities | 269 | 9.4% |
| Total | 2,858 | 100.0% |
Transportation & Commute in Fergus Falls
Vehicle Availability by Sex in Fergus Falls
The most prevalent vehicle ownership categories in Fergus Falls are males with 2 vehicles (1,196, accounting for 40.0%) and females with 2 vehicles (1,399, making up 35.5%).
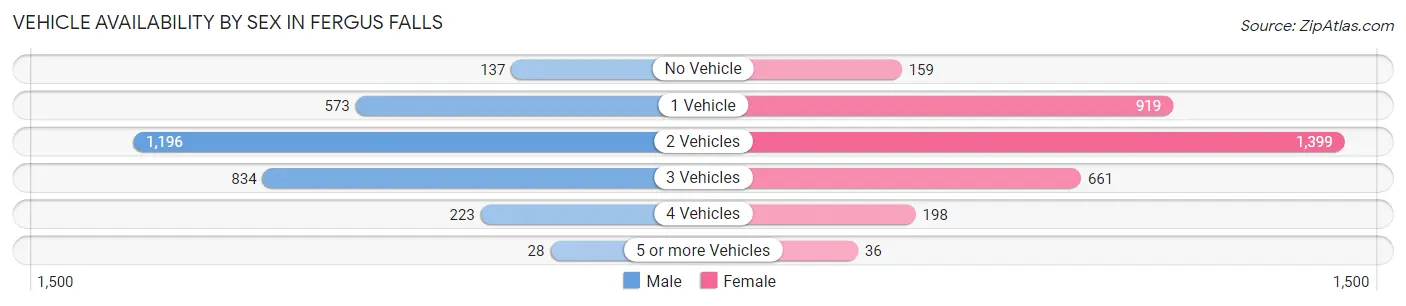
| Vehicles Available | Male | Female |
| No Vehicle | 137 (4.6%) | 159 (4.7%) |
| 1 Vehicle | 573 (19.2%) | 919 (27.3%) |
| 2 Vehicles | 1,196 (40.0%) | 1,399 (41.5%) |
| 3 Vehicles | 834 (27.9%) | 661 (19.6%) |
| 4 Vehicles | 223 (7.5%) | 198 (5.9%) |
| 5 or more Vehicles | 28 (0.9%) | 36 (1.1%) |
| Total | 2,991 (100.0%) | 3,372 (100.0%) |
Commute Time in Fergus Falls
The most frequently occuring commute durations in Fergus Falls are 5 to 9 minutes (2,190 commuters, 37.2%), 10 to 14 minutes (1,631 commuters, 27.7%), and less than 5 minutes (636 commuters, 10.8%).
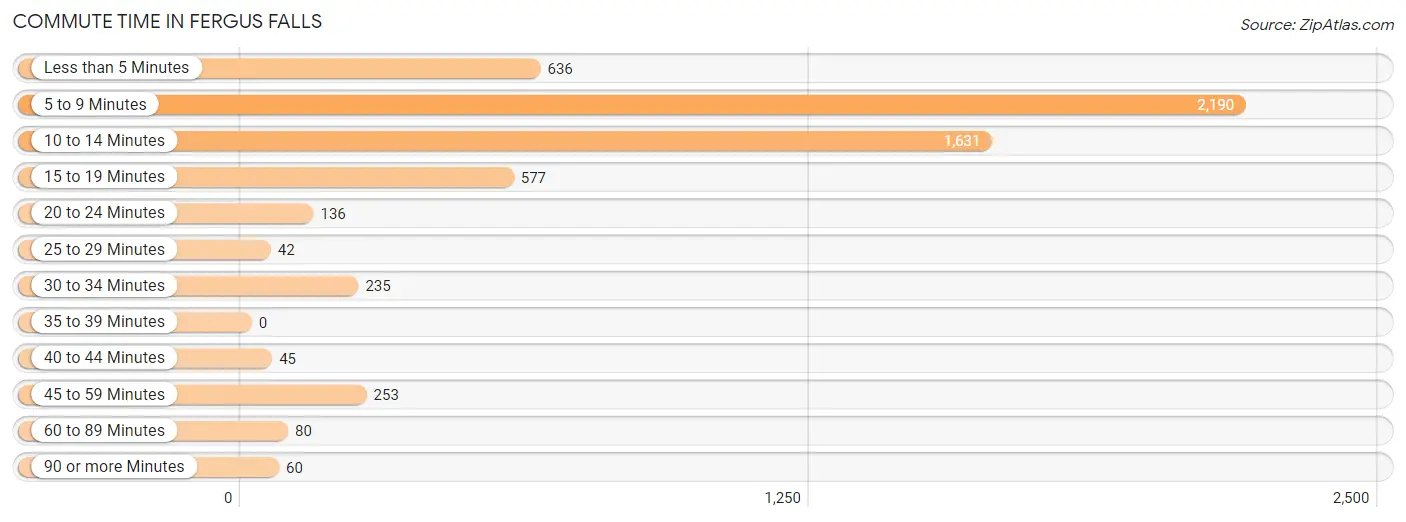
| Commute Time | # Commuters | % Commuters |
| Less than 5 Minutes | 636 | 10.8% |
| 5 to 9 Minutes | 2,190 | 37.2% |
| 10 to 14 Minutes | 1,631 | 27.7% |
| 15 to 19 Minutes | 577 | 9.8% |
| 20 to 24 Minutes | 136 | 2.3% |
| 25 to 29 Minutes | 42 | 0.7% |
| 30 to 34 Minutes | 235 | 4.0% |
| 35 to 39 Minutes | 0 | 0.0% |
| 40 to 44 Minutes | 45 | 0.8% |
| 45 to 59 Minutes | 253 | 4.3% |
| 60 to 89 Minutes | 80 | 1.4% |
| 90 or more Minutes | 60 | 1.0% |
Commute Time by Sex in Fergus Falls
The most common commute times in Fergus Falls are 5 to 9 minutes (953 commuters, 33.5%) for males and 5 to 9 minutes (1,237 commuters, 40.6%) for females.
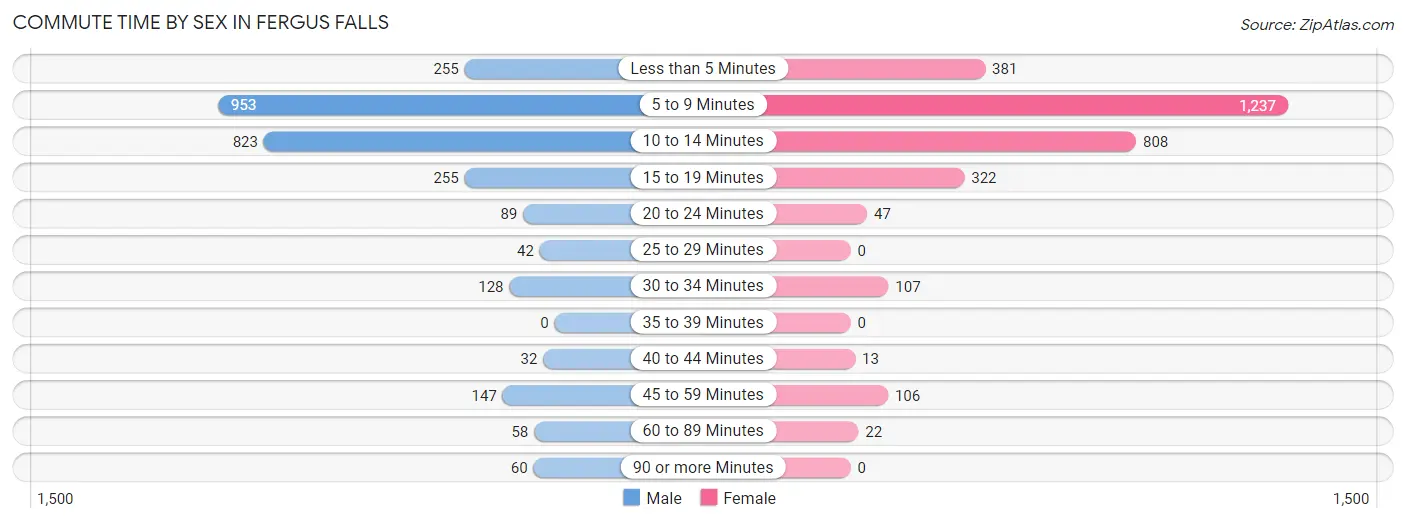
| Commute Time | Male | Female |
| Less than 5 Minutes | 255 (9.0%) | 381 (12.5%) |
| 5 to 9 Minutes | 953 (33.5%) | 1,237 (40.6%) |
| 10 to 14 Minutes | 823 (29.0%) | 808 (26.6%) |
| 15 to 19 Minutes | 255 (9.0%) | 322 (10.6%) |
| 20 to 24 Minutes | 89 (3.1%) | 47 (1.5%) |
| 25 to 29 Minutes | 42 (1.5%) | 0 (0.0%) |
| 30 to 34 Minutes | 128 (4.5%) | 107 (3.5%) |
| 35 to 39 Minutes | 0 (0.0%) | 0 (0.0%) |
| 40 to 44 Minutes | 32 (1.1%) | 13 (0.4%) |
| 45 to 59 Minutes | 147 (5.2%) | 106 (3.5%) |
| 60 to 89 Minutes | 58 (2.0%) | 22 (0.7%) |
| 90 or more Minutes | 60 (2.1%) | 0 (0.0%) |
Time of Departure to Work by Sex in Fergus Falls
The most frequent times of departure to work in Fergus Falls are 6:00 AM to 6:29 AM (417, 14.7%) for males and 7:30 AM to 7:59 AM (609, 20.0%) for females.
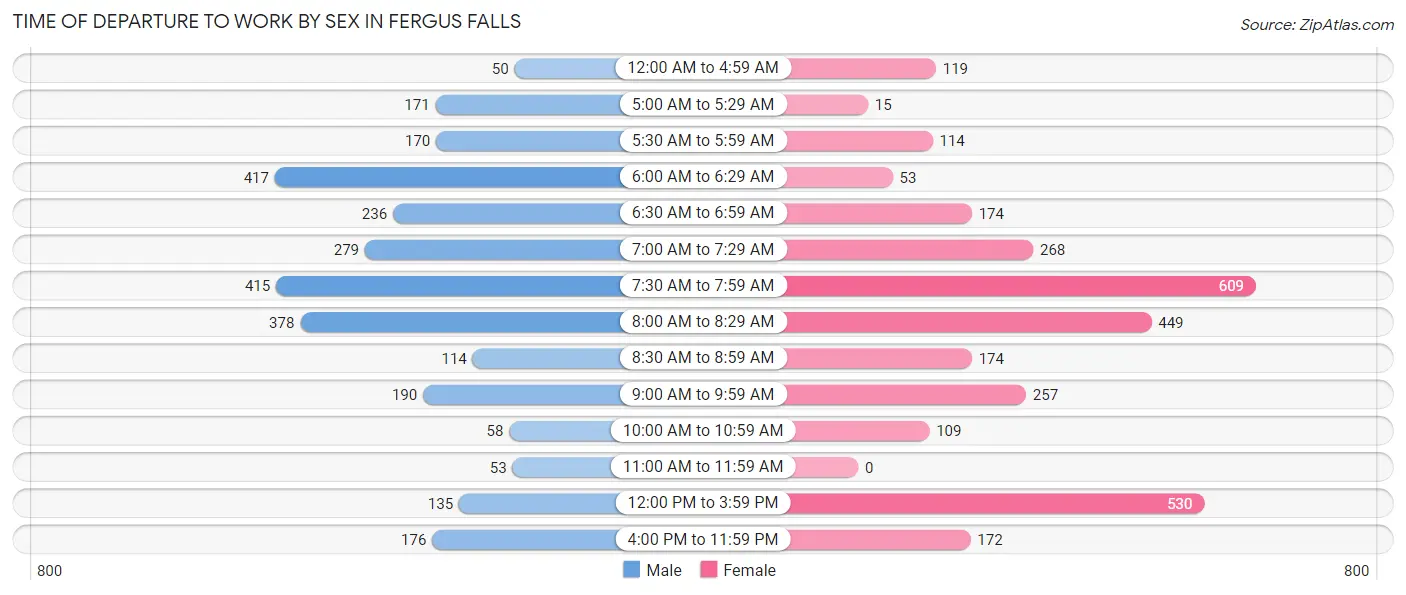
| Time of Departure | Male | Female |
| 12:00 AM to 4:59 AM | 50 (1.8%) | 119 (3.9%) |
| 5:00 AM to 5:29 AM | 171 (6.0%) | 15 (0.5%) |
| 5:30 AM to 5:59 AM | 170 (6.0%) | 114 (3.7%) |
| 6:00 AM to 6:29 AM | 417 (14.7%) | 53 (1.7%) |
| 6:30 AM to 6:59 AM | 236 (8.3%) | 174 (5.7%) |
| 7:00 AM to 7:29 AM | 279 (9.8%) | 268 (8.8%) |
| 7:30 AM to 7:59 AM | 415 (14.6%) | 609 (20.0%) |
| 8:00 AM to 8:29 AM | 378 (13.3%) | 449 (14.8%) |
| 8:30 AM to 8:59 AM | 114 (4.0%) | 174 (5.7%) |
| 9:00 AM to 9:59 AM | 190 (6.7%) | 257 (8.5%) |
| 10:00 AM to 10:59 AM | 58 (2.0%) | 109 (3.6%) |
| 11:00 AM to 11:59 AM | 53 (1.9%) | 0 (0.0%) |
| 12:00 PM to 3:59 PM | 135 (4.8%) | 530 (17.4%) |
| 4:00 PM to 11:59 PM | 176 (6.2%) | 172 (5.7%) |
| Total | 2,842 (100.0%) | 3,043 (100.0%) |
Housing Occupancy in Fergus Falls
Occupancy by Ownership in Fergus Falls
Of the total 6,403 dwellings in Fergus Falls, owner-occupied units account for 4,148 (64.8%), while renter-occupied units make up 2,255 (35.2%).
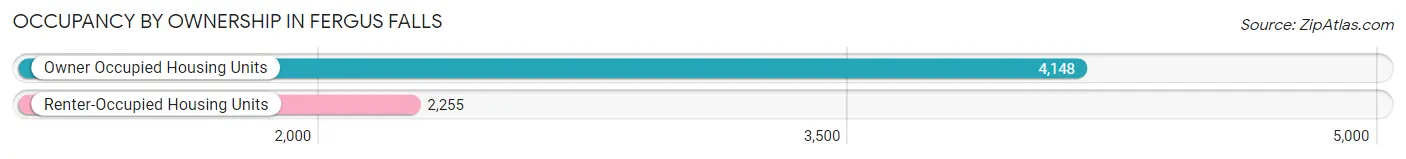
| Occupancy | # Housing Units | % Housing Units |
| Owner Occupied Housing Units | 4,148 | 64.8% |
| Renter-Occupied Housing Units | 2,255 | 35.2% |
| Total Occupied Housing Units | 6,403 | 100.0% |
Occupancy by Household Size in Fergus Falls
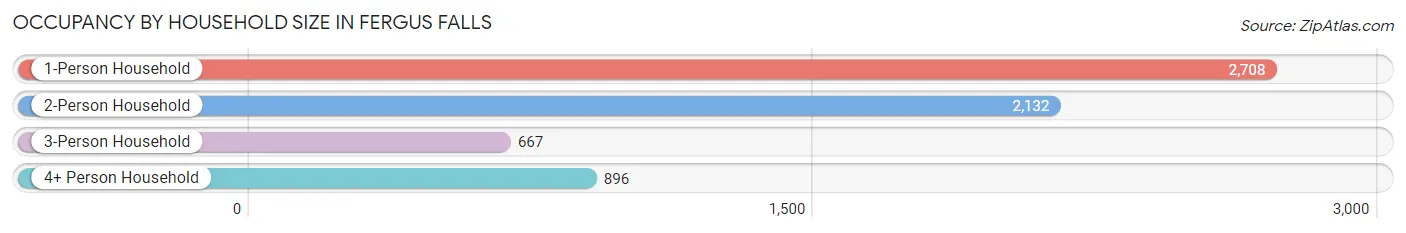
| Household Size | # Housing Units | % Housing Units |
| 1-Person Household | 2,708 | 42.3% |
| 2-Person Household | 2,132 | 33.3% |
| 3-Person Household | 667 | 10.4% |
| 4+ Person Household | 896 | 14.0% |
| Total Housing Units | 6,403 | 100.0% |
Occupancy by Ownership by Household Size in Fergus Falls
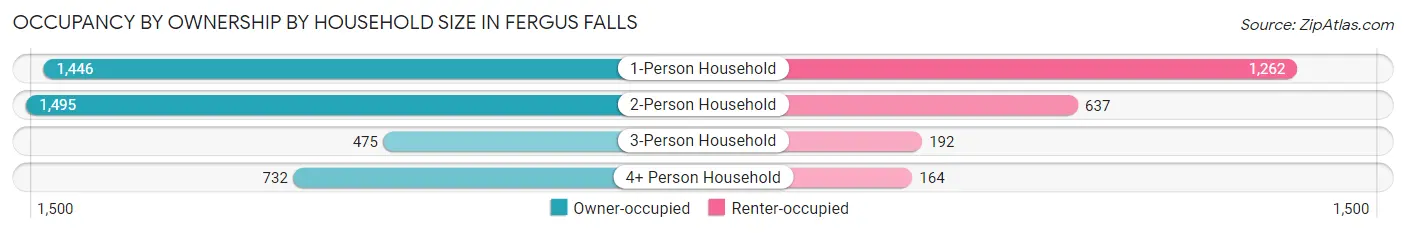
| Household Size | Owner-occupied | Renter-occupied |
| 1-Person Household | 1,446 (53.4%) | 1,262 (46.6%) |
| 2-Person Household | 1,495 (70.1%) | 637 (29.9%) |
| 3-Person Household | 475 (71.2%) | 192 (28.8%) |
| 4+ Person Household | 732 (81.7%) | 164 (18.3%) |
| Total Housing Units | 4,148 (64.8%) | 2,255 (35.2%) |
Occupancy by Educational Attainment in Fergus Falls
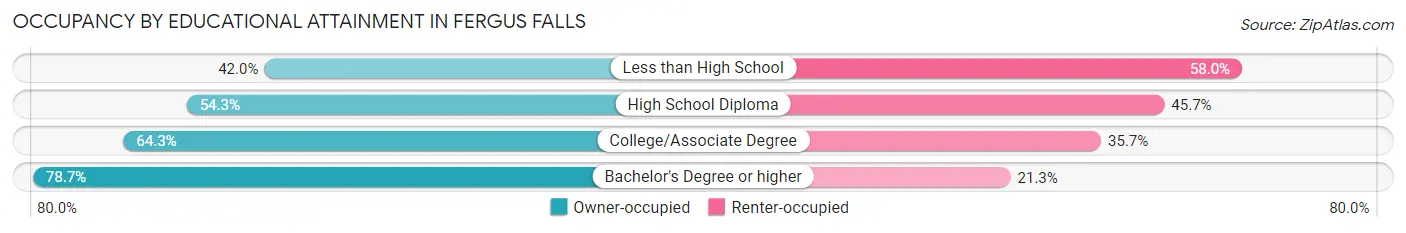
| Household Size | Owner-occupied | Renter-occupied |
| Less than High School | 139 (42.0%) | 192 (58.0%) |
| High School Diploma | 716 (54.3%) | 603 (45.7%) |
| College/Associate Degree | 2,001 (64.3%) | 1,110 (35.7%) |
| Bachelor's Degree or higher | 1,292 (78.7%) | 350 (21.3%) |
Occupancy by Age of Householder in Fergus Falls
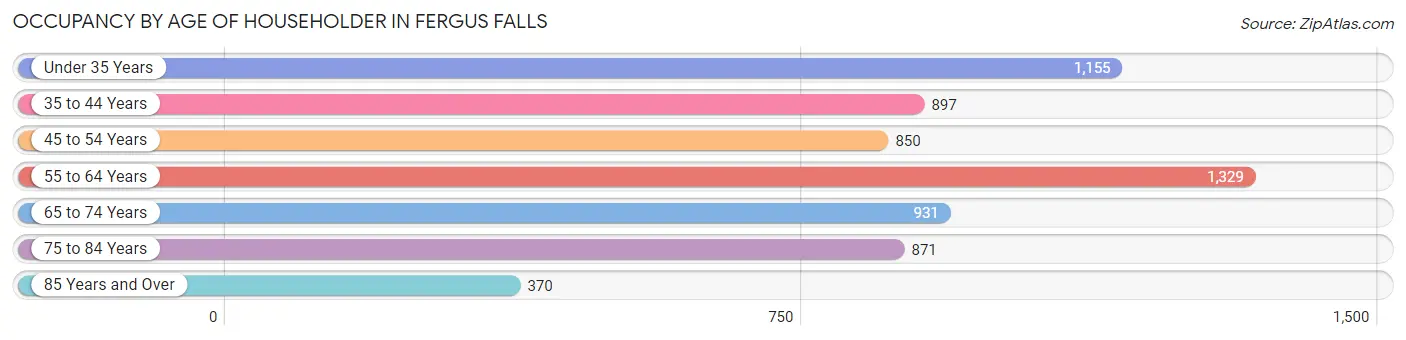
| Age Bracket | # Households | % Households |
| Under 35 Years | 1,155 | 18.0% |
| 35 to 44 Years | 897 | 14.0% |
| 45 to 54 Years | 850 | 13.3% |
| 55 to 64 Years | 1,329 | 20.8% |
| 65 to 74 Years | 931 | 14.5% |
| 75 to 84 Years | 871 | 13.6% |
| 85 Years and Over | 370 | 5.8% |
| Total | 6,403 | 100.0% |
Housing Finances in Fergus Falls
Median Income by Occupancy in Fergus Falls
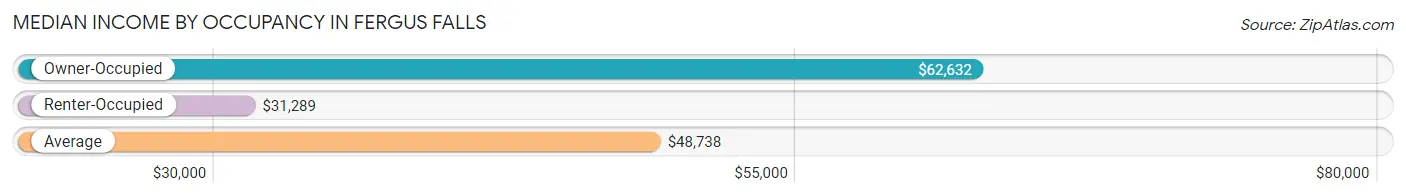
| Occupancy Type | # Households | Median Income |
| Owner-Occupied | 4,148 (64.8%) | $62,632 |
| Renter-Occupied | 2,255 (35.2%) | $31,289 |
| Average | 6,403 (100.0%) | $48,738 |
Occupancy by Householder Income Bracket in Fergus Falls
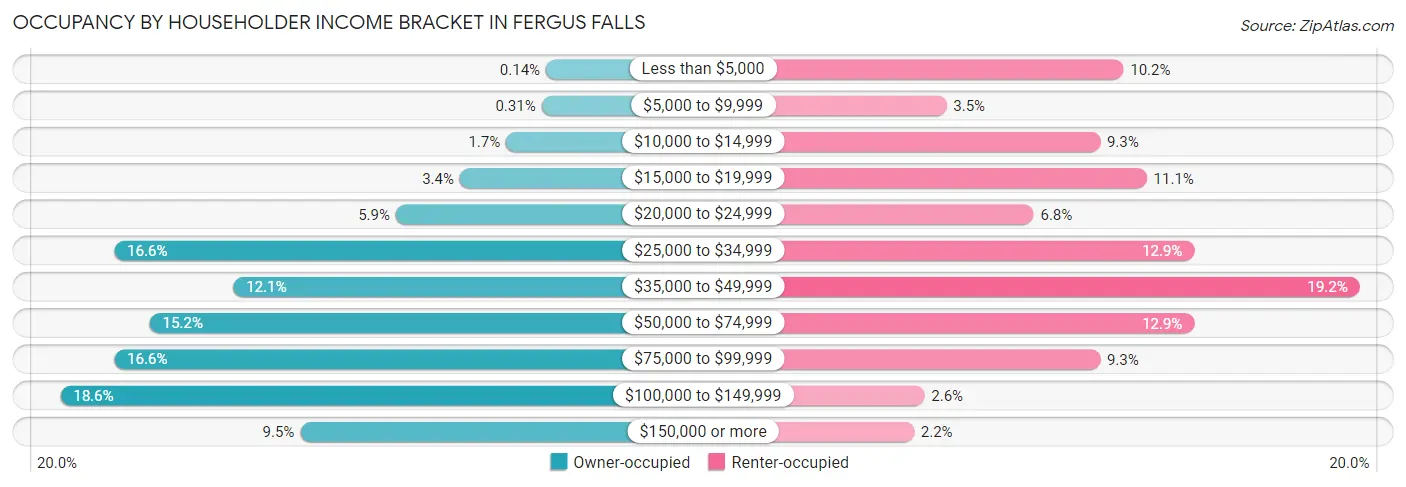
| Income Bracket | Owner-occupied | Renter-occupied |
| Less than $5,000 | 6 (0.1%) | 230 (10.2%) |
| $5,000 to $9,999 | 13 (0.3%) | 78 (3.5%) |
| $10,000 to $14,999 | 69 (1.7%) | 210 (9.3%) |
| $15,000 to $19,999 | 142 (3.4%) | 250 (11.1%) |
| $20,000 to $24,999 | 243 (5.9%) | 153 (6.8%) |
| $25,000 to $34,999 | 688 (16.6%) | 291 (12.9%) |
| $35,000 to $49,999 | 500 (12.0%) | 433 (19.2%) |
| $50,000 to $74,999 | 632 (15.2%) | 291 (12.9%) |
| $75,000 to $99,999 | 688 (16.6%) | 210 (9.3%) |
| $100,000 to $149,999 | 773 (18.6%) | 59 (2.6%) |
| $150,000 or more | 394 (9.5%) | 50 (2.2%) |
| Total | 4,148 (100.0%) | 2,255 (100.0%) |
Monthly Housing Cost Tiers in Fergus Falls
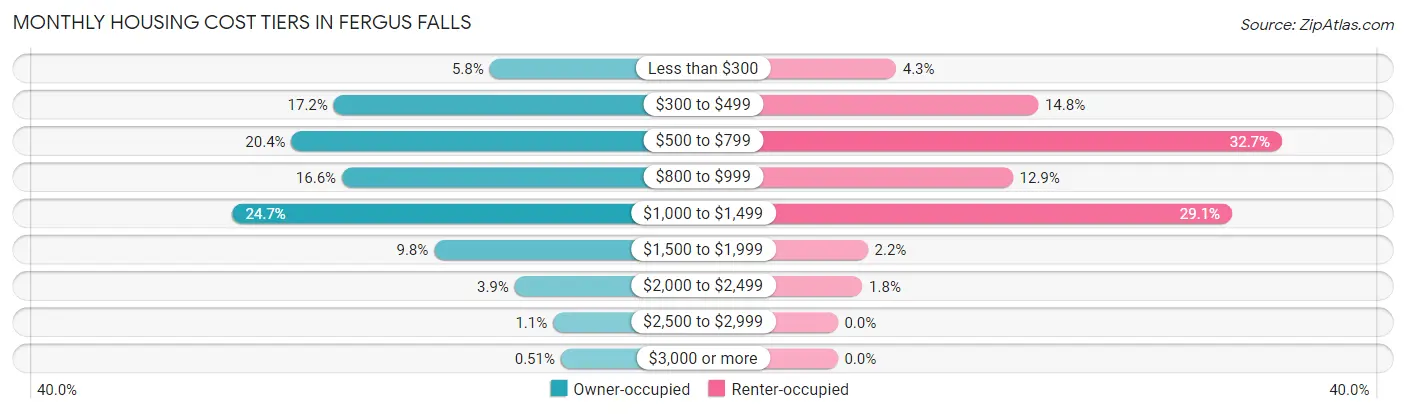
| Monthly Cost | Owner-occupied | Renter-occupied |
| Less than $300 | 239 (5.8%) | 97 (4.3%) |
| $300 to $499 | 715 (17.2%) | 333 (14.8%) |
| $500 to $799 | 844 (20.3%) | 738 (32.7%) |
| $800 to $999 | 690 (16.6%) | 291 (12.9%) |
| $1,000 to $1,499 | 1,024 (24.7%) | 655 (29.0%) |
| $1,500 to $1,999 | 408 (9.8%) | 50 (2.2%) |
| $2,000 to $2,499 | 162 (3.9%) | 41 (1.8%) |
| $2,500 to $2,999 | 45 (1.1%) | 0 (0.0%) |
| $3,000 or more | 21 (0.5%) | 0 (0.0%) |
| Total | 4,148 (100.0%) | 2,255 (100.0%) |
Physical Housing Characteristics in Fergus Falls
Housing Structures in Fergus Falls
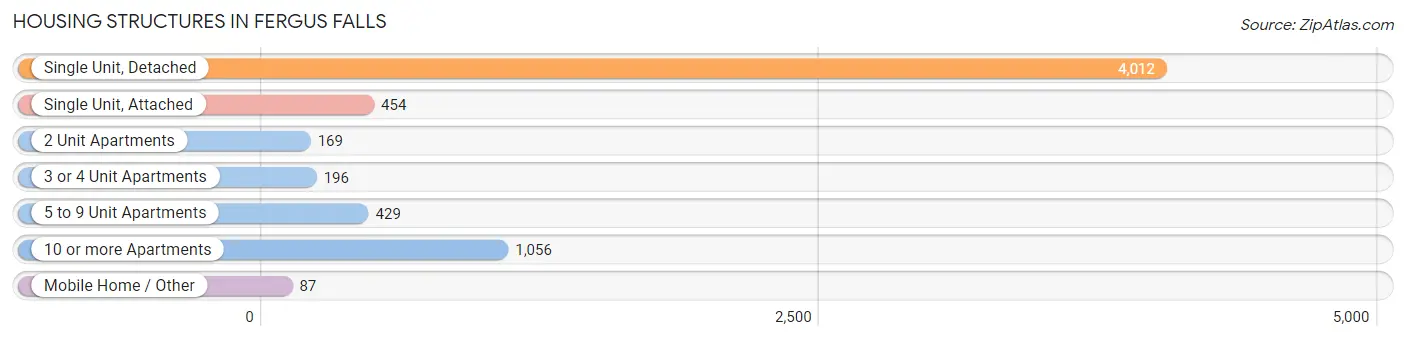
| Structure Type | # Housing Units | % Housing Units |
| Single Unit, Detached | 4,012 | 62.7% |
| Single Unit, Attached | 454 | 7.1% |
| 2 Unit Apartments | 169 | 2.6% |
| 3 or 4 Unit Apartments | 196 | 3.1% |
| 5 to 9 Unit Apartments | 429 | 6.7% |
| 10 or more Apartments | 1,056 | 16.5% |
| Mobile Home / Other | 87 | 1.4% |
| Total | 6,403 | 100.0% |
Housing Structures by Occupancy in Fergus Falls
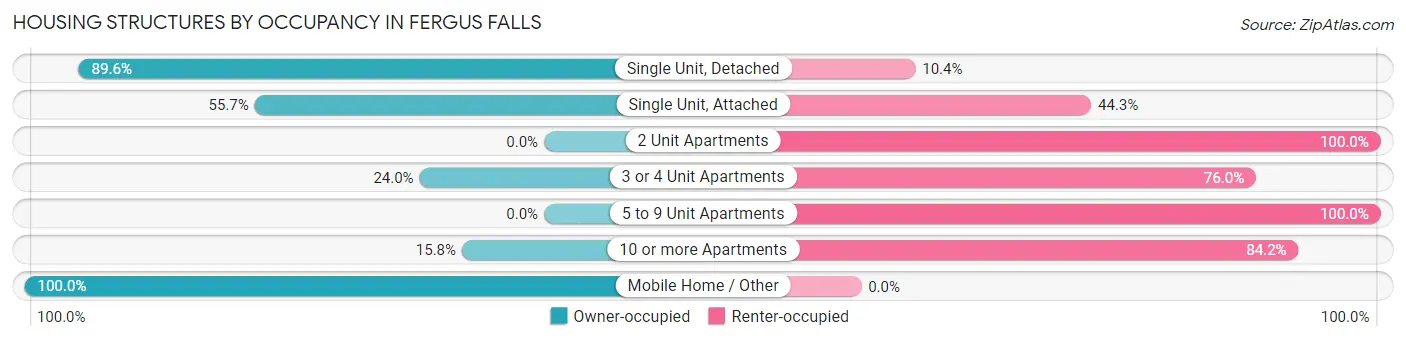
| Structure Type | Owner-occupied | Renter-occupied |
| Single Unit, Detached | 3,594 (89.6%) | 418 (10.4%) |
| Single Unit, Attached | 253 (55.7%) | 201 (44.3%) |
| 2 Unit Apartments | 0 (0.0%) | 169 (100.0%) |
| 3 or 4 Unit Apartments | 47 (24.0%) | 149 (76.0%) |
| 5 to 9 Unit Apartments | 0 (0.0%) | 429 (100.0%) |
| 10 or more Apartments | 167 (15.8%) | 889 (84.2%) |
| Mobile Home / Other | 87 (100.0%) | 0 (0.0%) |
| Total | 4,148 (64.8%) | 2,255 (35.2%) |
Housing Structures by Number of Rooms in Fergus Falls
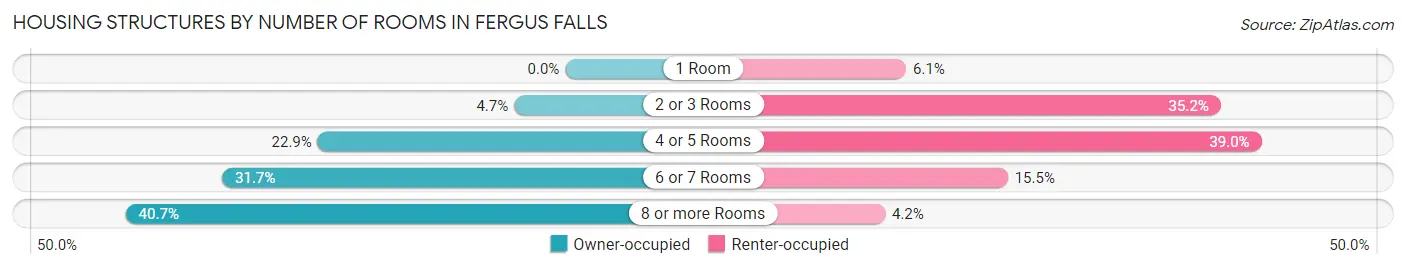
| Number of Rooms | Owner-occupied | Renter-occupied |
| 1 Room | 0 (0.0%) | 138 (6.1%) |
| 2 or 3 Rooms | 196 (4.7%) | 794 (35.2%) |
| 4 or 5 Rooms | 950 (22.9%) | 879 (39.0%) |
| 6 or 7 Rooms | 1,316 (31.7%) | 350 (15.5%) |
| 8 or more Rooms | 1,686 (40.6%) | 94 (4.2%) |
| Total | 4,148 (100.0%) | 2,255 (100.0%) |
Housing Structure by Heating Type in Fergus Falls
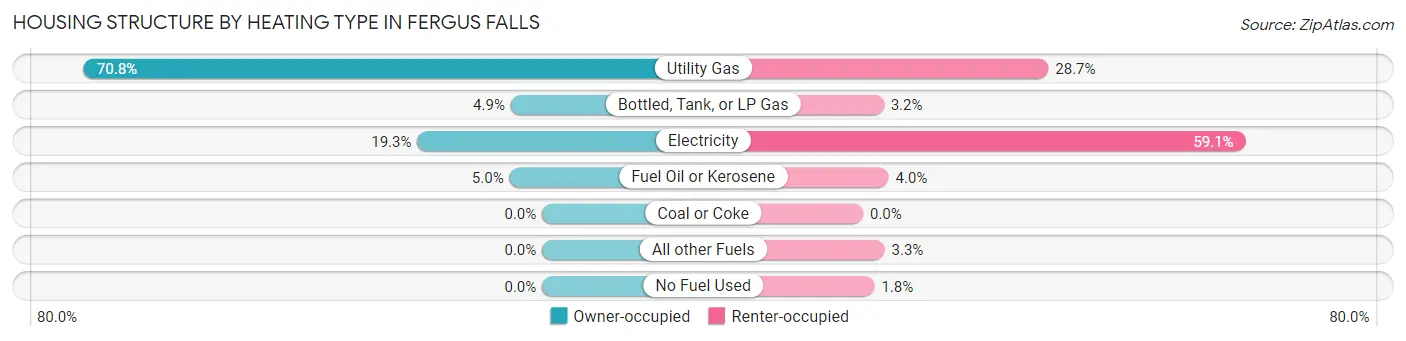
| Heating Type | Owner-occupied | Renter-occupied |
| Utility Gas | 2,938 (70.8%) | 646 (28.6%) |
| Bottled, Tank, or LP Gas | 201 (4.9%) | 72 (3.2%) |
| Electricity | 800 (19.3%) | 1,333 (59.1%) |
| Fuel Oil or Kerosene | 209 (5.0%) | 89 (4.0%) |
| Coal or Coke | 0 (0.0%) | 0 (0.0%) |
| All other Fuels | 0 (0.0%) | 75 (3.3%) |
| No Fuel Used | 0 (0.0%) | 40 (1.8%) |
| Total | 4,148 (100.0%) | 2,255 (100.0%) |
Household Vehicle Usage in Fergus Falls
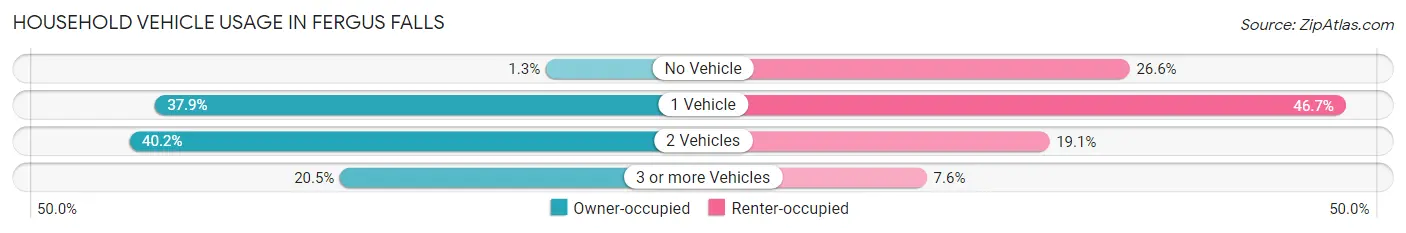
| Vehicles per Household | Owner-occupied | Renter-occupied |
| No Vehicle | 55 (1.3%) | 599 (26.6%) |
| 1 Vehicle | 1,572 (37.9%) | 1,054 (46.7%) |
| 2 Vehicles | 1,669 (40.2%) | 430 (19.1%) |
| 3 or more Vehicles | 852 (20.5%) | 172 (7.6%) |
| Total | 4,148 (100.0%) | 2,255 (100.0%) |
Real Estate & Mortgages in Fergus Falls
Real Estate and Mortgage Overview in Fergus Falls
| Characteristic | Without Mortgage | With Mortgage |
| Housing Units | 1,777 | 2,371 |
| Median Property Value | $171,100 | $160,300 |
| Median Household Income | $53,405 | $270 |
| Monthly Housing Costs | $502 | $21 |
| Real Estate Taxes | $1,760 | $55 |
Property Value by Mortgage Status in Fergus Falls
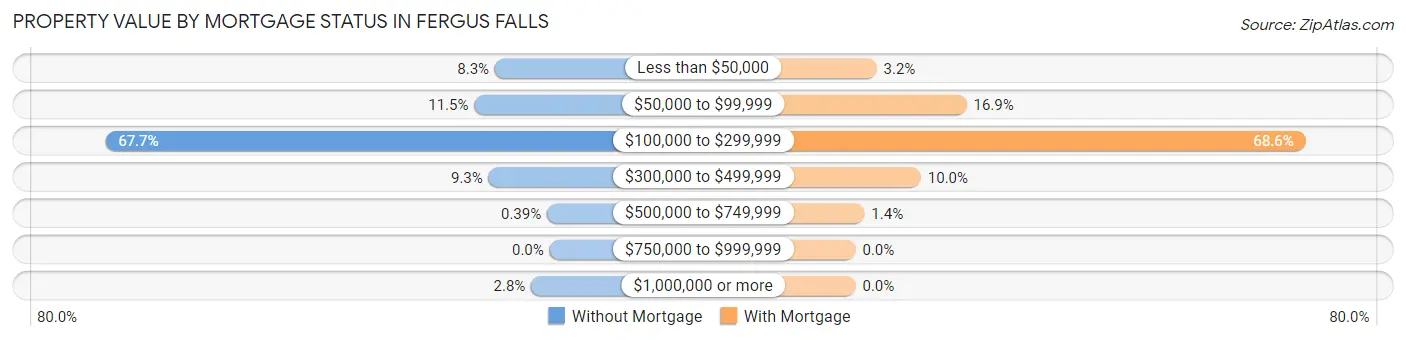
| Property Value | Without Mortgage | With Mortgage |
| Less than $50,000 | 148 (8.3%) | 76 (3.2%) |
| $50,000 to $99,999 | 204 (11.5%) | 401 (16.9%) |
| $100,000 to $299,999 | 1,203 (67.7%) | 1,626 (68.6%) |
| $300,000 to $499,999 | 165 (9.3%) | 236 (10.0%) |
| $500,000 to $749,999 | 7 (0.4%) | 32 (1.3%) |
| $750,000 to $999,999 | 0 (0.0%) | 0 (0.0%) |
| $1,000,000 or more | 50 (2.8%) | 0 (0.0%) |
| Total | 1,777 (100.0%) | 2,371 (100.0%) |
Household Income by Mortgage Status in Fergus Falls
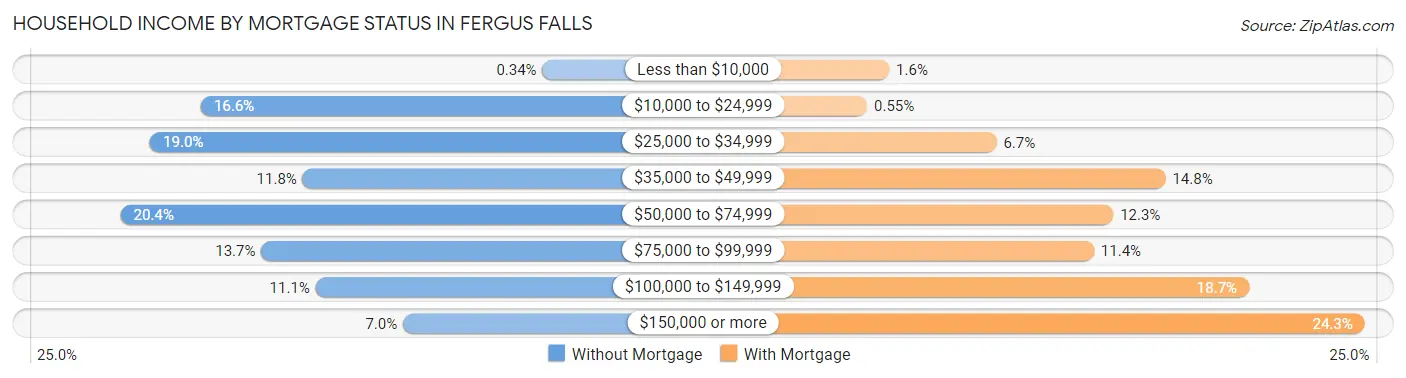
| Household Income | Without Mortgage | With Mortgage |
| Less than $10,000 | 6 (0.3%) | 38 (1.6%) |
| $10,000 to $24,999 | 295 (16.6%) | 13 (0.5%) |
| $25,000 to $34,999 | 338 (19.0%) | 159 (6.7%) |
| $35,000 to $49,999 | 209 (11.8%) | 350 (14.8%) |
| $50,000 to $74,999 | 363 (20.4%) | 291 (12.3%) |
| $75,000 to $99,999 | 244 (13.7%) | 269 (11.4%) |
| $100,000 to $149,999 | 198 (11.1%) | 444 (18.7%) |
| $150,000 or more | 124 (7.0%) | 575 (24.2%) |
| Total | 1,777 (100.0%) | 2,371 (100.0%) |
Property Value to Household Income Ratio in Fergus Falls
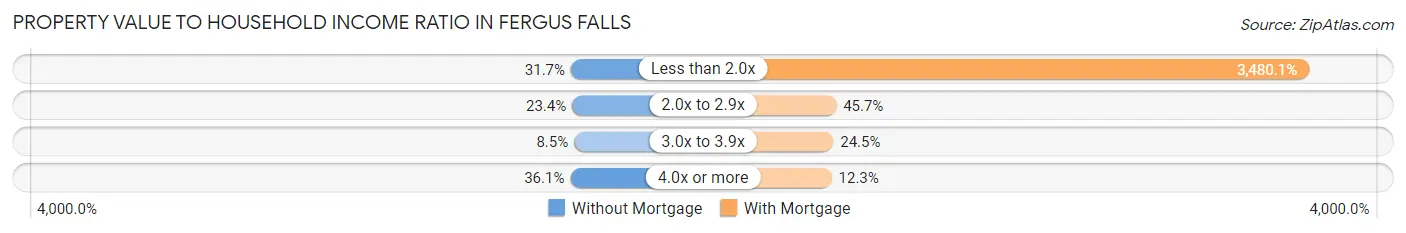
| Value-to-Income Ratio | Without Mortgage | With Mortgage |
| Less than 2.0x | 563 (31.7%) | 82,512 (3,480.0%) |
| 2.0x to 2.9x | 416 (23.4%) | 1,083 (45.7%) |
| 3.0x to 3.9x | 151 (8.5%) | 580 (24.5%) |
| 4.0x or more | 641 (36.1%) | 292 (12.3%) |
| Total | 1,777 (100.0%) | 2,371 (100.0%) |
Real Estate Taxes by Mortgage Status in Fergus Falls
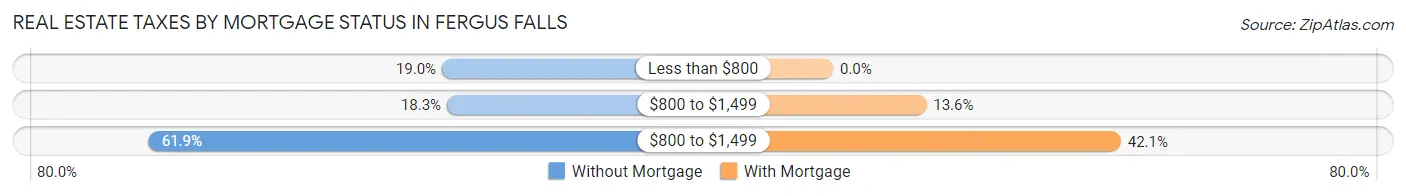
| Property Taxes | Without Mortgage | With Mortgage |
| Less than $800 | 338 (19.0%) | 0 (0.0%) |
| $800 to $1,499 | 325 (18.3%) | 323 (13.6%) |
| $800 to $1,499 | 1,099 (61.9%) | 997 (42.0%) |
| Total | 1,777 (100.0%) | 2,371 (100.0%) |
Health & Disability in Fergus Falls
Health Insurance Coverage by Age in Fergus Falls
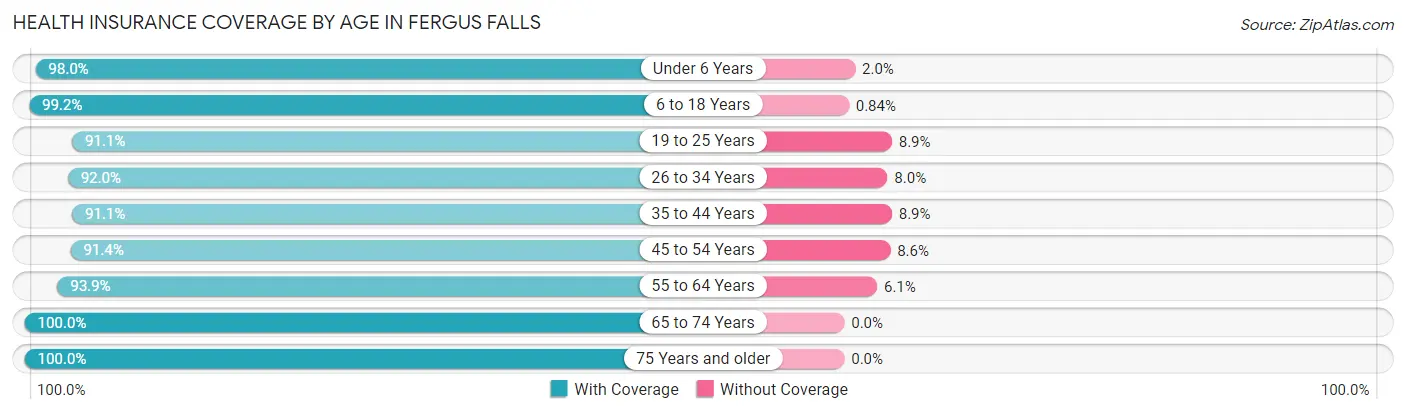
| Age Bracket | With Coverage | Without Coverage |
| Under 6 Years | 923 (98.0%) | 19 (2.0%) |
| 6 to 18 Years | 2,118 (99.2%) | 18 (0.8%) |
| 19 to 25 Years | 998 (91.1%) | 97 (8.9%) |
| 26 to 34 Years | 1,373 (92.0%) | 120 (8.0%) |
| 35 to 44 Years | 1,533 (91.1%) | 149 (8.9%) |
| 45 to 54 Years | 1,090 (91.4%) | 102 (8.6%) |
| 55 to 64 Years | 1,936 (93.9%) | 126 (6.1%) |
| 65 to 74 Years | 1,416 (100.0%) | 0 (0.0%) |
| 75 Years and older | 1,737 (100.0%) | 0 (0.0%) |
| Total | 13,124 (95.4%) | 631 (4.6%) |
Health Insurance Coverage by Citizenship Status in Fergus Falls
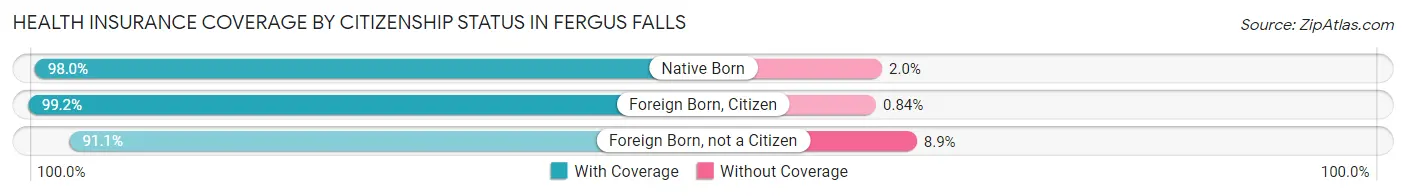
| Citizenship Status | With Coverage | Without Coverage |
| Native Born | 923 (98.0%) | 19 (2.0%) |
| Foreign Born, Citizen | 2,118 (99.2%) | 18 (0.8%) |
| Foreign Born, not a Citizen | 998 (91.1%) | 97 (8.9%) |
Health Insurance Coverage by Household Income in Fergus Falls
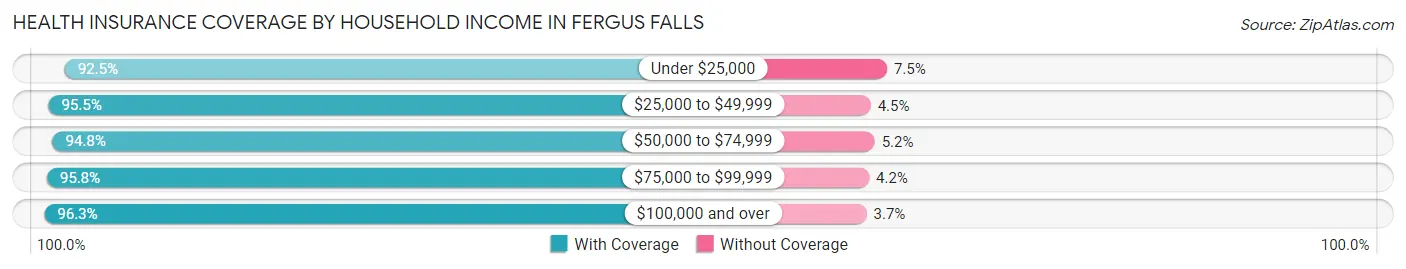
| Household Income | With Coverage | Without Coverage |
| Under $25,000 | 1,608 (92.5%) | 131 (7.5%) |
| $25,000 to $49,999 | 3,067 (95.5%) | 144 (4.5%) |
| $50,000 to $74,999 | 1,900 (94.8%) | 105 (5.2%) |
| $75,000 to $99,999 | 2,473 (95.8%) | 108 (4.2%) |
| $100,000 and over | 3,708 (96.3%) | 143 (3.7%) |
Public vs Private Health Insurance Coverage by Age in Fergus Falls
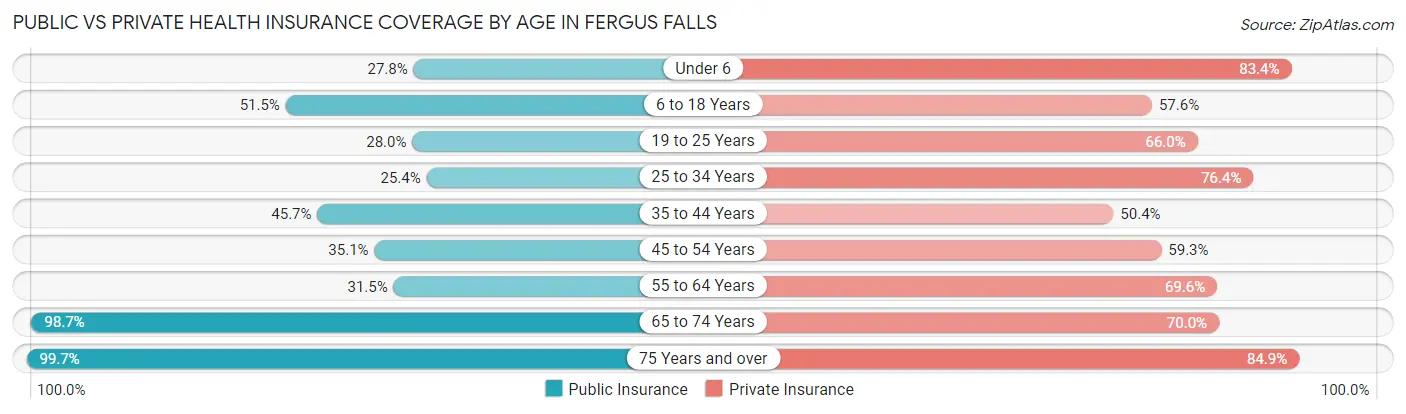
| Age Bracket | Public Insurance | Private Insurance |
| Under 6 | 262 (27.8%) | 786 (83.4%) |
| 6 to 18 Years | 1,101 (51.5%) | 1,230 (57.6%) |
| 19 to 25 Years | 307 (28.0%) | 723 (66.0%) |
| 25 to 34 Years | 379 (25.4%) | 1,140 (76.4%) |
| 35 to 44 Years | 768 (45.7%) | 848 (50.4%) |
| 45 to 54 Years | 418 (35.1%) | 707 (59.3%) |
| 55 to 64 Years | 650 (31.5%) | 1,436 (69.6%) |
| 65 to 74 Years | 1,398 (98.7%) | 991 (70.0%) |
| 75 Years and over | 1,731 (99.7%) | 1,474 (84.9%) |
| Total | 7,014 (51.0%) | 9,335 (67.9%) |
Disability Status by Sex by Age in Fergus Falls
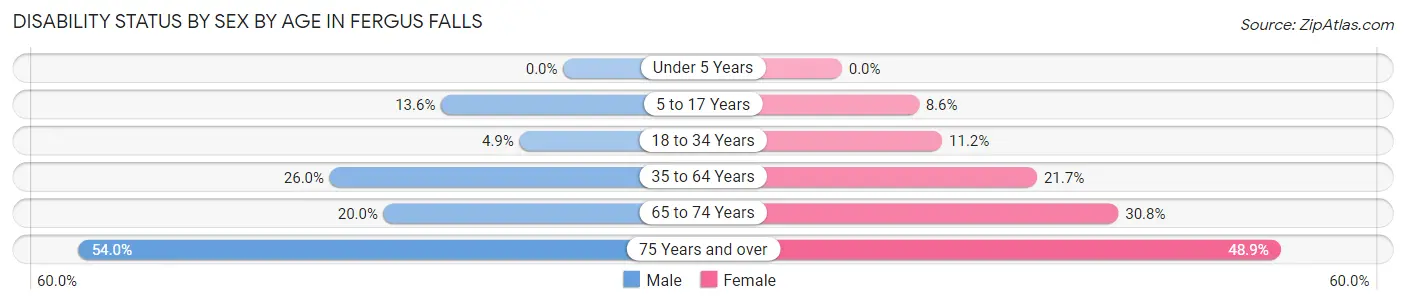
| Age Bracket | Male | Female |
| Under 5 Years | 0 (0.0%) | 0 (0.0%) |
| 5 to 17 Years | 133 (13.6%) | 94 (8.6%) |
| 18 to 34 Years | 62 (4.9%) | 176 (11.2%) |
| 35 to 64 Years | 609 (26.0%) | 564 (21.7%) |
| 65 to 74 Years | 126 (20.0%) | 242 (30.8%) |
| 75 Years and over | 394 (54.0%) | 492 (48.9%) |
Disability Class by Sex by Age in Fergus Falls
Disability Class: Hearing Difficulty
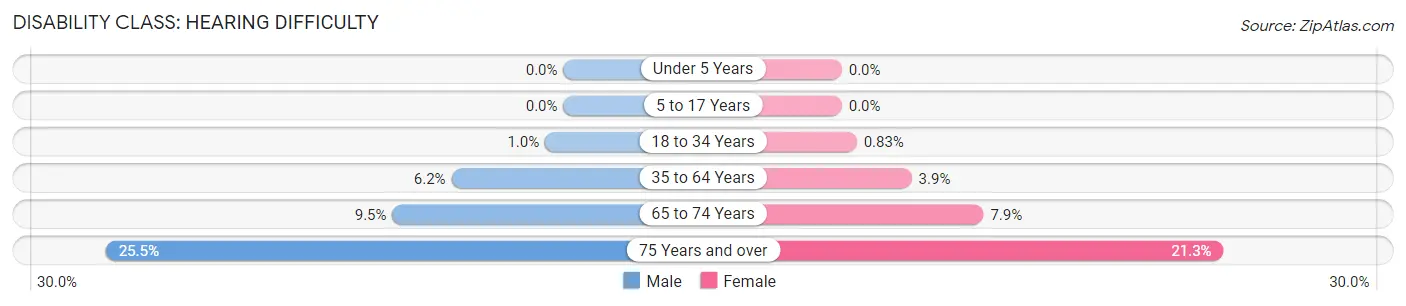
| Age Bracket | Male | Female |
| Under 5 Years | 0 (0.0%) | 0 (0.0%) |
| 5 to 17 Years | 0 (0.0%) | 0 (0.0%) |
| 18 to 34 Years | 13 (1.0%) | 13 (0.8%) |
| 35 to 64 Years | 146 (6.2%) | 101 (3.9%) |
| 65 to 74 Years | 60 (9.5%) | 62 (7.9%) |
| 75 Years and over | 186 (25.5%) | 214 (21.2%) |
Disability Class: Vision Difficulty
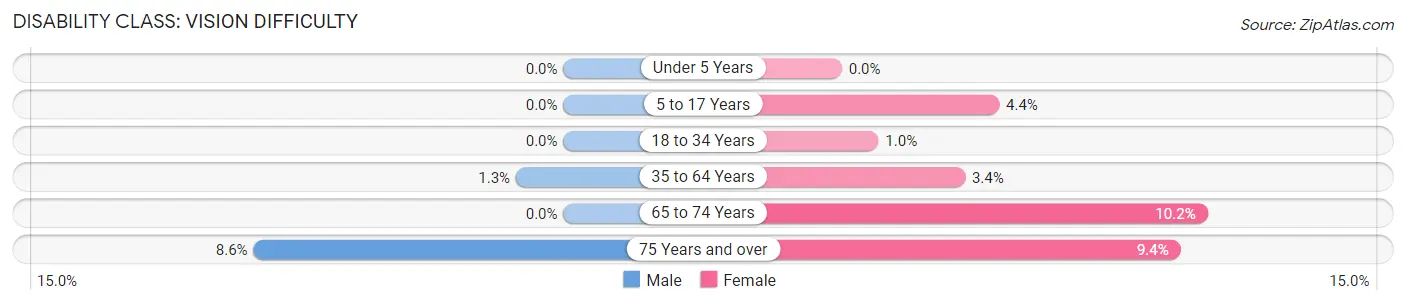
| Age Bracket | Male | Female |
| Under 5 Years | 0 (0.0%) | 0 (0.0%) |
| 5 to 17 Years | 0 (0.0%) | 48 (4.4%) |
| 18 to 34 Years | 0 (0.0%) | 16 (1.0%) |
| 35 to 64 Years | 31 (1.3%) | 89 (3.4%) |
| 65 to 74 Years | 0 (0.0%) | 80 (10.2%) |
| 75 Years and over | 63 (8.6%) | 95 (9.4%) |
Disability Class: Cognitive Difficulty
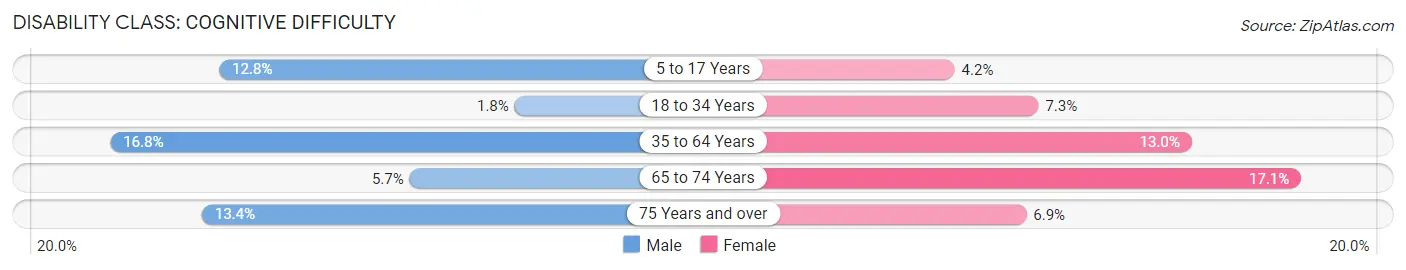
| Age Bracket | Male | Female |
| 5 to 17 Years | 125 (12.8%) | 46 (4.2%) |
| 18 to 34 Years | 23 (1.8%) | 115 (7.3%) |
| 35 to 64 Years | 394 (16.8%) | 337 (13.0%) |
| 65 to 74 Years | 36 (5.7%) | 134 (17.1%) |
| 75 Years and over | 98 (13.4%) | 69 (6.9%) |
Disability Class: Ambulatory Difficulty
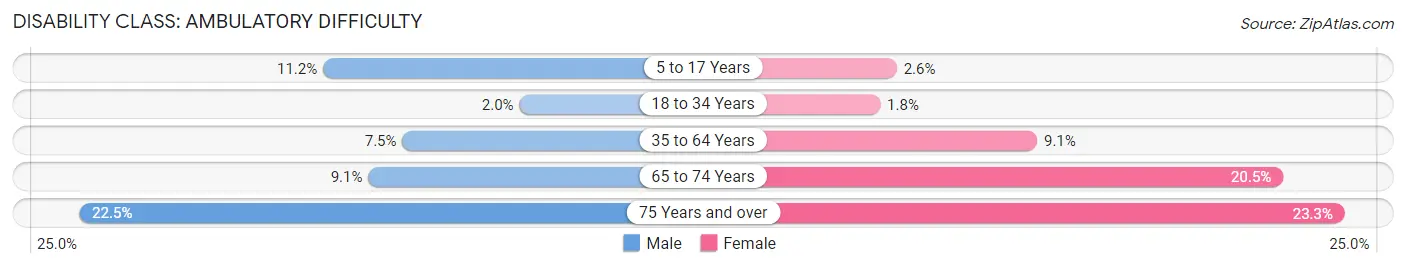
| Age Bracket | Male | Female |
| 5 to 17 Years | 109 (11.2%) | 28 (2.5%) |
| 18 to 34 Years | 26 (2.0%) | 28 (1.8%) |
| 35 to 64 Years | 175 (7.5%) | 235 (9.1%) |
| 65 to 74 Years | 57 (9.0%) | 161 (20.5%) |
| 75 Years and over | 164 (22.5%) | 235 (23.3%) |
Disability Class: Self-Care Difficulty
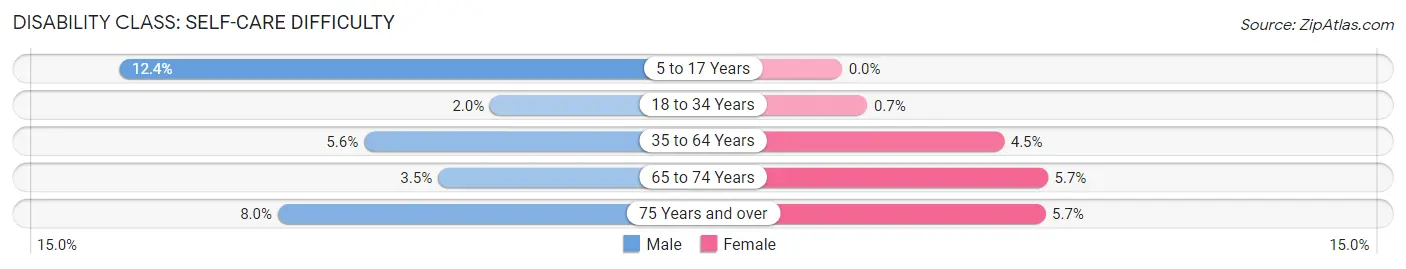
| Age Bracket | Male | Female |
| 5 to 17 Years | 121 (12.4%) | 0 (0.0%) |
| 18 to 34 Years | 26 (2.0%) | 11 (0.7%) |
| 35 to 64 Years | 130 (5.6%) | 117 (4.5%) |
| 65 to 74 Years | 22 (3.5%) | 45 (5.7%) |
| 75 Years and over | 58 (8.0%) | 57 (5.7%) |
Technology Access in Fergus Falls
Computing Device Access in Fergus Falls
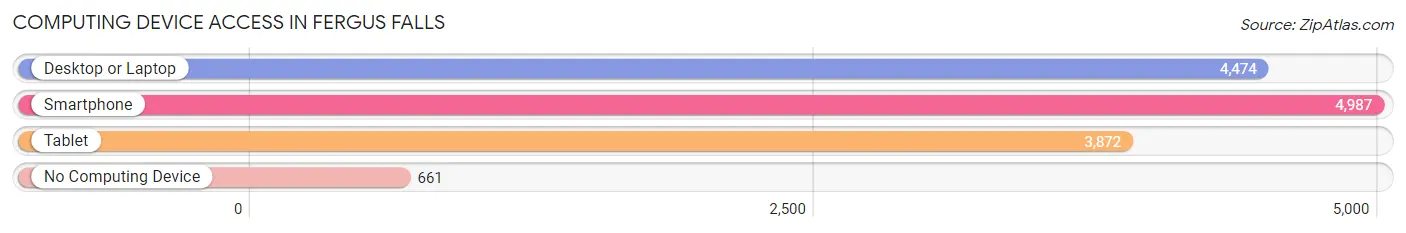
| Device Type | # Households | % Households |
| Desktop or Laptop | 4,474 | 69.9% |
| Smartphone | 4,987 | 77.9% |
| Tablet | 3,872 | 60.5% |
| No Computing Device | 661 | 10.3% |
| Total | 6,403 | 100.0% |
Internet Access in Fergus Falls
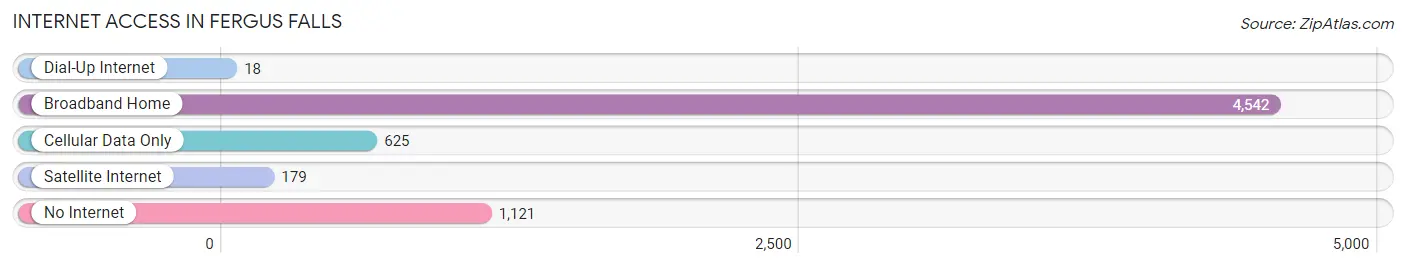
| Internet Type | # Households | % Households |
| Dial-Up Internet | 18 | 0.3% |
| Broadband Home | 4,542 | 70.9% |
| Cellular Data Only | 625 | 9.8% |
| Satellite Internet | 179 | 2.8% |
| No Internet | 1,121 | 17.5% |
| Total | 6,403 | 100.0% |
Fergus Falls Summary
Fergus Falls is a city located in Otter Tail County, Minnesota, United States. The population was 13,138 at the 2010 census. It is the county seat of Otter Tail County. Fergus Falls is home to Minnesota State Community and Technical College, a two-year college with a variety of programs.
History
Fergus Falls was founded in 1856 by William and Elizabeth Fergus, who were among the first settlers in the area. The city was named after James Fergus, a Scottish immigrant who had settled in the area in 1845. The city was incorporated in 1872.
In the late 19th century, Fergus Falls was a major center for the lumber industry. The city was home to several sawmills and a large paper mill. The city also had a thriving agricultural industry, with several grain elevators and a large creamery.
Geography
Fergus Falls is located at the confluence of the Otter Tail River and the Leaf River. The city is situated on the western edge of the Red River Valley, a large area of flat land in western Minnesota. The city is surrounded by rolling hills and wooded areas.
The city has a total area of 8.9 square miles, of which 8.7 square miles is land and 0.2 square miles is water.
Economy
Fergus Falls is a regional center for commerce and industry. The city is home to several manufacturing companies, including a large paper mill, a metal fabrication plant, and a food processing plant. The city also has a large retail sector, with several large stores and shopping centers.
The city is also home to several medical facilities, including a hospital, a nursing home, and several clinics.
Demographics
As of the 2010 census, there were 13,138 people, 5,541 households, and 3,323 families residing in the city. The population density was 1,491.3 people per square mile. The racial makeup of the city was 94.2% White, 0.7% African American, 0.4% Native American, 0.7% Asian, 0.1% Pacific Islander, 2.3% from other races, and 1.6% from two or more races. Hispanic or Latino of any race were 4.2% of the population.
The median income for a household in the city was $41,945, and the median income for a family was $51,945. The per capita income for the city was $20,945. About 8.2% of families and 11.2% of the population were below the poverty line, including 16.2% of those under age 18 and 8.2% of those age 65 or over.
Common Questions
What is Per Capita Income in Fergus Falls?
Per Capita income in Fergus Falls is $31,823.
What is the Median Family Income in Fergus Falls?
Median Family Income in Fergus Falls is $77,862.
What is the Median Household income in Fergus Falls?
Median Household Income in Fergus Falls is $48,738.
What is Income or Wage Gap in Fergus Falls?
Income or Wage Gap in Fergus Falls is 36.9%.
Women in Fergus Falls earn 63.1 cents for every dollar earned by a man.
What is Family Income Deficit in Fergus Falls?
Family Income Deficit in Fergus Falls is $11,780.
Families that are below poverty line in Fergus Falls earn $11,780 less on average than the poverty threshold level.
What is Inequality or Gini Index in Fergus Falls?
Inequality or Gini Index in Fergus Falls is 0.44.
What is the Total Population of Fergus Falls?
Total Population of Fergus Falls is 14,108.
What is the Total Male Population of Fergus Falls?
Total Male Population of Fergus Falls is 6,443.
What is the Total Female Population of Fergus Falls?
Total Female Population of Fergus Falls is 7,665.
What is the Ratio of Males per 100 Females in Fergus Falls?
There are 84.06 Males per 100 Females in Fergus Falls.
What is the Ratio of Females per 100 Males in Fergus Falls?
There are 118.97 Females per 100 Males in Fergus Falls.
What is the Median Population Age in Fergus Falls?
Median Population Age in Fergus Falls is 42.0 Years.
What is the Average Family Size in Fergus Falls
Average Family Size in Fergus Falls is 2.9 People.
What is the Average Household Size in Fergus Falls
Average Household Size in Fergus Falls is 2.1 People.
How Large is the Labor Force in Fergus Falls?
There are 7,046 People in the Labor Forcein in Fergus Falls.
What is the Percentage of People in the Labor Force in Fergus Falls?
60.9% of People are in the Labor Force in Fergus Falls.
What is the Unemployment Rate in Fergus Falls?
Unemployment Rate in Fergus Falls is 6.9%.