Madelia, MN Map & Demographics
Madelia Map
Madelia Overview
$33,460
PER CAPITA INCOME
$85,450
AVG FAMILY INCOME
$74,625
AVG HOUSEHOLD INCOME
26.9%
WAGE / INCOME GAP [ % ]
73.1¢/ $1
WAGE / INCOME GAP [ $ ]
$13,359
FAMILY INCOME DEFICIT
0.41
INEQUALITY / GINI INDEX
2,352
TOTAL POPULATION
1,144
MALE POPULATION
1,208
FEMALE POPULATION
94.70
MALES / 100 FEMALES
105.59
FEMALES / 100 MALES
36.5
MEDIAN AGE
3.3
AVG FAMILY SIZE
2.7
AVG HOUSEHOLD SIZE
1,310
LABOR FORCE [ PEOPLE ]
73.7%
PERCENT IN LABOR FORCE
3.4%
UNEMPLOYMENT RATE
Madelia Zip Codes
Madelia Area Codes
Income in Madelia
Income Overview in Madelia
Per Capita Income in Madelia is $33,460, while median incomes of families and households are $85,450 and $74,625 respectively.
| Characteristic | Number | Measure |
| Per Capita Income | 2,352 | $33,460 |
| Median Family Income | 533 | $85,450 |
| Mean Family Income | 533 | $99,554 |
| Median Household Income | 827 | $74,625 |
| Mean Household Income | 827 | $83,679 |
| Income Deficit | 533 | $13,359 |
| Wage / Income Gap (%) | 2,352 | 26.95% |
| Wage / Income Gap ($) | 2,352 | 73.05¢ per $1 |
| Gini / Inequality Index | 2,352 | 0.41 |
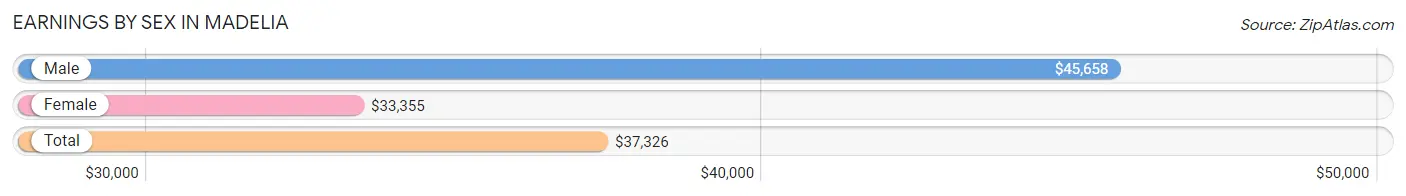
Earnings by Sex in Madelia
Average Earnings in Madelia are $37,326, $45,658 for men and $33,355 for women, a difference of 27.0%.
| Sex | Number | Average Earnings |
| Male | 686 (52.0%) | $45,658 |
| Female | 633 (48.0%) | $33,355 |
| Total | 1,319 (100.0%) | $37,326 |
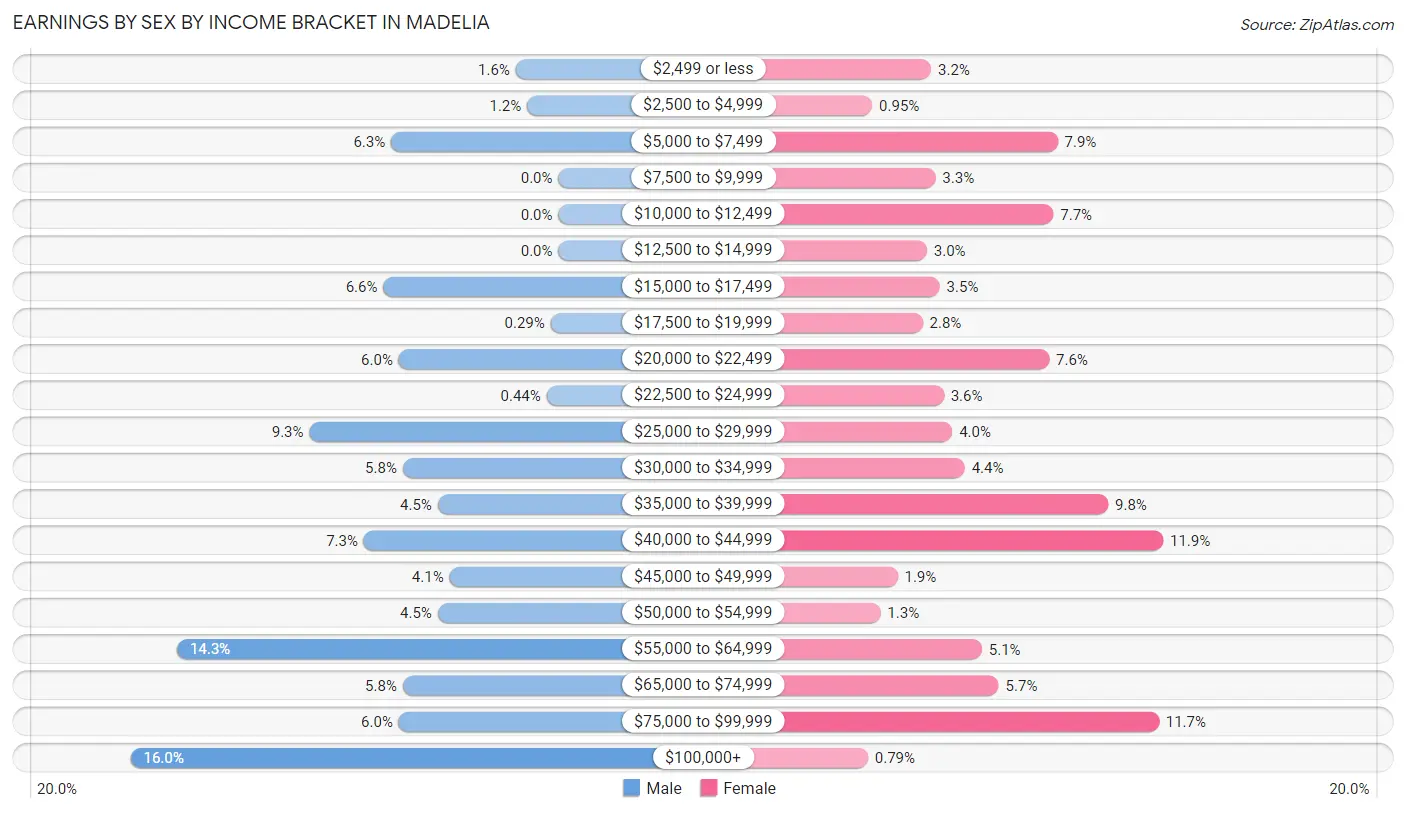
Earnings by Sex by Income Bracket in Madelia
The most common earnings brackets in Madelia are $100,000+ for men (110 | 16.0%) and $40,000 to $44,999 for women (75 | 11.8%).
| Income | Male | Female |
| $2,499 or less | 11 (1.6%) | 20 (3.2%) |
| $2,500 to $4,999 | 8 (1.2%) | 6 (0.9%) |
| $5,000 to $7,499 | 43 (6.3%) | 50 (7.9%) |
| $7,500 to $9,999 | 0 (0.0%) | 21 (3.3%) |
| $10,000 to $12,499 | 0 (0.0%) | 49 (7.7%) |
| $12,500 to $14,999 | 0 (0.0%) | 19 (3.0%) |
| $15,000 to $17,499 | 45 (6.6%) | 22 (3.5%) |
| $17,500 to $19,999 | 2 (0.3%) | 18 (2.8%) |
| $20,000 to $22,499 | 41 (6.0%) | 48 (7.6%) |
| $22,500 to $24,999 | 3 (0.4%) | 23 (3.6%) |
| $25,000 to $29,999 | 64 (9.3%) | 25 (4.0%) |
| $30,000 to $34,999 | 40 (5.8%) | 28 (4.4%) |
| $35,000 to $39,999 | 31 (4.5%) | 62 (9.8%) |
| $40,000 to $44,999 | 50 (7.3%) | 75 (11.8%) |
| $45,000 to $49,999 | 28 (4.1%) | 12 (1.9%) |
| $50,000 to $54,999 | 31 (4.5%) | 8 (1.3%) |
| $55,000 to $64,999 | 98 (14.3%) | 32 (5.1%) |
| $65,000 to $74,999 | 40 (5.8%) | 36 (5.7%) |
| $75,000 to $99,999 | 41 (6.0%) | 74 (11.7%) |
| $100,000+ | 110 (16.0%) | 5 (0.8%) |
| Total | 686 (100.0%) | 633 (100.0%) |
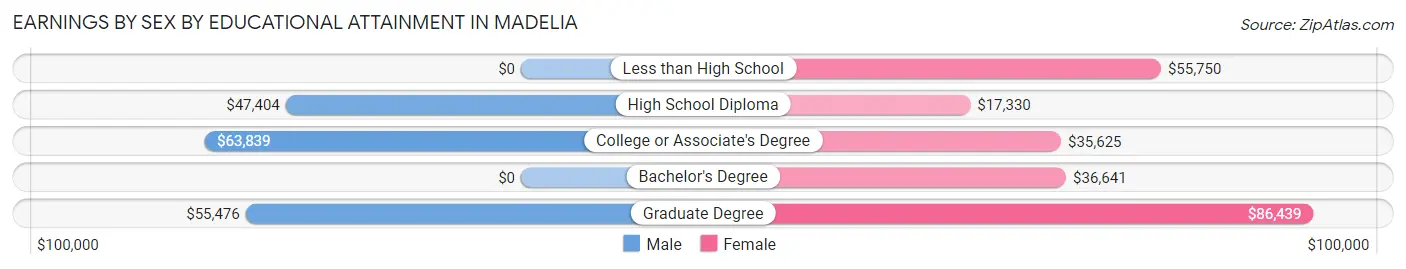
Earnings by Sex by Educational Attainment in Madelia
Average earnings in Madelia are $54,583 for men and $36,019 for women, a difference of 34.0%. Men with an educational attainment of college or associate's degree enjoy the highest average annual earnings of $63,839, while those with high school diploma education earn the least with $47,404. Women with an educational attainment of graduate degree earn the most with the average annual earnings of $86,439, while those with high school diploma education have the smallest earnings of $17,330.
| Educational Attainment | Male Income | Female Income |
| Less than High School | - | - |
| High School Diploma | $47,404 | $17,330 |
| College or Associate's Degree | $63,839 | $35,625 |
| Bachelor's Degree | - | - |
| Graduate Degree | $55,476 | $86,439 |
| Total | $54,583 | $36,019 |
Family Income in Madelia
Family Income Brackets in Madelia
According to the Madelia family income data, there are 143 families falling into the $75,000 to $99,999 income range, which is the most common income bracket and makes up 26.8% of all families.
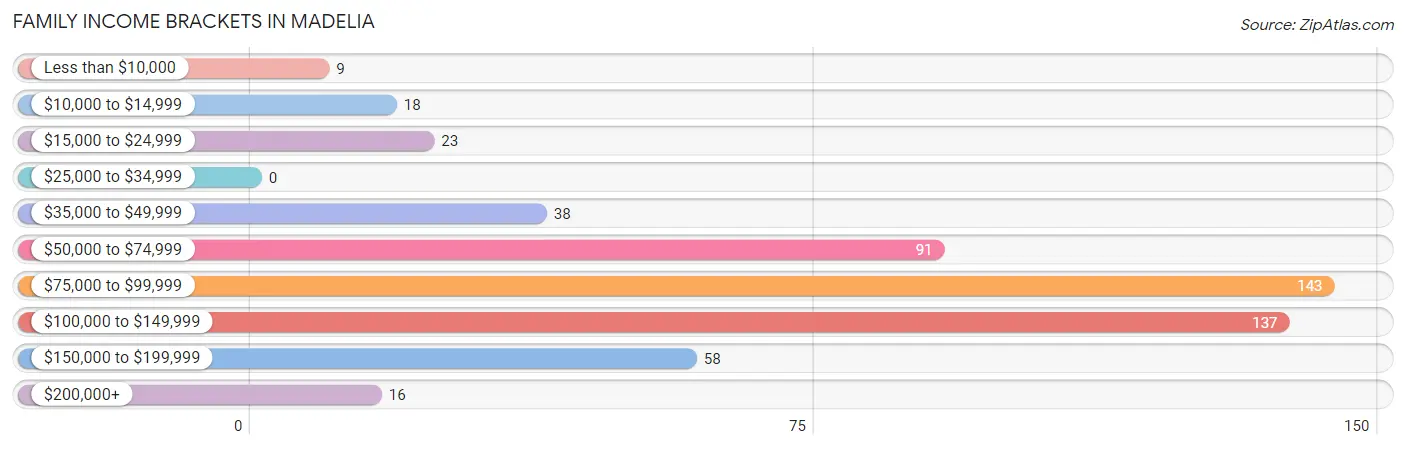
| Income Bracket | # Families | % Families |
| Less than $10,000 | 9 | 1.7% |
| $10,000 to $14,999 | 18 | 3.4% |
| $15,000 to $24,999 | 23 | 4.3% |
| $25,000 to $34,999 | 0 | 0.0% |
| $35,000 to $49,999 | 38 | 7.1% |
| $50,000 to $74,999 | 91 | 17.1% |
| $75,000 to $99,999 | 143 | 26.8% |
| $100,000 to $149,999 | 137 | 25.7% |
| $150,000 to $199,999 | 58 | 10.9% |
| $200,000+ | 16 | 3.0% |
Family Income by Famaliy Size in Madelia
4-person families (39 | 7.3%) account for the highest median family income in Madelia with $137,969 per family, while 2-person families (245 | 46.0%) have the highest median income of $41,473 per family member.
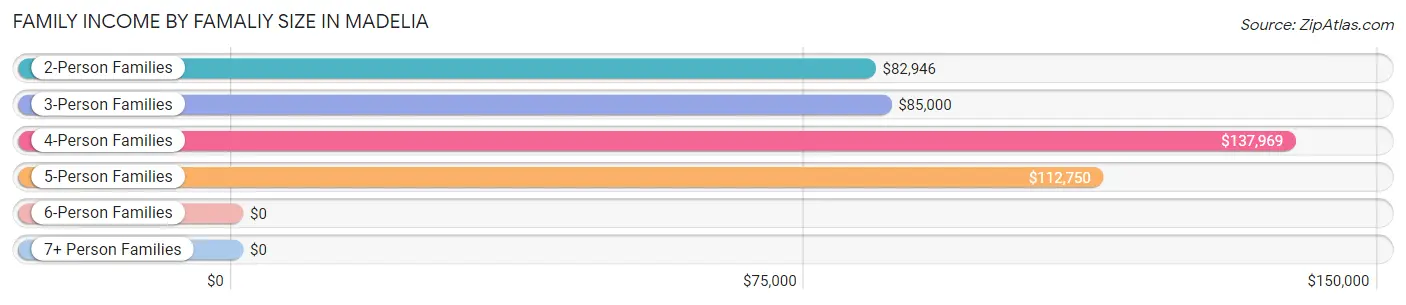
| Income Bracket | # Families | Median Income |
| 2-Person Families | 245 (46.0%) | $82,946 |
| 3-Person Families | 116 (21.8%) | $85,000 |
| 4-Person Families | 39 (7.3%) | $137,969 |
| 5-Person Families | 95 (17.8%) | $112,750 |
| 6-Person Families | 30 (5.6%) | $0 |
| 7+ Person Families | 8 (1.5%) | $0 |
| Total | 533 (100.0%) | $85,450 |
Family Income by Number of Earners in Madelia
The median family income in Madelia is $85,450, with families comprising 3+ earners (59) having the highest median family income of $117,083, while families with 1 earner (185) have the lowest median family income of $61,359, accounting for 11.1% and 34.7% of families, respectively.
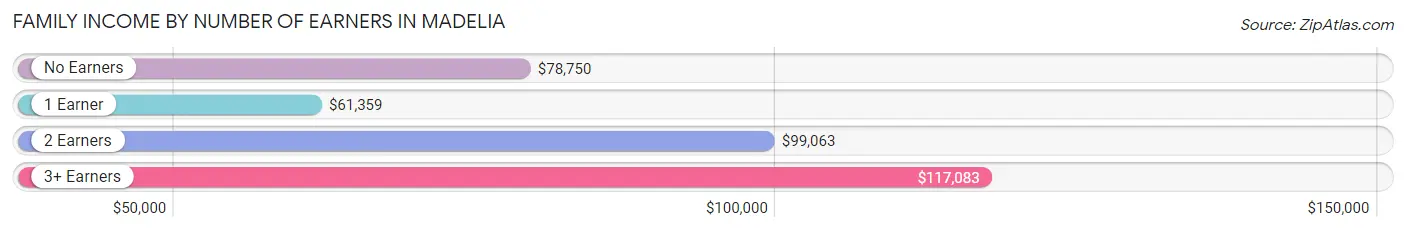
| Number of Earners | # Families | Median Income |
| No Earners | 58 (10.9%) | $78,750 |
| 1 Earner | 185 (34.7%) | $61,359 |
| 2 Earners | 231 (43.3%) | $99,063 |
| 3+ Earners | 59 (11.1%) | $117,083 |
| Total | 533 (100.0%) | $85,450 |
Household Income in Madelia
Household Income Brackets in Madelia
With 155 households falling in the category, the $75,000 to $99,999 income range is the most frequent in Madelia, accounting for 18.7% of all households. In contrast, only 19 households (2.3%) fall into the $200,000+ income bracket, making it the least populous group.
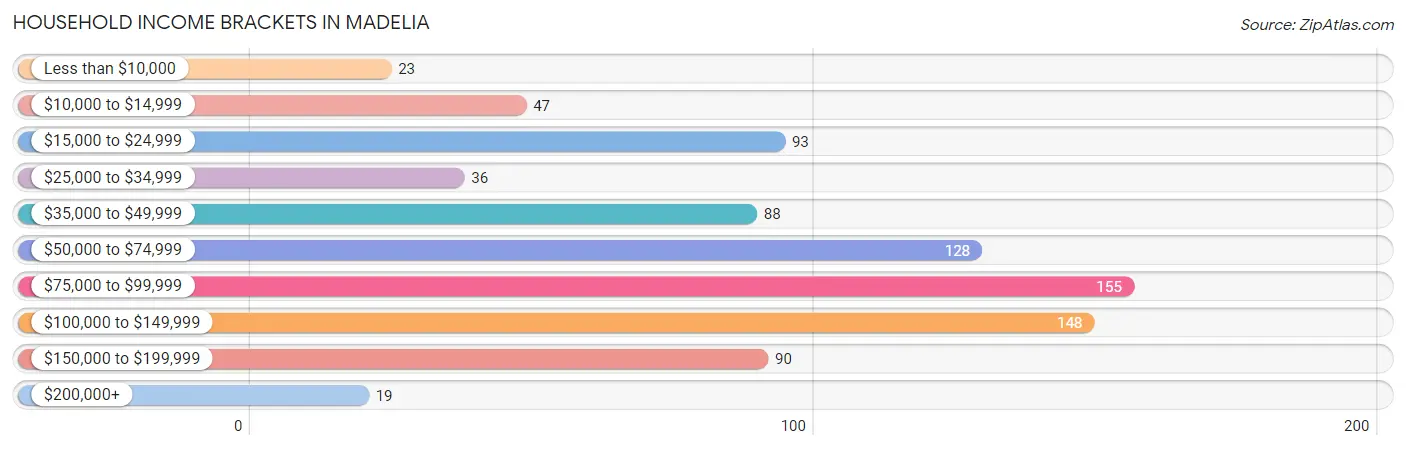
| Income Bracket | # Households | % Households |
| Less than $10,000 | 23 | 2.8% |
| $10,000 to $14,999 | 47 | 5.7% |
| $15,000 to $24,999 | 93 | 11.2% |
| $25,000 to $34,999 | 36 | 4.4% |
| $35,000 to $49,999 | 88 | 10.6% |
| $50,000 to $74,999 | 128 | 15.5% |
| $75,000 to $99,999 | 155 | 18.7% |
| $100,000 to $149,999 | 148 | 17.9% |
| $150,000 to $199,999 | 90 | 10.9% |
| $200,000+ | 19 | 2.3% |
Household Income by Householder Age in Madelia
The median household income in Madelia is $74,625, with the highest median household income of $108,750 found in the 45 to 64 years age bracket for the primary householder. A total of 280 households (33.9%) fall into this category. Meanwhile, the 15 to 24 years age bracket for the primary householder has the lowest median household income of $0, with 77 households (9.3%) in this group.
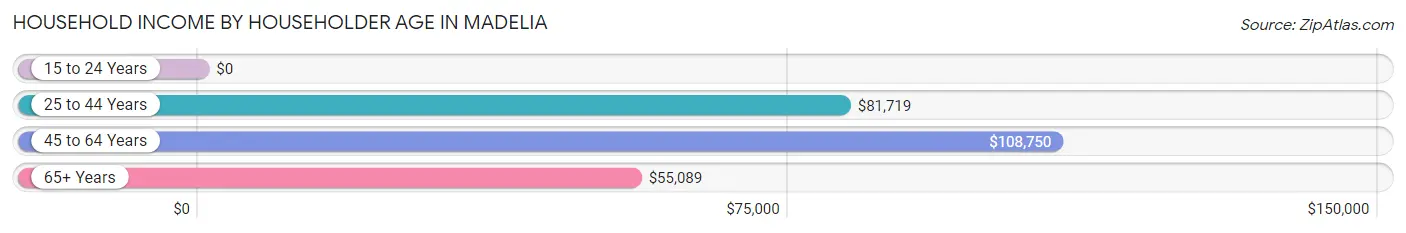
| Income Bracket | # Households | Median Income |
| 15 to 24 Years | 77 (9.3%) | $0 |
| 25 to 44 Years | 219 (26.5%) | $81,719 |
| 45 to 64 Years | 280 (33.9%) | $108,750 |
| 65+ Years | 251 (30.3%) | $55,089 |
| Total | 827 (100.0%) | $74,625 |
Poverty in Madelia
Income Below Poverty by Sex and Age in Madelia
With 4.3% poverty level for males and 12.7% for females among the residents of Madelia, 6 to 11 year old males and 16 and 17 year old females are the most vulnerable to poverty, with 16 males (30.8%) and 16 females (64.0%) in their respective age groups living below the poverty level.
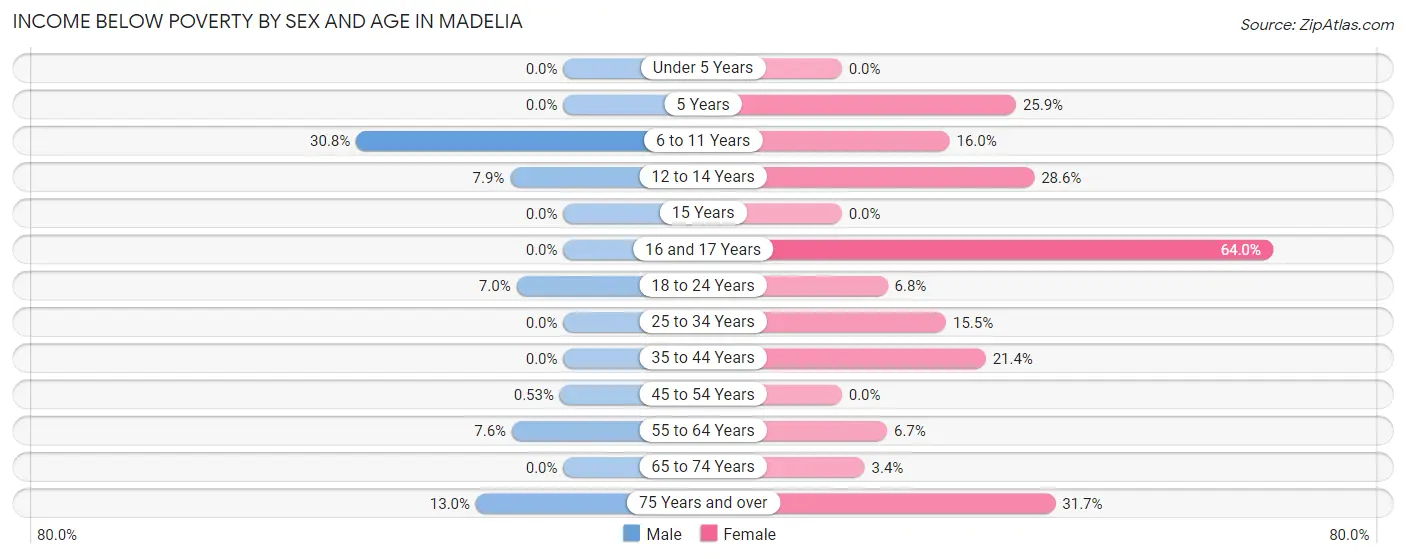
| Age Bracket | Male | Female |
| Under 5 Years | 0 (0.0%) | 0 (0.0%) |
| 5 Years | 0 (0.0%) | 15 (25.9%) |
| 6 to 11 Years | 16 (30.8%) | 12 (16.0%) |
| 12 to 14 Years | 3 (7.9%) | 8 (28.6%) |
| 15 Years | 0 (0.0%) | 0 (0.0%) |
| 16 and 17 Years | 0 (0.0%) | 16 (64.0%) |
| 18 to 24 Years | 8 (7.0%) | 7 (6.8%) |
| 25 to 34 Years | 0 (0.0%) | 26 (15.5%) |
| 35 to 44 Years | 0 (0.0%) | 25 (21.4%) |
| 45 to 54 Years | 1 (0.5%) | 0 (0.0%) |
| 55 to 64 Years | 11 (7.6%) | 8 (6.7%) |
| 65 to 74 Years | 0 (0.0%) | 4 (3.4%) |
| 75 Years and over | 10 (13.0%) | 26 (31.7%) |
| Total | 49 (4.3%) | 147 (12.7%) |
Income Above Poverty by Sex and Age in Madelia
According to the poverty statistics in Madelia, males aged under 5 years and females aged under 5 years are the age groups that are most secure financially, with 100.0% of males and 100.0% of females in these age groups living above the poverty line.
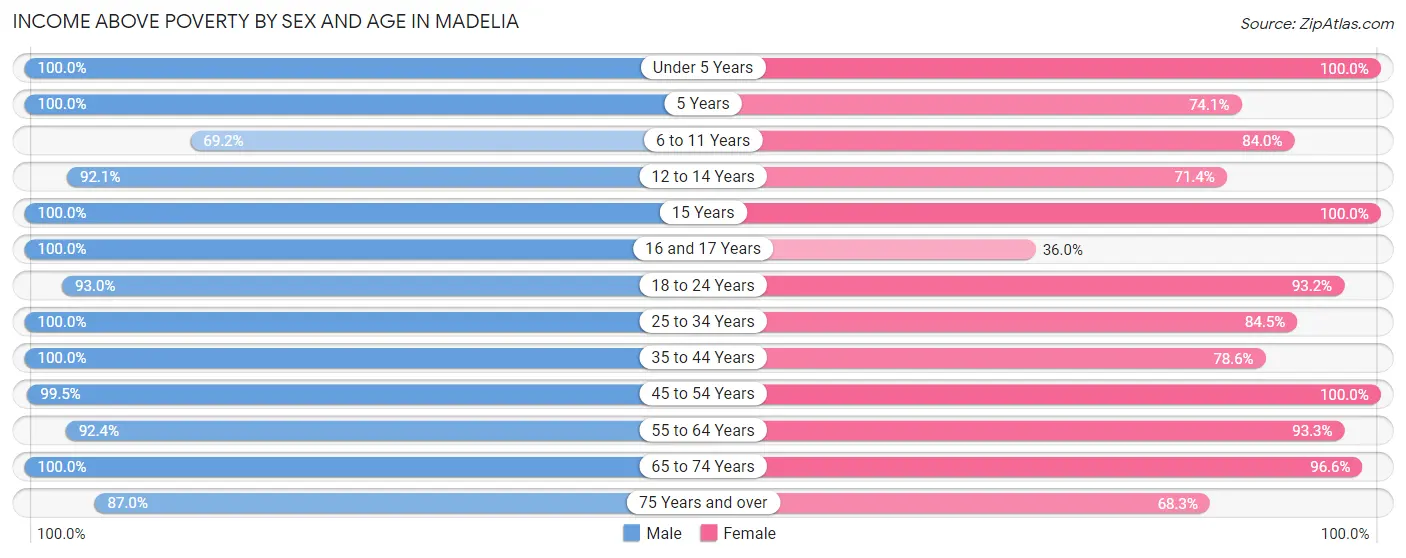
| Age Bracket | Male | Female |
| Under 5 Years | 125 (100.0%) | 127 (100.0%) |
| 5 Years | 18 (100.0%) | 43 (74.1%) |
| 6 to 11 Years | 36 (69.2%) | 63 (84.0%) |
| 12 to 14 Years | 35 (92.1%) | 20 (71.4%) |
| 15 Years | 23 (100.0%) | 31 (100.0%) |
| 16 and 17 Years | 12 (100.0%) | 9 (36.0%) |
| 18 to 24 Years | 107 (93.0%) | 96 (93.2%) |
| 25 to 34 Years | 169 (100.0%) | 142 (84.5%) |
| 35 to 44 Years | 64 (100.0%) | 92 (78.6%) |
| 45 to 54 Years | 187 (99.5%) | 107 (100.0%) |
| 55 to 64 Years | 133 (92.4%) | 111 (93.3%) |
| 65 to 74 Years | 104 (100.0%) | 114 (96.6%) |
| 75 Years and over | 67 (87.0%) | 56 (68.3%) |
| Total | 1,080 (95.7%) | 1,011 (87.3%) |
Income Below Poverty Among Married-Couple Families in Madelia
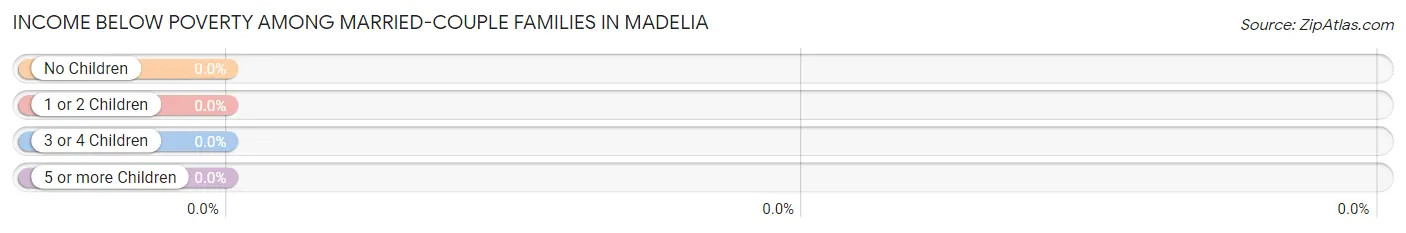
| Children | Above Poverty | Below Poverty |
| No Children | 206 (100.0%) | 0 (0.0%) |
| 1 or 2 Children | 80 (100.0%) | 0 (0.0%) |
| 3 or 4 Children | 89 (100.0%) | 0 (0.0%) |
| 5 or more Children | 8 (100.0%) | 0 (0.0%) |
| Total | 383 (100.0%) | 0 (0.0%) |
Income Below Poverty Among Single-Parent Households in Madelia
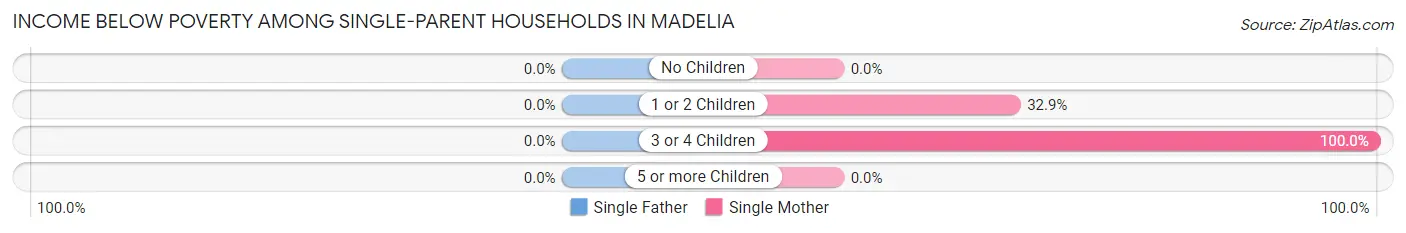
| Children | Single Father | Single Mother |
| No Children | 0 (0.0%) | 0 (0.0%) |
| 1 or 2 Children | 0 (0.0%) | 24 (32.9%) |
| 3 or 4 Children | 0 (0.0%) | 22 (100.0%) |
| 5 or more Children | 0 (0.0%) | 0 (0.0%) |
| Total | 0 (0.0%) | 46 (44.7%) |
Income Below Poverty Among Married-Couple vs Single-Parent Households in Madelia
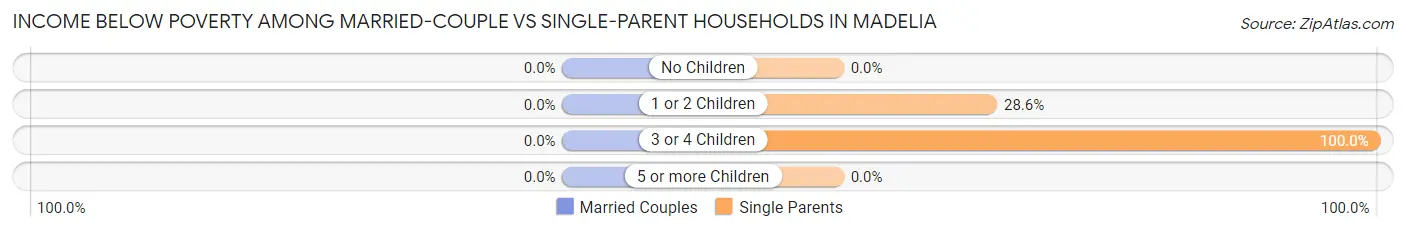
| Children | Married-Couple Families | Single-Parent Households |
| No Children | 0 (0.0%) | 0 (0.0%) |
| 1 or 2 Children | 0 (0.0%) | 24 (28.6%) |
| 3 or 4 Children | 0 (0.0%) | 22 (100.0%) |
| 5 or more Children | 0 (0.0%) | 0 (0.0%) |
| Total | 0 (0.0%) | 46 (30.7%) |
Race in Madelia
The most populous races in Madelia are White / Caucasian (1,707 | 72.6%), Hispanic or Latino (682 | 29.0%), and Some other Race (351 | 14.9%).
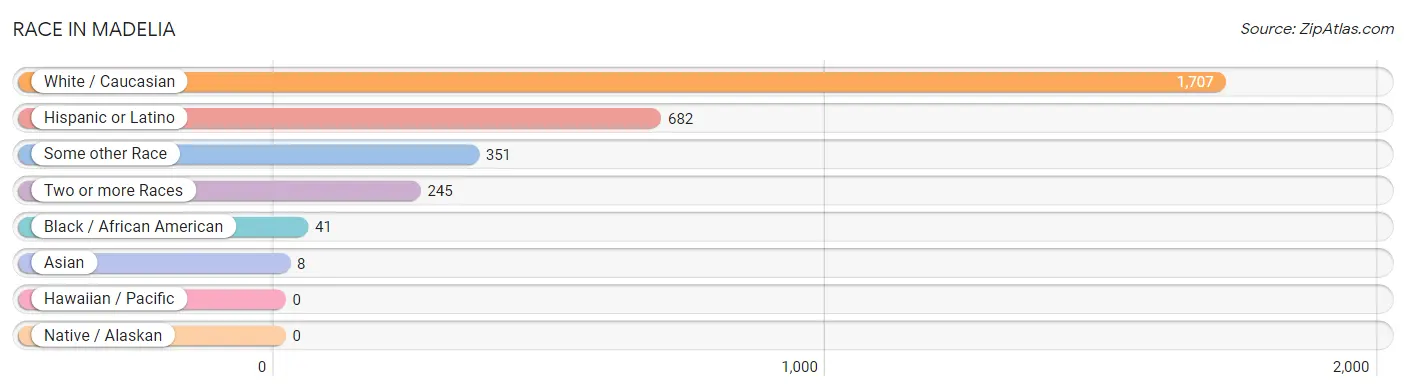
| Race | # Population | % Population |
| Asian | 8 | 0.3% |
| Black / African American | 41 | 1.7% |
| Hawaiian / Pacific | 0 | 0.0% |
| Hispanic or Latino | 682 | 29.0% |
| Native / Alaskan | 0 | 0.0% |
| White / Caucasian | 1,707 | 72.6% |
| Two or more Races | 245 | 10.4% |
| Some other Race | 351 | 14.9% |
| Total | 2,352 | 100.0% |
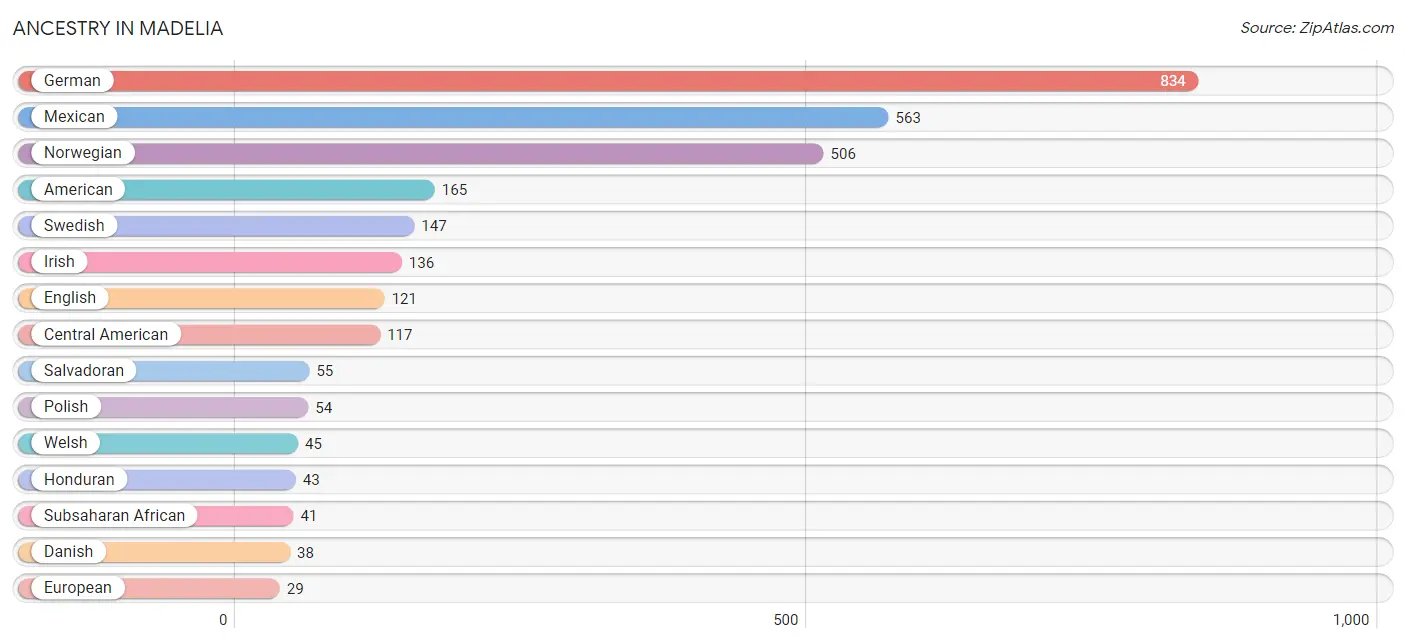
Ancestry in Madelia
The most populous ancestries reported in Madelia are German (834 | 35.5%), Mexican (563 | 23.9%), Norwegian (506 | 21.5%), American (165 | 7.0%), and Swedish (147 | 6.2%), together accounting for 94.2% of all Madelia residents.
| Ancestry | # Population | % Population |
| African | 19 | 0.8% |
| American | 165 | 7.0% |
| Belgian | 26 | 1.1% |
| Central American | 117 | 5.0% |
| Czech | 5 | 0.2% |
| Czechoslovakian | 9 | 0.4% |
| Danish | 38 | 1.6% |
| English | 121 | 5.1% |
| European | 29 | 1.2% |
| French | 19 | 0.8% |
| German | 834 | 35.5% |
| Guatemalan | 19 | 0.8% |
| Honduran | 43 | 1.8% |
| Irish | 136 | 5.8% |
| Jamaican | 19 | 0.8% |
| Korean | 8 | 0.3% |
| Mexican | 563 | 23.9% |
| Northern European | 5 | 0.2% |
| Norwegian | 506 | 21.5% |
| Polish | 54 | 2.3% |
| Salvadoran | 55 | 2.3% |
| Scottish | 24 | 1.0% |
| Subsaharan African | 41 | 1.7% |
| Swedish | 147 | 6.2% |
| Welsh | 45 | 1.9% | View All 25 Rows |
Immigrants in Madelia
The most numerous immigrant groups reported in Madelia came from Central America (240 | 10.2%), Latin America (240 | 10.2%), Mexico (157 | 6.7%), Honduras (40 | 1.7%), and El Salvador (24 | 1.0%), together accounting for 29.8% of all Madelia residents.
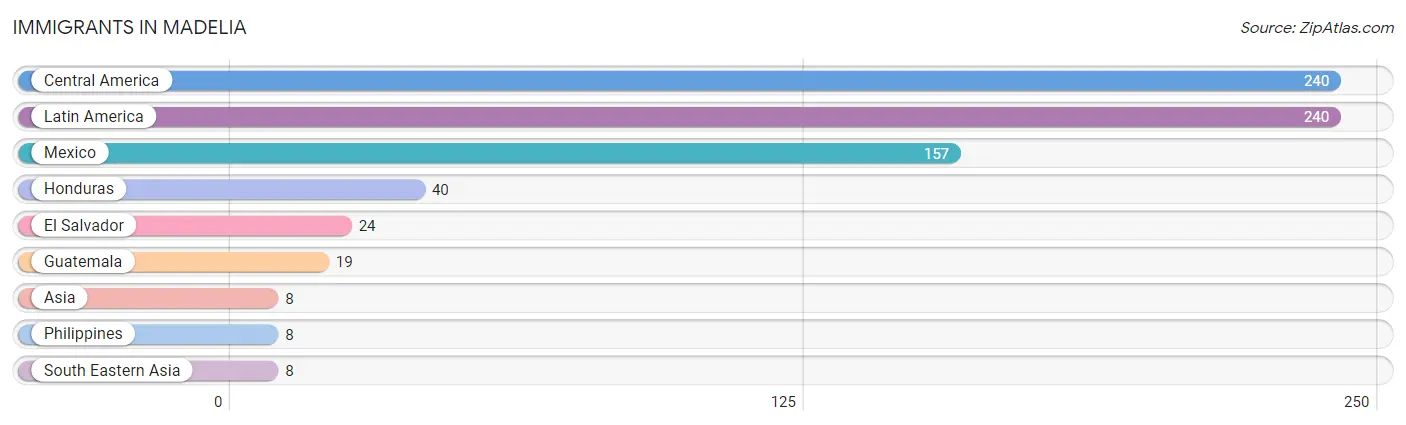
| Immigration Origin | # Population | % Population |
| Asia | 8 | 0.3% |
| Central America | 240 | 10.2% |
| El Salvador | 24 | 1.0% |
| Guatemala | 19 | 0.8% |
| Honduras | 40 | 1.7% |
| Latin America | 240 | 10.2% |
| Mexico | 157 | 6.7% |
| Philippines | 8 | 0.3% |
| South Eastern Asia | 8 | 0.3% | View All 9 Rows |
Sex and Age in Madelia
Sex and Age in Madelia
The most populous age groups in Madelia are Under 5 Years (125 | 10.9%) for men and Under 5 Years (127 | 10.5%) for women.
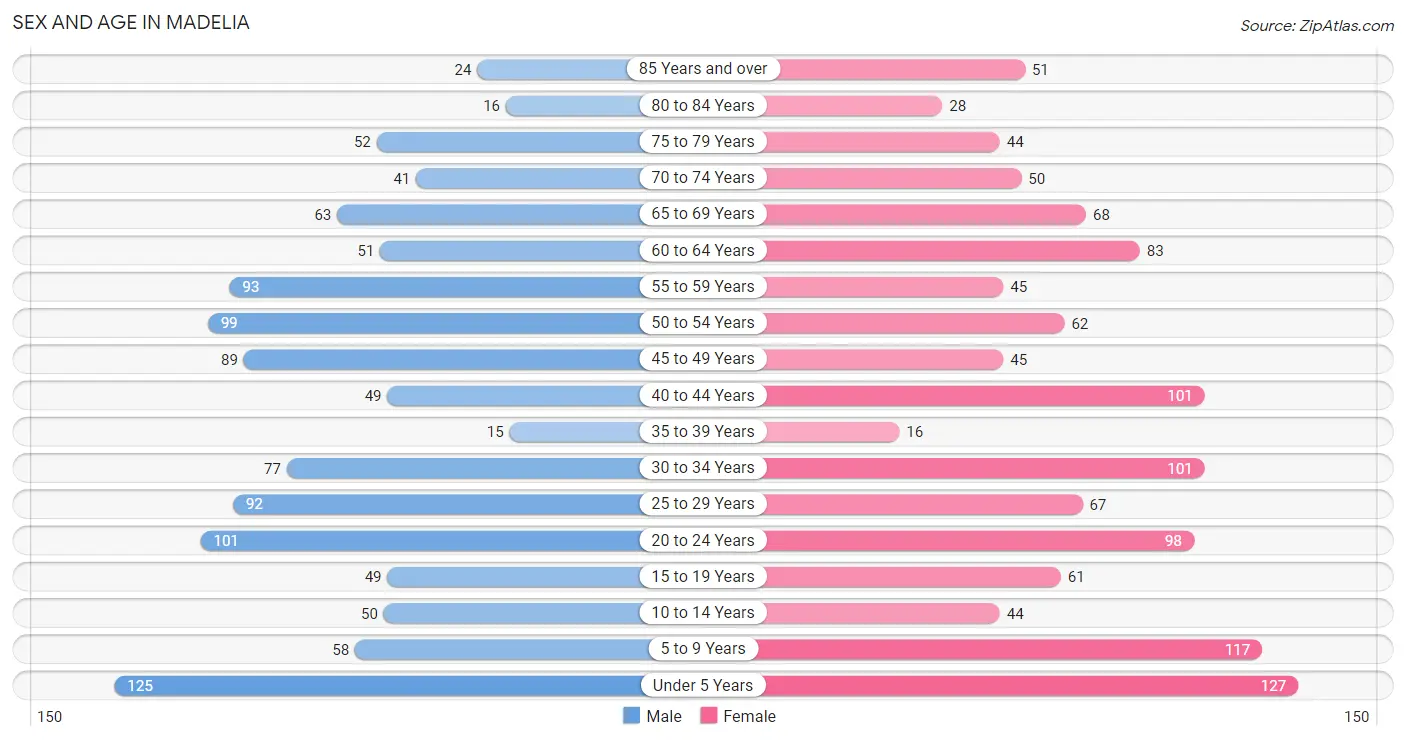
| Age Bracket | Male | Female |
| Under 5 Years | 125 (10.9%) | 127 (10.5%) |
| 5 to 9 Years | 58 (5.1%) | 117 (9.7%) |
| 10 to 14 Years | 50 (4.4%) | 44 (3.6%) |
| 15 to 19 Years | 49 (4.3%) | 61 (5.1%) |
| 20 to 24 Years | 101 (8.8%) | 98 (8.1%) |
| 25 to 29 Years | 92 (8.0%) | 67 (5.6%) |
| 30 to 34 Years | 77 (6.7%) | 101 (8.4%) |
| 35 to 39 Years | 15 (1.3%) | 16 (1.3%) |
| 40 to 44 Years | 49 (4.3%) | 101 (8.4%) |
| 45 to 49 Years | 89 (7.8%) | 45 (3.7%) |
| 50 to 54 Years | 99 (8.6%) | 62 (5.1%) |
| 55 to 59 Years | 93 (8.1%) | 45 (3.7%) |
| 60 to 64 Years | 51 (4.5%) | 83 (6.9%) |
| 65 to 69 Years | 63 (5.5%) | 68 (5.6%) |
| 70 to 74 Years | 41 (3.6%) | 50 (4.1%) |
| 75 to 79 Years | 52 (4.5%) | 44 (3.6%) |
| 80 to 84 Years | 16 (1.4%) | 28 (2.3%) |
| 85 Years and over | 24 (2.1%) | 51 (4.2%) |
| Total | 1,144 (100.0%) | 1,208 (100.0%) |
Families and Households in Madelia
Median Family Size in Madelia
The median family size in Madelia is 3.30 persons per family, with married-couple families (383 | 71.9%) accounting for the largest median family size of 3.35 persons per family. On the other hand, single male/father families (47 | 8.8%) represent the smallest median family size with 3.04 persons per family.
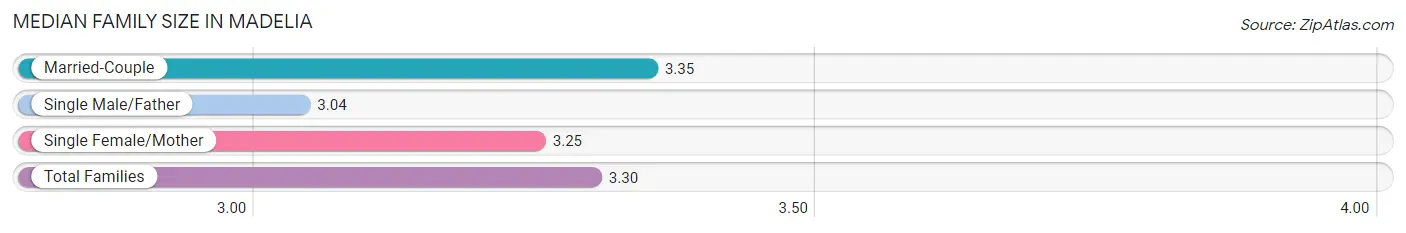
| Family Type | # Families | Family Size |
| Married-Couple | 383 (71.9%) | 3.35 |
| Single Male/Father | 47 (8.8%) | 3.04 |
| Single Female/Mother | 103 (19.3%) | 3.25 |
| Total Families | 533 (100.0%) | 3.30 |
Median Household Size in Madelia
The median household size in Madelia is 2.74 persons per household, with single female/mother households (103 | 12.4%) accounting for the largest median household size of 3.5 persons per household. non-family households (294 | 35.5%) represent the smallest median household size with 1.55 persons per household.
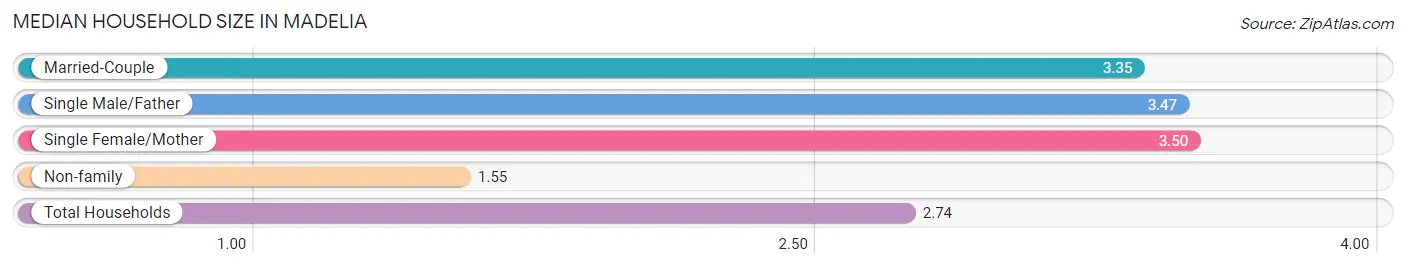
| Household Type | # Households | Household Size |
| Married-Couple | 383 (46.3%) | 3.35 |
| Single Male/Father | 47 (5.7%) | 3.47 |
| Single Female/Mother | 103 (12.4%) | 3.50 |
| Non-family | 294 (35.5%) | 1.55 |
| Total Households | 827 (100.0%) | 2.74 |
Household Size by Marriage Status in Madelia
Out of a total of 827 households in Madelia, 533 (64.4%) are family households, while 294 (35.5%) are nonfamily households. The most numerous type of family households are 2-person households, comprising 218, and the most common type of nonfamily households are 1-person households, comprising 227.
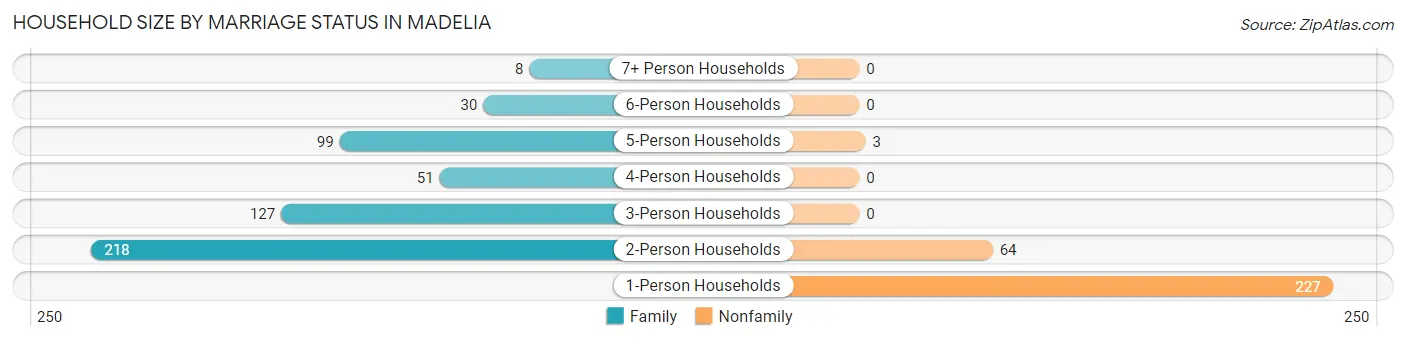
| Household Size | Family Households | Nonfamily Households |
| 1-Person Households | - | 227 (27.5%) |
| 2-Person Households | 218 (26.4%) | 64 (7.7%) |
| 3-Person Households | 127 (15.4%) | 0 (0.0%) |
| 4-Person Households | 51 (6.2%) | 0 (0.0%) |
| 5-Person Households | 99 (12.0%) | 3 (0.4%) |
| 6-Person Households | 30 (3.6%) | 0 (0.0%) |
| 7+ Person Households | 8 (1.0%) | 0 (0.0%) |
| Total | 533 (64.4%) | 294 (35.5%) |
Female Fertility in Madelia
Fertility by Age in Madelia
Average fertility rate in Madelia is 135.0 births per 1,000 women. Women in the age bracket of 20 to 34 years have the highest fertility rate with 203.0 births per 1,000 women. Women in the age bracket of 20 to 34 years acount for 79.4% of all women with births.
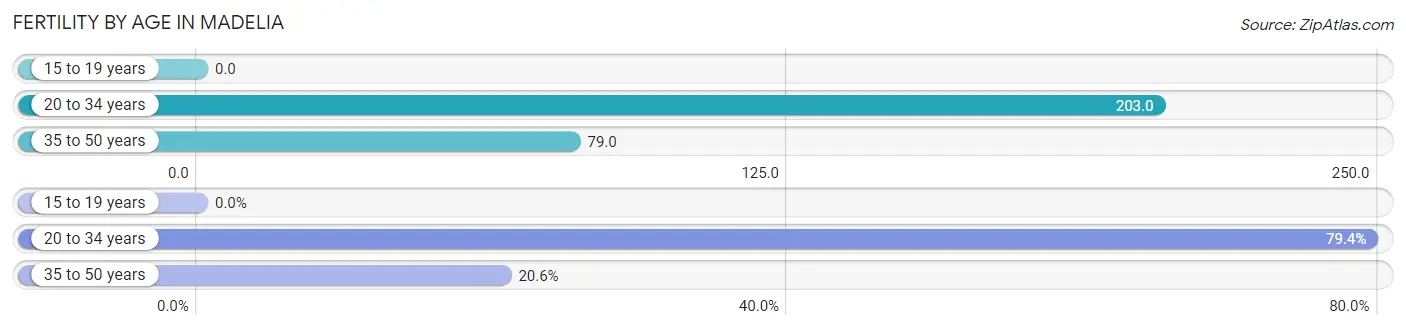
| Age Bracket | Women with Births | Births / 1,000 Women |
| 15 to 19 years | 0 (0.0%) | 0.0 |
| 20 to 34 years | 54 (79.4%) | 203.0 |
| 35 to 50 years | 14 (20.6%) | 79.0 |
| Total | 68 (100.0%) | 135.0 |
Fertility by Age by Marriage Status in Madelia
79.4% of women with births (68) in Madelia are married. The highest percentage of unmarried women with births falls into 35 to 50 years age bracket with 100.0% of them unmarried at the time of birth, while the lowest percentage of unmarried women with births belong to 20 to 34 years age bracket with 0.0% of them unmarried.
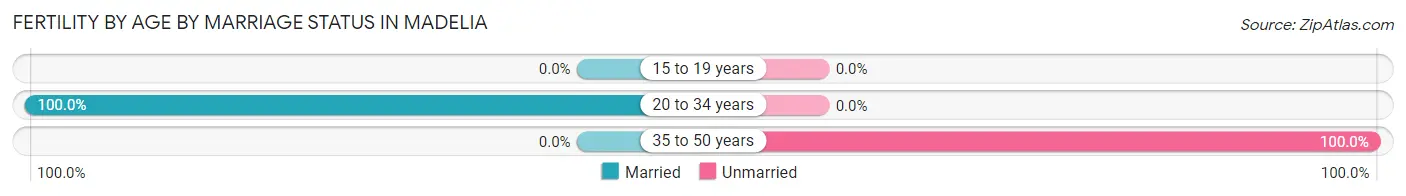
| Age Bracket | Married | Unmarried |
| 15 to 19 years | 0 (0.0%) | 0 (0.0%) |
| 20 to 34 years | 54 (100.0%) | 0 (0.0%) |
| 35 to 50 years | 0 (0.0%) | 14 (100.0%) |
| Total | 54 (79.4%) | 14 (20.6%) |
Fertility by Education in Madelia
Average fertility rate in Madelia is 135.0 births per 1,000 women. Women with the education attainment of less than high school have the highest fertility rate of 280.0 births per 1,000 women, while women with the education attainment of college or associate's degree have the lowest fertility at 16.0 births per 1,000 women. Women with the education attainment of less than high school represent 33.8% of all women with births.
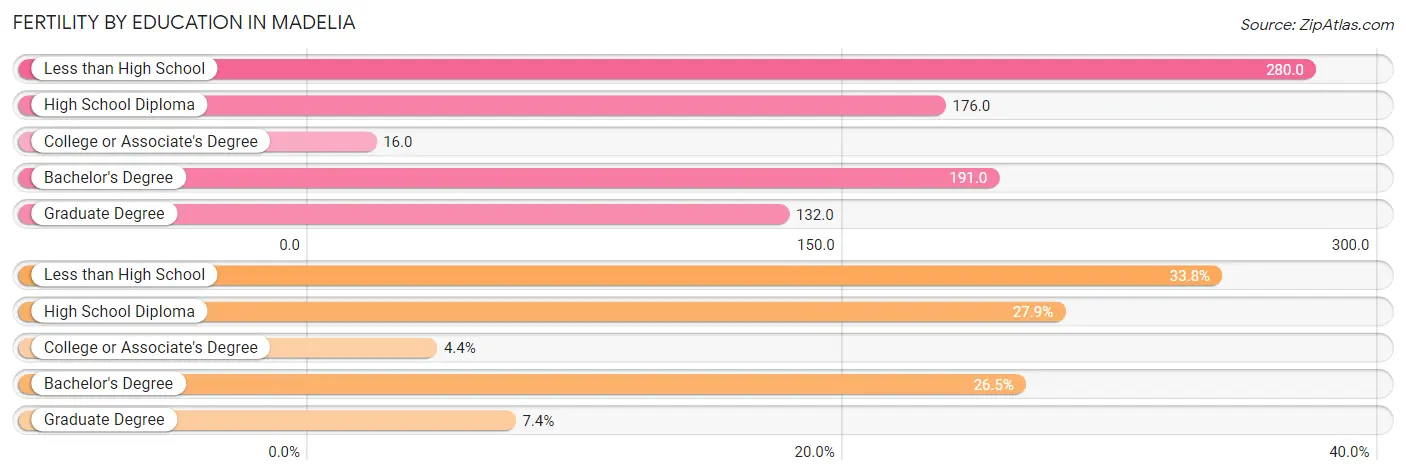
| Educational Attainment | Women with Births | Births / 1,000 Women |
| Less than High School | 23 (33.8%) | 280.0 |
| High School Diploma | 19 (27.9%) | 176.0 |
| College or Associate's Degree | 3 (4.4%) | 16.0 |
| Bachelor's Degree | 18 (26.5%) | 191.0 |
| Graduate Degree | 5 (7.3%) | 132.0 |
| Total | 68 (100.0%) | 135.0 |
Fertility by Education by Marriage Status in Madelia
20.6% of women with births in Madelia are unmarried. Women with the educational attainment of less than high school are most likely to be married with 100.0% of them married at childbirth, while women with the educational attainment of bachelor's degree are least likely to be married with 77.8% of them unmarried at childbirth.
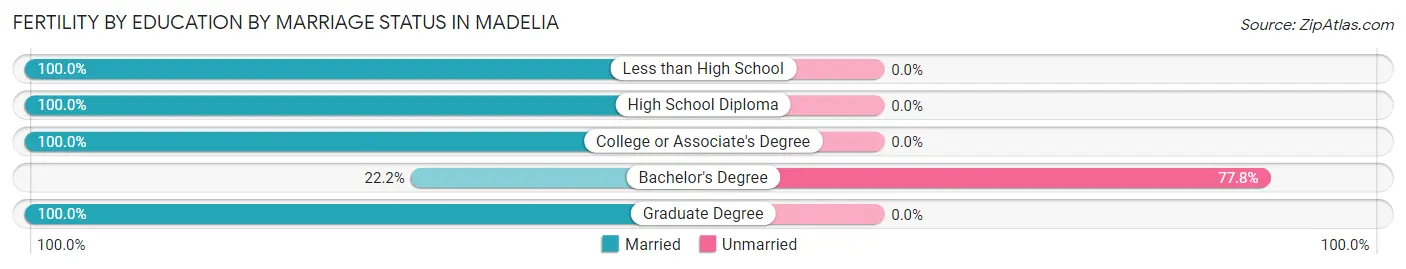
| Educational Attainment | Married | Unmarried |
| Less than High School | 23 (100.0%) | 0 (0.0%) |
| High School Diploma | 19 (100.0%) | 0 (0.0%) |
| College or Associate's Degree | 3 (100.0%) | 0 (0.0%) |
| Bachelor's Degree | 4 (22.2%) | 14 (77.8%) |
| Graduate Degree | 5 (100.0%) | 0 (0.0%) |
| Total | 54 (79.4%) | 14 (20.6%) |
Employment Characteristics in Madelia
Employment by Class of Employer in Madelia
Among the 1,263 employed individuals in Madelia, private company employees (891 | 70.6%), not-for-profit organizations (144 | 11.4%), and local government employees (90 | 7.1%) make up the most common classes of employment.
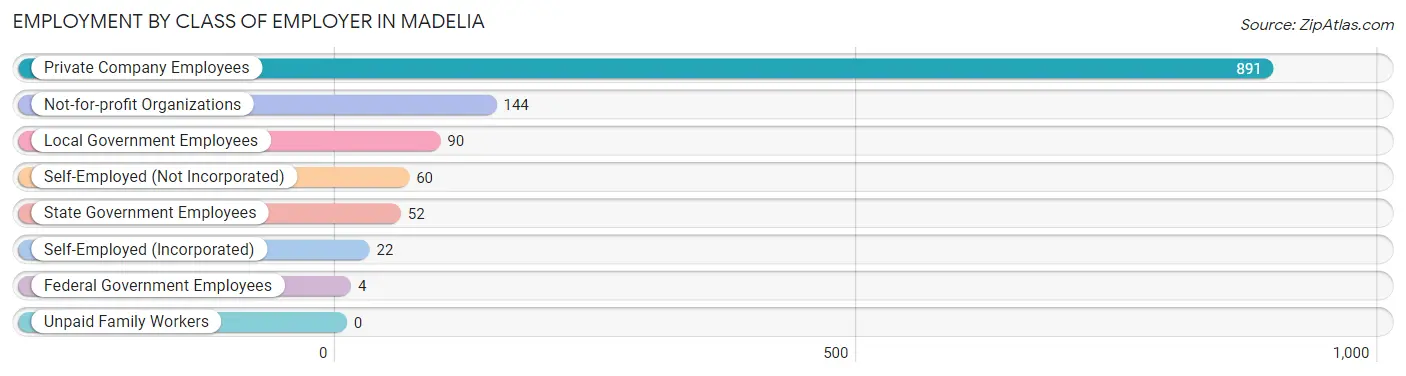
| Employer Class | # Employees | % Employees |
| Private Company Employees | 891 | 70.6% |
| Self-Employed (Incorporated) | 22 | 1.7% |
| Self-Employed (Not Incorporated) | 60 | 4.8% |
| Not-for-profit Organizations | 144 | 11.4% |
| Local Government Employees | 90 | 7.1% |
| State Government Employees | 52 | 4.1% |
| Federal Government Employees | 4 | 0.3% |
| Unpaid Family Workers | 0 | 0.0% |
| Total | 1,263 | 100.0% |
Employment Status by Age in Madelia
According to the labor force statistics for Madelia, out of the total population over 16 years of age (1,777), 73.7% or 1,310 individuals are in the labor force, with 3.4% or 45 of them unemployed. The age group with the highest labor force participation rate is 35 to 44 years, with 100.0% or 181 individuals in the labor force. Within the labor force, the 60 to 64 years age range has the highest percentage of unemployed individuals, with 19.3% or 16 of them being unemployed.
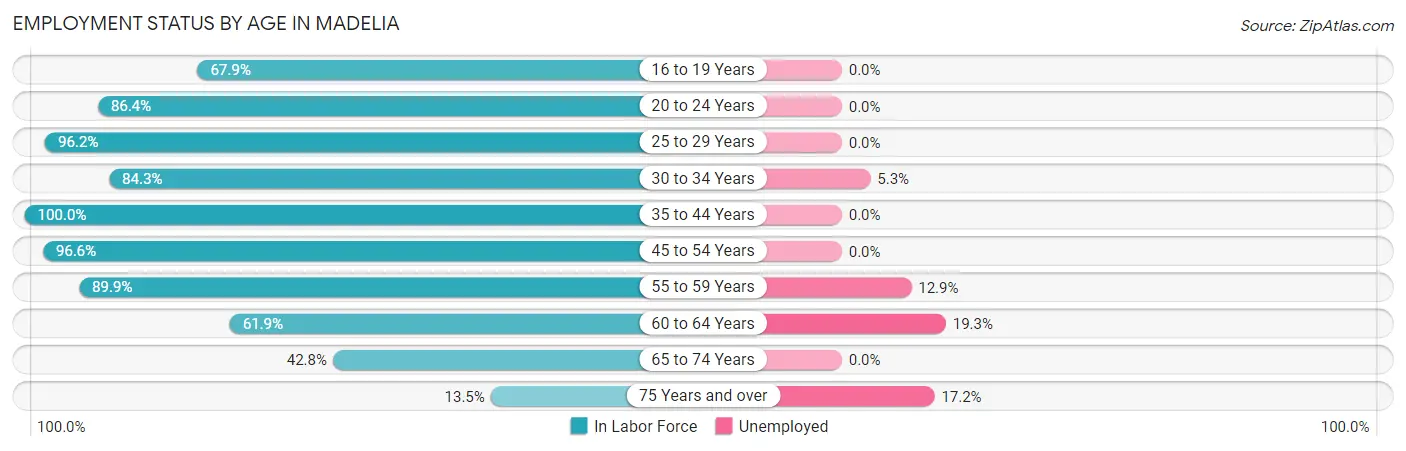
| Age Bracket | In Labor Force | Unemployed |
| 16 to 19 Years | 38 (67.9%) | 0 (0.0%) |
| 20 to 24 Years | 172 (86.4%) | 0 (0.0%) |
| 25 to 29 Years | 153 (96.2%) | 0 (0.0%) |
| 30 to 34 Years | 150 (84.3%) | 8 (5.3%) |
| 35 to 44 Years | 181 (100.0%) | 0 (0.0%) |
| 45 to 54 Years | 285 (96.6%) | 0 (0.0%) |
| 55 to 59 Years | 124 (89.9%) | 16 (12.9%) |
| 60 to 64 Years | 83 (61.9%) | 16 (19.3%) |
| 65 to 74 Years | 95 (42.8%) | 0 (0.0%) |
| 75 Years and over | 29 (13.5%) | 5 (17.2%) |
| Total | 1,310 (73.7%) | 45 (3.4%) |
Employment Status by Educational Attainment in Madelia
According to labor force statistics for Madelia, 90.0% of individuals (976) out of the total population between 25 and 64 years of age (1,085) are in the labor force, with 4.1% or 40 of them being unemployed. The group with the highest labor force participation rate are those with the educational attainment of less than high school, with 93.5% or 130 individuals in the labor force. Within the labor force, individuals with bachelor's degree or higher education have the highest percentage of unemployment, with 9.0% or 20 of them being unemployed.
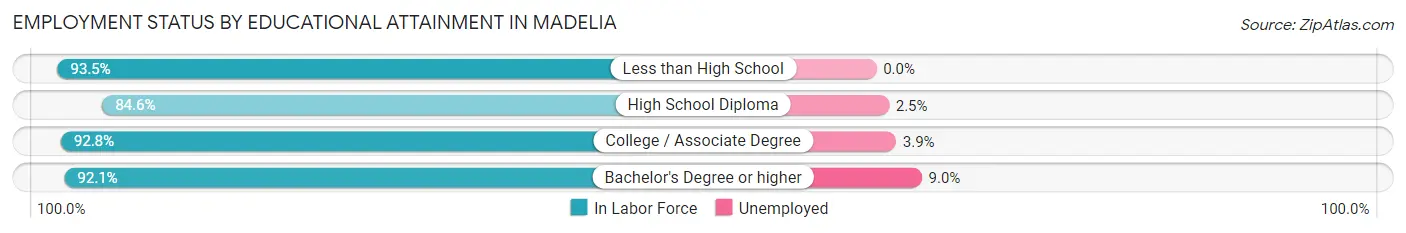
| Educational Attainment | In Labor Force | Unemployed |
| Less than High School | 130 (93.5%) | 0 (0.0%) |
| High School Diploma | 314 (84.6%) | 9 (2.5%) |
| College / Associate Degree | 311 (92.8%) | 13 (3.9%) |
| Bachelor's Degree or higher | 221 (92.1%) | 22 (9.0%) |
| Total | 976 (90.0%) | 44 (4.1%) |
Employment Occupations by Sex in Madelia
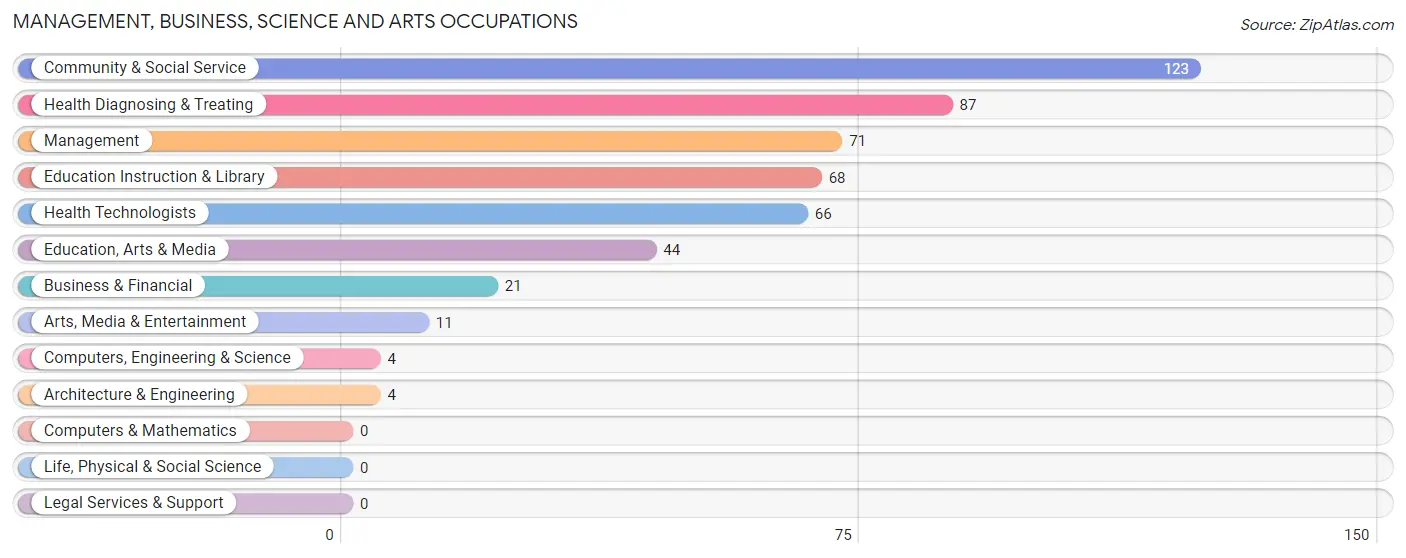
Management, Business, Science and Arts Occupations
The most common Management, Business, Science and Arts occupations in Madelia are Community & Social Service (123 | 9.7%), Health Diagnosing & Treating (87 | 6.9%), Management (71 | 5.6%), Education Instruction & Library (68 | 5.4%), and Health Technologists (66 | 5.2%).
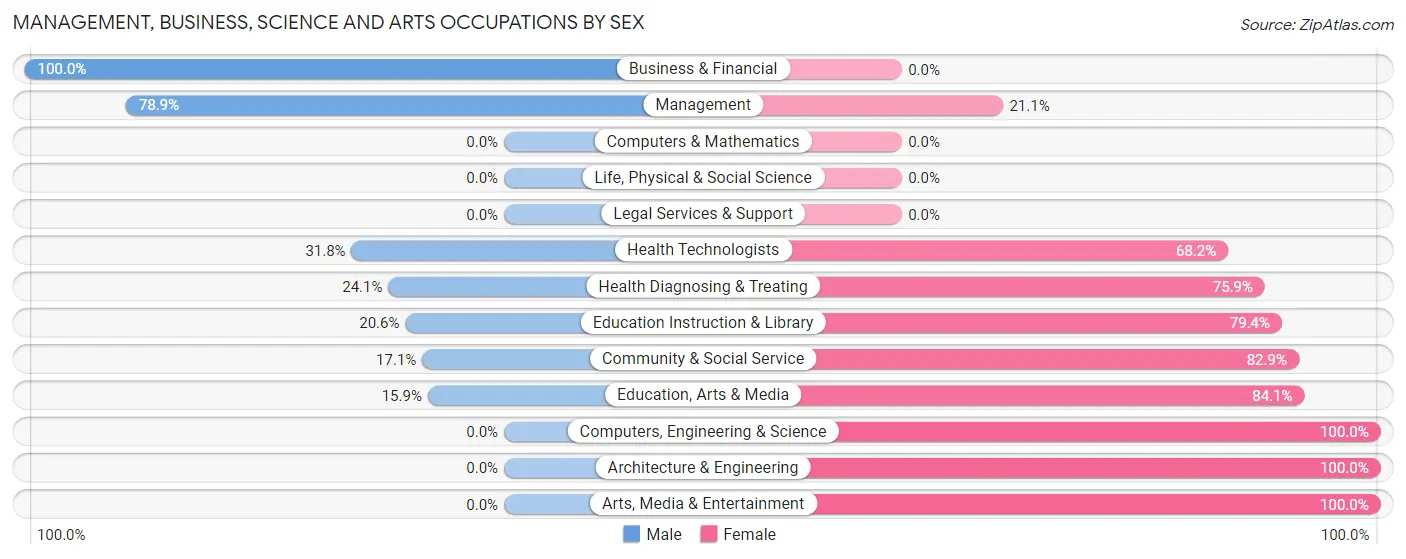
Management, Business, Science and Arts Occupations by Sex
Within the Management, Business, Science and Arts occupations in Madelia, the most male-oriented occupations are Business & Financial (100.0%), Management (78.9%), and Health Technologists (31.8%), while the most female-oriented occupations are Computers, Engineering & Science (100.0%), Architecture & Engineering (100.0%), and Arts, Media & Entertainment (100.0%).
| Occupation | Male | Female |
| Management | 56 (78.9%) | 15 (21.1%) |
| Business & Financial | 21 (100.0%) | 0 (0.0%) |
| Computers, Engineering & Science | 0 (0.0%) | 4 (100.0%) |
| Computers & Mathematics | 0 (0.0%) | 0 (0.0%) |
| Architecture & Engineering | 0 (0.0%) | 4 (100.0%) |
| Life, Physical & Social Science | 0 (0.0%) | 0 (0.0%) |
| Community & Social Service | 21 (17.1%) | 102 (82.9%) |
| Education, Arts & Media | 7 (15.9%) | 37 (84.1%) |
| Legal Services & Support | 0 (0.0%) | 0 (0.0%) |
| Education Instruction & Library | 14 (20.6%) | 54 (79.4%) |
| Arts, Media & Entertainment | 0 (0.0%) | 11 (100.0%) |
| Health Diagnosing & Treating | 21 (24.1%) | 66 (75.9%) |
| Health Technologists | 21 (31.8%) | 45 (68.2%) |
| Total (Category) | 119 (38.9%) | 187 (61.1%) |
| Total (Overall) | 654 (51.7%) | 611 (48.3%) |
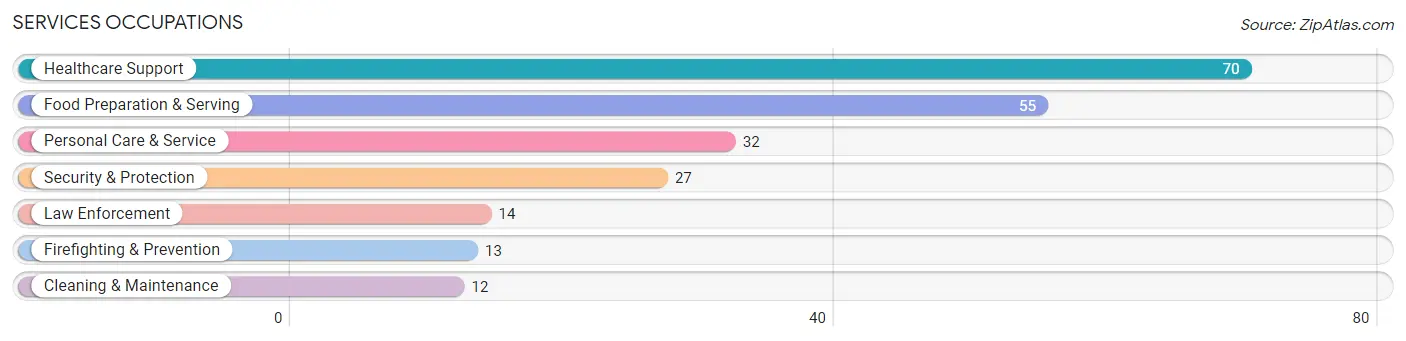
Services Occupations
The most common Services occupations in Madelia are Healthcare Support (70 | 5.5%), Food Preparation & Serving (55 | 4.3%), Personal Care & Service (32 | 2.5%), Security & Protection (27 | 2.1%), and Law Enforcement (14 | 1.1%).
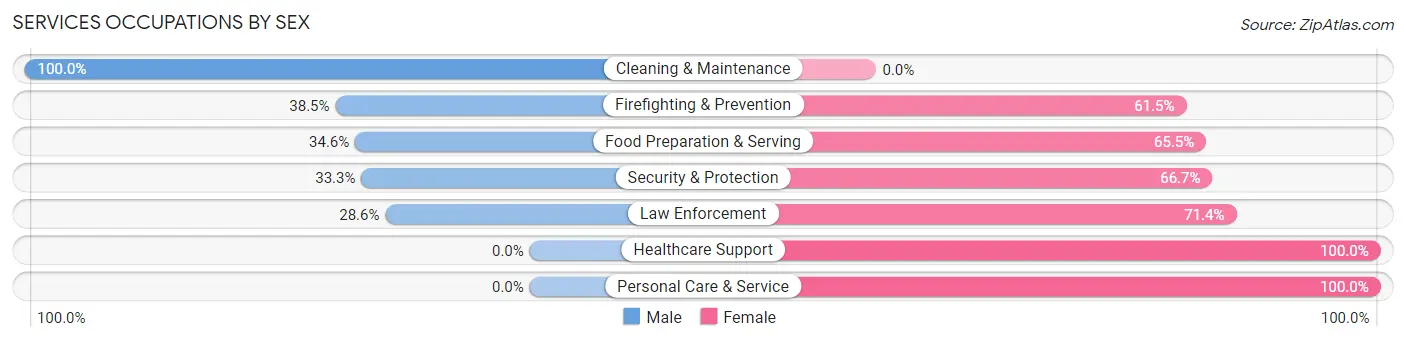
Services Occupations by Sex
Within the Services occupations in Madelia, the most male-oriented occupations are Cleaning & Maintenance (100.0%), Firefighting & Prevention (38.5%), and Food Preparation & Serving (34.5%), while the most female-oriented occupations are Healthcare Support (100.0%), Personal Care & Service (100.0%), and Law Enforcement (71.4%).
| Occupation | Male | Female |
| Healthcare Support | 0 (0.0%) | 70 (100.0%) |
| Security & Protection | 9 (33.3%) | 18 (66.7%) |
| Firefighting & Prevention | 5 (38.5%) | 8 (61.5%) |
| Law Enforcement | 4 (28.6%) | 10 (71.4%) |
| Food Preparation & Serving | 19 (34.5%) | 36 (65.4%) |
| Cleaning & Maintenance | 12 (100.0%) | 0 (0.0%) |
| Personal Care & Service | 0 (0.0%) | 32 (100.0%) |
| Total (Category) | 40 (20.4%) | 156 (79.6%) |
| Total (Overall) | 654 (51.7%) | 611 (48.3%) |
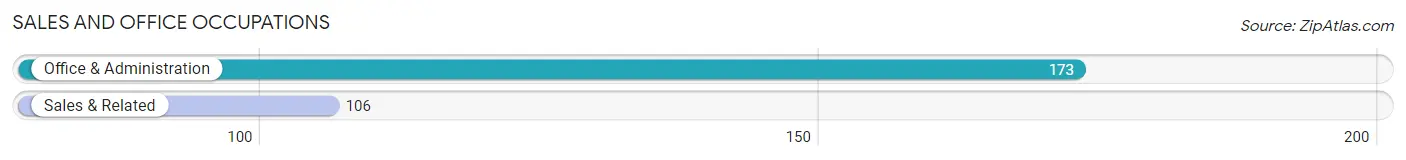
Sales and Office Occupations
The most common Sales and Office occupations in Madelia are Office & Administration (173 | 13.7%), and Sales & Related (106 | 8.4%).
Sales and Office Occupations by Sex
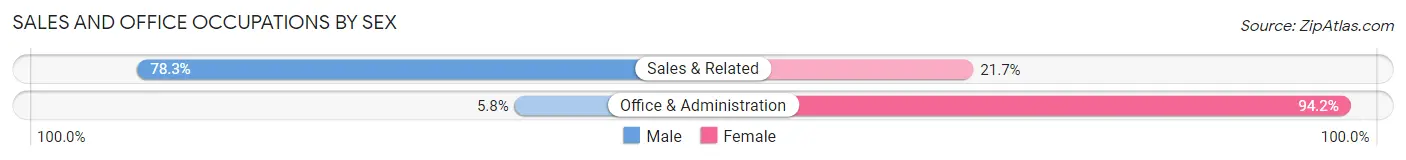
| Occupation | Male | Female |
| Sales & Related | 83 (78.3%) | 23 (21.7%) |
| Office & Administration | 10 (5.8%) | 163 (94.2%) |
| Total (Category) | 93 (33.3%) | 186 (66.7%) |
| Total (Overall) | 654 (51.7%) | 611 (48.3%) |
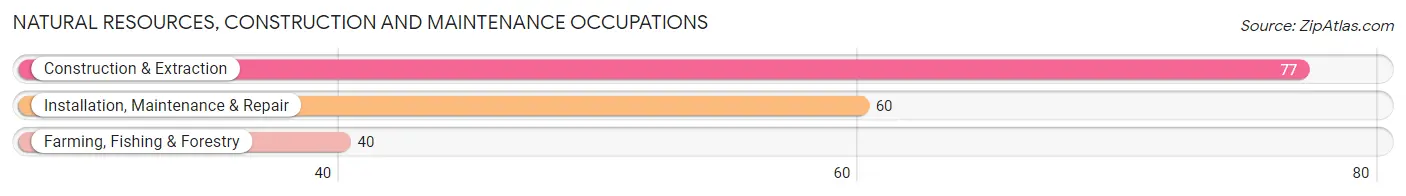
Natural Resources, Construction and Maintenance Occupations
The most common Natural Resources, Construction and Maintenance occupations in Madelia are Construction & Extraction (77 | 6.1%), Installation, Maintenance & Repair (60 | 4.7%), and Farming, Fishing & Forestry (40 | 3.2%).
Natural Resources, Construction and Maintenance Occupations by Sex
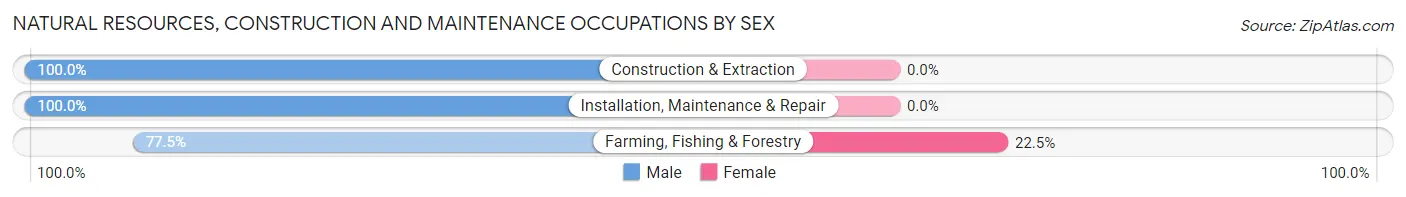
| Occupation | Male | Female |
| Farming, Fishing & Forestry | 31 (77.5%) | 9 (22.5%) |
| Construction & Extraction | 77 (100.0%) | 0 (0.0%) |
| Installation, Maintenance & Repair | 60 (100.0%) | 0 (0.0%) |
| Total (Category) | 168 (94.9%) | 9 (5.1%) |
| Total (Overall) | 654 (51.7%) | 611 (48.3%) |
Production, Transportation and Moving Occupations
The most common Production, Transportation and Moving occupations in Madelia are Transportation (120 | 9.5%), Production (113 | 8.9%), and Material Moving (74 | 5.9%).
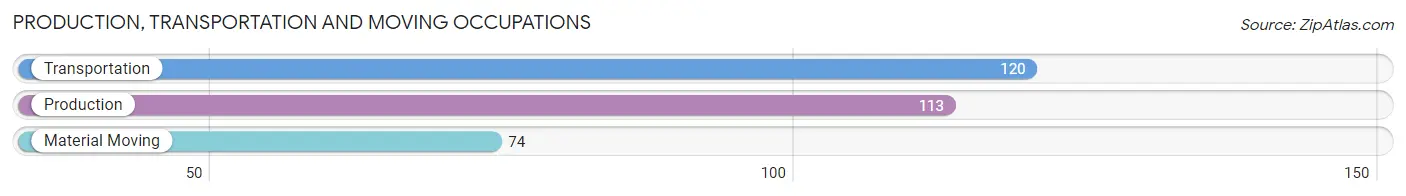
Production, Transportation and Moving Occupations by Sex
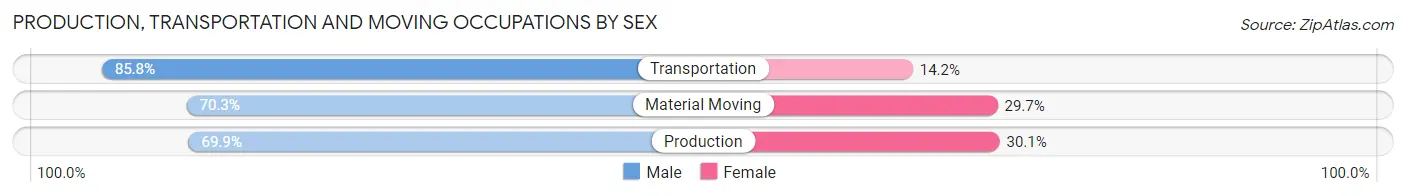
| Occupation | Male | Female |
| Production | 79 (69.9%) | 34 (30.1%) |
| Transportation | 103 (85.8%) | 17 (14.2%) |
| Material Moving | 52 (70.3%) | 22 (29.7%) |
| Total (Category) | 234 (76.2%) | 73 (23.8%) |
| Total (Overall) | 654 (51.7%) | 611 (48.3%) |
Employment Industries by Sex in Madelia
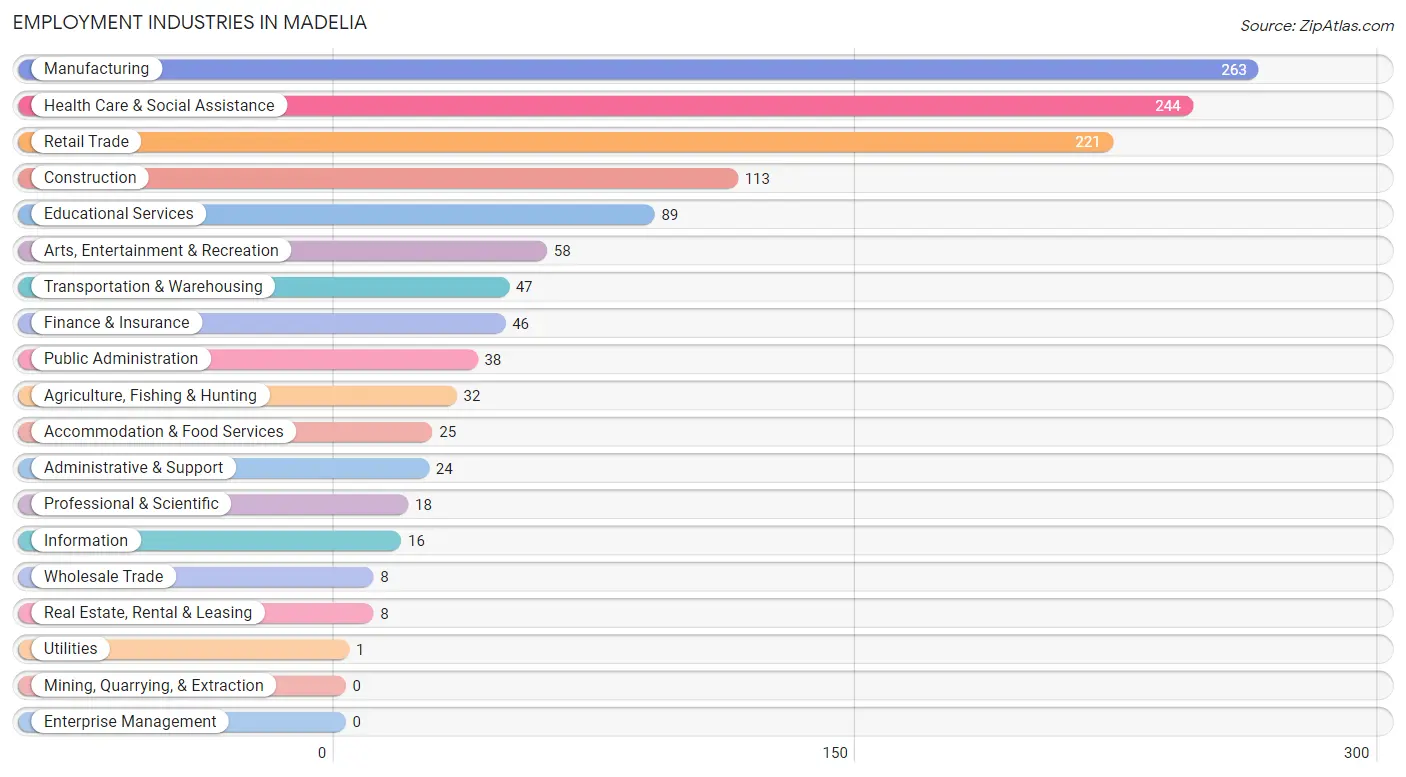
Employment Industries in Madelia
The major employment industries in Madelia include Manufacturing (263 | 20.8%), Health Care & Social Assistance (244 | 19.3%), Retail Trade (221 | 17.5%), Construction (113 | 8.9%), and Educational Services (89 | 7.0%).
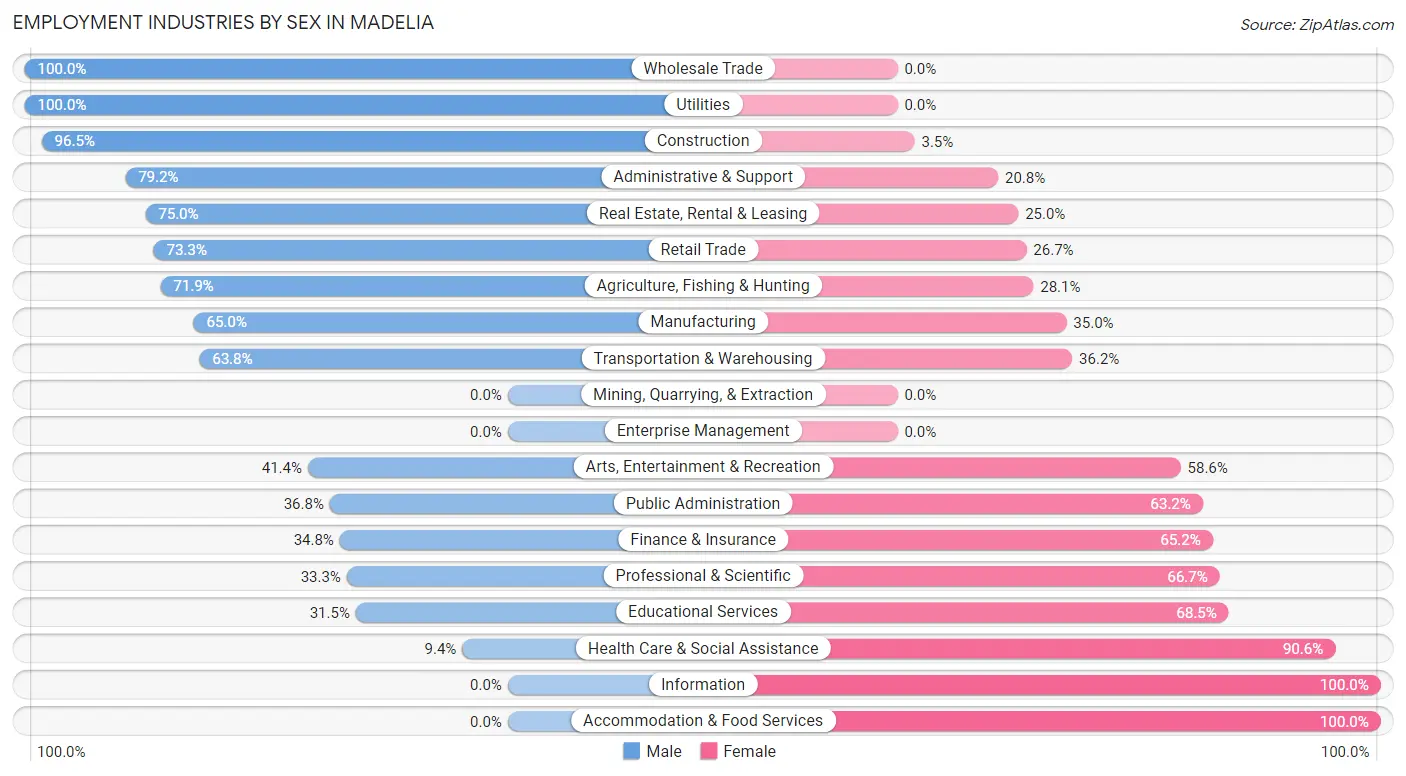
Employment Industries by Sex in Madelia
The Madelia industries that see more men than women are Wholesale Trade (100.0%), Utilities (100.0%), and Construction (96.5%), whereas the industries that tend to have a higher number of women are Information (100.0%), Accommodation & Food Services (100.0%), and Health Care & Social Assistance (90.6%).
| Industry | Male | Female |
| Agriculture, Fishing & Hunting | 23 (71.9%) | 9 (28.1%) |
| Mining, Quarrying, & Extraction | 0 (0.0%) | 0 (0.0%) |
| Construction | 109 (96.5%) | 4 (3.5%) |
| Manufacturing | 171 (65.0%) | 92 (35.0%) |
| Wholesale Trade | 8 (100.0%) | 0 (0.0%) |
| Retail Trade | 162 (73.3%) | 59 (26.7%) |
| Transportation & Warehousing | 30 (63.8%) | 17 (36.2%) |
| Utilities | 1 (100.0%) | 0 (0.0%) |
| Information | 0 (0.0%) | 16 (100.0%) |
| Finance & Insurance | 16 (34.8%) | 30 (65.2%) |
| Real Estate, Rental & Leasing | 6 (75.0%) | 2 (25.0%) |
| Professional & Scientific | 6 (33.3%) | 12 (66.7%) |
| Enterprise Management | 0 (0.0%) | 0 (0.0%) |
| Administrative & Support | 19 (79.2%) | 5 (20.8%) |
| Educational Services | 28 (31.5%) | 61 (68.5%) |
| Health Care & Social Assistance | 23 (9.4%) | 221 (90.6%) |
| Arts, Entertainment & Recreation | 24 (41.4%) | 34 (58.6%) |
| Accommodation & Food Services | 0 (0.0%) | 25 (100.0%) |
| Public Administration | 14 (36.8%) | 24 (63.2%) |
| Total | 654 (51.7%) | 611 (48.3%) |
Education in Madelia
School Enrollment in Madelia
The most common levels of schooling among the 509 students in Madelia are college / undergraduate (103 | 20.2%), nursery / preschool (93 | 18.3%), and high school (93 | 18.3%).
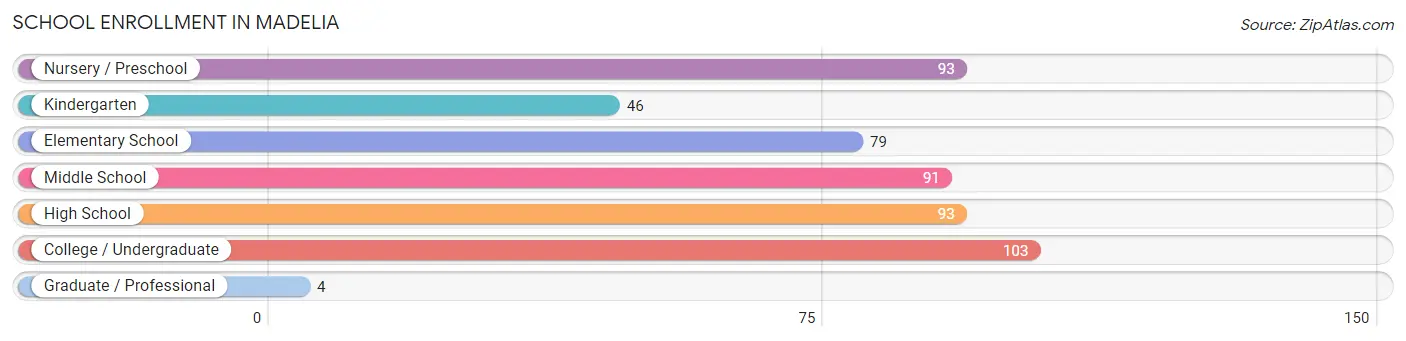
| School Level | # Students | % Students |
| Nursery / Preschool | 93 | 18.3% |
| Kindergarten | 46 | 9.0% |
| Elementary School | 79 | 15.5% |
| Middle School | 91 | 17.9% |
| High School | 93 | 18.3% |
| College / Undergraduate | 103 | 20.2% |
| Graduate / Professional | 4 | 0.8% |
| Total | 509 | 100.0% |
School Enrollment by Age by Funding Source in Madelia
Out of a total of 509 students who are enrolled in schools in Madelia, 72 (14.1%) attend a private institution, while the remaining 437 (85.9%) are enrolled in public schools. The age group of 25 to 34 year olds has the highest likelihood of being enrolled in private schools, with 22 (55.0% in the age bracket) enrolled. Conversely, the age group of 3 to 4 year olds has the lowest likelihood of being enrolled in a private school, with 40 (100.0% in the age bracket) attending a public institution.
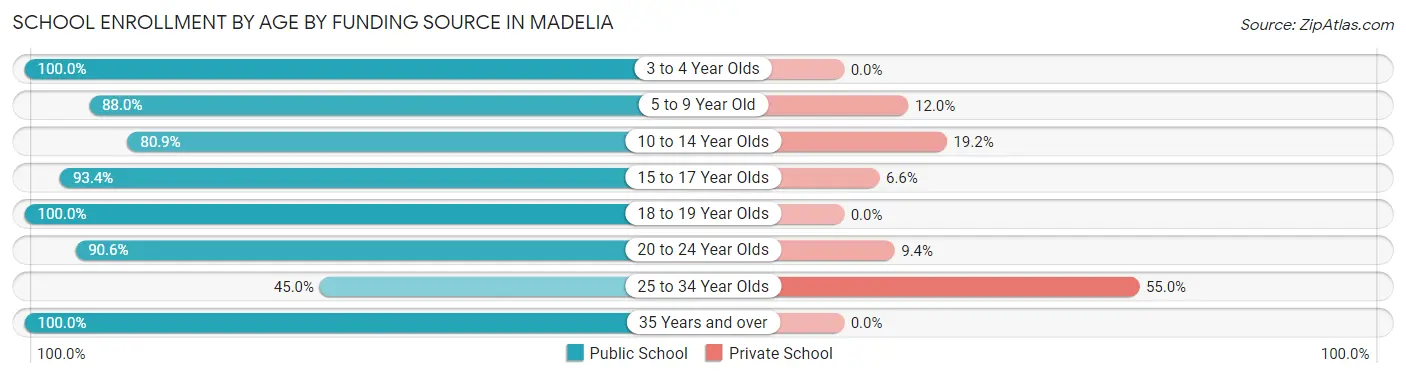
| Age Bracket | Public School | Private School |
| 3 to 4 Year Olds | 40 (100.0%) | 0 (0.0%) |
| 5 to 9 Year Old | 154 (88.0%) | 21 (12.0%) |
| 10 to 14 Year Olds | 76 (80.8%) | 18 (19.2%) |
| 15 to 17 Year Olds | 85 (93.4%) | 6 (6.6%) |
| 18 to 19 Year Olds | 5 (100.0%) | 0 (0.0%) |
| 20 to 24 Year Olds | 48 (90.6%) | 5 (9.4%) |
| 25 to 34 Year Olds | 18 (45.0%) | 22 (55.0%) |
| 35 Years and over | 11 (100.0%) | 0 (0.0%) |
| Total | 437 (85.9%) | 72 (14.1%) |
Educational Attainment by Field of Study in Madelia
Bio, nature & agricultural (64 | 20.1%), business (52 | 16.3%), education (46 | 14.4%), visual & performing arts (43 | 13.5%), and literature & languages (36 | 11.3%) are the most common fields of study among 319 individuals in Madelia who have obtained a bachelor's degree or higher.
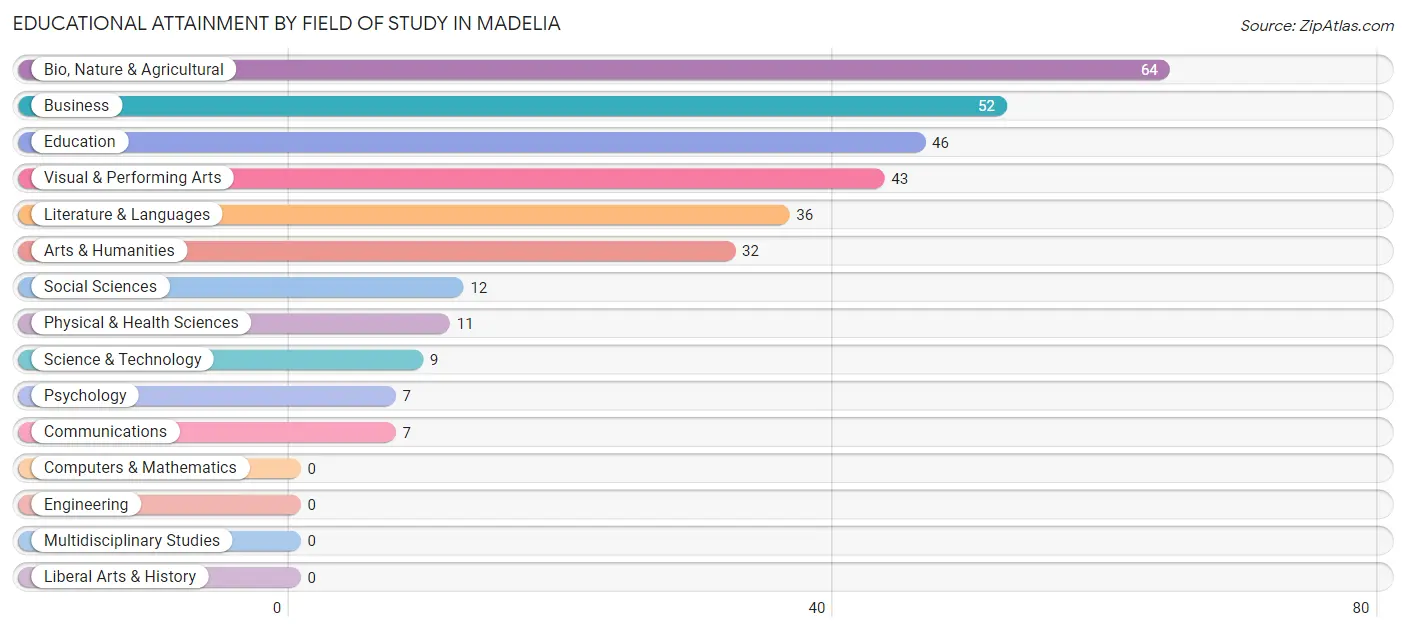
| Field of Study | # Graduates | % Graduates |
| Computers & Mathematics | 0 | 0.0% |
| Bio, Nature & Agricultural | 64 | 20.1% |
| Physical & Health Sciences | 11 | 3.5% |
| Psychology | 7 | 2.2% |
| Social Sciences | 12 | 3.8% |
| Engineering | 0 | 0.0% |
| Multidisciplinary Studies | 0 | 0.0% |
| Science & Technology | 9 | 2.8% |
| Business | 52 | 16.3% |
| Education | 46 | 14.4% |
| Literature & Languages | 36 | 11.3% |
| Liberal Arts & History | 0 | 0.0% |
| Visual & Performing Arts | 43 | 13.5% |
| Communications | 7 | 2.2% |
| Arts & Humanities | 32 | 10.0% |
| Total | 319 | 100.0% |
Transportation & Commute in Madelia
Vehicle Availability by Sex in Madelia
The most prevalent vehicle ownership categories in Madelia are males with 2 vehicles (268, accounting for 41.1%) and females with 2 vehicles (210, making up 44.3%).
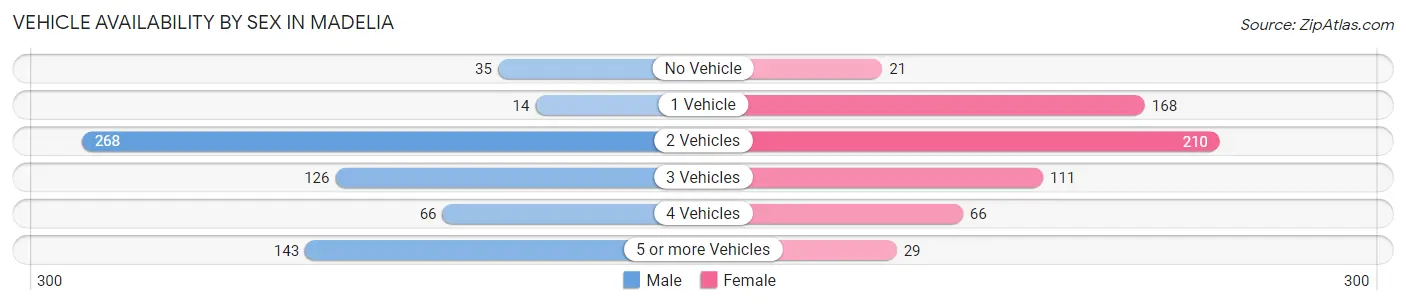
| Vehicles Available | Male | Female |
| No Vehicle | 35 (5.4%) | 21 (3.5%) |
| 1 Vehicle | 14 (2.1%) | 168 (27.8%) |
| 2 Vehicles | 268 (41.1%) | 210 (34.7%) |
| 3 Vehicles | 126 (19.3%) | 111 (18.3%) |
| 4 Vehicles | 66 (10.1%) | 66 (10.9%) |
| 5 or more Vehicles | 143 (21.9%) | 29 (4.8%) |
| Total | 652 (100.0%) | 605 (100.0%) |
Commute Time in Madelia
The most frequently occuring commute durations in Madelia are 5 to 9 minutes (440 commuters, 35.2%), 20 to 24 minutes (187 commuters, 15.0%), and less than 5 minutes (129 commuters, 10.3%).
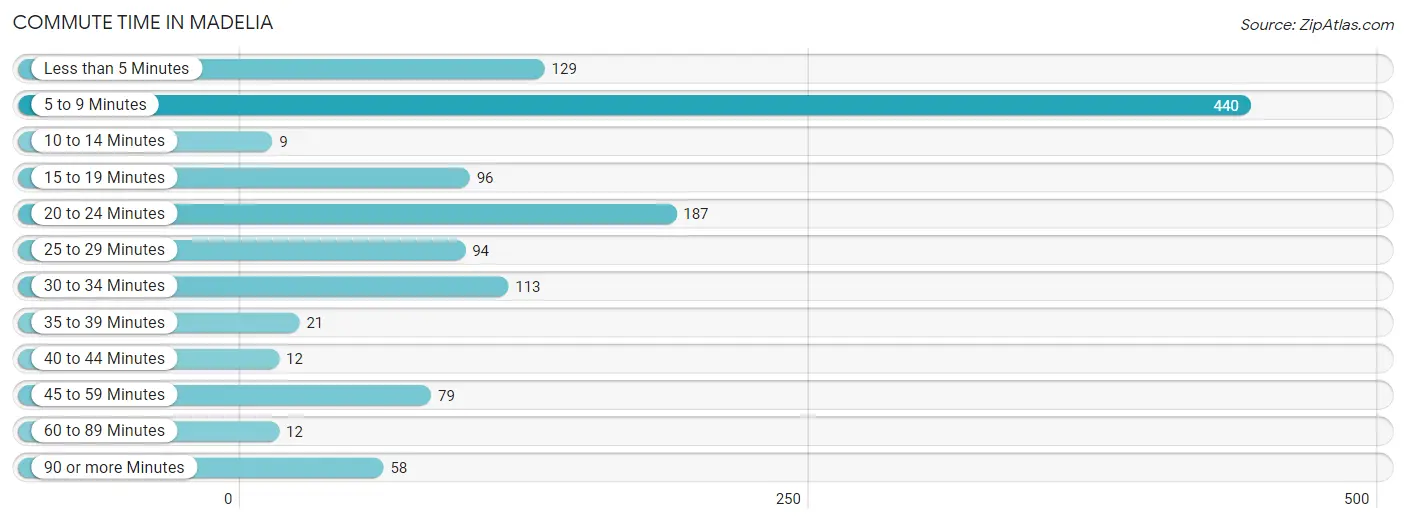
| Commute Time | # Commuters | % Commuters |
| Less than 5 Minutes | 129 | 10.3% |
| 5 to 9 Minutes | 440 | 35.2% |
| 10 to 14 Minutes | 9 | 0.7% |
| 15 to 19 Minutes | 96 | 7.7% |
| 20 to 24 Minutes | 187 | 15.0% |
| 25 to 29 Minutes | 94 | 7.5% |
| 30 to 34 Minutes | 113 | 9.0% |
| 35 to 39 Minutes | 21 | 1.7% |
| 40 to 44 Minutes | 12 | 1.0% |
| 45 to 59 Minutes | 79 | 6.3% |
| 60 to 89 Minutes | 12 | 1.0% |
| 90 or more Minutes | 58 | 4.6% |
Commute Time by Sex in Madelia
The most common commute times in Madelia are 5 to 9 minutes (185 commuters, 28.7%) for males and 5 to 9 minutes (255 commuters, 42.1%) for females.
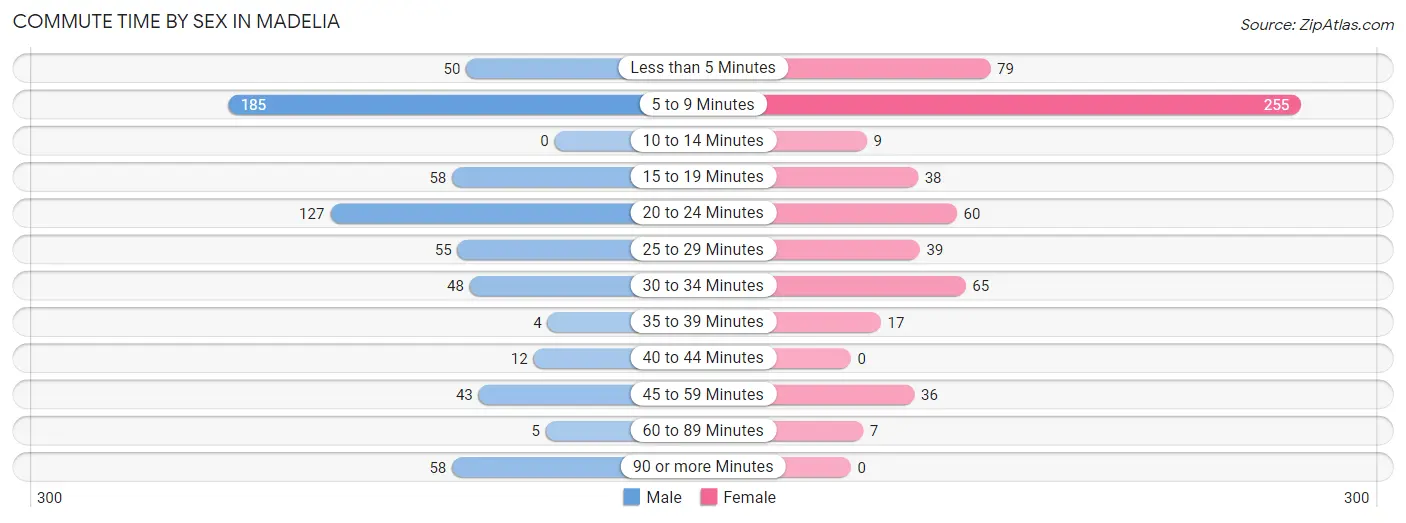
| Commute Time | Male | Female |
| Less than 5 Minutes | 50 (7.7%) | 79 (13.1%) |
| 5 to 9 Minutes | 185 (28.7%) | 255 (42.1%) |
| 10 to 14 Minutes | 0 (0.0%) | 9 (1.5%) |
| 15 to 19 Minutes | 58 (9.0%) | 38 (6.3%) |
| 20 to 24 Minutes | 127 (19.7%) | 60 (9.9%) |
| 25 to 29 Minutes | 55 (8.5%) | 39 (6.5%) |
| 30 to 34 Minutes | 48 (7.4%) | 65 (10.7%) |
| 35 to 39 Minutes | 4 (0.6%) | 17 (2.8%) |
| 40 to 44 Minutes | 12 (1.9%) | 0 (0.0%) |
| 45 to 59 Minutes | 43 (6.7%) | 36 (5.9%) |
| 60 to 89 Minutes | 5 (0.8%) | 7 (1.2%) |
| 90 or more Minutes | 58 (9.0%) | 0 (0.0%) |
Time of Departure to Work by Sex in Madelia
The most frequent times of departure to work in Madelia are 7:00 AM to 7:29 AM (116, 18.0%) for males and 7:00 AM to 7:29 AM (81, 13.4%) for females.
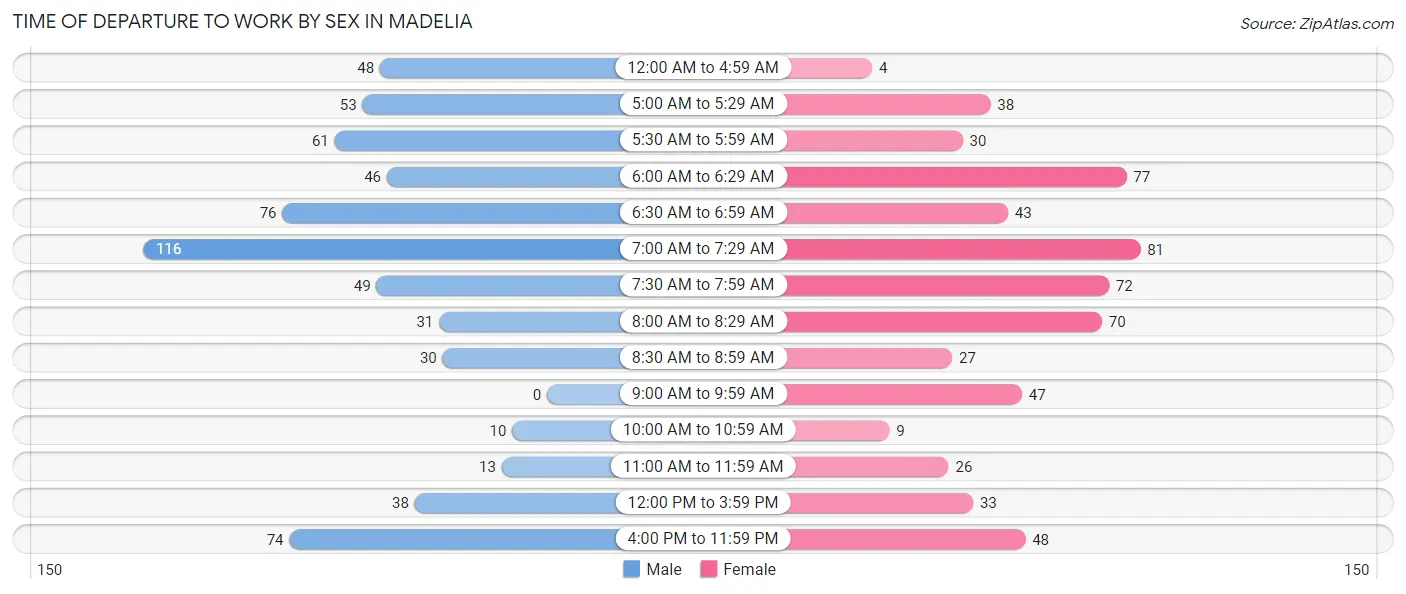
| Time of Departure | Male | Female |
| 12:00 AM to 4:59 AM | 48 (7.4%) | 4 (0.7%) |
| 5:00 AM to 5:29 AM | 53 (8.2%) | 38 (6.3%) |
| 5:30 AM to 5:59 AM | 61 (9.5%) | 30 (5.0%) |
| 6:00 AM to 6:29 AM | 46 (7.1%) | 77 (12.7%) |
| 6:30 AM to 6:59 AM | 76 (11.8%) | 43 (7.1%) |
| 7:00 AM to 7:29 AM | 116 (18.0%) | 81 (13.4%) |
| 7:30 AM to 7:59 AM | 49 (7.6%) | 72 (11.9%) |
| 8:00 AM to 8:29 AM | 31 (4.8%) | 70 (11.6%) |
| 8:30 AM to 8:59 AM | 30 (4.6%) | 27 (4.5%) |
| 9:00 AM to 9:59 AM | 0 (0.0%) | 47 (7.8%) |
| 10:00 AM to 10:59 AM | 10 (1.5%) | 9 (1.5%) |
| 11:00 AM to 11:59 AM | 13 (2.0%) | 26 (4.3%) |
| 12:00 PM to 3:59 PM | 38 (5.9%) | 33 (5.4%) |
| 4:00 PM to 11:59 PM | 74 (11.5%) | 48 (7.9%) |
| Total | 645 (100.0%) | 605 (100.0%) |
Housing Occupancy in Madelia
Occupancy by Ownership in Madelia
Of the total 827 dwellings in Madelia, owner-occupied units account for 600 (72.6%), while renter-occupied units make up 227 (27.5%).
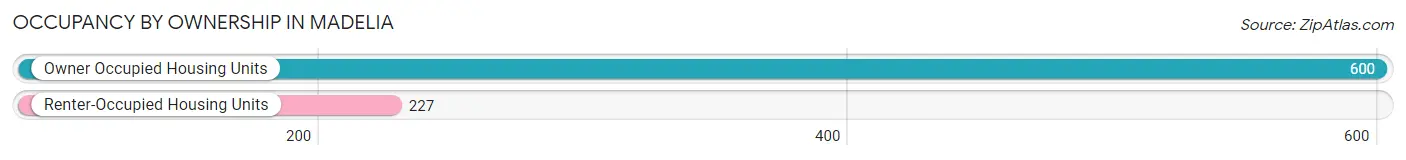
| Occupancy | # Housing Units | % Housing Units |
| Owner Occupied Housing Units | 600 | 72.6% |
| Renter-Occupied Housing Units | 227 | 27.5% |
| Total Occupied Housing Units | 827 | 100.0% |
Occupancy by Household Size in Madelia
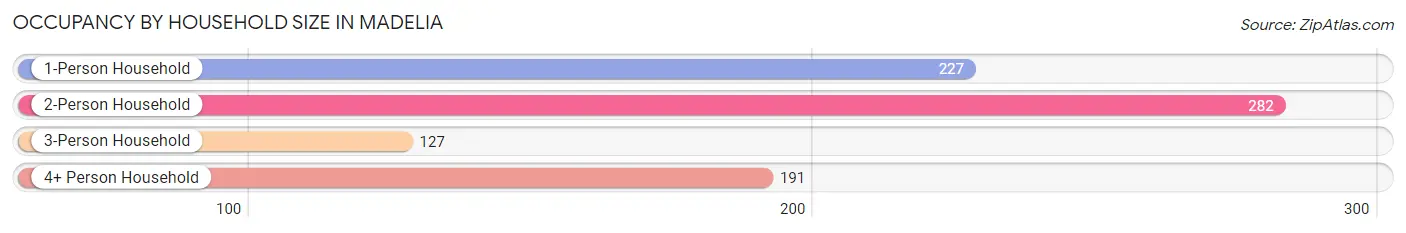
| Household Size | # Housing Units | % Housing Units |
| 1-Person Household | 227 | 27.5% |
| 2-Person Household | 282 | 34.1% |
| 3-Person Household | 127 | 15.4% |
| 4+ Person Household | 191 | 23.1% |
| Total Housing Units | 827 | 100.0% |
Occupancy by Ownership by Household Size in Madelia
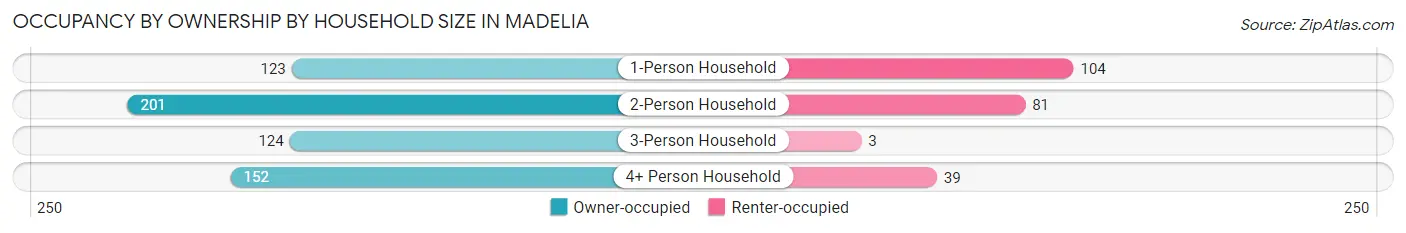
| Household Size | Owner-occupied | Renter-occupied |
| 1-Person Household | 123 (54.2%) | 104 (45.8%) |
| 2-Person Household | 201 (71.3%) | 81 (28.7%) |
| 3-Person Household | 124 (97.6%) | 3 (2.4%) |
| 4+ Person Household | 152 (79.6%) | 39 (20.4%) |
| Total Housing Units | 600 (72.6%) | 227 (27.5%) |
Occupancy by Educational Attainment in Madelia
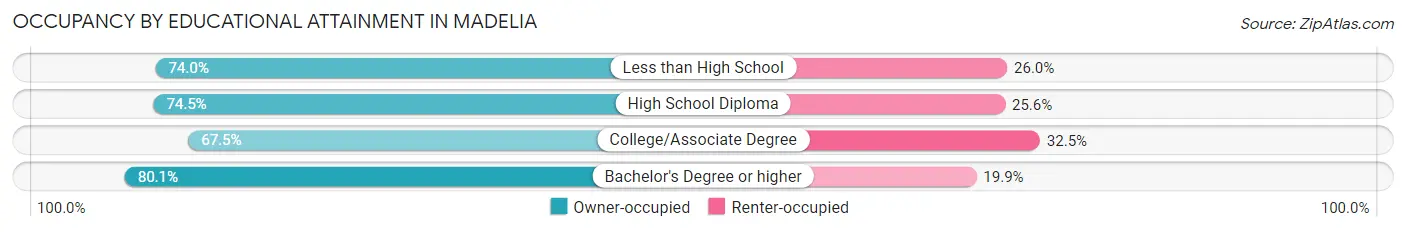
| Household Size | Owner-occupied | Renter-occupied |
| Less than High School | 77 (74.0%) | 27 (26.0%) |
| High School Diploma | 169 (74.5%) | 58 (25.6%) |
| College/Associate Degree | 233 (67.5%) | 112 (32.5%) |
| Bachelor's Degree or higher | 121 (80.1%) | 30 (19.9%) |
Occupancy by Age of Householder in Madelia
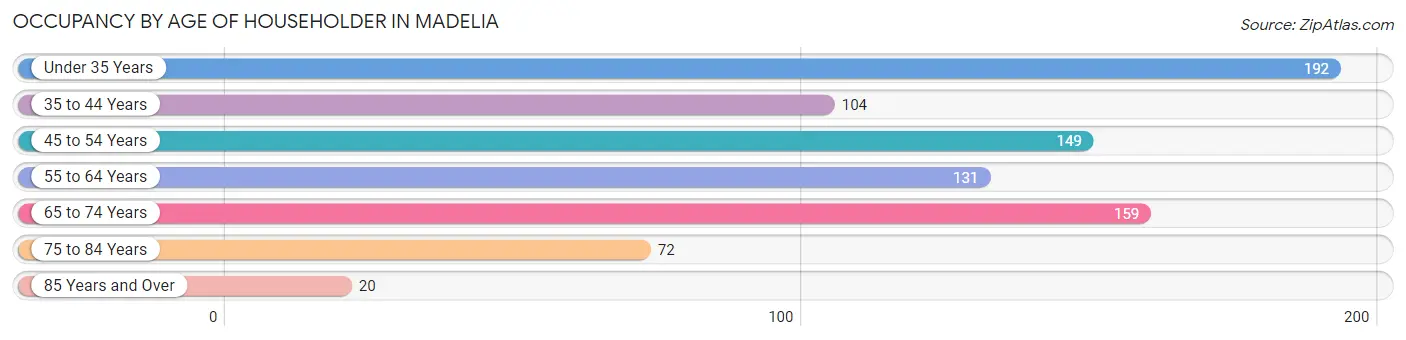
| Age Bracket | # Households | % Households |
| Under 35 Years | 192 | 23.2% |
| 35 to 44 Years | 104 | 12.6% |
| 45 to 54 Years | 149 | 18.0% |
| 55 to 64 Years | 131 | 15.8% |
| 65 to 74 Years | 159 | 19.2% |
| 75 to 84 Years | 72 | 8.7% |
| 85 Years and Over | 20 | 2.4% |
| Total | 827 | 100.0% |
Housing Finances in Madelia
Median Income by Occupancy in Madelia
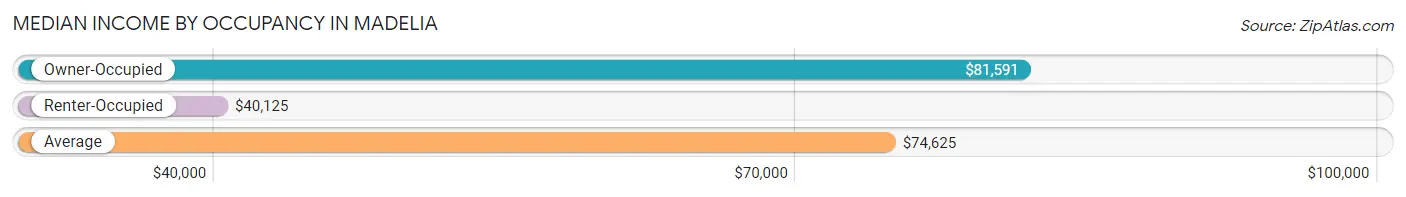
| Occupancy Type | # Households | Median Income |
| Owner-Occupied | 600 (72.6%) | $81,591 |
| Renter-Occupied | 227 (27.5%) | $40,125 |
| Average | 827 (100.0%) | $74,625 |
Occupancy by Householder Income Bracket in Madelia
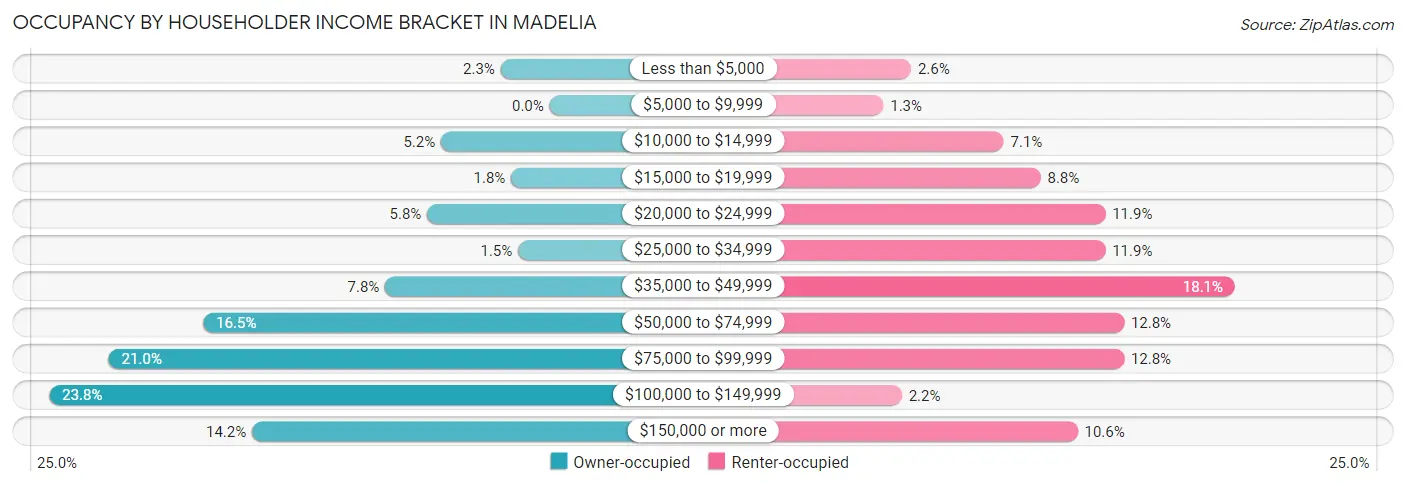
| Income Bracket | Owner-occupied | Renter-occupied |
| Less than $5,000 | 14 (2.3%) | 6 (2.6%) |
| $5,000 to $9,999 | 0 (0.0%) | 3 (1.3%) |
| $10,000 to $14,999 | 31 (5.2%) | 16 (7.0%) |
| $15,000 to $19,999 | 11 (1.8%) | 20 (8.8%) |
| $20,000 to $24,999 | 35 (5.8%) | 27 (11.9%) |
| $25,000 to $34,999 | 9 (1.5%) | 27 (11.9%) |
| $35,000 to $49,999 | 47 (7.8%) | 41 (18.1%) |
| $50,000 to $74,999 | 99 (16.5%) | 29 (12.8%) |
| $75,000 to $99,999 | 126 (21.0%) | 29 (12.8%) |
| $100,000 to $149,999 | 143 (23.8%) | 5 (2.2%) |
| $150,000 or more | 85 (14.2%) | 24 (10.6%) |
| Total | 600 (100.0%) | 227 (100.0%) |
Monthly Housing Cost Tiers in Madelia
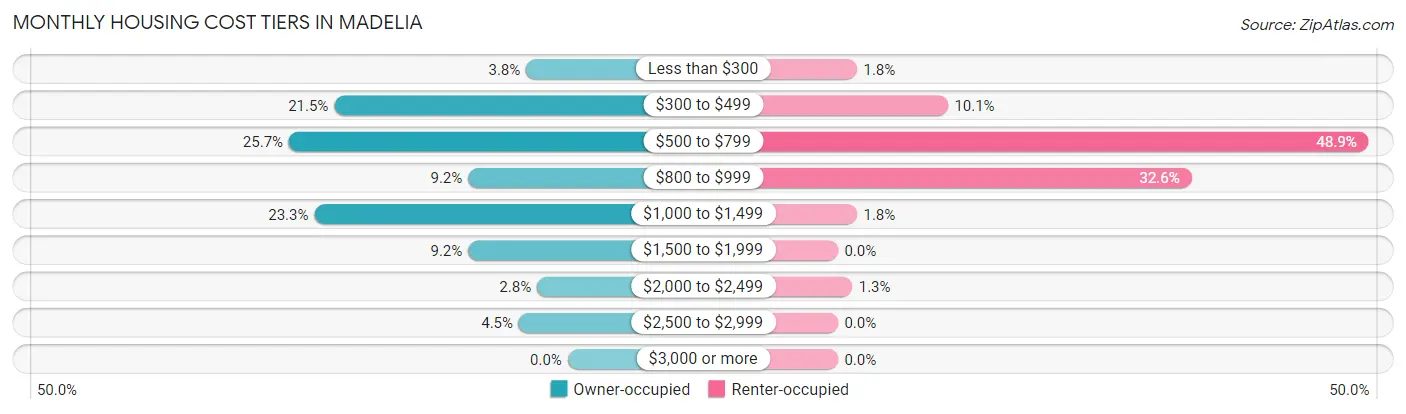
| Monthly Cost | Owner-occupied | Renter-occupied |
| Less than $300 | 23 (3.8%) | 4 (1.8%) |
| $300 to $499 | 129 (21.5%) | 23 (10.1%) |
| $500 to $799 | 154 (25.7%) | 111 (48.9%) |
| $800 to $999 | 55 (9.2%) | 74 (32.6%) |
| $1,000 to $1,499 | 140 (23.3%) | 4 (1.8%) |
| $1,500 to $1,999 | 55 (9.2%) | 0 (0.0%) |
| $2,000 to $2,499 | 17 (2.8%) | 3 (1.3%) |
| $2,500 to $2,999 | 27 (4.5%) | 0 (0.0%) |
| $3,000 or more | 0 (0.0%) | 0 (0.0%) |
| Total | 600 (100.0%) | 227 (100.0%) |
Physical Housing Characteristics in Madelia
Housing Structures in Madelia
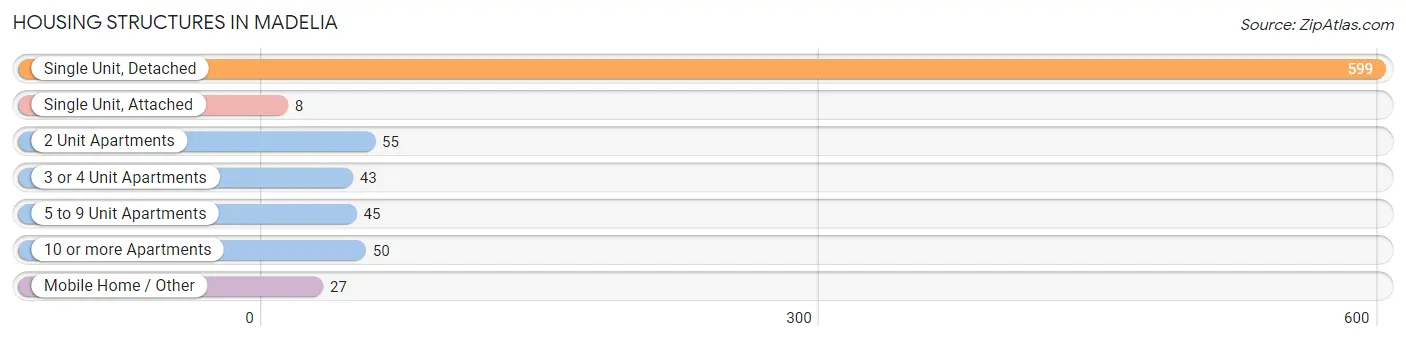
| Structure Type | # Housing Units | % Housing Units |
| Single Unit, Detached | 599 | 72.4% |
| Single Unit, Attached | 8 | 1.0% |
| 2 Unit Apartments | 55 | 6.7% |
| 3 or 4 Unit Apartments | 43 | 5.2% |
| 5 to 9 Unit Apartments | 45 | 5.4% |
| 10 or more Apartments | 50 | 6.0% |
| Mobile Home / Other | 27 | 3.3% |
| Total | 827 | 100.0% |
Housing Structures by Occupancy in Madelia
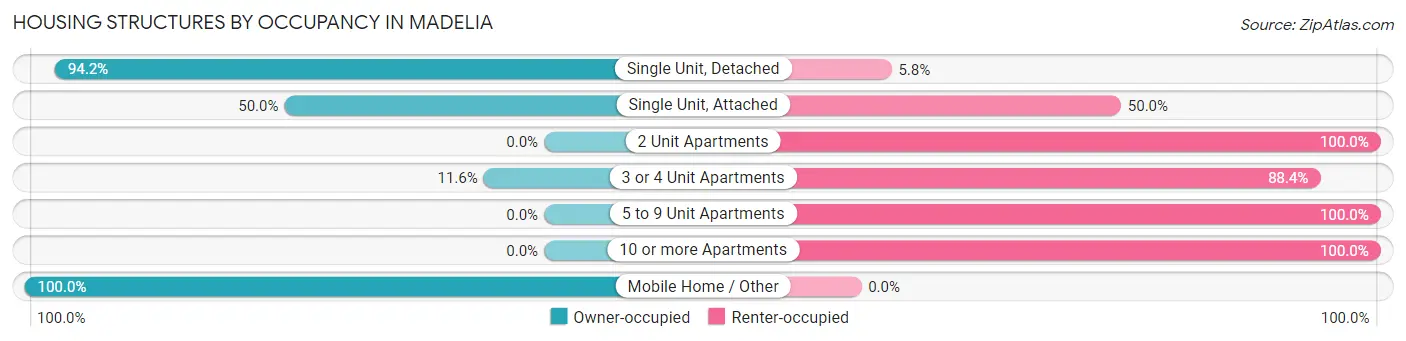
| Structure Type | Owner-occupied | Renter-occupied |
| Single Unit, Detached | 564 (94.2%) | 35 (5.8%) |
| Single Unit, Attached | 4 (50.0%) | 4 (50.0%) |
| 2 Unit Apartments | 0 (0.0%) | 55 (100.0%) |
| 3 or 4 Unit Apartments | 5 (11.6%) | 38 (88.4%) |
| 5 to 9 Unit Apartments | 0 (0.0%) | 45 (100.0%) |
| 10 or more Apartments | 0 (0.0%) | 50 (100.0%) |
| Mobile Home / Other | 27 (100.0%) | 0 (0.0%) |
| Total | 600 (72.6%) | 227 (27.5%) |
Housing Structures by Number of Rooms in Madelia
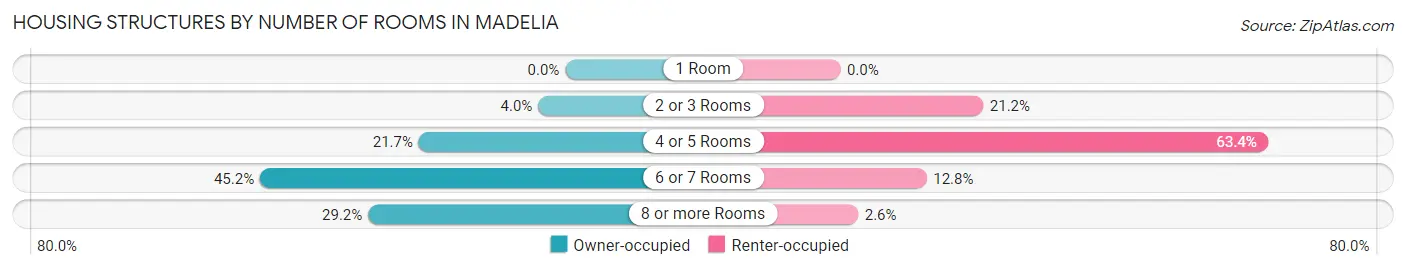
| Number of Rooms | Owner-occupied | Renter-occupied |
| 1 Room | 0 (0.0%) | 0 (0.0%) |
| 2 or 3 Rooms | 24 (4.0%) | 48 (21.1%) |
| 4 or 5 Rooms | 130 (21.7%) | 144 (63.4%) |
| 6 or 7 Rooms | 271 (45.2%) | 29 (12.8%) |
| 8 or more Rooms | 175 (29.2%) | 6 (2.6%) |
| Total | 600 (100.0%) | 227 (100.0%) |
Housing Structure by Heating Type in Madelia
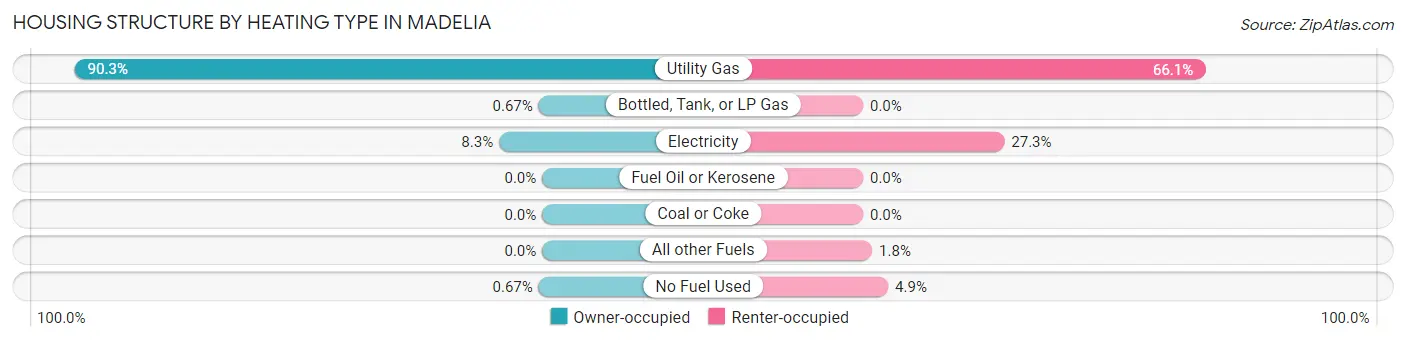
| Heating Type | Owner-occupied | Renter-occupied |
| Utility Gas | 542 (90.3%) | 150 (66.1%) |
| Bottled, Tank, or LP Gas | 4 (0.7%) | 0 (0.0%) |
| Electricity | 50 (8.3%) | 62 (27.3%) |
| Fuel Oil or Kerosene | 0 (0.0%) | 0 (0.0%) |
| Coal or Coke | 0 (0.0%) | 0 (0.0%) |
| All other Fuels | 0 (0.0%) | 4 (1.8%) |
| No Fuel Used | 4 (0.7%) | 11 (4.9%) |
| Total | 600 (100.0%) | 227 (100.0%) |
Household Vehicle Usage in Madelia
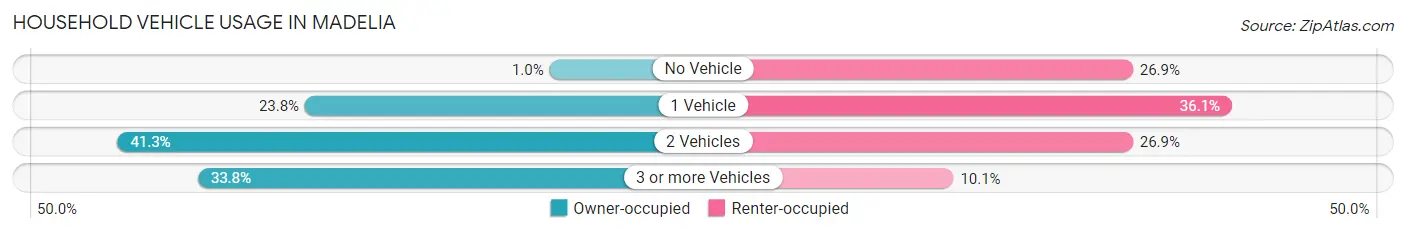
| Vehicles per Household | Owner-occupied | Renter-occupied |
| No Vehicle | 6 (1.0%) | 61 (26.9%) |
| 1 Vehicle | 143 (23.8%) | 82 (36.1%) |
| 2 Vehicles | 248 (41.3%) | 61 (26.9%) |
| 3 or more Vehicles | 203 (33.8%) | 23 (10.1%) |
| Total | 600 (100.0%) | 227 (100.0%) |
Real Estate & Mortgages in Madelia
Real Estate and Mortgage Overview in Madelia
| Characteristic | Without Mortgage | With Mortgage |
| Housing Units | 255 | 345 |
| Median Property Value | $129,800 | $150,900 |
| Median Household Income | $63,854 | $56 |
| Monthly Housing Costs | $478 | $0 |
| Real Estate Taxes | $1,563 | $12 |
Property Value by Mortgage Status in Madelia
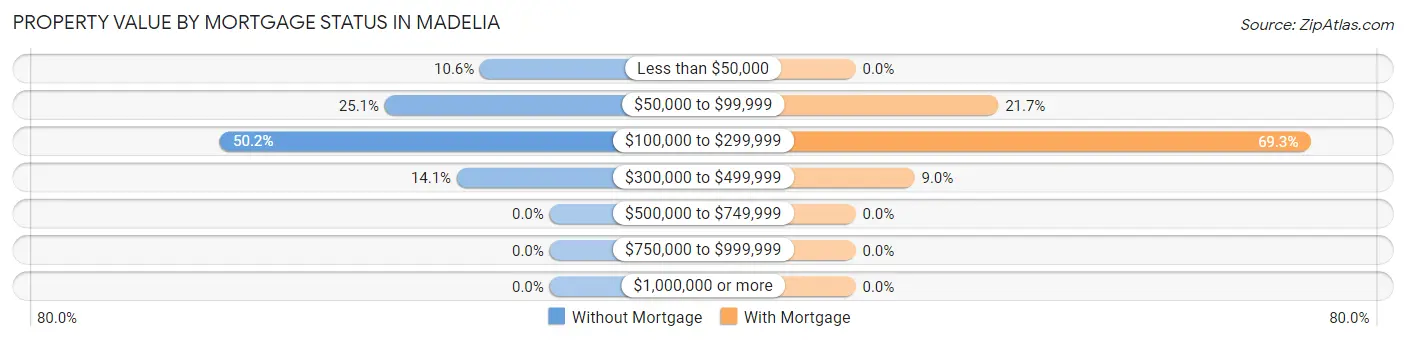
| Property Value | Without Mortgage | With Mortgage |
| Less than $50,000 | 27 (10.6%) | 0 (0.0%) |
| $50,000 to $99,999 | 64 (25.1%) | 75 (21.7%) |
| $100,000 to $299,999 | 128 (50.2%) | 239 (69.3%) |
| $300,000 to $499,999 | 36 (14.1%) | 31 (9.0%) |
| $500,000 to $749,999 | 0 (0.0%) | 0 (0.0%) |
| $750,000 to $999,999 | 0 (0.0%) | 0 (0.0%) |
| $1,000,000 or more | 0 (0.0%) | 0 (0.0%) |
| Total | 255 (100.0%) | 345 (100.0%) |
Household Income by Mortgage Status in Madelia
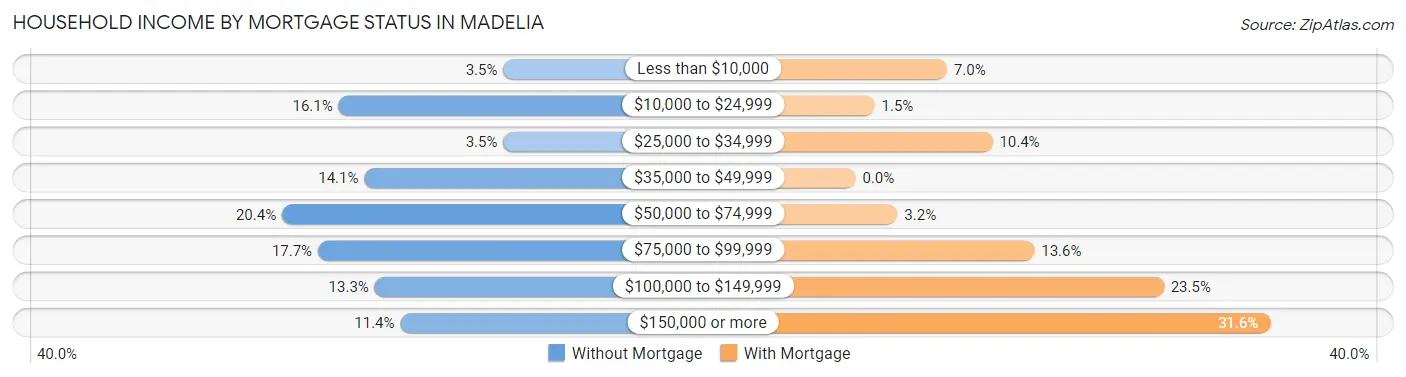
| Household Income | Without Mortgage | With Mortgage |
| Less than $10,000 | 9 (3.5%) | 24 (7.0%) |
| $10,000 to $24,999 | 41 (16.1%) | 5 (1.5%) |
| $25,000 to $34,999 | 9 (3.5%) | 36 (10.4%) |
| $35,000 to $49,999 | 36 (14.1%) | 0 (0.0%) |
| $50,000 to $74,999 | 52 (20.4%) | 11 (3.2%) |
| $75,000 to $99,999 | 45 (17.6%) | 47 (13.6%) |
| $100,000 to $149,999 | 34 (13.3%) | 81 (23.5%) |
| $150,000 or more | 29 (11.4%) | 109 (31.6%) |
| Total | 255 (100.0%) | 345 (100.0%) |
Property Value to Household Income Ratio in Madelia
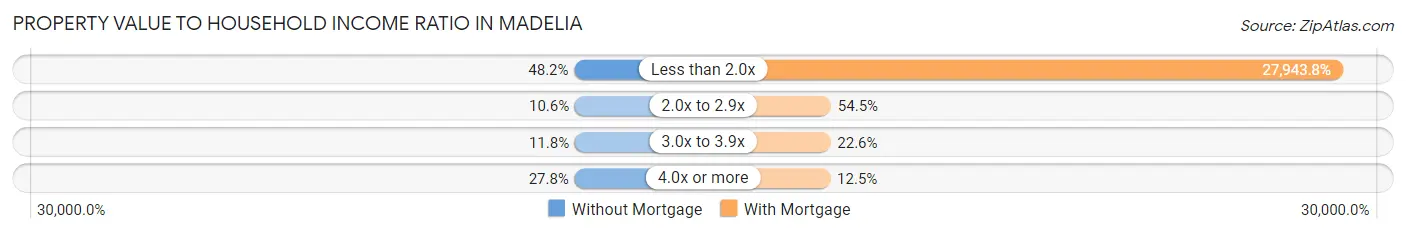
| Value-to-Income Ratio | Without Mortgage | With Mortgage |
| Less than 2.0x | 123 (48.2%) | 96,406 (27,943.8%) |
| 2.0x to 2.9x | 27 (10.6%) | 188 (54.5%) |
| 3.0x to 3.9x | 30 (11.8%) | 78 (22.6%) |
| 4.0x or more | 71 (27.8%) | 43 (12.5%) |
| Total | 255 (100.0%) | 345 (100.0%) |
Real Estate Taxes by Mortgage Status in Madelia
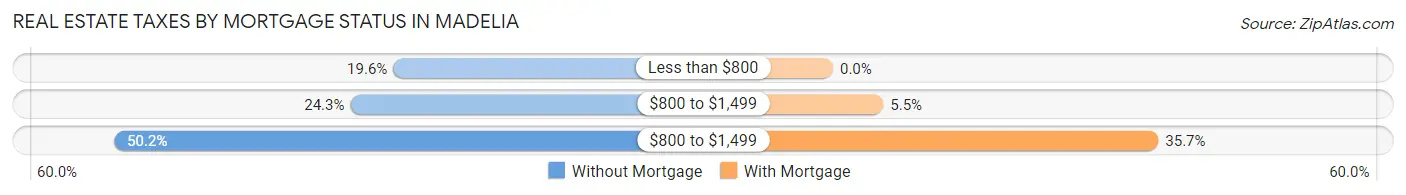
| Property Taxes | Without Mortgage | With Mortgage |
| Less than $800 | 50 (19.6%) | 0 (0.0%) |
| $800 to $1,499 | 62 (24.3%) | 19 (5.5%) |
| $800 to $1,499 | 128 (50.2%) | 123 (35.6%) |
| Total | 255 (100.0%) | 345 (100.0%) |
Health & Disability in Madelia
Health Insurance Coverage by Age in Madelia
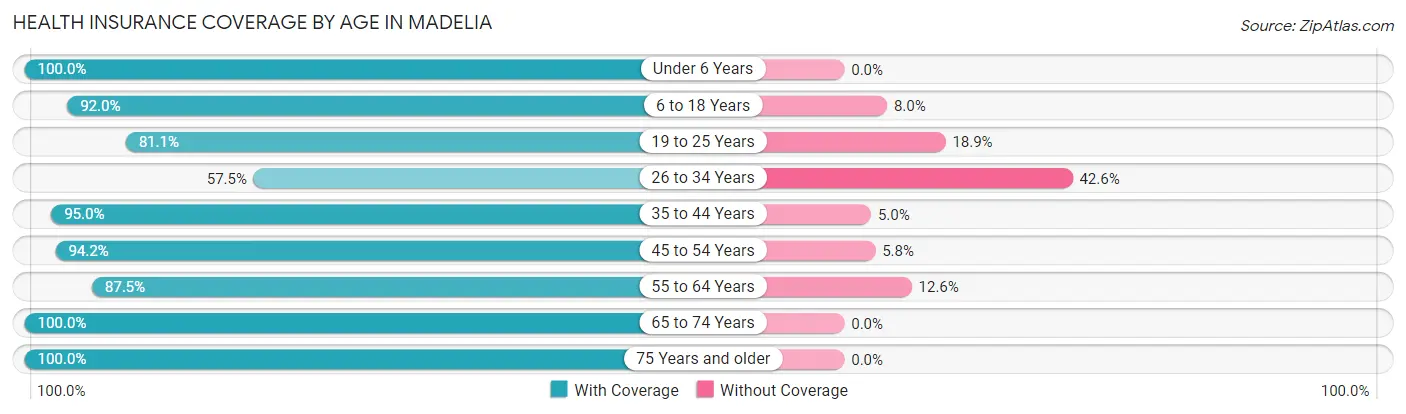
| Age Bracket | With Coverage | Without Coverage |
| Under 6 Years | 328 (100.0%) | 0 (0.0%) |
| 6 to 18 Years | 266 (92.0%) | 23 (8.0%) |
| 19 to 25 Years | 185 (81.1%) | 43 (18.9%) |
| 26 to 34 Years | 185 (57.5%) | 137 (42.5%) |
| 35 to 44 Years | 172 (95.0%) | 9 (5.0%) |
| 45 to 54 Years | 278 (94.2%) | 17 (5.8%) |
| 55 to 64 Years | 230 (87.5%) | 33 (12.6%) |
| 65 to 74 Years | 222 (100.0%) | 0 (0.0%) |
| 75 Years and older | 159 (100.0%) | 0 (0.0%) |
| Total | 2,025 (88.5%) | 262 (11.5%) |
Health Insurance Coverage by Citizenship Status in Madelia
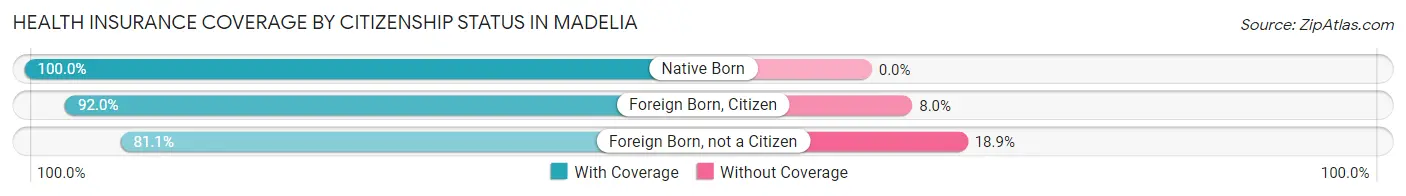
| Citizenship Status | With Coverage | Without Coverage |
| Native Born | 328 (100.0%) | 0 (0.0%) |
| Foreign Born, Citizen | 266 (92.0%) | 23 (8.0%) |
| Foreign Born, not a Citizen | 185 (81.1%) | 43 (18.9%) |
Health Insurance Coverage by Household Income in Madelia
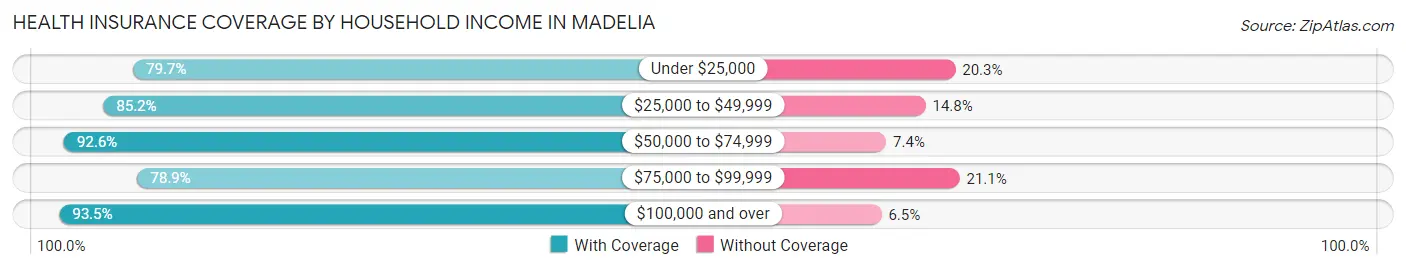
| Household Income | With Coverage | Without Coverage |
| Under $25,000 | 200 (79.7%) | 51 (20.3%) |
| $25,000 to $49,999 | 179 (85.2%) | 31 (14.8%) |
| $50,000 to $74,999 | 352 (92.6%) | 28 (7.4%) |
| $75,000 to $99,999 | 321 (78.9%) | 86 (21.1%) |
| $100,000 and over | 949 (93.5%) | 66 (6.5%) |
Public vs Private Health Insurance Coverage by Age in Madelia
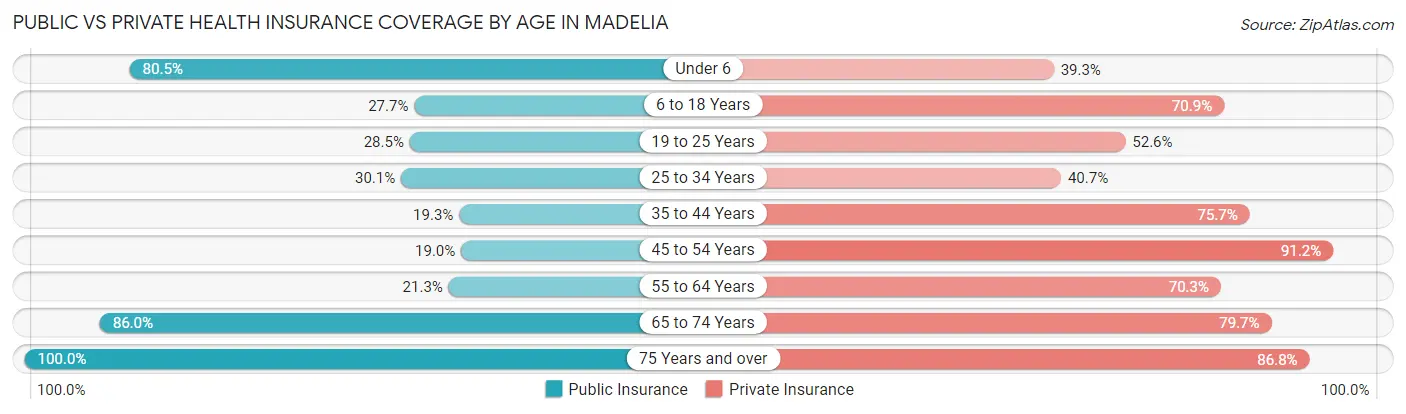
| Age Bracket | Public Insurance | Private Insurance |
| Under 6 | 264 (80.5%) | 129 (39.3%) |
| 6 to 18 Years | 80 (27.7%) | 205 (70.9%) |
| 19 to 25 Years | 65 (28.5%) | 120 (52.6%) |
| 25 to 34 Years | 97 (30.1%) | 131 (40.7%) |
| 35 to 44 Years | 35 (19.3%) | 137 (75.7%) |
| 45 to 54 Years | 56 (19.0%) | 269 (91.2%) |
| 55 to 64 Years | 56 (21.3%) | 185 (70.3%) |
| 65 to 74 Years | 191 (86.0%) | 177 (79.7%) |
| 75 Years and over | 159 (100.0%) | 138 (86.8%) |
| Total | 1,003 (43.9%) | 1,491 (65.2%) |
Disability Status by Sex by Age in Madelia
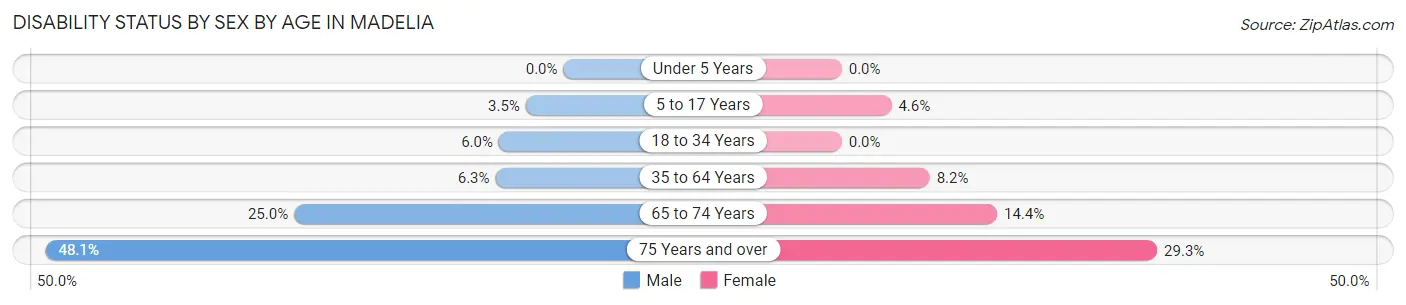
| Age Bracket | Male | Female |
| Under 5 Years | 0 (0.0%) | 0 (0.0%) |
| 5 to 17 Years | 5 (3.5%) | 10 (4.6%) |
| 18 to 34 Years | 17 (6.0%) | 0 (0.0%) |
| 35 to 64 Years | 25 (6.3%) | 28 (8.2%) |
| 65 to 74 Years | 26 (25.0%) | 17 (14.4%) |
| 75 Years and over | 37 (48.0%) | 24 (29.3%) |
Disability Class by Sex by Age in Madelia
Disability Class: Hearing Difficulty
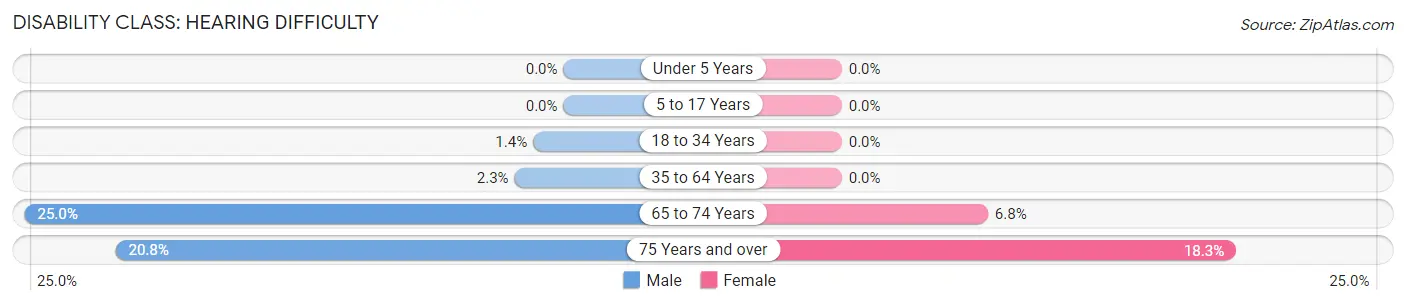
| Age Bracket | Male | Female |
| Under 5 Years | 0 (0.0%) | 0 (0.0%) |
| 5 to 17 Years | 0 (0.0%) | 0 (0.0%) |
| 18 to 34 Years | 4 (1.4%) | 0 (0.0%) |
| 35 to 64 Years | 9 (2.3%) | 0 (0.0%) |
| 65 to 74 Years | 26 (25.0%) | 8 (6.8%) |
| 75 Years and over | 16 (20.8%) | 15 (18.3%) |
Disability Class: Vision Difficulty
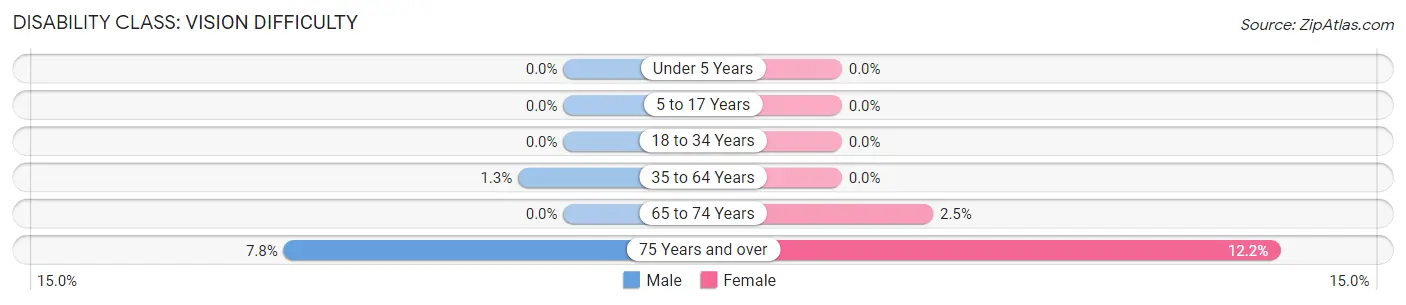
| Age Bracket | Male | Female |
| Under 5 Years | 0 (0.0%) | 0 (0.0%) |
| 5 to 17 Years | 0 (0.0%) | 0 (0.0%) |
| 18 to 34 Years | 0 (0.0%) | 0 (0.0%) |
| 35 to 64 Years | 5 (1.3%) | 0 (0.0%) |
| 65 to 74 Years | 0 (0.0%) | 3 (2.5%) |
| 75 Years and over | 6 (7.8%) | 10 (12.2%) |
Disability Class: Cognitive Difficulty
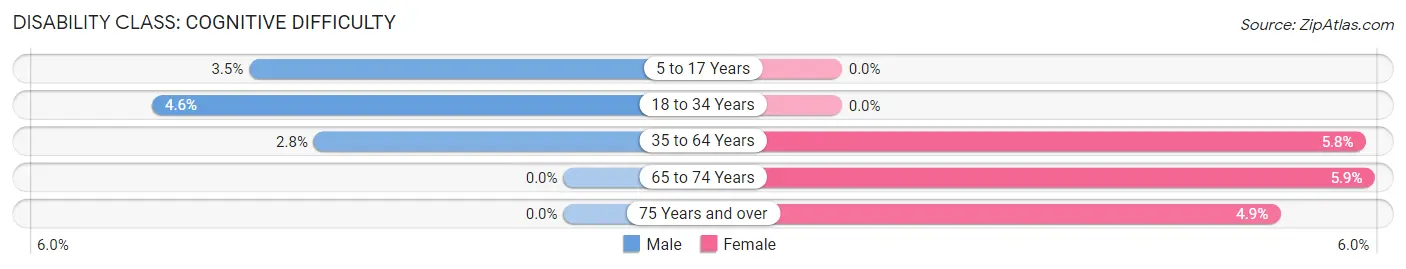
| Age Bracket | Male | Female |
| 5 to 17 Years | 5 (3.5%) | 0 (0.0%) |
| 18 to 34 Years | 13 (4.6%) | 0 (0.0%) |
| 35 to 64 Years | 11 (2.8%) | 20 (5.8%) |
| 65 to 74 Years | 0 (0.0%) | 7 (5.9%) |
| 75 Years and over | 0 (0.0%) | 4 (4.9%) |
Disability Class: Ambulatory Difficulty
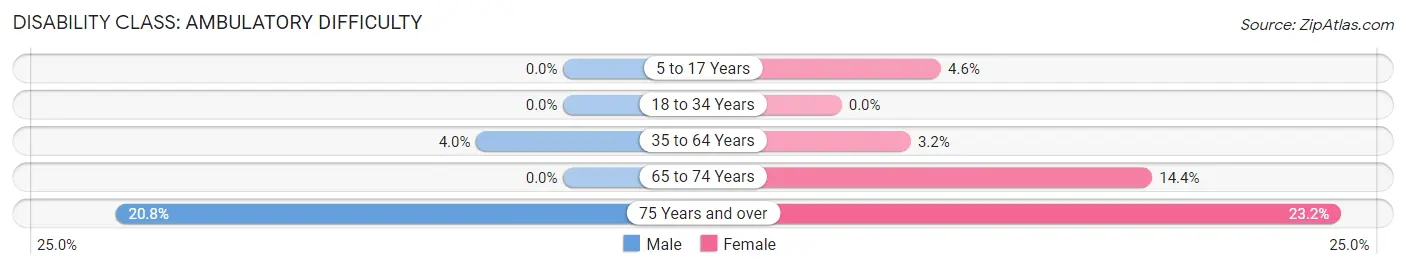
| Age Bracket | Male | Female |
| 5 to 17 Years | 0 (0.0%) | 10 (4.6%) |
| 18 to 34 Years | 0 (0.0%) | 0 (0.0%) |
| 35 to 64 Years | 16 (4.0%) | 11 (3.2%) |
| 65 to 74 Years | 0 (0.0%) | 17 (14.4%) |
| 75 Years and over | 16 (20.8%) | 19 (23.2%) |
Disability Class: Self-Care Difficulty
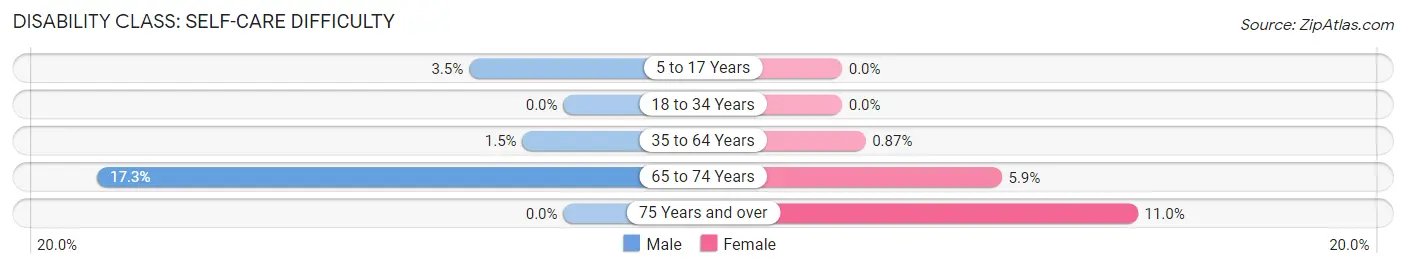
| Age Bracket | Male | Female |
| 5 to 17 Years | 5 (3.5%) | 0 (0.0%) |
| 18 to 34 Years | 0 (0.0%) | 0 (0.0%) |
| 35 to 64 Years | 6 (1.5%) | 3 (0.9%) |
| 65 to 74 Years | 18 (17.3%) | 7 (5.9%) |
| 75 Years and over | 0 (0.0%) | 9 (11.0%) |
Technology Access in Madelia
Computing Device Access in Madelia
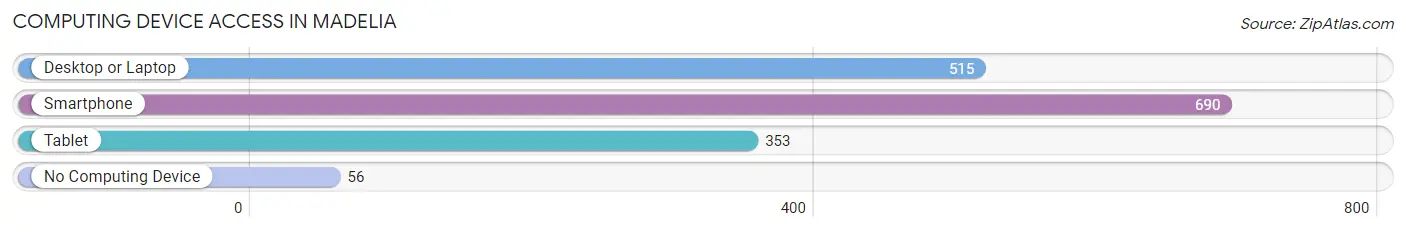
| Device Type | # Households | % Households |
| Desktop or Laptop | 515 | 62.3% |
| Smartphone | 690 | 83.4% |
| Tablet | 353 | 42.7% |
| No Computing Device | 56 | 6.8% |
| Total | 827 | 100.0% |
Internet Access in Madelia
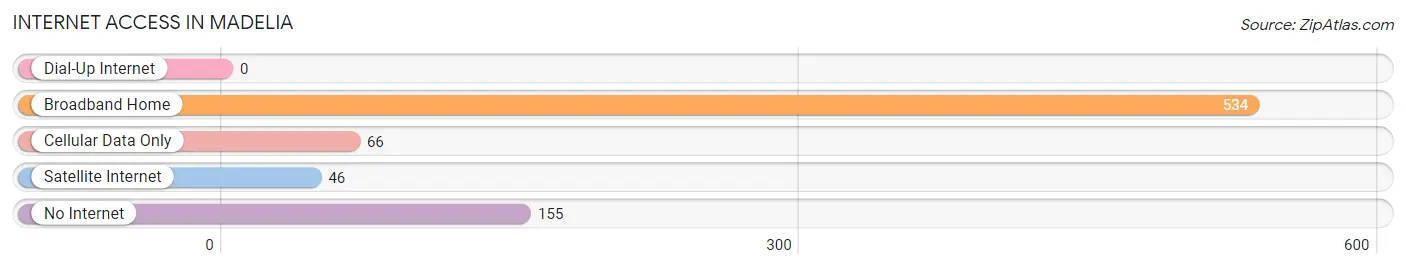
| Internet Type | # Households | % Households |
| Dial-Up Internet | 0 | 0.0% |
| Broadband Home | 534 | 64.6% |
| Cellular Data Only | 66 | 8.0% |
| Satellite Internet | 46 | 5.6% |
| No Internet | 155 | 18.7% |
| Total | 827 | 100.0% |
Madelia Summary
Madelia is a small city located in Watonwan County, Minnesota. It is situated in the south-central part of the state, about 90 miles southwest of Minneapolis. The city has a population of 1,717 people, according to the 2010 census.
History
Madelia was founded in 1856 by a group of settlers from Sweden. The city was named after Madelia, Sweden, the hometown of the settlers. The settlers were attracted to the area by the abundance of timber and the fertile soil. They quickly established a thriving lumber industry, which was the main source of income for the town for many years.
In the late 19th century, Madelia became a center for the dairy industry. The city was also home to a number of other businesses, including a flour mill, a brickyard, and a furniture factory.
Geography
Madelia is located in the south-central part of Minnesota, about 90 miles southwest of Minneapolis. The city is situated on the banks of the Watonwan River, which flows through the city. The city is surrounded by rolling hills and farmland.
The climate in Madelia is typical of the Midwest, with cold winters and hot summers. The average annual temperature is around 50 degrees Fahrenheit.
Economy
Madelia’s economy is largely based on agriculture. The city is home to a number of dairy farms, as well as a number of other agricultural businesses. The city is also home to a number of manufacturing businesses, including a furniture factory and a brickyard.
The city is also home to a number of retail businesses, including a grocery store, a hardware store, and a number of restaurants.
Demographics
According to the 2010 census, the population of Madelia is 1,717 people. The population is predominantly white, with a small percentage of African Americans and Hispanics. The median household income is $41,000, and the median age is 37.
Madelia is a small city with a rich history and a vibrant economy. The city is home to a number of businesses, and the population is diverse and growing. Madelia is a great place to live, work, and raise a family.
Common Questions
What is Per Capita Income in Madelia?
Per Capita income in Madelia is $33,460.
What is the Median Family Income in Madelia?
Median Family Income in Madelia is $85,450.
What is the Median Household income in Madelia?
Median Household Income in Madelia is $74,625.
What is Income or Wage Gap in Madelia?
Income or Wage Gap in Madelia is 26.9%.
Women in Madelia earn 73.1 cents for every dollar earned by a man.
What is Family Income Deficit in Madelia?
Family Income Deficit in Madelia is $13,359.
Families that are below poverty line in Madelia earn $13,359 less on average than the poverty threshold level.
What is Inequality or Gini Index in Madelia?
Inequality or Gini Index in Madelia is 0.41.
What is the Total Population of Madelia?
Total Population of Madelia is 2,352.
What is the Total Male Population of Madelia?
Total Male Population of Madelia is 1,144.
What is the Total Female Population of Madelia?
Total Female Population of Madelia is 1,208.
What is the Ratio of Males per 100 Females in Madelia?
There are 94.70 Males per 100 Females in Madelia.
What is the Ratio of Females per 100 Males in Madelia?
There are 105.59 Females per 100 Males in Madelia.
What is the Median Population Age in Madelia?
Median Population Age in Madelia is 36.5 Years.
What is the Average Family Size in Madelia
Average Family Size in Madelia is 3.3 People.
What is the Average Household Size in Madelia
Average Household Size in Madelia is 2.7 People.
How Large is the Labor Force in Madelia?
There are 1,310 People in the Labor Forcein in Madelia.
What is the Percentage of People in the Labor Force in Madelia?
73.7% of People are in the Labor Force in Madelia.
What is the Unemployment Rate in Madelia?
Unemployment Rate in Madelia is 3.4%.