Ball Club, MN Map & Demographics
Ball Club Map
Ball Club Overview
$18,787
PER CAPITA INCOME
98.0%
WAGE / INCOME GAP [ % ]
2.0¢/ $1
WAGE / INCOME GAP [ $ ]
0.43
INEQUALITY / GINI INDEX
119
TOTAL POPULATION
57
MALE POPULATION
62
FEMALE POPULATION
91.94
MALES / 100 FEMALES
108.77
FEMALES / 100 MALES
44.1
MEDIAN AGE
2.5
AVG FAMILY SIZE
2.5
AVG HOUSEHOLD SIZE
36
LABOR FORCE [ PEOPLE ]
43.9%
PERCENT IN LABOR FORCE
8.3%
UNEMPLOYMENT RATE
Income in Ball Club
Income Overview in Ball Club
| Characteristic | Number | Measure |
| Per Capita Income | 119 | $18,787 |
| Median Family Income | 44 | $0 |
| Mean Family Income | 44 | $45,936 |
| Median Household Income | 48 | $0 |
| Mean Household Income | 48 | $46,654 |
| Income Deficit | 44 | $0 |
| Wage / Income Gap (%) | 119 | 97.97% |
| Wage / Income Gap ($) | 119 | 2.03¢ per $1 |
| Gini / Inequality Index | 119 | 0.43 |
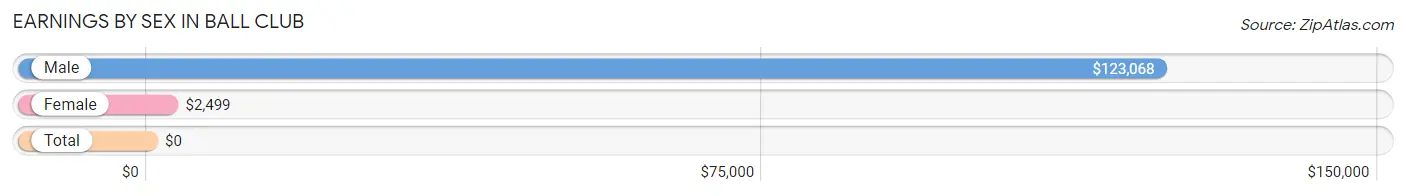
Earnings by Sex in Ball Club
| Sex | Number | Average Earnings |
| Male | 17 (47.2%) | $123,068 |
| Female | 19 (52.8%) | $2,499 |
| Total | 36 (100.0%) | $0 |
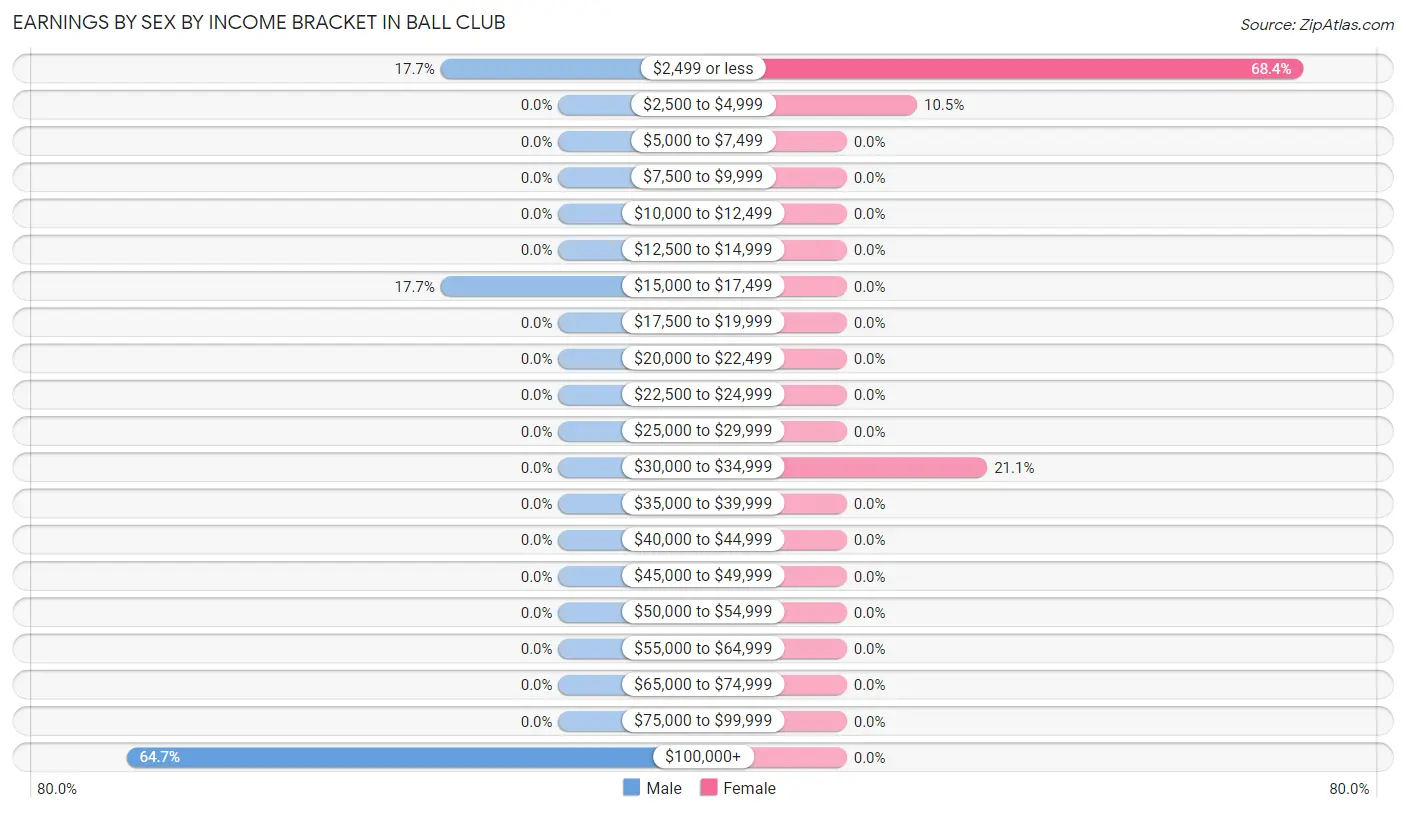
Earnings by Sex by Income Bracket in Ball Club
The most common earnings brackets in Ball Club are $100,000+ for men (11 | 64.7%) and $2,499 or less for women (13 | 68.4%).
| Income | Male | Female |
| $2,499 or less | 3 (17.6%) | 13 (68.4%) |
| $2,500 to $4,999 | 0 (0.0%) | 2 (10.5%) |
| $5,000 to $7,499 | 0 (0.0%) | 0 (0.0%) |
| $7,500 to $9,999 | 0 (0.0%) | 0 (0.0%) |
| $10,000 to $12,499 | 0 (0.0%) | 0 (0.0%) |
| $12,500 to $14,999 | 0 (0.0%) | 0 (0.0%) |
| $15,000 to $17,499 | 3 (17.6%) | 0 (0.0%) |
| $17,500 to $19,999 | 0 (0.0%) | 0 (0.0%) |
| $20,000 to $22,499 | 0 (0.0%) | 0 (0.0%) |
| $22,500 to $24,999 | 0 (0.0%) | 0 (0.0%) |
| $25,000 to $29,999 | 0 (0.0%) | 0 (0.0%) |
| $30,000 to $34,999 | 0 (0.0%) | 4 (21.0%) |
| $35,000 to $39,999 | 0 (0.0%) | 0 (0.0%) |
| $40,000 to $44,999 | 0 (0.0%) | 0 (0.0%) |
| $45,000 to $49,999 | 0 (0.0%) | 0 (0.0%) |
| $50,000 to $54,999 | 0 (0.0%) | 0 (0.0%) |
| $55,000 to $64,999 | 0 (0.0%) | 0 (0.0%) |
| $65,000 to $74,999 | 0 (0.0%) | 0 (0.0%) |
| $75,000 to $99,999 | 0 (0.0%) | 0 (0.0%) |
| $100,000+ | 11 (64.7%) | 0 (0.0%) |
| Total | 17 (100.0%) | 19 (100.0%) |
Earnings by Sex by Educational Attainment in Ball Club
| Educational Attainment | Male Income | Female Income |
| Less than High School | - | - |
| High School Diploma | - | - |
| College or Associate's Degree | - | - |
| Bachelor's Degree | - | - |
| Graduate Degree | - | - |
| Total | $123,068 | $2,499 |
Family Income in Ball Club
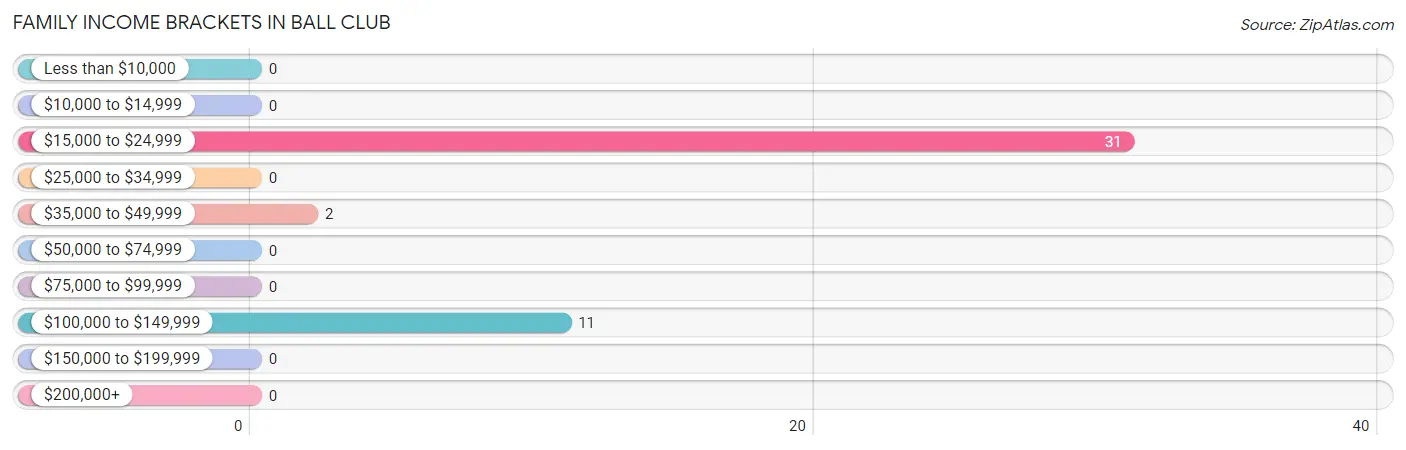
Family Income Brackets in Ball Club
According to the Ball Club family income data, there are 31 families falling into the $15,000 to $24,999 income range, which is the most common income bracket and makes up 70.5% of all families.
| Income Bracket | # Families | % Families |
| Less than $10,000 | 0 | 0.0% |
| $10,000 to $14,999 | 0 | 0.0% |
| $15,000 to $24,999 | 31 | 70.5% |
| $25,000 to $34,999 | 0 | 0.0% |
| $35,000 to $49,999 | 2 | 4.5% |
| $50,000 to $74,999 | 0 | 0.0% |
| $75,000 to $99,999 | 0 | 0.0% |
| $100,000 to $149,999 | 11 | 25.0% |
| $150,000 to $199,999 | 0 | 0.0% |
| $200,000+ | 0 | 0.0% |
Family Income by Famaliy Size in Ball Club
| Income Bracket | # Families | Median Income |
| 2-Person Families | 0 (0.0%) | $0 |
| 3-Person Families | 11 (25.0%) | $0 |
| 4-Person Families | 0 (0.0%) | $0 |
| 5-Person Families | 33 (75.0%) | $0 |
| 6-Person Families | 0 (0.0%) | $0 |
| 7+ Person Families | 0 (0.0%) | $0 |
| Total | 44 (100.0%) | $0 |
Family Income by Number of Earners in Ball Club
| Number of Earners | # Families | Median Income |
| No Earners | 0 (0.0%) | $0 |
| 1 Earner | 31 (70.5%) | $0 |
| 2 Earners | 13 (29.5%) | $0 |
| 3+ Earners | 0 (0.0%) | $0 |
| Total | 44 (100.0%) | $0 |
Household Income in Ball Club
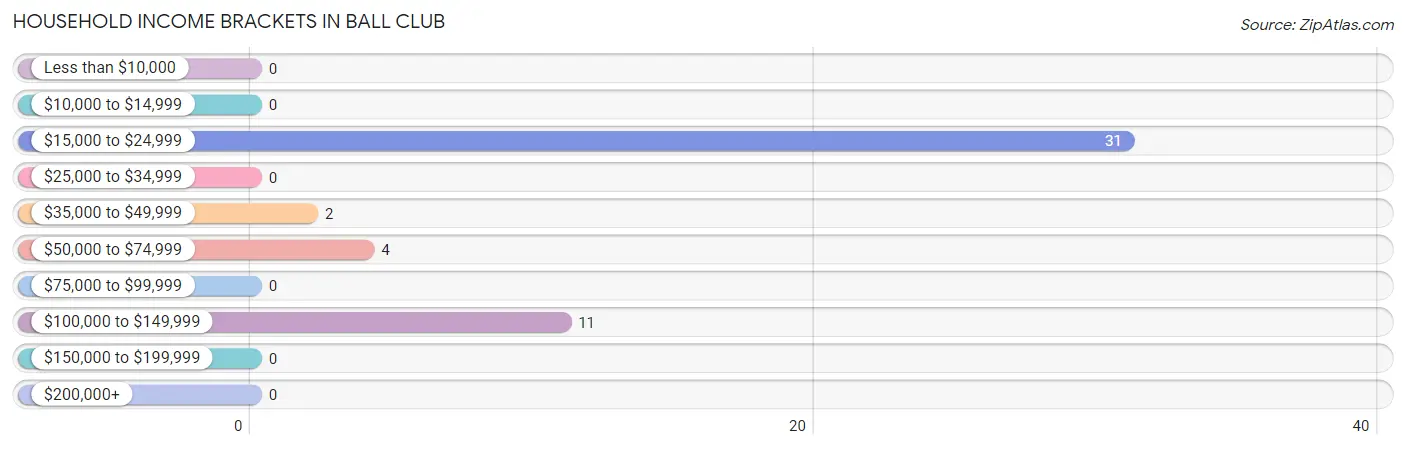
Household Income Brackets in Ball Club
With 31 households falling in the category, the $15,000 to $24,999 income range is the most frequent in Ball Club, accounting for 64.6% of all households.
| Income Bracket | # Households | % Households |
| Less than $10,000 | 0 | 0.0% |
| $10,000 to $14,999 | 0 | 0.0% |
| $15,000 to $24,999 | 31 | 64.6% |
| $25,000 to $34,999 | 0 | 0.0% |
| $35,000 to $49,999 | 2 | 4.2% |
| $50,000 to $74,999 | 4 | 8.3% |
| $75,000 to $99,999 | 0 | 0.0% |
| $100,000 to $149,999 | 11 | 22.9% |
| $150,000 to $199,999 | 0 | 0.0% |
| $200,000+ | 0 | 0.0% |
Household Income by Householder Age in Ball Club
The median household income in Ball Club is $0, with the highest median household income of $18,992 found in the 65+ years age bracket for the primary householder. A total of 37 households (77.1%) fall into this category.
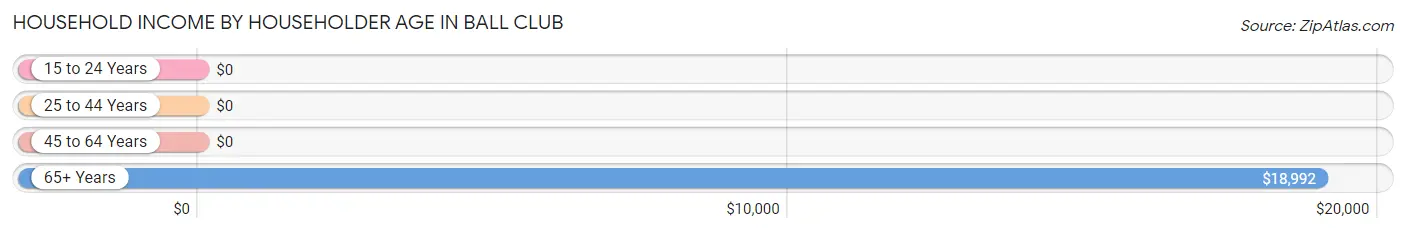
| Income Bracket | # Households | Median Income |
| 15 to 24 Years | 0 (0.0%) | $0 |
| 25 to 44 Years | 11 (22.9%) | $0 |
| 45 to 64 Years | 0 (0.0%) | $0 |
| 65+ Years | 37 (77.1%) | $18,992 |
| Total | 48 (100.0%) | $0 |
Poverty in Ball Club
Income Below Poverty by Sex and Age in Ball Club
With 40.4% poverty level for males and 69.4% for females among the residents of Ball Club, 25 to 34 year old males and under 5 year old females are the most vulnerable to poverty, with 3 males (100.0%) and 9 females (100.0%) in their respective age groups living below the poverty level.
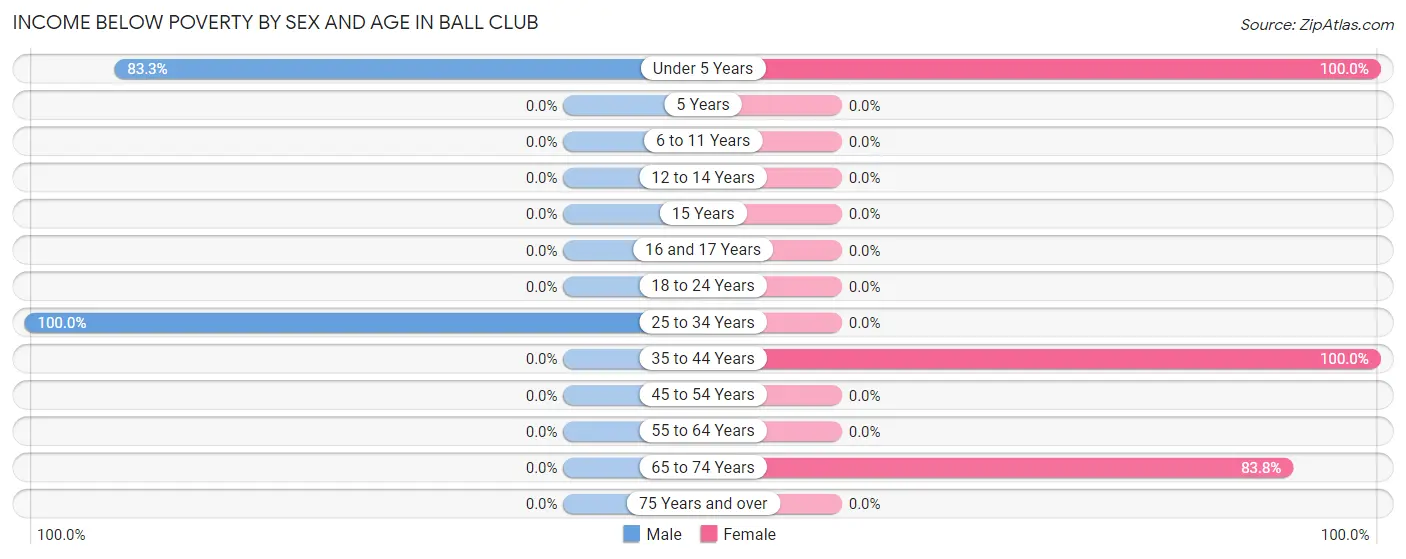
| Age Bracket | Male | Female |
| Under 5 Years | 20 (83.3%) | 9 (100.0%) |
| 5 Years | 0 (0.0%) | 0 (0.0%) |
| 6 to 11 Years | 0 (0.0%) | 0 (0.0%) |
| 12 to 14 Years | 0 (0.0%) | 0 (0.0%) |
| 15 Years | 0 (0.0%) | 0 (0.0%) |
| 16 and 17 Years | 0 (0.0%) | 0 (0.0%) |
| 18 to 24 Years | 0 (0.0%) | 0 (0.0%) |
| 25 to 34 Years | 3 (100.0%) | 0 (0.0%) |
| 35 to 44 Years | 0 (0.0%) | 3 (100.0%) |
| 45 to 54 Years | 0 (0.0%) | 0 (0.0%) |
| 55 to 64 Years | 0 (0.0%) | 0 (0.0%) |
| 65 to 74 Years | 0 (0.0%) | 31 (83.8%) |
| 75 Years and over | 0 (0.0%) | 0 (0.0%) |
| Total | 23 (40.4%) | 43 (69.4%) |
Income Above Poverty by Sex and Age in Ball Club
According to the poverty statistics in Ball Club, males aged 6 to 11 years and females aged 45 to 54 years are the age groups that are most secure financially, with 100.0% of males and 100.0% of females in these age groups living above the poverty line.
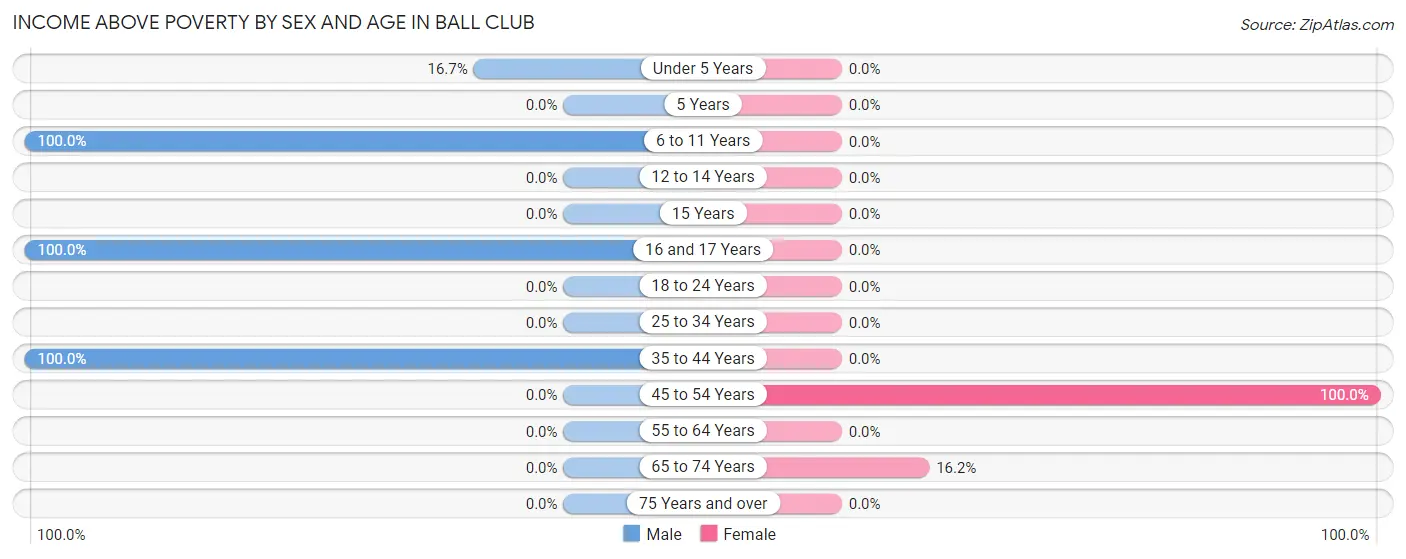
| Age Bracket | Male | Female |
| Under 5 Years | 4 (16.7%) | 0 (0.0%) |
| 5 Years | 0 (0.0%) | 0 (0.0%) |
| 6 to 11 Years | 4 (100.0%) | 0 (0.0%) |
| 12 to 14 Years | 0 (0.0%) | 0 (0.0%) |
| 15 Years | 0 (0.0%) | 0 (0.0%) |
| 16 and 17 Years | 12 (100.0%) | 0 (0.0%) |
| 18 to 24 Years | 0 (0.0%) | 0 (0.0%) |
| 25 to 34 Years | 0 (0.0%) | 0 (0.0%) |
| 35 to 44 Years | 14 (100.0%) | 0 (0.0%) |
| 45 to 54 Years | 0 (0.0%) | 13 (100.0%) |
| 55 to 64 Years | 0 (0.0%) | 0 (0.0%) |
| 65 to 74 Years | 0 (0.0%) | 6 (16.2%) |
| 75 Years and over | 0 (0.0%) | 0 (0.0%) |
| Total | 34 (59.7%) | 19 (30.6%) |
Income Below Poverty Among Married-Couple Families in Ball Club
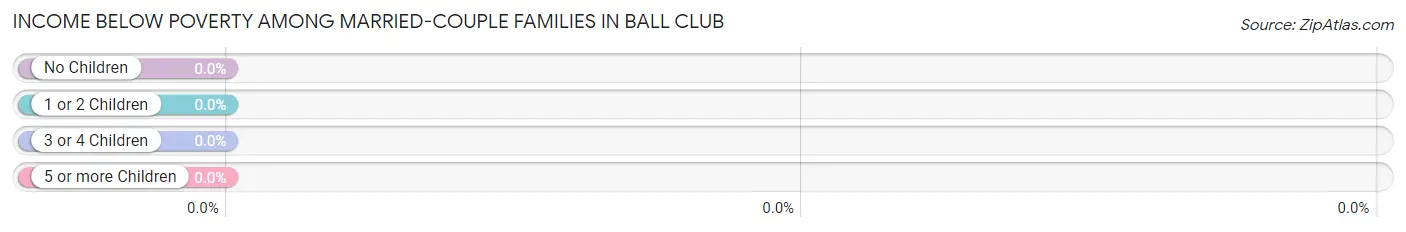
| Children | Above Poverty | Below Poverty |
| No Children | 0 (0.0%) | 0 (0.0%) |
| 1 or 2 Children | 11 (100.0%) | 0 (0.0%) |
| 3 or 4 Children | 0 (0.0%) | 0 (0.0%) |
| 5 or more Children | 0 (0.0%) | 0 (0.0%) |
| Total | 11 (100.0%) | 0 (0.0%) |
Income Below Poverty Among Single-Parent Households in Ball Club
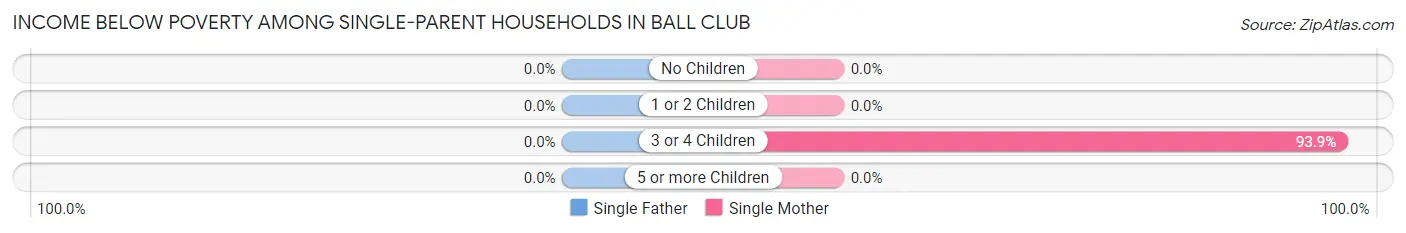
| Children | Single Father | Single Mother |
| No Children | 0 (0.0%) | 0 (0.0%) |
| 1 or 2 Children | 0 (0.0%) | 0 (0.0%) |
| 3 or 4 Children | 0 (0.0%) | 31 (93.9%) |
| 5 or more Children | 0 (0.0%) | 0 (0.0%) |
| Total | 0 (0.0%) | 31 (93.9%) |
Income Below Poverty Among Married-Couple vs Single-Parent Households in Ball Club
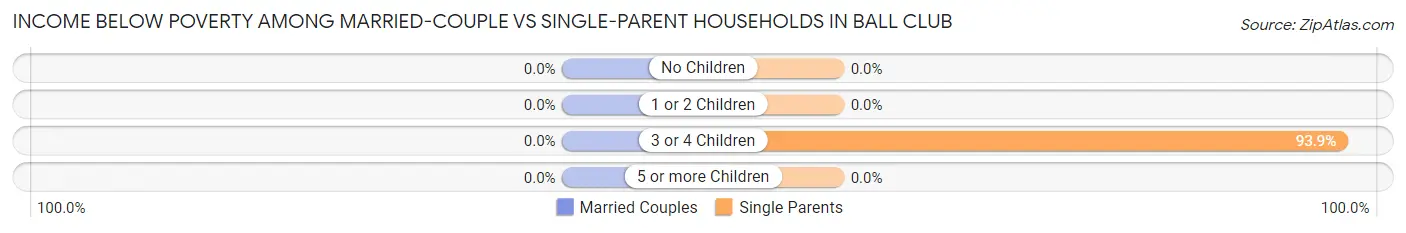
| Children | Married-Couple Families | Single-Parent Households |
| No Children | 0 (0.0%) | 0 (0.0%) |
| 1 or 2 Children | 0 (0.0%) | 0 (0.0%) |
| 3 or 4 Children | 0 (0.0%) | 31 (93.9%) |
| 5 or more Children | 0 (0.0%) | 0 (0.0%) |
| Total | 0 (0.0%) | 31 (93.9%) |
Race in Ball Club
The most populous races in Ball Club are Native / Alaskan (77 | 64.7%), and White / Caucasian (42 | 35.3%).
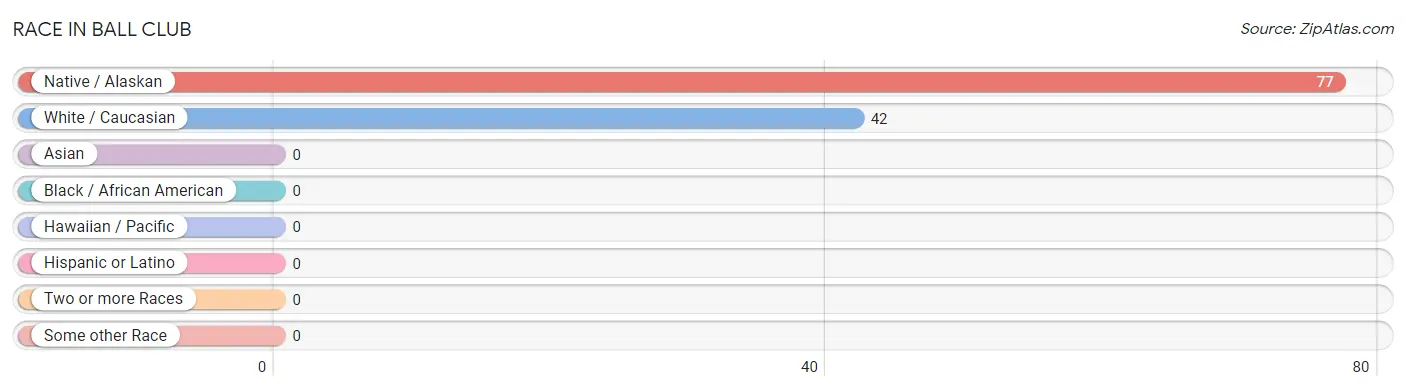
| Race | # Population | % Population |
| Asian | 0 | 0.0% |
| Black / African American | 0 | 0.0% |
| Hawaiian / Pacific | 0 | 0.0% |
| Hispanic or Latino | 0 | 0.0% |
| Native / Alaskan | 77 | 64.7% |
| White / Caucasian | 42 | 35.3% |
| Two or more Races | 0 | 0.0% |
| Some other Race | 0 | 0.0% |
| Total | 119 | 100.0% |
Ancestry in Ball Club
The most populous ancestries reported in Ball Club are German (36 | 30.2%), Cherokee (34 | 28.6%), Scandinavian (23 | 19.3%), Chippewa (8 | 6.7%), and Norwegian (4 | 3.4%), together accounting for 88.2% of all Ball Club residents.
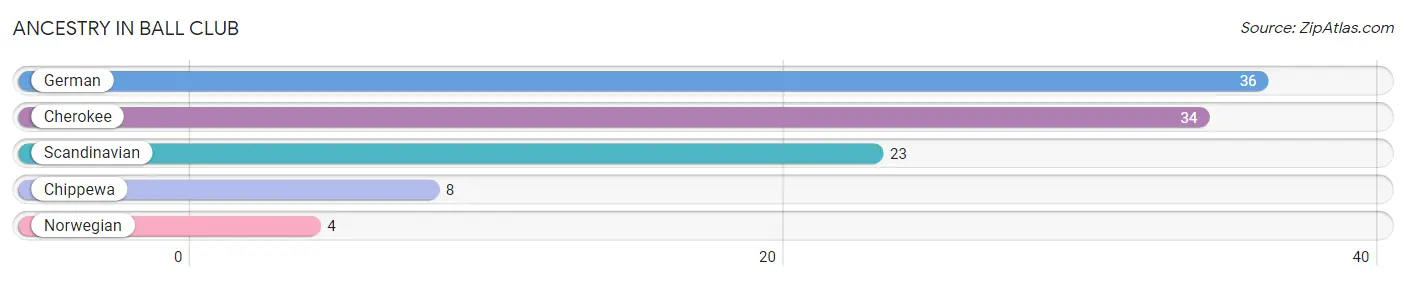
| Ancestry | # Population | % Population |
| Cherokee | 34 | 28.6% |
| Chippewa | 8 | 6.7% |
| German | 36 | 30.2% |
| Norwegian | 4 | 3.4% |
| Scandinavian | 23 | 19.3% | View All 5 Rows |
Immigrants in Ball Club

| Immigration Origin | # Population | % Population | View All 0 Rows |
Sex and Age in Ball Club
Sex and Age in Ball Club
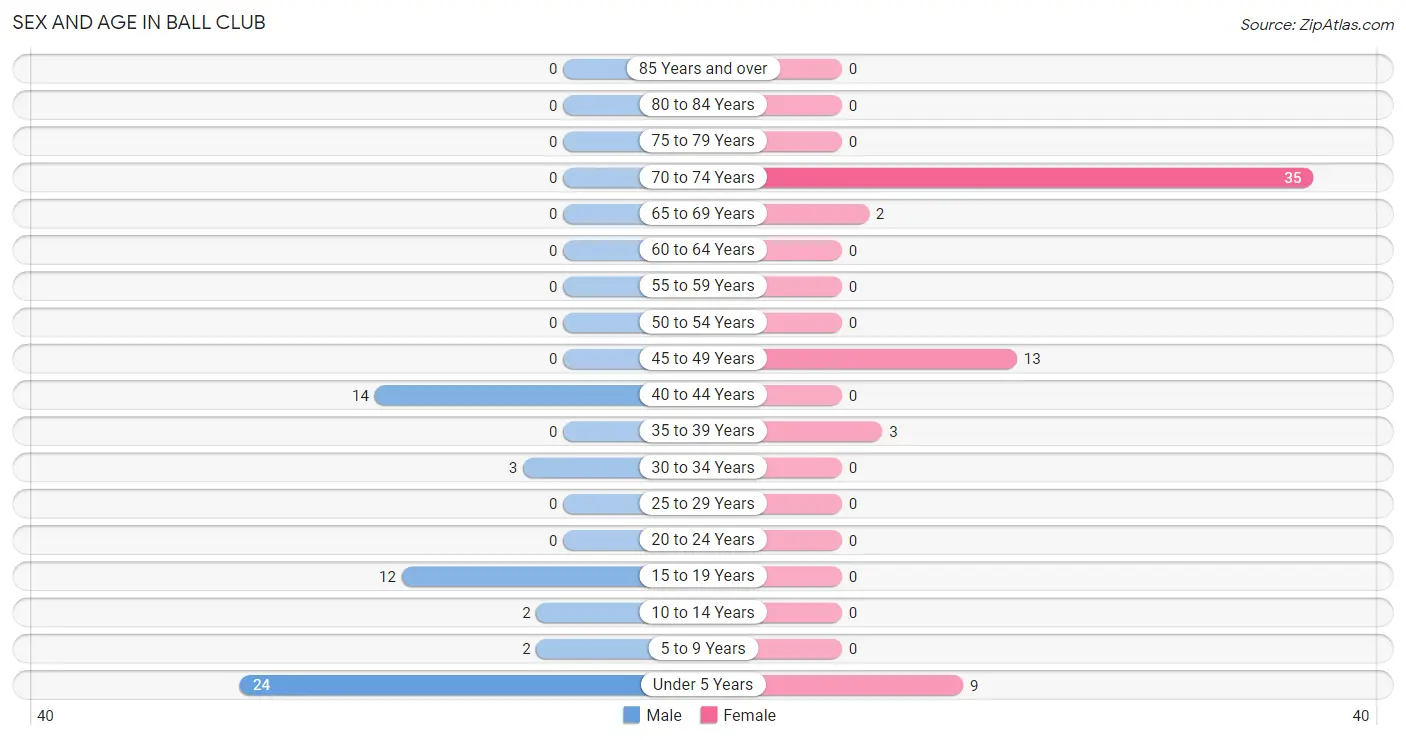
The most populous age groups in Ball Club are Under 5 Years (24 | 42.1%) for men and 70 to 74 Years (35 | 56.5%) for women.
| Age Bracket | Male | Female |
| Under 5 Years | 24 (42.1%) | 9 (14.5%) |
| 5 to 9 Years | 2 (3.5%) | 0 (0.0%) |
| 10 to 14 Years | 2 (3.5%) | 0 (0.0%) |
| 15 to 19 Years | 12 (21.0%) | 0 (0.0%) |
| 20 to 24 Years | 0 (0.0%) | 0 (0.0%) |
| 25 to 29 Years | 0 (0.0%) | 0 (0.0%) |
| 30 to 34 Years | 3 (5.3%) | 0 (0.0%) |
| 35 to 39 Years | 0 (0.0%) | 3 (4.8%) |
| 40 to 44 Years | 14 (24.6%) | 0 (0.0%) |
| 45 to 49 Years | 0 (0.0%) | 13 (21.0%) |
| 50 to 54 Years | 0 (0.0%) | 0 (0.0%) |
| 55 to 59 Years | 0 (0.0%) | 0 (0.0%) |
| 60 to 64 Years | 0 (0.0%) | 0 (0.0%) |
| 65 to 69 Years | 0 (0.0%) | 2 (3.2%) |
| 70 to 74 Years | 0 (0.0%) | 35 (56.5%) |
| 75 to 79 Years | 0 (0.0%) | 0 (0.0%) |
| 80 to 84 Years | 0 (0.0%) | 0 (0.0%) |
| 85 Years and over | 0 (0.0%) | 0 (0.0%) |
| Total | 57 (100.0%) | 62 (100.0%) |
Families and Households in Ball Club
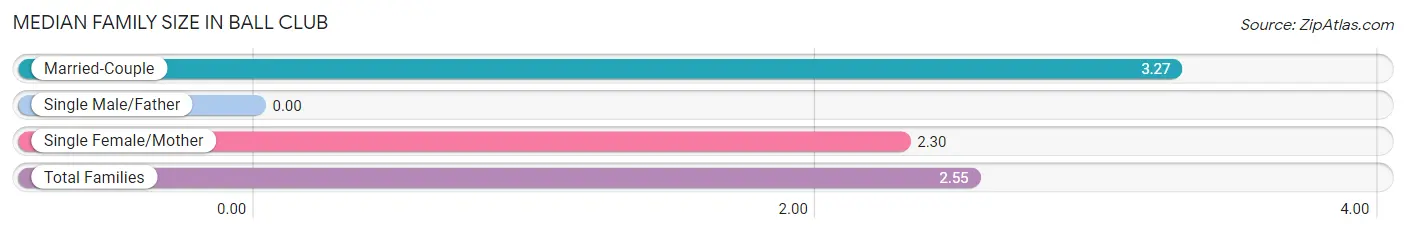
Median Family Size in Ball Club
| Family Type | # Families | Family Size |
| Married-Couple | 11 (25.0%) | 3.27 |
| Single Male/Father | 0 (0.0%) | - |
| Single Female/Mother | 33 (75.0%) | 2.30 |
| Total Families | 44 (100.0%) | 2.55 |
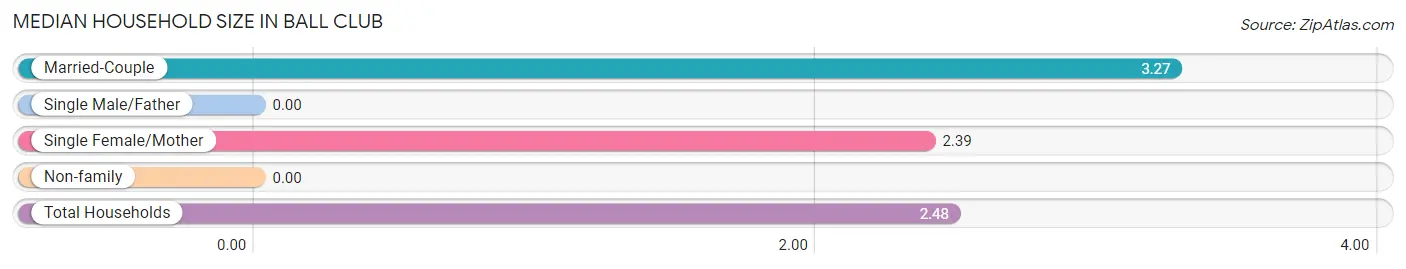
Median Household Size in Ball Club
| Household Type | # Households | Household Size |
| Married-Couple | 11 (22.9%) | 3.27 |
| Single Male/Father | 0 (0.0%) | - |
| Single Female/Mother | 33 (68.8%) | 2.39 |
| Non-family | 4 (8.3%) | - |
| Total Households | 48 (100.0%) | 2.48 |
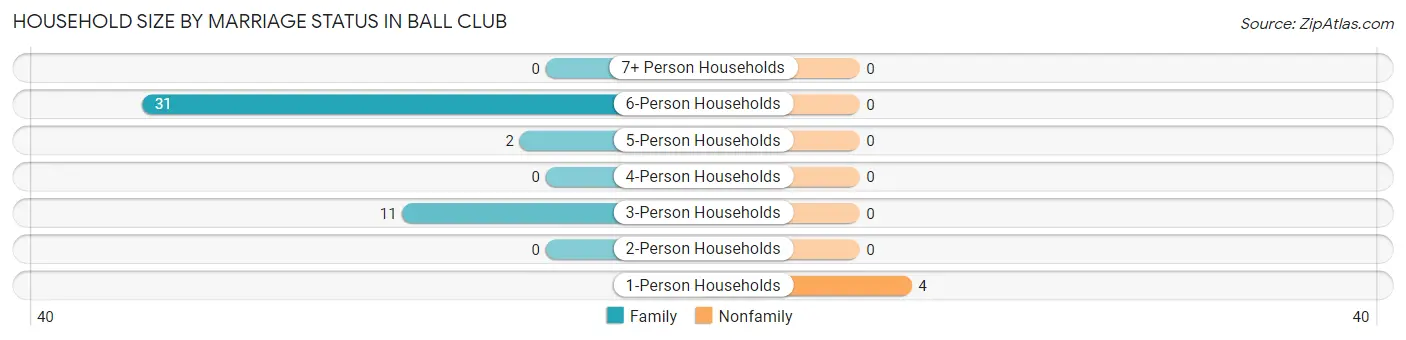
Household Size by Marriage Status in Ball Club
Out of a total of 48 households in Ball Club, 44 (91.7%) are family households, while 4 (8.3%) are nonfamily households. The most numerous type of family households are 6-person households, comprising 31, and the most common type of nonfamily households are 1-person households, comprising 4.
| Household Size | Family Households | Nonfamily Households |
| 1-Person Households | - | 4 (8.3%) |
| 2-Person Households | 0 (0.0%) | 0 (0.0%) |
| 3-Person Households | 11 (22.9%) | 0 (0.0%) |
| 4-Person Households | 0 (0.0%) | 0 (0.0%) |
| 5-Person Households | 2 (4.2%) | 0 (0.0%) |
| 6-Person Households | 31 (64.6%) | 0 (0.0%) |
| 7+ Person Households | 0 (0.0%) | 0 (0.0%) |
| Total | 44 (91.7%) | 4 (8.3%) |
Female Fertility in Ball Club
Fertility by Age in Ball Club
Average fertility rate in Ball Club is 188.0 births per 1,000 women. Women in the age bracket of 35 to 50 years have the highest fertility rate with 188.0 births per 1,000 women. Women in the age bracket of 35 to 50 years acount for 100.0% of all women with births.
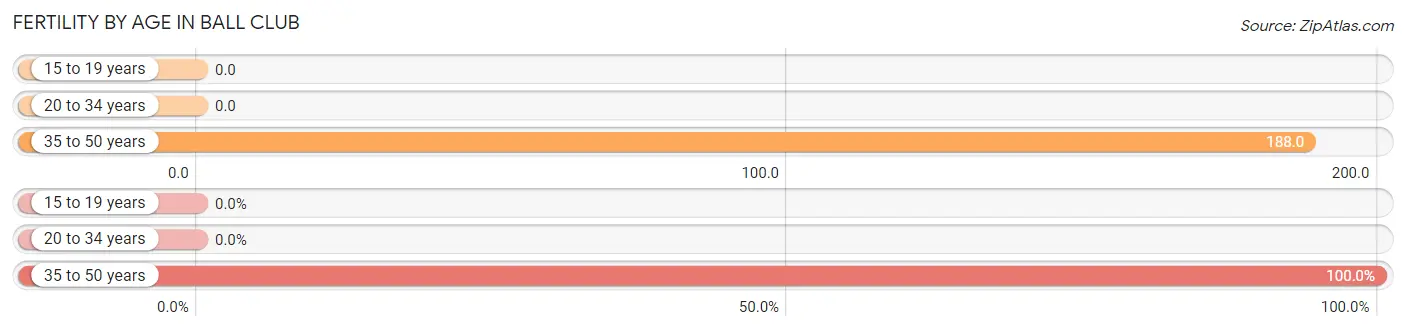
| Age Bracket | Women with Births | Births / 1,000 Women |
| 15 to 19 years | 0 (0.0%) | 0.0 |
| 20 to 34 years | 0 (0.0%) | 0.0 |
| 35 to 50 years | 3 (100.0%) | 188.0 |
| Total | 3 (100.0%) | 188.0 |
Fertility by Age by Marriage Status in Ball Club
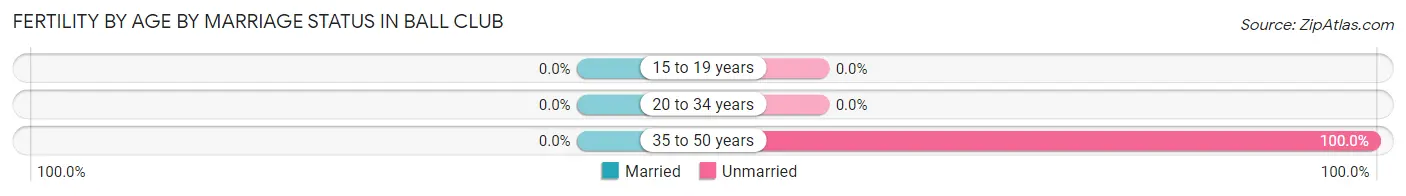
| Age Bracket | Married | Unmarried |
| 15 to 19 years | 0 (0.0%) | 0 (0.0%) |
| 20 to 34 years | 0 (0.0%) | 0 (0.0%) |
| 35 to 50 years | 0 (0.0%) | 3 (100.0%) |
| Total | 0 (0.0%) | 3 (100.0%) |
Fertility by Education in Ball Club
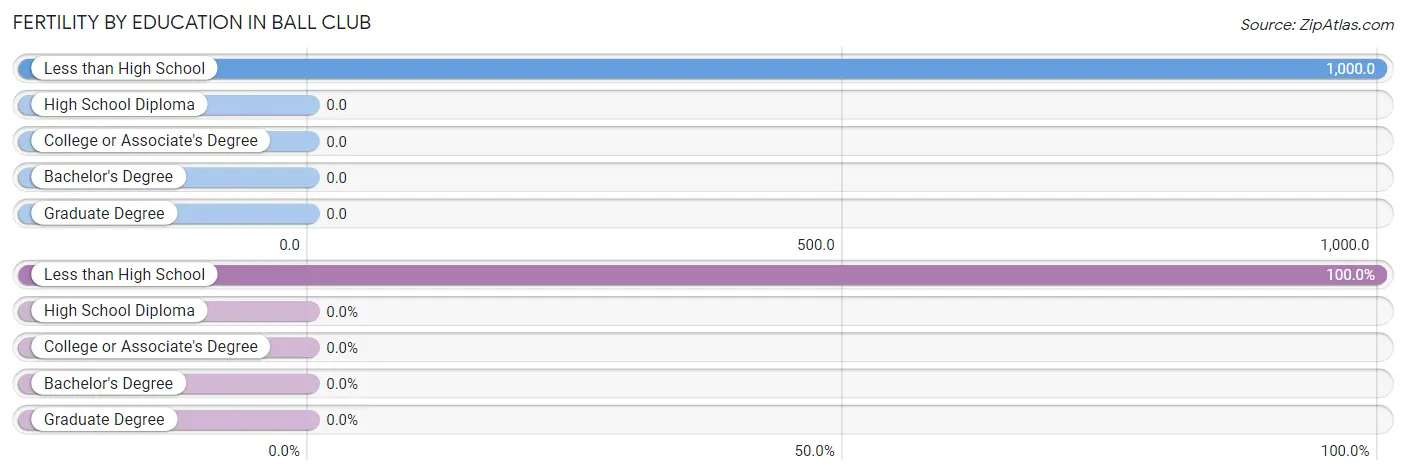
| Educational Attainment | Women with Births | Births / 1,000 Women |
| Less than High School | 3 (100.0%) | 1,000.0 |
| High School Diploma | 0 (0.0%) | 0.0 |
| College or Associate's Degree | 0 (0.0%) | 0.0 |
| Bachelor's Degree | 0 (0.0%) | 0.0 |
| Graduate Degree | 0 (0.0%) | 0.0 |
| Total | 3 (100.0%) | 188.0 |
Fertility by Education by Marriage Status in Ball Club
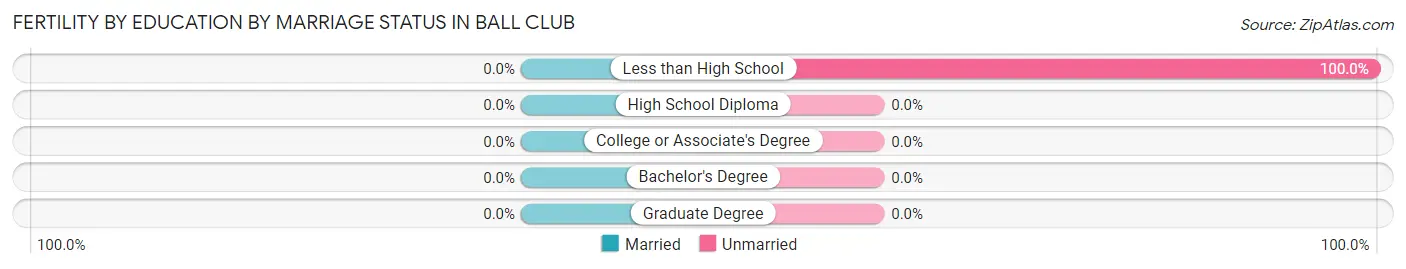
| Educational Attainment | Married | Unmarried |
| Less than High School | 0 (0.0%) | 3 (100.0%) |
| High School Diploma | 0 (0.0%) | 0 (0.0%) |
| College or Associate's Degree | 0 (0.0%) | 0 (0.0%) |
| Bachelor's Degree | 0 (0.0%) | 0 (0.0%) |
| Graduate Degree | 0 (0.0%) | 0 (0.0%) |
| Total | 0 (0.0%) | 3 (100.0%) |
Employment Characteristics in Ball Club
Employment by Class of Employer in Ball Club
Among the 33 employed individuals in Ball Club, private company employees (16 | 48.5%), self-employed (not incorporated) (13 | 39.4%), and self-employed (incorporated) (4 | 12.1%) make up the most common classes of employment.
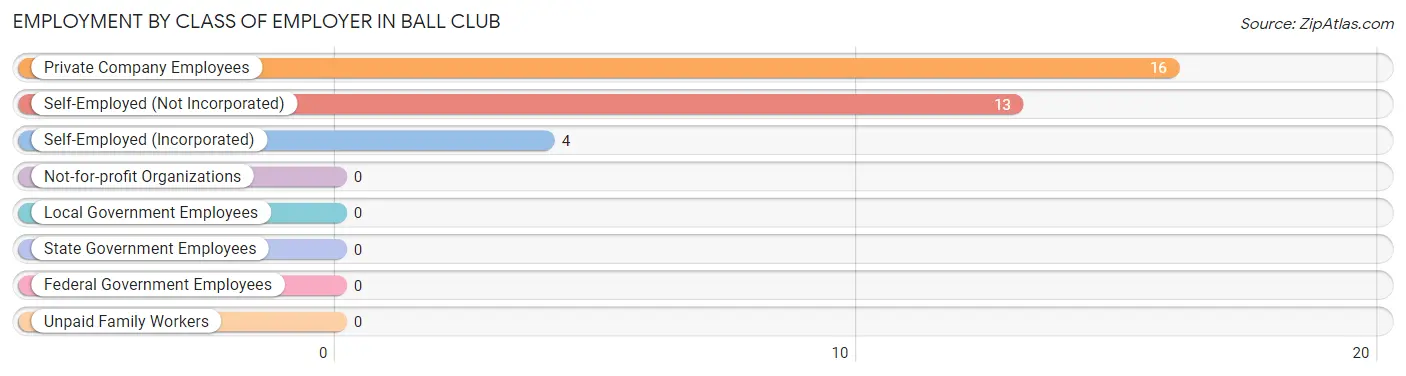
| Employer Class | # Employees | % Employees |
| Private Company Employees | 16 | 48.5% |
| Self-Employed (Incorporated) | 4 | 12.1% |
| Self-Employed (Not Incorporated) | 13 | 39.4% |
| Not-for-profit Organizations | 0 | 0.0% |
| Local Government Employees | 0 | 0.0% |
| State Government Employees | 0 | 0.0% |
| Federal Government Employees | 0 | 0.0% |
| Unpaid Family Workers | 0 | 0.0% |
| Total | 33 | 100.0% |
Employment Status by Age in Ball Club
According to the labor force statistics for Ball Club, out of the total population over 16 years of age (82), 43.9% or 36 individuals are in the labor force, with 8.3% or 3 of them unemployed. The age group with the highest labor force participation rate is 30 to 34 years, with 100.0% or 3 individuals in the labor force. Within the labor force, the 30 to 34 years age range has the highest percentage of unemployed individuals, with 100.0% or 3 of them being unemployed.
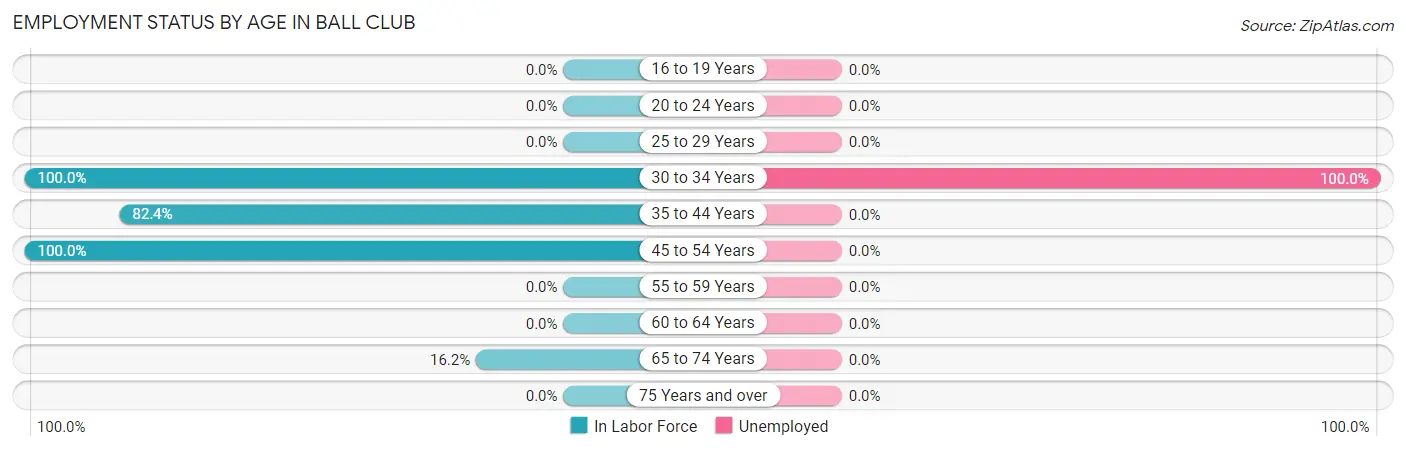
| Age Bracket | In Labor Force | Unemployed |
| 16 to 19 Years | 0 (0.0%) | 0 (0.0%) |
| 20 to 24 Years | 0 (0.0%) | 0 (0.0%) |
| 25 to 29 Years | 0 (0.0%) | 0 (0.0%) |
| 30 to 34 Years | 3 (100.0%) | 3 (100.0%) |
| 35 to 44 Years | 14 (82.4%) | 0 (0.0%) |
| 45 to 54 Years | 13 (100.0%) | 0 (0.0%) |
| 55 to 59 Years | 0 (0.0%) | 0 (0.0%) |
| 60 to 64 Years | 0 (0.0%) | 0 (0.0%) |
| 65 to 74 Years | 6 (16.2%) | 0 (0.0%) |
| 75 Years and over | 0 (0.0%) | 0 (0.0%) |
| Total | 36 (43.9%) | 3 (8.3%) |
Employment Status by Educational Attainment in Ball Club
According to labor force statistics for Ball Club, 90.9% of individuals (30) out of the total population between 25 and 64 years of age (33) are in the labor force, with 10.0% or 3 of them being unemployed. The group with the highest labor force participation rate are those with the educational attainment of college / associate degree, with 100.0% or 16 individuals in the labor force. Within the labor force, individuals with college / associate degree education have the highest percentage of unemployment, with 18.8% or 3 of them being unemployed.
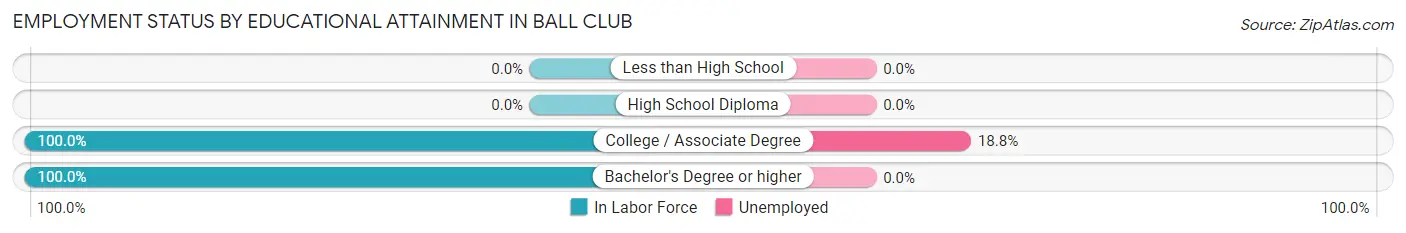
| Educational Attainment | In Labor Force | Unemployed |
| Less than High School | 0 (0.0%) | 0 (0.0%) |
| High School Diploma | 0 (0.0%) | 0 (0.0%) |
| College / Associate Degree | 16 (100.0%) | 3 (18.8%) |
| Bachelor's Degree or higher | 14 (100.0%) | 0 (0.0%) |
| Total | 30 (90.9%) | 3 (10.0%) |
Employment Occupations by Sex in Ball Club
Management, Business, Science and Arts Occupations
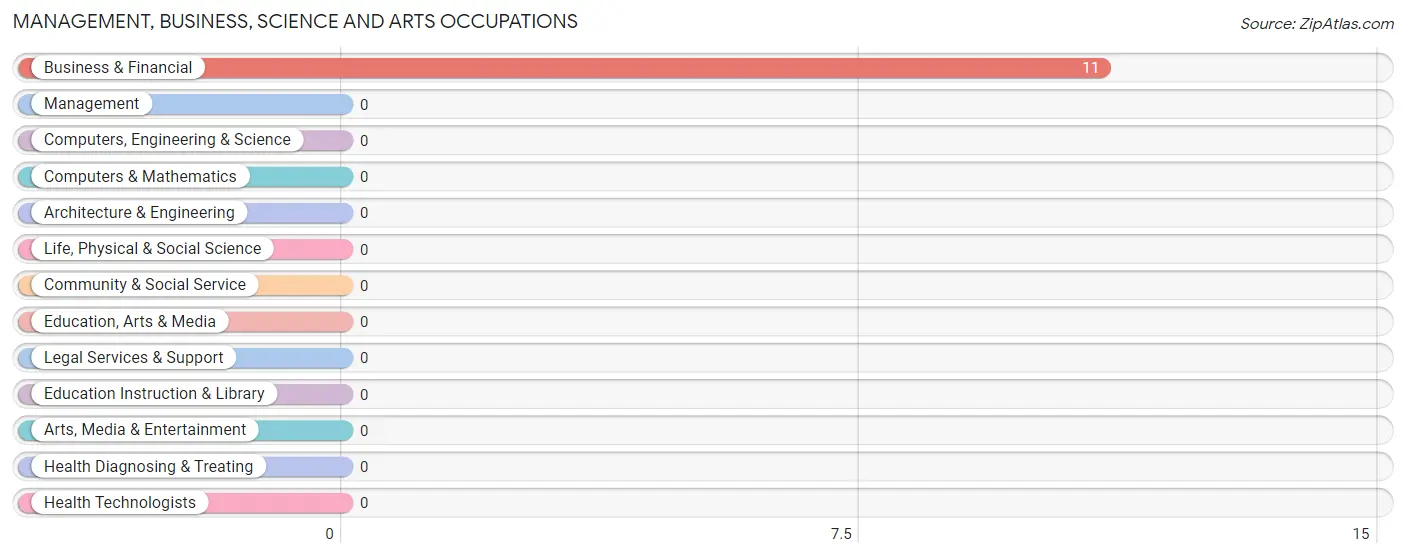
The most common Management, Business, Science and Arts occupations in Ball Club are , and Business & Financial (11 | 33.3%).
Management, Business, Science and Arts Occupations by Sex
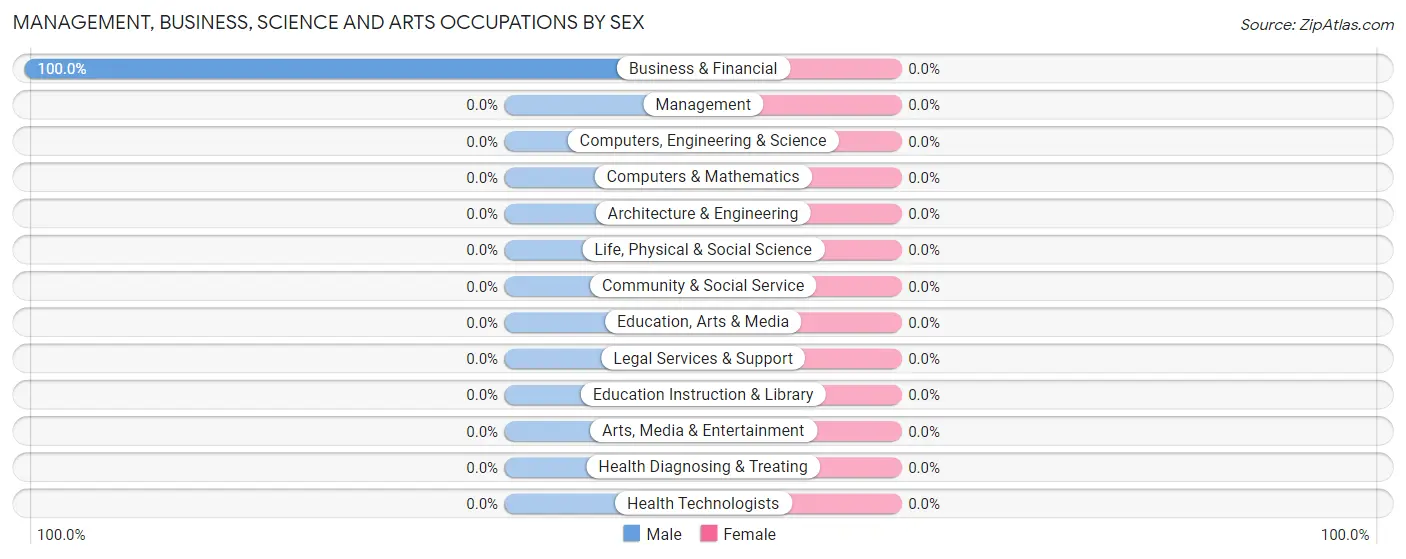
| Occupation | Male | Female |
| Management | 0 (0.0%) | 0 (0.0%) |
| Business & Financial | 11 (100.0%) | 0 (0.0%) |
| Computers, Engineering & Science | 0 (0.0%) | 0 (0.0%) |
| Computers & Mathematics | 0 (0.0%) | 0 (0.0%) |
| Architecture & Engineering | 0 (0.0%) | 0 (0.0%) |
| Life, Physical & Social Science | 0 (0.0%) | 0 (0.0%) |
| Community & Social Service | 0 (0.0%) | 0 (0.0%) |
| Education, Arts & Media | 0 (0.0%) | 0 (0.0%) |
| Legal Services & Support | 0 (0.0%) | 0 (0.0%) |
| Education Instruction & Library | 0 (0.0%) | 0 (0.0%) |
| Arts, Media & Entertainment | 0 (0.0%) | 0 (0.0%) |
| Health Diagnosing & Treating | 0 (0.0%) | 0 (0.0%) |
| Health Technologists | 0 (0.0%) | 0 (0.0%) |
| Total (Category) | 11 (100.0%) | 0 (0.0%) |
| Total (Overall) | 14 (42.4%) | 19 (57.6%) |
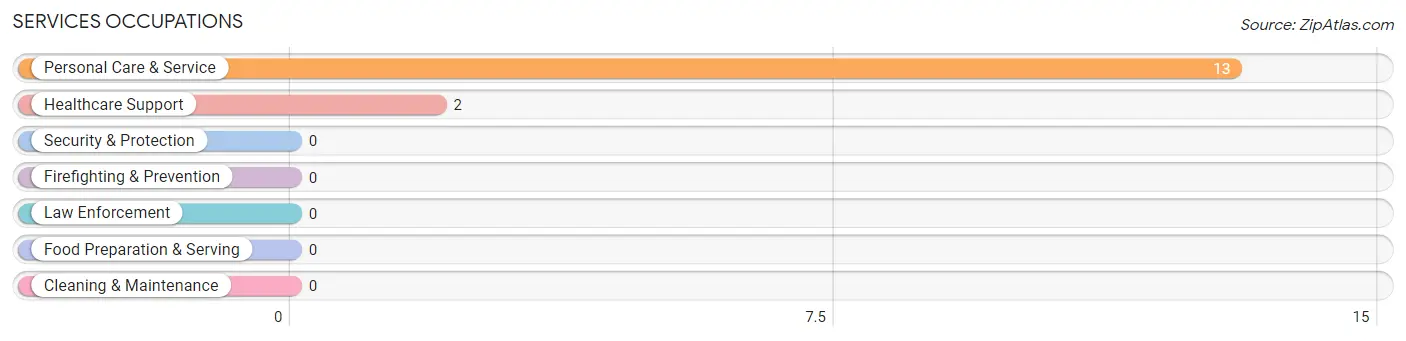
Services Occupations
The most common Services occupations in Ball Club are Personal Care & Service (13 | 39.4%), and Healthcare Support (2 | 6.1%).
Services Occupations by Sex
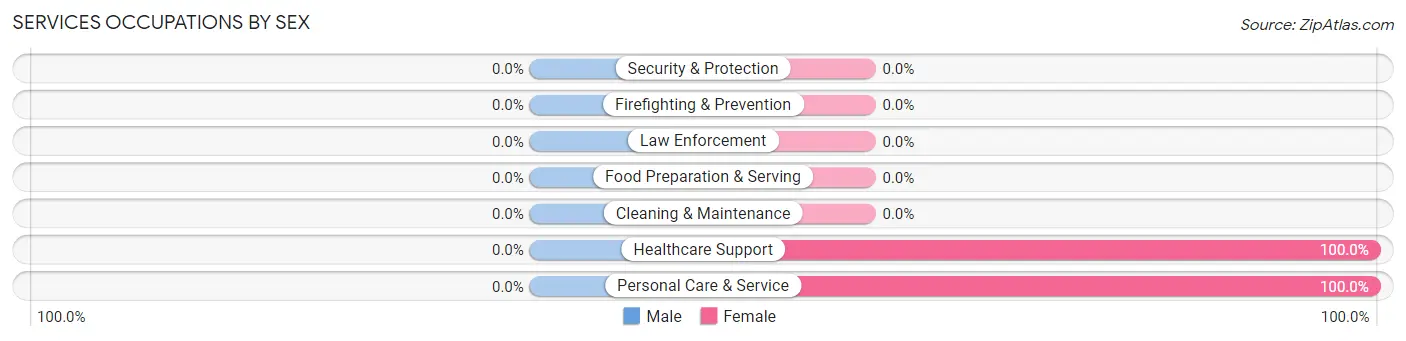
| Occupation | Male | Female |
| Healthcare Support | 0 (0.0%) | 2 (100.0%) |
| Security & Protection | 0 (0.0%) | 0 (0.0%) |
| Firefighting & Prevention | 0 (0.0%) | 0 (0.0%) |
| Law Enforcement | 0 (0.0%) | 0 (0.0%) |
| Food Preparation & Serving | 0 (0.0%) | 0 (0.0%) |
| Cleaning & Maintenance | 0 (0.0%) | 0 (0.0%) |
| Personal Care & Service | 0 (0.0%) | 13 (100.0%) |
| Total (Category) | 0 (0.0%) | 15 (100.0%) |
| Total (Overall) | 14 (42.4%) | 19 (57.6%) |
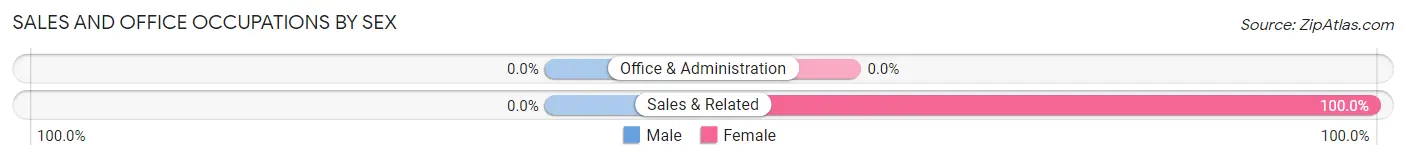
Sales and Office Occupations
The most common Sales and Office occupations in Ball Club are , and Sales & Related (4 | 12.1%).
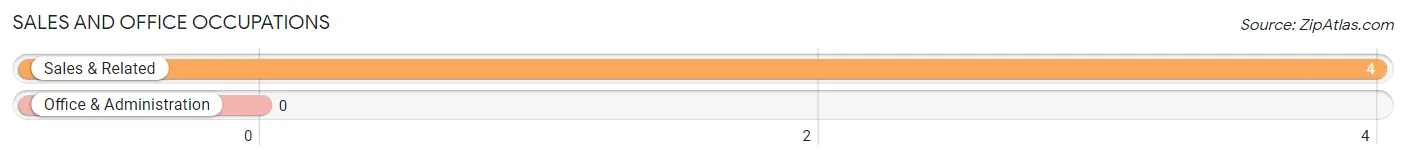
Sales and Office Occupations by Sex
| Occupation | Male | Female |
| Sales & Related | 0 (0.0%) | 4 (100.0%) |
| Office & Administration | 0 (0.0%) | 0 (0.0%) |
| Total (Category) | 0 (0.0%) | 4 (100.0%) |
| Total (Overall) | 14 (42.4%) | 19 (57.6%) |
Natural Resources, Construction and Maintenance Occupations
The most common Natural Resources, Construction and Maintenance occupations in Ball Club are , and Construction & Extraction (3 | 9.1%).
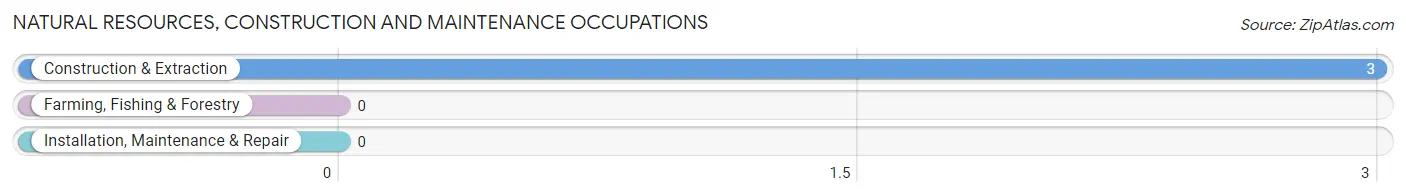
Natural Resources, Construction and Maintenance Occupations by Sex
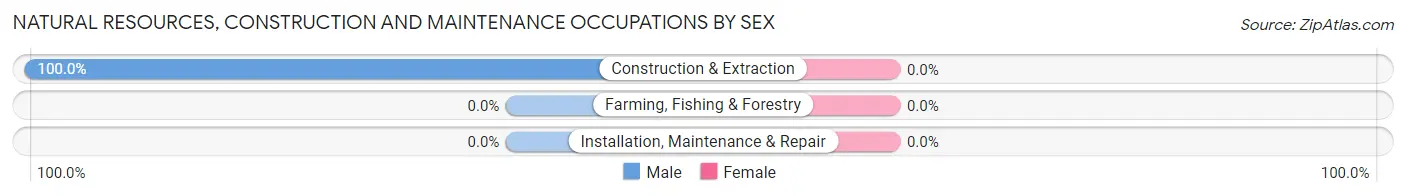
| Occupation | Male | Female |
| Farming, Fishing & Forestry | 0 (0.0%) | 0 (0.0%) |
| Construction & Extraction | 3 (100.0%) | 0 (0.0%) |
| Installation, Maintenance & Repair | 0 (0.0%) | 0 (0.0%) |
| Total (Category) | 3 (100.0%) | 0 (0.0%) |
| Total (Overall) | 14 (42.4%) | 19 (57.6%) |
Production, Transportation and Moving Occupations
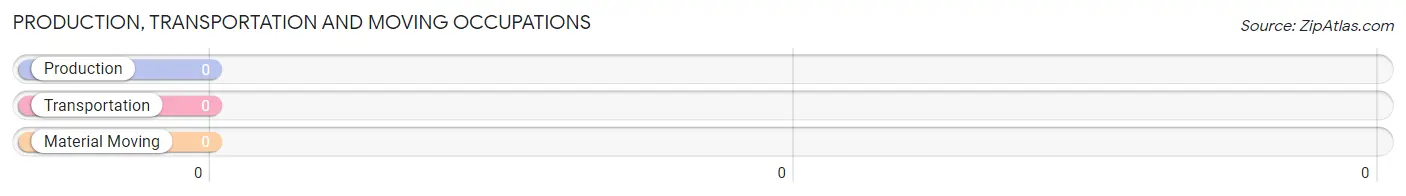
Production, Transportation and Moving Occupations by Sex
| Occupation | Male | Female |
| Production | 0 (0.0%) | 0 (0.0%) |
| Transportation | 0 (0.0%) | 0 (0.0%) |
| Material Moving | 0 (0.0%) | 0 (0.0%) |
| Total (Category) | 0 (0.0%) | 0 (0.0%) |
| Total (Overall) | 14 (42.4%) | 19 (57.6%) |
Employment Industries by Sex in Ball Club
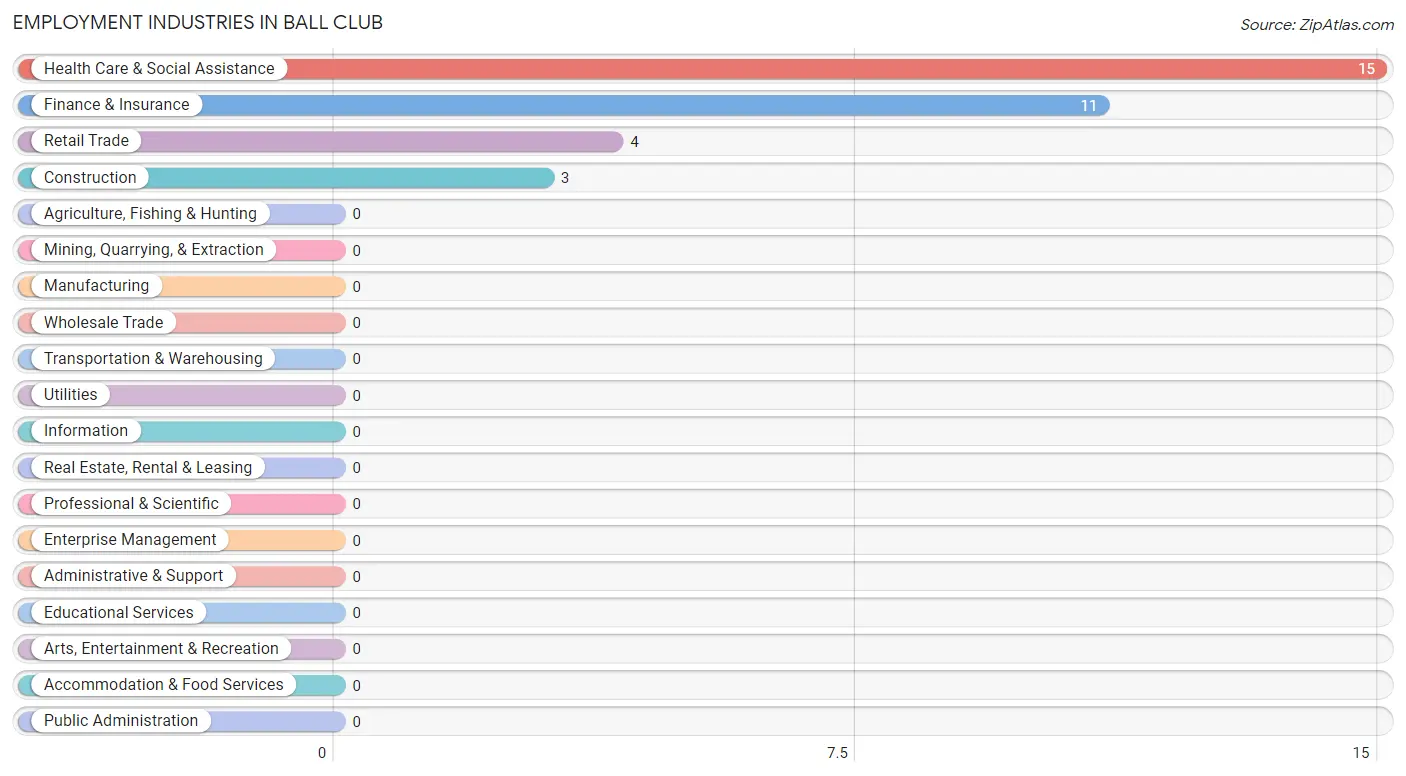
Employment Industries in Ball Club
The major employment industries in Ball Club include Health Care & Social Assistance (15 | 45.5%), Finance & Insurance (11 | 33.3%), Retail Trade (4 | 12.1%), and Construction (3 | 9.1%).
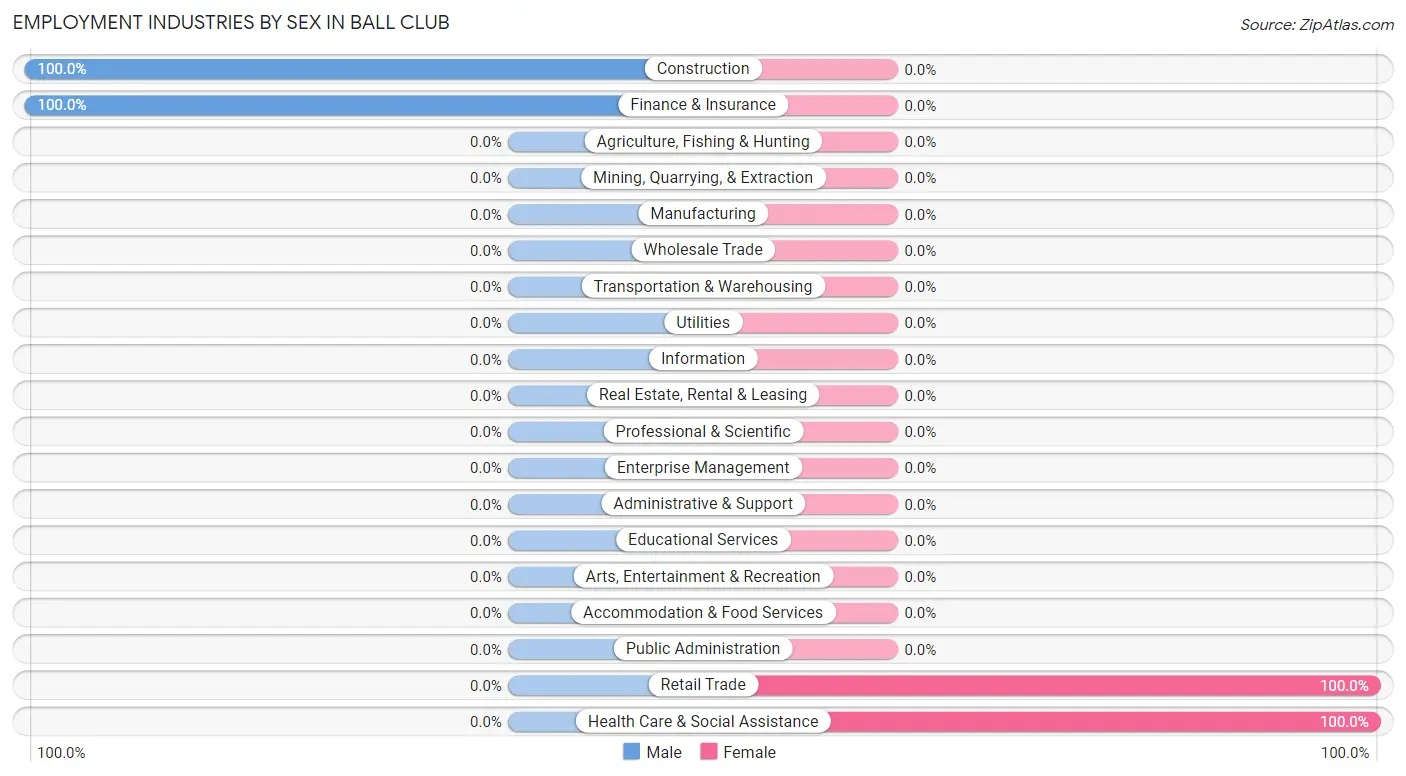
Employment Industries by Sex in Ball Club
The Ball Club industries that see more men than women are Construction (100.0%), and Finance & Insurance (100.0%), whereas the industries that tend to have a higher number of women are Retail Trade (100.0%), and Health Care & Social Assistance (100.0%).
| Industry | Male | Female |
| Agriculture, Fishing & Hunting | 0 (0.0%) | 0 (0.0%) |
| Mining, Quarrying, & Extraction | 0 (0.0%) | 0 (0.0%) |
| Construction | 3 (100.0%) | 0 (0.0%) |
| Manufacturing | 0 (0.0%) | 0 (0.0%) |
| Wholesale Trade | 0 (0.0%) | 0 (0.0%) |
| Retail Trade | 0 (0.0%) | 4 (100.0%) |
| Transportation & Warehousing | 0 (0.0%) | 0 (0.0%) |
| Utilities | 0 (0.0%) | 0 (0.0%) |
| Information | 0 (0.0%) | 0 (0.0%) |
| Finance & Insurance | 11 (100.0%) | 0 (0.0%) |
| Real Estate, Rental & Leasing | 0 (0.0%) | 0 (0.0%) |
| Professional & Scientific | 0 (0.0%) | 0 (0.0%) |
| Enterprise Management | 0 (0.0%) | 0 (0.0%) |
| Administrative & Support | 0 (0.0%) | 0 (0.0%) |
| Educational Services | 0 (0.0%) | 0 (0.0%) |
| Health Care & Social Assistance | 0 (0.0%) | 15 (100.0%) |
| Arts, Entertainment & Recreation | 0 (0.0%) | 0 (0.0%) |
| Accommodation & Food Services | 0 (0.0%) | 0 (0.0%) |
| Public Administration | 0 (0.0%) | 0 (0.0%) |
| Total | 14 (42.4%) | 19 (57.6%) |
Education in Ball Club
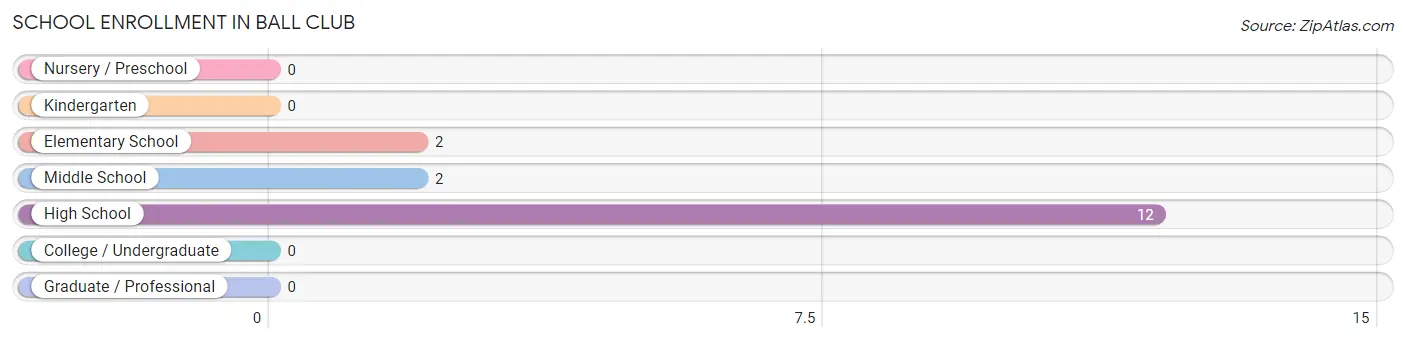
School Enrollment in Ball Club
The most common levels of schooling among the 16 students in Ball Club are high school (12 | 75.0%), elementary school (2 | 12.5%), and middle school (2 | 12.5%).
| School Level | # Students | % Students |
| Nursery / Preschool | 0 | 0.0% |
| Kindergarten | 0 | 0.0% |
| Elementary School | 2 | 12.5% |
| Middle School | 2 | 12.5% |
| High School | 12 | 75.0% |
| College / Undergraduate | 0 | 0.0% |
| Graduate / Professional | 0 | 0.0% |
| Total | 16 | 100.0% |
School Enrollment by Age by Funding Source in Ball Club
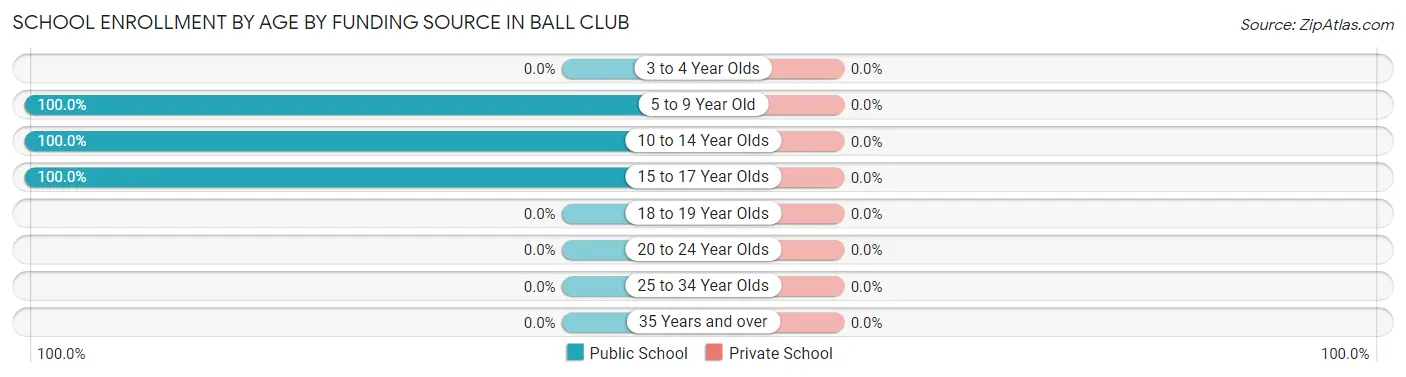
| Age Bracket | Public School | Private School |
| 3 to 4 Year Olds | 0 (0.0%) | 0 (0.0%) |
| 5 to 9 Year Old | 2 (100.0%) | 0 (0.0%) |
| 10 to 14 Year Olds | 2 (100.0%) | 0 (0.0%) |
| 15 to 17 Year Olds | 12 (100.0%) | 0 (0.0%) |
| 18 to 19 Year Olds | 0 (0.0%) | 0 (0.0%) |
| 20 to 24 Year Olds | 0 (0.0%) | 0 (0.0%) |
| 25 to 34 Year Olds | 0 (0.0%) | 0 (0.0%) |
| 35 Years and over | 0 (0.0%) | 0 (0.0%) |
| Total | 16 (100.0%) | 0 (0.0%) |
Educational Attainment by Field of Study in Ball Club
Education (11 | 78.6%), and business (3 | 21.4%) are the most common fields of study among 14 individuals in Ball Club who have obtained a bachelor's degree or higher.
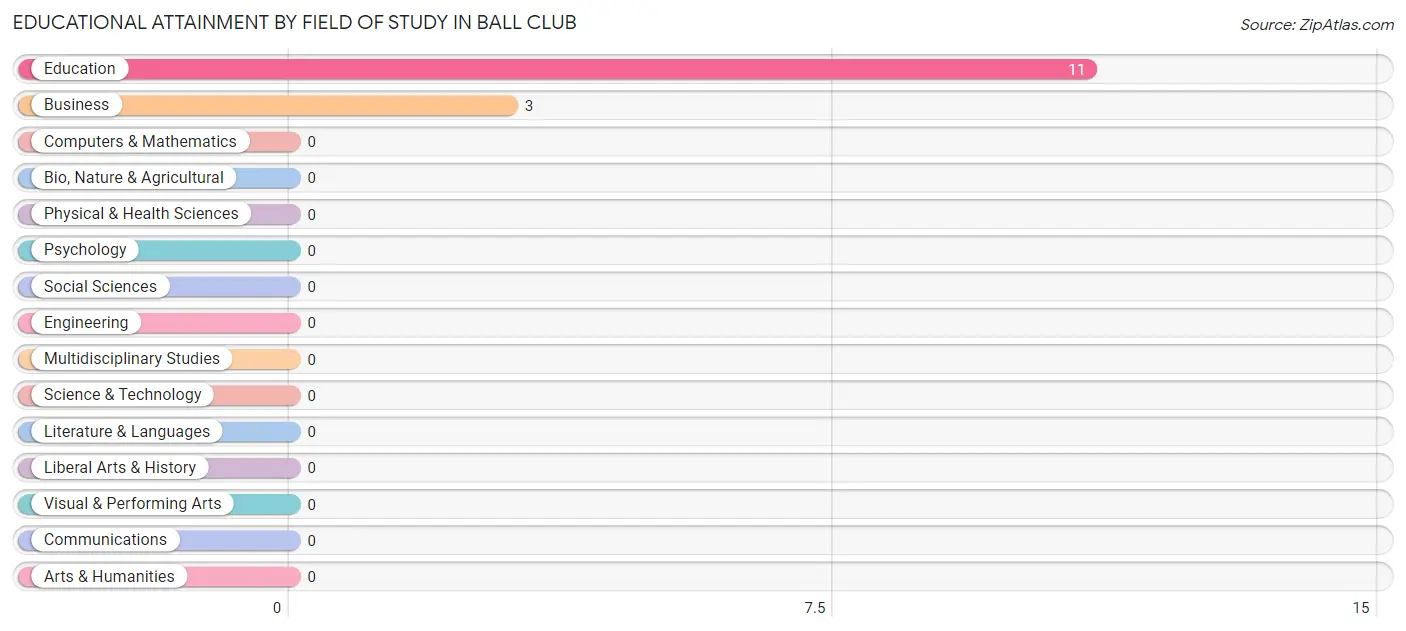
| Field of Study | # Graduates | % Graduates |
| Computers & Mathematics | 0 | 0.0% |
| Bio, Nature & Agricultural | 0 | 0.0% |
| Physical & Health Sciences | 0 | 0.0% |
| Psychology | 0 | 0.0% |
| Social Sciences | 0 | 0.0% |
| Engineering | 0 | 0.0% |
| Multidisciplinary Studies | 0 | 0.0% |
| Science & Technology | 0 | 0.0% |
| Business | 3 | 21.4% |
| Education | 11 | 78.6% |
| Literature & Languages | 0 | 0.0% |
| Liberal Arts & History | 0 | 0.0% |
| Visual & Performing Arts | 0 | 0.0% |
| Communications | 0 | 0.0% |
| Arts & Humanities | 0 | 0.0% |
| Total | 14 | 100.0% |
Transportation & Commute in Ball Club
Vehicle Availability by Sex in Ball Club
The most prevalent vehicle ownership categories in Ball Club are males with 3 vehicles (14, accounting for 100.0%) and females with 3 vehicles (15, making up 73.7%).
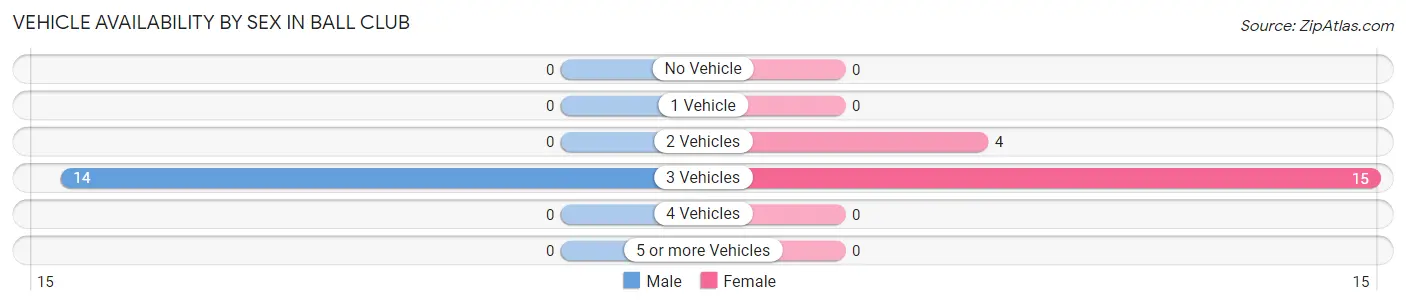
| Vehicles Available | Male | Female |
| No Vehicle | 0 (0.0%) | 0 (0.0%) |
| 1 Vehicle | 0 (0.0%) | 0 (0.0%) |
| 2 Vehicles | 0 (0.0%) | 4 (21.0%) |
| 3 Vehicles | 14 (100.0%) | 15 (78.9%) |
| 4 Vehicles | 0 (0.0%) | 0 (0.0%) |
| 5 or more Vehicles | 0 (0.0%) | 0 (0.0%) |
| Total | 14 (100.0%) | 19 (100.0%) |
Commute Time in Ball Club
The most frequently occuring commute durations in Ball Club are 30 to 34 minutes (24 commuters, 82.8%), 40 to 44 minutes (3 commuters, 10.3%), and 15 to 19 minutes (2 commuters, 6.9%).
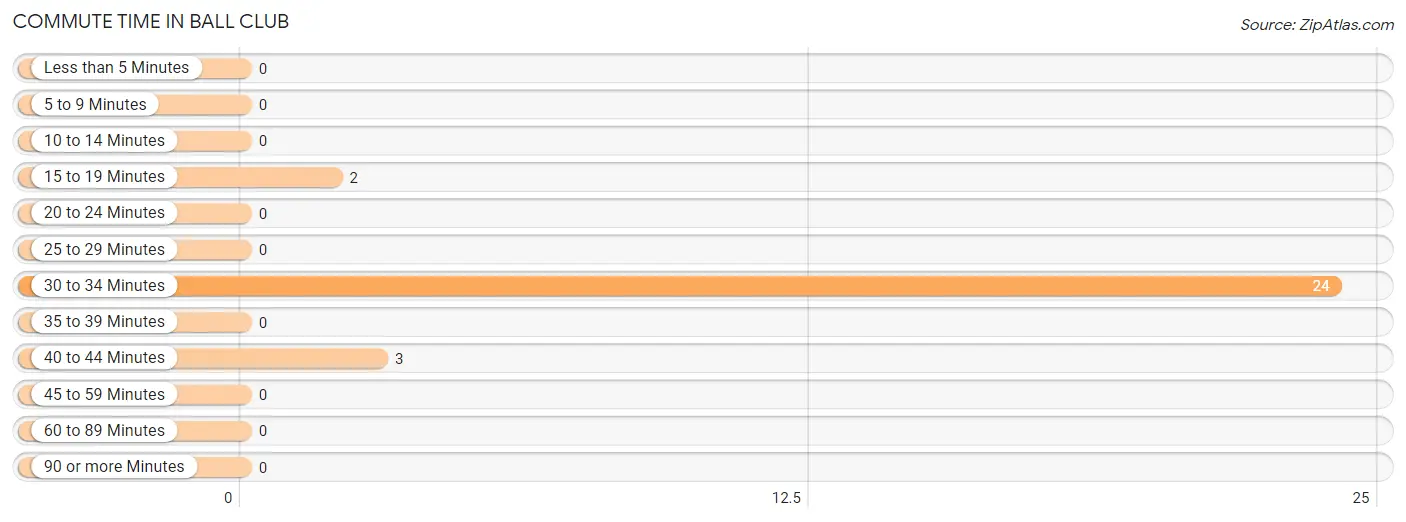
| Commute Time | # Commuters | % Commuters |
| Less than 5 Minutes | 0 | 0.0% |
| 5 to 9 Minutes | 0 | 0.0% |
| 10 to 14 Minutes | 0 | 0.0% |
| 15 to 19 Minutes | 2 | 6.9% |
| 20 to 24 Minutes | 0 | 0.0% |
| 25 to 29 Minutes | 0 | 0.0% |
| 30 to 34 Minutes | 24 | 82.8% |
| 35 to 39 Minutes | 0 | 0.0% |
| 40 to 44 Minutes | 3 | 10.3% |
| 45 to 59 Minutes | 0 | 0.0% |
| 60 to 89 Minutes | 0 | 0.0% |
| 90 or more Minutes | 0 | 0.0% |
Commute Time by Sex in Ball Club
The most common commute times in Ball Club are 30 to 34 minutes (11 commuters, 78.6%) for males and 30 to 34 minutes (13 commuters, 86.7%) for females.
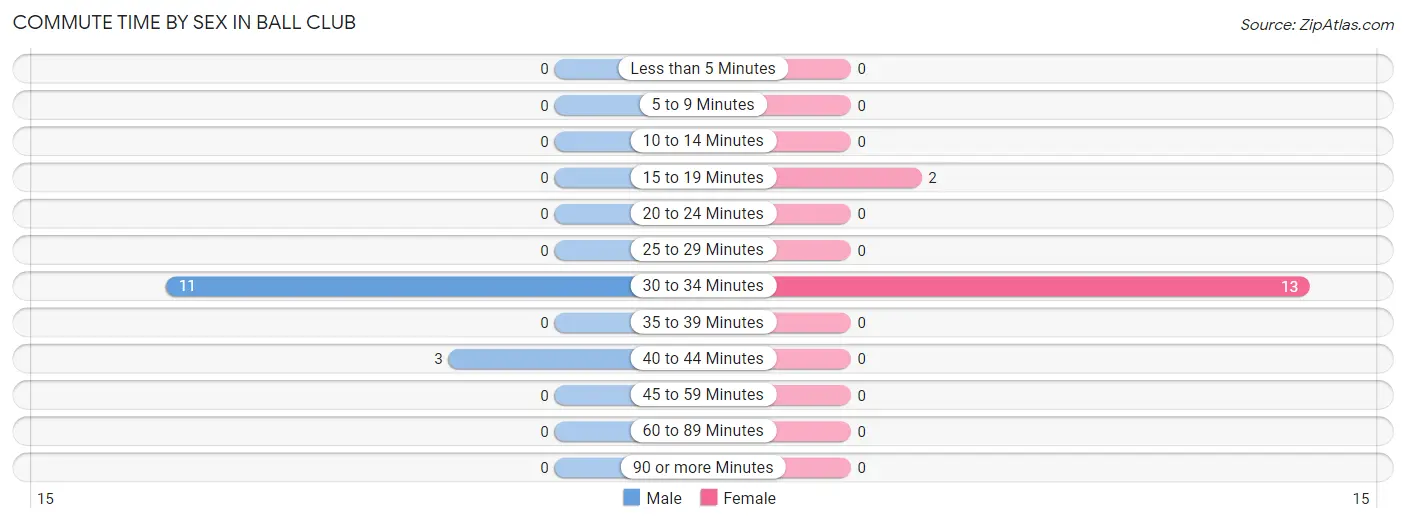
| Commute Time | Male | Female |
| Less than 5 Minutes | 0 (0.0%) | 0 (0.0%) |
| 5 to 9 Minutes | 0 (0.0%) | 0 (0.0%) |
| 10 to 14 Minutes | 0 (0.0%) | 0 (0.0%) |
| 15 to 19 Minutes | 0 (0.0%) | 2 (13.3%) |
| 20 to 24 Minutes | 0 (0.0%) | 0 (0.0%) |
| 25 to 29 Minutes | 0 (0.0%) | 0 (0.0%) |
| 30 to 34 Minutes | 11 (78.6%) | 13 (86.7%) |
| 35 to 39 Minutes | 0 (0.0%) | 0 (0.0%) |
| 40 to 44 Minutes | 3 (21.4%) | 0 (0.0%) |
| 45 to 59 Minutes | 0 (0.0%) | 0 (0.0%) |
| 60 to 89 Minutes | 0 (0.0%) | 0 (0.0%) |
| 90 or more Minutes | 0 (0.0%) | 0 (0.0%) |
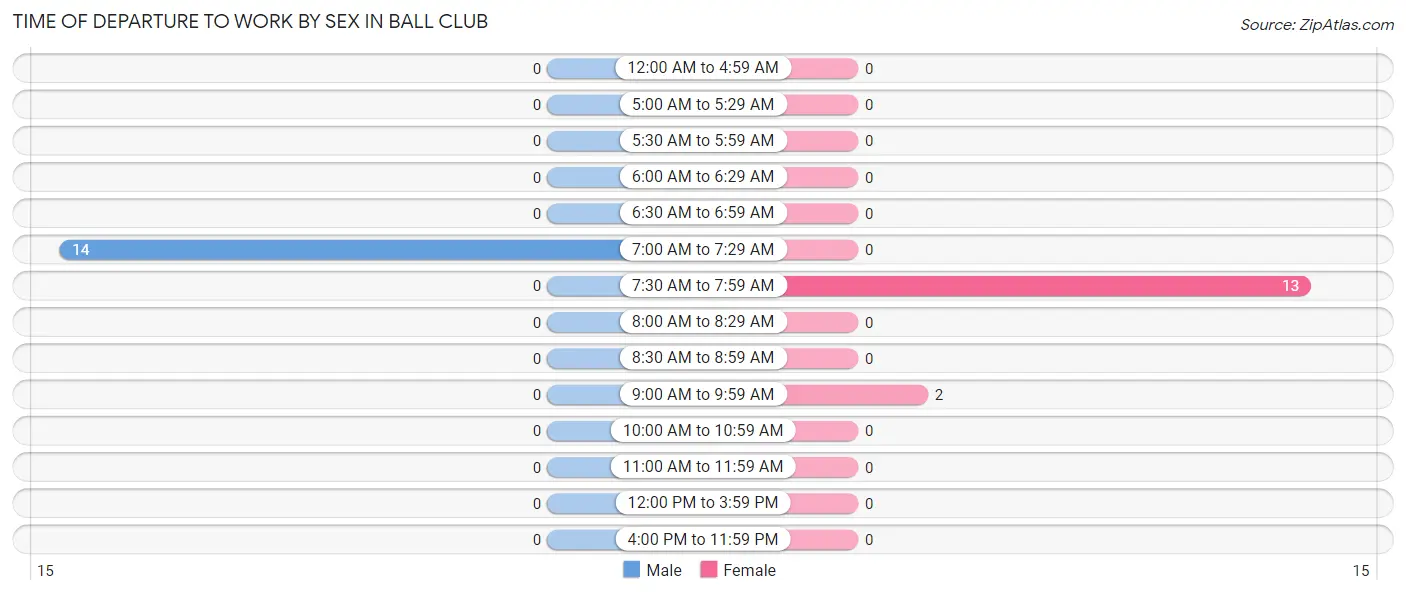
Time of Departure to Work by Sex in Ball Club
The most frequent times of departure to work in Ball Club are 7:00 AM to 7:29 AM (14, 100.0%) for males and 7:30 AM to 7:59 AM (13, 86.7%) for females.
| Time of Departure | Male | Female |
| 12:00 AM to 4:59 AM | 0 (0.0%) | 0 (0.0%) |
| 5:00 AM to 5:29 AM | 0 (0.0%) | 0 (0.0%) |
| 5:30 AM to 5:59 AM | 0 (0.0%) | 0 (0.0%) |
| 6:00 AM to 6:29 AM | 0 (0.0%) | 0 (0.0%) |
| 6:30 AM to 6:59 AM | 0 (0.0%) | 0 (0.0%) |
| 7:00 AM to 7:29 AM | 14 (100.0%) | 0 (0.0%) |
| 7:30 AM to 7:59 AM | 0 (0.0%) | 13 (86.7%) |
| 8:00 AM to 8:29 AM | 0 (0.0%) | 0 (0.0%) |
| 8:30 AM to 8:59 AM | 0 (0.0%) | 0 (0.0%) |
| 9:00 AM to 9:59 AM | 0 (0.0%) | 2 (13.3%) |
| 10:00 AM to 10:59 AM | 0 (0.0%) | 0 (0.0%) |
| 11:00 AM to 11:59 AM | 0 (0.0%) | 0 (0.0%) |
| 12:00 PM to 3:59 PM | 0 (0.0%) | 0 (0.0%) |
| 4:00 PM to 11:59 PM | 0 (0.0%) | 0 (0.0%) |
| Total | 14 (100.0%) | 15 (100.0%) |
Housing Occupancy in Ball Club
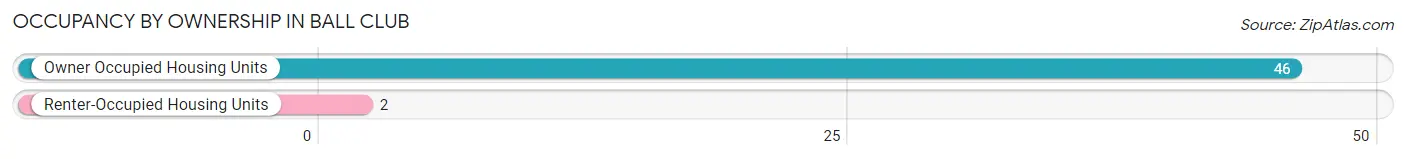
Occupancy by Ownership in Ball Club
Of the total 48 dwellings in Ball Club, owner-occupied units account for 46 (95.8%), while renter-occupied units make up 2 (4.2%).
| Occupancy | # Housing Units | % Housing Units |
| Owner Occupied Housing Units | 46 | 95.8% |
| Renter-Occupied Housing Units | 2 | 4.2% |
| Total Occupied Housing Units | 48 | 100.0% |
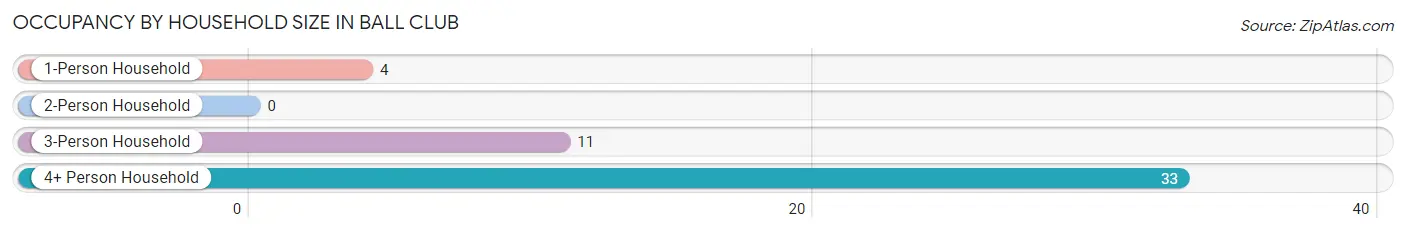
Occupancy by Household Size in Ball Club
| Household Size | # Housing Units | % Housing Units |
| 1-Person Household | 4 | 8.3% |
| 2-Person Household | 0 | 0.0% |
| 3-Person Household | 11 | 22.9% |
| 4+ Person Household | 33 | 68.8% |
| Total Housing Units | 48 | 100.0% |
Occupancy by Ownership by Household Size in Ball Club
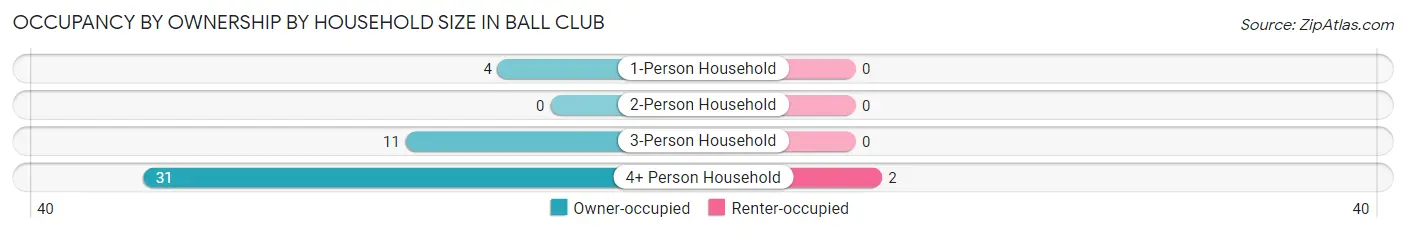
| Household Size | Owner-occupied | Renter-occupied |
| 1-Person Household | 4 (100.0%) | 0 (0.0%) |
| 2-Person Household | 0 (0.0%) | 0 (0.0%) |
| 3-Person Household | 11 (100.0%) | 0 (0.0%) |
| 4+ Person Household | 31 (93.9%) | 2 (6.1%) |
| Total Housing Units | 46 (95.8%) | 2 (4.2%) |
Occupancy by Educational Attainment in Ball Club
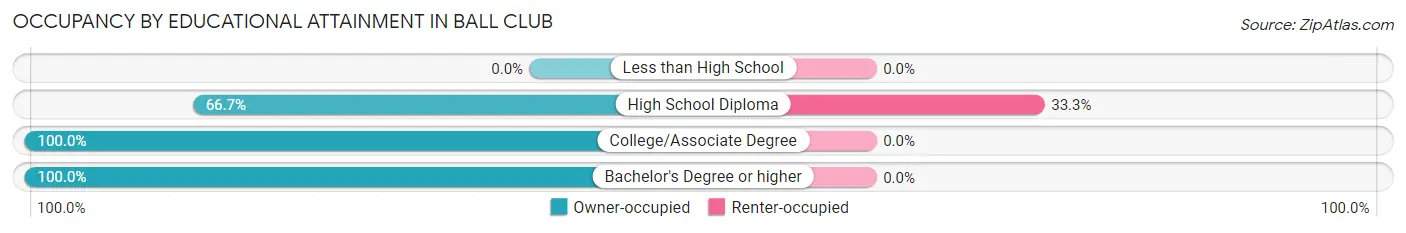
| Household Size | Owner-occupied | Renter-occupied |
| Less than High School | 0 (0.0%) | 0 (0.0%) |
| High School Diploma | 4 (66.7%) | 2 (33.3%) |
| College/Associate Degree | 31 (100.0%) | 0 (0.0%) |
| Bachelor's Degree or higher | 11 (100.0%) | 0 (0.0%) |
Occupancy by Age of Householder in Ball Club
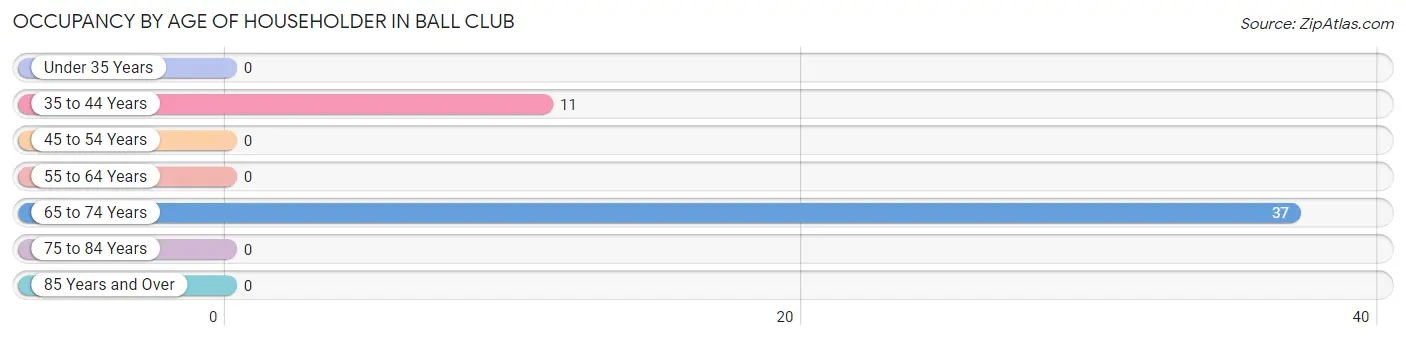
| Age Bracket | # Households | % Households |
| Under 35 Years | 0 | 0.0% |
| 35 to 44 Years | 11 | 22.9% |
| 45 to 54 Years | 0 | 0.0% |
| 55 to 64 Years | 0 | 0.0% |
| 65 to 74 Years | 37 | 77.1% |
| 75 to 84 Years | 0 | 0.0% |
| 85 Years and Over | 0 | 0.0% |
| Total | 48 | 100.0% |
Housing Finances in Ball Club
Median Income by Occupancy in Ball Club
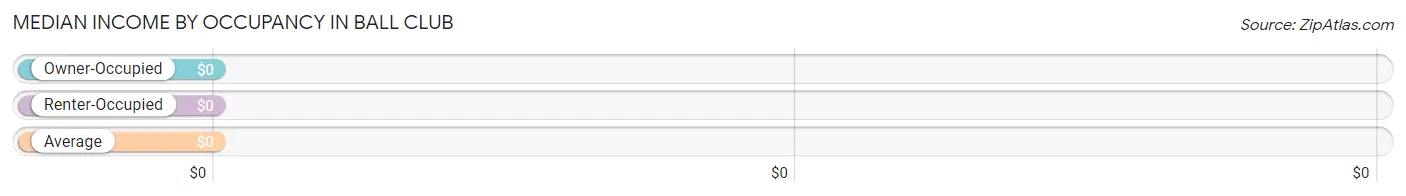
| Occupancy Type | # Households | Median Income |
| Owner-Occupied | 46 (95.8%) | $0 |
| Renter-Occupied | 2 (4.2%) | $0 |
| Average | 48 (100.0%) | $0 |
Occupancy by Householder Income Bracket in Ball Club
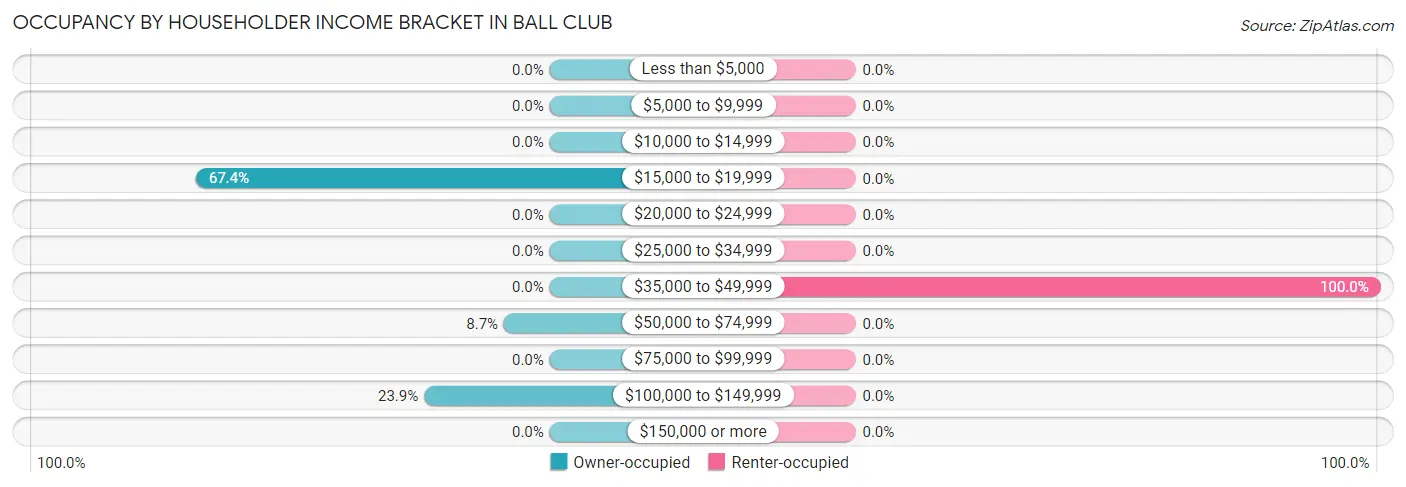
| Income Bracket | Owner-occupied | Renter-occupied |
| Less than $5,000 | 0 (0.0%) | 0 (0.0%) |
| $5,000 to $9,999 | 0 (0.0%) | 0 (0.0%) |
| $10,000 to $14,999 | 0 (0.0%) | 0 (0.0%) |
| $15,000 to $19,999 | 31 (67.4%) | 0 (0.0%) |
| $20,000 to $24,999 | 0 (0.0%) | 0 (0.0%) |
| $25,000 to $34,999 | 0 (0.0%) | 0 (0.0%) |
| $35,000 to $49,999 | 0 (0.0%) | 2 (100.0%) |
| $50,000 to $74,999 | 4 (8.7%) | 0 (0.0%) |
| $75,000 to $99,999 | 0 (0.0%) | 0 (0.0%) |
| $100,000 to $149,999 | 11 (23.9%) | 0 (0.0%) |
| $150,000 or more | 0 (0.0%) | 0 (0.0%) |
| Total | 46 (100.0%) | 2 (100.0%) |
Monthly Housing Cost Tiers in Ball Club
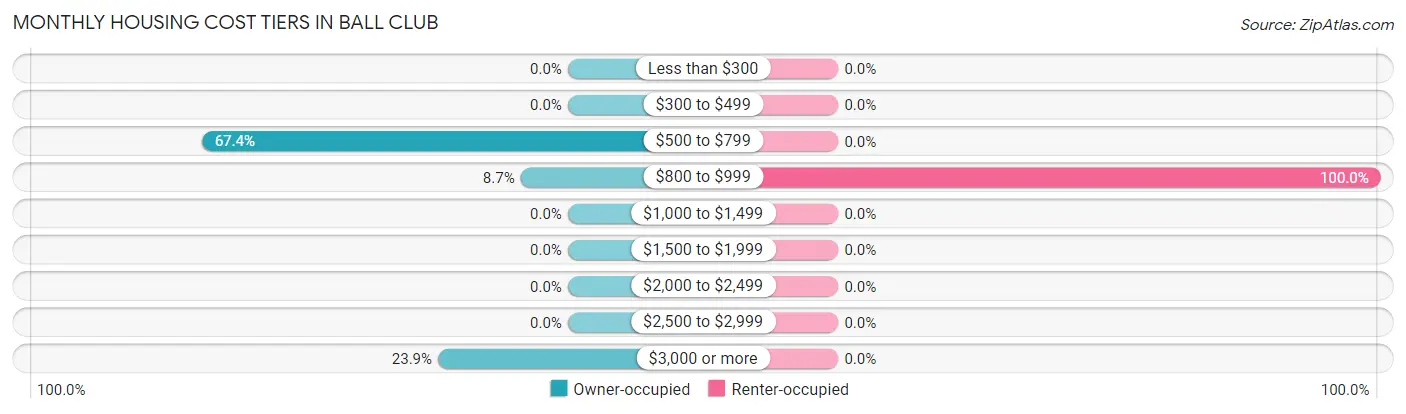
| Monthly Cost | Owner-occupied | Renter-occupied |
| Less than $300 | 0 (0.0%) | 0 (0.0%) |
| $300 to $499 | 0 (0.0%) | 0 (0.0%) |
| $500 to $799 | 31 (67.4%) | 0 (0.0%) |
| $800 to $999 | 4 (8.7%) | 2 (100.0%) |
| $1,000 to $1,499 | 0 (0.0%) | 0 (0.0%) |
| $1,500 to $1,999 | 0 (0.0%) | 0 (0.0%) |
| $2,000 to $2,499 | 0 (0.0%) | 0 (0.0%) |
| $2,500 to $2,999 | 0 (0.0%) | 0 (0.0%) |
| $3,000 or more | 11 (23.9%) | 0 (0.0%) |
| Total | 46 (100.0%) | 2 (100.0%) |
Physical Housing Characteristics in Ball Club
Housing Structures in Ball Club
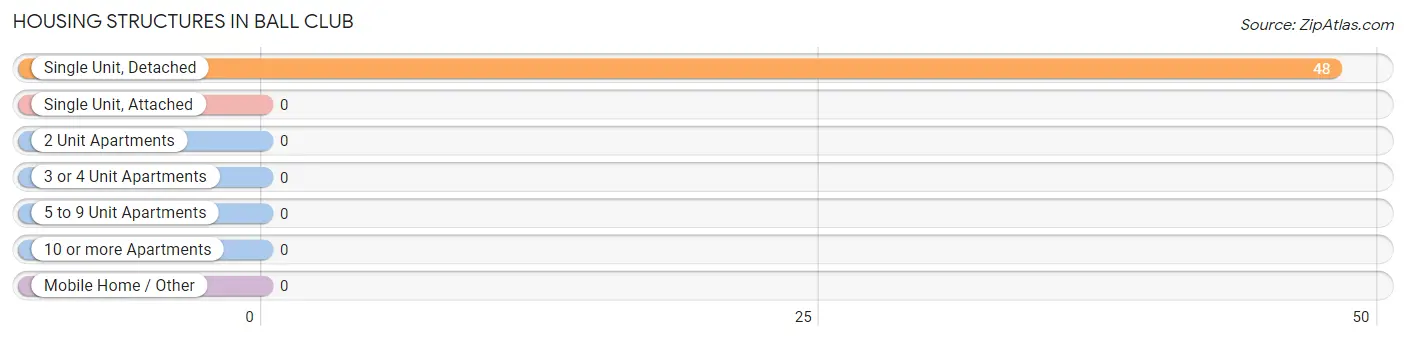
| Structure Type | # Housing Units | % Housing Units |
| Single Unit, Detached | 48 | 100.0% |
| Single Unit, Attached | 0 | 0.0% |
| 2 Unit Apartments | 0 | 0.0% |
| 3 or 4 Unit Apartments | 0 | 0.0% |
| 5 to 9 Unit Apartments | 0 | 0.0% |
| 10 or more Apartments | 0 | 0.0% |
| Mobile Home / Other | 0 | 0.0% |
| Total | 48 | 100.0% |
Housing Structures by Occupancy in Ball Club
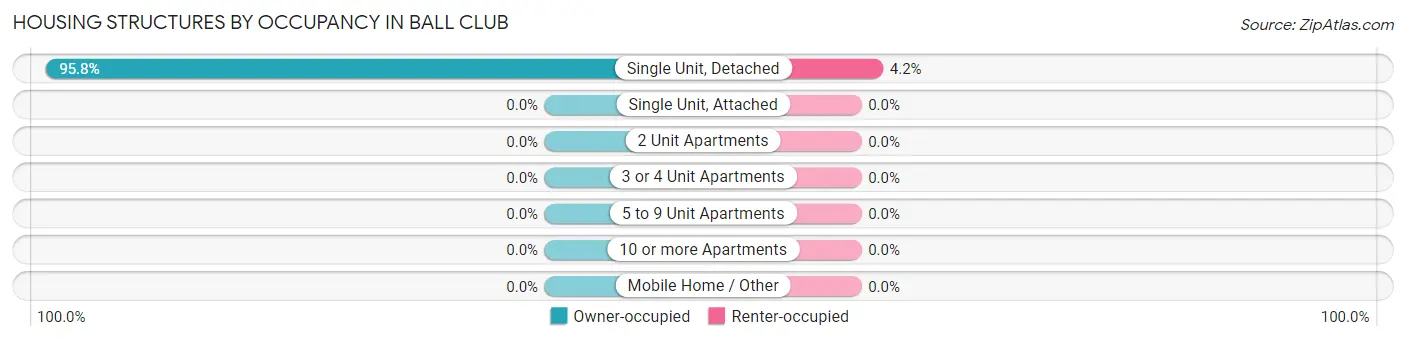
| Structure Type | Owner-occupied | Renter-occupied |
| Single Unit, Detached | 46 (95.8%) | 2 (4.2%) |
| Single Unit, Attached | 0 (0.0%) | 0 (0.0%) |
| 2 Unit Apartments | 0 (0.0%) | 0 (0.0%) |
| 3 or 4 Unit Apartments | 0 (0.0%) | 0 (0.0%) |
| 5 to 9 Unit Apartments | 0 (0.0%) | 0 (0.0%) |
| 10 or more Apartments | 0 (0.0%) | 0 (0.0%) |
| Mobile Home / Other | 0 (0.0%) | 0 (0.0%) |
| Total | 46 (95.8%) | 2 (4.2%) |
Housing Structures by Number of Rooms in Ball Club
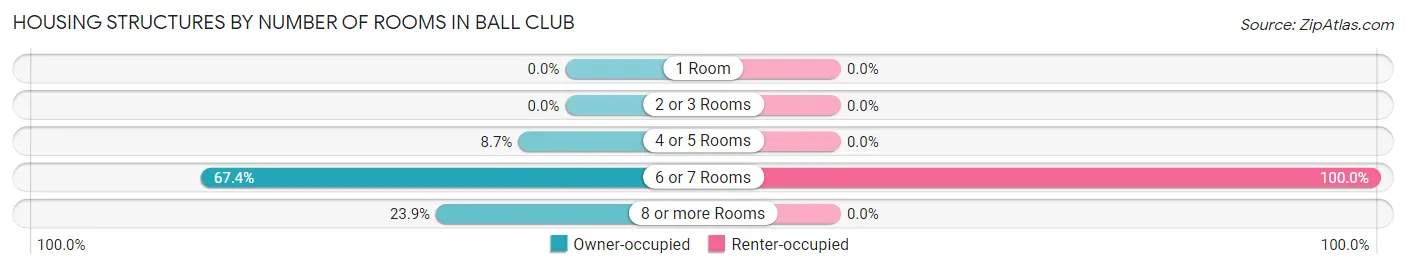
| Number of Rooms | Owner-occupied | Renter-occupied |
| 1 Room | 0 (0.0%) | 0 (0.0%) |
| 2 or 3 Rooms | 0 (0.0%) | 0 (0.0%) |
| 4 or 5 Rooms | 4 (8.7%) | 0 (0.0%) |
| 6 or 7 Rooms | 31 (67.4%) | 2 (100.0%) |
| 8 or more Rooms | 11 (23.9%) | 0 (0.0%) |
| Total | 46 (100.0%) | 2 (100.0%) |
Housing Structure by Heating Type in Ball Club
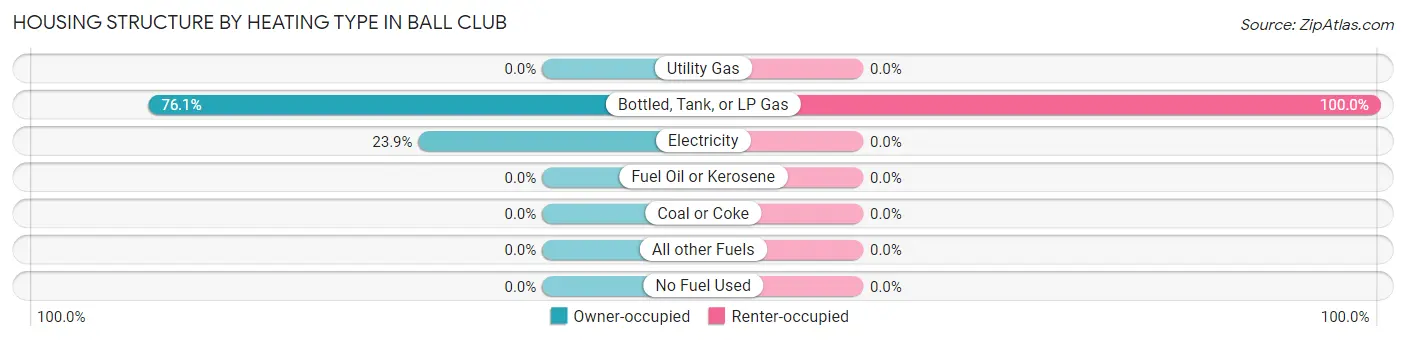
| Heating Type | Owner-occupied | Renter-occupied |
| Utility Gas | 0 (0.0%) | 0 (0.0%) |
| Bottled, Tank, or LP Gas | 35 (76.1%) | 2 (100.0%) |
| Electricity | 11 (23.9%) | 0 (0.0%) |
| Fuel Oil or Kerosene | 0 (0.0%) | 0 (0.0%) |
| Coal or Coke | 0 (0.0%) | 0 (0.0%) |
| All other Fuels | 0 (0.0%) | 0 (0.0%) |
| No Fuel Used | 0 (0.0%) | 0 (0.0%) |
| Total | 46 (100.0%) | 2 (100.0%) |
Household Vehicle Usage in Ball Club
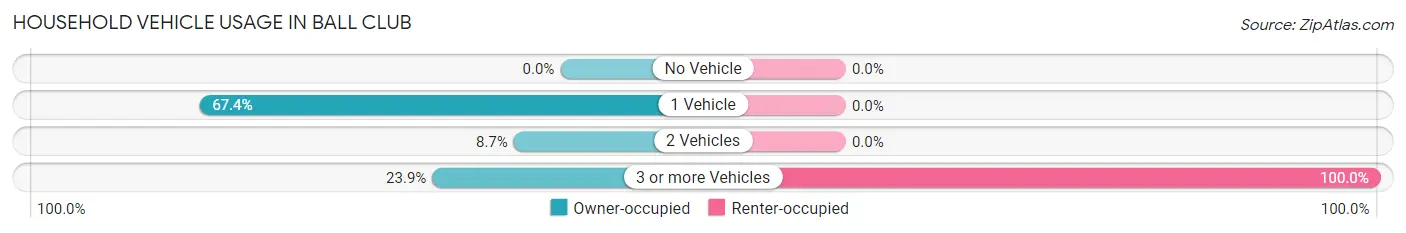
| Vehicles per Household | Owner-occupied | Renter-occupied |
| No Vehicle | 0 (0.0%) | 0 (0.0%) |
| 1 Vehicle | 31 (67.4%) | 0 (0.0%) |
| 2 Vehicles | 4 (8.7%) | 0 (0.0%) |
| 3 or more Vehicles | 11 (23.9%) | 2 (100.0%) |
| Total | 46 (100.0%) | 2 (100.0%) |
Real Estate & Mortgages in Ball Club
Real Estate and Mortgage Overview in Ball Club
| Characteristic | Without Mortgage | With Mortgage |
| Housing Units | 35 | 11 |
| Median Property Value | - | - |
| Median Household Income | - | - |
| Monthly Housing Costs | - | - |
| Real Estate Taxes | - | - |
Property Value by Mortgage Status in Ball Club
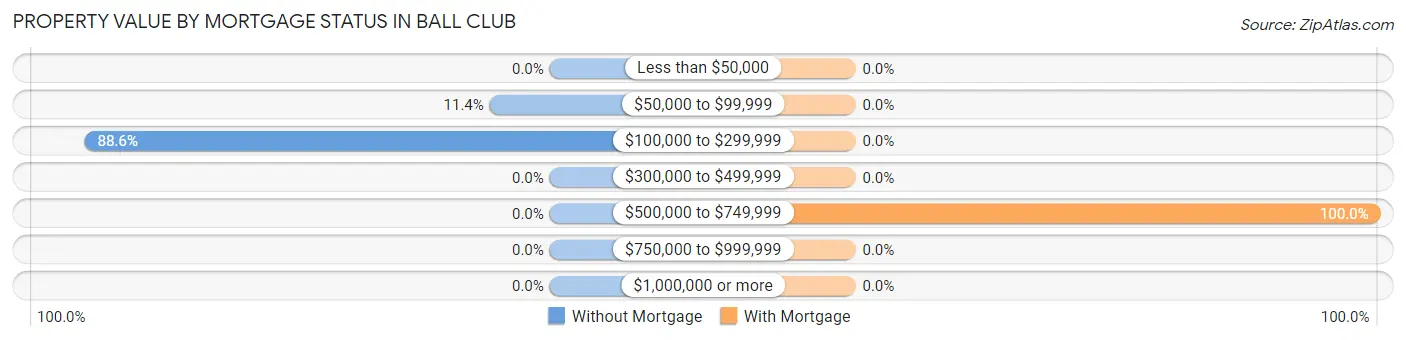
| Property Value | Without Mortgage | With Mortgage |
| Less than $50,000 | 0 (0.0%) | 0 (0.0%) |
| $50,000 to $99,999 | 4 (11.4%) | 0 (0.0%) |
| $100,000 to $299,999 | 31 (88.6%) | 0 (0.0%) |
| $300,000 to $499,999 | 0 (0.0%) | 0 (0.0%) |
| $500,000 to $749,999 | 0 (0.0%) | 11 (100.0%) |
| $750,000 to $999,999 | 0 (0.0%) | 0 (0.0%) |
| $1,000,000 or more | 0 (0.0%) | 0 (0.0%) |
| Total | 35 (100.0%) | 11 (100.0%) |
Household Income by Mortgage Status in Ball Club
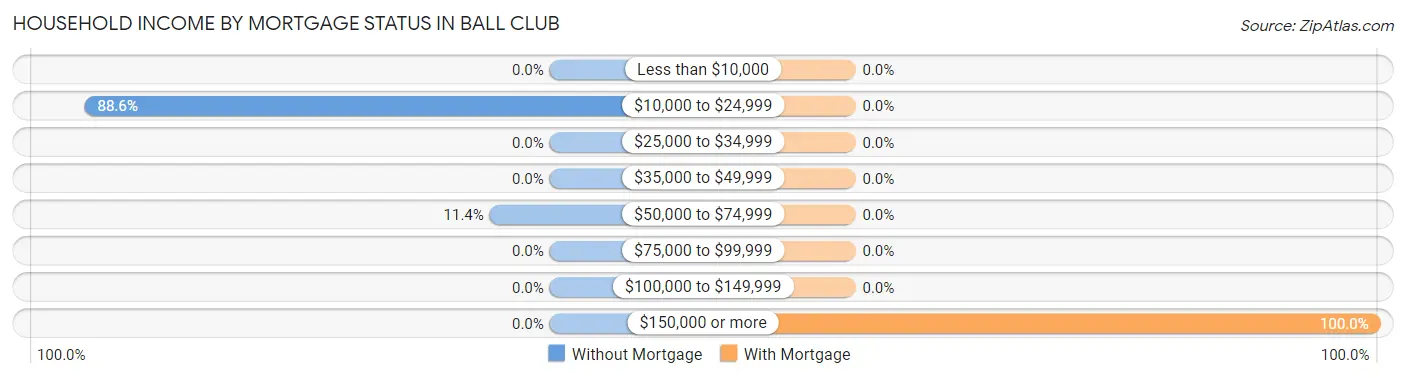
| Household Income | Without Mortgage | With Mortgage |
| Less than $10,000 | 0 (0.0%) | 0 (0.0%) |
| $10,000 to $24,999 | 31 (88.6%) | 0 (0.0%) |
| $25,000 to $34,999 | 0 (0.0%) | 0 (0.0%) |
| $35,000 to $49,999 | 0 (0.0%) | 0 (0.0%) |
| $50,000 to $74,999 | 4 (11.4%) | 0 (0.0%) |
| $75,000 to $99,999 | 0 (0.0%) | 0 (0.0%) |
| $100,000 to $149,999 | 0 (0.0%) | 0 (0.0%) |
| $150,000 or more | 0 (0.0%) | 11 (100.0%) |
| Total | 35 (100.0%) | 11 (100.0%) |
Property Value to Household Income Ratio in Ball Club
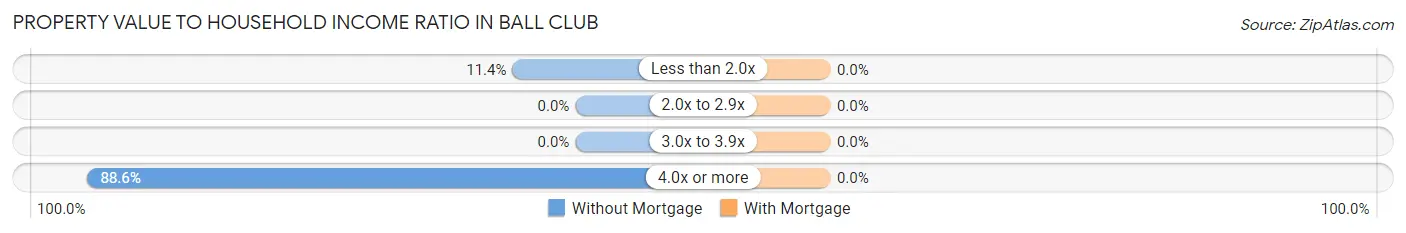
| Value-to-Income Ratio | Without Mortgage | With Mortgage |
| Less than 2.0x | 4 (11.4%) | 0 (0.0%) |
| 2.0x to 2.9x | 0 (0.0%) | 0 (0.0%) |
| 3.0x to 3.9x | 0 (0.0%) | 0 (0.0%) |
| 4.0x or more | 31 (88.6%) | 0 (0.0%) |
| Total | 35 (100.0%) | 11 (100.0%) |
Real Estate Taxes by Mortgage Status in Ball Club
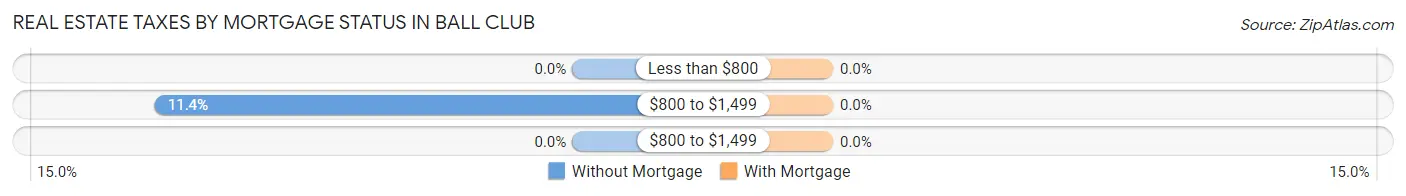
| Property Taxes | Without Mortgage | With Mortgage |
| Less than $800 | 0 (0.0%) | 0 (0.0%) |
| $800 to $1,499 | 4 (11.4%) | 0 (0.0%) |
| $800 to $1,499 | 0 (0.0%) | 0 (0.0%) |
| Total | 35 (100.0%) | 11 (100.0%) |
Health & Disability in Ball Club
Health Insurance Coverage by Age in Ball Club
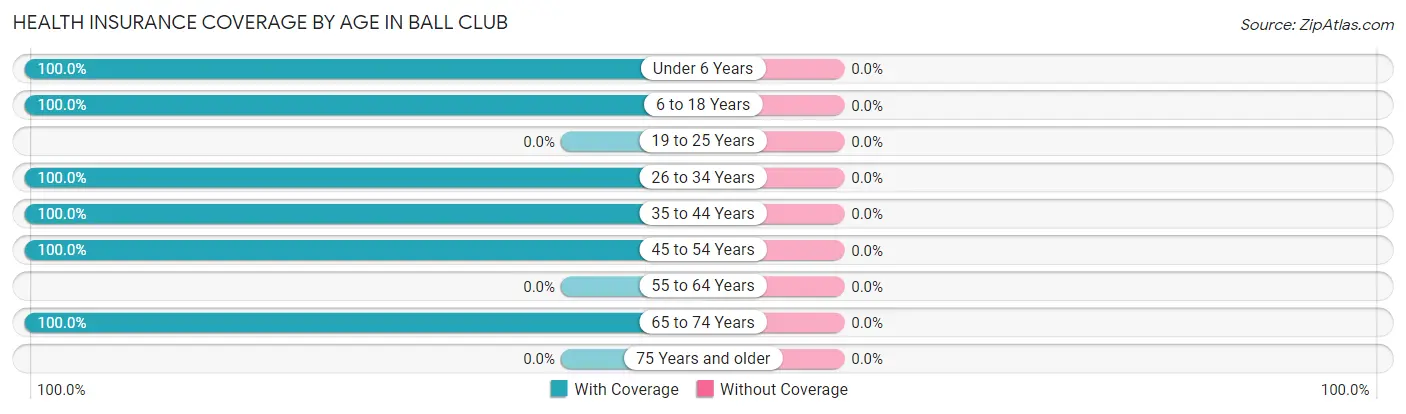
| Age Bracket | With Coverage | Without Coverage |
| Under 6 Years | 33 (100.0%) | 0 (0.0%) |
| 6 to 18 Years | 16 (100.0%) | 0 (0.0%) |
| 19 to 25 Years | 0 (0.0%) | 0 (0.0%) |
| 26 to 34 Years | 3 (100.0%) | 0 (0.0%) |
| 35 to 44 Years | 17 (100.0%) | 0 (0.0%) |
| 45 to 54 Years | 13 (100.0%) | 0 (0.0%) |
| 55 to 64 Years | 0 (0.0%) | 0 (0.0%) |
| 65 to 74 Years | 37 (100.0%) | 0 (0.0%) |
| 75 Years and older | 0 (0.0%) | 0 (0.0%) |
| Total | 119 (100.0%) | 0 (0.0%) |
Health Insurance Coverage by Citizenship Status in Ball Club
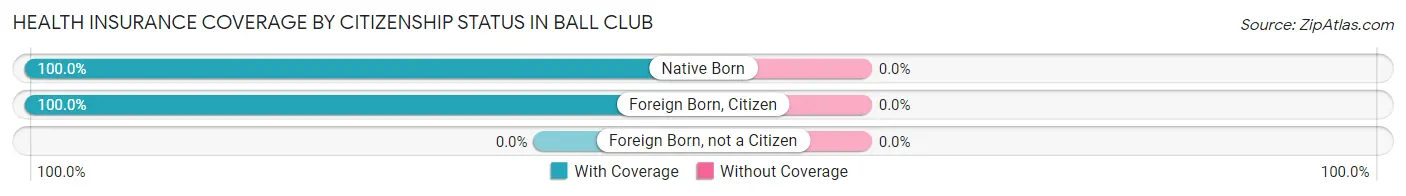
| Citizenship Status | With Coverage | Without Coverage |
| Native Born | 33 (100.0%) | 0 (0.0%) |
| Foreign Born, Citizen | 16 (100.0%) | 0 (0.0%) |
| Foreign Born, not a Citizen | 0 (0.0%) | 0 (0.0%) |
Health Insurance Coverage by Household Income in Ball Club
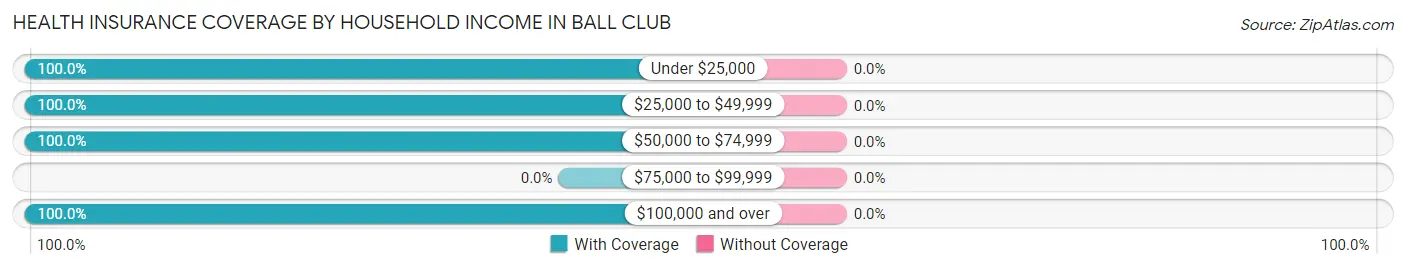
| Household Income | With Coverage | Without Coverage |
| Under $25,000 | 66 (100.0%) | 0 (0.0%) |
| $25,000 to $49,999 | 13 (100.0%) | 0 (0.0%) |
| $50,000 to $74,999 | 4 (100.0%) | 0 (0.0%) |
| $75,000 to $99,999 | 0 (0.0%) | 0 (0.0%) |
| $100,000 and over | 36 (100.0%) | 0 (0.0%) |
Public vs Private Health Insurance Coverage by Age in Ball Club
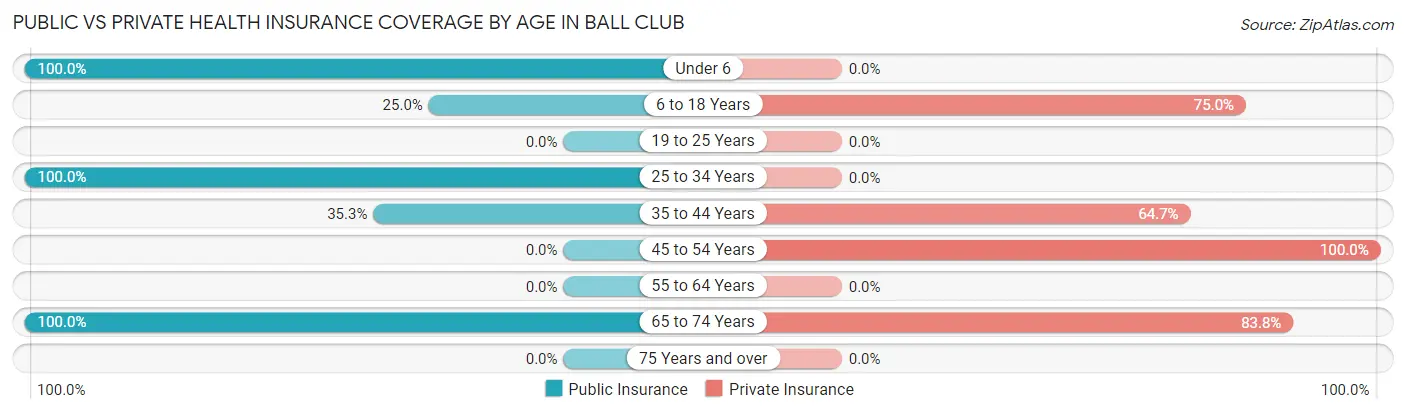
| Age Bracket | Public Insurance | Private Insurance |
| Under 6 | 33 (100.0%) | 0 (0.0%) |
| 6 to 18 Years | 4 (25.0%) | 12 (75.0%) |
| 19 to 25 Years | 0 (0.0%) | 0 (0.0%) |
| 25 to 34 Years | 3 (100.0%) | 0 (0.0%) |
| 35 to 44 Years | 6 (35.3%) | 11 (64.7%) |
| 45 to 54 Years | 0 (0.0%) | 13 (100.0%) |
| 55 to 64 Years | 0 (0.0%) | 0 (0.0%) |
| 65 to 74 Years | 37 (100.0%) | 31 (83.8%) |
| 75 Years and over | 0 (0.0%) | 0 (0.0%) |
| Total | 83 (69.8%) | 67 (56.3%) |
Disability Status by Sex by Age in Ball Club
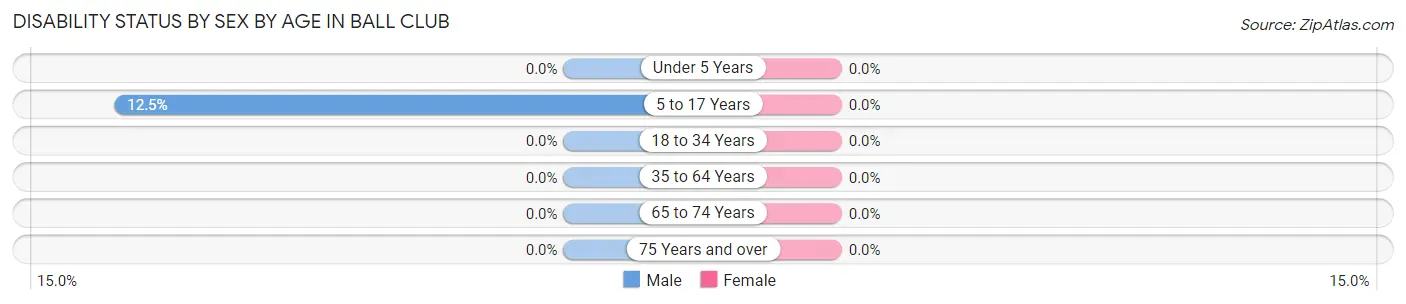
| Age Bracket | Male | Female |
| Under 5 Years | 0 (0.0%) | 0 (0.0%) |
| 5 to 17 Years | 2 (12.5%) | 0 (0.0%) |
| 18 to 34 Years | 0 (0.0%) | 0 (0.0%) |
| 35 to 64 Years | 0 (0.0%) | 0 (0.0%) |
| 65 to 74 Years | 0 (0.0%) | 0 (0.0%) |
| 75 Years and over | 0 (0.0%) | 0 (0.0%) |
Disability Class by Sex by Age in Ball Club
Disability Class: Hearing Difficulty
| Age Bracket | Male | Female |
| Under 5 Years | 0 (0.0%) | 0 (0.0%) |
| 5 to 17 Years | 0 (0.0%) | 0 (0.0%) |
| 18 to 34 Years | 0 (0.0%) | 0 (0.0%) |
| 35 to 64 Years | 0 (0.0%) | 0 (0.0%) |
| 65 to 74 Years | 0 (0.0%) | 0 (0.0%) |
| 75 Years and over | 0 (0.0%) | 0 (0.0%) |
Disability Class: Vision Difficulty
| Age Bracket | Male | Female |
| Under 5 Years | 0 (0.0%) | 0 (0.0%) |
| 5 to 17 Years | 0 (0.0%) | 0 (0.0%) |
| 18 to 34 Years | 0 (0.0%) | 0 (0.0%) |
| 35 to 64 Years | 0 (0.0%) | 0 (0.0%) |
| 65 to 74 Years | 0 (0.0%) | 0 (0.0%) |
| 75 Years and over | 0 (0.0%) | 0 (0.0%) |
Disability Class: Cognitive Difficulty
| Age Bracket | Male | Female |
| 5 to 17 Years | 2 (12.5%) | 0 (0.0%) |
| 18 to 34 Years | 0 (0.0%) | 0 (0.0%) |
| 35 to 64 Years | 0 (0.0%) | 0 (0.0%) |
| 65 to 74 Years | 0 (0.0%) | 0 (0.0%) |
| 75 Years and over | 0 (0.0%) | 0 (0.0%) |
Disability Class: Ambulatory Difficulty
| Age Bracket | Male | Female |
| 5 to 17 Years | 0 (0.0%) | 0 (0.0%) |
| 18 to 34 Years | 0 (0.0%) | 0 (0.0%) |
| 35 to 64 Years | 0 (0.0%) | 0 (0.0%) |
| 65 to 74 Years | 0 (0.0%) | 0 (0.0%) |
| 75 Years and over | 0 (0.0%) | 0 (0.0%) |
Disability Class: Self-Care Difficulty
| Age Bracket | Male | Female |
| 5 to 17 Years | 0 (0.0%) | 0 (0.0%) |
| 18 to 34 Years | 0 (0.0%) | 0 (0.0%) |
| 35 to 64 Years | 0 (0.0%) | 0 (0.0%) |
| 65 to 74 Years | 0 (0.0%) | 0 (0.0%) |
| 75 Years and over | 0 (0.0%) | 0 (0.0%) |
Technology Access in Ball Club
Computing Device Access in Ball Club
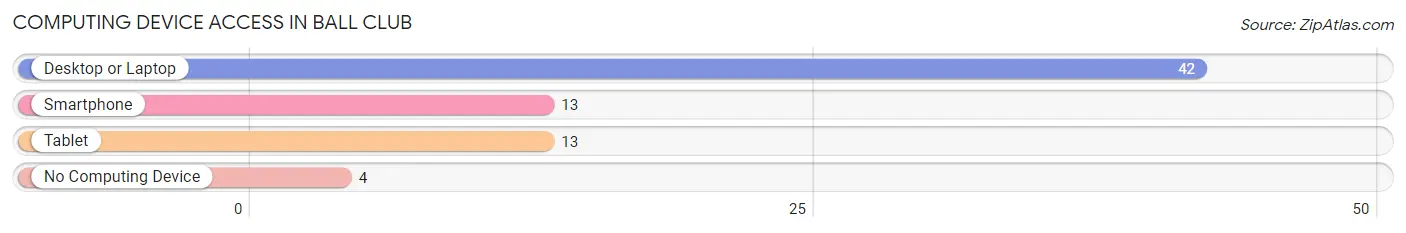
| Device Type | # Households | % Households |
| Desktop or Laptop | 42 | 87.5% |
| Smartphone | 13 | 27.1% |
| Tablet | 13 | 27.1% |
| No Computing Device | 4 | 8.3% |
| Total | 48 | 100.0% |
Internet Access in Ball Club
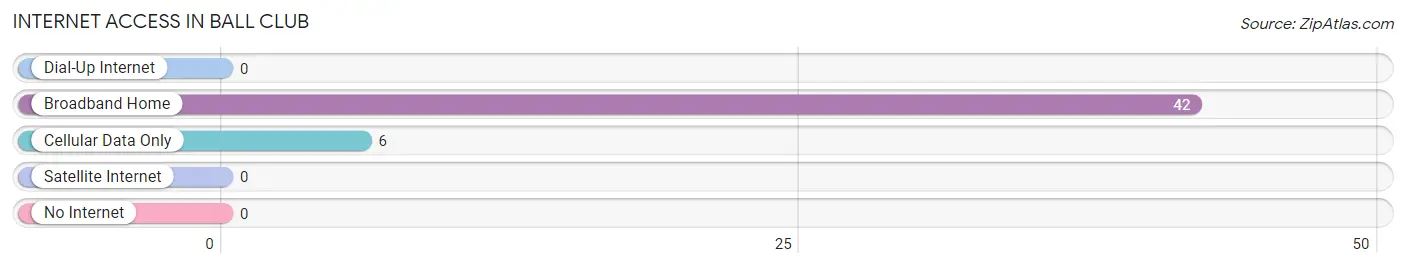
| Internet Type | # Households | % Households |
| Dial-Up Internet | 0 | 0.0% |
| Broadband Home | 42 | 87.5% |
| Cellular Data Only | 6 | 12.5% |
| Satellite Internet | 0 | 0.0% |
| No Internet | 0 | 0.0% |
| Total | 48 | 100.0% |
Ball Club Summary
The Minnesota Twins baseball club is a professional Major League Baseball (MLB) team based in Minneapolis, Minnesota. The Twins are a member of the American League Central Division and play their home games at Target Field. The Twins have been in existence since 1901, when they were known as the Washington Senators. The team moved to Minnesota in 1961 and became the Minnesota Twins.
Minnesota is a state located in the Midwestern United States. It is bordered by Wisconsin to the east, Iowa to the south, North Dakota and South Dakota to the west, and the Canadian provinces of Ontario and Manitoba to the north. Minnesota is the 12th largest state in the United States, with an area of 86,943 square miles. It is the 21st most populous state, with a population of 5.6 million people as of 2020.
Minnesota has a diverse geography, ranging from the rolling hills of the Driftless Area in the southeast to the flat plains of the northern Great Plains. The state is home to the Mississippi River, the largest river in the United States, as well as 10,000 lakes. The state is also home to the Boundary Waters Canoe Area Wilderness, a 1.1 million acre wilderness area in the northeast.
Minnesota has a strong economy, with a gross domestic product (GDP) of $400 billion in 2019. The state is home to 19 Fortune 500 companies, including Target, Best Buy, 3M, and UnitedHealth Group. The state is also home to a number of major industries, including agriculture, manufacturing, and healthcare.
Minnesota has a diverse population, with a majority of the population being of European descent. The state is also home to a large population of Native Americans, African Americans, and Asian Americans. As of 2020, the state had a population of 5.6 million people, with a median age of 38.7 years.
The Minnesota Twins have been a part of the state’s history since 1961, when they moved from Washington, D.C. to Minnesota. The team has won three World Series titles, in 1987, 1991, and most recently in 2020. The Twins have also won six American League Central Division titles, most recently in 2019. The team has a long history of success, and is one of the most beloved teams in the state.
Common Questions
What is Per Capita Income in Ball Club?
Per Capita income in Ball Club is $18,787.
What is Income or Wage Gap in Ball Club?
Income or Wage Gap in Ball Club is 98.0%.
Women in Ball Club earn 2.0 cents for every dollar earned by a man.
What is Inequality or Gini Index in Ball Club?
Inequality or Gini Index in Ball Club is 0.43.
What is the Total Population of Ball Club?
Total Population of Ball Club is 119.
What is the Total Male Population of Ball Club?
Total Male Population of Ball Club is 57.
What is the Total Female Population of Ball Club?
Total Female Population of Ball Club is 62.
What is the Ratio of Males per 100 Females in Ball Club?
There are 91.94 Males per 100 Females in Ball Club.
What is the Ratio of Females per 100 Males in Ball Club?
There are 108.77 Females per 100 Males in Ball Club.
What is the Median Population Age in Ball Club?
Median Population Age in Ball Club is 44.1 Years.
What is the Average Family Size in Ball Club
Average Family Size in Ball Club is 2.5 People.
What is the Average Household Size in Ball Club
Average Household Size in Ball Club is 2.5 People.
How Large is the Labor Force in Ball Club?
There are 36 People in the Labor Forcein in Ball Club.
What is the Percentage of People in the Labor Force in Ball Club?
43.9% of People are in the Labor Force in Ball Club.
What is the Unemployment Rate in Ball Club?
Unemployment Rate in Ball Club is 8.3%.