Zip Codes with the Highest Percentage of Population Employed in Cleaning & Maintenance in Indiana
RELATED REPORTS & OPTIONS
Cleaning & Maintenance
Indiana
Compare Zip Codes
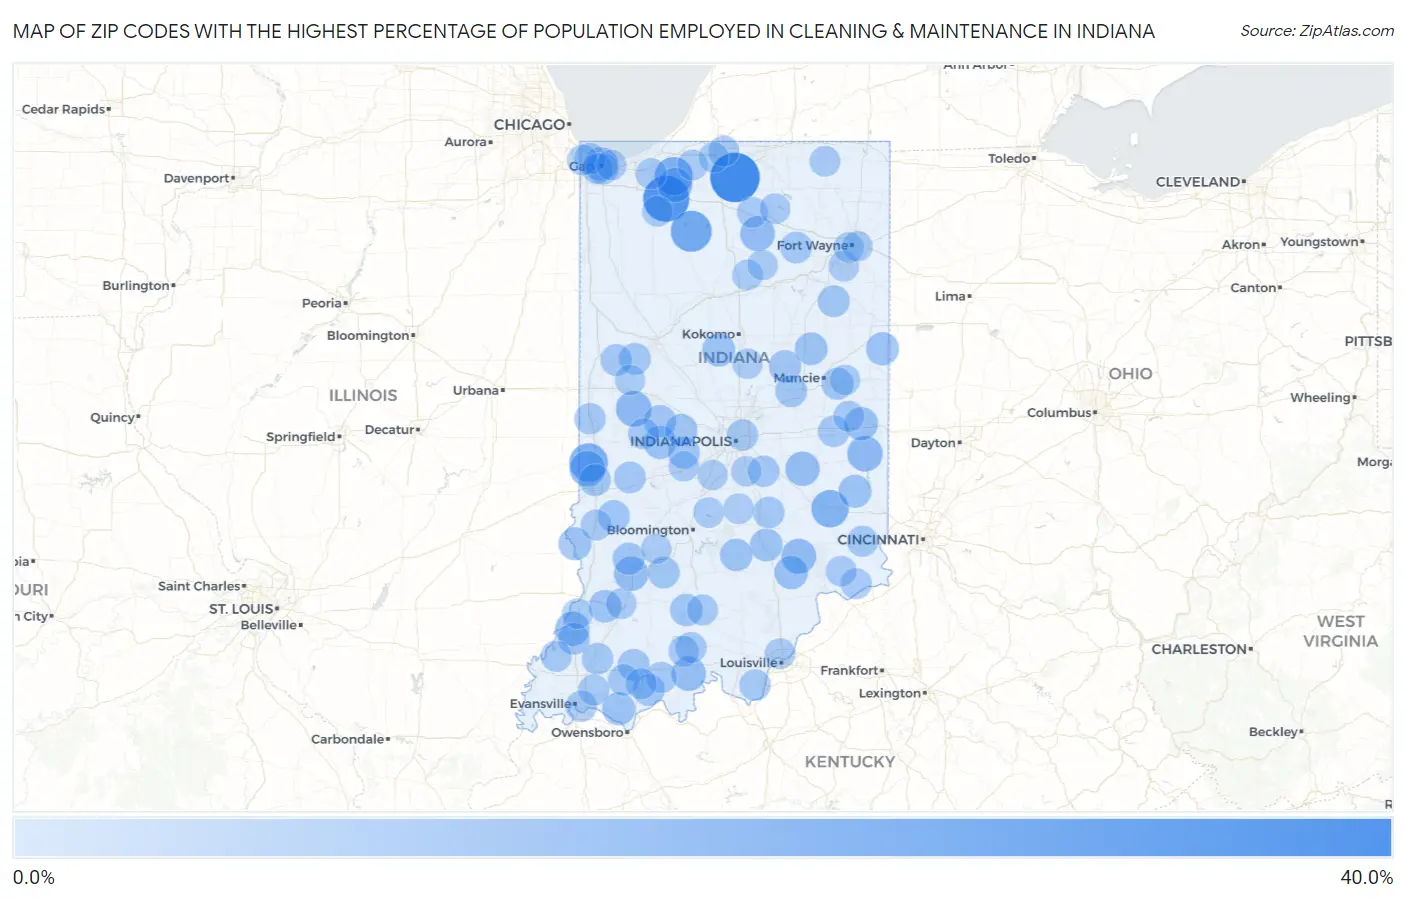
Map of Zip Codes with the Highest Percentage of Population Employed in Cleaning & Maintenance in Indiana
0.0%
40.0%
Zip Codes with the Highest Percentage of Population Employed in Cleaning & Maintenance in Indiana
| Zip Code | % Employed | vs State | vs National | |
| 1. | 46595 | 31.6% | 3.2%(+28.3)#1 | 3.5%(+28.1)#157 |
| 2. | 46340 | 27.0% | 3.2%(+23.7)#2 | 3.5%(+23.5)#213 |
| 3. | 46968 | 20.0% | 3.2%(+16.8)#3 | 3.5%(+16.5)#405 |
| 4. | 47884 | 16.8% | 3.2%(+13.6)#4 | 3.5%(+13.3)#592 |
| 5. | 46345 | 16.7% | 3.2%(+13.4)#5 | 3.5%(+13.2)#609 |
| 6. | 47263 | 15.3% | 3.2%(+12.1)#6 | 3.5%(+11.8)#716 |
| 7. | 47916 | 13.0% | 3.2%(+9.81)#7 | 3.5%(+9.56)#1,013 |
| 8. | 47863 | 13.0% | 3.2%(+9.77)#8 | 3.5%(+9.52)#1,015 |
| 9. | 47325 | 12.8% | 3.2%(+9.59)#9 | 3.5%(+9.34)#1,046 |
| 10. | 47282 | 12.0% | 3.2%(+8.80)#10 | 3.5%(+8.55)#1,199 |
| 11. | 46508 | 11.8% | 3.2%(+8.53)#11 | 3.5%(+8.28)#1,254 |
| 12. | 46346 | 11.6% | 3.2%(+8.33)#12 | 3.5%(+8.08)#1,316 |
| 13. | 47576 | 11.4% | 3.2%(+8.21)#13 | 3.5%(+7.95)#1,350 |
| 14. | 46146 | 11.4% | 3.2%(+8.18)#14 | 3.5%(+7.93)#1,357 |
| 15. | 47524 | 11.4% | 3.2%(+8.16)#15 | 3.5%(+7.91)#1,363 |
| 16. | 47529 | 11.3% | 3.2%(+8.12)#16 | 3.5%(+7.87)#1,381 |
| 17. | 47345 | 10.1% | 3.2%(+6.90)#17 | 3.5%(+6.65)#1,753 |
| 18. | 47227 | 10.1% | 3.2%(+6.85)#18 | 3.5%(+6.60)#1,772 |
| 19. | 46402 | 10.0% | 3.2%(+6.74)#19 | 3.5%(+6.49)#1,821 |
| 20. | 47381 | 9.6% | 3.2%(+6.34)#20 | 3.5%(+6.09)#2,009 |
| 21. | 46105 | 9.5% | 3.2%(+6.31)#21 | 3.5%(+6.06)#2,019 |
| 22. | 46039 | 9.5% | 3.2%(+6.31)#22 | 3.5%(+6.06)#2,021 |
| 23. | 47634 | 9.5% | 3.2%(+6.27)#23 | 3.5%(+6.02)#2,044 |
| 24. | 47030 | 9.4% | 3.2%(+6.21)#24 | 3.5%(+5.96)#2,073 |
| 25. | 47861 | 9.4% | 3.2%(+6.12)#25 | 3.5%(+5.87)#2,119 |
| 26. | 47247 | 9.2% | 3.2%(+5.95)#26 | 3.5%(+5.70)#2,198 |
| 27. | 46957 | 9.0% | 3.2%(+5.77)#27 | 3.5%(+5.52)#2,299 |
| 28. | 47597 | 9.0% | 3.2%(+5.75)#28 | 3.5%(+5.50)#2,311 |
| 29. | 47235 | 8.9% | 3.2%(+5.71)#29 | 3.5%(+5.46)#2,338 |
| 30. | 47954 | 8.9% | 3.2%(+5.67)#30 | 3.5%(+5.42)#2,367 |
| 31. | 47469 | 8.7% | 3.2%(+5.51)#31 | 3.5%(+5.26)#2,449 |
| 32. | 46063 | 8.6% | 3.2%(+5.38)#32 | 3.5%(+5.13)#2,527 |
| 33. | 46165 | 8.5% | 3.2%(+5.26)#33 | 3.5%(+5.00)#2,623 |
| 34. | 47443 | 8.5% | 3.2%(+5.24)#34 | 3.5%(+4.99)#2,627 |
| 35. | 47858 | 8.5% | 3.2%(+5.23)#35 | 3.5%(+4.98)#2,635 |
| 36. | 47541 | 8.3% | 3.2%(+5.04)#36 | 3.5%(+4.79)#2,802 |
| 37. | 46103 | 8.2% | 3.2%(+5.01)#37 | 3.5%(+4.76)#2,831 |
| 38. | 47383 | 8.2% | 3.2%(+4.94)#38 | 3.5%(+4.69)#2,895 |
| 39. | 47550 | 8.0% | 3.2%(+4.77)#39 | 3.5%(+4.52)#3,044 |
| 40. | 46016 | 8.0% | 3.2%(+4.74)#40 | 3.5%(+4.49)#3,072 |
| 41. | 47666 | 8.0% | 3.2%(+4.73)#41 | 3.5%(+4.48)#3,076 |
| 42. | 47522 | 7.9% | 3.2%(+4.69)#42 | 3.5%(+4.44)#3,103 |
| 43. | 47804 | 7.9% | 3.2%(+4.68)#43 | 3.5%(+4.43)#3,113 |
| 44. | 46766 | 7.9% | 3.2%(+4.68)#44 | 3.5%(+4.42)#3,117 |
| 45. | 46407 | 7.9% | 3.2%(+4.66)#45 | 3.5%(+4.40)#3,140 |
| 46. | 47992 | 7.9% | 3.2%(+4.64)#46 | 3.5%(+4.39)#3,151 |
| 47. | 47918 | 7.9% | 3.2%(+4.63)#47 | 3.5%(+4.38)#3,160 |
| 48. | 47857 | 7.8% | 3.2%(+4.57)#48 | 3.5%(+4.32)#3,227 |
| 49. | 46787 | 7.7% | 3.2%(+4.52)#49 | 3.5%(+4.27)#3,275 |
| 50. | 47683 | 7.7% | 3.2%(+4.46)#50 | 3.5%(+4.21)#3,337 |
| 51. | 47226 | 7.6% | 3.2%(+4.41)#51 | 3.5%(+4.16)#3,387 |
| 52. | 46110 | 7.6% | 3.2%(+4.39)#52 | 3.5%(+4.14)#3,411 |
| 53. | 47387 | 7.6% | 3.2%(+4.33)#53 | 3.5%(+4.08)#3,471 |
| 54. | 47637 | 7.5% | 3.2%(+4.27)#54 | 3.5%(+4.02)#3,539 |
| 55. | 46312 | 7.4% | 3.2%(+4.21)#55 | 3.5%(+3.96)#3,610 |
| 56. | 47714 | 7.3% | 3.2%(+4.08)#56 | 3.5%(+3.83)#3,721 |
| 57. | 46218 | 7.3% | 3.2%(+4.06)#57 | 3.5%(+3.81)#3,751 |
| 58. | 47117 | 7.2% | 3.2%(+4.01)#58 | 3.5%(+3.76)#3,801 |
| 59. | 47928 | 7.2% | 3.2%(+4.01)#59 | 3.5%(+3.76)#3,802 |
| 60. | 47577 | 7.2% | 3.2%(+3.97)#60 | 3.5%(+3.71)#3,863 |
| 61. | 46175 | 7.1% | 3.2%(+3.86)#61 | 3.5%(+3.61)#3,967 |
| 62. | 47610 | 7.1% | 3.2%(+3.86)#62 | 3.5%(+3.61)#3,970 |
| 63. | 46391 | 7.0% | 3.2%(+3.78)#63 | 3.5%(+3.53)#4,068 |
| 64. | 47032 | 6.9% | 3.2%(+3.71)#64 | 3.5%(+3.46)#4,142 |
| 65. | 47665 | 6.9% | 3.2%(+3.70)#65 | 3.5%(+3.45)#4,145 |
| 66. | 47452 | 6.9% | 3.2%(+3.70)#66 | 3.5%(+3.45)#4,147 |
| 67. | 47552 | 6.9% | 3.2%(+3.66)#67 | 3.5%(+3.41)#4,214 |
| 68. | 47175 | 6.9% | 3.2%(+3.66)#68 | 3.5%(+3.41)#4,226 |
| 69. | 47879 | 6.9% | 3.2%(+3.63)#69 | 3.5%(+3.38)#4,253 |
| 70. | 47346 | 6.8% | 3.2%(+3.60)#70 | 3.5%(+3.35)#4,297 |
| 71. | 46404 | 6.8% | 3.2%(+3.58)#71 | 3.5%(+3.33)#4,319 |
| 72. | 47043 | 6.7% | 3.2%(+3.51)#72 | 3.5%(+3.26)#4,420 |
| 73. | 46616 | 6.7% | 3.2%(+3.51)#73 | 3.5%(+3.25)#4,434 |
| 74. | 46524 | 6.7% | 3.2%(+3.46)#74 | 3.5%(+3.21)#4,500 |
| 75. | 46327 | 6.6% | 3.2%(+3.41)#75 | 3.5%(+3.15)#4,574 |
| 76. | 47224 | 6.6% | 3.2%(+3.39)#76 | 3.5%(+3.14)#4,591 |
| 77. | 46348 | 6.6% | 3.2%(+3.39)#77 | 3.5%(+3.14)#4,595 |
| 78. | 46926 | 6.6% | 3.2%(+3.36)#78 | 3.5%(+3.11)#4,629 |
| 79. | 46761 | 6.6% | 3.2%(+3.32)#79 | 3.5%(+3.07)#4,683 |
| 80. | 47129 | 6.5% | 3.2%(+3.27)#80 | 3.5%(+3.02)#4,767 |
| 81. | 47116 | 6.5% | 3.2%(+3.25)#81 | 3.5%(+3.00)#4,800 |
| 82. | 46538 | 6.5% | 3.2%(+3.24)#82 | 3.5%(+2.99)#4,807 |
| 83. | 47501 | 6.4% | 3.2%(+3.18)#83 | 3.5%(+2.92)#4,923 |
| 84. | 46798 | 6.3% | 3.2%(+3.12)#84 | 3.5%(+2.86)#5,023 |
| 85. | 46365 | 6.3% | 3.2%(+3.11)#85 | 3.5%(+2.86)#5,037 |
| 86. | 46164 | 6.3% | 3.2%(+3.05)#86 | 3.5%(+2.80)#5,130 |
| 87. | 46802 | 6.3% | 3.2%(+3.05)#87 | 3.5%(+2.80)#5,142 |
| 88. | 46403 | 6.3% | 3.2%(+3.04)#88 | 3.5%(+2.79)#5,158 |
| 89. | 47591 | 6.3% | 3.2%(+3.03)#89 | 3.5%(+2.78)#5,167 |
| 90. | 46974 | 6.3% | 3.2%(+3.03)#90 | 3.5%(+2.77)#5,176 |
| 91. | 46111 | 6.2% | 3.2%(+3.02)#91 | 3.5%(+2.77)#5,195 |
| 92. | 47368 | 6.2% | 3.2%(+3.01)#92 | 3.5%(+2.76)#5,205 |
| 93. | 47468 | 6.2% | 3.2%(+2.99)#93 | 3.5%(+2.74)#5,233 |
| 94. | 46184 | 6.2% | 3.2%(+2.98)#94 | 3.5%(+2.73)#5,247 |
| 95. | 46072 | 6.1% | 3.2%(+2.92)#95 | 3.5%(+2.67)#5,367 |
| 96. | 47994 | 6.1% | 3.2%(+2.91)#96 | 3.5%(+2.66)#5,382 |
| 97. | 46803 | 6.1% | 3.2%(+2.89)#97 | 3.5%(+2.64)#5,413 |
| 98. | 46180 | 6.1% | 3.2%(+2.89)#98 | 3.5%(+2.64)#5,418 |
| 99. | 46619 | 6.1% | 3.2%(+2.89)#99 | 3.5%(+2.64)#5,429 |
| 100. | 47424 | 6.1% | 3.2%(+2.87)#100 | 3.5%(+2.62)#5,456 |
Common Questions
What are the Top 10 Zip Codes with the Highest Percentage of Population Employed in Cleaning & Maintenance in Indiana?
Top 10 Zip Codes with the Highest Percentage of Population Employed in Cleaning & Maintenance in Indiana are:
What zip code has the Highest Percentage of Population Employed in Cleaning & Maintenance in Indiana?
46595 has the Highest Percentage of Population Employed in Cleaning & Maintenance in Indiana with 31.6%.
What is the Percentage of Population Employed in Cleaning & Maintenance in the State of Indiana?
Percentage of Population Employed in Cleaning & Maintenance in Indiana is 3.2%.
What is the Percentage of Population Employed in Cleaning & Maintenance in the United States?
Percentage of Population Employed in Cleaning & Maintenance in the United States is 3.5%.