West Point, IN Map & Demographics
West Point Map
West Point Overview
$51,413
PER CAPITA INCOME
$118,385
AVG FAMILY INCOME
$117,986
AVG HOUSEHOLD INCOME
0.08
INEQUALITY / GINI INDEX
246
TOTAL POPULATION
117
MALE POPULATION
129
FEMALE POPULATION
90.70
MALES / 100 FEMALES
110.26
FEMALES / 100 MALES
43.1
MEDIAN AGE
2.2
AVG FAMILY SIZE
2.1
AVG HOUSEHOLD SIZE
192
LABOR FORCE [ PEOPLE ]
78.0%
PERCENT IN LABOR FORCE
Income in West Point
Income Overview in West Point
Per Capita Income in West Point is $51,413, while median incomes of families and households are $118,385 and $117,986 respectively.
| Characteristic | Number | Measure |
| Per Capita Income | 246 | $51,413 |
| Median Family Income | 93 | $118,385 |
| Mean Family Income | 93 | $105,866 |
| Median Household Income | 116 | $117,986 |
| Mean Household Income | 116 | $107,252 |
| Income Deficit | 93 | $0 |
| Wage / Income Gap (%) | 246 | 0.00% |
| Wage / Income Gap ($) | 246 | 100.00¢ per $1 |
| Gini / Inequality Index | 246 | 0.08 |
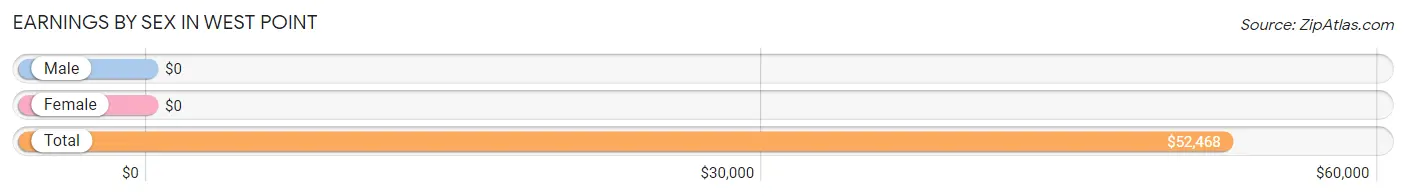
Earnings by Sex in West Point
| Sex | Number | Average Earnings |
| Male | 95 (49.5%) | $0 |
| Female | 97 (50.5%) | $0 |
| Total | 192 (100.0%) | $52,468 |
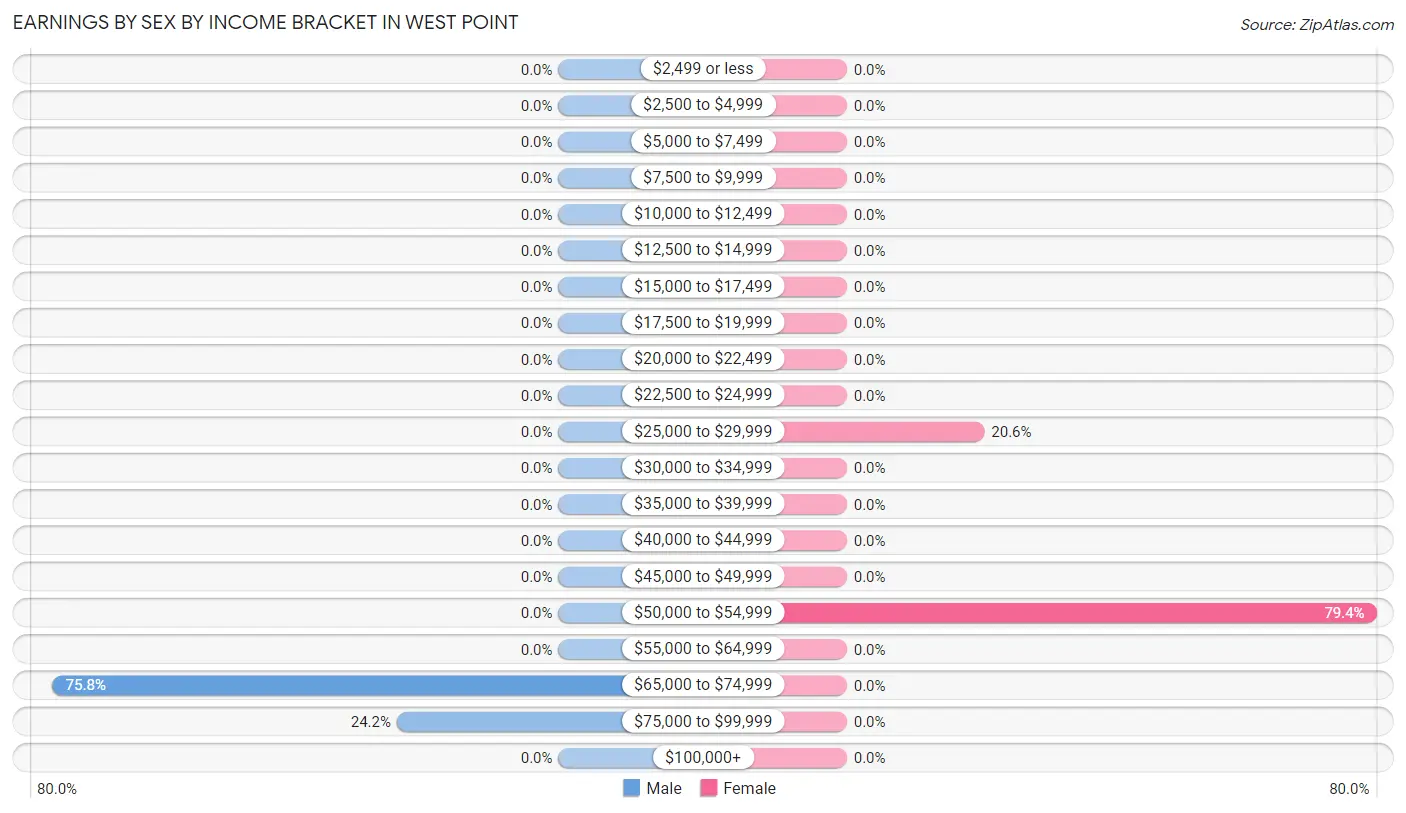
Earnings by Sex by Income Bracket in West Point
The most common earnings brackets in West Point are $65,000 to $74,999 for men (72 | 75.8%) and $50,000 to $54,999 for women (77 | 79.4%).
| Income | Male | Female |
| $2,499 or less | 0 (0.0%) | 0 (0.0%) |
| $2,500 to $4,999 | 0 (0.0%) | 0 (0.0%) |
| $5,000 to $7,499 | 0 (0.0%) | 0 (0.0%) |
| $7,500 to $9,999 | 0 (0.0%) | 0 (0.0%) |
| $10,000 to $12,499 | 0 (0.0%) | 0 (0.0%) |
| $12,500 to $14,999 | 0 (0.0%) | 0 (0.0%) |
| $15,000 to $17,499 | 0 (0.0%) | 0 (0.0%) |
| $17,500 to $19,999 | 0 (0.0%) | 0 (0.0%) |
| $20,000 to $22,499 | 0 (0.0%) | 0 (0.0%) |
| $22,500 to $24,999 | 0 (0.0%) | 0 (0.0%) |
| $25,000 to $29,999 | 0 (0.0%) | 20 (20.6%) |
| $30,000 to $34,999 | 0 (0.0%) | 0 (0.0%) |
| $35,000 to $39,999 | 0 (0.0%) | 0 (0.0%) |
| $40,000 to $44,999 | 0 (0.0%) | 0 (0.0%) |
| $45,000 to $49,999 | 0 (0.0%) | 0 (0.0%) |
| $50,000 to $54,999 | 0 (0.0%) | 77 (79.4%) |
| $55,000 to $64,999 | 0 (0.0%) | 0 (0.0%) |
| $65,000 to $74,999 | 72 (75.8%) | 0 (0.0%) |
| $75,000 to $99,999 | 23 (24.2%) | 0 (0.0%) |
| $100,000+ | 0 (0.0%) | 0 (0.0%) |
| Total | 95 (100.0%) | 97 (100.0%) |
Earnings by Sex by Educational Attainment in West Point
| Educational Attainment | Male Income | Female Income |
| Less than High School | - | - |
| High School Diploma | - | - |
| College or Associate's Degree | - | - |
| Bachelor's Degree | - | - |
| Graduate Degree | - | - |
| Total | - | - |
Family Income in West Point
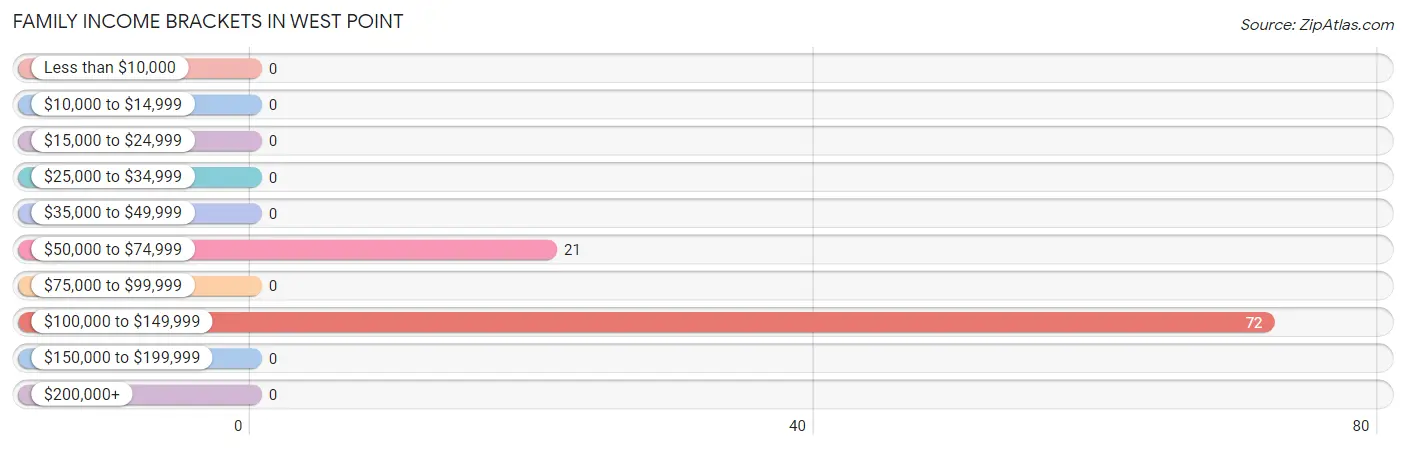
Family Income Brackets in West Point
According to the West Point family income data, there are 72 families falling into the $100,000 to $149,999 income range, which is the most common income bracket and makes up 77.4% of all families.
| Income Bracket | # Families | % Families |
| Less than $10,000 | 0 | 0.0% |
| $10,000 to $14,999 | 0 | 0.0% |
| $15,000 to $24,999 | 0 | 0.0% |
| $25,000 to $34,999 | 0 | 0.0% |
| $35,000 to $49,999 | 0 | 0.0% |
| $50,000 to $74,999 | 21 | 22.6% |
| $75,000 to $99,999 | 0 | 0.0% |
| $100,000 to $149,999 | 72 | 77.4% |
| $150,000 to $199,999 | 0 | 0.0% |
| $200,000+ | 0 | 0.0% |
Family Income by Famaliy Size in West Point
| Income Bracket | # Families | Median Income |
| 2-Person Families | 84 (90.3%) | $0 |
| 3-Person Families | 9 (9.7%) | $0 |
| 4-Person Families | 0 (0.0%) | $0 |
| 5-Person Families | 0 (0.0%) | $0 |
| 6-Person Families | 0 (0.0%) | $0 |
| 7+ Person Families | 0 (0.0%) | $0 |
| Total | 93 (100.0%) | $118,385 |
Family Income by Number of Earners in West Point
| Number of Earners | # Families | Median Income |
| No Earners | 21 (22.6%) | $0 |
| 1 Earner | 0 (0.0%) | $0 |
| 2 Earners | 72 (77.4%) | $0 |
| 3+ Earners | 0 (0.0%) | $0 |
| Total | 93 (100.0%) | $118,385 |
Household Income in West Point
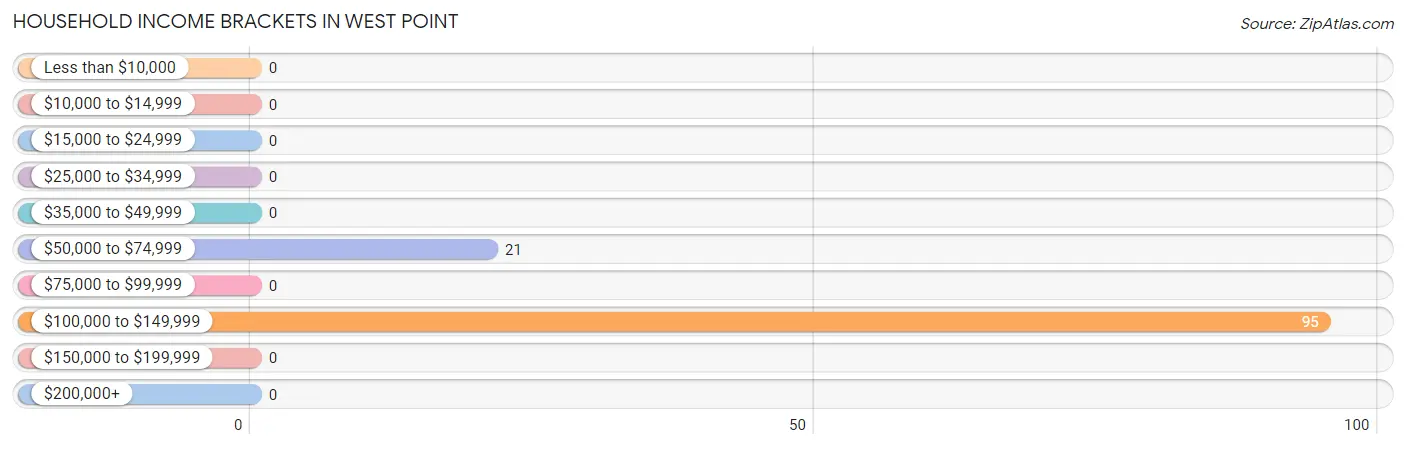
Household Income Brackets in West Point
With 95 households falling in the category, the $100,000 to $149,999 income range is the most frequent in West Point, accounting for 81.9% of all households.
| Income Bracket | # Households | % Households |
| Less than $10,000 | 0 | 0.0% |
| $10,000 to $14,999 | 0 | 0.0% |
| $15,000 to $24,999 | 0 | 0.0% |
| $25,000 to $34,999 | 0 | 0.0% |
| $35,000 to $49,999 | 0 | 0.0% |
| $50,000 to $74,999 | 21 | 18.1% |
| $75,000 to $99,999 | 0 | 0.0% |
| $100,000 to $149,999 | 95 | 81.9% |
| $150,000 to $199,999 | 0 | 0.0% |
| $200,000+ | 0 | 0.0% |
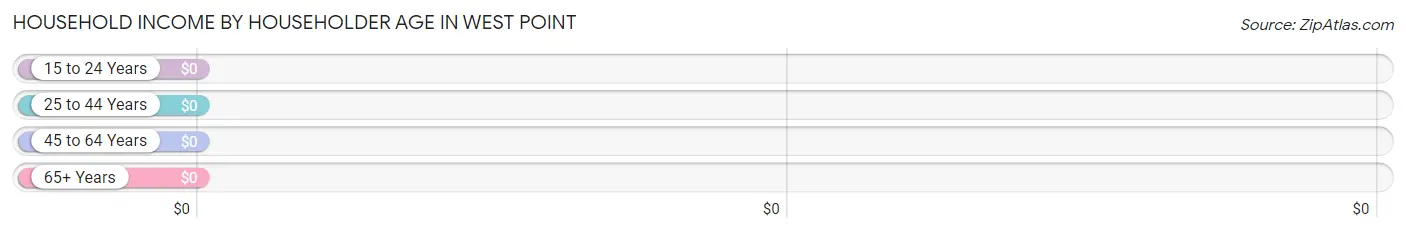
Household Income by Householder Age in West Point
| Income Bracket | # Households | Median Income |
| 15 to 24 Years | 0 (0.0%) | $0 |
| 25 to 44 Years | 95 (81.9%) | $0 |
| 45 to 64 Years | 12 (10.3%) | $0 |
| 65+ Years | 9 (7.8%) | $0 |
| Total | 116 (100.0%) | $117,986 |
Poverty in West Point
Income Below Poverty by Sex and Age in West Point
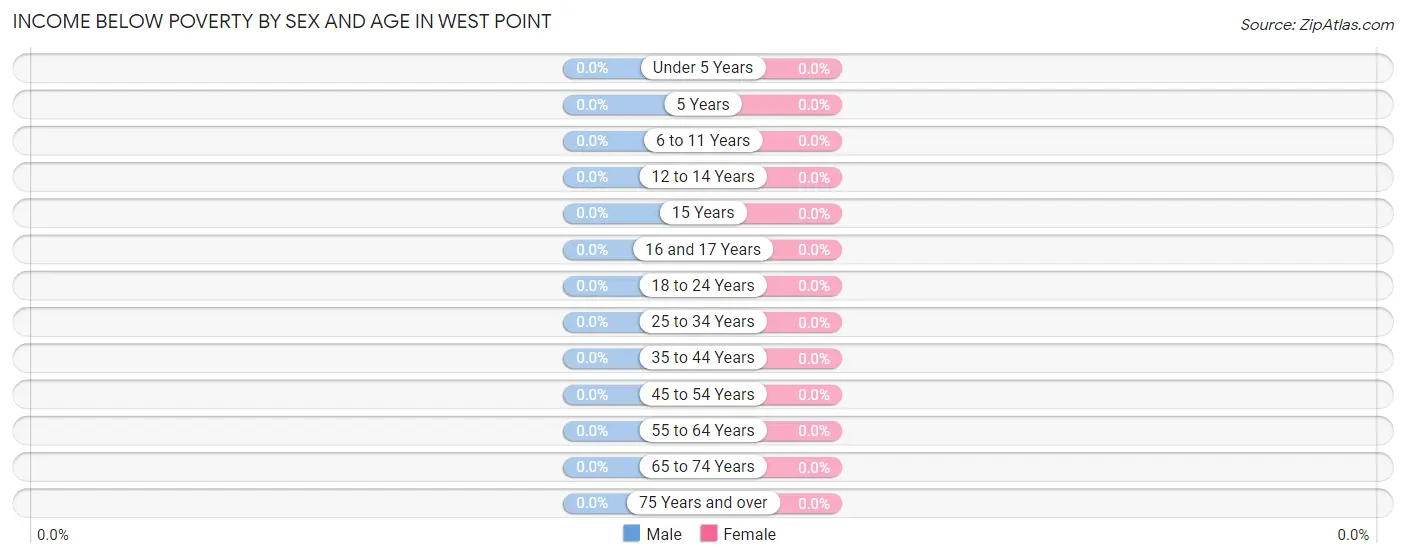
| Age Bracket | Male | Female |
| Under 5 Years | 0 (0.0%) | 0 (0.0%) |
| 5 Years | 0 (0.0%) | 0 (0.0%) |
| 6 to 11 Years | 0 (0.0%) | 0 (0.0%) |
| 12 to 14 Years | 0 (0.0%) | 0 (0.0%) |
| 15 Years | 0 (0.0%) | 0 (0.0%) |
| 16 and 17 Years | 0 (0.0%) | 0 (0.0%) |
| 18 to 24 Years | 0 (0.0%) | 0 (0.0%) |
| 25 to 34 Years | 0 (0.0%) | 0 (0.0%) |
| 35 to 44 Years | 0 (0.0%) | 0 (0.0%) |
| 45 to 54 Years | 0 (0.0%) | 0 (0.0%) |
| 55 to 64 Years | 0 (0.0%) | 0 (0.0%) |
| 65 to 74 Years | 0 (0.0%) | 0 (0.0%) |
| 75 Years and over | 0 (0.0%) | 0 (0.0%) |
| Total | 0 (0.0%) | 0 (0.0%) |
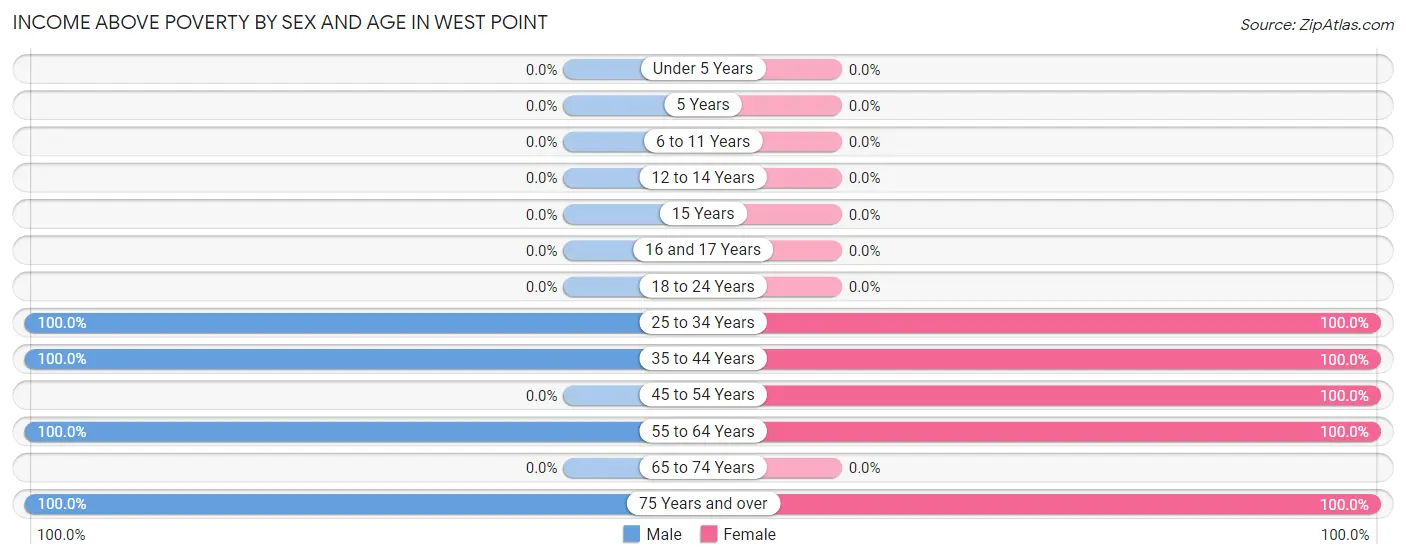
Income Above Poverty by Sex and Age in West Point
According to the poverty statistics in West Point, males aged 25 to 34 years and females aged 25 to 34 years are the age groups that are most secure financially, with 100.0% of males and 100.0% of females in these age groups living above the poverty line.
| Age Bracket | Male | Female |
| Under 5 Years | 0 (0.0%) | 0 (0.0%) |
| 5 Years | 0 (0.0%) | 0 (0.0%) |
| 6 to 11 Years | 0 (0.0%) | 0 (0.0%) |
| 12 to 14 Years | 0 (0.0%) | 0 (0.0%) |
| 15 Years | 0 (0.0%) | 0 (0.0%) |
| 16 and 17 Years | 0 (0.0%) | 0 (0.0%) |
| 18 to 24 Years | 0 (0.0%) | 0 (0.0%) |
| 25 to 34 Years | 23 (100.0%) | 20 (100.0%) |
| 35 to 44 Years | 72 (100.0%) | 77 (100.0%) |
| 45 to 54 Years | 0 (0.0%) | 9 (100.0%) |
| 55 to 64 Years | 13 (100.0%) | 12 (100.0%) |
| 65 to 74 Years | 0 (0.0%) | 0 (0.0%) |
| 75 Years and over | 9 (100.0%) | 11 (100.0%) |
| Total | 117 (100.0%) | 129 (100.0%) |
Income Below Poverty Among Married-Couple Families in West Point
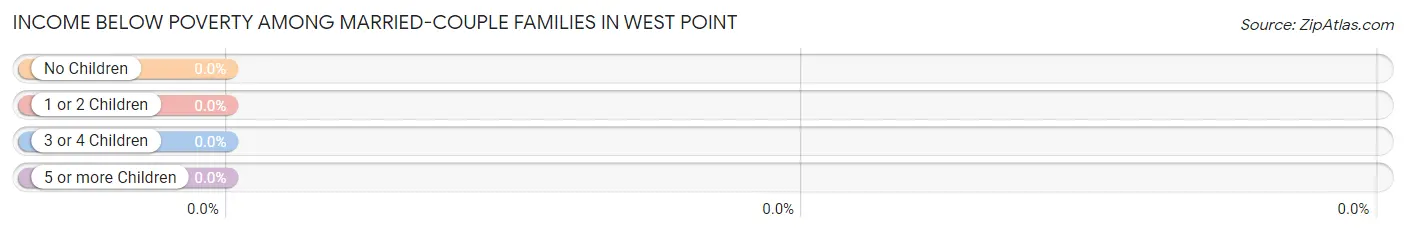
| Children | Above Poverty | Below Poverty |
| No Children | 81 (100.0%) | 0 (0.0%) |
| 1 or 2 Children | 0 (0.0%) | 0 (0.0%) |
| 3 or 4 Children | 0 (0.0%) | 0 (0.0%) |
| 5 or more Children | 0 (0.0%) | 0 (0.0%) |
| Total | 81 (100.0%) | 0 (0.0%) |
Income Below Poverty Among Single-Parent Households in West Point
| Children | Single Father | Single Mother |
| No Children | 0 (0.0%) | 0 (0.0%) |
| 1 or 2 Children | 0 (0.0%) | 0 (0.0%) |
| 3 or 4 Children | 0 (0.0%) | 0 (0.0%) |
| 5 or more Children | 0 (0.0%) | 0 (0.0%) |
| Total | 0 (0.0%) | 0 (0.0%) |
Income Below Poverty Among Married-Couple vs Single-Parent Households in West Point
| Children | Married-Couple Families | Single-Parent Households |
| No Children | 0 (0.0%) | 0 (0.0%) |
| 1 or 2 Children | 0 (0.0%) | 0 (0.0%) |
| 3 or 4 Children | 0 (0.0%) | 0 (0.0%) |
| 5 or more Children | 0 (0.0%) | 0 (0.0%) |
| Total | 0 (0.0%) | 0 (0.0%) |
Race in West Point
The most populous races in West Point are , and White / Caucasian (246 | 100.0%).
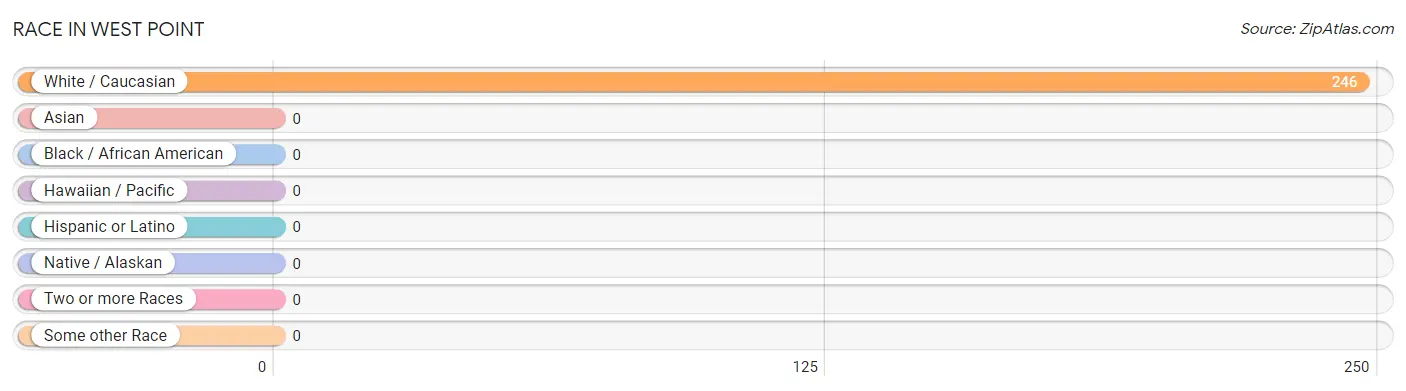
| Race | # Population | % Population |
| Asian | 0 | 0.0% |
| Black / African American | 0 | 0.0% |
| Hawaiian / Pacific | 0 | 0.0% |
| Hispanic or Latino | 0 | 0.0% |
| Native / Alaskan | 0 | 0.0% |
| White / Caucasian | 246 | 100.0% |
| Two or more Races | 0 | 0.0% |
| Some other Race | 0 | 0.0% |
| Total | 246 | 100.0% |
Ancestry in West Point
The most populous ancestries reported in West Point are German (25 | 10.2%), Irish (25 | 10.2%), and American (9 | 3.7%), together accounting for 24.0% of all West Point residents.
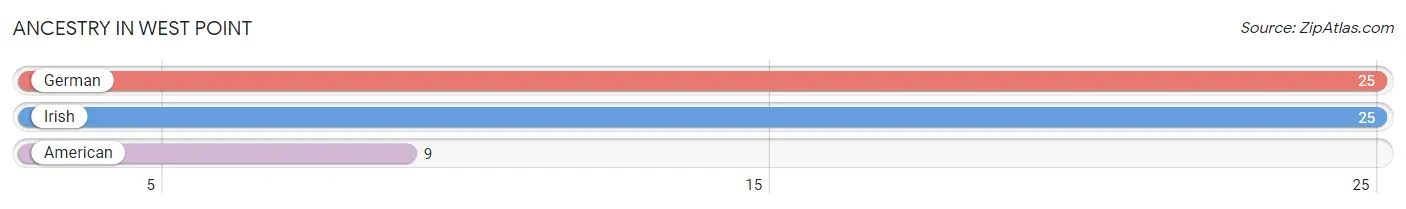
| Ancestry | # Population | % Population |
| American | 9 | 3.7% |
| German | 25 | 10.2% |
| Irish | 25 | 10.2% | View All 3 Rows |
Immigrants in West Point

| Immigration Origin | # Population | % Population | View All 0 Rows |
Sex and Age in West Point
Sex and Age in West Point
The most populous age groups in West Point are 35 to 39 Years (72 | 61.5%) for men and 40 to 44 Years (77 | 59.7%) for women.
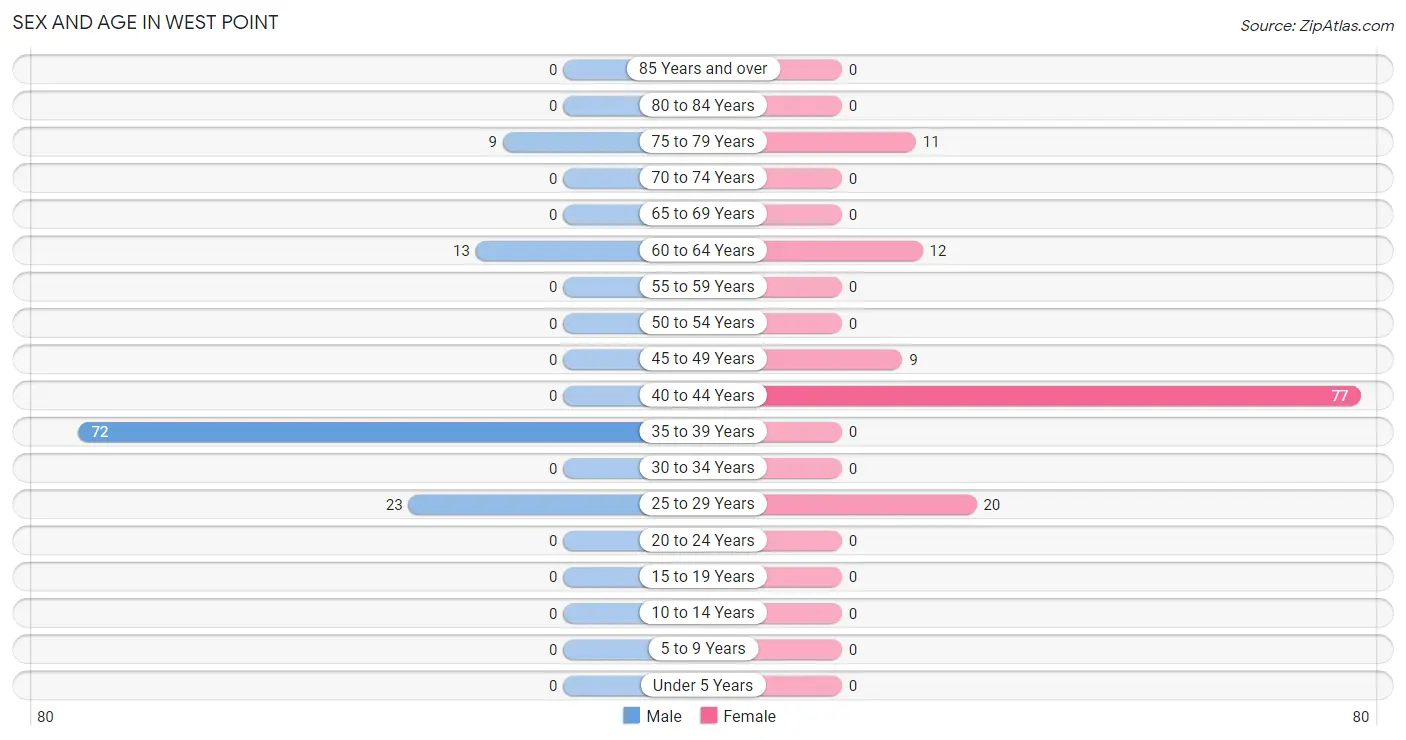
| Age Bracket | Male | Female |
| Under 5 Years | 0 (0.0%) | 0 (0.0%) |
| 5 to 9 Years | 0 (0.0%) | 0 (0.0%) |
| 10 to 14 Years | 0 (0.0%) | 0 (0.0%) |
| 15 to 19 Years | 0 (0.0%) | 0 (0.0%) |
| 20 to 24 Years | 0 (0.0%) | 0 (0.0%) |
| 25 to 29 Years | 23 (19.7%) | 20 (15.5%) |
| 30 to 34 Years | 0 (0.0%) | 0 (0.0%) |
| 35 to 39 Years | 72 (61.5%) | 0 (0.0%) |
| 40 to 44 Years | 0 (0.0%) | 77 (59.7%) |
| 45 to 49 Years | 0 (0.0%) | 9 (7.0%) |
| 50 to 54 Years | 0 (0.0%) | 0 (0.0%) |
| 55 to 59 Years | 0 (0.0%) | 0 (0.0%) |
| 60 to 64 Years | 13 (11.1%) | 12 (9.3%) |
| 65 to 69 Years | 0 (0.0%) | 0 (0.0%) |
| 70 to 74 Years | 0 (0.0%) | 0 (0.0%) |
| 75 to 79 Years | 9 (7.7%) | 11 (8.5%) |
| 80 to 84 Years | 0 (0.0%) | 0 (0.0%) |
| 85 Years and over | 0 (0.0%) | 0 (0.0%) |
| Total | 117 (100.0%) | 129 (100.0%) |
Families and Households in West Point
Median Family Size in West Point
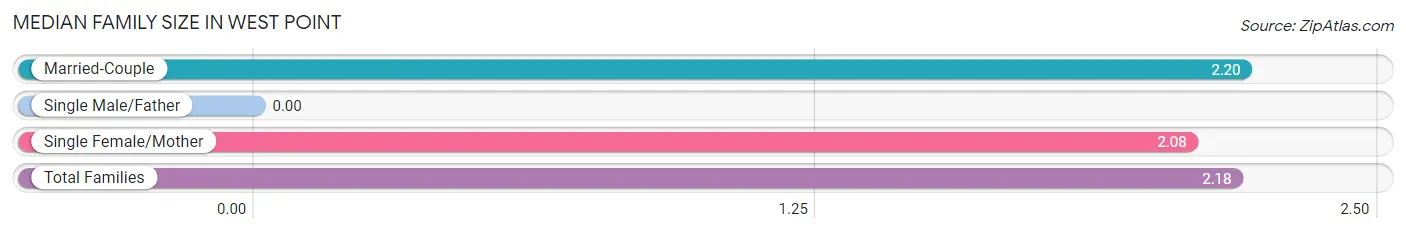
| Family Type | # Families | Family Size |
| Married-Couple | 81 (87.1%) | 2.20 |
| Single Male/Father | 0 (0.0%) | - |
| Single Female/Mother | 12 (12.9%) | 2.08 |
| Total Families | 93 (100.0%) | 2.18 |
Median Household Size in West Point
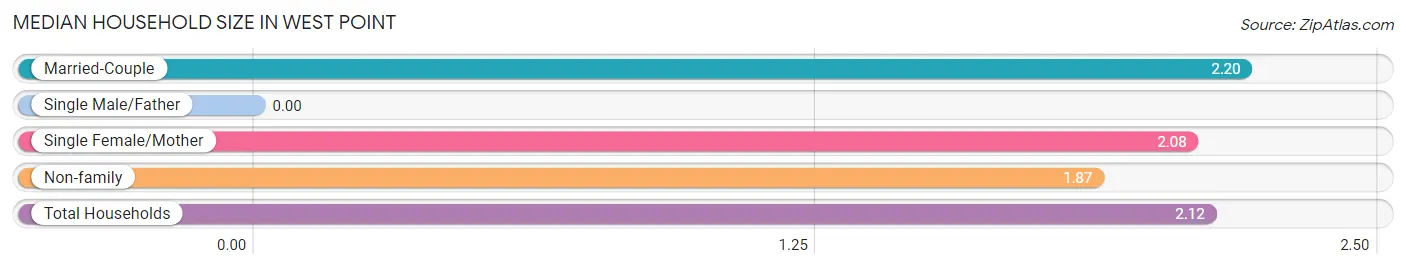
| Household Type | # Households | Household Size |
| Married-Couple | 81 (69.8%) | 2.20 |
| Single Male/Father | 0 (0.0%) | - |
| Single Female/Mother | 12 (10.3%) | 2.08 |
| Non-family | 23 (19.8%) | 1.87 |
| Total Households | 116 (100.0%) | 2.12 |
Household Size by Marriage Status in West Point
Out of a total of 116 households in West Point, 93 (80.2%) are family households, while 23 (19.8%) are nonfamily households. The most numerous type of family households are 2-person households, comprising 84, and the most common type of nonfamily households are 2-person households, comprising 23.
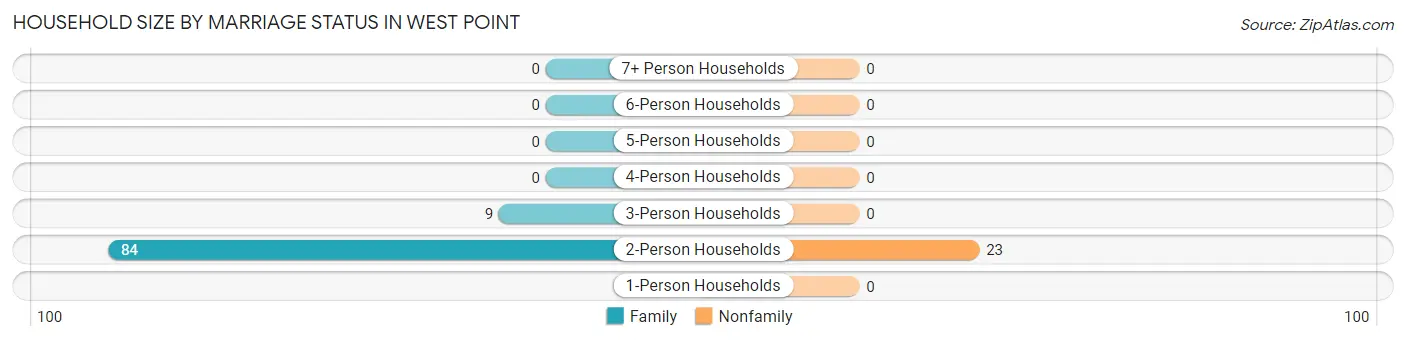
| Household Size | Family Households | Nonfamily Households |
| 1-Person Households | - | 0 (0.0%) |
| 2-Person Households | 84 (72.4%) | 23 (19.8%) |
| 3-Person Households | 9 (7.8%) | 0 (0.0%) |
| 4-Person Households | 0 (0.0%) | 0 (0.0%) |
| 5-Person Households | 0 (0.0%) | 0 (0.0%) |
| 6-Person Households | 0 (0.0%) | 0 (0.0%) |
| 7+ Person Households | 0 (0.0%) | 0 (0.0%) |
| Total | 93 (80.2%) | 23 (19.8%) |
Female Fertility in West Point
Fertility by Age in West Point
| Age Bracket | Women with Births | Births / 1,000 Women |
| 15 to 19 years | 0 (0.0%) | 0.0 |
| 20 to 34 years | 0 (0.0%) | 0.0 |
| 35 to 50 years | 0 (0.0%) | 0.0 |
| Total | 0 (0.0%) | 0.0 |
Fertility by Age by Marriage Status in West Point
| Age Bracket | Married | Unmarried |
| 15 to 19 years | 0 (0.0%) | 0 (0.0%) |
| 20 to 34 years | 0 (0.0%) | 0 (0.0%) |
| 35 to 50 years | 0 (0.0%) | 0 (0.0%) |
| Total | 0 (0.0%) | 0 (0.0%) |
Fertility by Education in West Point
| Educational Attainment | Women with Births | Births / 1,000 Women |
| Less than High School | 0 (0.0%) | 0.0 |
| High School Diploma | 0 (0.0%) | 0.0 |
| College or Associate's Degree | 0 (0.0%) | 0.0 |
| Bachelor's Degree | 0 (0.0%) | 0.0 |
| Graduate Degree | 0 (0.0%) | 0.0 |
| Total | 0 (0.0%) | 0.0 |
Fertility by Education by Marriage Status in West Point
| Educational Attainment | Married | Unmarried |
| Less than High School | 0 (0.0%) | 0 (0.0%) |
| High School Diploma | 0 (0.0%) | 0 (0.0%) |
| College or Associate's Degree | 0 (0.0%) | 0 (0.0%) |
| Bachelor's Degree | 0 (0.0%) | 0 (0.0%) |
| Graduate Degree | 0 (0.0%) | 0 (0.0%) |
| Total | 0 (0.0%) | 0 (0.0%) |
Employment Characteristics in West Point
Employment by Class of Employer in West Point
Among the 192 employed individuals in West Point, private company employees (172 | 89.6%), and self-employed (not incorporated) (20 | 10.4%) make up the most common classes of employment.
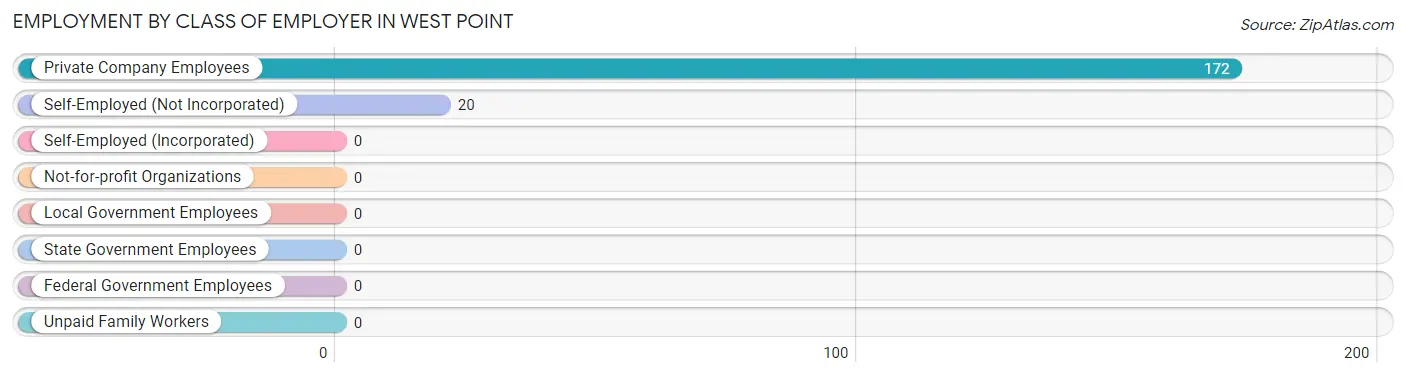
| Employer Class | # Employees | % Employees |
| Private Company Employees | 172 | 89.6% |
| Self-Employed (Incorporated) | 0 | 0.0% |
| Self-Employed (Not Incorporated) | 20 | 10.4% |
| Not-for-profit Organizations | 0 | 0.0% |
| Local Government Employees | 0 | 0.0% |
| State Government Employees | 0 | 0.0% |
| Federal Government Employees | 0 | 0.0% |
| Unpaid Family Workers | 0 | 0.0% |
| Total | 192 | 100.0% |
Employment Status by Age in West Point
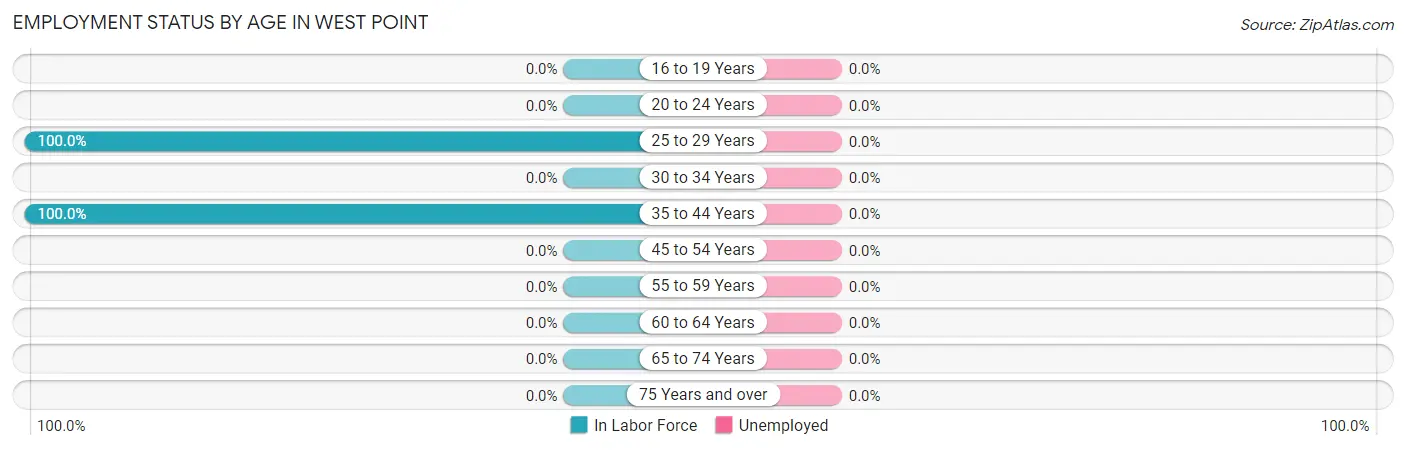
| Age Bracket | In Labor Force | Unemployed |
| 16 to 19 Years | 0 (0.0%) | 0 (0.0%) |
| 20 to 24 Years | 0 (0.0%) | 0 (0.0%) |
| 25 to 29 Years | 43 (100.0%) | 0 (0.0%) |
| 30 to 34 Years | 0 (0.0%) | 0 (0.0%) |
| 35 to 44 Years | 149 (100.0%) | 0 (0.0%) |
| 45 to 54 Years | 0 (0.0%) | 0 (0.0%) |
| 55 to 59 Years | 0 (0.0%) | 0 (0.0%) |
| 60 to 64 Years | 0 (0.0%) | 0 (0.0%) |
| 65 to 74 Years | 0 (0.0%) | 0 (0.0%) |
| 75 Years and over | 0 (0.0%) | 0 (0.0%) |
| Total | 192 (78.0%) | 0 (0.0%) |
Employment Status by Educational Attainment in West Point
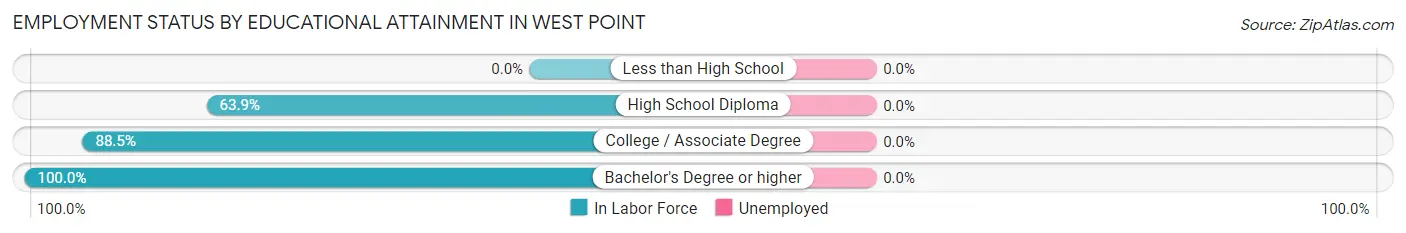
| Educational Attainment | In Labor Force | Unemployed |
| Less than High School | 0 (0.0%) | 0 (0.0%) |
| High School Diploma | 23 (63.9%) | 0 (0.0%) |
| College / Associate Degree | 92 (88.5%) | 0 (0.0%) |
| Bachelor's Degree or higher | 77 (100.0%) | 0 (0.0%) |
| Total | 192 (85.0%) | 0 (0.0%) |
Employment Occupations by Sex in West Point
Management, Business, Science and Arts Occupations
The most common Management, Business, Science and Arts occupations in West Point are , and Business & Financial (77 | 40.1%).
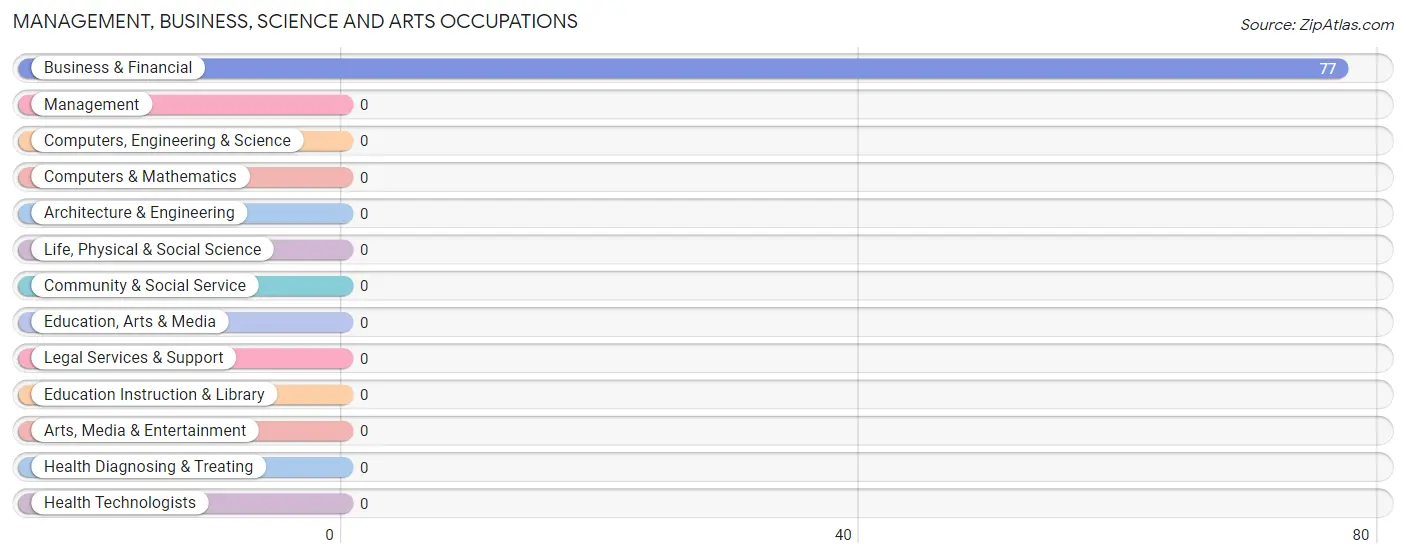
Management, Business, Science and Arts Occupations by Sex
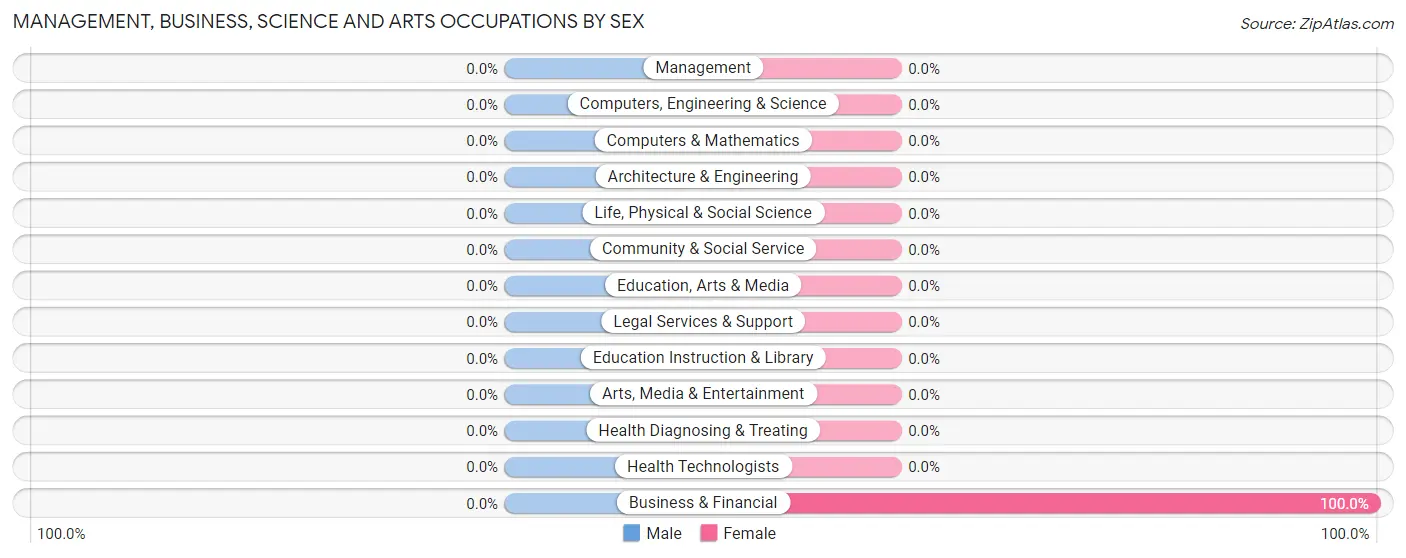
| Occupation | Male | Female |
| Management | 0 (0.0%) | 0 (0.0%) |
| Business & Financial | 0 (0.0%) | 77 (100.0%) |
| Computers, Engineering & Science | 0 (0.0%) | 0 (0.0%) |
| Computers & Mathematics | 0 (0.0%) | 0 (0.0%) |
| Architecture & Engineering | 0 (0.0%) | 0 (0.0%) |
| Life, Physical & Social Science | 0 (0.0%) | 0 (0.0%) |
| Community & Social Service | 0 (0.0%) | 0 (0.0%) |
| Education, Arts & Media | 0 (0.0%) | 0 (0.0%) |
| Legal Services & Support | 0 (0.0%) | 0 (0.0%) |
| Education Instruction & Library | 0 (0.0%) | 0 (0.0%) |
| Arts, Media & Entertainment | 0 (0.0%) | 0 (0.0%) |
| Health Diagnosing & Treating | 0 (0.0%) | 0 (0.0%) |
| Health Technologists | 0 (0.0%) | 0 (0.0%) |
| Total (Category) | 0 (0.0%) | 77 (100.0%) |
| Total (Overall) | 95 (49.5%) | 97 (50.5%) |
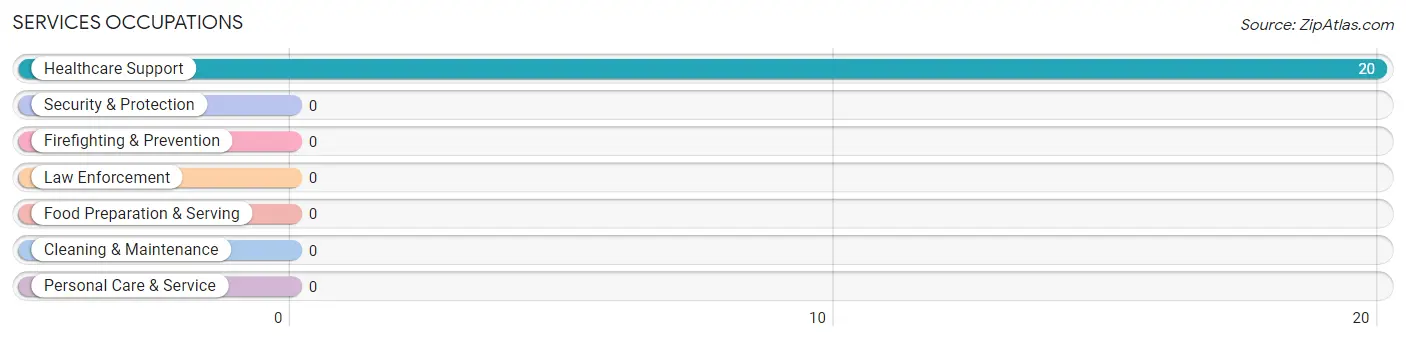
Services Occupations
The most common Services occupations in West Point are , and Healthcare Support (20 | 10.4%).
Services Occupations by Sex
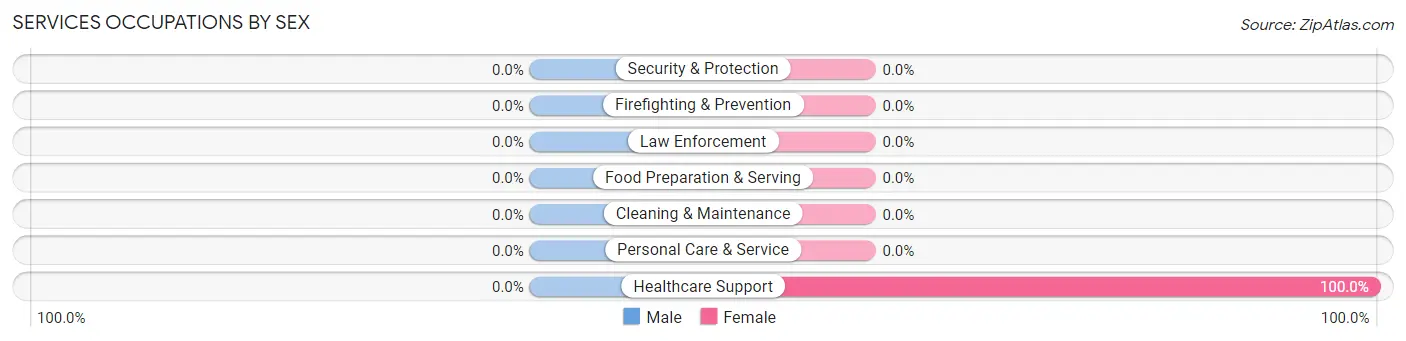
| Occupation | Male | Female |
| Healthcare Support | 0 (0.0%) | 20 (100.0%) |
| Security & Protection | 0 (0.0%) | 0 (0.0%) |
| Firefighting & Prevention | 0 (0.0%) | 0 (0.0%) |
| Law Enforcement | 0 (0.0%) | 0 (0.0%) |
| Food Preparation & Serving | 0 (0.0%) | 0 (0.0%) |
| Cleaning & Maintenance | 0 (0.0%) | 0 (0.0%) |
| Personal Care & Service | 0 (0.0%) | 0 (0.0%) |
| Total (Category) | 0 (0.0%) | 20 (100.0%) |
| Total (Overall) | 95 (49.5%) | 97 (50.5%) |
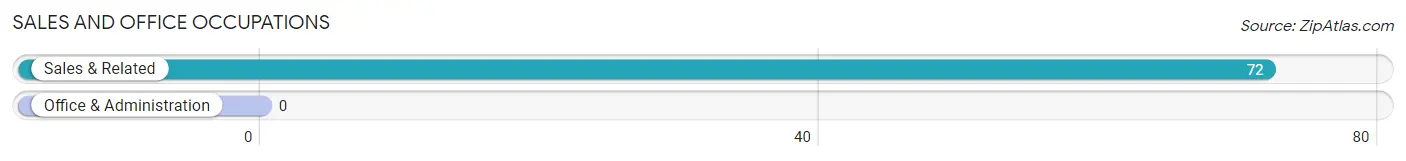
Sales and Office Occupations
The most common Sales and Office occupations in West Point are , and Sales & Related (72 | 37.5%).
Sales and Office Occupations by Sex

| Occupation | Male | Female |
| Sales & Related | 72 (100.0%) | 0 (0.0%) |
| Office & Administration | 0 (0.0%) | 0 (0.0%) |
| Total (Category) | 72 (100.0%) | 0 (0.0%) |
| Total (Overall) | 95 (49.5%) | 97 (50.5%) |
Natural Resources, Construction and Maintenance Occupations

Natural Resources, Construction and Maintenance Occupations by Sex
| Occupation | Male | Female |
| Farming, Fishing & Forestry | 0 (0.0%) | 0 (0.0%) |
| Construction & Extraction | 0 (0.0%) | 0 (0.0%) |
| Installation, Maintenance & Repair | 0 (0.0%) | 0 (0.0%) |
| Total (Category) | 0 (0.0%) | 0 (0.0%) |
| Total (Overall) | 95 (49.5%) | 97 (50.5%) |
Production, Transportation and Moving Occupations
The most common Production, Transportation and Moving occupations in West Point are , and Production (23 | 12.0%).
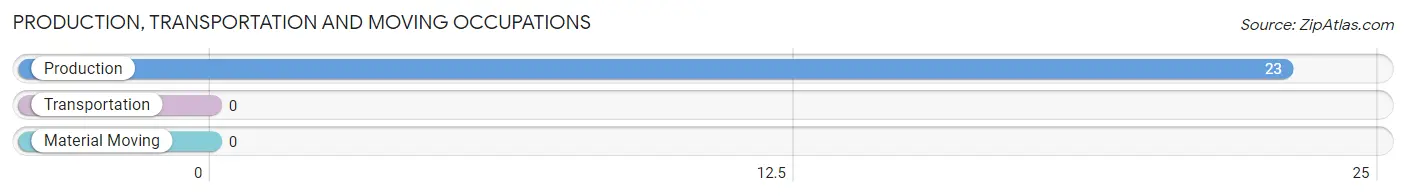
Production, Transportation and Moving Occupations by Sex
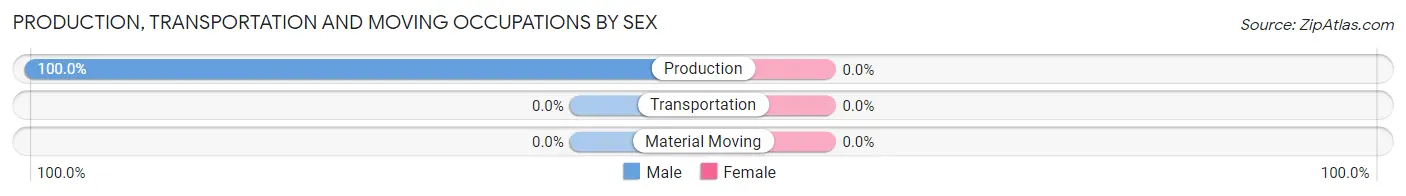
| Occupation | Male | Female |
| Production | 23 (100.0%) | 0 (0.0%) |
| Transportation | 0 (0.0%) | 0 (0.0%) |
| Material Moving | 0 (0.0%) | 0 (0.0%) |
| Total (Category) | 23 (100.0%) | 0 (0.0%) |
| Total (Overall) | 95 (49.5%) | 97 (50.5%) |
Employment Industries by Sex in West Point
Employment Industries in West Point
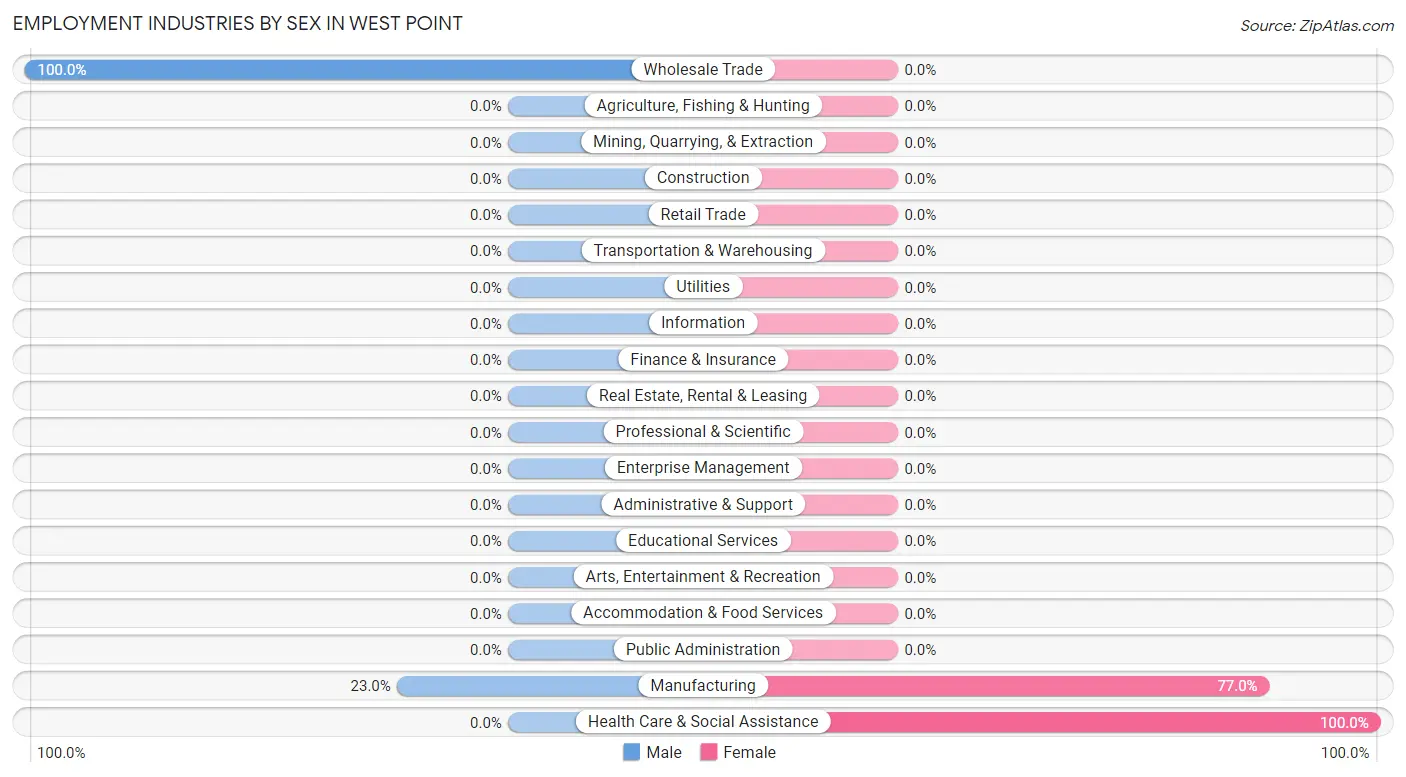
The major employment industries in West Point include Manufacturing (100 | 52.1%), Wholesale Trade (72 | 37.5%), and Health Care & Social Assistance (20 | 10.4%).
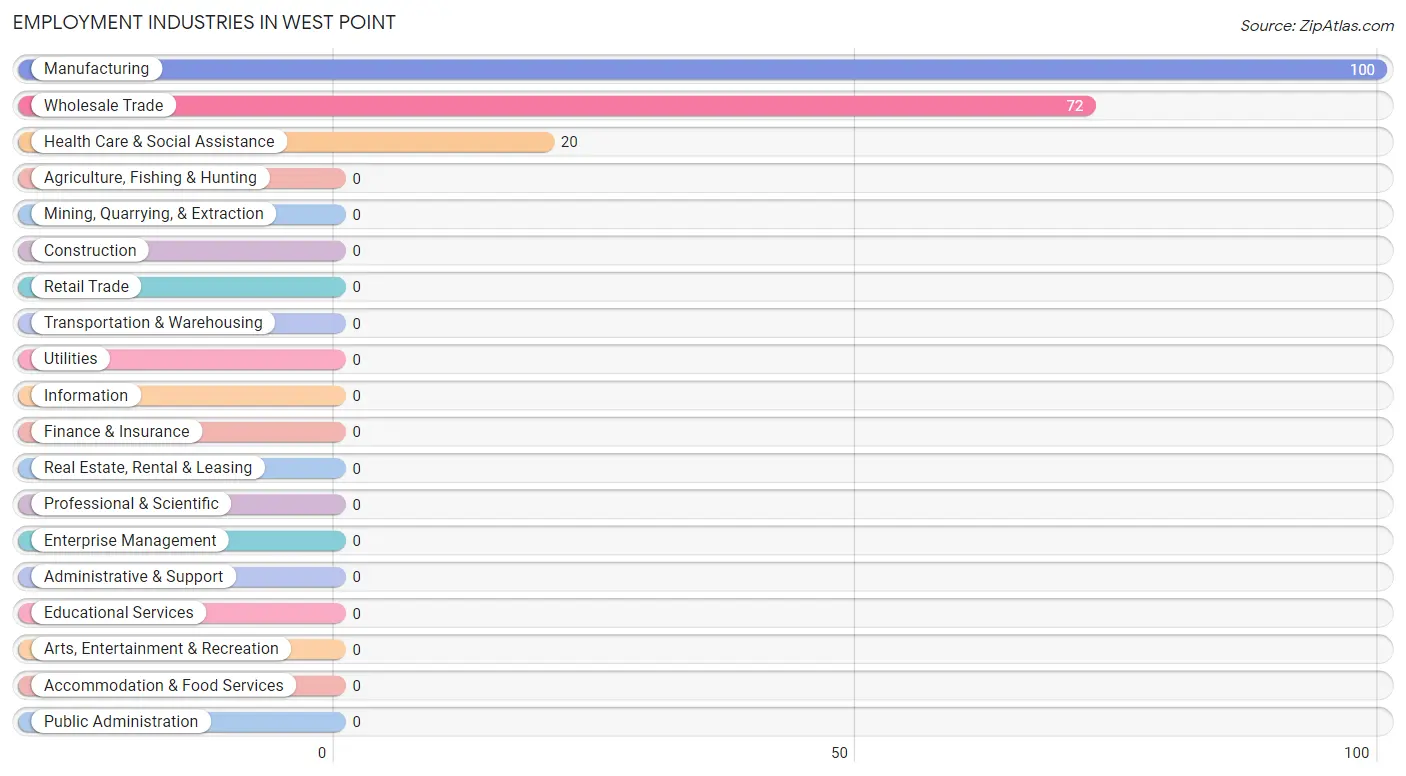
Employment Industries by Sex in West Point
The West Point industries that see more men than women are Wholesale Trade (100.0%), and Manufacturing (23.0%), whereas the industries that tend to have a higher number of women are Health Care & Social Assistance (100.0%), and Manufacturing (77.0%).
| Industry | Male | Female |
| Agriculture, Fishing & Hunting | 0 (0.0%) | 0 (0.0%) |
| Mining, Quarrying, & Extraction | 0 (0.0%) | 0 (0.0%) |
| Construction | 0 (0.0%) | 0 (0.0%) |
| Manufacturing | 23 (23.0%) | 77 (77.0%) |
| Wholesale Trade | 72 (100.0%) | 0 (0.0%) |
| Retail Trade | 0 (0.0%) | 0 (0.0%) |
| Transportation & Warehousing | 0 (0.0%) | 0 (0.0%) |
| Utilities | 0 (0.0%) | 0 (0.0%) |
| Information | 0 (0.0%) | 0 (0.0%) |
| Finance & Insurance | 0 (0.0%) | 0 (0.0%) |
| Real Estate, Rental & Leasing | 0 (0.0%) | 0 (0.0%) |
| Professional & Scientific | 0 (0.0%) | 0 (0.0%) |
| Enterprise Management | 0 (0.0%) | 0 (0.0%) |
| Administrative & Support | 0 (0.0%) | 0 (0.0%) |
| Educational Services | 0 (0.0%) | 0 (0.0%) |
| Health Care & Social Assistance | 0 (0.0%) | 20 (100.0%) |
| Arts, Entertainment & Recreation | 0 (0.0%) | 0 (0.0%) |
| Accommodation & Food Services | 0 (0.0%) | 0 (0.0%) |
| Public Administration | 0 (0.0%) | 0 (0.0%) |
| Total | 95 (49.5%) | 97 (50.5%) |
Education in West Point
School Enrollment in West Point
| School Level | # Students | % Students |
| Nursery / Preschool | 0 | 0.0% |
| Kindergarten | 0 | 0.0% |
| Elementary School | 0 | 0.0% |
| Middle School | 0 | 0.0% |
| High School | 0 | 0.0% |
| College / Undergraduate | 0 | 0.0% |
| Graduate / Professional | 0 | 0.0% |
| Total | 0 | 0.0% |
School Enrollment by Age by Funding Source in West Point
| Age Bracket | Public School | Private School |
| 3 to 4 Year Olds | 0 (0.0%) | 0 (0.0%) |
| 5 to 9 Year Old | 0 (0.0%) | 0 (0.0%) |
| 10 to 14 Year Olds | 0 (0.0%) | 0 (0.0%) |
| 15 to 17 Year Olds | 0 (0.0%) | 0 (0.0%) |
| 18 to 19 Year Olds | 0 (0.0%) | 0 (0.0%) |
| 20 to 24 Year Olds | 0 (0.0%) | 0 (0.0%) |
| 25 to 34 Year Olds | 0 (0.0%) | 0 (0.0%) |
| 35 Years and over | 0 (0.0%) | 0 (0.0%) |
| Total | 0 (0.0%) | 0 (0.0%) |
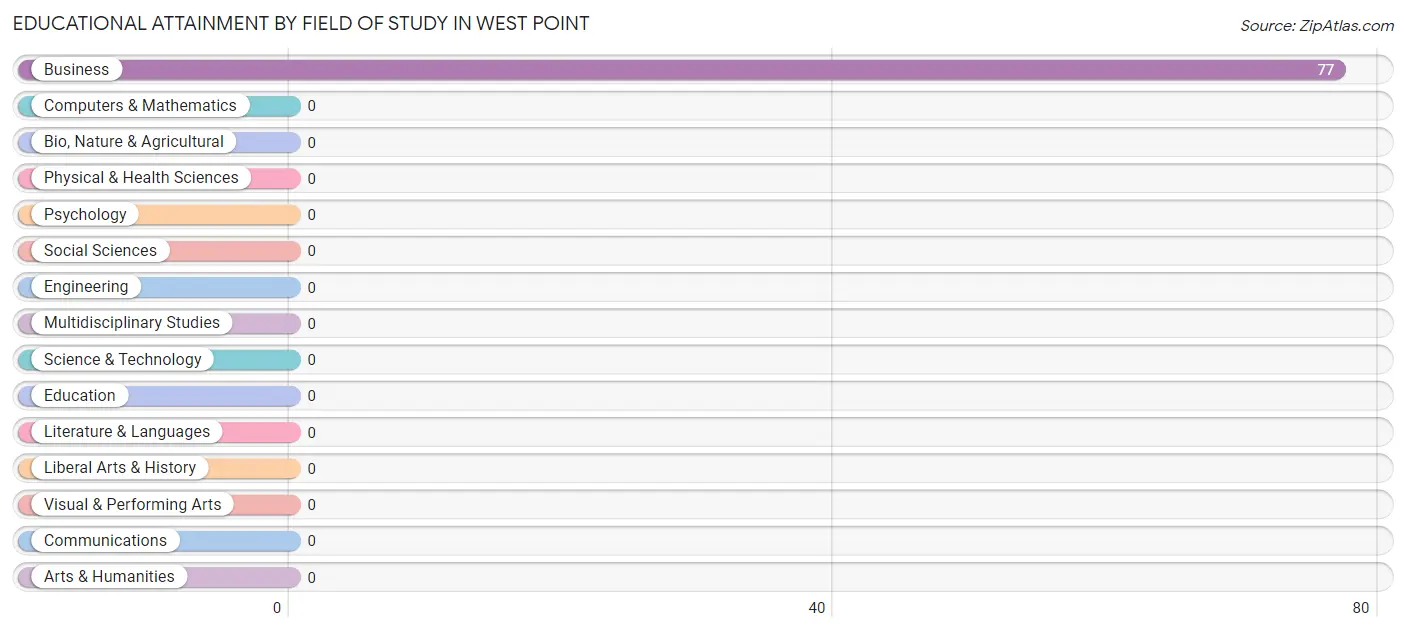
Educational Attainment by Field of Study in West Point
, and business (77 | 100.0%) are the most common fields of study among 77 individuals in West Point who have obtained a bachelor's degree or higher.
| Field of Study | # Graduates | % Graduates |
| Computers & Mathematics | 0 | 0.0% |
| Bio, Nature & Agricultural | 0 | 0.0% |
| Physical & Health Sciences | 0 | 0.0% |
| Psychology | 0 | 0.0% |
| Social Sciences | 0 | 0.0% |
| Engineering | 0 | 0.0% |
| Multidisciplinary Studies | 0 | 0.0% |
| Science & Technology | 0 | 0.0% |
| Business | 77 | 100.0% |
| Education | 0 | 0.0% |
| Literature & Languages | 0 | 0.0% |
| Liberal Arts & History | 0 | 0.0% |
| Visual & Performing Arts | 0 | 0.0% |
| Communications | 0 | 0.0% |
| Arts & Humanities | 0 | 0.0% |
| Total | 77 | 100.0% |
Transportation & Commute in West Point
Vehicle Availability by Sex in West Point
The most prevalent vehicle ownership categories in West Point are males with 2 vehicles (95, accounting for 100.0%) and females with 2 vehicles (97, making up 97.9%).
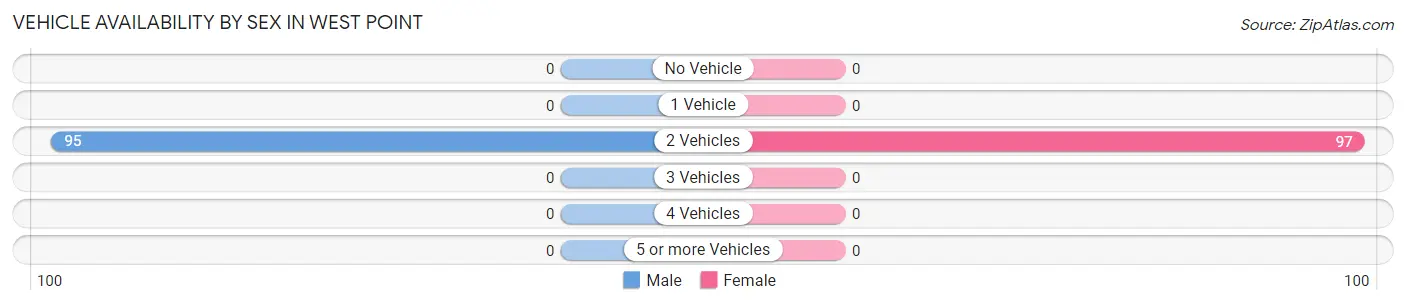
| Vehicles Available | Male | Female |
| No Vehicle | 0 (0.0%) | 0 (0.0%) |
| 1 Vehicle | 0 (0.0%) | 0 (0.0%) |
| 2 Vehicles | 95 (100.0%) | 97 (100.0%) |
| 3 Vehicles | 0 (0.0%) | 0 (0.0%) |
| 4 Vehicles | 0 (0.0%) | 0 (0.0%) |
| 5 or more Vehicles | 0 (0.0%) | 0 (0.0%) |
| Total | 95 (100.0%) | 97 (100.0%) |
Commute Time in West Point
The most frequently occuring commute durations in West Point are 25 to 29 minutes (149 commuters, 77.6%), 15 to 19 minutes (43 commuters, 22.4%), and less than 5 minutes (0 commuters, 0.0%).
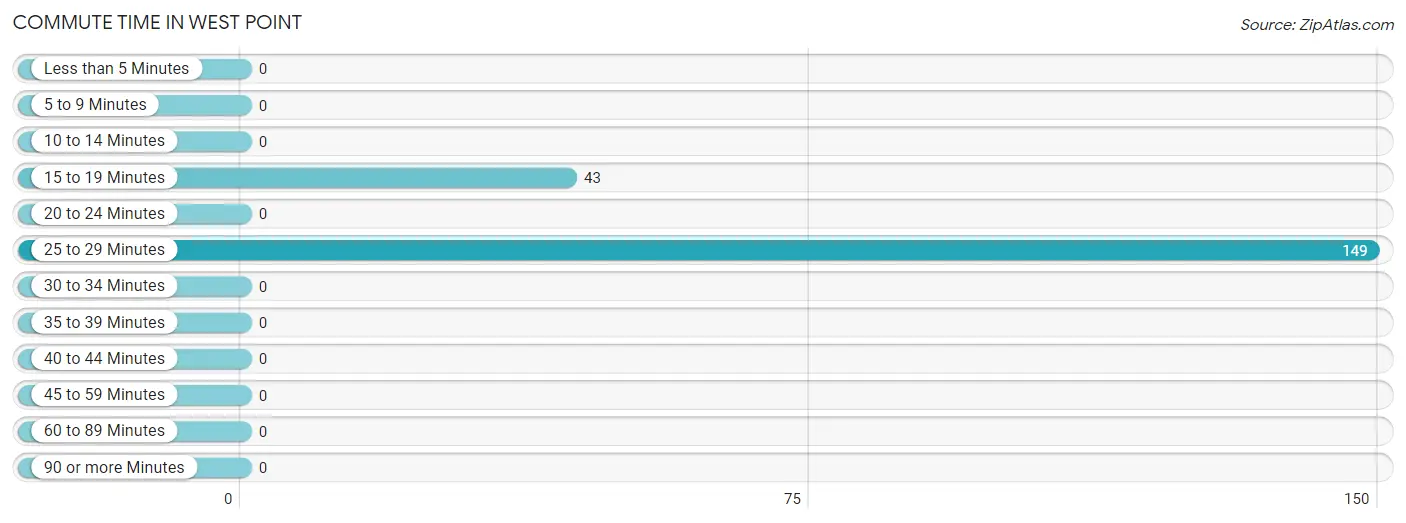
| Commute Time | # Commuters | % Commuters |
| Less than 5 Minutes | 0 | 0.0% |
| 5 to 9 Minutes | 0 | 0.0% |
| 10 to 14 Minutes | 0 | 0.0% |
| 15 to 19 Minutes | 43 | 22.4% |
| 20 to 24 Minutes | 0 | 0.0% |
| 25 to 29 Minutes | 149 | 77.6% |
| 30 to 34 Minutes | 0 | 0.0% |
| 35 to 39 Minutes | 0 | 0.0% |
| 40 to 44 Minutes | 0 | 0.0% |
| 45 to 59 Minutes | 0 | 0.0% |
| 60 to 89 Minutes | 0 | 0.0% |
| 90 or more Minutes | 0 | 0.0% |
Commute Time by Sex in West Point
The most common commute times in West Point are 25 to 29 minutes (72 commuters, 75.8%) for males and 25 to 29 minutes (77 commuters, 79.4%) for females.
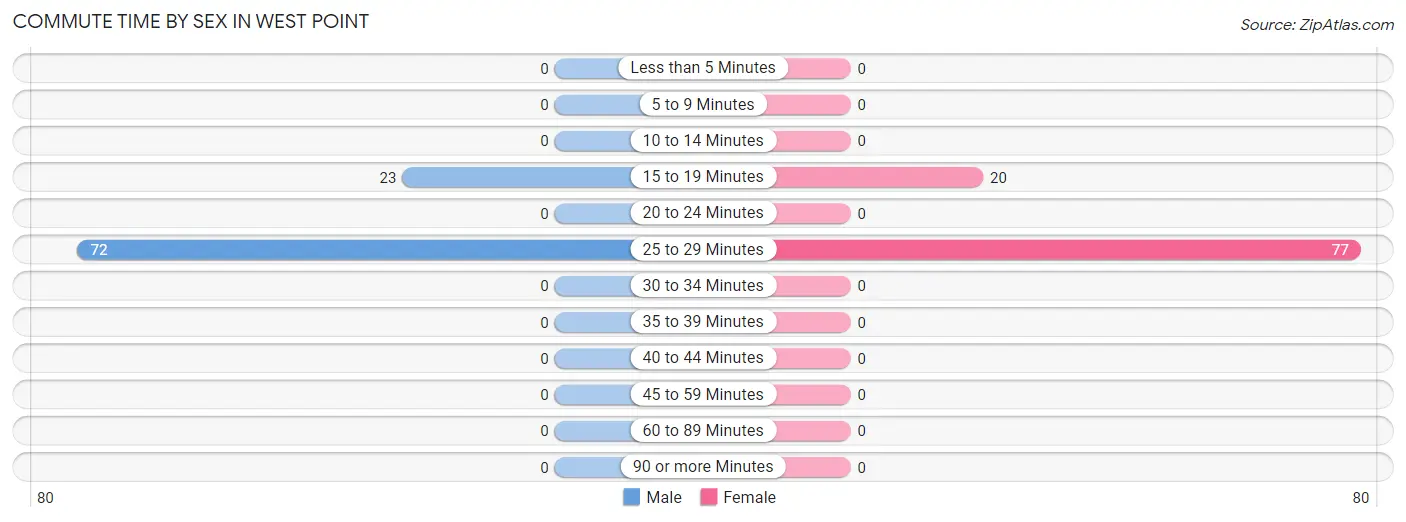
| Commute Time | Male | Female |
| Less than 5 Minutes | 0 (0.0%) | 0 (0.0%) |
| 5 to 9 Minutes | 0 (0.0%) | 0 (0.0%) |
| 10 to 14 Minutes | 0 (0.0%) | 0 (0.0%) |
| 15 to 19 Minutes | 23 (24.2%) | 20 (20.6%) |
| 20 to 24 Minutes | 0 (0.0%) | 0 (0.0%) |
| 25 to 29 Minutes | 72 (75.8%) | 77 (79.4%) |
| 30 to 34 Minutes | 0 (0.0%) | 0 (0.0%) |
| 35 to 39 Minutes | 0 (0.0%) | 0 (0.0%) |
| 40 to 44 Minutes | 0 (0.0%) | 0 (0.0%) |
| 45 to 59 Minutes | 0 (0.0%) | 0 (0.0%) |
| 60 to 89 Minutes | 0 (0.0%) | 0 (0.0%) |
| 90 or more Minutes | 0 (0.0%) | 0 (0.0%) |
Time of Departure to Work by Sex in West Point
The most frequent times of departure to work in West Point are 8:00 AM to 8:29 AM (72, 75.8%) for males and 5:30 AM to 5:59 AM (77, 79.4%) for females.
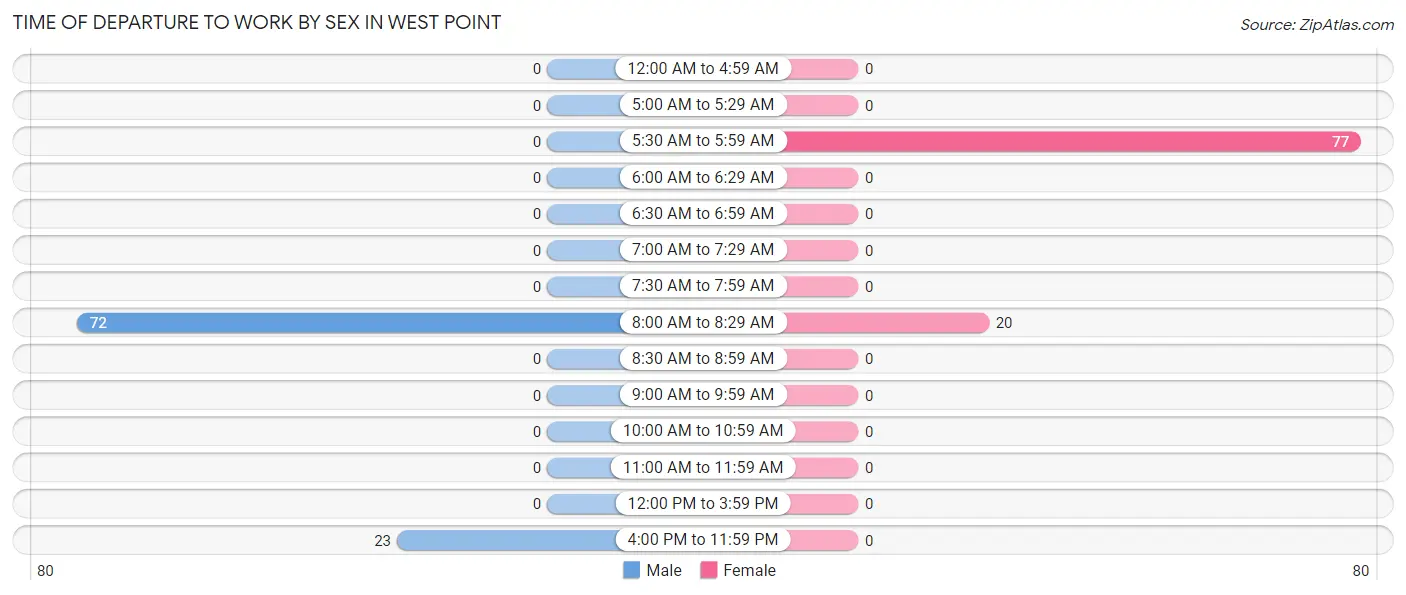
| Time of Departure | Male | Female |
| 12:00 AM to 4:59 AM | 0 (0.0%) | 0 (0.0%) |
| 5:00 AM to 5:29 AM | 0 (0.0%) | 0 (0.0%) |
| 5:30 AM to 5:59 AM | 0 (0.0%) | 77 (79.4%) |
| 6:00 AM to 6:29 AM | 0 (0.0%) | 0 (0.0%) |
| 6:30 AM to 6:59 AM | 0 (0.0%) | 0 (0.0%) |
| 7:00 AM to 7:29 AM | 0 (0.0%) | 0 (0.0%) |
| 7:30 AM to 7:59 AM | 0 (0.0%) | 0 (0.0%) |
| 8:00 AM to 8:29 AM | 72 (75.8%) | 20 (20.6%) |
| 8:30 AM to 8:59 AM | 0 (0.0%) | 0 (0.0%) |
| 9:00 AM to 9:59 AM | 0 (0.0%) | 0 (0.0%) |
| 10:00 AM to 10:59 AM | 0 (0.0%) | 0 (0.0%) |
| 11:00 AM to 11:59 AM | 0 (0.0%) | 0 (0.0%) |
| 12:00 PM to 3:59 PM | 0 (0.0%) | 0 (0.0%) |
| 4:00 PM to 11:59 PM | 23 (24.2%) | 0 (0.0%) |
| Total | 95 (100.0%) | 97 (100.0%) |
Housing Occupancy in West Point
Occupancy by Ownership in West Point
Of the total 116 dwellings in West Point, owner-occupied units account for 116 (100.0%), while renter-occupied units make up 0 (0.0%).
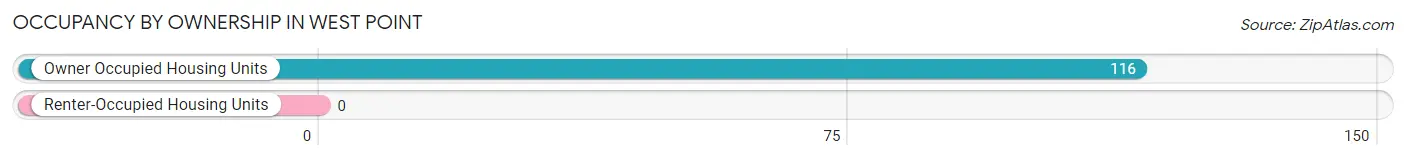
| Occupancy | # Housing Units | % Housing Units |
| Owner Occupied Housing Units | 116 | 100.0% |
| Renter-Occupied Housing Units | 0 | 0.0% |
| Total Occupied Housing Units | 116 | 100.0% |
Occupancy by Household Size in West Point
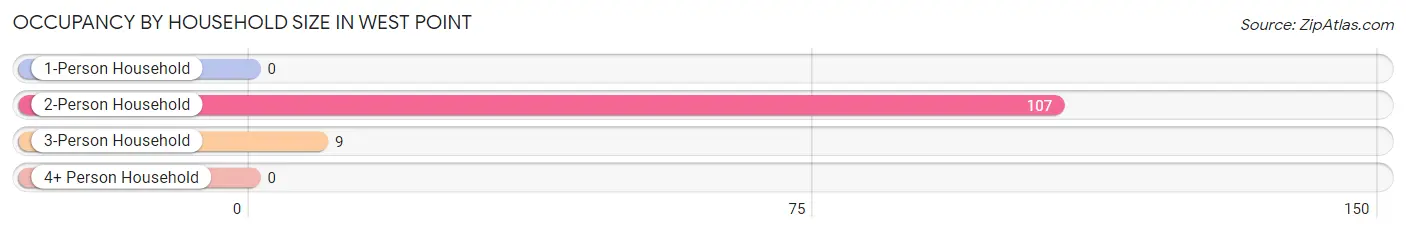
| Household Size | # Housing Units | % Housing Units |
| 1-Person Household | 0 | 0.0% |
| 2-Person Household | 107 | 92.2% |
| 3-Person Household | 9 | 7.8% |
| 4+ Person Household | 0 | 0.0% |
| Total Housing Units | 116 | 100.0% |
Occupancy by Ownership by Household Size in West Point
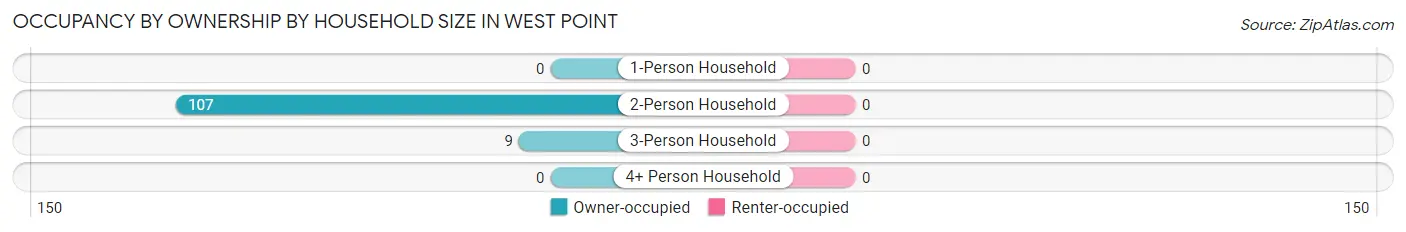
| Household Size | Owner-occupied | Renter-occupied |
| 1-Person Household | 0 (0.0%) | 0 (0.0%) |
| 2-Person Household | 107 (100.0%) | 0 (0.0%) |
| 3-Person Household | 9 (100.0%) | 0 (0.0%) |
| 4+ Person Household | 0 (0.0%) | 0 (0.0%) |
| Total Housing Units | 116 (100.0%) | 0 (0.0%) |
Occupancy by Educational Attainment in West Point
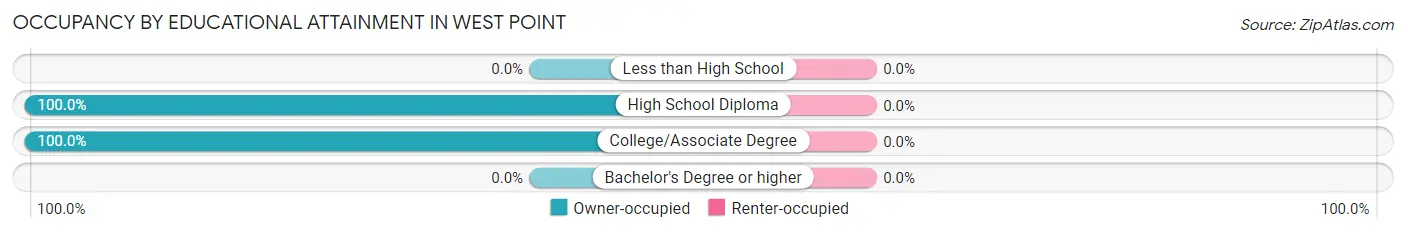
| Household Size | Owner-occupied | Renter-occupied |
| Less than High School | 0 (0.0%) | 0 (0.0%) |
| High School Diploma | 32 (100.0%) | 0 (0.0%) |
| College/Associate Degree | 84 (100.0%) | 0 (0.0%) |
| Bachelor's Degree or higher | 0 (0.0%) | 0 (0.0%) |
Occupancy by Age of Householder in West Point
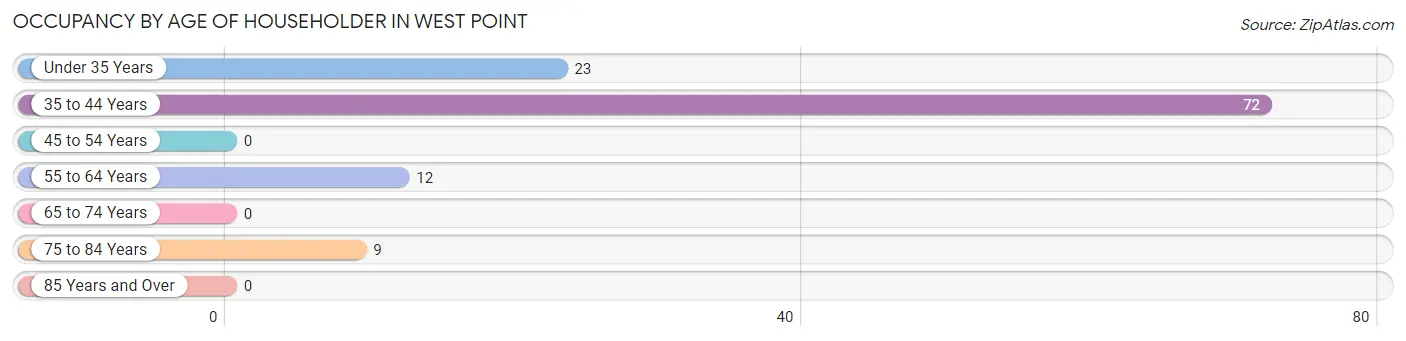
| Age Bracket | # Households | % Households |
| Under 35 Years | 23 | 19.8% |
| 35 to 44 Years | 72 | 62.1% |
| 45 to 54 Years | 0 | 0.0% |
| 55 to 64 Years | 12 | 10.3% |
| 65 to 74 Years | 0 | 0.0% |
| 75 to 84 Years | 9 | 7.8% |
| 85 Years and Over | 0 | 0.0% |
| Total | 116 | 100.0% |
Housing Finances in West Point
Median Income by Occupancy in West Point
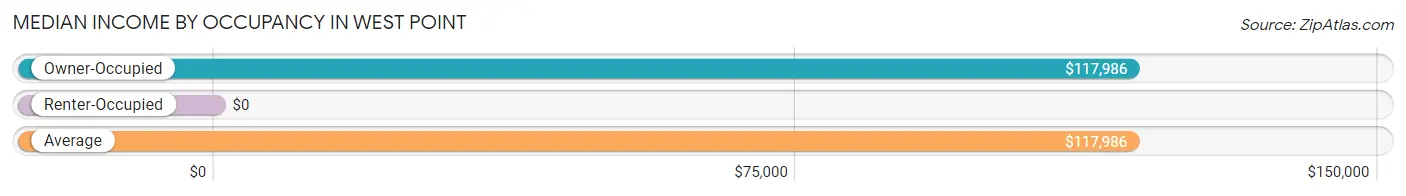
| Occupancy Type | # Households | Median Income |
| Owner-Occupied | 116 (100.0%) | $117,986 |
| Renter-Occupied | 0 (0.0%) | $0 |
| Average | 116 (100.0%) | $117,986 |
Occupancy by Householder Income Bracket in West Point
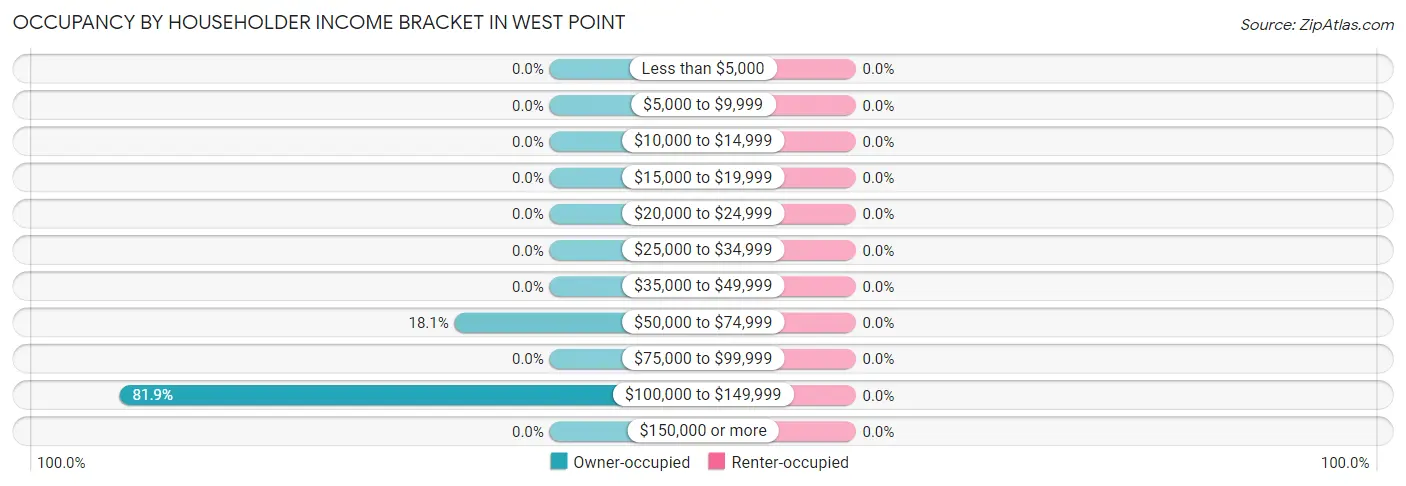
| Income Bracket | Owner-occupied | Renter-occupied |
| Less than $5,000 | 0 (0.0%) | 0 (0.0%) |
| $5,000 to $9,999 | 0 (0.0%) | 0 (0.0%) |
| $10,000 to $14,999 | 0 (0.0%) | 0 (0.0%) |
| $15,000 to $19,999 | 0 (0.0%) | 0 (0.0%) |
| $20,000 to $24,999 | 0 (0.0%) | 0 (0.0%) |
| $25,000 to $34,999 | 0 (0.0%) | 0 (0.0%) |
| $35,000 to $49,999 | 0 (0.0%) | 0 (0.0%) |
| $50,000 to $74,999 | 21 (18.1%) | 0 (0.0%) |
| $75,000 to $99,999 | 0 (0.0%) | 0 (0.0%) |
| $100,000 to $149,999 | 95 (81.9%) | 0 (0.0%) |
| $150,000 or more | 0 (0.0%) | 0 (0.0%) |
| Total | 116 (100.0%) | 0 (0.0%) |
Monthly Housing Cost Tiers in West Point
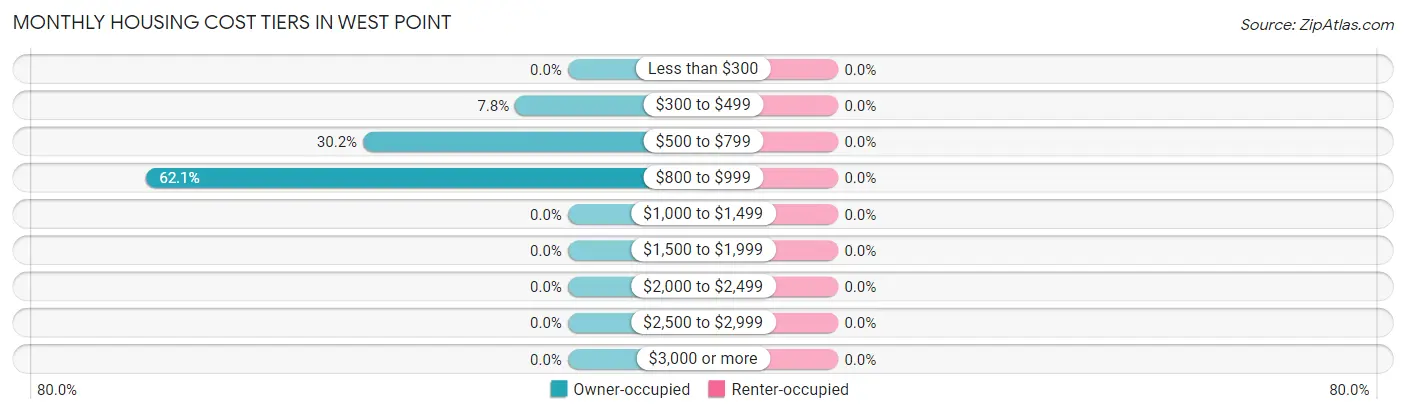
| Monthly Cost | Owner-occupied | Renter-occupied |
| Less than $300 | 0 (0.0%) | 0 (0.0%) |
| $300 to $499 | 9 (7.8%) | 0 (0.0%) |
| $500 to $799 | 35 (30.2%) | 0 (0.0%) |
| $800 to $999 | 72 (62.1%) | 0 (0.0%) |
| $1,000 to $1,499 | 0 (0.0%) | 0 (0.0%) |
| $1,500 to $1,999 | 0 (0.0%) | 0 (0.0%) |
| $2,000 to $2,499 | 0 (0.0%) | 0 (0.0%) |
| $2,500 to $2,999 | 0 (0.0%) | 0 (0.0%) |
| $3,000 or more | 0 (0.0%) | 0 (0.0%) |
| Total | 116 (100.0%) | 0 (0.0%) |
Physical Housing Characteristics in West Point
Housing Structures in West Point
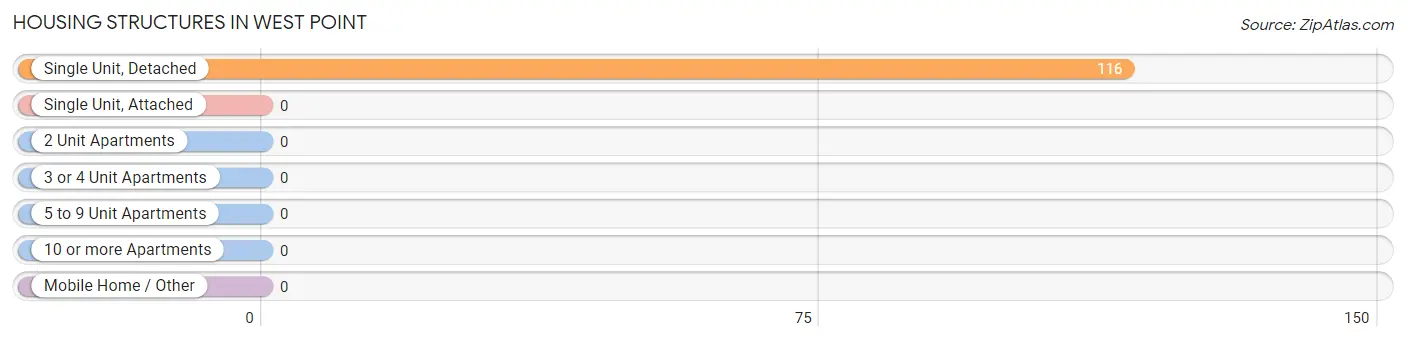
| Structure Type | # Housing Units | % Housing Units |
| Single Unit, Detached | 116 | 100.0% |
| Single Unit, Attached | 0 | 0.0% |
| 2 Unit Apartments | 0 | 0.0% |
| 3 or 4 Unit Apartments | 0 | 0.0% |
| 5 to 9 Unit Apartments | 0 | 0.0% |
| 10 or more Apartments | 0 | 0.0% |
| Mobile Home / Other | 0 | 0.0% |
| Total | 116 | 100.0% |
Housing Structures by Occupancy in West Point
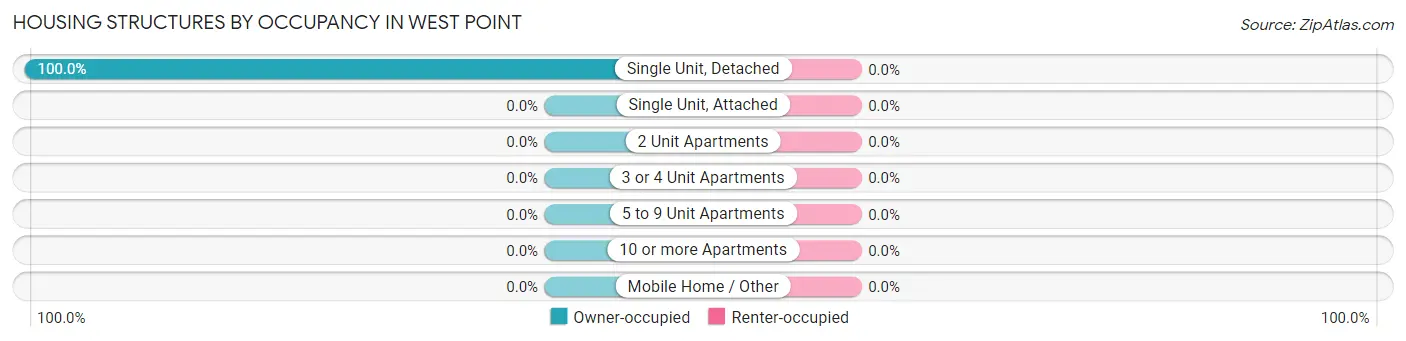
| Structure Type | Owner-occupied | Renter-occupied |
| Single Unit, Detached | 116 (100.0%) | 0 (0.0%) |
| Single Unit, Attached | 0 (0.0%) | 0 (0.0%) |
| 2 Unit Apartments | 0 (0.0%) | 0 (0.0%) |
| 3 or 4 Unit Apartments | 0 (0.0%) | 0 (0.0%) |
| 5 to 9 Unit Apartments | 0 (0.0%) | 0 (0.0%) |
| 10 or more Apartments | 0 (0.0%) | 0 (0.0%) |
| Mobile Home / Other | 0 (0.0%) | 0 (0.0%) |
| Total | 116 (100.0%) | 0 (0.0%) |
Housing Structures by Number of Rooms in West Point
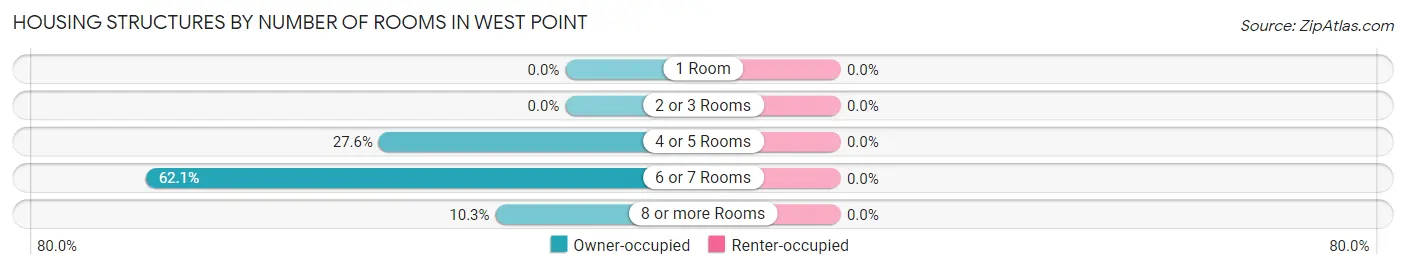
| Number of Rooms | Owner-occupied | Renter-occupied |
| 1 Room | 0 (0.0%) | 0 (0.0%) |
| 2 or 3 Rooms | 0 (0.0%) | 0 (0.0%) |
| 4 or 5 Rooms | 32 (27.6%) | 0 (0.0%) |
| 6 or 7 Rooms | 72 (62.1%) | 0 (0.0%) |
| 8 or more Rooms | 12 (10.3%) | 0 (0.0%) |
| Total | 116 (100.0%) | 0 (0.0%) |
Housing Structure by Heating Type in West Point
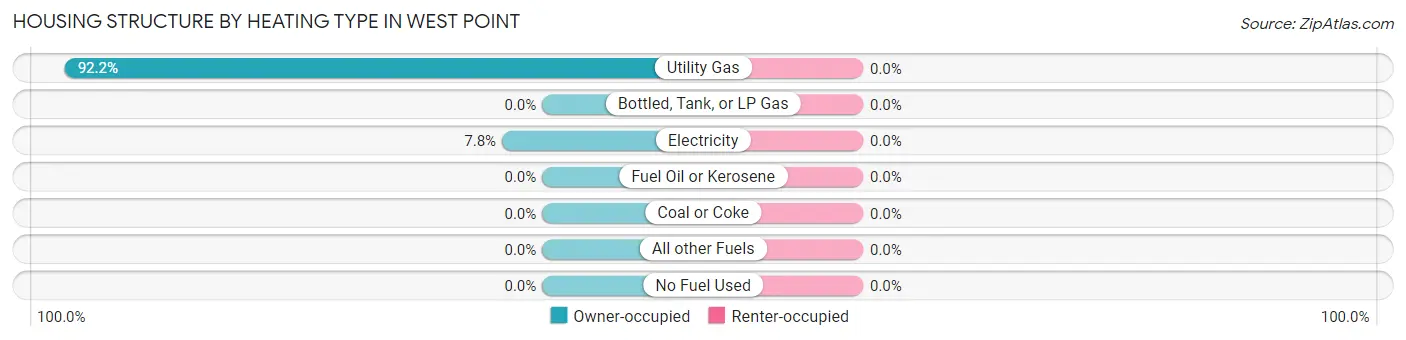
| Heating Type | Owner-occupied | Renter-occupied |
| Utility Gas | 107 (92.2%) | 0 (0.0%) |
| Bottled, Tank, or LP Gas | 0 (0.0%) | 0 (0.0%) |
| Electricity | 9 (7.8%) | 0 (0.0%) |
| Fuel Oil or Kerosene | 0 (0.0%) | 0 (0.0%) |
| Coal or Coke | 0 (0.0%) | 0 (0.0%) |
| All other Fuels | 0 (0.0%) | 0 (0.0%) |
| No Fuel Used | 0 (0.0%) | 0 (0.0%) |
| Total | 116 (100.0%) | 0 (0.0%) |
Household Vehicle Usage in West Point
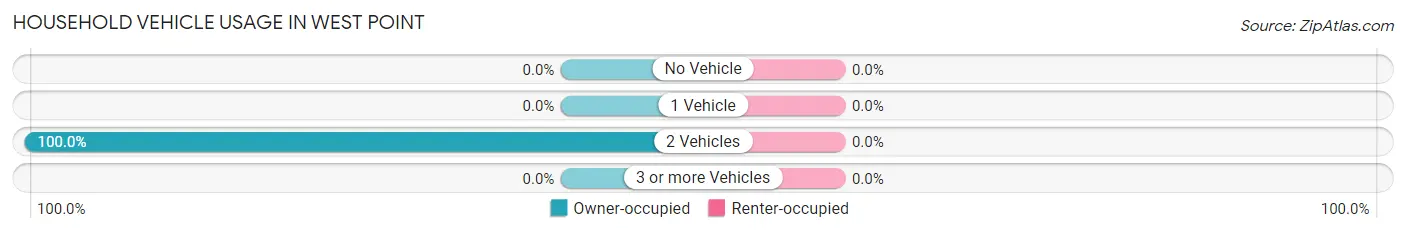
| Vehicles per Household | Owner-occupied | Renter-occupied |
| No Vehicle | 0 (0.0%) | 0 (0.0%) |
| 1 Vehicle | 0 (0.0%) | 0 (0.0%) |
| 2 Vehicles | 116 (100.0%) | 0 (0.0%) |
| 3 or more Vehicles | 0 (0.0%) | 0 (0.0%) |
| Total | 116 (100.0%) | 0 (0.0%) |
Real Estate & Mortgages in West Point
Real Estate and Mortgage Overview in West Point
| Characteristic | Without Mortgage | With Mortgage |
| Housing Units | 21 | 95 |
| Median Property Value | - | - |
| Median Household Income | - | - |
| Monthly Housing Costs | - | - |
| Real Estate Taxes | - | - |
Property Value by Mortgage Status in West Point
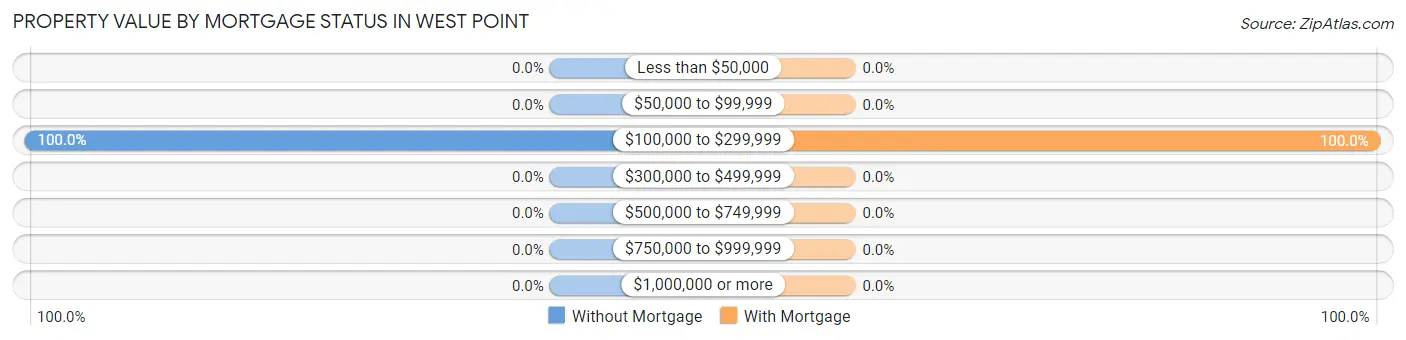
| Property Value | Without Mortgage | With Mortgage |
| Less than $50,000 | 0 (0.0%) | 0 (0.0%) |
| $50,000 to $99,999 | 0 (0.0%) | 0 (0.0%) |
| $100,000 to $299,999 | 21 (100.0%) | 95 (100.0%) |
| $300,000 to $499,999 | 0 (0.0%) | 0 (0.0%) |
| $500,000 to $749,999 | 0 (0.0%) | 0 (0.0%) |
| $750,000 to $999,999 | 0 (0.0%) | 0 (0.0%) |
| $1,000,000 or more | 0 (0.0%) | 0 (0.0%) |
| Total | 21 (100.0%) | 95 (100.0%) |
Household Income by Mortgage Status in West Point
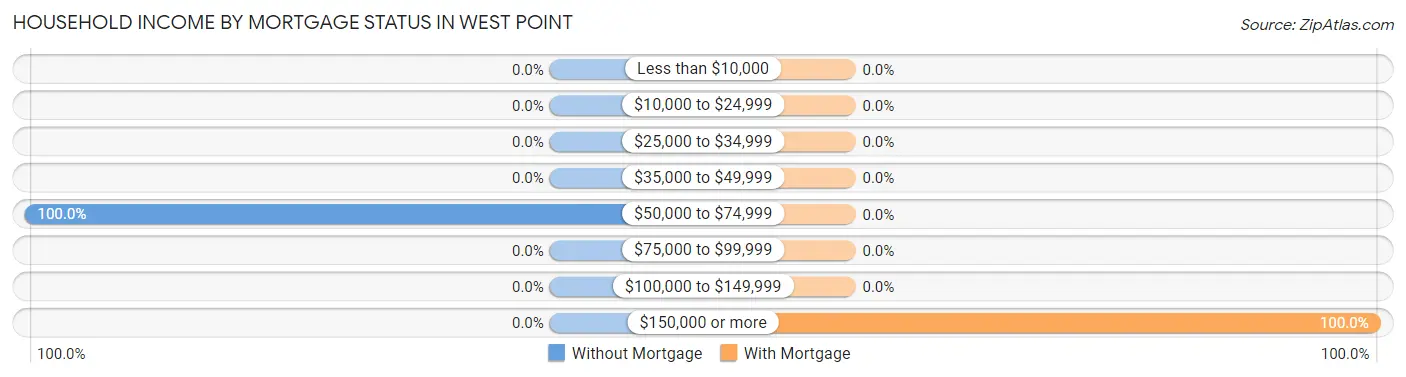
| Household Income | Without Mortgage | With Mortgage |
| Less than $10,000 | 0 (0.0%) | 0 (0.0%) |
| $10,000 to $24,999 | 0 (0.0%) | 0 (0.0%) |
| $25,000 to $34,999 | 0 (0.0%) | 0 (0.0%) |
| $35,000 to $49,999 | 0 (0.0%) | 0 (0.0%) |
| $50,000 to $74,999 | 21 (100.0%) | 0 (0.0%) |
| $75,000 to $99,999 | 0 (0.0%) | 0 (0.0%) |
| $100,000 to $149,999 | 0 (0.0%) | 0 (0.0%) |
| $150,000 or more | 0 (0.0%) | 95 (100.0%) |
| Total | 21 (100.0%) | 95 (100.0%) |
Property Value to Household Income Ratio in West Point
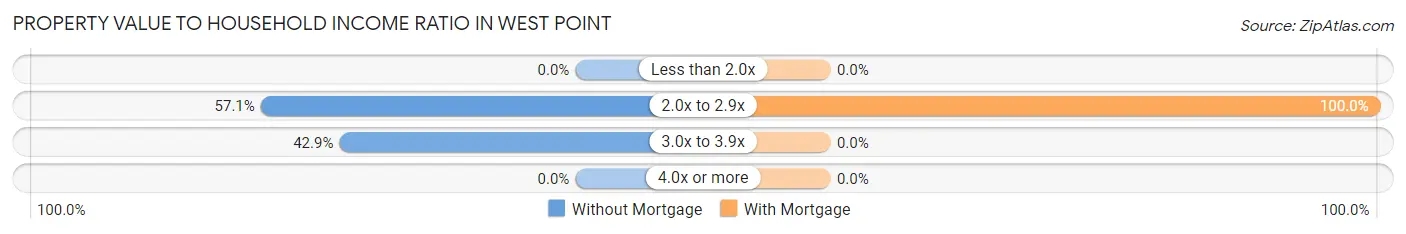
| Value-to-Income Ratio | Without Mortgage | With Mortgage |
| Less than 2.0x | 0 (0.0%) | 0 (0.0%) |
| 2.0x to 2.9x | 12 (57.1%) | 95 (100.0%) |
| 3.0x to 3.9x | 9 (42.9%) | 0 (0.0%) |
| 4.0x or more | 0 (0.0%) | 0 (0.0%) |
| Total | 21 (100.0%) | 95 (100.0%) |
Real Estate Taxes by Mortgage Status in West Point
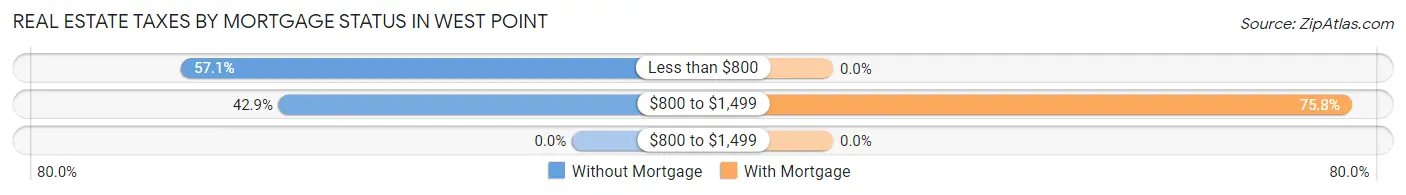
| Property Taxes | Without Mortgage | With Mortgage |
| Less than $800 | 12 (57.1%) | 0 (0.0%) |
| $800 to $1,499 | 9 (42.9%) | 72 (75.8%) |
| $800 to $1,499 | 0 (0.0%) | 0 (0.0%) |
| Total | 21 (100.0%) | 95 (100.0%) |
Health & Disability in West Point
Health Insurance Coverage by Age in West Point
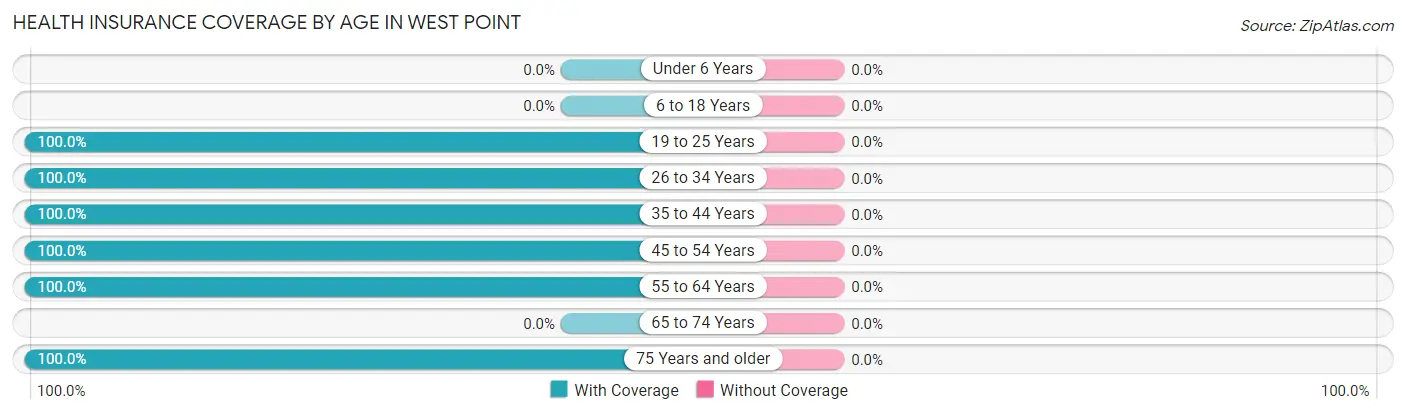
| Age Bracket | With Coverage | Without Coverage |
| Under 6 Years | 0 (0.0%) | 0 (0.0%) |
| 6 to 18 Years | 0 (0.0%) | 0 (0.0%) |
| 19 to 25 Years | 20 (100.0%) | 0 (0.0%) |
| 26 to 34 Years | 23 (100.0%) | 0 (0.0%) |
| 35 to 44 Years | 149 (100.0%) | 0 (0.0%) |
| 45 to 54 Years | 9 (100.0%) | 0 (0.0%) |
| 55 to 64 Years | 25 (100.0%) | 0 (0.0%) |
| 65 to 74 Years | 0 (0.0%) | 0 (0.0%) |
| 75 Years and older | 20 (100.0%) | 0 (0.0%) |
| Total | 246 (100.0%) | 0 (0.0%) |
Health Insurance Coverage by Citizenship Status in West Point
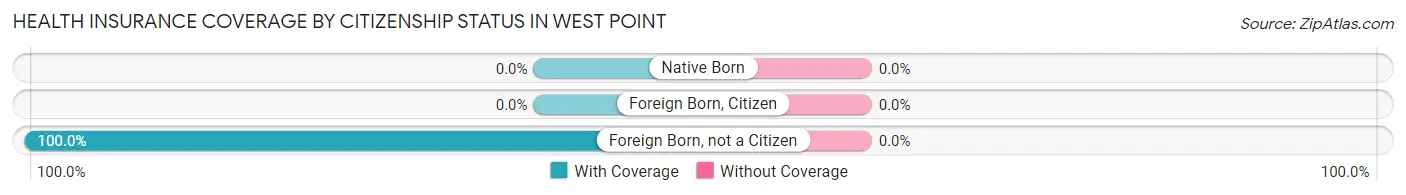
| Citizenship Status | With Coverage | Without Coverage |
| Native Born | 0 (0.0%) | 0 (0.0%) |
| Foreign Born, Citizen | 0 (0.0%) | 0 (0.0%) |
| Foreign Born, not a Citizen | 20 (100.0%) | 0 (0.0%) |
Health Insurance Coverage by Household Income in West Point
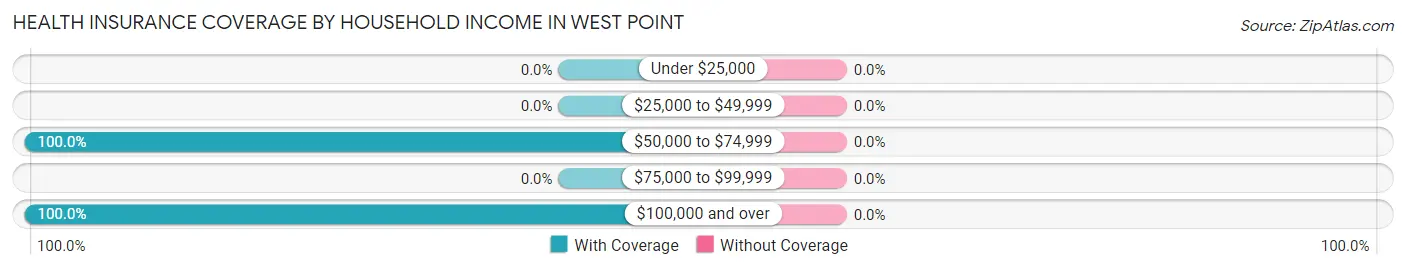
| Household Income | With Coverage | Without Coverage |
| Under $25,000 | 0 (0.0%) | 0 (0.0%) |
| $25,000 to $49,999 | 0 (0.0%) | 0 (0.0%) |
| $50,000 to $74,999 | 54 (100.0%) | 0 (0.0%) |
| $75,000 to $99,999 | 0 (0.0%) | 0 (0.0%) |
| $100,000 and over | 192 (100.0%) | 0 (0.0%) |
Public vs Private Health Insurance Coverage by Age in West Point
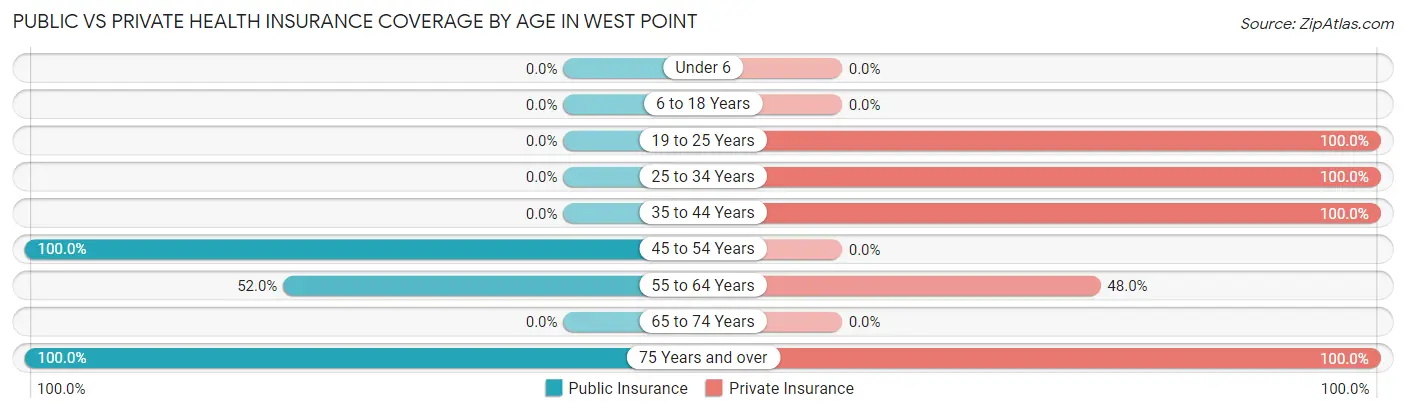
| Age Bracket | Public Insurance | Private Insurance |
| Under 6 | 0 (0.0%) | 0 (0.0%) |
| 6 to 18 Years | 0 (0.0%) | 0 (0.0%) |
| 19 to 25 Years | 0 (0.0%) | 20 (100.0%) |
| 25 to 34 Years | 0 (0.0%) | 23 (100.0%) |
| 35 to 44 Years | 0 (0.0%) | 149 (100.0%) |
| 45 to 54 Years | 9 (100.0%) | 0 (0.0%) |
| 55 to 64 Years | 13 (52.0%) | 12 (48.0%) |
| 65 to 74 Years | 0 (0.0%) | 0 (0.0%) |
| 75 Years and over | 20 (100.0%) | 20 (100.0%) |
| Total | 42 (17.1%) | 224 (91.1%) |
Disability Status by Sex by Age in West Point
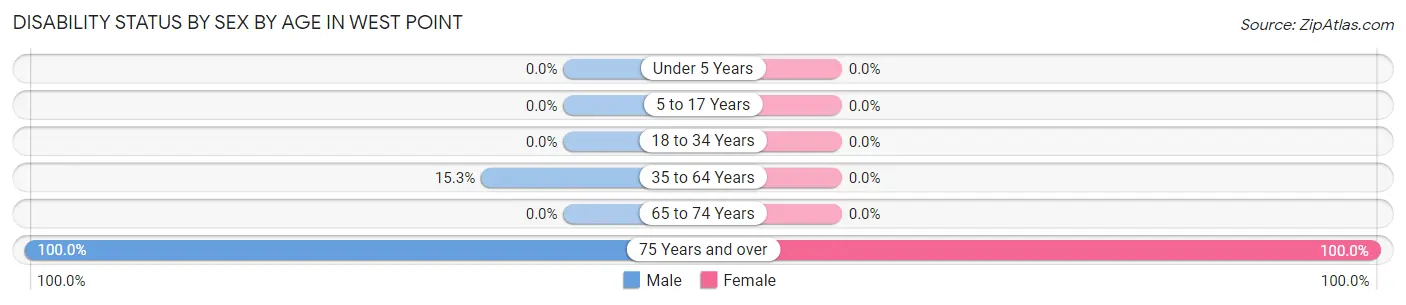
| Age Bracket | Male | Female |
| Under 5 Years | 0 (0.0%) | 0 (0.0%) |
| 5 to 17 Years | 0 (0.0%) | 0 (0.0%) |
| 18 to 34 Years | 0 (0.0%) | 0 (0.0%) |
| 35 to 64 Years | 13 (15.3%) | 0 (0.0%) |
| 65 to 74 Years | 0 (0.0%) | 0 (0.0%) |
| 75 Years and over | 9 (100.0%) | 11 (100.0%) |
Disability Class by Sex by Age in West Point
Disability Class: Hearing Difficulty
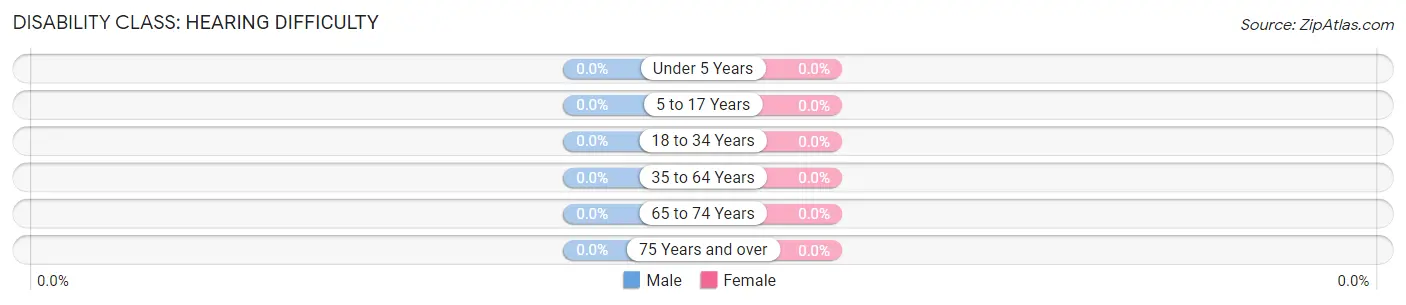
| Age Bracket | Male | Female |
| Under 5 Years | 0 (0.0%) | 0 (0.0%) |
| 5 to 17 Years | 0 (0.0%) | 0 (0.0%) |
| 18 to 34 Years | 0 (0.0%) | 0 (0.0%) |
| 35 to 64 Years | 0 (0.0%) | 0 (0.0%) |
| 65 to 74 Years | 0 (0.0%) | 0 (0.0%) |
| 75 Years and over | 0 (0.0%) | 0 (0.0%) |
Disability Class: Vision Difficulty
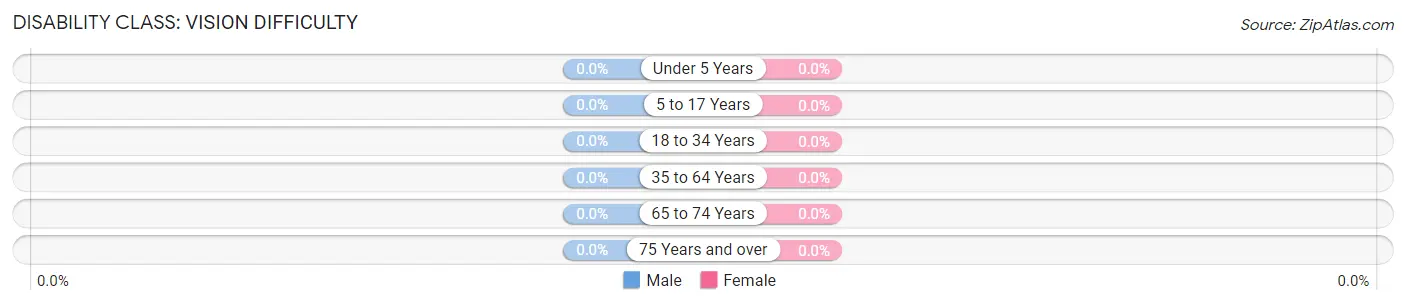
| Age Bracket | Male | Female |
| Under 5 Years | 0 (0.0%) | 0 (0.0%) |
| 5 to 17 Years | 0 (0.0%) | 0 (0.0%) |
| 18 to 34 Years | 0 (0.0%) | 0 (0.0%) |
| 35 to 64 Years | 0 (0.0%) | 0 (0.0%) |
| 65 to 74 Years | 0 (0.0%) | 0 (0.0%) |
| 75 Years and over | 0 (0.0%) | 0 (0.0%) |
Disability Class: Cognitive Difficulty
| Age Bracket | Male | Female |
| 5 to 17 Years | 0 (0.0%) | 0 (0.0%) |
| 18 to 34 Years | 0 (0.0%) | 0 (0.0%) |
| 35 to 64 Years | 0 (0.0%) | 0 (0.0%) |
| 65 to 74 Years | 0 (0.0%) | 0 (0.0%) |
| 75 Years and over | 0 (0.0%) | 0 (0.0%) |
Disability Class: Ambulatory Difficulty
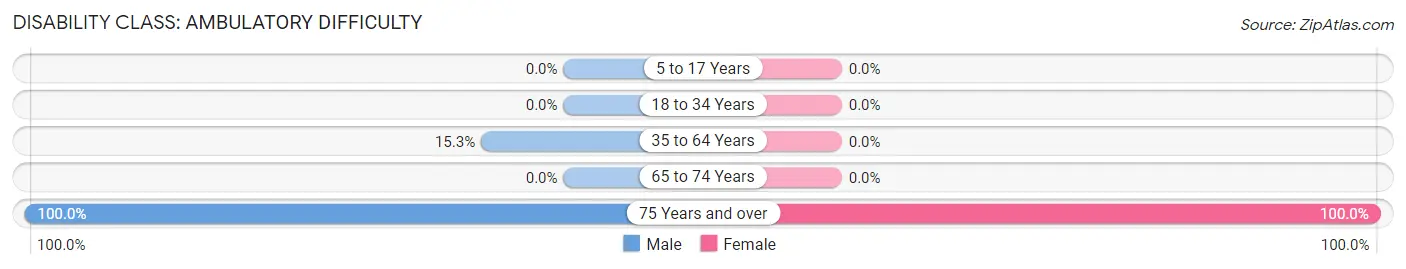
| Age Bracket | Male | Female |
| 5 to 17 Years | 0 (0.0%) | 0 (0.0%) |
| 18 to 34 Years | 0 (0.0%) | 0 (0.0%) |
| 35 to 64 Years | 13 (15.3%) | 0 (0.0%) |
| 65 to 74 Years | 0 (0.0%) | 0 (0.0%) |
| 75 Years and over | 9 (100.0%) | 11 (100.0%) |
Disability Class: Self-Care Difficulty
| Age Bracket | Male | Female |
| 5 to 17 Years | 0 (0.0%) | 0 (0.0%) |
| 18 to 34 Years | 0 (0.0%) | 0 (0.0%) |
| 35 to 64 Years | 0 (0.0%) | 0 (0.0%) |
| 65 to 74 Years | 0 (0.0%) | 0 (0.0%) |
| 75 Years and over | 0 (0.0%) | 0 (0.0%) |
Technology Access in West Point
Computing Device Access in West Point
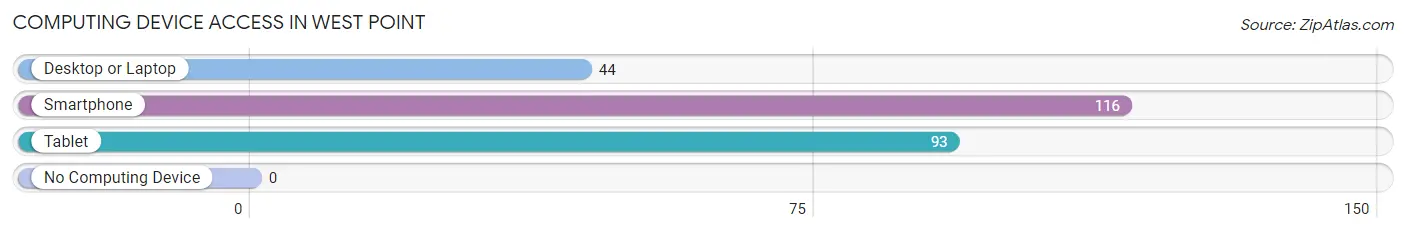
| Device Type | # Households | % Households |
| Desktop or Laptop | 44 | 37.9% |
| Smartphone | 116 | 100.0% |
| Tablet | 93 | 80.2% |
| No Computing Device | 0 | 0.0% |
| Total | 116 | 100.0% |
Internet Access in West Point
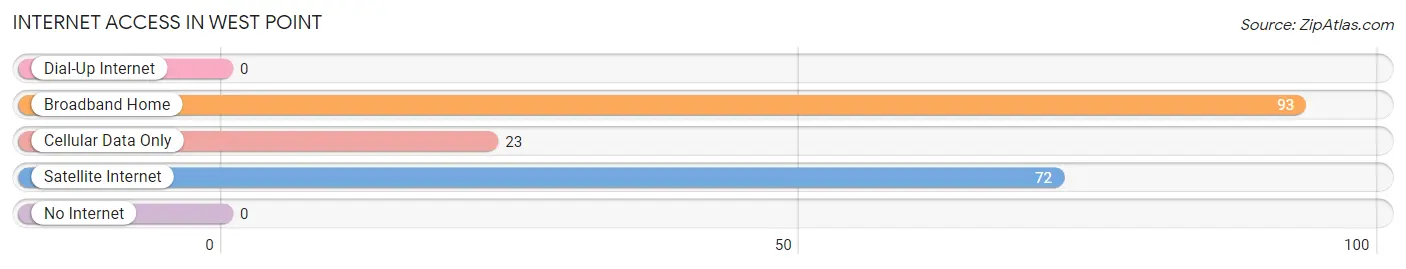
| Internet Type | # Households | % Households |
| Dial-Up Internet | 0 | 0.0% |
| Broadband Home | 93 | 80.2% |
| Cellular Data Only | 23 | 19.8% |
| Satellite Internet | 72 | 62.1% |
| No Internet | 0 | 0.0% |
| Total | 116 | 100.0% |
West Point Summary
West Point is a small town located in Tippecanoe County, Indiana. It is situated on the banks of the Wabash River, approximately 10 miles south of Lafayette. The town was founded in 1836 and has a population of approximately 1,500 people.
History
West Point was founded in 1836 by a group of settlers from Ohio. The town was named after the nearby West Point Military Academy in New York. The settlers were attracted to the area due to its fertile soil and access to the Wabash River. The town quickly grew and by 1837, it had a population of over 500 people.
In 1839, the first school was established in West Point. The school was a one-room log cabin and was used until 1845 when a larger school was built. The town also had a post office, a blacksmith shop, and a general store.
In 1851, the first railroad line was built through West Point. This allowed for the town to become a major shipping hub for the surrounding area. The railroad also allowed for the town to become a popular tourist destination.
In 1871, the town was incorporated and the first mayor was elected. The town continued to grow and by the early 1900s, it had a population of over 1,000 people.
Geography
West Point is located in Tippecanoe County, Indiana. It is situated on the banks of the Wabash River, approximately 10 miles south of Lafayette. The town is located in a flat, open area and is surrounded by farmland. The town is located at an elevation of approximately 600 feet above sea level.
The climate in West Point is humid continental, with hot summers and cold winters. The average temperature in the summer is around 75 degrees Fahrenheit and the average temperature in the winter is around 30 degrees Fahrenheit.
Economy
The economy of West Point is largely based on agriculture. The town is surrounded by farmland and many of the residents are involved in farming. The town also has a few small businesses, including a grocery store, a hardware store, and a few restaurants.
The town is also home to a few manufacturing companies, including a plastics factory and a metal fabrication plant. The town is also home to a few small technology companies.
Demographics
The population of West Point is approximately 1,500 people. The town is predominantly white, with a small Hispanic population. The median household income is around $50,000 and the median home value is around $150,000.
The town is served by the West Point-Tippecanoe School Corporation, which includes two elementary schools, one middle school, and one high school. The town also has a public library and a few churches.
Conclusion
West Point is a small town located in Tippecanoe County, Indiana. It was founded in 1836 and has a population of approximately 1,500 people. The town is largely based on agriculture and has a few small businesses. The town is served by the West Point-Tippecanoe School Corporation and has a public library and a few churches.
Common Questions
What is Per Capita Income in West Point?
Per Capita income in West Point is $51,413.
What is the Median Family Income in West Point?
Median Family Income in West Point is $118,385.
What is the Median Household income in West Point?
Median Household Income in West Point is $117,986.
What is Inequality or Gini Index in West Point?
Inequality or Gini Index in West Point is 0.08.
What is the Total Population of West Point?
Total Population of West Point is 246.
What is the Total Male Population of West Point?
Total Male Population of West Point is 117.
What is the Total Female Population of West Point?
Total Female Population of West Point is 129.
What is the Ratio of Males per 100 Females in West Point?
There are 90.70 Males per 100 Females in West Point.
What is the Ratio of Females per 100 Males in West Point?
There are 110.26 Females per 100 Males in West Point.
What is the Median Population Age in West Point?
Median Population Age in West Point is 43.1 Years.
What is the Average Family Size in West Point
Average Family Size in West Point is 2.2 People.
What is the Average Household Size in West Point
Average Household Size in West Point is 2.1 People.
How Large is the Labor Force in West Point?
There are 192 People in the Labor Forcein in West Point.
What is the Percentage of People in the Labor Force in West Point?
78.0% of People are in the Labor Force in West Point.