Area Code 570 Map & Demographics
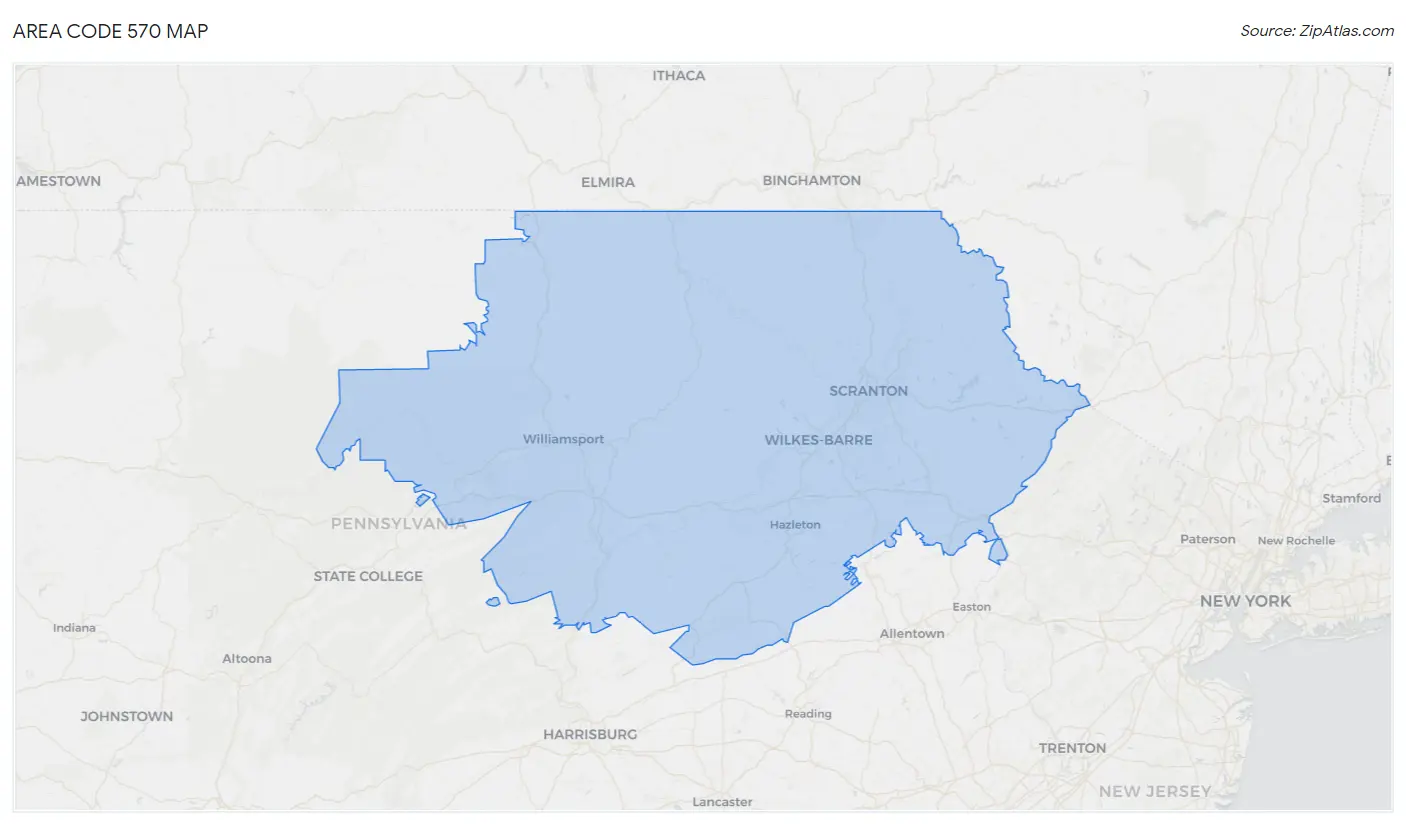
Area Code 570 Map
Area Code 570 Overview
$34,854
PER CAPITA INCOME
$80,626
AVG FAMILY INCOME
$66,539
AVG HOUSEHOLD INCOME
33.7%
WAGE / INCOME GAP [ % ]
66.3¢/ $1
WAGE / INCOME GAP [ $ ]
$10,462
FAMILY INCOME DEFICIT
127.20
INEQUALITY / GINI INDEX
1,505,035
TOTAL POPULATION
754,183
MALE POPULATION
750,852
FEMALE POPULATION
100.44
MALES / 100 FEMALES
99.56
FEMALES / 100 MALES
46.2
MEDIAN AGE
2.9
AVG FAMILY SIZE
2.4
AVG HOUSEHOLD SIZE
723,084
LABOR FORCE [ PEOPLE ]
58.0%
PERCENT IN LABOR FORCE
6.3%
UNEMPLOYMENT RATE
Income in Area Code 570
Income Overview in Area Code 570
Per Capita Income in Area Code 570 is $34,854, while median incomes of families and households are $80,626 and $66,539 respectively.
| Characteristic | Number | Measure |
| Per Capita Income | 1,505,035 | $34,854 |
| Median Family Income | 382,624 | $80,626 |
| Mean Family Income | 382,624 | $29,467,128 |
| Median Household Income | 599,417 | $66,539 |
| Mean Household Income | 599,417 | $25,796,338 |
| Income Deficit | 382,624 | $10,462 |
| Wage / Income Gap (%) | 1,505,035 | 33.72% |
| Wage / Income Gap ($) | 1,505,035 | 66.28¢ per $1 |
| Gini / Inequality Index | 1,505,035 | 127.20 |
Earnings by Sex in Area Code 570
Average Earnings in Area Code 570 are $39,495, $47,876 for men and $32,003 for women, a difference of 33.2%.
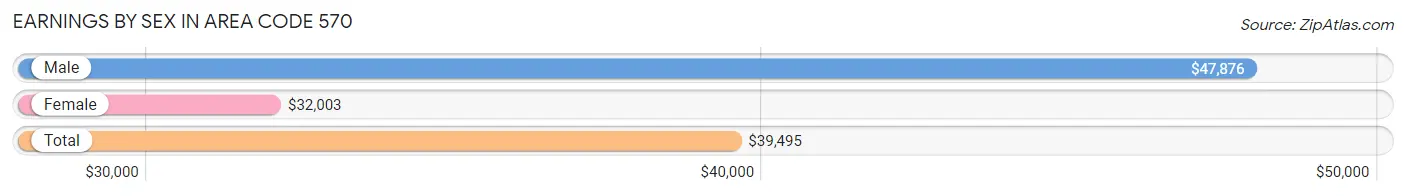
| Sex | Number | Average Earnings |
| Male | 412,226 (53.1%) | $47,876 |
| Female | 364,658 (46.9%) | $32,003 |
| Total | 776,884 (100.0%) | $39,495 |
Earnings by Sex by Income Bracket in Area Code 570
The most common earnings brackets in Area Code 570 are $100,000+ for men (49,745 | 12.1%) and $30,000 to $34,999 for women (27,937 | 7.7%).
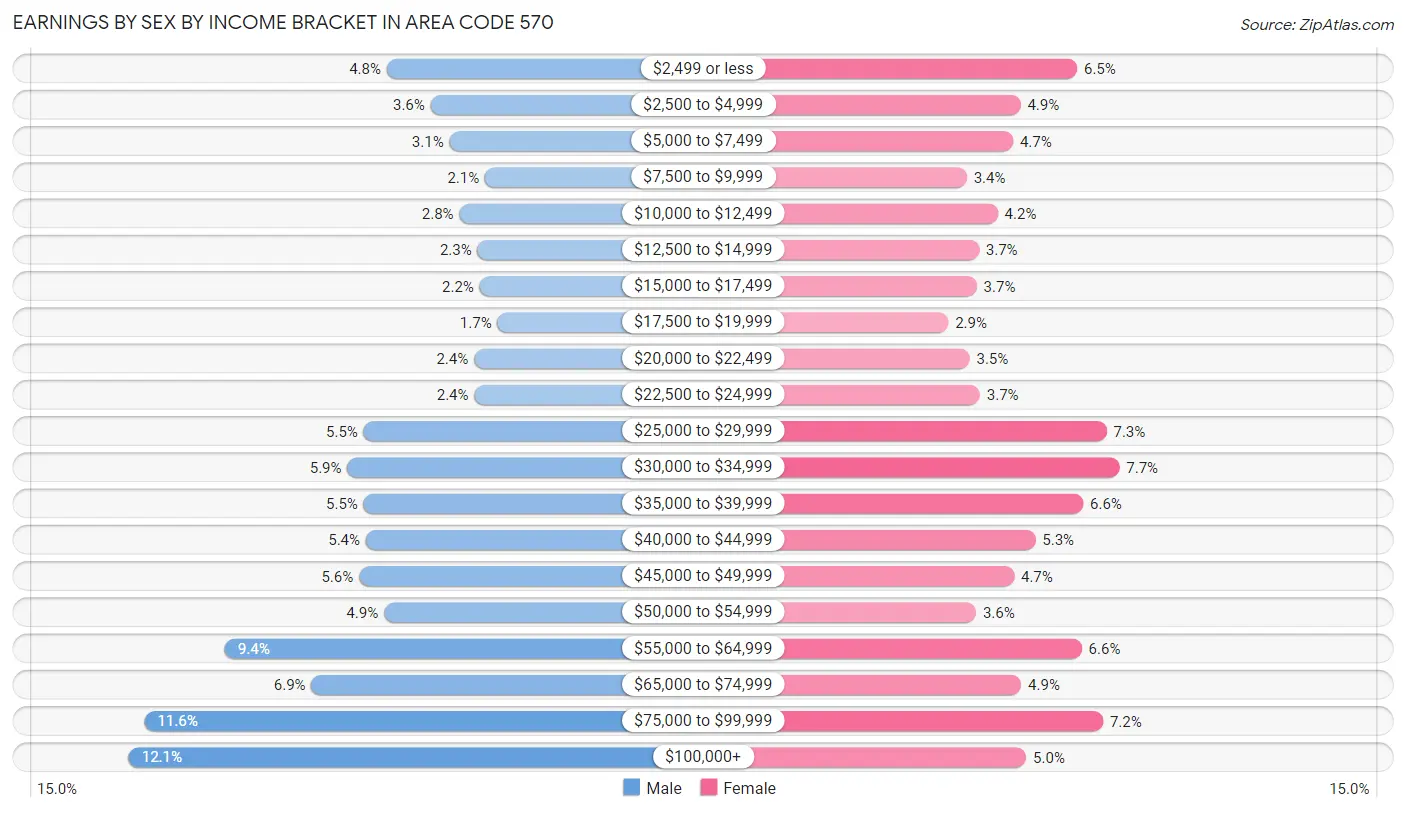
| Income | Male | Female |
| $2,499 or less | 19,854 (4.8%) | 23,594 (6.5%) |
| $2,500 to $4,999 | 14,785 (3.6%) | 17,790 (4.9%) |
| $5,000 to $7,499 | 12,599 (3.1%) | 17,042 (4.7%) |
| $7,500 to $9,999 | 8,472 (2.1%) | 12,273 (3.4%) |
| $10,000 to $12,499 | 11,442 (2.8%) | 15,447 (4.2%) |
| $12,500 to $14,999 | 9,350 (2.3%) | 13,536 (3.7%) |
| $15,000 to $17,499 | 9,125 (2.2%) | 13,299 (3.6%) |
| $17,500 to $19,999 | 7,048 (1.7%) | 10,387 (2.9%) |
| $20,000 to $22,499 | 9,788 (2.4%) | 12,584 (3.5%) |
| $22,500 to $24,999 | 9,737 (2.4%) | 13,652 (3.7%) |
| $25,000 to $29,999 | 22,541 (5.5%) | 26,610 (7.3%) |
| $30,000 to $34,999 | 24,457 (5.9%) | 27,937 (7.7%) |
| $35,000 to $39,999 | 22,537 (5.5%) | 24,214 (6.6%) |
| $40,000 to $44,999 | 22,285 (5.4%) | 19,321 (5.3%) |
| $45,000 to $49,999 | 23,102 (5.6%) | 17,144 (4.7%) |
| $50,000 to $54,999 | 20,204 (4.9%) | 13,247 (3.6%) |
| $55,000 to $64,999 | 38,609 (9.4%) | 24,059 (6.6%) |
| $65,000 to $74,999 | 28,614 (6.9%) | 17,869 (4.9%) |
| $75,000 to $99,999 | 47,932 (11.6%) | 26,263 (7.2%) |
| $100,000+ | 49,745 (12.1%) | 18,390 (5.0%) |
| Total | 412,226 (100.0%) | 364,658 (100.0%) |
Earnings by Sex by Educational Attainment in Area Code 570
Average earnings in Area Code 570 are $15,356,626 for men and $10,022,828 for women, a difference of 34.7%. Men with an educational attainment of bachelor's degree enjoy the highest average annual earnings of $13,676,427, while those with less than high school education earn the least with $6,278,694. Women with an educational attainment of graduate degree earn the most with the average annual earnings of $13,882,831, while those with less than high school education have the smallest earnings of $1,953,257.
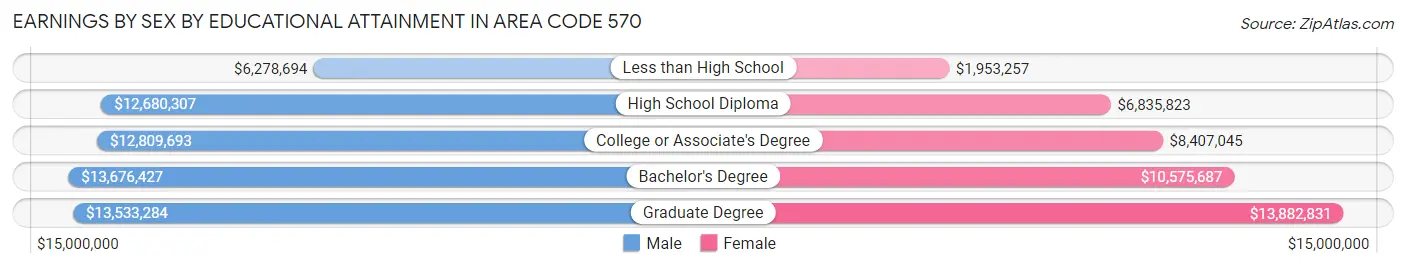
| Educational Attainment | Male Income | Female Income |
| Less than High School | $6,278,694 | $1,953,257 |
| High School Diploma | $12,680,307 | $6,835,823 |
| College or Associate's Degree | $12,809,693 | $8,407,045 |
| Bachelor's Degree | $13,676,427 | $10,575,687 |
| Graduate Degree | $13,533,284 | $13,882,831 |
| Total | $15,356,626 | $10,022,828 |
Family Income in Area Code 570
Family Income Brackets in Area Code 570
According to the Area Code 570 family income data, there are 24,880,126 families falling into the $100,000 to $149,999 income range, which is the most common income bracket and makes up 6,502.5% of all families. Conversely, the $10,000 to $14,999 income bracket is the least frequent group with only 2,022,168 families (528.5%) belonging to this category.
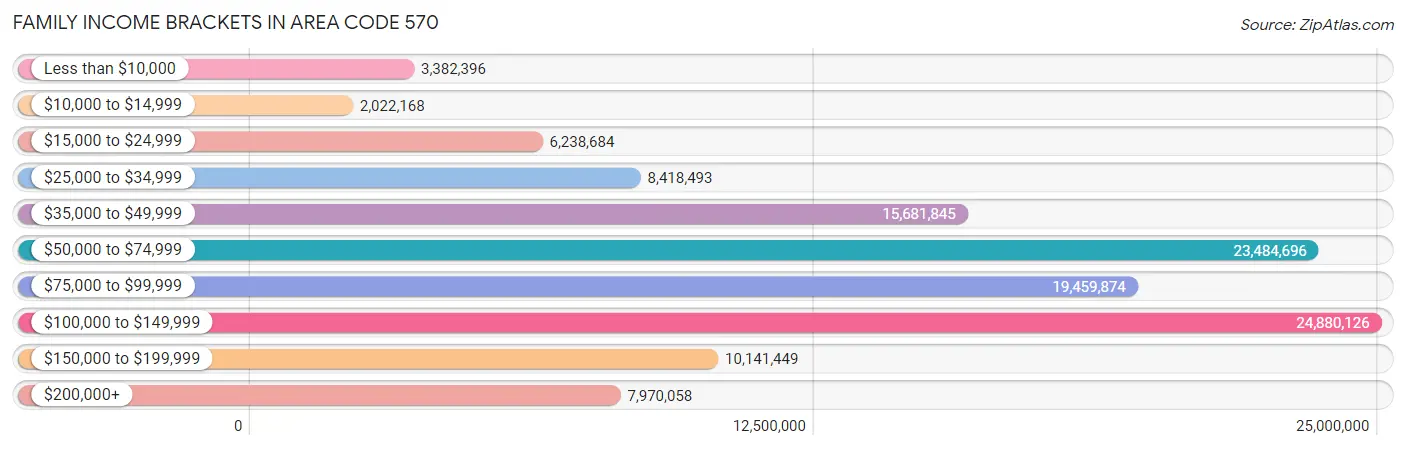
| Income Bracket | # Families | % Families |
| Less than $10,000 | 3,382,396 | 884.0% |
| $10,000 to $14,999 | 2,022,168 | 528.5% |
| $15,000 to $24,999 | 6,238,684 | 1,630.5% |
| $25,000 to $34,999 | 8,418,493 | 2,200.2% |
| $35,000 to $49,999 | 15,681,845 | 4,098.5% |
| $50,000 to $74,999 | 23,484,696 | 6,137.8% |
| $75,000 to $99,999 | 19,459,874 | 5,085.9% |
| $100,000 to $149,999 | 24,880,126 | 6,502.5% |
| $150,000 to $199,999 | 10,141,449 | 2,650.5% |
| $200,000+ | 7,970,058 | 2,083.0% |
Family Income by Famaliy Size in Area Code 570
7+ person families (5,654 | 1.5%) account for the highest median family income in Area Code 570 with $111,963 per family, while 2-person families (199,305 | 52.1%) have the highest median income of $35,175 per family member.
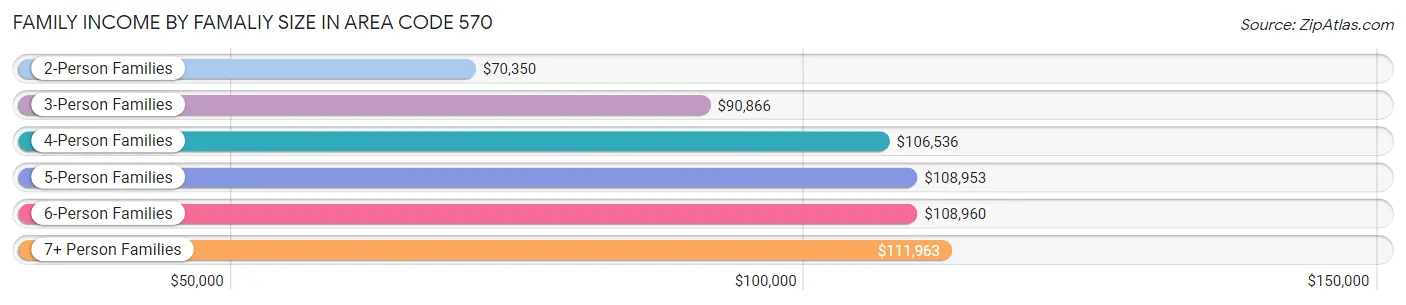
| Income Bracket | # Families | Median Income |
| 2-Person Families | 199,305 (52.1%) | $70,350 |
| 3-Person Families | 85,766 (22.4%) | $90,866 |
| 4-Person Families | 58,099 (15.2%) | $106,536 |
| 5-Person Families | 25,420 (6.6%) | $108,953 |
| 6-Person Families | 8,380 (2.2%) | $108,960 |
| 7+ Person Families | 5,654 (1.5%) | $111,963 |
| Total | 382,624 (100.0%) | $80,626 |
Family Income by Number of Earners in Area Code 570
The median family income in Area Code 570 is $80,626, with families comprising 3+ earners (44,412) having the highest median family income of $138,014, while families with no earners (69,936) have the lowest median family income of $48,244, accounting for 11.6% and 18.3% of families, respectively.
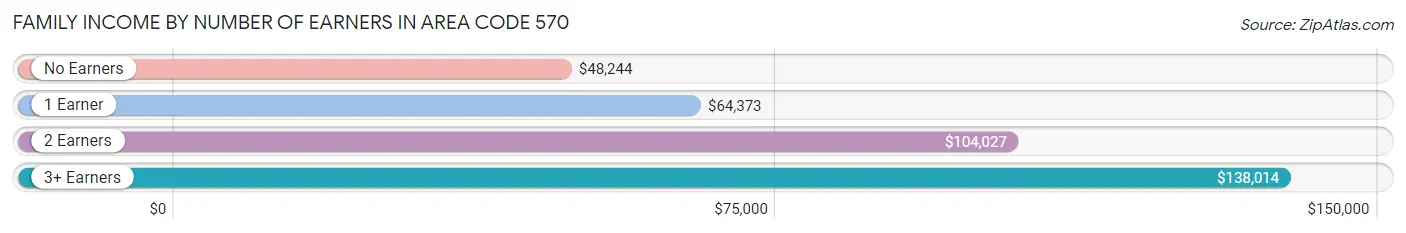
| Number of Earners | # Families | Median Income |
| No Earners | 69,936 (18.3%) | $48,244 |
| 1 Earner | 122,222 (31.9%) | $64,373 |
| 2 Earners | 146,054 (38.2%) | $104,027 |
| 3+ Earners | 44,412 (11.6%) | $138,014 |
| Total | 382,624 (100.0%) | $80,626 |
Household Income in Area Code 570
Household Income Brackets in Area Code 570
With 35,803,777 households falling in the category, the $50,000 to $74,999 income range is the most frequent in Area Code 570, accounting for 5,973.1% of all households. In contrast, only 7,353,048 households (1,226.7%) fall into the less than $10,000 income bracket, making it the least populous group.
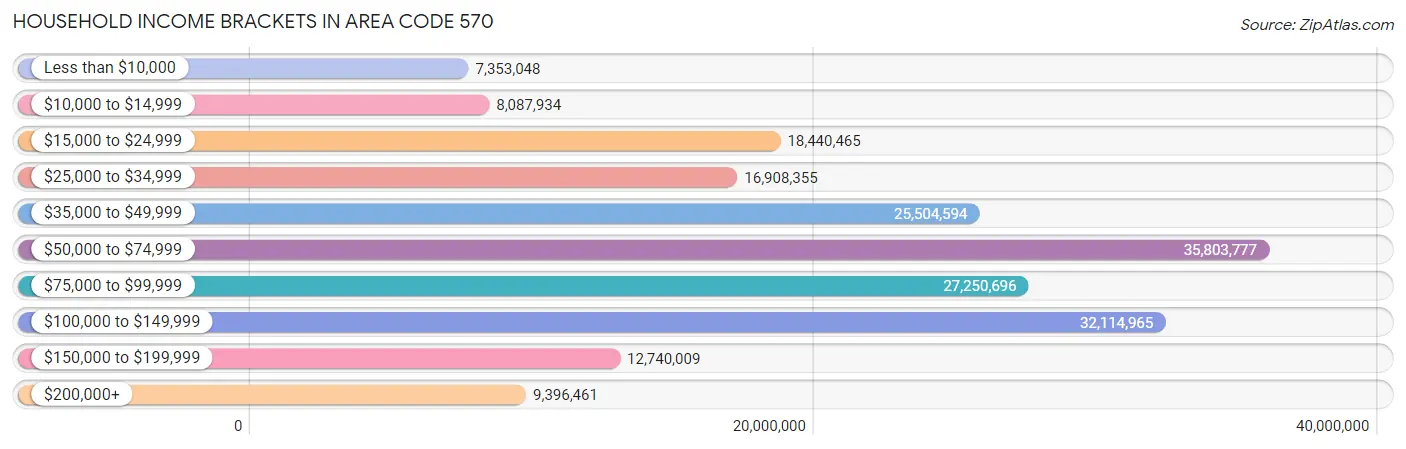
| Income Bracket | # Households | % Households |
| Less than $10,000 | 7,353,048 | 1,226.7% |
| $10,000 to $14,999 | 8,087,934 | 1,349.3% |
| $15,000 to $24,999 | 18,440,465 | 3,076.4% |
| $25,000 to $34,999 | 16,908,355 | 2,820.8% |
| $35,000 to $49,999 | 25,504,594 | 4,254.9% |
| $50,000 to $74,999 | 35,803,777 | 5,973.1% |
| $75,000 to $99,999 | 27,250,696 | 4,546.2% |
| $100,000 to $149,999 | 32,114,965 | 5,357.7% |
| $150,000 to $199,999 | 12,740,009 | 2,125.4% |
| $200,000+ | 9,396,461 | 1,567.6% |
Household Income by Householder Age in Area Code 570
The median household income in Area Code 570 is $66,539, with the highest median household income of $81,309 found in the 45 to 64 years age bracket for the primary householder. A total of 232,597 households (38.8%) fall into this category. Meanwhile, the 65+ years age bracket for the primary householder has the lowest median household income of $49,166, with 192,941 households (32.2%) in this group.
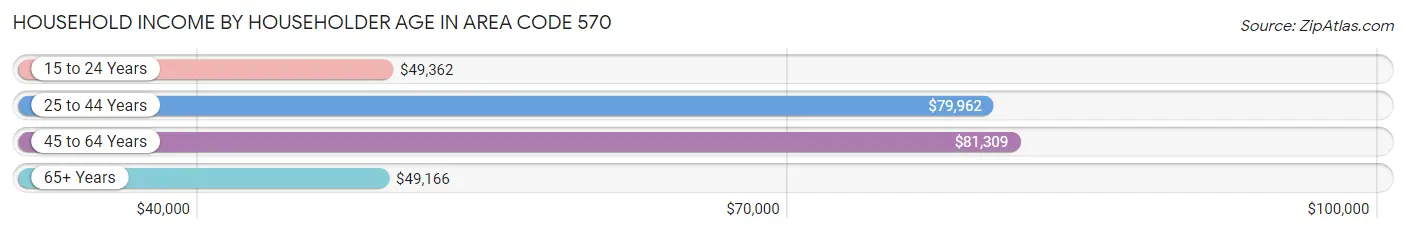
| Income Bracket | # Households | Median Income |
| 15 to 24 Years | 15,996 (2.7%) | $49,362 |
| 25 to 44 Years | 157,883 (26.3%) | $79,962 |
| 45 to 64 Years | 232,597 (38.8%) | $81,309 |
| 65+ Years | 192,941 (32.2%) | $49,166 |
| Total | 599,417 (100.0%) | $66,539 |
Poverty in Area Code 570
Income Below Poverty by Sex and Age in Area Code 570
With 11.3% poverty level for males and 14.0% for females among the residents of Area Code 570, 6 to 11 year old males and under 5 year old females are the most vulnerable to poverty, with 9,538 males (19.4%) and 8,263 females (23.1%) in their respective age groups living below the poverty level.
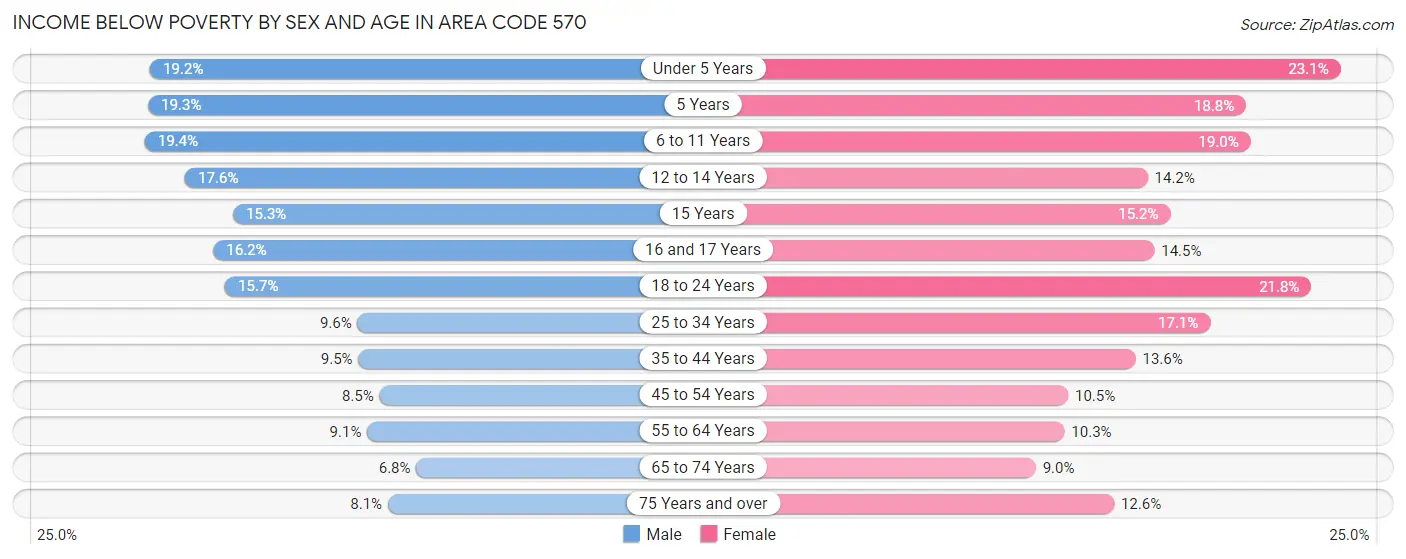
| Age Bracket | Male | Female |
| Under 5 Years | 7,092 (19.2%) | 8,263 (23.1%) |
| 5 Years | 1,674 (19.3%) | 1,246 (18.8%) |
| 6 to 11 Years | 9,538 (19.4%) | 9,053 (19.0%) |
| 12 to 14 Years | 4,527 (17.5%) | 3,438 (14.2%) |
| 15 Years | 1,312 (15.3%) | 1,269 (15.2%) |
| 16 and 17 Years | 3,186 (16.2%) | 2,620 (14.5%) |
| 18 to 24 Years | 9,173 (15.7%) | 12,077 (21.8%) |
| 25 to 34 Years | 8,439 (9.6%) | 14,062 (17.1%) |
| 35 to 44 Years | 7,925 (9.5%) | 11,256 (13.6%) |
| 45 to 54 Years | 8,106 (8.5%) | 9,744 (10.5%) |
| 55 to 64 Years | 9,884 (9.1%) | 11,311 (10.3%) |
| 65 to 74 Years | 5,819 (6.8%) | 8,194 (9.0%) |
| 75 Years and over | 4,155 (8.1%) | 8,985 (12.6%) |
| Total | 80,830 (11.3%) | 101,518 (14.0%) |
Income Above Poverty by Sex and Age in Area Code 570
According to the poverty statistics in Area Code 570, males aged 65 to 74 years and females aged 65 to 74 years are the age groups that are most secure financially, with 93.2% of males and 91.0% of females in these age groups living above the poverty line.
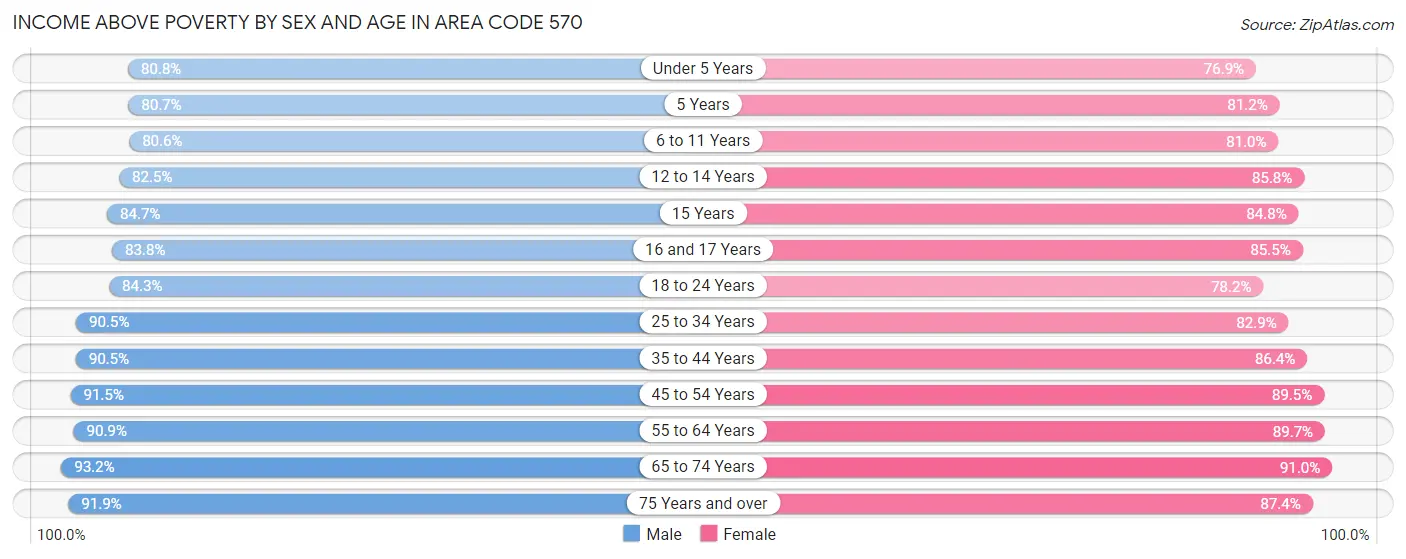
| Age Bracket | Male | Female |
| Under 5 Years | 29,892 (80.8%) | 27,449 (76.9%) |
| 5 Years | 7,013 (80.7%) | 5,397 (81.2%) |
| 6 to 11 Years | 39,571 (80.6%) | 38,661 (81.0%) |
| 12 to 14 Years | 21,275 (82.5%) | 20,785 (85.8%) |
| 15 Years | 7,246 (84.7%) | 7,056 (84.8%) |
| 16 and 17 Years | 16,438 (83.8%) | 15,449 (85.5%) |
| 18 to 24 Years | 49,236 (84.3%) | 43,365 (78.2%) |
| 25 to 34 Years | 79,942 (90.4%) | 68,209 (82.9%) |
| 35 to 44 Years | 75,379 (90.5%) | 71,329 (86.4%) |
| 45 to 54 Years | 86,897 (91.5%) | 83,056 (89.5%) |
| 55 to 64 Years | 98,731 (90.9%) | 98,169 (89.7%) |
| 65 to 74 Years | 79,467 (93.2%) | 82,834 (91.0%) |
| 75 Years and over | 46,874 (91.9%) | 62,177 (87.4%) |
| Total | 637,961 (88.7%) | 623,936 (86.0%) |
Income Below Poverty Among Married-Couple Families in Area Code 570
The poverty statistics for married-couple families in Area Code 570 show that 3.8% or 10,660 of the total 280,156 families live below the poverty line. Families with 5 or more children have the highest poverty rate of 18.9%, comprising of 446 families. On the other hand, families with no children have the lowest poverty rate of 3.1%, which includes 5,740 families.
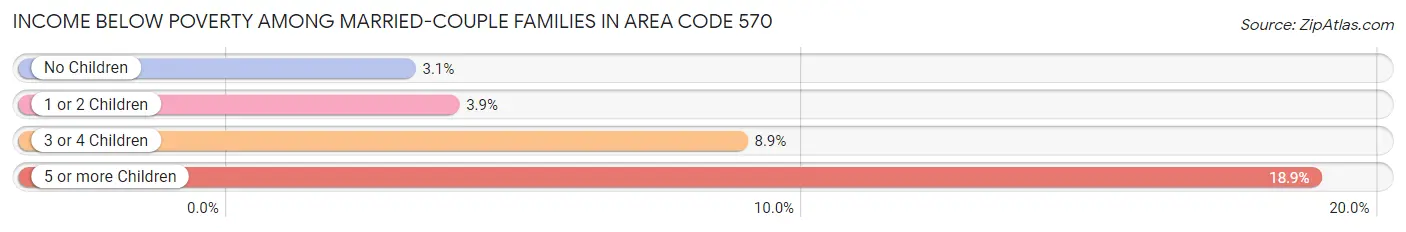
| Children | Above Poverty | Below Poverty |
| No Children | 180,205 (96.9%) | 5,740 (3.1%) |
| 1 or 2 Children | 70,382 (96.2%) | 2,821 (3.8%) |
| 3 or 4 Children | 16,990 (91.1%) | 1,653 (8.9%) |
| 5 or more Children | 1,919 (81.1%) | 446 (18.9%) |
| Total | 269,496 (96.2%) | 10,660 (3.8%) |
Income Below Poverty Among Single-Parent Households in Area Code 570
According to the poverty data in Area Code 570, 14.8% or 4,991 single-father households and 26.5% or 18,230 single-mother households are living below the poverty line. Among single-father households, those with 5 or more children have the highest poverty rate, with 101 households (36.3%) experiencing poverty. Likewise, among single-mother households, those with 5 or more children have the highest poverty rate, with 522 households (68.6%) falling below the poverty line.
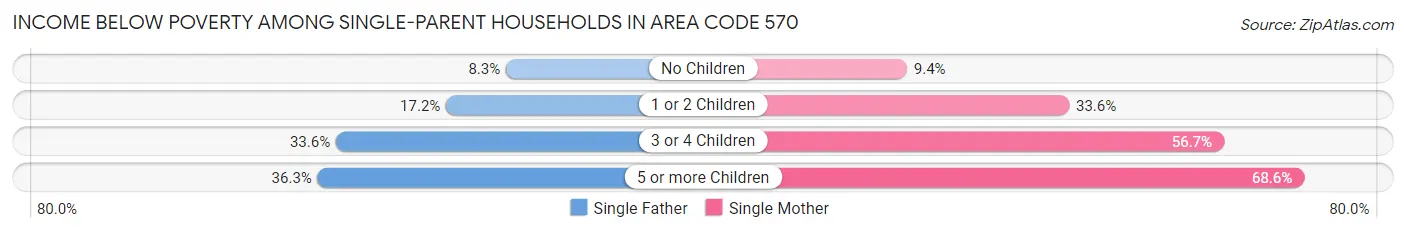
| Children | Single Father | Single Mother |
| No Children | 1,193 (8.3%) | 2,542 (9.4%) |
| 1 or 2 Children | 2,824 (17.2%) | 11,687 (33.6%) |
| 3 or 4 Children | 873 (33.6%) | 3,479 (56.7%) |
| 5 or more Children | 101 (36.3%) | 522 (68.6%) |
| Total | 4,991 (14.8%) | 18,230 (26.5%) |
Income Below Poverty Among Married-Couple vs Single-Parent Households in Area Code 570
The poverty data for Area Code 570 shows that 10,660 of the married-couple family households (3.8%) and 23,221 of the single-parent households (22.7%) are living below the poverty level. Within the married-couple family households, those with 5 or more children have the highest poverty rate, with 446 households (18.9%) falling below the poverty line. Among the single-parent households, those with 5 or more children have the highest poverty rate, with 623 household (60.0%) living below poverty.
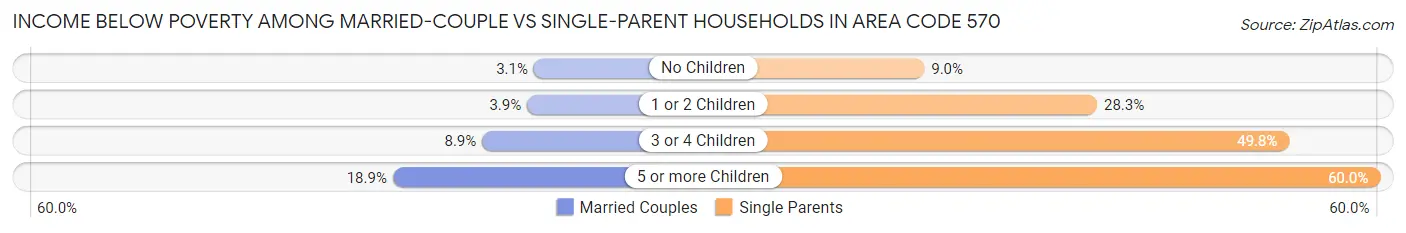
| Children | Married-Couple Families | Single-Parent Households |
| No Children | 5,740 (3.1%) | 3,735 (9.0%) |
| 1 or 2 Children | 2,821 (3.8%) | 14,511 (28.3%) |
| 3 or 4 Children | 1,653 (8.9%) | 4,352 (49.8%) |
| 5 or more Children | 446 (18.9%) | 623 (60.0%) |
| Total | 10,660 (3.8%) | 23,221 (22.7%) |
Race in Area Code 570
The most populous races in Area Code 570 are White / Caucasian (1,304,539 | 86.7%), Hispanic or Latino (126,435 | 8.4%), and Two or more Races (74,739 | 5.0%).
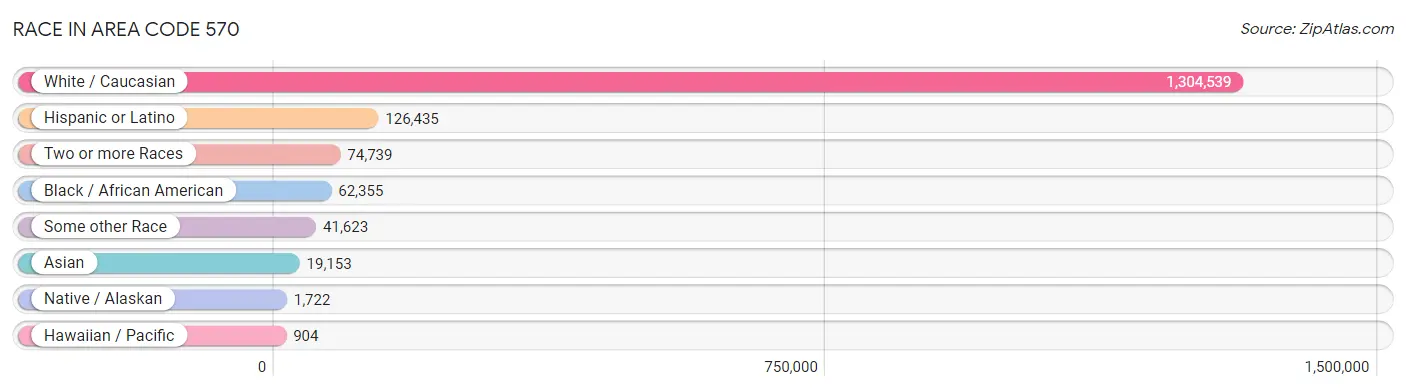
| Race | # Population | % Population |
| Asian | 19,153 | 1.3% |
| Black / African American | 62,355 | 4.1% |
| Hawaiian / Pacific | 904 | 0.1% |
| Hispanic or Latino | 126,435 | 8.4% |
| Native / Alaskan | 1,722 | 0.1% |
| White / Caucasian | 1,304,539 | 86.7% |
| Two or more Races | 74,739 | 5.0% |
| Some other Race | 41,623 | 2.8% |
| Total | 1,505,035 | 100.0% |
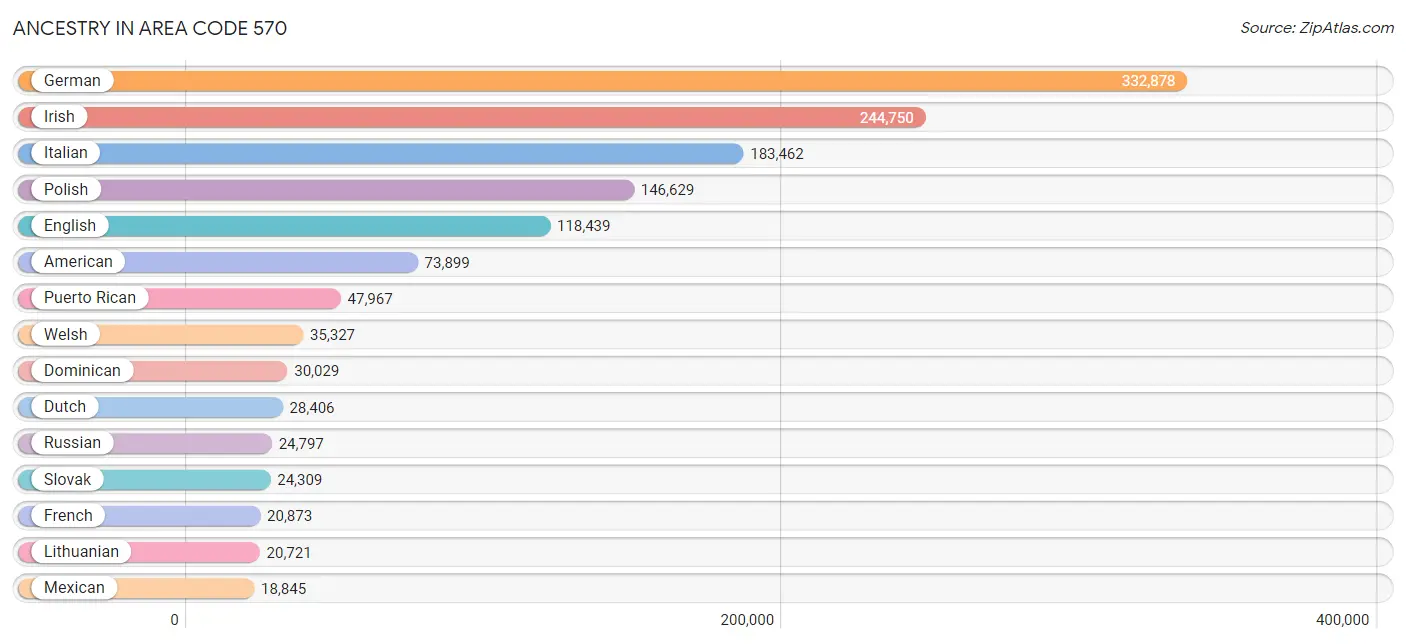
Ancestry in Area Code 570
The most populous ancestries reported in Area Code 570 are German (332,878 | 22.1%), Irish (244,750 | 16.3%), Italian (183,462 | 12.2%), Polish (146,629 | 9.7%), and English (118,439 | 7.9%), together accounting for 68.2% of all Area Code 570 residents.
| Ancestry | # Population | % Population |
| Afghan | 83 | 0.0% |
| African | 3,869 | 0.3% |
| Alaska Native | 7 | 0.0% |
| Alaskan Athabascan | 2 | 0.0% |
| Albanian | 345 | 0.0% |
| Aleut | 5 | 0.0% |
| Alsatian | 36 | 0.0% |
| American | 73,899 | 4.9% |
| Apache | 67 | 0.0% |
| Arab | 6,023 | 0.4% |
| Argentinean | 446 | 0.0% |
| Armenian | 447 | 0.0% |
| Assyrian / Chaldean / Syriac | 23 | 0.0% |
| Australian | 296 | 0.0% |
| Austrian | 5,738 | 0.4% |
| Bahamian | 48 | 0.0% |
| Bangladeshi | 297 | 0.0% |
| Barbadian | 77 | 0.0% |
| Basque | 101 | 0.0% |
| Belgian | 787 | 0.1% |
| Belizean | 250 | 0.0% |
| Bermudan | 45 | 0.0% |
| Bhutanese | 1,303 | 0.1% |
| Blackfeet | 725 | 0.1% |
| Bolivian | 174 | 0.0% |
| Brazilian | 845 | 0.1% |
| British | 4,403 | 0.3% |
| British West Indian | 340 | 0.0% |
| Bulgarian | 368 | 0.0% |
| Burmese | 2,945 | 0.2% |
| Cajun | 12 | 0.0% |
| Cambodian | 39 | 0.0% |
| Canadian | 1,009 | 0.1% |
| Cape Verdean | 39 | 0.0% |
| Carpatho Rusyn | 369 | 0.0% |
| Celtic | 52 | 0.0% |
| Central American | 7,457 | 0.5% |
| Central American Indian | 985 | 0.1% |
| Cherokee | 2,070 | 0.1% |
| Cheyenne | 19 | 0.0% |
| Chickasaw | 68 | 0.0% |
| Chilean | 579 | 0.0% |
| Chinese | 7 | 0.0% |
| Chippewa | 64 | 0.0% |
| Choctaw | 78 | 0.0% |
| Colombian | 2,820 | 0.2% |
| Comanche | 11 | 0.0% |
| Costa Rican | 204 | 0.0% |
| Cree | 4 | 0.0% |
| Creek | 22 | 0.0% |
| Croatian | 885 | 0.1% |
| Crow | 58 | 0.0% |
| Cuban | 2,479 | 0.2% |
| Cypriot | 101 | 0.0% |
| Czech | 3,725 | 0.3% |
| Czechoslovakian | 2,735 | 0.2% |
| Danish | 1,466 | 0.1% |
| Delaware | 311 | 0.0% |
| Dominican | 30,029 | 2.0% |
| Dutch | 28,406 | 1.9% |
| Dutch West Indian | 36 | 0.0% |
| Eastern European | 5,324 | 0.4% |
| Ecuadorian | 3,928 | 0.3% |
| Egyptian | 532 | 0.0% |
| English | 118,439 | 7.9% |
| Estonian | 88 | 0.0% |
| Ethiopian | 337 | 0.0% |
| European | 12,026 | 0.8% |
| Filipino | 132 | 0.0% |
| Finnish | 822 | 0.1% |
| French | 20,873 | 1.4% |
| French American Indian | 23 | 0.0% |
| French Canadian | 2,652 | 0.2% |
| German | 332,878 | 22.1% |
| German Russian | 39 | 0.0% |
| Ghanaian | 259 | 0.0% |
| Greek | 6,347 | 0.4% |
| Guamanian / Chamorro | 162 | 0.0% |
| Guatemalan | 1,513 | 0.1% |
| Guyanese | 777 | 0.1% |
| Haitian | 1,250 | 0.1% |
| Honduran | 2,653 | 0.2% |
| Hopi | 5 | 0.0% |
| Hungarian | 7,679 | 0.5% |
| Icelander | 120 | 0.0% |
| Indian (Asian) | 4,082 | 0.3% |
| Indonesian | 58 | 0.0% |
| Inupiat | 21 | 0.0% |
| Iranian | 432 | 0.0% |
| Iraqi | 243 | 0.0% |
| Irish | 244,750 | 16.3% |
| Iroquois | 534 | 0.0% |
| Israeli | 268 | 0.0% |
| Italian | 183,462 | 12.2% |
| Jamaican | 3,105 | 0.2% |
| Japanese | 230 | 0.0% |
| Jordanian | 86 | 0.0% |
| Kenyan | 144 | 0.0% |
| Korean | 4,346 | 0.3% |
| Laotian | 199 | 0.0% |
| Latvian | 286 | 0.0% |
| Lebanese | 3,304 | 0.2% |
| Liberian | 86 | 0.0% |
| Lithuanian | 20,721 | 1.4% |
| Lumbee | 25 | 0.0% |
| Luxembourger | 57 | 0.0% |
| Macedonian | 141 | 0.0% |
| Malaysian | 133 | 0.0% |
| Maltese | 178 | 0.0% |
| Mexican | 18,845 | 1.3% |
| Mexican American Indian | 319 | 0.0% |
| Mongolian | 48 | 0.0% |
| Moroccan | 333 | 0.0% |
| Native Hawaiian | 498 | 0.0% |
| Navajo | 48 | 0.0% |
| New Zealander | 24 | 0.0% |
| Nicaraguan | 462 | 0.0% |
| Nigerian | 261 | 0.0% |
| Northern European | 969 | 0.1% |
| Norwegian | 5,038 | 0.3% |
| Okinawan | 10 | 0.0% |
| Osage | 25 | 0.0% |
| Ottawa | 10 | 0.0% |
| Pakistani | 496 | 0.0% |
| Palestinian | 27 | 0.0% |
| Panamanian | 395 | 0.0% |
| Paraguayan | 1 | 0.0% |
| Pennsylvania German | 18,383 | 1.2% |
| Peruvian | 1,663 | 0.1% |
| Polish | 146,629 | 9.7% |
| Portuguese | 3,649 | 0.2% |
| Potawatomi | 10 | 0.0% |
| Puerto Rican | 47,967 | 3.2% |
| Romanian | 1,215 | 0.1% |
| Russian | 24,797 | 1.7% |
| Salvadoran | 2,061 | 0.1% |
| Samoan | 160 | 0.0% |
| Scandinavian | 1,831 | 0.1% |
| Scotch-Irish | 7,117 | 0.5% |
| Scottish | 17,612 | 1.2% |
| Seminole | 81 | 0.0% |
| Senegalese | 3 | 0.0% |
| Serbian | 404 | 0.0% |
| Shoshone | 38 | 0.0% |
| Sierra Leonean | 8 | 0.0% |
| Sioux | 483 | 0.0% |
| Slavic | 1,315 | 0.1% |
| Slovak | 24,309 | 1.6% |
| Slovene | 687 | 0.1% |
| South African | 89 | 0.0% |
| South American | 10,481 | 0.7% |
| South American Indian | 198 | 0.0% |
| Soviet Union | 38 | 0.0% |
| Spaniard | 2,105 | 0.1% |
| Spanish | 1,147 | 0.1% |
| Spanish American | 192 | 0.0% |
| Spanish American Indian | 13 | 0.0% |
| Sri Lankan | 1,627 | 0.1% |
| Subsaharan African | 5,692 | 0.4% |
| Swedish | 7,890 | 0.5% |
| Swiss | 5,353 | 0.4% |
| Syrian | 1,125 | 0.1% |
| Thai | 7,131 | 0.5% |
| Tongan | 1 | 0.0% |
| Trinidadian and Tobagonian | 844 | 0.1% |
| Turkish | 737 | 0.1% |
| Ugandan | 1 | 0.0% |
| Ukrainian | 12,837 | 0.9% |
| Uruguayan | 199 | 0.0% |
| Venezuelan | 671 | 0.0% |
| Vietnamese | 125 | 0.0% |
| Welsh | 35,327 | 2.4% |
| West Indian | 1,512 | 0.1% |
| Yugoslavian | 740 | 0.1% |
| Zimbabwean | 3 | 0.0% | View All 175 Rows |
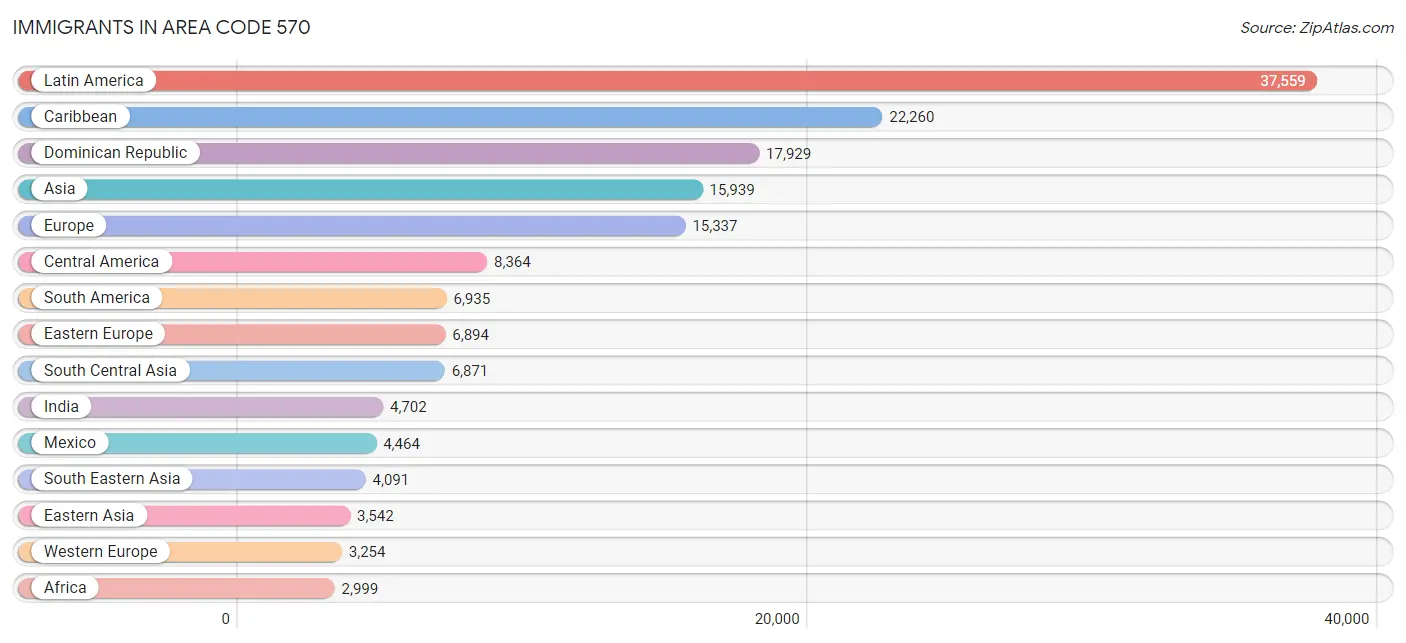
Immigrants in Area Code 570
The most numerous immigrant groups reported in Area Code 570 came from Latin America (37,559 | 2.5%), Caribbean (22,260 | 1.5%), Dominican Republic (17,929 | 1.2%), Asia (15,939 | 1.1%), and Europe (15,337 | 1.0%), together accounting for 7.3% of all Area Code 570 residents.
| Immigration Origin | # Population | % Population |
| Afghanistan | 152 | 0.0% |
| Africa | 2,999 | 0.2% |
| Albania | 75 | 0.0% |
| Argentina | 242 | 0.0% |
| Asia | 15,939 | 1.1% |
| Australia | 285 | 0.0% |
| Austria | 200 | 0.0% |
| Azores | 34 | 0.0% |
| Bahamas | 50 | 0.0% |
| Bangladesh | 116 | 0.0% |
| Barbados | 45 | 0.0% |
| Belarus | 114 | 0.0% |
| Belgium | 36 | 0.0% |
| Belize | 141 | 0.0% |
| Bolivia | 167 | 0.0% |
| Bosnia and Herzegovina | 61 | 0.0% |
| Brazil | 818 | 0.1% |
| Bulgaria | 304 | 0.0% |
| Cabo Verde | 21 | 0.0% |
| Cambodia | 161 | 0.0% |
| Cameroon | 6 | 0.0% |
| Canada | 1,521 | 0.1% |
| Caribbean | 22,260 | 1.5% |
| Central America | 8,364 | 0.6% |
| Chile | 121 | 0.0% |
| China | 1,811 | 0.1% |
| Colombia | 1,466 | 0.1% |
| Costa Rica | 128 | 0.0% |
| Croatia | 68 | 0.0% |
| Cuba | 382 | 0.0% |
| Czechoslovakia | 202 | 0.0% |
| Denmark | 85 | 0.0% |
| Dominica | 506 | 0.0% |
| Dominican Republic | 17,929 | 1.2% |
| Eastern Africa | 722 | 0.1% |
| Eastern Asia | 3,542 | 0.2% |
| Eastern Europe | 6,894 | 0.5% |
| Ecuador | 2,062 | 0.1% |
| Egypt | 209 | 0.0% |
| El Salvador | 917 | 0.1% |
| England | 873 | 0.1% |
| Ethiopia | 206 | 0.0% |
| Europe | 15,337 | 1.0% |
| France | 259 | 0.0% |
| Germany | 2,501 | 0.2% |
| Ghana | 461 | 0.0% |
| Greece | 444 | 0.0% |
| Grenada | 200 | 0.0% |
| Guatemala | 828 | 0.1% |
| Guyana | 964 | 0.1% |
| Haiti | 595 | 0.0% |
| Honduras | 1,148 | 0.1% |
| Hong Kong | 76 | 0.0% |
| Hungary | 271 | 0.0% |
| India | 4,702 | 0.3% |
| Indonesia | 189 | 0.0% |
| Iran | 267 | 0.0% |
| Iraq | 188 | 0.0% |
| Ireland | 369 | 0.0% |
| Israel | 103 | 0.0% |
| Italy | 1,522 | 0.1% |
| Jamaica | 1,486 | 0.1% |
| Japan | 327 | 0.0% |
| Jordan | 75 | 0.0% |
| Kazakhstan | 44 | 0.0% |
| Kenya | 141 | 0.0% |
| Korea | 1,380 | 0.1% |
| Kuwait | 6 | 0.0% |
| Laos | 233 | 0.0% |
| Latin America | 37,559 | 2.5% |
| Latvia | 34 | 0.0% |
| Lebanon | 119 | 0.0% |
| Liberia | 107 | 0.0% |
| Lithuania | 53 | 0.0% |
| Malaysia | 22 | 0.0% |
| Mexico | 4,464 | 0.3% |
| Micronesia | 50 | 0.0% |
| Middle Africa | 143 | 0.0% |
| Moldova | 55 | 0.0% |
| Morocco | 194 | 0.0% |
| Nepal | 332 | 0.0% |
| Netherlands | 229 | 0.0% |
| Nicaragua | 367 | 0.0% |
| Nigeria | 249 | 0.0% |
| North Macedonia | 20 | 0.0% |
| Northern Africa | 506 | 0.0% |
| Northern Europe | 2,457 | 0.2% |
| Norway | 61 | 0.0% |
| Oceania | 501 | 0.0% |
| Pakistan | 763 | 0.1% |
| Panama | 371 | 0.0% |
| Peru | 504 | 0.0% |
| Philippines | 2,211 | 0.2% |
| Poland | 2,629 | 0.2% |
| Portugal | 418 | 0.0% |
| Romania | 349 | 0.0% |
| Russia | 1,244 | 0.1% |
| Saudi Arabia | 24 | 0.0% |
| Scotland | 290 | 0.0% |
| Senegal | 39 | 0.0% |
| Serbia | 166 | 0.0% |
| Sierra Leone | 23 | 0.0% |
| Singapore | 16 | 0.0% |
| South Africa | 97 | 0.0% |
| South America | 6,935 | 0.5% |
| South Central Asia | 6,871 | 0.5% |
| South Eastern Asia | 4,091 | 0.3% |
| Southern Europe | 2,724 | 0.2% |
| Spain | 337 | 0.0% |
| Sri Lanka | 33 | 0.0% |
| St. Vincent and the Grenadines | 292 | 0.0% |
| Sudan | 32 | 0.0% |
| Sweden | 41 | 0.0% |
| Switzerland | 29 | 0.0% |
| Syria | 142 | 0.0% |
| Taiwan | 121 | 0.0% |
| Thailand | 241 | 0.0% |
| Trinidad and Tobago | 456 | 0.0% |
| Turkey | 565 | 0.0% |
| Uganda | 59 | 0.0% |
| Ukraine | 871 | 0.1% |
| Uruguay | 97 | 0.0% |
| Uzbekistan | 13 | 0.0% |
| Venezuela | 473 | 0.0% |
| Vietnam | 963 | 0.1% |
| West Indies | 124 | 0.0% |
| Western Africa | 1,135 | 0.1% |
| Western Asia | 1,419 | 0.1% |
| Western Europe | 3,254 | 0.2% |
| Zaire | 98 | 0.0% |
| Zimbabwe | 16 | 0.0% | View All 131 Rows |
Sex and Age in Area Code 570
Sex and Age in Area Code 570
The most populous age groups in Area Code 570 are 60 to 64 Years (56,010 | 7.4%) for men and 55 to 59 Years (55,465 | 7.4%) for women.
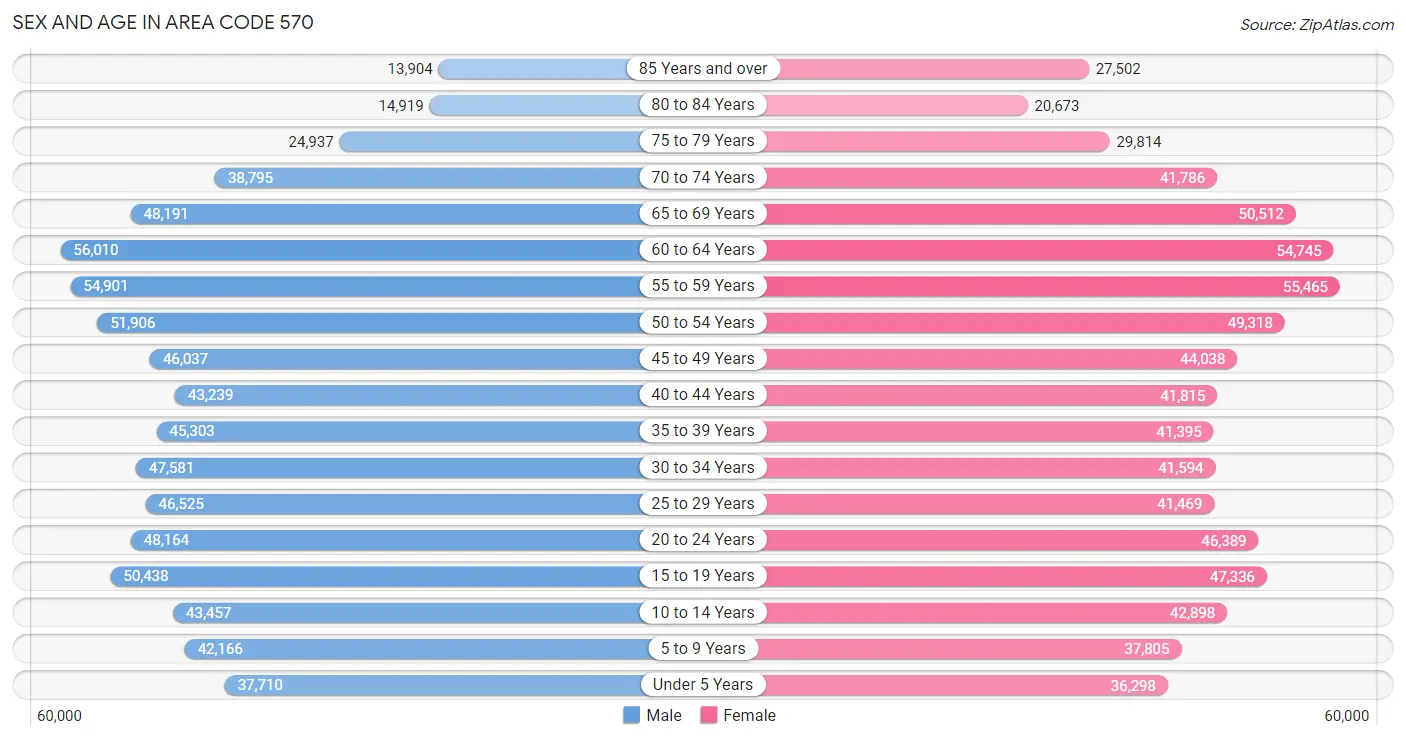
| Age Bracket | Male | Female |
| Under 5 Years | 37,710 (5.0%) | 36,298 (4.8%) |
| 5 to 9 Years | 42,166 (5.6%) | 37,805 (5.0%) |
| 10 to 14 Years | 43,457 (5.8%) | 42,898 (5.7%) |
| 15 to 19 Years | 50,438 (6.7%) | 47,336 (6.3%) |
| 20 to 24 Years | 48,164 (6.4%) | 46,389 (6.2%) |
| 25 to 29 Years | 46,525 (6.2%) | 41,469 (5.5%) |
| 30 to 34 Years | 47,581 (6.3%) | 41,594 (5.5%) |
| 35 to 39 Years | 45,303 (6.0%) | 41,395 (5.5%) |
| 40 to 44 Years | 43,239 (5.7%) | 41,815 (5.6%) |
| 45 to 49 Years | 46,037 (6.1%) | 44,038 (5.9%) |
| 50 to 54 Years | 51,906 (6.9%) | 49,318 (6.6%) |
| 55 to 59 Years | 54,901 (7.3%) | 55,465 (7.4%) |
| 60 to 64 Years | 56,010 (7.4%) | 54,745 (7.3%) |
| 65 to 69 Years | 48,191 (6.4%) | 50,512 (6.7%) |
| 70 to 74 Years | 38,795 (5.1%) | 41,786 (5.6%) |
| 75 to 79 Years | 24,937 (3.3%) | 29,814 (4.0%) |
| 80 to 84 Years | 14,919 (2.0%) | 20,673 (2.8%) |
| 85 Years and over | 13,904 (1.8%) | 27,502 (3.7%) |
| Total | 754,183 (100.0%) | 750,852 (100.0%) |
Families and Households in Area Code 570
Median Family Size in Area Code 570
The median family size in Area Code 570 is 2.92 persons per family, with single female/mother families (68,721 | 18.0%) accounting for the largest median family size of 2.9516 persons per family. On the other hand, single male/father families (33,747 | 8.8%) represent the smallest median family size with 2.80 persons per family.
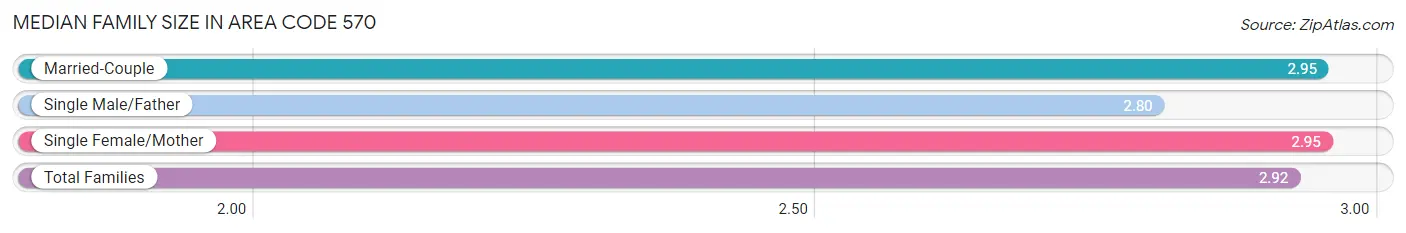
| Family Type | # Families | Family Size |
| Married-Couple | 280,156 (73.2%) | 2.95 |
| Single Male/Father | 33,747 (8.8%) | 2.80 |
| Single Female/Mother | 68,721 (18.0%) | 2.95 |
| Total Families | 382,624 (100.0%) | 2.92 |
Median Household Size in Area Code 570
The median household size in Area Code 570 is 2.39 persons per household, with single male/father households (33,747 | 5.6%) accounting for the largest median household size of 3.22959 persons per household. non-family households (216,793 | 36.2%) represent the smallest median household size with 1.23 persons per household.
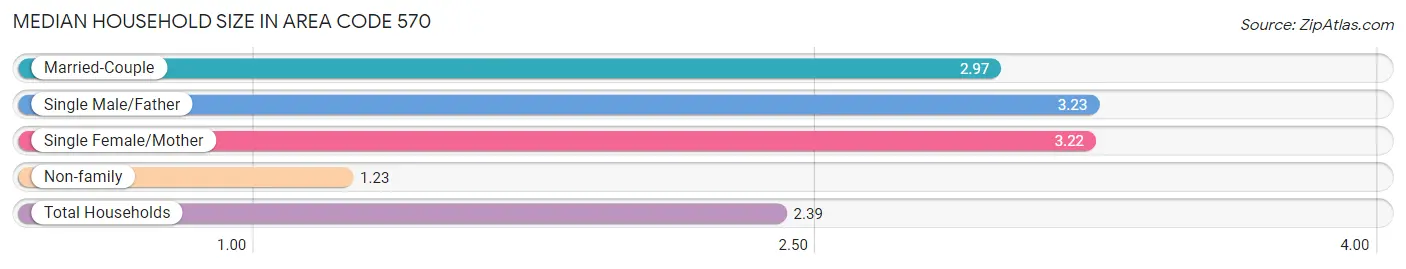
| Household Type | # Households | Household Size |
| Married-Couple | 280,156 (46.7%) | 2.97 |
| Single Male/Father | 33,747 (5.6%) | 3.23 |
| Single Female/Mother | 68,721 (11.5%) | 3.22 |
| Non-family | 216,793 (36.2%) | 1.23 |
| Total Households | 599,417 (100.0%) | 2.39 |
Household Size by Marriage Status in Area Code 570
Out of a total of 599,417 households in Area Code 570, 382,624 (63.8%) are family households, while 216,793 (36.2%) are nonfamily households. The most numerous type of family households are 2-person households, comprising 184,825, and the most common type of nonfamily households are 1-person households, comprising 179,085.
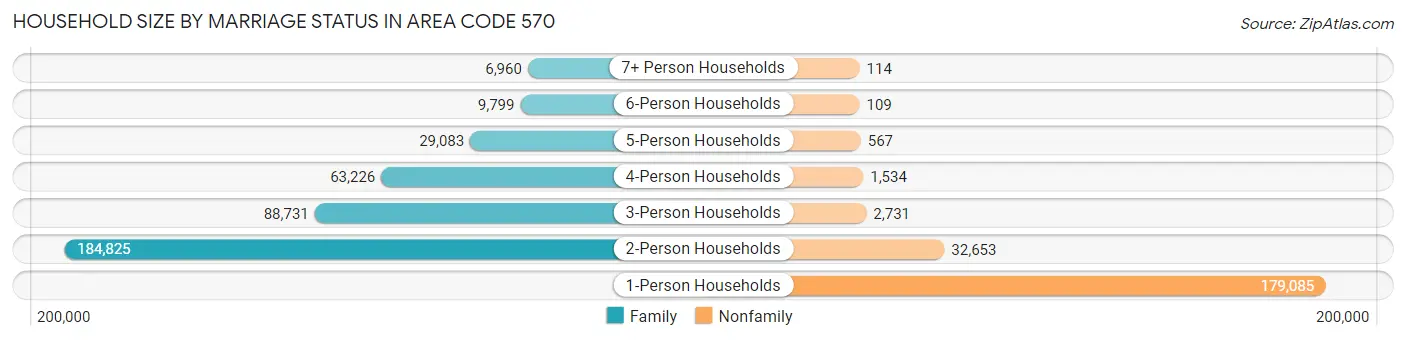
| Household Size | Family Households | Nonfamily Households |
| 1-Person Households | - | 179,085 (29.9%) |
| 2-Person Households | 184,825 (30.8%) | 32,653 (5.4%) |
| 3-Person Households | 88,731 (14.8%) | 2,731 (0.5%) |
| 4-Person Households | 63,226 (10.5%) | 1,534 (0.3%) |
| 5-Person Households | 29,083 (4.9%) | 567 (0.1%) |
| 6-Person Households | 9,799 (1.6%) | 109 (0.0%) |
| 7+ Person Households | 6,960 (1.2%) | 114 (0.0%) |
| Total | 382,624 (63.8%) | 216,793 (36.2%) |
Female Fertility in Area Code 570
Fertility by Age in Area Code 570
Average fertility rate in Area Code 570 is 83.9 births per 1,000 women. Women in the age bracket of 20 to 34 years have the highest fertility rate with 153.1 births per 1,000 women. Women in the age bracket of 20 to 34 years acount for 70.5% of all women with births.
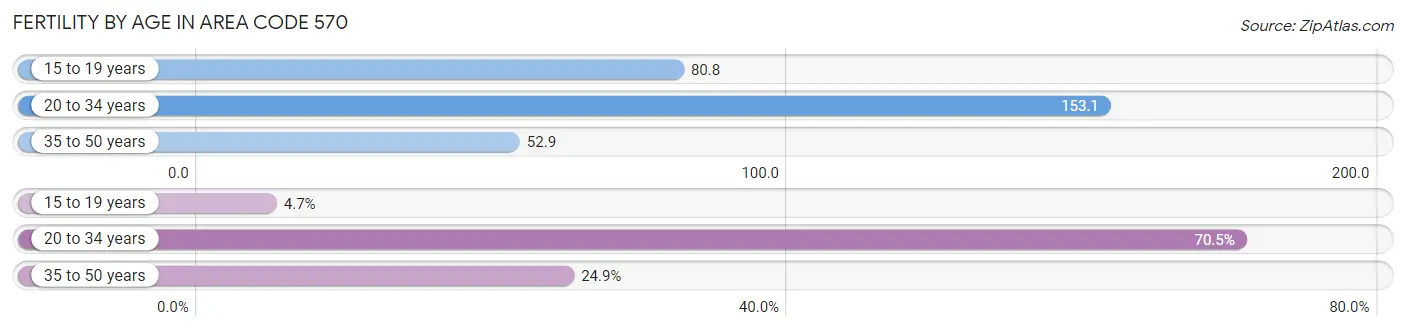
| Age Bracket | Women with Births | Births / 1,000 Women |
| 15 to 19 years | 780 (4.7%) | 80.8 |
| 20 to 34 years | 11,783 (70.5%) | 153.1 |
| 35 to 50 years | 4,155 (24.8%) | 52.9 |
| Total | 16,718 (100.0%) | 83.9 |
Fertility by Age by Marriage Status in Area Code 570
53.8% of women with births (16,718) in Area Code 570 are married. The highest percentage of unmarried women with births falls into 15 to 19 years age bracket with 98.6% of them unmarried at the time of birth, while the lowest percentage of unmarried women with births belong to 20 to 34 years age bracket with 53.2% of them unmarried.
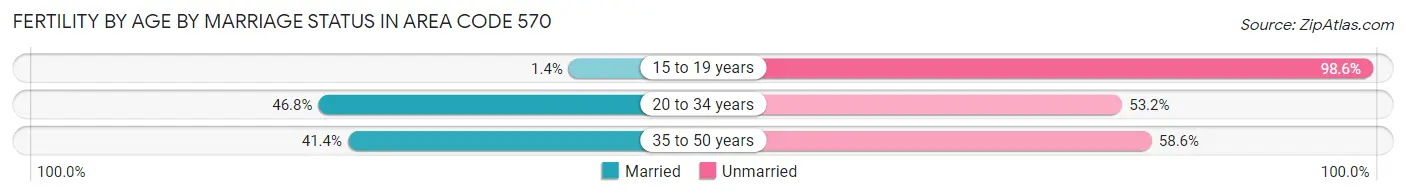
| Age Bracket | Married | Unmarried |
| 15 to 19 years | 11 (1.4%) | 769 (98.6%) |
| 20 to 34 years | 5,513 (46.8%) | 6,270 (53.2%) |
| 35 to 50 years | 1,722 (41.4%) | 2,433 (58.6%) |
| Total | 9,002 (53.8%) | 7,716 (46.2%) |
Fertility by Education in Area Code 570
Average fertility rate in Area Code 570 is 83.9 births per 1,000 women. Women with the education attainment of graduate degree have the highest fertility rate of 172.2 births per 1,000 women, while women with the education attainment of less than high school have the lowest fertility at 104.3 births per 1,000 women. Women with the education attainment of high school diploma represent 31.6% of all women with births.
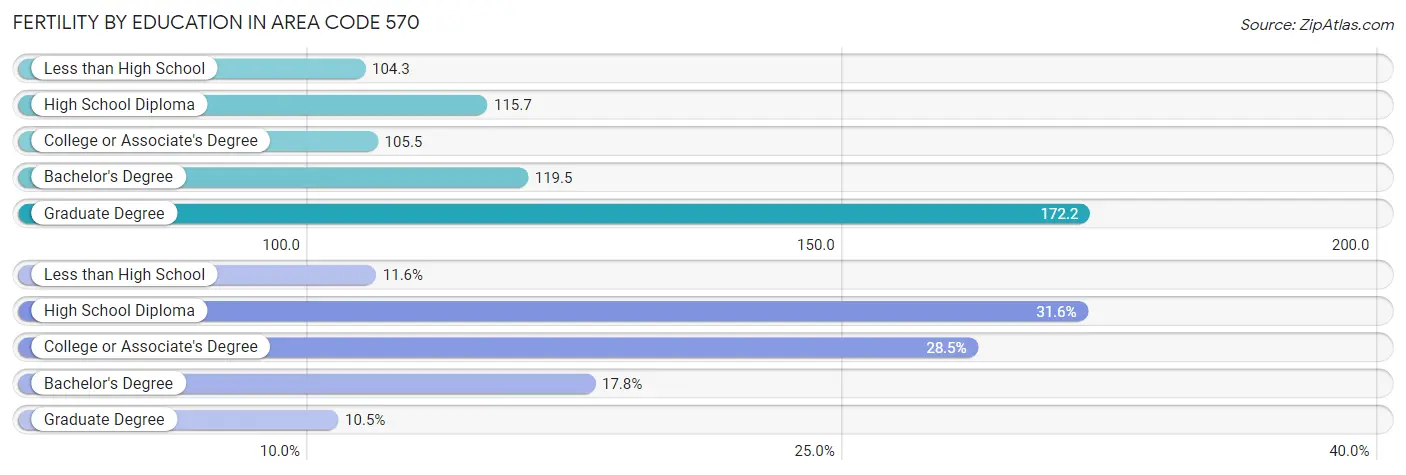
| Educational Attainment | Women with Births | Births / 1,000 Women |
| Less than High School | 1,937 (11.6%) | 104.3 |
| High School Diploma | 5,285 (31.6%) | 115.7 |
| College or Associate's Degree | 4,768 (28.5%) | 105.5 |
| Bachelor's Degree | 2,967 (17.7%) | 119.5 |
| Graduate Degree | 1,761 (10.5%) | 172.2 |
| Total | 16,718 (100.0%) | 83.9 |
Fertility by Education by Marriage Status in Area Code 570
46.2% of women with births in Area Code 570 are unmarried. Women with the educational attainment of bachelor's degree are most likely to be married with 42.5% of them married at childbirth, while women with the educational attainment of less than high school are least likely to be married with 80.9% of them unmarried at childbirth.
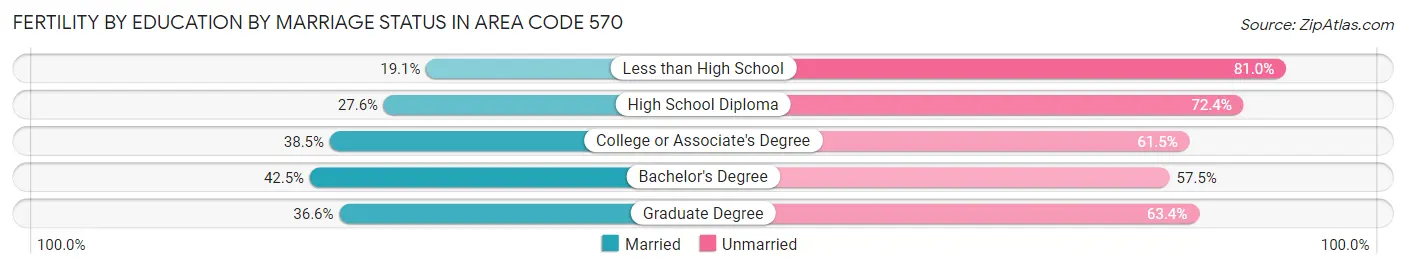
| Educational Attainment | Married | Unmarried |
| Less than High School | 369 (19.1%) | 1,568 (80.9%) |
| High School Diploma | 1,458 (27.6%) | 3,827 (72.4%) |
| College or Associate's Degree | 1,835 (38.5%) | 2,933 (61.5%) |
| Bachelor's Degree | 1,261 (42.5%) | 1,706 (57.5%) |
| Graduate Degree | 644 (36.6%) | 1,117 (63.4%) |
| Total | 9,002 (53.8%) | 7,716 (46.2%) |
Employment Characteristics in Area Code 570
Employment by Class of Employer in Area Code 570
Among the 681,886 employed individuals in Area Code 570, private company employees (466,692 | 68.4%), not-for-profit organizations (72,999 | 10.7%), and local government employees (44,655 | 6.6%) make up the most common classes of employment.
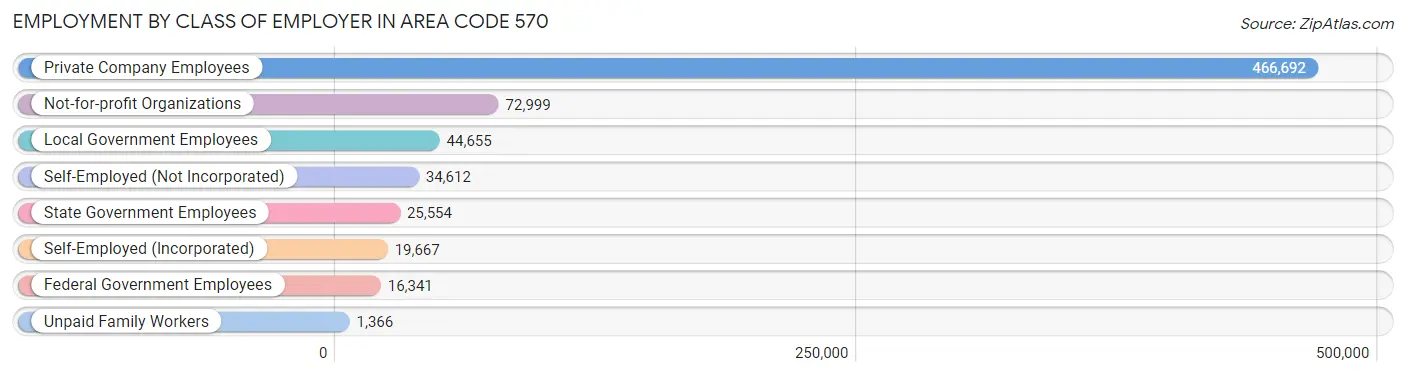
| Employer Class | # Employees | % Employees |
| Private Company Employees | 466,692 | 68.4% |
| Self-Employed (Incorporated) | 19,667 | 2.9% |
| Self-Employed (Not Incorporated) | 34,612 | 5.1% |
| Not-for-profit Organizations | 72,999 | 10.7% |
| Local Government Employees | 44,655 | 6.6% |
| State Government Employees | 25,554 | 3.7% |
| Federal Government Employees | 16,341 | 2.4% |
| Unpaid Family Workers | 1,366 | 0.2% |
| Total | 681,886 | 100.0% |
Employment Status by Age in Area Code 570
According to the labor force statistics for Area Code 570, out of the total population over 16 years of age (1,247,756), 58.0% or 723,075 individuals are in the labor force, with 6.3% or 45,264 of them unemployed. The age group with the highest labor force participation rate is 25 to 29 years, with 85.0% or 74,751 individuals in the labor force. Within the labor force, the 16 to 19 years age range has the highest percentage of unemployed individuals, with 3,479.6% or 1,325,832 of them being unemployed.
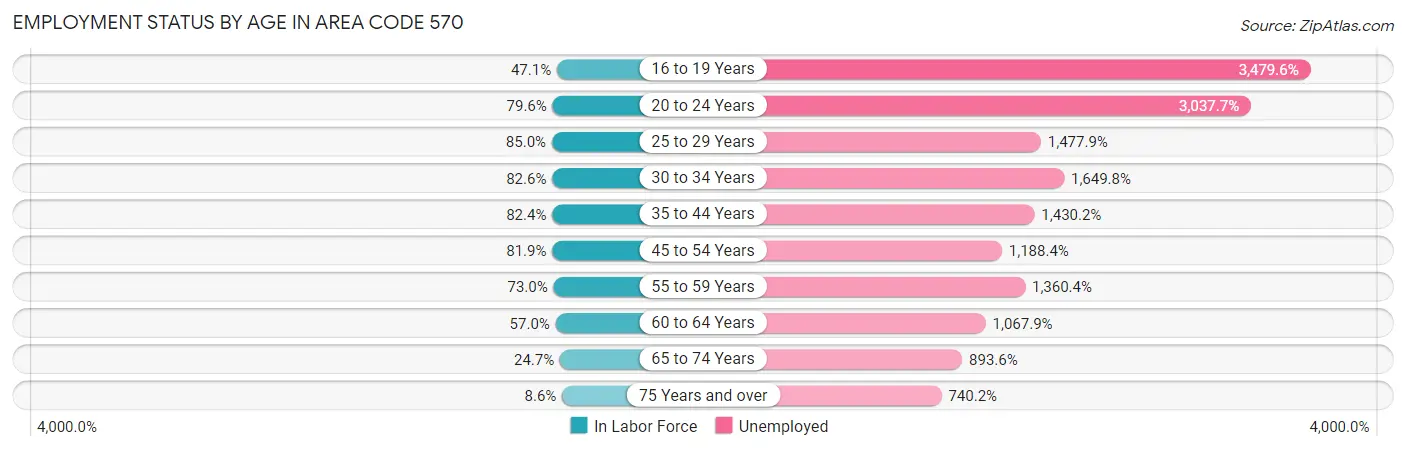
| Age Bracket | In Labor Force | Unemployed |
| 16 to 19 Years | 38,100 (47.1%) | 1,325,832 (3,479.6%) |
| 20 to 24 Years | 75,296 (79.6%) | 2,287,175 (3,037.7%) |
| 25 to 29 Years | 74,755 (85.0%) | 1,104,745 (1,477.9%) |
| 30 to 34 Years | 73,629 (82.6%) | 1,214,781 (1,649.8%) |
| 35 to 44 Years | 141,490 (82.4%) | 2,023,576 (1,430.2%) |
| 45 to 54 Years | 156,643 (81.9%) | 1,861,462 (1,188.4%) |
| 55 to 59 Years | 80,571 (73.0%) | 1,096,033 (1,360.4%) |
| 60 to 64 Years | 63,118 (57.0%) | 674,048 (1,067.9%) |
| 65 to 74 Years | 44,211 (24.7%) | 395,069 (893.6%) |
| 75 Years and over | 11,331 (8.6%) | 83,865 (740.2%) |
| Total | 723,084 (58.0%) | 45,262 (6.3%) |
Employment Status by Educational Attainment in Area Code 570
According to labor force statistics for Area Code 570, 76.2% of individuals (580,446) out of the total population between 25 and 64 years of age (761,341) are in the labor force, with 1,497.2% or 8,690,438 of them being unemployed. The group with the highest labor force participation rate are those with the educational attainment of bachelor's degree or higher, with 85.9% or 167,826 individuals in the labor force. Within the labor force, individuals with less than high school education have the highest percentage of unemployment, with 2,416.0% or 911,847 of them being unemployed.
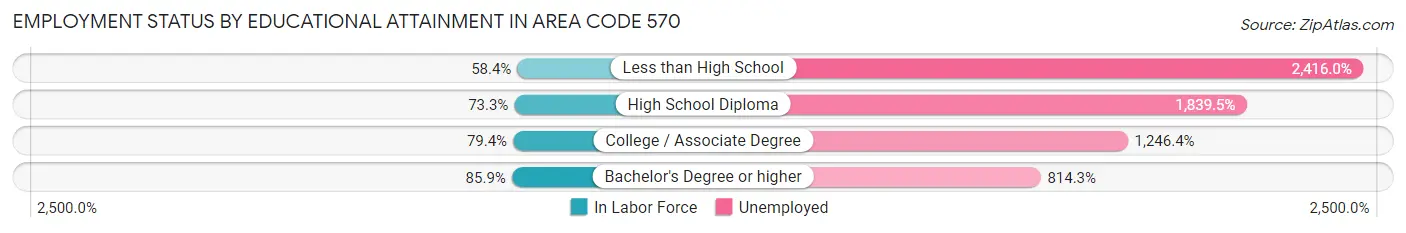
| Educational Attainment | In Labor Force | Unemployed |
| Less than High School | 37,740 (58.4%) | 1,561,896 (2,416.0%) |
| High School Diploma | 210,431 (73.3%) | 5,278,390 (1,839.5%) |
| College / Associate Degree | 170,350 (79.4%) | 2,673,067 (1,246.4%) |
| Bachelor's Degree or higher | 167,833 (85.9%) | 1,590,189 (814.3%) |
| Total | 580,420 (76.2%) | 11,398,797 (1,497.2%) |
Employment Occupations by Sex in Area Code 570
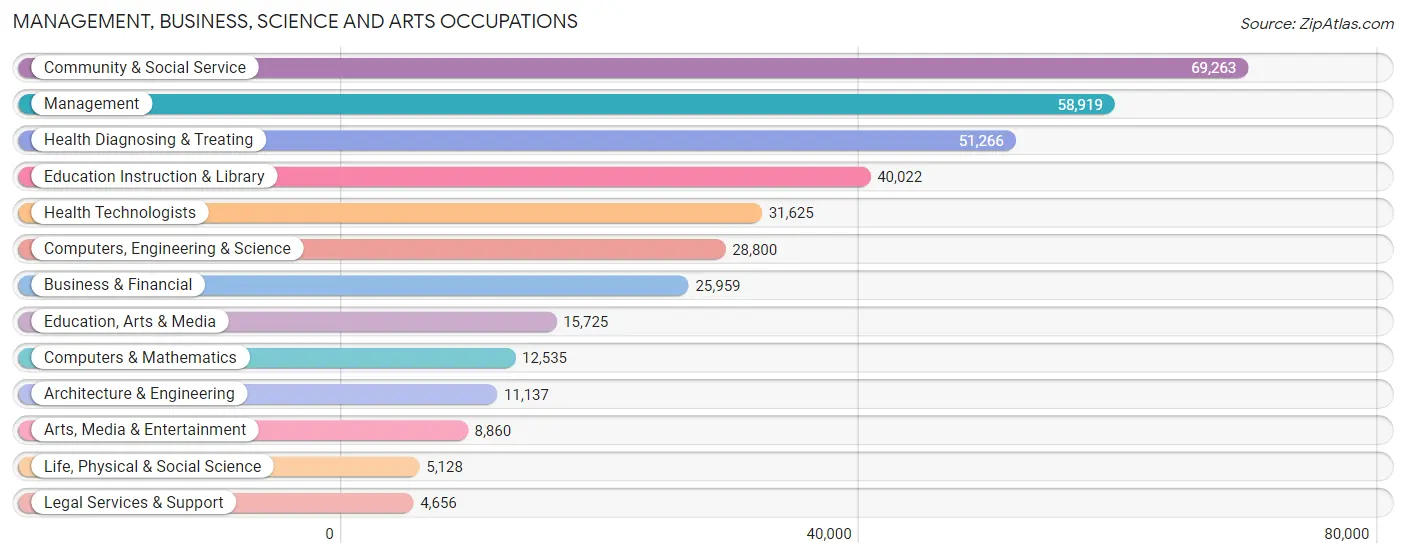
Management, Business, Science and Arts Occupations
The most common Management, Business, Science and Arts occupations in Area Code 570 are Community & Social Service (69,263 | 10.0%), Management (58,919 | 8.5%), Health Diagnosing & Treating (51,266 | 7.4%), Education Instruction & Library (40,022 | 5.8%), and Health Technologists (31,625 | 4.5%).
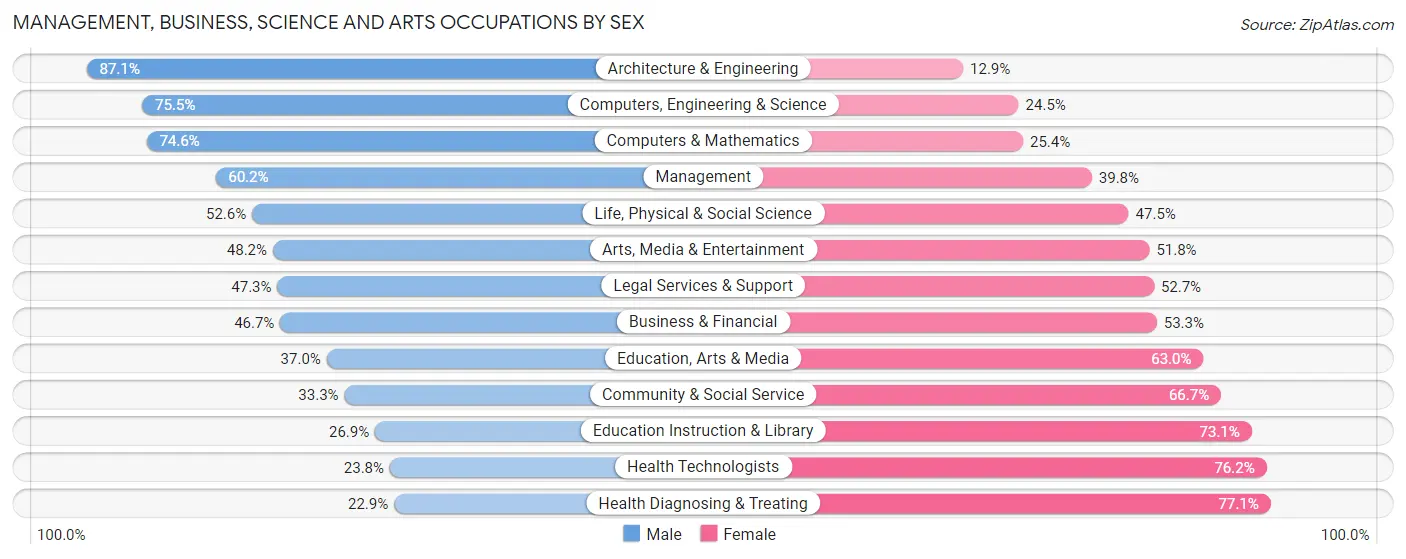
Management, Business, Science and Arts Occupations by Sex
Within the Management, Business, Science and Arts occupations in Area Code 570, the most male-oriented occupations are Architecture & Engineering (87.1%), Computers, Engineering & Science (75.5%), and Computers & Mathematics (74.6%), while the most female-oriented occupations are Health Diagnosing & Treating (77.1%), Health Technologists (76.2%), and Education Instruction & Library (73.1%).
| Occupation | Male | Female |
| Management | 35,479 (60.2%) | 23,440 (39.8%) |
| Business & Financial | 12,118 (46.7%) | 13,841 (53.3%) |
| Computers, Engineering & Science | 21,742 (75.5%) | 7,058 (24.5%) |
| Computers & Mathematics | 9,349 (74.6%) | 3,186 (25.4%) |
| Architecture & Engineering | 9,698 (87.1%) | 1,439 (12.9%) |
| Life, Physical & Social Science | 2,695 (52.5%) | 2,433 (47.4%) |
| Community & Social Service | 23,055 (33.3%) | 46,208 (66.7%) |
| Education, Arts & Media | 5,816 (37.0%) | 9,909 (63.0%) |
| Legal Services & Support | 2,201 (47.3%) | 2,455 (52.7%) |
| Education Instruction & Library | 10,767 (26.9%) | 29,255 (73.1%) |
| Arts, Media & Entertainment | 4,271 (48.2%) | 4,589 (51.8%) |
| Health Diagnosing & Treating | 11,755 (22.9%) | 39,511 (77.1%) |
| Health Technologists | 7,527 (23.8%) | 24,098 (76.2%) |
| Total (Category) | 104,149 (44.5%) | 130,058 (55.5%) |
| Total (Overall) | 368,225 (53.0%) | 326,525 (47.0%) |
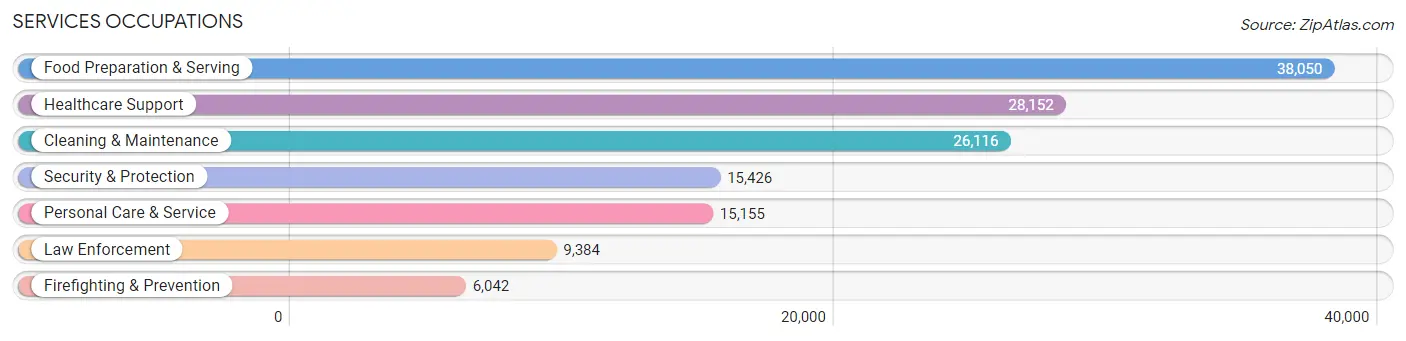
Services Occupations
The most common Services occupations in Area Code 570 are Food Preparation & Serving (38,050 | 5.5%), Healthcare Support (28,152 | 4.1%), Cleaning & Maintenance (26,116 | 3.8%), Security & Protection (15,426 | 2.2%), and Personal Care & Service (15,155 | 2.2%).
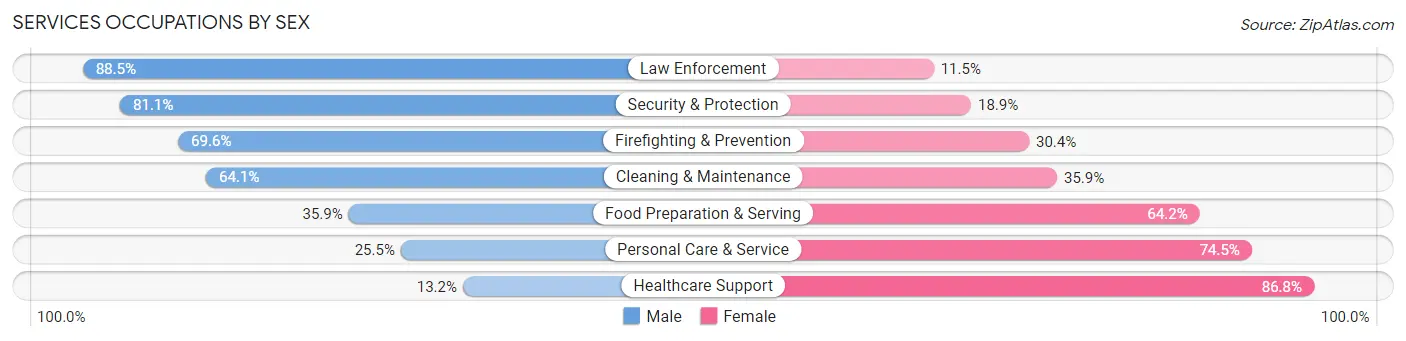
Services Occupations by Sex
Within the Services occupations in Area Code 570, the most male-oriented occupations are Law Enforcement (88.5%), Security & Protection (81.1%), and Firefighting & Prevention (69.6%), while the most female-oriented occupations are Healthcare Support (86.8%), Personal Care & Service (74.5%), and Food Preparation & Serving (64.1%).
| Occupation | Male | Female |
| Healthcare Support | 3,725 (13.2%) | 24,427 (86.8%) |
| Security & Protection | 12,509 (81.1%) | 2,917 (18.9%) |
| Firefighting & Prevention | 4,206 (69.6%) | 1,836 (30.4%) |
| Law Enforcement | 8,303 (88.5%) | 1,081 (11.5%) |
| Food Preparation & Serving | 13,640 (35.8%) | 24,410 (64.1%) |
| Cleaning & Maintenance | 16,731 (64.1%) | 9,385 (35.9%) |
| Personal Care & Service | 3,868 (25.5%) | 11,287 (74.5%) |
| Total (Category) | 50,473 (41.1%) | 72,426 (58.9%) |
| Total (Overall) | 368,225 (53.0%) | 326,525 (47.0%) |
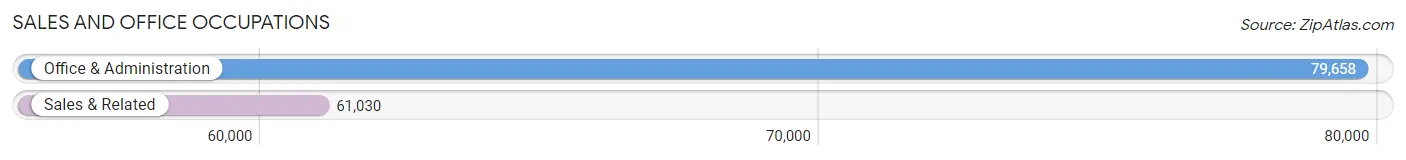
Sales and Office Occupations
The most common Sales and Office occupations in Area Code 570 are Office & Administration (79,658 | 11.5%), and Sales & Related (61,030 | 8.8%).
Sales and Office Occupations by Sex
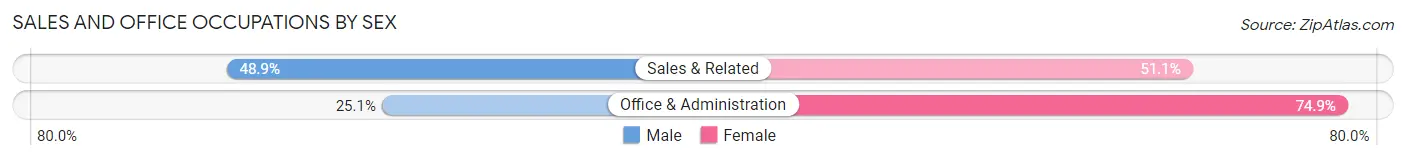
| Occupation | Male | Female |
| Sales & Related | 29,859 (48.9%) | 31,171 (51.1%) |
| Office & Administration | 19,966 (25.1%) | 59,692 (74.9%) |
| Total (Category) | 49,825 (35.4%) | 90,863 (64.6%) |
| Total (Overall) | 368,225 (53.0%) | 326,525 (47.0%) |
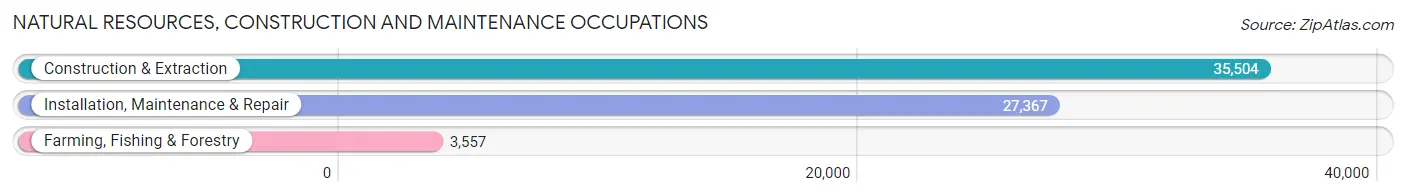
Natural Resources, Construction and Maintenance Occupations
The most common Natural Resources, Construction and Maintenance occupations in Area Code 570 are Construction & Extraction (35,504 | 5.1%), Installation, Maintenance & Repair (27,367 | 3.9%), and Farming, Fishing & Forestry (3,557 | 0.5%).
Natural Resources, Construction and Maintenance Occupations by Sex
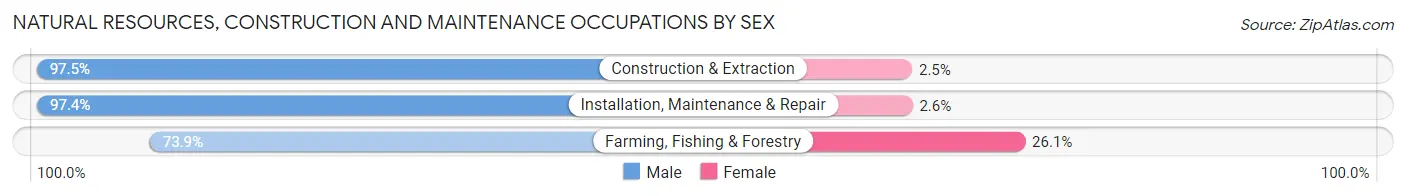
| Occupation | Male | Female |
| Farming, Fishing & Forestry | 2,630 (73.9%) | 927 (26.1%) |
| Construction & Extraction | 34,608 (97.5%) | 896 (2.5%) |
| Installation, Maintenance & Repair | 26,653 (97.4%) | 714 (2.6%) |
| Total (Category) | 63,891 (96.2%) | 2,537 (3.8%) |
| Total (Overall) | 368,225 (53.0%) | 326,525 (47.0%) |
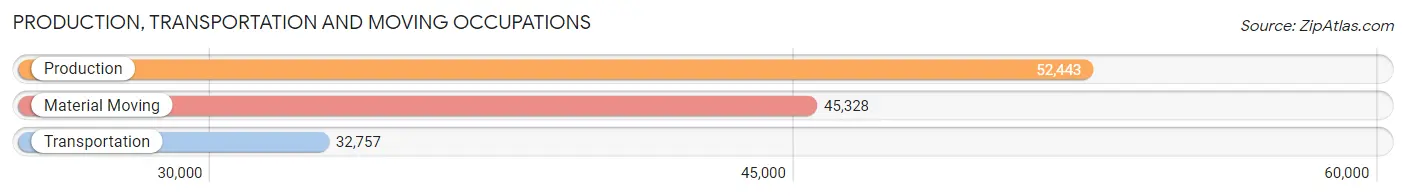
Production, Transportation and Moving Occupations
The most common Production, Transportation and Moving occupations in Area Code 570 are Production (52,443 | 7.5%), Material Moving (45,328 | 6.5%), and Transportation (32,757 | 4.7%).
Production, Transportation and Moving Occupations by Sex
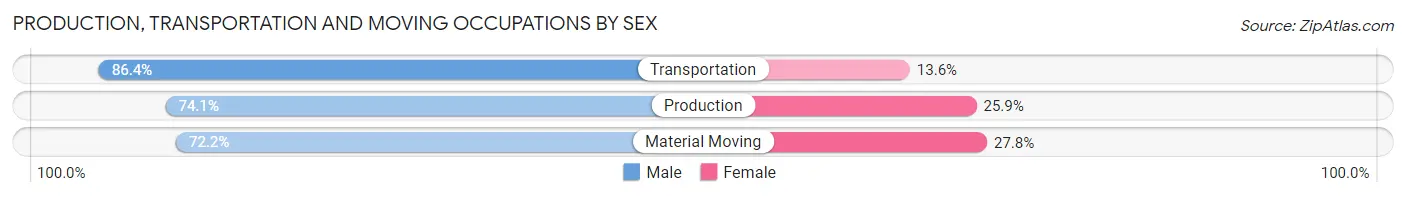
| Occupation | Male | Female |
| Production | 38,874 (74.1%) | 13,569 (25.9%) |
| Transportation | 28,288 (86.4%) | 4,469 (13.6%) |
| Material Moving | 32,725 (72.2%) | 12,603 (27.8%) |
| Total (Category) | 99,887 (76.5%) | 30,641 (23.5%) |
| Total (Overall) | 368,225 (53.0%) | 326,525 (47.0%) |
Employment Industries by Sex in Area Code 570
Employment Industries in Area Code 570
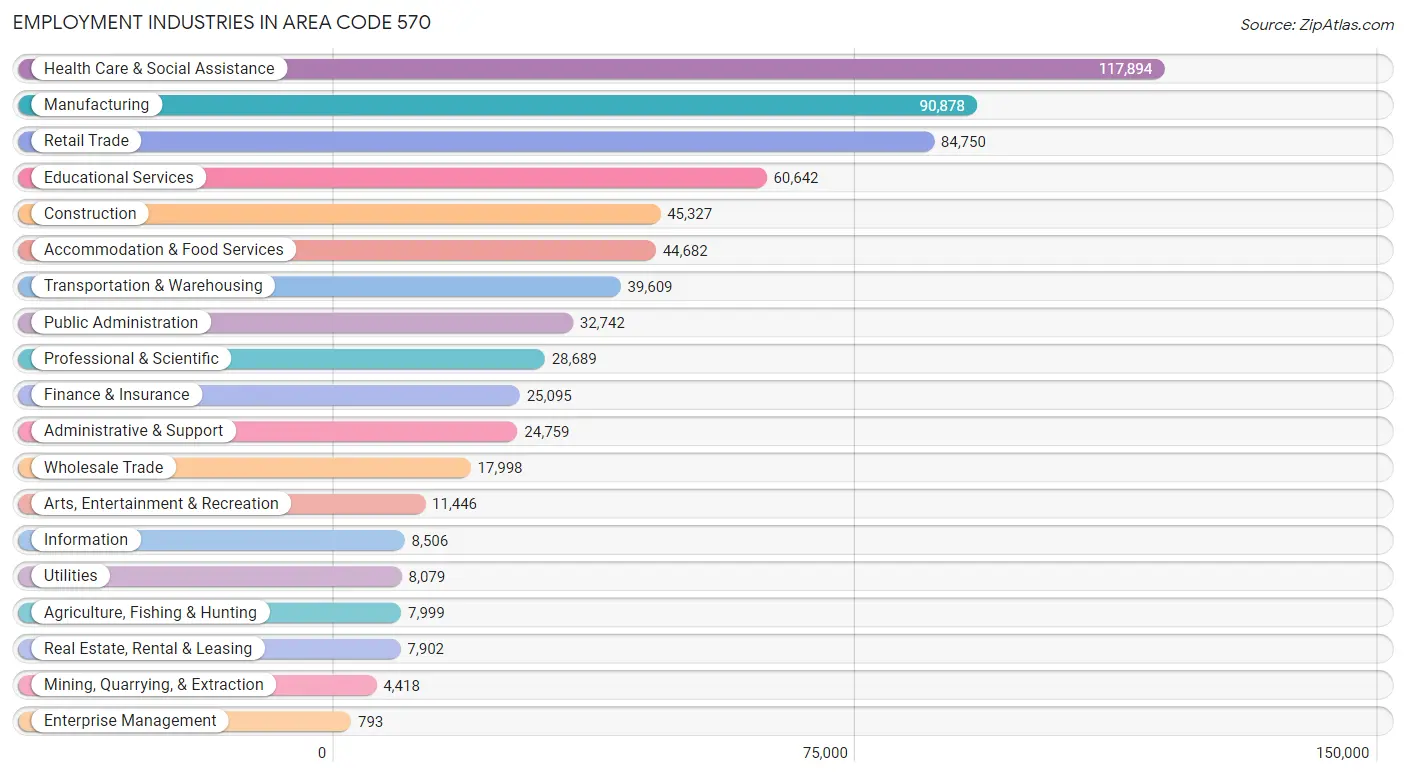
The major employment industries in Area Code 570 include Health Care & Social Assistance (117,894 | 17.0%), Manufacturing (90,878 | 13.1%), Retail Trade (84,750 | 12.2%), Educational Services (60,642 | 8.7%), and Construction (45,327 | 6.5%).
Employment Industries by Sex in Area Code 570
The Area Code 570 industries that see more men than women are Construction (92.1%), Mining, Quarrying, & Extraction (90.2%), and Utilities (79.8%), whereas the industries that tend to have a higher number of women are Health Care & Social Assistance (79.3%), Finance & Insurance (66.6%), and Educational Services (66.4%).
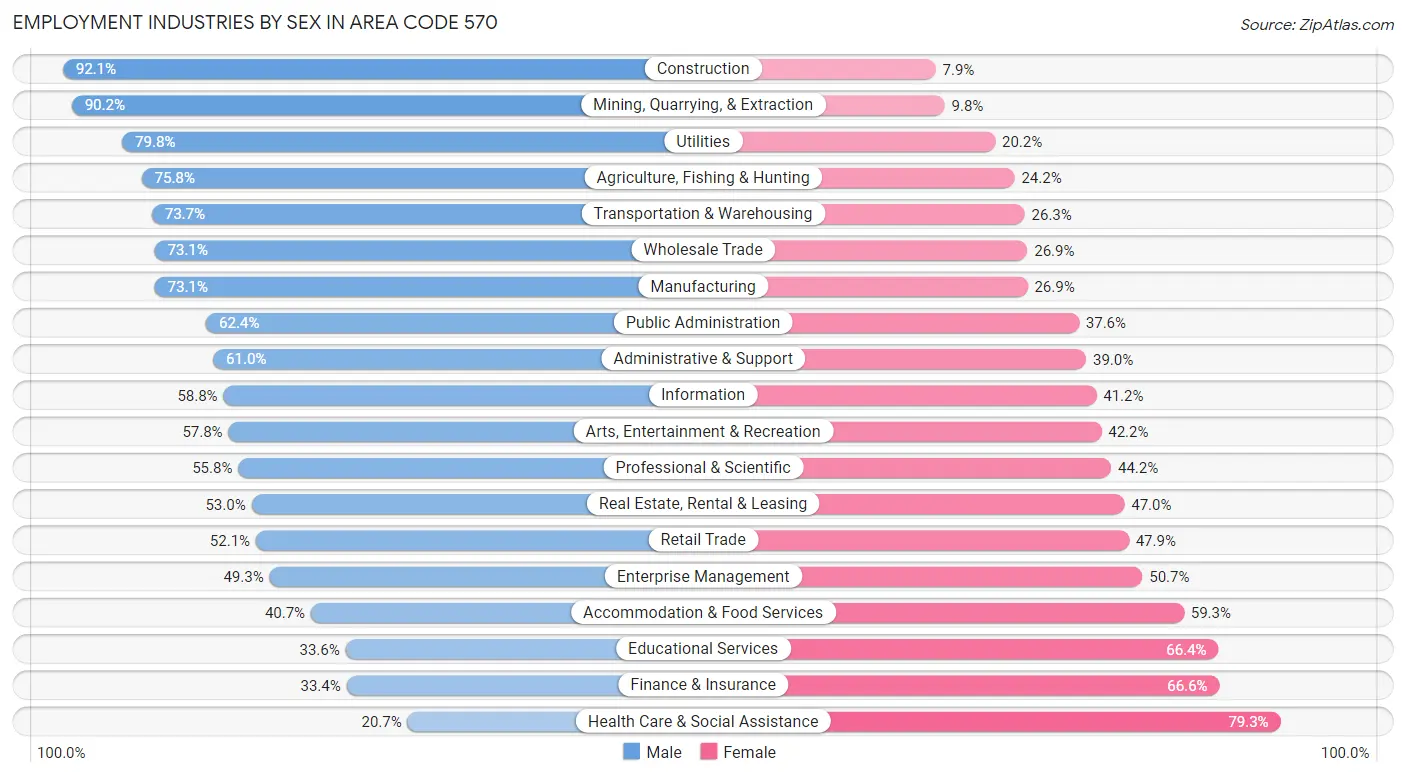
| Industry | Male | Female |
| Agriculture, Fishing & Hunting | 6,061 (75.8%) | 1,938 (24.2%) |
| Mining, Quarrying, & Extraction | 3,987 (90.2%) | 431 (9.8%) |
| Construction | 41,741 (92.1%) | 3,586 (7.9%) |
| Manufacturing | 66,411 (73.1%) | 24,467 (26.9%) |
| Wholesale Trade | 13,158 (73.1%) | 4,840 (26.9%) |
| Retail Trade | 44,170 (52.1%) | 40,580 (47.9%) |
| Transportation & Warehousing | 29,179 (73.7%) | 10,430 (26.3%) |
| Utilities | 6,447 (79.8%) | 1,632 (20.2%) |
| Information | 5,005 (58.8%) | 3,501 (41.2%) |
| Finance & Insurance | 8,371 (33.4%) | 16,724 (66.6%) |
| Real Estate, Rental & Leasing | 4,191 (53.0%) | 3,711 (47.0%) |
| Professional & Scientific | 16,002 (55.8%) | 12,687 (44.2%) |
| Enterprise Management | 391 (49.3%) | 402 (50.7%) |
| Administrative & Support | 15,093 (61.0%) | 9,666 (39.0%) |
| Educational Services | 20,360 (33.6%) | 40,282 (66.4%) |
| Health Care & Social Assistance | 24,435 (20.7%) | 93,459 (79.3%) |
| Arts, Entertainment & Recreation | 6,617 (57.8%) | 4,829 (42.2%) |
| Accommodation & Food Services | 18,197 (40.7%) | 26,485 (59.3%) |
| Public Administration | 20,443 (62.4%) | 12,299 (37.6%) |
| Total | 368,225 (53.0%) | 326,525 (47.0%) |
Education in Area Code 570
School Enrollment in Area Code 570
The most common levels of schooling among the 317,212 students in Area Code 570 are high school (72,221 | 22.8%), college / undergraduate (69,589 | 21.9%), and middle school (67,671 | 21.3%).
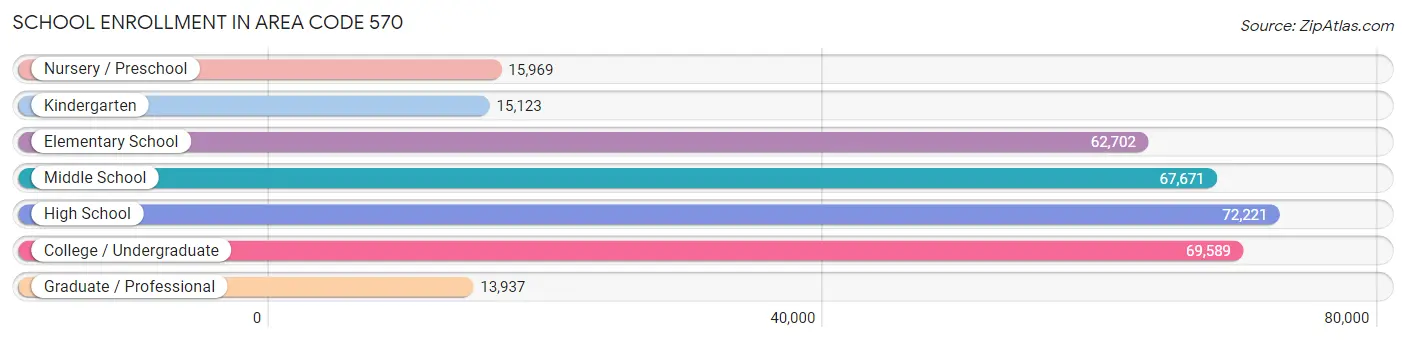
| School Level | # Students | % Students |
| Nursery / Preschool | 15,969 | 5.0% |
| Kindergarten | 15,123 | 4.8% |
| Elementary School | 62,702 | 19.8% |
| Middle School | 67,671 | 21.3% |
| High School | 72,221 | 22.8% |
| College / Undergraduate | 69,589 | 21.9% |
| Graduate / Professional | 13,937 | 4.4% |
| Total | 317,212 | 100.0% |
School Enrollment by Age by Funding Source in Area Code 570
Out of a total of 317,212 students who are enrolled in schools in Area Code 570, 69,048 (21.8%) attend a private institution, while the remaining 248,164 (78.2%) are enrolled in public schools. The age group of 20 to 24 year olds has the highest likelihood of being enrolled in private schools, with 17,103 (45.8% in the age bracket) enrolled. Conversely, the age group of 15 to 17 year olds has the lowest likelihood of being enrolled in a private school, with 46,298 (89.1% in the age bracket) attending a public institution.
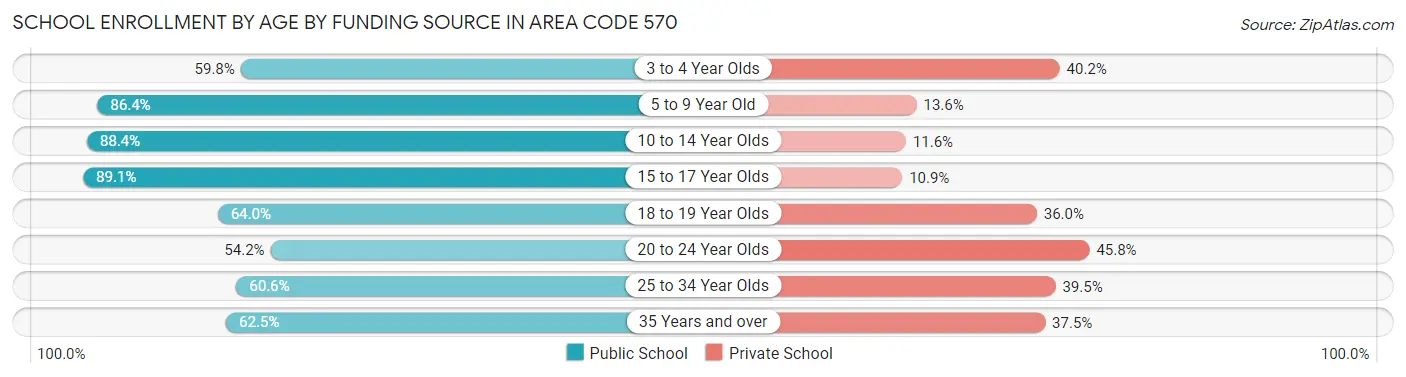
| Age Bracket | Public School | Private School |
| 3 to 4 Year Olds | 7,013 (59.8%) | 4,721 (40.2%) |
| 5 to 9 Year Old | 63,530 (86.4%) | 9,976 (13.6%) |
| 10 to 14 Year Olds | 74,081 (88.4%) | 9,718 (11.6%) |
| 15 to 17 Year Olds | 46,298 (89.1%) | 5,663 (10.9%) |
| 18 to 19 Year Olds | 20,135 (64.0%) | 11,312 (36.0%) |
| 20 to 24 Year Olds | 20,255 (54.2%) | 17,103 (45.8%) |
| 25 to 34 Year Olds | 8,395 (60.6%) | 5,469 (39.5%) |
| 35 Years and over | 8,460 (62.5%) | 5,083 (37.5%) |
| Total | 248,164 (78.2%) | 69,048 (21.8%) |
Educational Attainment by Field of Study in Area Code 570
Education (50,514 | 18.0%), business (45,034 | 16.1%), science & technology (36,516 | 13.0%), arts & humanities (22,693 | 8.1%), and bio, nature & agricultural (19,105 | 6.8%) are the most common fields of study among 280,347 individuals in Area Code 570 who have obtained a bachelor's degree or higher.
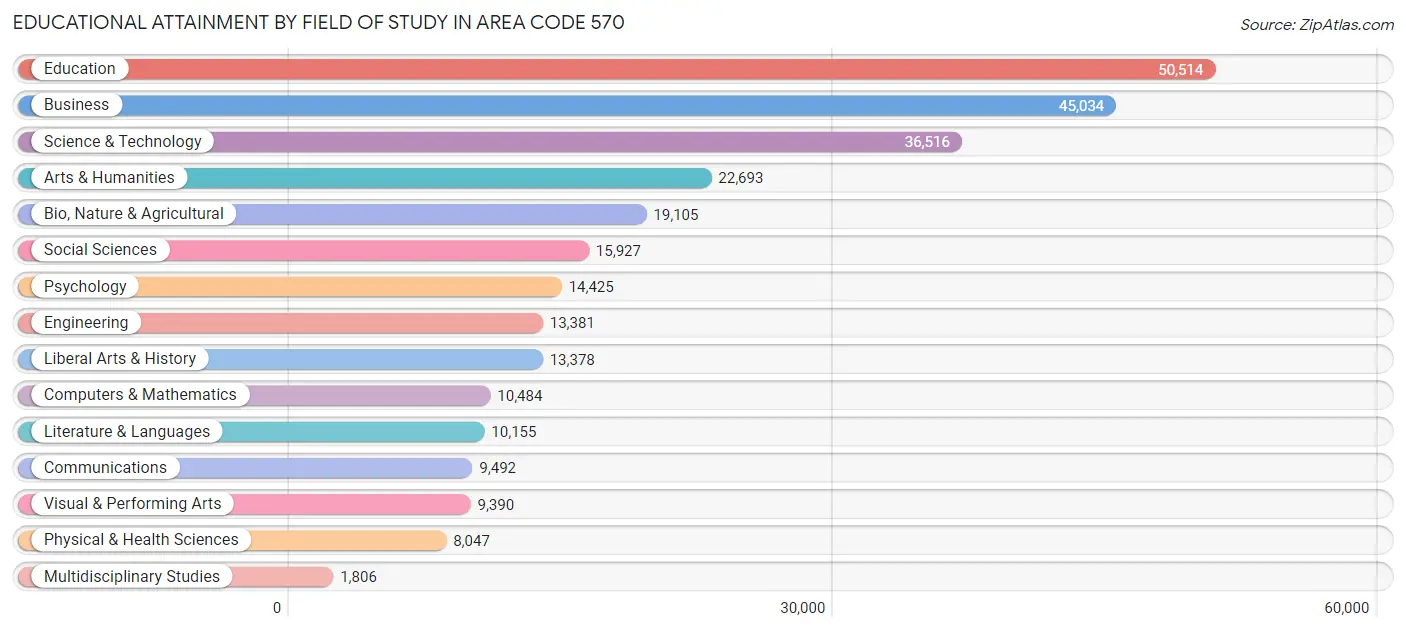
| Field of Study | # Graduates | % Graduates |
| Computers & Mathematics | 10,484 | 3.7% |
| Bio, Nature & Agricultural | 19,105 | 6.8% |
| Physical & Health Sciences | 8,047 | 2.9% |
| Psychology | 14,425 | 5.1% |
| Social Sciences | 15,927 | 5.7% |
| Engineering | 13,381 | 4.8% |
| Multidisciplinary Studies | 1,806 | 0.6% |
| Science & Technology | 36,516 | 13.0% |
| Business | 45,034 | 16.1% |
| Education | 50,514 | 18.0% |
| Literature & Languages | 10,155 | 3.6% |
| Liberal Arts & History | 13,378 | 4.8% |
| Visual & Performing Arts | 9,390 | 3.4% |
| Communications | 9,492 | 3.4% |
| Arts & Humanities | 22,693 | 8.1% |
| Total | 280,347 | 100.0% |
Transportation & Commute in Area Code 570
Vehicle Availability by Sex in Area Code 570
The most prevalent vehicle ownership categories in Area Code 570 are males with 2 vehicles (147,171, accounting for 41.0%) and females with 2 vehicles (124,804, making up 46.7%).
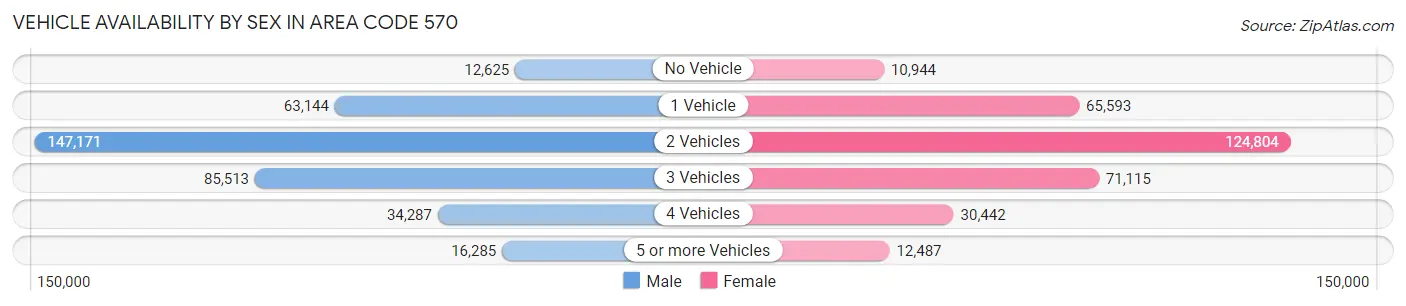
| Vehicles Available | Male | Female |
| No Vehicle | 12,625 (3.5%) | 10,944 (3.5%) |
| 1 Vehicle | 63,144 (17.6%) | 65,593 (20.8%) |
| 2 Vehicles | 147,171 (41.0%) | 124,804 (39.6%) |
| 3 Vehicles | 85,513 (23.8%) | 71,115 (22.6%) |
| 4 Vehicles | 34,287 (9.6%) | 30,442 (9.7%) |
| 5 or more Vehicles | 16,285 (4.5%) | 12,487 (4.0%) |
| Total | 359,025 (100.0%) | 315,385 (100.0%) |
Commute Time in Area Code 570
The most frequently occuring commute durations in Area Code 570 are 15 to 19 minutes (99,901 commuters, 15.9%), 10 to 14 minutes (98,165 commuters, 15.6%), and 20 to 24 minutes (86,382 commuters, 13.8%).
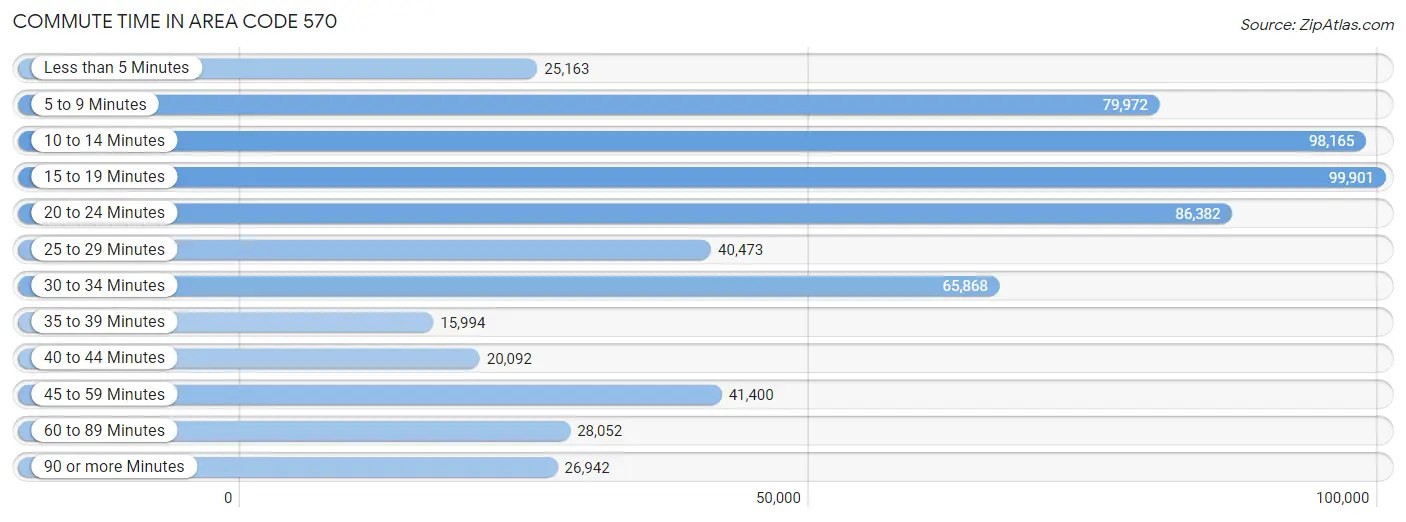
| Commute Time | # Commuters | % Commuters |
| Less than 5 Minutes | 25,163 | 4.0% |
| 5 to 9 Minutes | 79,972 | 12.7% |
| 10 to 14 Minutes | 98,165 | 15.6% |
| 15 to 19 Minutes | 99,901 | 15.9% |
| 20 to 24 Minutes | 86,382 | 13.8% |
| 25 to 29 Minutes | 40,473 | 6.4% |
| 30 to 34 Minutes | 65,868 | 10.5% |
| 35 to 39 Minutes | 15,994 | 2.5% |
| 40 to 44 Minutes | 20,092 | 3.2% |
| 45 to 59 Minutes | 41,400 | 6.6% |
| 60 to 89 Minutes | 28,052 | 4.5% |
| 90 or more Minutes | 26,942 | 4.3% |
Commute Time by Sex in Area Code 570
The most common commute times in Area Code 570 are 15 to 19 minutes (50,048 commuters, 14.8%) for males and 10 to 14 minutes (50,170 commuters, 17.3%) for females.
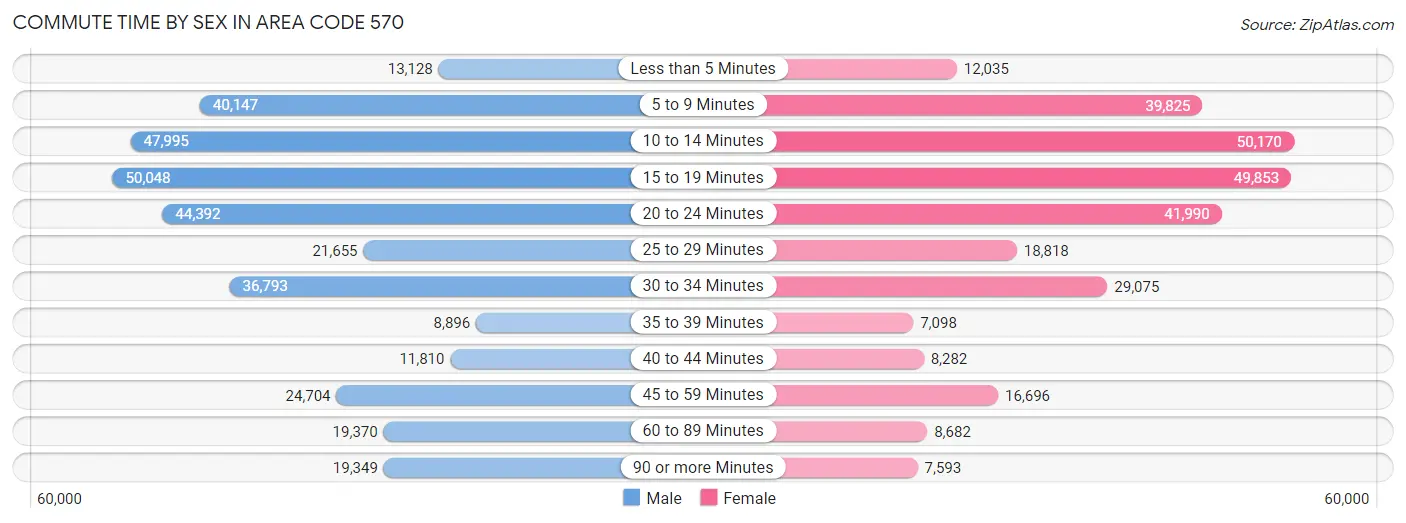
| Commute Time | Male | Female |
| Less than 5 Minutes | 13,128 (3.9%) | 12,035 (4.2%) |
| 5 to 9 Minutes | 40,147 (11.9%) | 39,825 (13.7%) |
| 10 to 14 Minutes | 47,995 (14.2%) | 50,170 (17.3%) |
| 15 to 19 Minutes | 50,048 (14.8%) | 49,853 (17.2%) |
| 20 to 24 Minutes | 44,392 (13.1%) | 41,990 (14.5%) |
| 25 to 29 Minutes | 21,655 (6.4%) | 18,818 (6.5%) |
| 30 to 34 Minutes | 36,793 (10.9%) | 29,075 (10.0%) |
| 35 to 39 Minutes | 8,896 (2.6%) | 7,098 (2.5%) |
| 40 to 44 Minutes | 11,810 (3.5%) | 8,282 (2.9%) |
| 45 to 59 Minutes | 24,704 (7.3%) | 16,696 (5.8%) |
| 60 to 89 Minutes | 19,370 (5.7%) | 8,682 (3.0%) |
| 90 or more Minutes | 19,349 (5.7%) | 7,593 (2.6%) |
Time of Departure to Work by Sex in Area Code 570
The most frequent times of departure to work in Area Code 570 are 7:00 AM to 7:29 AM (43,156, 12.8%) for males and 7:00 AM to 7:29 AM (44,513, 15.3%) for females.
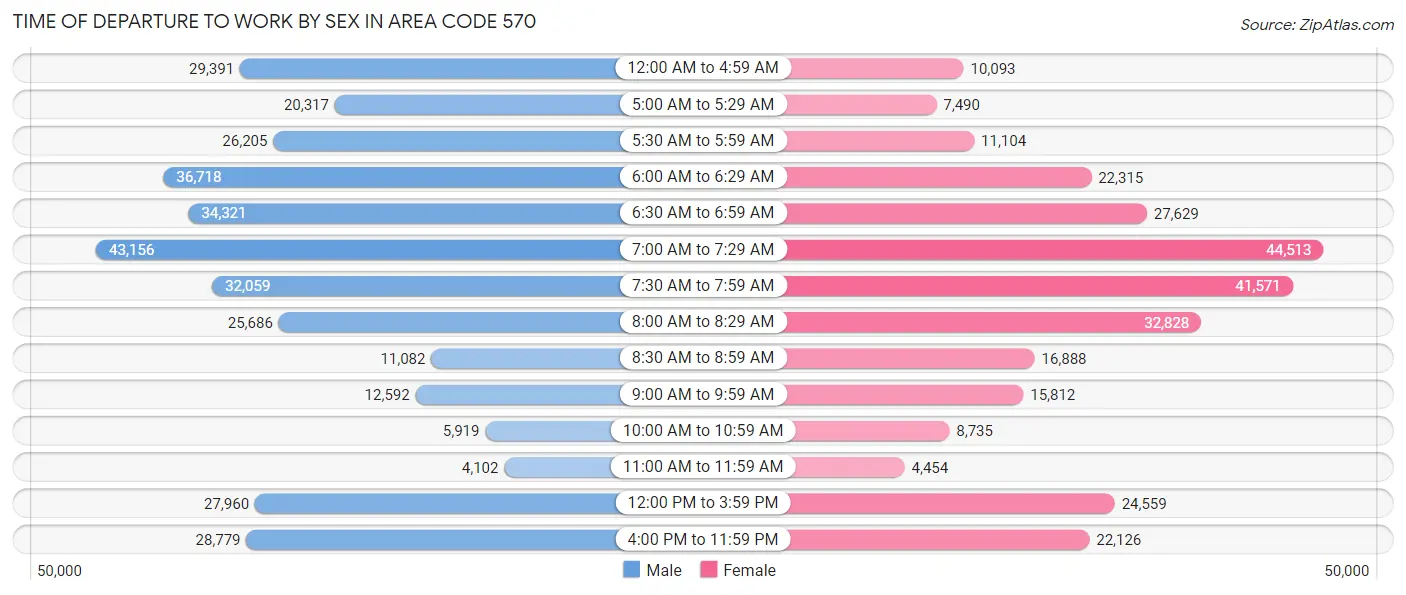
| Time of Departure | Male | Female |
| 12:00 AM to 4:59 AM | 29,391 (8.7%) | 10,093 (3.5%) |
| 5:00 AM to 5:29 AM | 20,317 (6.0%) | 7,490 (2.6%) |
| 5:30 AM to 5:59 AM | 26,205 (7.7%) | 11,104 (3.8%) |
| 6:00 AM to 6:29 AM | 36,718 (10.8%) | 22,315 (7.7%) |
| 6:30 AM to 6:59 AM | 34,321 (10.2%) | 27,629 (9.5%) |
| 7:00 AM to 7:29 AM | 43,156 (12.8%) | 44,513 (15.3%) |
| 7:30 AM to 7:59 AM | 32,059 (9.5%) | 41,571 (14.3%) |
| 8:00 AM to 8:29 AM | 25,686 (7.6%) | 32,828 (11.3%) |
| 8:30 AM to 8:59 AM | 11,082 (3.3%) | 16,888 (5.8%) |
| 9:00 AM to 9:59 AM | 12,592 (3.7%) | 15,812 (5.4%) |
| 10:00 AM to 10:59 AM | 5,919 (1.8%) | 8,735 (3.0%) |
| 11:00 AM to 11:59 AM | 4,102 (1.2%) | 4,454 (1.5%) |
| 12:00 PM to 3:59 PM | 27,960 (8.3%) | 24,559 (8.5%) |
| 4:00 PM to 11:59 PM | 28,779 (8.5%) | 22,126 (7.6%) |
| Total | 338,287 (100.0%) | 290,117 (100.0%) |
Housing Occupancy in Area Code 570
Occupancy by Ownership in Area Code 570
Of the total 599,417 dwellings in Area Code 570, owner-occupied units account for 431,204 (71.9%), while renter-occupied units make up 168,213 (28.1%).
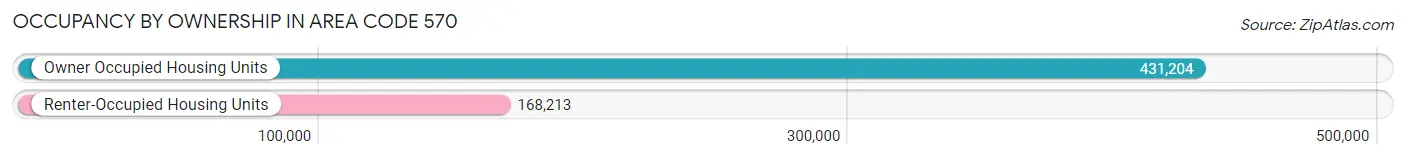
| Occupancy | # Housing Units | % Housing Units |
| Owner Occupied Housing Units | 431,204 | 71.9% |
| Renter-Occupied Housing Units | 168,213 | 28.1% |
| Total Occupied Housing Units | 599,417 | 100.0% |
Occupancy by Household Size in Area Code 570
| Household Size | # Housing Units | % Housing Units |
| 1-Person Household | 179,085 | 29.9% |
| 2-Person Household | 217,478 | 36.3% |
| 3-Person Household | 91,462 | 15.3% |
| 4+ Person Household | 111,392 | 18.6% |
| Total Housing Units | 599,417 | 100.0% |
Occupancy by Ownership by Household Size in Area Code 570
| Household Size | Owner-occupied | Renter-occupied |
| 1-Person Household | 106,213 (59.3%) | 72,872 (40.7%) |
| 2-Person Household | 173,040 (79.6%) | 44,438 (20.4%) |
| 3-Person Household | 68,405 (74.8%) | 23,057 (25.2%) |
| 4+ Person Household | 83,546 (75.0%) | 27,846 (25.0%) |
| Total Housing Units | 431,204 (71.9%) | 168,213 (28.1%) |
Occupancy by Educational Attainment in Area Code 570
| Household Size | Owner-occupied | Renter-occupied |
| Less than High School | 26,365 (53.9%) | 22,554 (46.1%) |
| High School Diploma | 156,830 (69.8%) | 67,874 (30.2%) |
| College/Associate Degree | 121,407 (71.5%) | 48,335 (28.5%) |
| Bachelor's Degree or higher | 126,602 (81.1%) | 29,450 (18.9%) |
Occupancy by Age of Householder in Area Code 570
| Age Bracket | # Households | % Households |
| Under 35 Years | 88,862 | 14.8% |
| 35 to 44 Years | 85,017 | 14.2% |
| 45 to 54 Years | 105,172 | 17.5% |
| 55 to 64 Years | 127,425 | 21.3% |
| 65 to 74 Years | 110,126 | 18.4% |
| 75 to 84 Years | 57,531 | 9.6% |
| 85 Years and Over | 25,284 | 4.2% |
| Total | 599,417 | 100.0% |
Housing Finances in Area Code 570
Median Income by Occupancy in Area Code 570
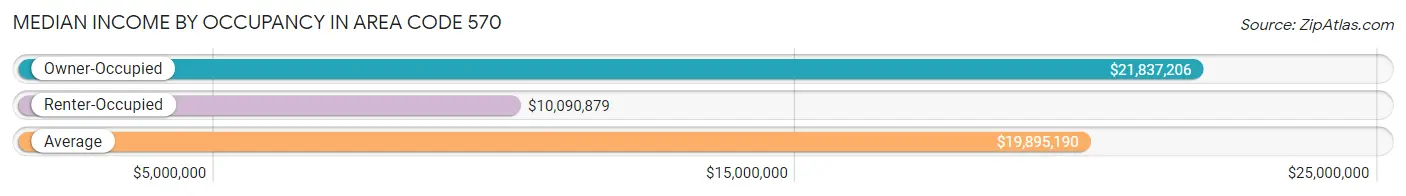
| Occupancy Type | # Households | Median Income |
| Owner-Occupied | 431,204 (71.9%) | $21,837,206 |
| Renter-Occupied | 168,213 (28.1%) | $10,090,879 |
| Average | 599,417 (100.0%) | $19,895,190 |
Occupancy by Householder Income Bracket in Area Code 570
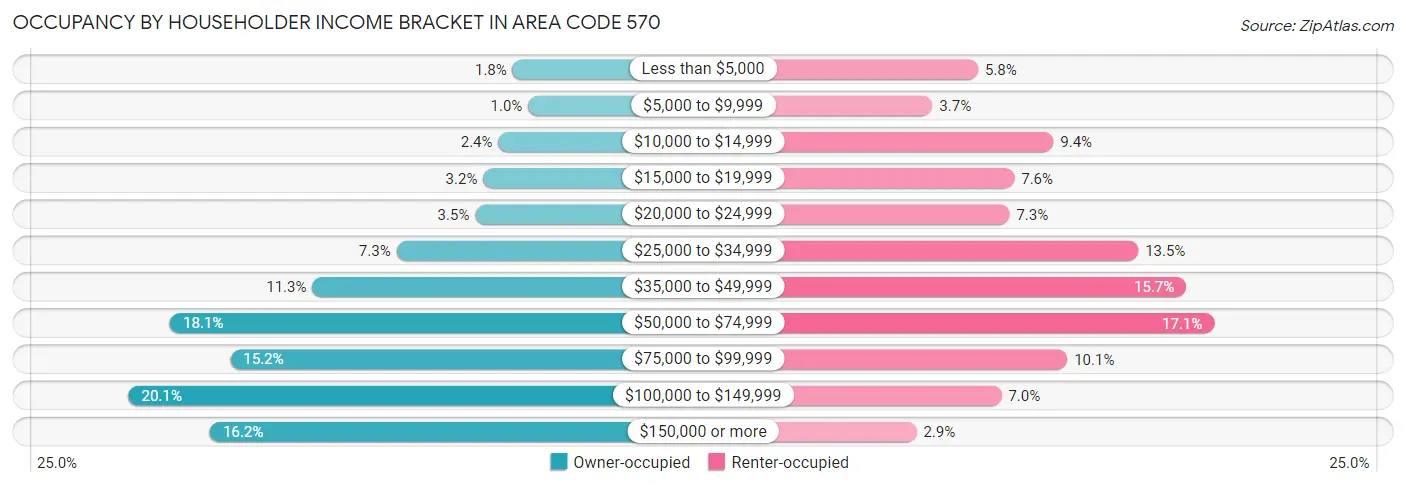
| Income Bracket | Owner-occupied | Renter-occupied |
| Less than $5,000 | 7,577 (1.8%) | 9,811 (5.8%) |
| $5,000 to $9,999 | 4,404 (1.0%) | 6,161 (3.7%) |
| $10,000 to $14,999 | 10,515 (2.4%) | 15,853 (9.4%) |
| $15,000 to $19,999 | 13,620 (3.2%) | 12,711 (7.6%) |
| $20,000 to $24,999 | 15,281 (3.5%) | 12,327 (7.3%) |
| $25,000 to $34,999 | 31,455 (7.3%) | 22,637 (13.5%) |
| $35,000 to $49,999 | 48,705 (11.3%) | 26,473 (15.7%) |
| $50,000 to $74,999 | 77,906 (18.1%) | 28,720 (17.1%) |
| $75,000 to $99,999 | 65,547 (15.2%) | 16,957 (10.1%) |
| $100,000 to $149,999 | 86,456 (20.1%) | 11,686 (7.0%) |
| $150,000 or more | 69,738 (16.2%) | 4,877 (2.9%) |
| Total | 431,204 (100.0%) | 168,213 (100.0%) |
Monthly Housing Cost Tiers in Area Code 570
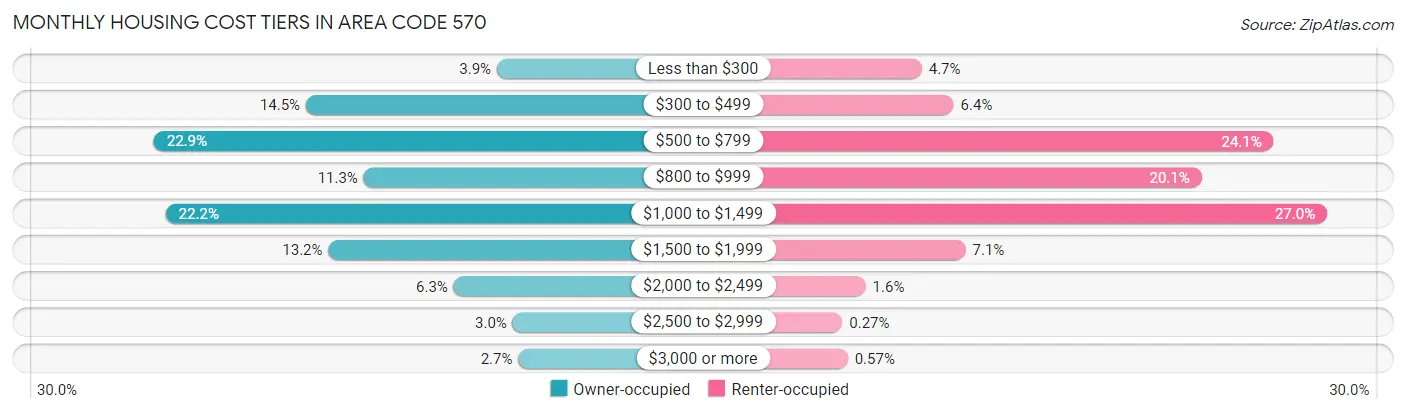
| Monthly Cost | Owner-occupied | Renter-occupied |
| Less than $300 | 16,855 (3.9%) | 7,844 (4.7%) |
| $300 to $499 | 62,354 (14.5%) | 10,801 (6.4%) |
| $500 to $799 | 98,580 (22.9%) | 40,517 (24.1%) |
| $800 to $999 | 48,610 (11.3%) | 33,828 (20.1%) |
| $1,000 to $1,499 | 95,749 (22.2%) | 45,479 (27.0%) |
| $1,500 to $1,999 | 57,008 (13.2%) | 11,914 (7.1%) |
| $2,000 to $2,499 | 27,179 (6.3%) | 2,626 (1.6%) |
| $2,500 to $2,999 | 13,112 (3.0%) | 452 (0.3%) |
| $3,000 or more | 11,757 (2.7%) | 962 (0.6%) |
| Total | 431,204 (100.0%) | 168,213 (100.0%) |
Physical Housing Characteristics in Area Code 570
Housing Structures in Area Code 570
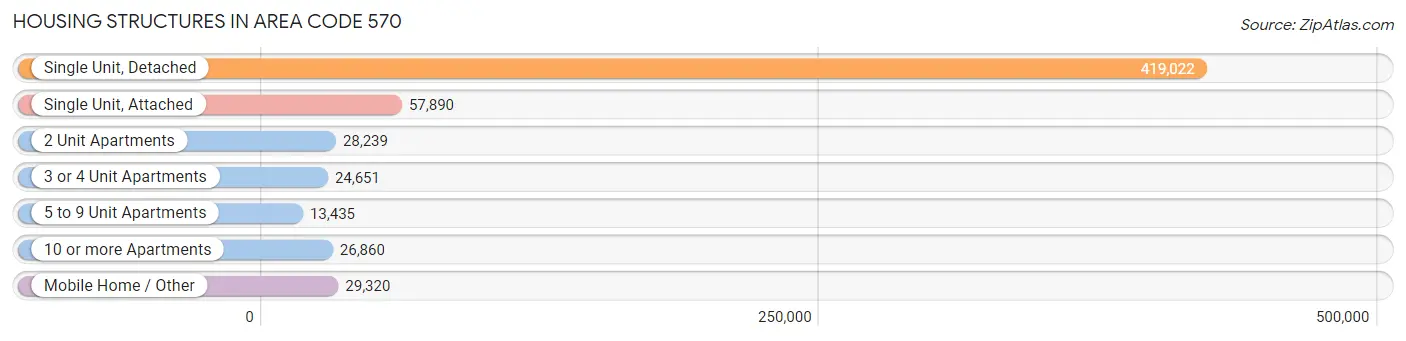
| Structure Type | # Housing Units | % Housing Units |
| Single Unit, Detached | 419,022 | 69.9% |
| Single Unit, Attached | 57,890 | 9.7% |
| 2 Unit Apartments | 28,239 | 4.7% |
| 3 or 4 Unit Apartments | 24,651 | 4.1% |
| 5 to 9 Unit Apartments | 13,435 | 2.2% |
| 10 or more Apartments | 26,860 | 4.5% |
| Mobile Home / Other | 29,320 | 4.9% |
| Total | 599,417 | 100.0% |
Housing Structures by Occupancy in Area Code 570
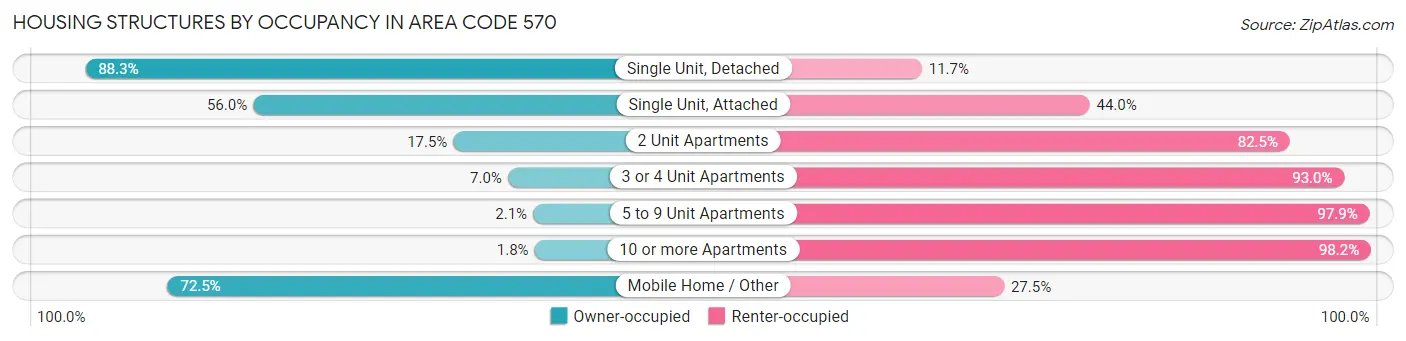
| Structure Type | Owner-occupied | Renter-occupied |
| Single Unit, Detached | 370,080 (88.3%) | 48,942 (11.7%) |
| Single Unit, Attached | 32,433 (56.0%) | 25,457 (44.0%) |
| 2 Unit Apartments | 4,935 (17.5%) | 23,304 (82.5%) |
| 3 or 4 Unit Apartments | 1,720 (7.0%) | 22,931 (93.0%) |
| 5 to 9 Unit Apartments | 286 (2.1%) | 13,149 (97.9%) |
| 10 or more Apartments | 493 (1.8%) | 26,367 (98.2%) |
| Mobile Home / Other | 21,257 (72.5%) | 8,063 (27.5%) |
| Total | 431,204 (71.9%) | 168,213 (28.1%) |
Housing Structures by Number of Rooms in Area Code 570
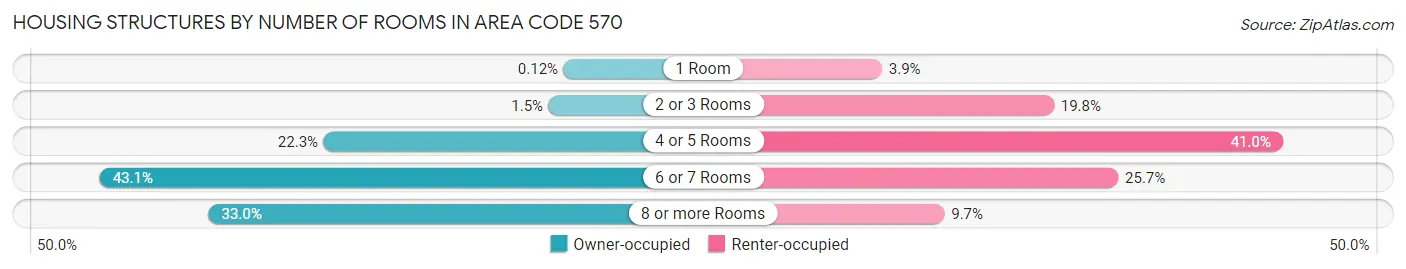
| Number of Rooms | Owner-occupied | Renter-occupied |
| 1 Room | 536 (0.1%) | 6,532 (3.9%) |
| 2 or 3 Rooms | 6,512 (1.5%) | 33,273 (19.8%) |
| 4 or 5 Rooms | 96,242 (22.3%) | 68,887 (40.9%) |
| 6 or 7 Rooms | 185,654 (43.0%) | 43,287 (25.7%) |
| 8 or more Rooms | 142,260 (33.0%) | 16,234 (9.7%) |
| Total | 431,204 (100.0%) | 168,213 (100.0%) |
Housing Structure by Heating Type in Area Code 570
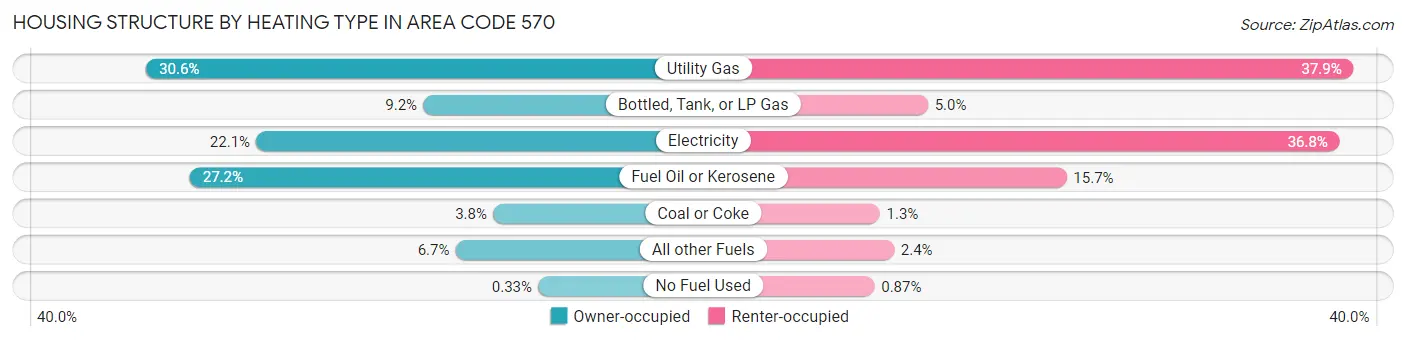
| Heating Type | Owner-occupied | Renter-occupied |
| Utility Gas | 131,958 (30.6%) | 63,765 (37.9%) |
| Bottled, Tank, or LP Gas | 39,698 (9.2%) | 8,403 (5.0%) |
| Electricity | 95,390 (22.1%) | 61,976 (36.8%) |
| Fuel Oil or Kerosene | 117,405 (27.2%) | 26,441 (15.7%) |
| Coal or Coke | 16,419 (3.8%) | 2,161 (1.3%) |
| All other Fuels | 28,928 (6.7%) | 4,008 (2.4%) |
| No Fuel Used | 1,406 (0.3%) | 1,459 (0.9%) |
| Total | 431,204 (100.0%) | 168,213 (100.0%) |
Household Vehicle Usage in Area Code 570
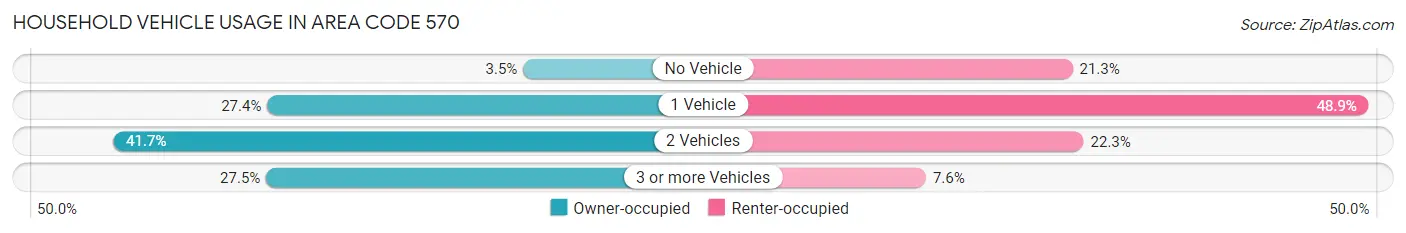
| Vehicles per Household | Owner-occupied | Renter-occupied |
| No Vehicle | 14,910 (3.5%) | 35,753 (21.2%) |
| 1 Vehicle | 117,951 (27.4%) | 82,235 (48.9%) |
| 2 Vehicles | 179,966 (41.7%) | 37,486 (22.3%) |
| 3 or more Vehicles | 118,377 (27.5%) | 12,739 (7.6%) |
| Total | 431,204 (100.0%) | 168,213 (100.0%) |
Real Estate & Mortgages in Area Code 570
Real Estate and Mortgage Overview in Area Code 570
| Characteristic | Without Mortgage | With Mortgage |
| Housing Units | 198,797 | 232,407 |
| Median Property Value | $49,321,500 | $54,449,000 |
| Median Household Income | $16,794,271 | $49,196 |
| Monthly Housing Costs | $167,724 | $11,338 |
| Real Estate Taxes | $665,086 | $2,757 |
Property Value by Mortgage Status in Area Code 570
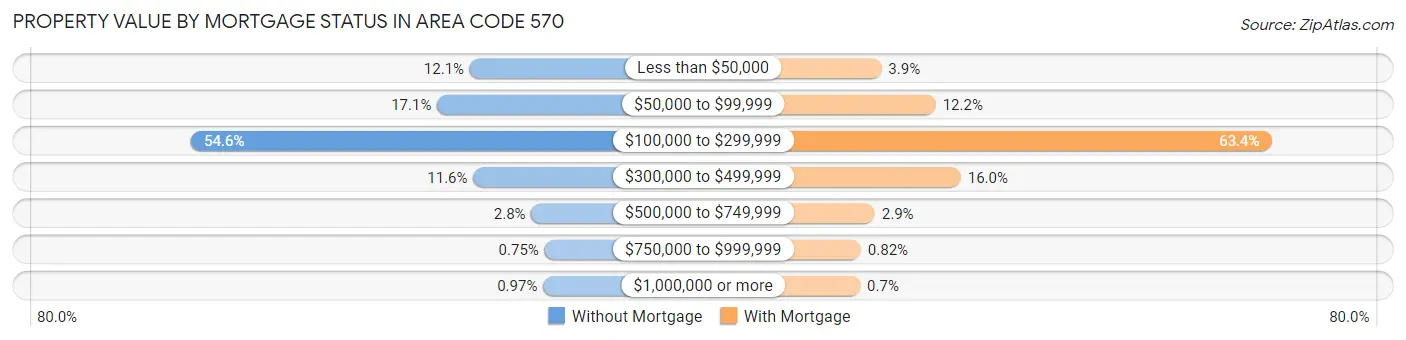
| Property Value | Without Mortgage | With Mortgage |
| Less than $50,000 | 24,129 (12.1%) | 9,158 (3.9%) |
| $50,000 to $99,999 | 34,025 (17.1%) | 28,402 (12.2%) |
| $100,000 to $299,999 | 108,606 (54.6%) | 147,226 (63.3%) |
| $300,000 to $499,999 | 23,107 (11.6%) | 37,272 (16.0%) |
| $500,000 to $749,999 | 5,513 (2.8%) | 6,822 (2.9%) |
| $750,000 to $999,999 | 1,489 (0.7%) | 1,906 (0.8%) |
| $1,000,000 or more | 1,928 (1.0%) | 1,621 (0.7%) |
| Total | 198,797 (100.0%) | 232,407 (100.0%) |
Household Income by Mortgage Status in Area Code 570
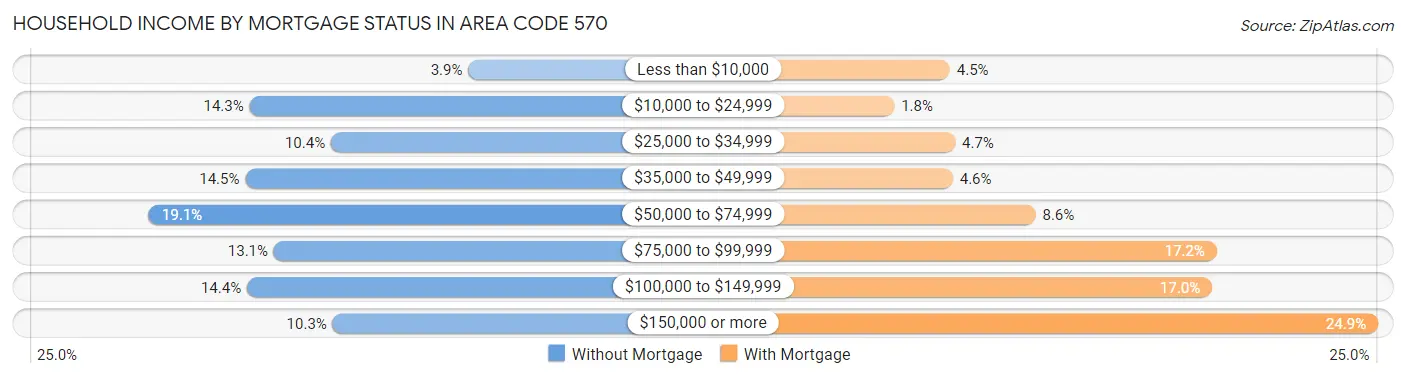
| Household Income | Without Mortgage | With Mortgage |
| Less than $10,000 | 7,701 (3.9%) | 10,439 (4.5%) |
| $10,000 to $24,999 | 28,402 (14.3%) | 4,280 (1.8%) |
| $25,000 to $34,999 | 20,699 (10.4%) | 11,014 (4.7%) |
| $35,000 to $49,999 | 28,799 (14.5%) | 10,756 (4.6%) |
| $50,000 to $74,999 | 37,922 (19.1%) | 19,906 (8.6%) |
| $75,000 to $99,999 | 26,094 (13.1%) | 39,984 (17.2%) |
| $100,000 to $149,999 | 28,638 (14.4%) | 39,453 (17.0%) |
| $150,000 or more | 20,542 (10.3%) | 57,818 (24.9%) |
| Total | 198,797 (100.0%) | 232,407 (100.0%) |
Property Value to Household Income Ratio in Area Code 570
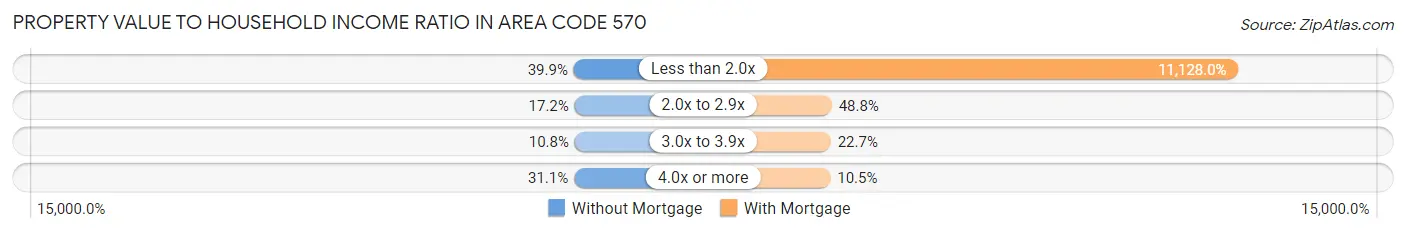
| Value-to-Income Ratio | Without Mortgage | With Mortgage |
| Less than 2.0x | 79,354 (39.9%) | 25,862,160 (11,128.0%) |
| 2.0x to 2.9x | 34,167 (17.2%) | 113,306 (48.7%) |
| 3.0x to 3.9x | 21,476 (10.8%) | 52,739 (22.7%) |
| 4.0x or more | 61,826 (31.1%) | 24,416 (10.5%) |
| Total | 198,797 (100.0%) | 232,407 (100.0%) |
Real Estate Taxes by Mortgage Status in Area Code 570
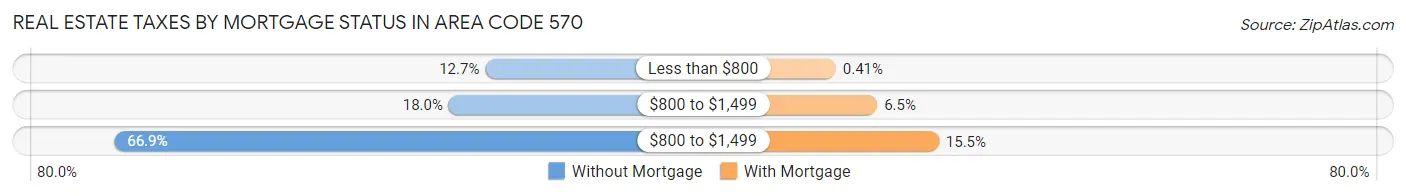
| Property Taxes | Without Mortgage | With Mortgage |
| Less than $800 | 25,227 (12.7%) | 961 (0.4%) |
| $800 to $1,499 | 35,820 (18.0%) | 14,982 (6.5%) |
| $800 to $1,499 | 132,983 (66.9%) | 35,938 (15.5%) |
| Total | 198,797 (100.0%) | 232,407 (100.0%) |
Health & Disability in Area Code 570
Health Insurance Coverage by Age in Area Code 570
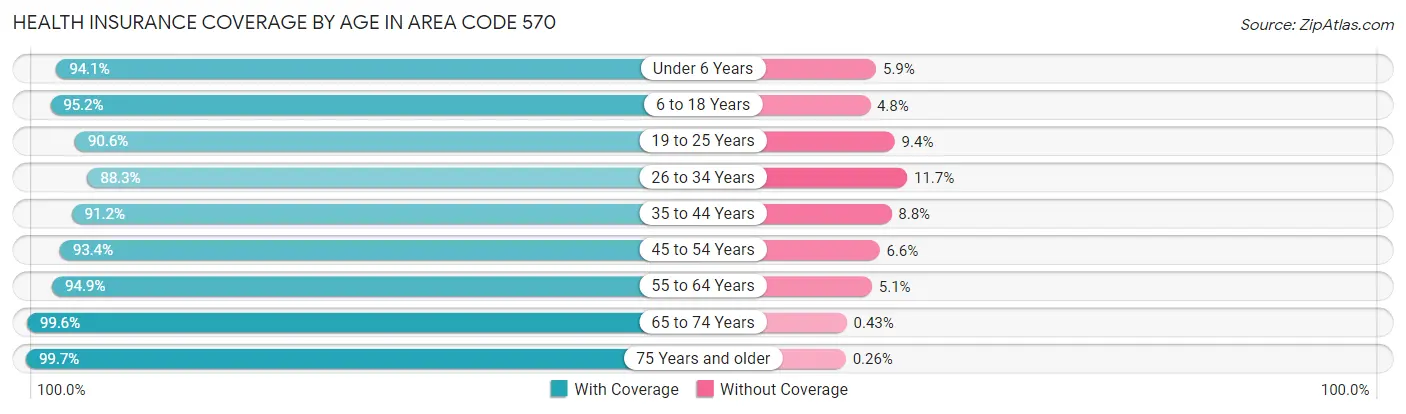
| Age Bracket | With Coverage | Without Coverage |
| Under 6 Years | 84,294 (94.1%) | 5,308 (5.9%) |
| 6 to 18 Years | 216,139 (95.2%) | 10,853 (4.8%) |
| 19 to 25 Years | 118,025 (90.6%) | 12,237 (9.4%) |
| 26 to 34 Years | 136,385 (88.3%) | 18,068 (11.7%) |
| 35 to 44 Years | 151,227 (91.2%) | 14,550 (8.8%) |
| 45 to 54 Years | 175,400 (93.4%) | 12,337 (6.6%) |
| 55 to 64 Years | 206,822 (94.9%) | 11,199 (5.1%) |
| 65 to 74 Years | 175,555 (99.6%) | 759 (0.4%) |
| 75 Years and older | 121,871 (99.7%) | 320 (0.3%) |
| Total | 1,385,718 (94.2%) | 85,631 (5.8%) |
Health Insurance Coverage by Citizenship Status in Area Code 570
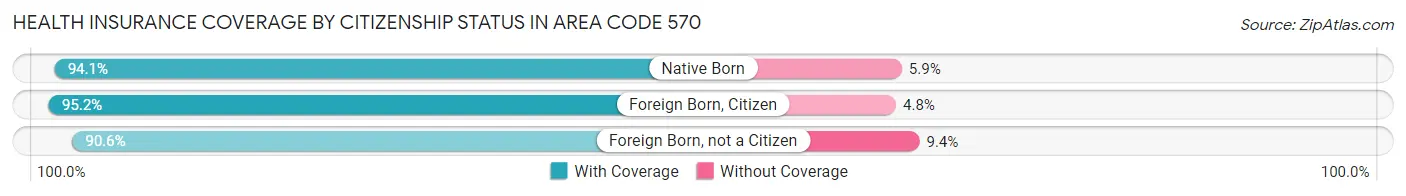
| Citizenship Status | With Coverage | Without Coverage |
| Native Born | 84,294 (94.1%) | 5,308 (5.9%) |
| Foreign Born, Citizen | 216,139 (95.2%) | 10,853 (4.8%) |
| Foreign Born, not a Citizen | 118,025 (90.6%) | 12,237 (9.4%) |
Health Insurance Coverage by Household Income in Area Code 570
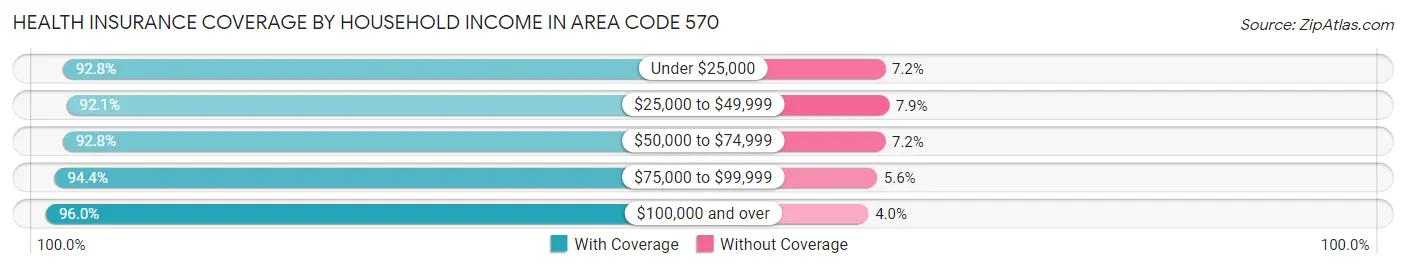
| Household Income | With Coverage | Without Coverage |
| Under $25,000 | 162,326 (92.8%) | 12,516 (7.2%) |
| $25,000 to $49,999 | 237,593 (92.1%) | 20,306 (7.9%) |
| $50,000 to $74,999 | 236,403 (92.8%) | 18,228 (7.2%) |
| $75,000 to $99,999 | 205,798 (94.4%) | 12,273 (5.6%) |
| $100,000 and over | 517,717 (96.0%) | 21,625 (4.0%) |
Public vs Private Health Insurance Coverage by Age in Area Code 570
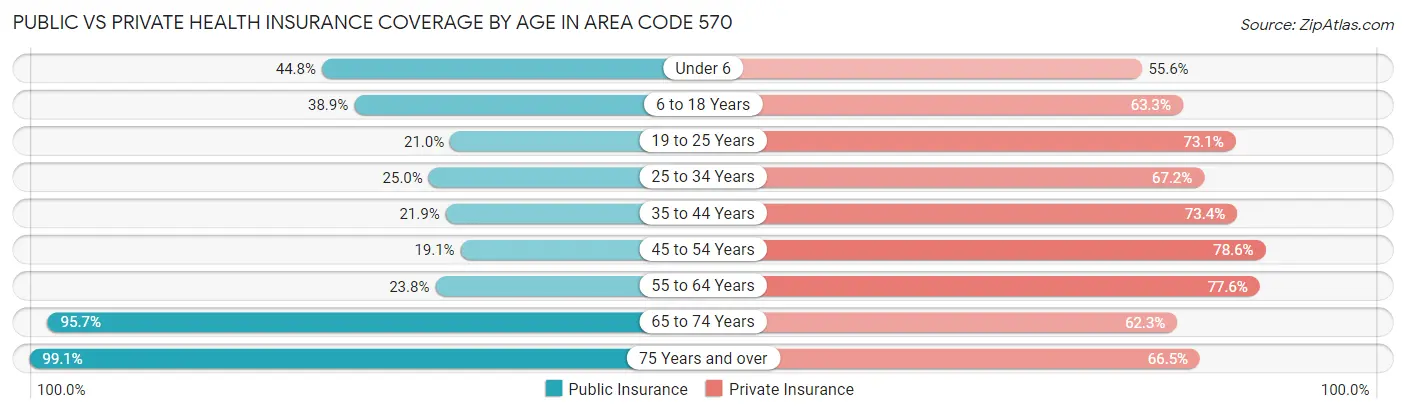
| Age Bracket | Public Insurance | Private Insurance |
| Under 6 | 40,178 (44.8%) | 49,836 (55.6%) |
| 6 to 18 Years | 88,178 (38.9%) | 143,630 (63.3%) |
| 19 to 25 Years | 27,397 (21.0%) | 95,190 (73.1%) |
| 25 to 34 Years | 38,623 (25.0%) | 103,852 (67.2%) |
| 35 to 44 Years | 36,264 (21.9%) | 121,592 (73.4%) |
| 45 to 54 Years | 35,849 (19.1%) | 147,600 (78.6%) |
| 55 to 64 Years | 51,839 (23.8%) | 169,105 (77.6%) |
| 65 to 74 Years | 168,776 (95.7%) | 109,747 (62.3%) |
| 75 Years and over | 121,109 (99.1%) | 81,205 (66.5%) |
| Total | 608,213 (41.3%) | 1,021,757 (69.4%) |
Disability Status by Sex by Age in Area Code 570
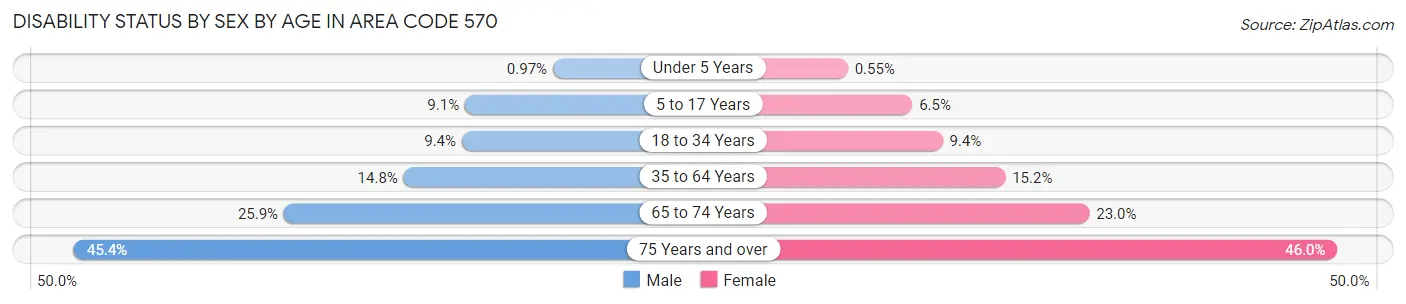
| Age Bracket | Male | Female |
| Under 5 Years | 366 (1.0%) | 199 (0.5%) |
| 5 to 17 Years | 10,392 (9.1%) | 7,011 (6.5%) |
| 18 to 34 Years | 14,800 (9.4%) | 13,964 (9.3%) |
| 35 to 64 Years | 42,477 (14.8%) | 43,210 (15.2%) |
| 65 to 74 Years | 22,112 (25.9%) | 20,909 (23.0%) |
| 75 Years and over | 23,179 (45.4%) | 32,728 (46.0%) |
Disability Class by Sex by Age in Area Code 570
Disability Class: Hearing Difficulty
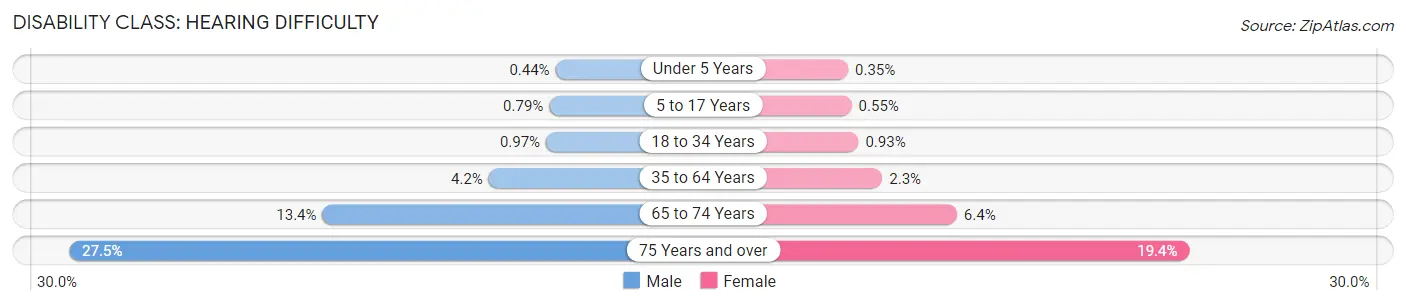
| Age Bracket | Male | Female |
| Under 5 Years | 166 (0.4%) | 126 (0.4%) |
| 5 to 17 Years | 899 (0.8%) | 590 (0.5%) |
| 18 to 34 Years | 1,524 (1.0%) | 1,384 (0.9%) |
| 35 to 64 Years | 11,939 (4.2%) | 6,426 (2.3%) |
| 65 to 74 Years | 11,447 (13.4%) | 5,832 (6.4%) |
| 75 Years and over | 14,044 (27.5%) | 13,773 (19.4%) |
Disability Class: Vision Difficulty
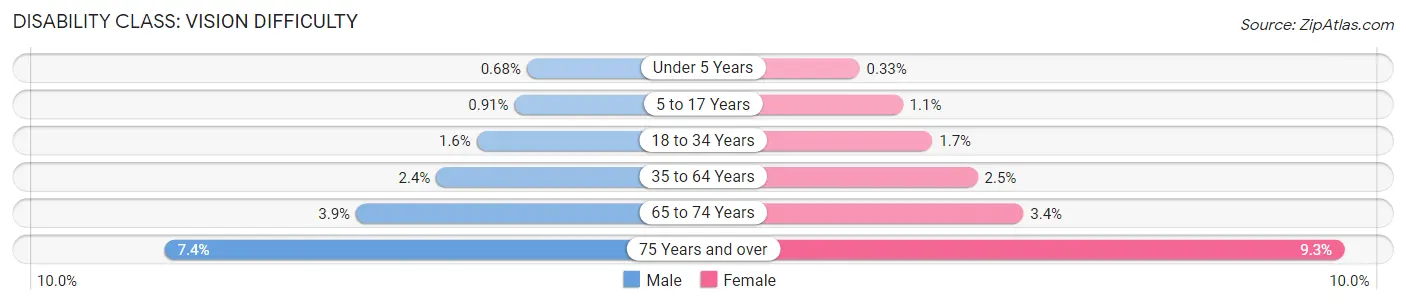
| Age Bracket | Male | Female |
| Under 5 Years | 256 (0.7%) | 121 (0.3%) |
| 5 to 17 Years | 1,032 (0.9%) | 1,216 (1.1%) |
| 18 to 34 Years | 2,531 (1.6%) | 2,514 (1.7%) |
| 35 to 64 Years | 6,765 (2.4%) | 7,185 (2.5%) |
| 65 to 74 Years | 3,283 (3.8%) | 3,070 (3.4%) |
| 75 Years and over | 3,776 (7.4%) | 6,634 (9.3%) |
Disability Class: Cognitive Difficulty
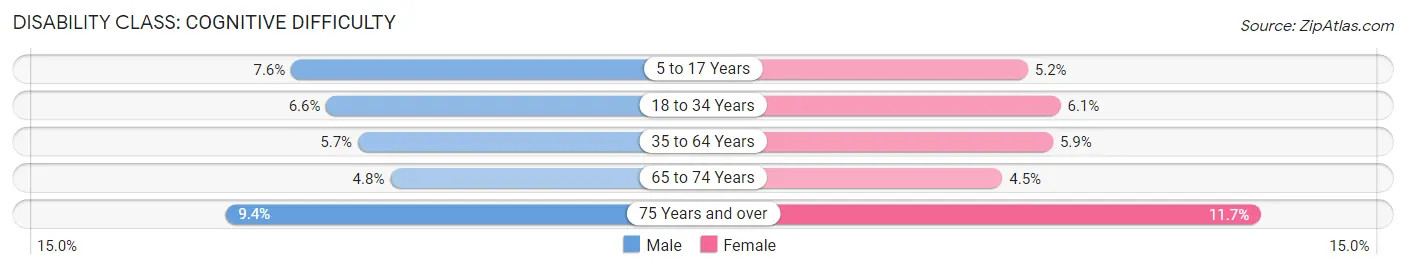
| Age Bracket | Male | Female |
| 5 to 17 Years | 8,630 (7.6%) | 5,552 (5.2%) |
| 18 to 34 Years | 10,367 (6.6%) | 9,096 (6.1%) |
| 35 to 64 Years | 16,412 (5.7%) | 16,748 (5.9%) |
| 65 to 74 Years | 4,107 (4.8%) | 4,069 (4.5%) |
| 75 Years and over | 4,803 (9.4%) | 8,302 (11.7%) |
Disability Class: Ambulatory Difficulty
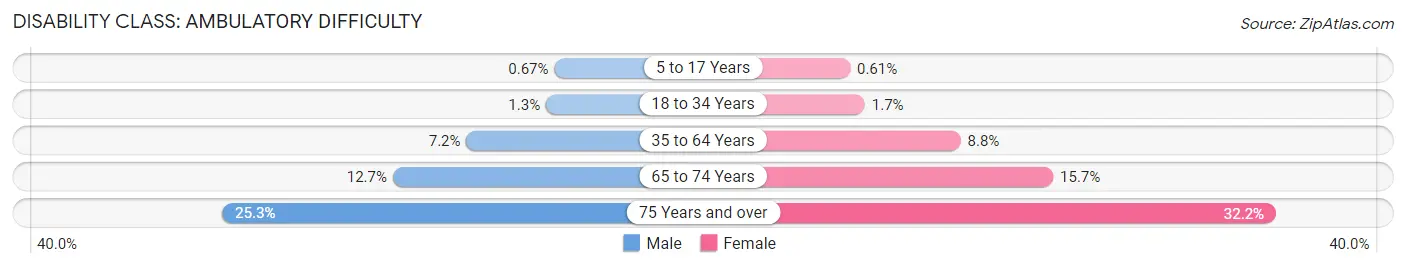
| Age Bracket | Male | Female |
| 5 to 17 Years | 759 (0.7%) | 655 (0.6%) |
| 18 to 34 Years | 2,018 (1.3%) | 2,555 (1.7%) |
| 35 to 64 Years | 20,647 (7.2%) | 25,126 (8.8%) |
| 65 to 74 Years | 10,800 (12.7%) | 14,284 (15.7%) |
| 75 Years and over | 12,924 (25.3%) | 22,935 (32.2%) |
Disability Class: Self-Care Difficulty
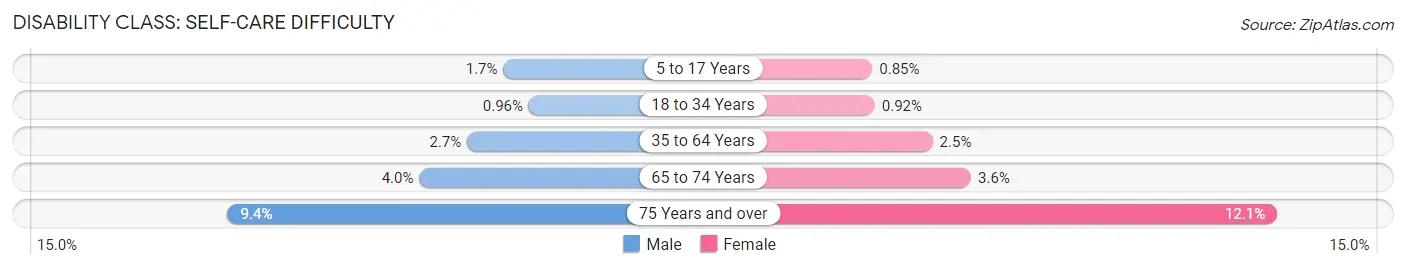
| Age Bracket | Male | Female |
| 5 to 17 Years | 1,900 (1.7%) | 915 (0.9%) |
| 18 to 34 Years | 1,514 (1.0%) | 1,378 (0.9%) |
| 35 to 64 Years | 7,691 (2.7%) | 7,208 (2.5%) |
| 65 to 74 Years | 3,418 (4.0%) | 3,281 (3.6%) |
| 75 Years and over | 4,773 (9.3%) | 8,622 (12.1%) |
Technology Access in Area Code 570
Computing Device Access in Area Code 570
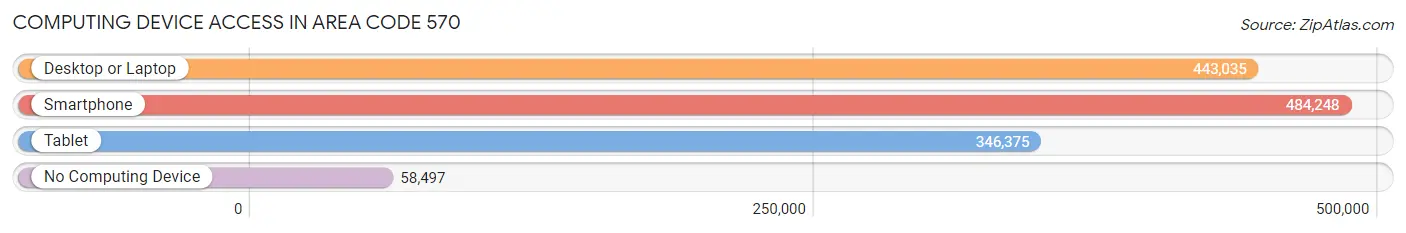
| Device Type | # Households | % Households |
| Desktop or Laptop | 443,035 | 73.9% |
| Smartphone | 484,248 | 80.8% |
| Tablet | 346,375 | 57.8% |
| No Computing Device | 58,497 | 9.8% |
| Total | 599,417 | 100.0% |
Internet Access in Area Code 570
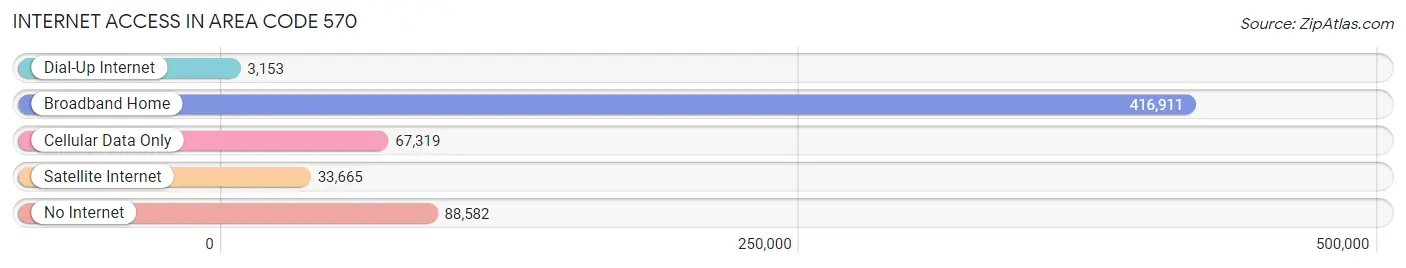
| Internet Type | # Households | % Households |
| Dial-Up Internet | 3,153 | 0.5% |
| Broadband Home | 416,911 | 69.6% |
| Cellular Data Only | 67,319 | 11.2% |
| Satellite Internet | 33,665 | 5.6% |
| No Internet | 88,582 | 14.8% |
| Total | 599,417 | 100.0% |
Area Code 570 Summary
Geography
Area code 570 is located in the northeastern part of Pennsylvania. It covers the Wilkes-Barre/Scranton metropolitan area, as well as parts of Carbon, Lackawanna, Luzerne, Monroe, Pike, Schuylkill, Susquehanna, Wayne, and Wyoming counties.
Social
Area code 570 is home to a diverse population of people from all walks of life. The area is known for its strong sense of community and friendly atmosphere. Residents enjoy a variety of outdoor activities, including hiking, camping, fishing, and skiing.
Economics
Area code 570 is home to a variety of businesses, including manufacturing, healthcare, retail, and tourism. The area is also home to several colleges and universities, providing educational opportunities for students.
Demographics
Area code 570 is home to a population of over 1.2 million people. The population is largely white, with a significant minority population. The median household income is slightly below the national average, and the poverty rate is slightly above the national average.
Common Questions
What is Per Capita Income in Area Code 570?
Per Capita income in Area Code 570 is $34,854.
What is the Median Family Income in Area Code 570?
Median Family Income in Area Code 570 is $80,626.
What is the Median Household income in Area Code 570?
Median Household Income in Area Code 570 is $66,539.
What is Income or Wage Gap in Area Code 570?
Income or Wage Gap in Area Code 570 is 33.7%.
Women in Area Code 570 earn 66.3 cents for every dollar earned by a man.
What is Family Income Deficit in Area Code 570?
Family Income Deficit in Area Code 570 is $10,462.
Families that are below poverty line in Area Code 570 earn $10,462 less on average than the poverty threshold level.
What is Inequality or Gini Index in Area Code 570?
Inequality or Gini Index in Area Code 570 is 127.20.
What is the Total Population of Area Code 570?
Total Population of Area Code 570 is 1,505,035.
What is the Total Male Population of Area Code 570?
Total Male Population of Area Code 570 is 754,183.
What is the Total Female Population of Area Code 570?
Total Female Population of Area Code 570 is 750,852.
What is the Ratio of Males per 100 Females in Area Code 570?
There are 100.44 Males per 100 Females in Area Code 570.
What is the Ratio of Females per 100 Males in Area Code 570?
There are 99.56 Females per 100 Males in Area Code 570.
What is the Median Population Age in Area Code 570?
Median Population Age in Area Code 570 is 46.2 Years.
What is the Average Family Size in Area Code 570
Average Family Size in Area Code 570 is 2.9 People.
What is the Average Household Size in Area Code 570
Average Household Size in Area Code 570 is 2.4 People.
How Large is the Labor Force in Area Code 570?
There are 723,084 People in the Labor Forcein in Area Code 570.
What is the Percentage of People in the Labor Force in Area Code 570?
58.0% of People are in the Labor Force in Area Code 570.
What is the Unemployment Rate in Area Code 570?
Unemployment Rate in Area Code 570 is 6.3%.