Altoona, PA Map & Demographics
Altoona Map
Altoona Overview
$29,320
PER CAPITA INCOME
$67,910
AVG FAMILY INCOME
$50,435
AVG HOUSEHOLD INCOME
27.4%
WAGE / INCOME GAP [ % ]
72.6¢/ $1
WAGE / INCOME GAP [ $ ]
$10,505
FAMILY INCOME DEFICIT
0.46
INEQUALITY / GINI INDEX
43,821
TOTAL POPULATION
21,376
MALE POPULATION
22,445
FEMALE POPULATION
95.24
MALES / 100 FEMALES
105.00
FEMALES / 100 MALES
39.7
MEDIAN AGE
3.0
AVG FAMILY SIZE
2.3
AVG HOUSEHOLD SIZE
20,807
LABOR FORCE [ PEOPLE ]
58.8%
PERCENT IN LABOR FORCE
6.0%
UNEMPLOYMENT RATE
Altoona Area Codes
Income in Altoona
Income Overview in Altoona
Per Capita Income in Altoona is $29,320, while median incomes of families and households are $67,910 and $50,435 respectively.
| Characteristic | Number | Measure |
| Per Capita Income | 43,821 | $29,320 |
| Median Family Income | 10,839 | $67,910 |
| Mean Family Income | 10,839 | $80,574 |
| Median Household Income | 18,418 | $50,435 |
| Mean Household Income | 18,418 | $68,001 |
| Income Deficit | 10,839 | $10,505 |
| Wage / Income Gap (%) | 43,821 | 27.39% |
| Wage / Income Gap ($) | 43,821 | 72.61¢ per $1 |
| Gini / Inequality Index | 43,821 | 0.46 |
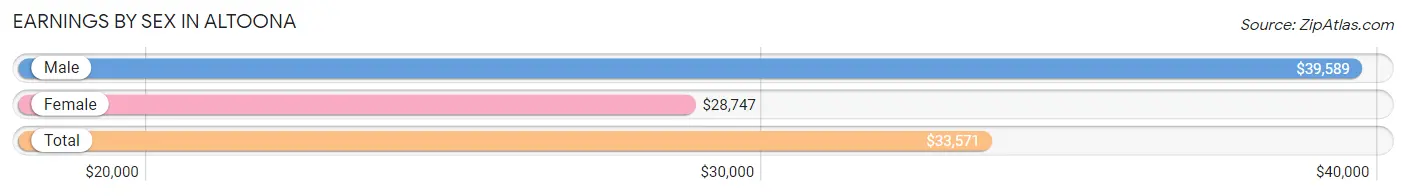
Earnings by Sex in Altoona
Average Earnings in Altoona are $33,571, $39,589 for men and $28,747 for women, a difference of 27.4%.
| Sex | Number | Average Earnings |
| Male | 10,950 (50.5%) | $39,589 |
| Female | 10,719 (49.5%) | $28,747 |
| Total | 21,669 (100.0%) | $33,571 |
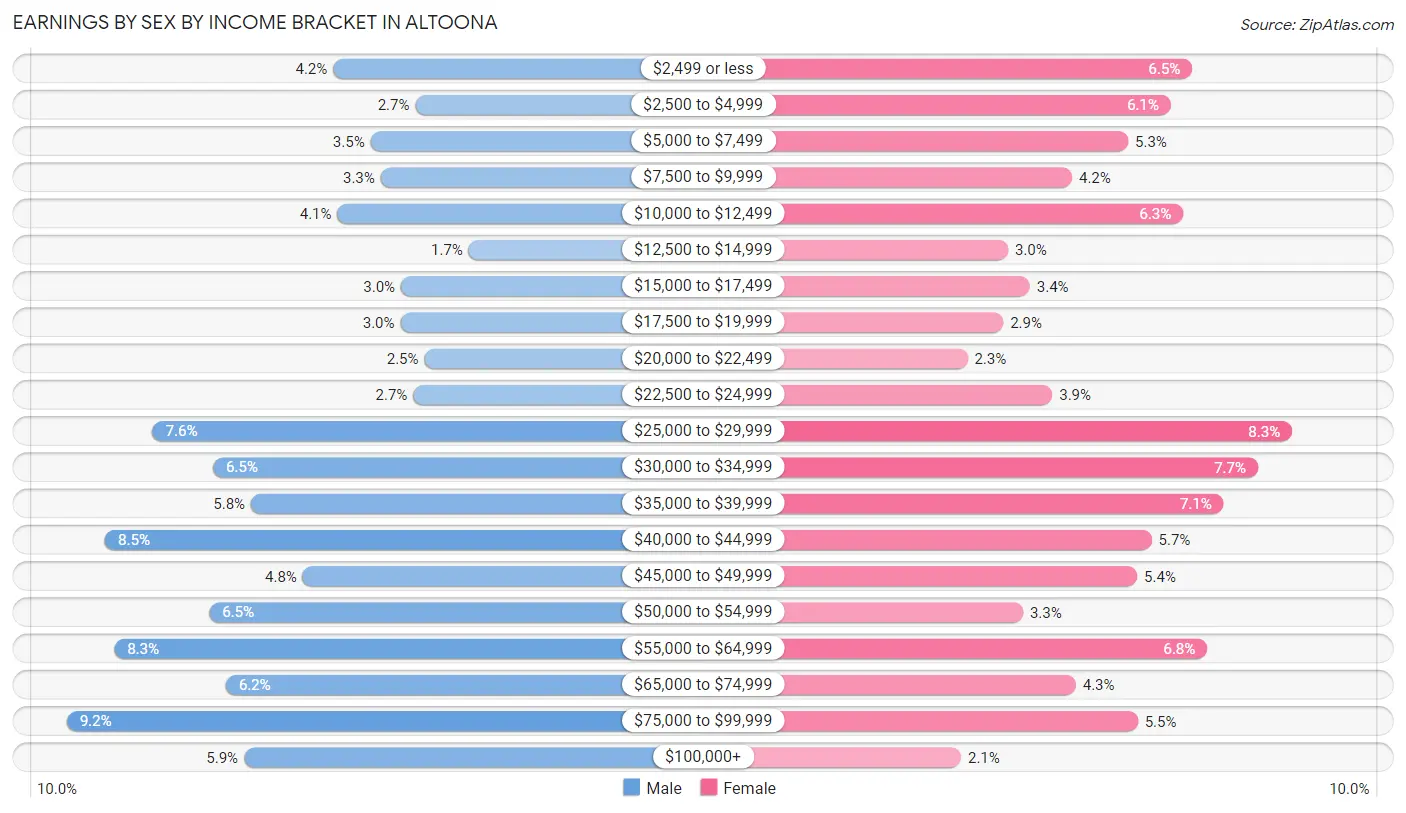
Earnings by Sex by Income Bracket in Altoona
The most common earnings brackets in Altoona are $75,000 to $99,999 for men (1,008 | 9.2%) and $25,000 to $29,999 for women (894 | 8.3%).
| Income | Male | Female |
| $2,499 or less | 462 (4.2%) | 693 (6.5%) |
| $2,500 to $4,999 | 293 (2.7%) | 651 (6.1%) |
| $5,000 to $7,499 | 385 (3.5%) | 565 (5.3%) |
| $7,500 to $9,999 | 365 (3.3%) | 452 (4.2%) |
| $10,000 to $12,499 | 453 (4.1%) | 675 (6.3%) |
| $12,500 to $14,999 | 184 (1.7%) | 324 (3.0%) |
| $15,000 to $17,499 | 323 (2.9%) | 368 (3.4%) |
| $17,500 to $19,999 | 324 (3.0%) | 314 (2.9%) |
| $20,000 to $22,499 | 275 (2.5%) | 242 (2.3%) |
| $22,500 to $24,999 | 298 (2.7%) | 413 (3.8%) |
| $25,000 to $29,999 | 832 (7.6%) | 894 (8.3%) |
| $30,000 to $34,999 | 708 (6.5%) | 825 (7.7%) |
| $35,000 to $39,999 | 631 (5.8%) | 757 (7.1%) |
| $40,000 to $44,999 | 930 (8.5%) | 612 (5.7%) |
| $45,000 to $49,999 | 525 (4.8%) | 583 (5.4%) |
| $50,000 to $54,999 | 716 (6.5%) | 354 (3.3%) |
| $55,000 to $64,999 | 911 (8.3%) | 724 (6.8%) |
| $65,000 to $74,999 | 682 (6.2%) | 460 (4.3%) |
| $75,000 to $99,999 | 1,008 (9.2%) | 584 (5.4%) |
| $100,000+ | 645 (5.9%) | 229 (2.1%) |
| Total | 10,950 (100.0%) | 10,719 (100.0%) |
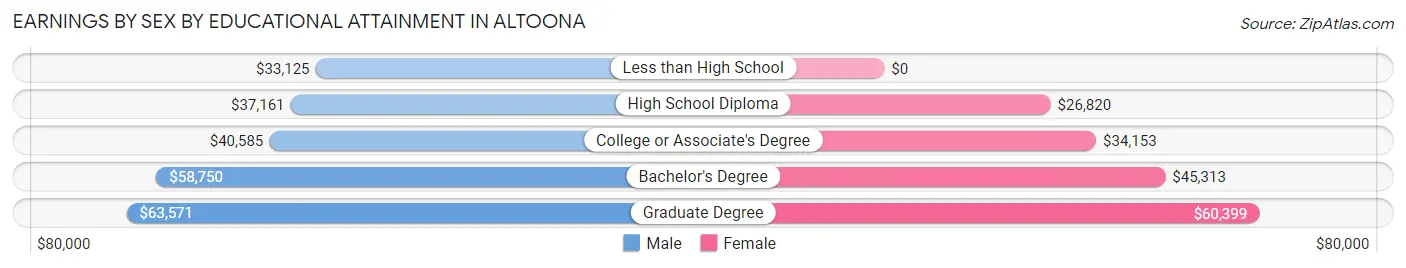
Earnings by Sex by Educational Attainment in Altoona
Average earnings in Altoona are $41,612 for men and $33,737 for women, a difference of 18.9%. Men with an educational attainment of graduate degree enjoy the highest average annual earnings of $63,571, while those with less than high school education earn the least with $33,125. Women with an educational attainment of graduate degree earn the most with the average annual earnings of $60,399, while those with high school diploma education have the smallest earnings of $26,820.
| Educational Attainment | Male Income | Female Income |
| Less than High School | $33,125 | $0 |
| High School Diploma | $37,161 | $26,820 |
| College or Associate's Degree | $40,585 | $34,153 |
| Bachelor's Degree | $58,750 | $45,313 |
| Graduate Degree | $63,571 | $60,399 |
| Total | $41,612 | $33,737 |
Family Income in Altoona
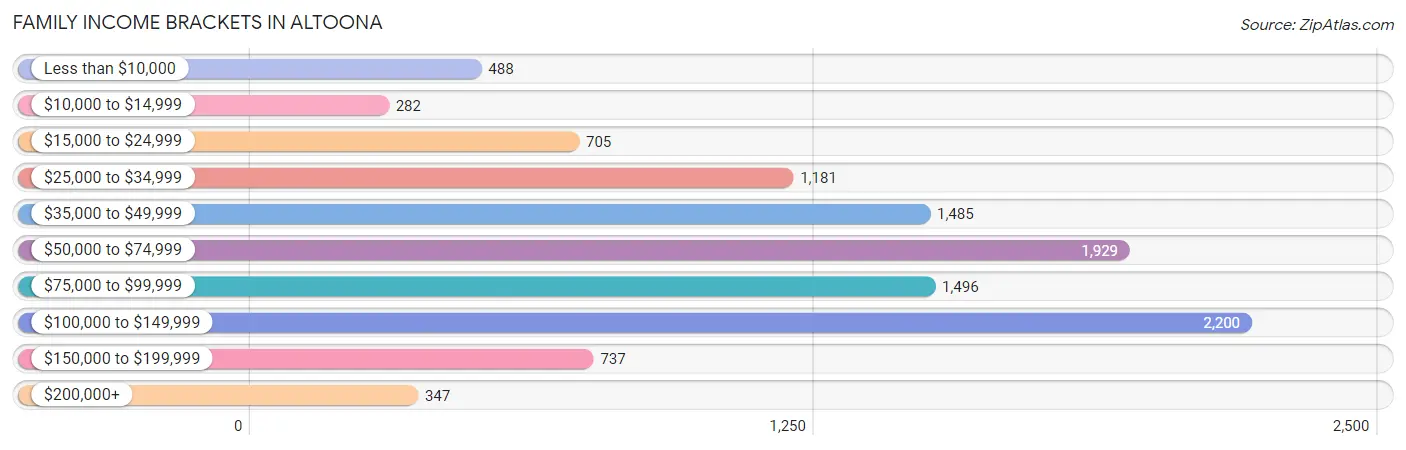
Family Income Brackets in Altoona
According to the Altoona family income data, there are 2,200 families falling into the $100,000 to $149,999 income range, which is the most common income bracket and makes up 20.3% of all families. Conversely, the $10,000 to $14,999 income bracket is the least frequent group with only 282 families (2.6%) belonging to this category.
| Income Bracket | # Families | % Families |
| Less than $10,000 | 488 | 4.5% |
| $10,000 to $14,999 | 282 | 2.6% |
| $15,000 to $24,999 | 705 | 6.5% |
| $25,000 to $34,999 | 1,181 | 10.9% |
| $35,000 to $49,999 | 1,485 | 13.7% |
| $50,000 to $74,999 | 1,929 | 17.8% |
| $75,000 to $99,999 | 1,496 | 13.8% |
| $100,000 to $149,999 | 2,200 | 20.3% |
| $150,000 to $199,999 | 737 | 6.8% |
| $200,000+ | 347 | 3.2% |
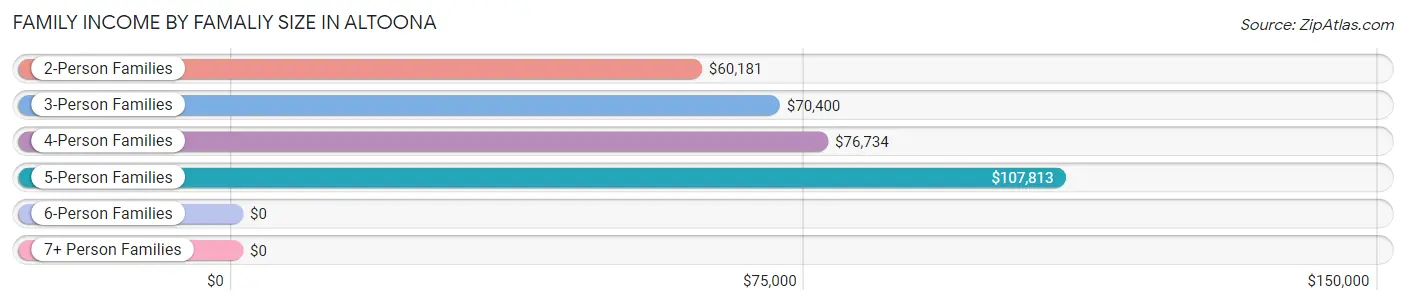
Family Income by Famaliy Size in Altoona
5-person families (665 | 6.1%) account for the highest median family income in Altoona with $107,813 per family, while 2-person families (5,312 | 49.0%) have the highest median income of $30,090 per family member.
| Income Bracket | # Families | Median Income |
| 2-Person Families | 5,312 (49.0%) | $60,181 |
| 3-Person Families | 2,816 (26.0%) | $70,400 |
| 4-Person Families | 1,695 (15.6%) | $76,734 |
| 5-Person Families | 665 (6.1%) | $107,813 |
| 6-Person Families | 191 (1.8%) | $0 |
| 7+ Person Families | 160 (1.5%) | $0 |
| Total | 10,839 (100.0%) | $67,910 |
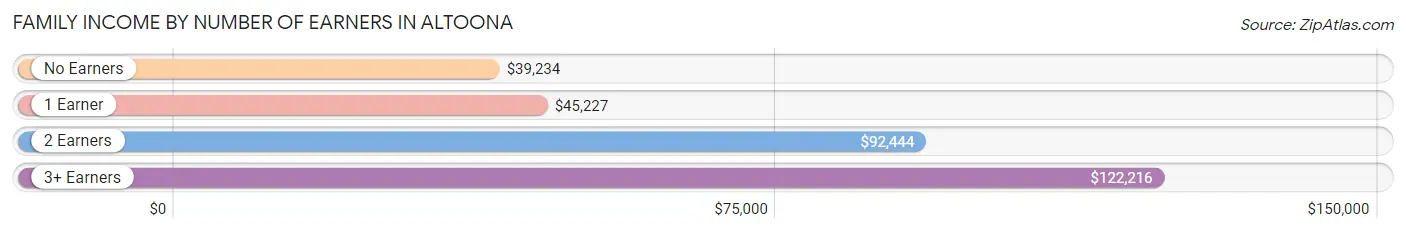
Family Income by Number of Earners in Altoona
The median family income in Altoona is $67,910, with families comprising 3+ earners (1,145) having the highest median family income of $122,216, while families with no earners (2,251) have the lowest median family income of $39,234, accounting for 10.6% and 20.8% of families, respectively.
| Number of Earners | # Families | Median Income |
| No Earners | 2,251 (20.8%) | $39,234 |
| 1 Earner | 3,520 (32.5%) | $45,227 |
| 2 Earners | 3,923 (36.2%) | $92,444 |
| 3+ Earners | 1,145 (10.6%) | $122,216 |
| Total | 10,839 (100.0%) | $67,910 |
Household Income in Altoona
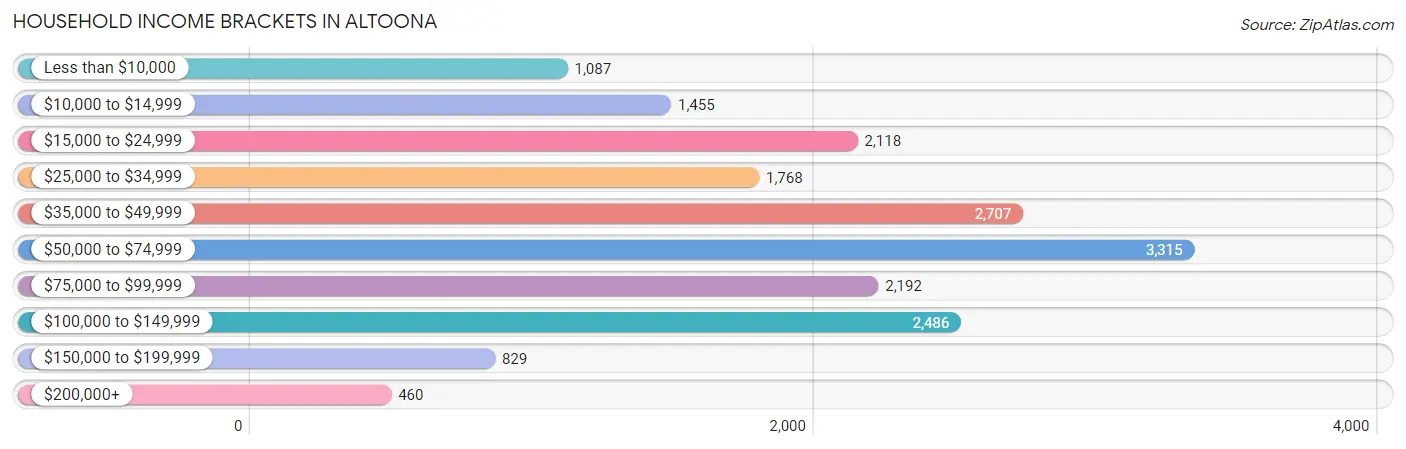
Household Income Brackets in Altoona
With 3,315 households falling in the category, the $50,000 to $74,999 income range is the most frequent in Altoona, accounting for 18.0% of all households. In contrast, only 460 households (2.5%) fall into the $200,000+ income bracket, making it the least populous group.
| Income Bracket | # Households | % Households |
| Less than $10,000 | 1,087 | 5.9% |
| $10,000 to $14,999 | 1,455 | 7.9% |
| $15,000 to $24,999 | 2,118 | 11.5% |
| $25,000 to $34,999 | 1,768 | 9.6% |
| $35,000 to $49,999 | 2,707 | 14.7% |
| $50,000 to $74,999 | 3,315 | 18.0% |
| $75,000 to $99,999 | 2,192 | 11.9% |
| $100,000 to $149,999 | 2,486 | 13.5% |
| $150,000 to $199,999 | 829 | 4.5% |
| $200,000+ | 460 | 2.5% |
Household Income by Householder Age in Altoona
The median household income in Altoona is $50,435, with the highest median household income of $57,144 found in the 25 to 44 years age bracket for the primary householder. A total of 5,737 households (31.1%) fall into this category. Meanwhile, the 15 to 24 years age bracket for the primary householder has the lowest median household income of $22,370, with 681 households (3.7%) in this group.
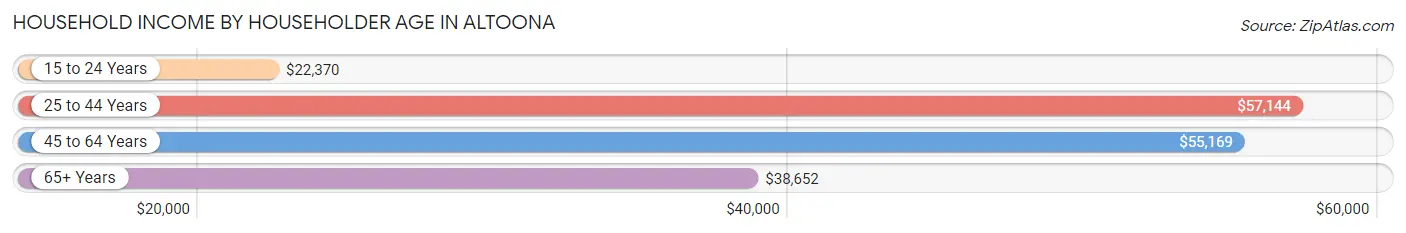
| Income Bracket | # Households | Median Income |
| 15 to 24 Years | 681 (3.7%) | $22,370 |
| 25 to 44 Years | 5,737 (31.1%) | $57,144 |
| 45 to 64 Years | 6,812 (37.0%) | $55,169 |
| 65+ Years | 5,188 (28.2%) | $38,652 |
| Total | 18,418 (100.0%) | $50,435 |
Poverty in Altoona
Income Below Poverty by Sex and Age in Altoona
With 17.7% poverty level for males and 20.8% for females among the residents of Altoona, under 5 year old males and under 5 year old females are the most vulnerable to poverty, with 447 males (37.0%) and 539 females (40.1%) in their respective age groups living below the poverty level.
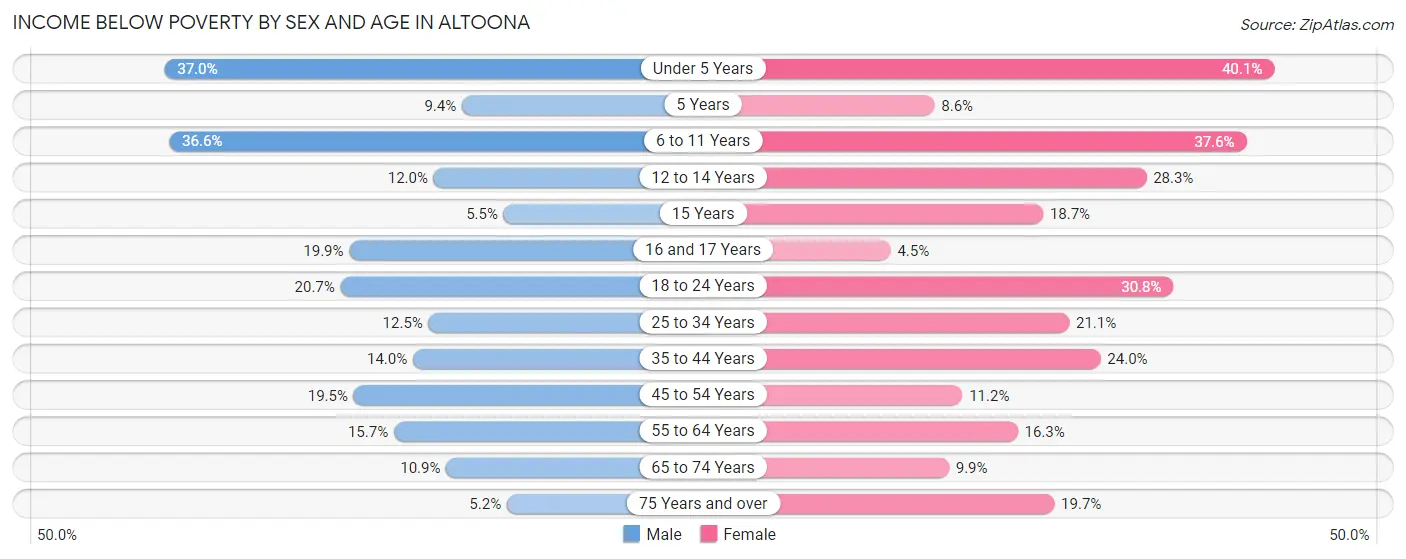
| Age Bracket | Male | Female |
| Under 5 Years | 447 (37.0%) | 539 (40.1%) |
| 5 Years | 11 (9.4%) | 25 (8.6%) |
| 6 to 11 Years | 669 (36.6%) | 513 (37.6%) |
| 12 to 14 Years | 98 (12.0%) | 224 (28.2%) |
| 15 Years | 13 (5.5%) | 45 (18.7%) |
| 16 and 17 Years | 114 (19.9%) | 23 (4.5%) |
| 18 to 24 Years | 329 (20.7%) | 579 (30.8%) |
| 25 to 34 Years | 384 (12.5%) | 621 (21.1%) |
| 35 to 44 Years | 341 (14.0%) | 624 (24.0%) |
| 45 to 54 Years | 569 (19.5%) | 317 (11.2%) |
| 55 to 64 Years | 465 (15.7%) | 470 (16.3%) |
| 65 to 74 Years | 198 (10.9%) | 249 (9.9%) |
| 75 Years and over | 72 (5.2%) | 315 (19.7%) |
| Total | 3,710 (17.7%) | 4,544 (20.8%) |
Income Above Poverty by Sex and Age in Altoona
According to the poverty statistics in Altoona, males aged 75 years and over and females aged 16 and 17 years are the age groups that are most secure financially, with 94.8% of males and 95.5% of females in these age groups living above the poverty line.
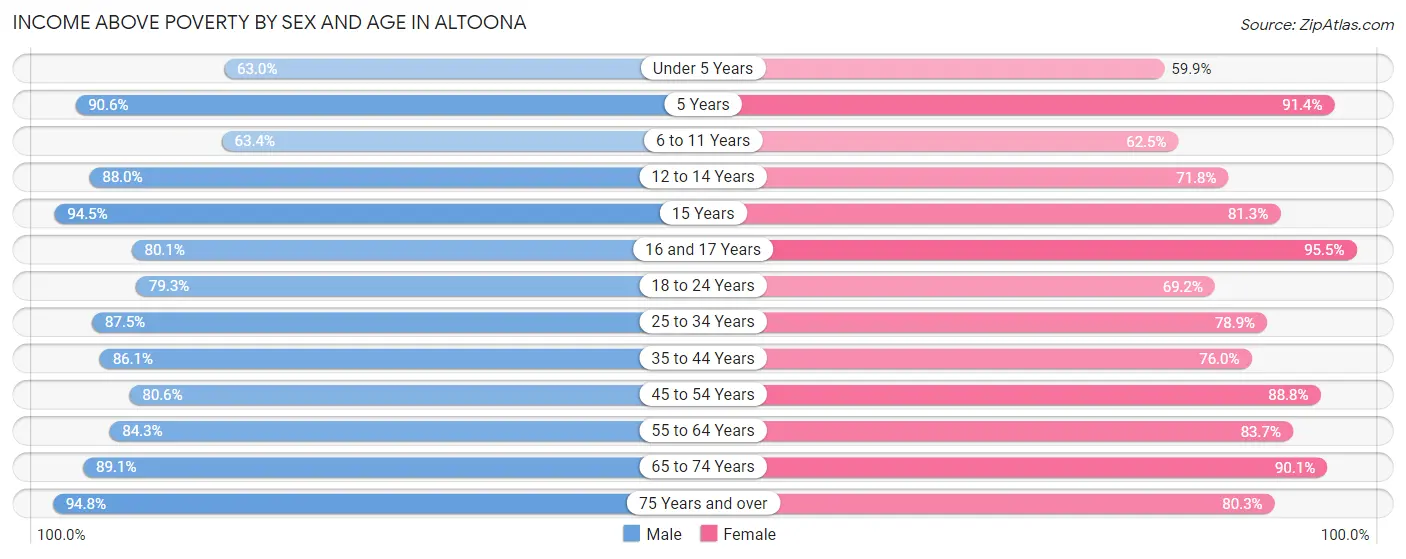
| Age Bracket | Male | Female |
| Under 5 Years | 760 (63.0%) | 804 (59.9%) |
| 5 Years | 106 (90.6%) | 266 (91.4%) |
| 6 to 11 Years | 1,160 (63.4%) | 853 (62.5%) |
| 12 to 14 Years | 717 (88.0%) | 569 (71.8%) |
| 15 Years | 222 (94.5%) | 196 (81.3%) |
| 16 and 17 Years | 460 (80.1%) | 486 (95.5%) |
| 18 to 24 Years | 1,263 (79.3%) | 1,303 (69.2%) |
| 25 to 34 Years | 2,688 (87.5%) | 2,324 (78.9%) |
| 35 to 44 Years | 2,103 (86.1%) | 1,976 (76.0%) |
| 45 to 54 Years | 2,357 (80.5%) | 2,518 (88.8%) |
| 55 to 64 Years | 2,493 (84.3%) | 2,411 (83.7%) |
| 65 to 74 Years | 1,625 (89.1%) | 2,258 (90.1%) |
| 75 Years and over | 1,305 (94.8%) | 1,283 (80.3%) |
| Total | 17,259 (82.3%) | 17,247 (79.1%) |
Income Below Poverty Among Married-Couple Families in Altoona
The poverty statistics for married-couple families in Altoona show that 5.2% or 366 of the total 7,005 families live below the poverty line. Families with 5 or more children have the highest poverty rate of 53.5%, comprising of 54 families. On the other hand, families with no children have the lowest poverty rate of 3.1%, which includes 139 families.
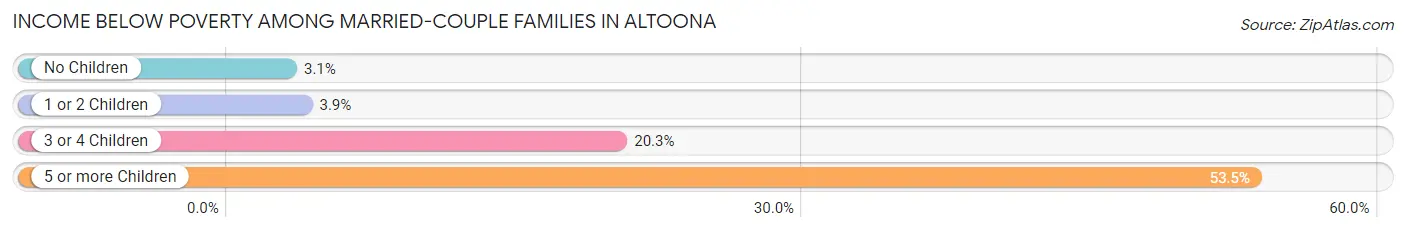
| Children | Above Poverty | Below Poverty |
| No Children | 4,378 (96.9%) | 139 (3.1%) |
| 1 or 2 Children | 1,826 (96.1%) | 74 (3.9%) |
| 3 or 4 Children | 388 (79.7%) | 99 (20.3%) |
| 5 or more Children | 47 (46.5%) | 54 (53.5%) |
| Total | 6,639 (94.8%) | 366 (5.2%) |
Income Below Poverty Among Single-Parent Households in Altoona
According to the poverty data in Altoona, 18.7% or 203 single-father households and 33.3% or 915 single-mother households are living below the poverty line. Among single-father households, those with 1 or 2 children have the highest poverty rate, with 178 households (30.8%) experiencing poverty. Likewise, among single-mother households, those with 3 or 4 children have the highest poverty rate, with 214 households (56.2%) falling below the poverty line.
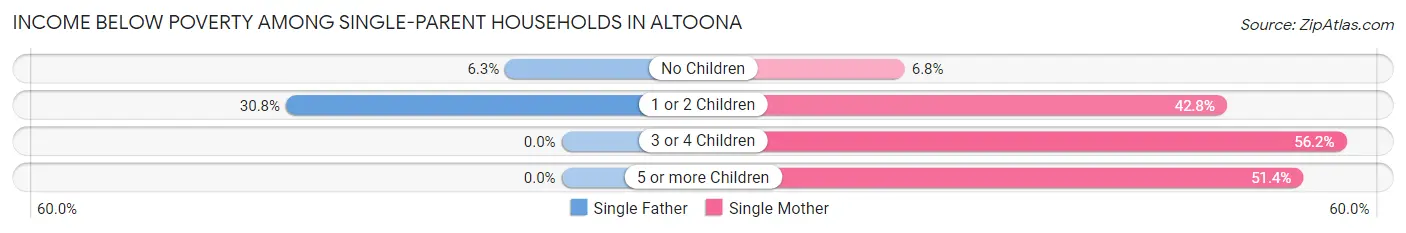
| Children | Single Father | Single Mother |
| No Children | 25 (6.3%) | 60 (6.8%) |
| 1 or 2 Children | 178 (30.8%) | 622 (42.8%) |
| 3 or 4 Children | 0 (0.0%) | 214 (56.2%) |
| 5 or more Children | 0 (0.0%) | 19 (51.3%) |
| Total | 203 (18.7%) | 915 (33.3%) |
Income Below Poverty Among Married-Couple vs Single-Parent Households in Altoona
The poverty data for Altoona shows that 366 of the married-couple family households (5.2%) and 1,118 of the single-parent households (29.2%) are living below the poverty level. Within the married-couple family households, those with 5 or more children have the highest poverty rate, with 54 households (53.5%) falling below the poverty line. Among the single-parent households, those with 5 or more children have the highest poverty rate, with 19 household (51.3%) living below poverty.
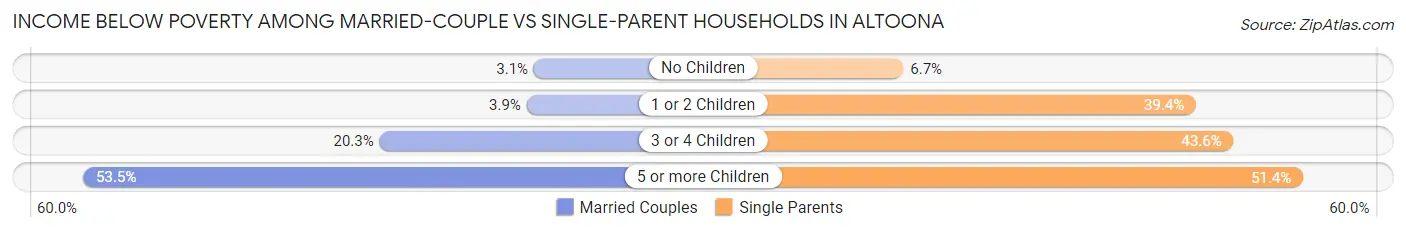
| Children | Married-Couple Families | Single-Parent Households |
| No Children | 139 (3.1%) | 85 (6.7%) |
| 1 or 2 Children | 74 (3.9%) | 800 (39.4%) |
| 3 or 4 Children | 99 (20.3%) | 214 (43.6%) |
| 5 or more Children | 54 (53.5%) | 19 (51.3%) |
| Total | 366 (5.2%) | 1,118 (29.2%) |
Race in Altoona
The most populous races in Altoona are White / Caucasian (39,850 | 90.9%), Two or more Races (2,076 | 4.7%), and Black / African American (1,461 | 3.3%).
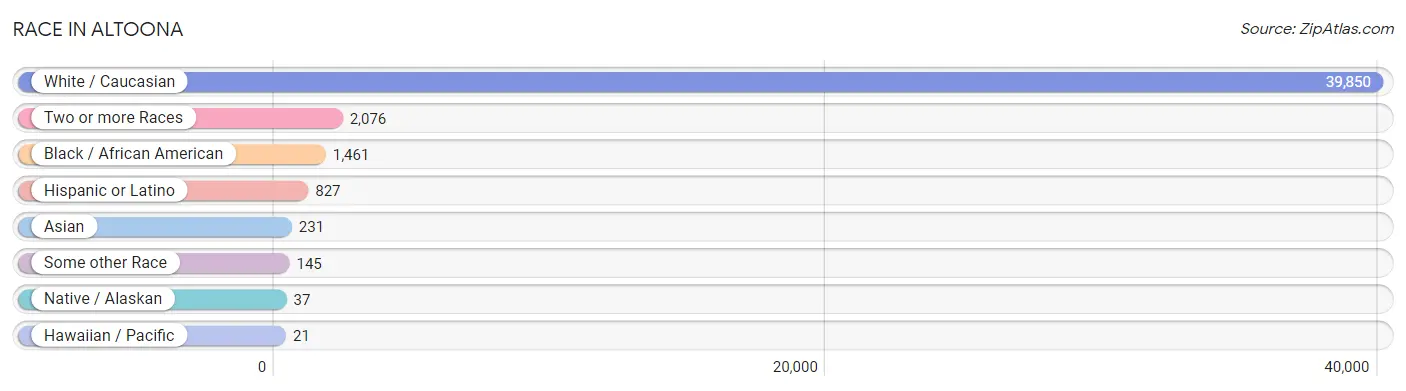
| Race | # Population | % Population |
| Asian | 231 | 0.5% |
| Black / African American | 1,461 | 3.3% |
| Hawaiian / Pacific | 21 | 0.1% |
| Hispanic or Latino | 827 | 1.9% |
| Native / Alaskan | 37 | 0.1% |
| White / Caucasian | 39,850 | 90.9% |
| Two or more Races | 2,076 | 4.7% |
| Some other Race | 145 | 0.3% |
| Total | 43,821 | 100.0% |
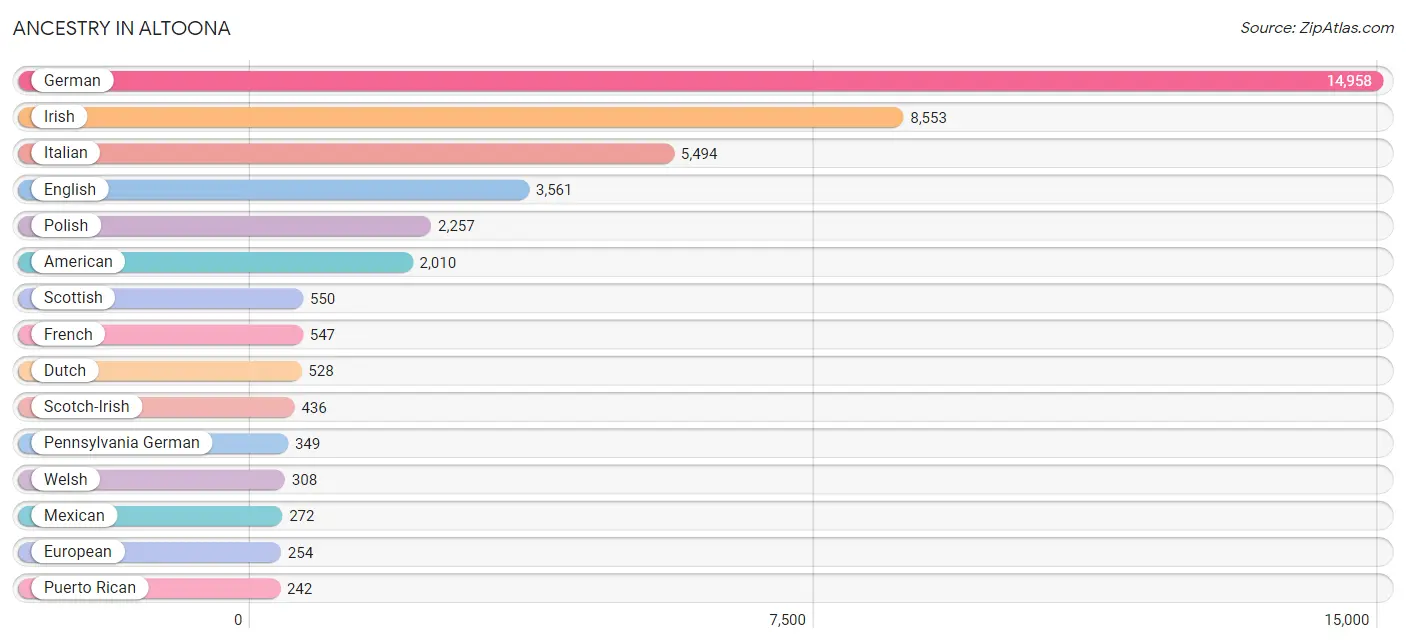
Ancestry in Altoona
The most populous ancestries reported in Altoona are German (14,958 | 34.1%), Irish (8,553 | 19.5%), Italian (5,494 | 12.5%), English (3,561 | 8.1%), and Polish (2,257 | 5.1%), together accounting for 79.5% of all Altoona residents.
| Ancestry | # Population | % Population |
| African | 27 | 0.1% |
| Albanian | 15 | 0.0% |
| American | 2,010 | 4.6% |
| Arab | 57 | 0.1% |
| Armenian | 13 | 0.0% |
| Austrian | 157 | 0.4% |
| Bhutanese | 9 | 0.0% |
| Brazilian | 38 | 0.1% |
| British | 145 | 0.3% |
| Bulgarian | 16 | 0.0% |
| Burmese | 50 | 0.1% |
| Canadian | 174 | 0.4% |
| Central American | 75 | 0.2% |
| Cherokee | 34 | 0.1% |
| Chilean | 5 | 0.0% |
| Chippewa | 22 | 0.1% |
| Croatian | 73 | 0.2% |
| Cuban | 103 | 0.2% |
| Czech | 69 | 0.2% |
| Czechoslovakian | 24 | 0.1% |
| Danish | 11 | 0.0% |
| Dominican | 87 | 0.2% |
| Dutch | 528 | 1.2% |
| Eastern European | 129 | 0.3% |
| Ecuadorian | 7 | 0.0% |
| English | 3,561 | 8.1% |
| Ethiopian | 20 | 0.1% |
| European | 254 | 0.6% |
| French | 547 | 1.3% |
| French Canadian | 111 | 0.3% |
| German | 14,958 | 34.1% |
| Greek | 76 | 0.2% |
| Guamanian / Chamorro | 12 | 0.0% |
| Haitian | 5 | 0.0% |
| Hungarian | 200 | 0.5% |
| Indian (Asian) | 34 | 0.1% |
| Irish | 8,553 | 19.5% |
| Iroquois | 5 | 0.0% |
| Italian | 5,494 | 12.5% |
| Jamaican | 7 | 0.0% |
| Japanese | 96 | 0.2% |
| Korean | 153 | 0.4% |
| Lebanese | 18 | 0.0% |
| Lithuanian | 141 | 0.3% |
| Mexican | 272 | 0.6% |
| Native Hawaiian | 10 | 0.0% |
| Nigerian | 21 | 0.1% |
| Northern European | 7 | 0.0% |
| Norwegian | 80 | 0.2% |
| Pakistani | 1 | 0.0% |
| Palestinian | 6 | 0.0% |
| Panamanian | 75 | 0.2% |
| Pennsylvania German | 349 | 0.8% |
| Polish | 2,257 | 5.1% |
| Portuguese | 66 | 0.2% |
| Puerto Rican | 242 | 0.5% |
| Puget Sound Salish | 11 | 0.0% |
| Romanian | 6 | 0.0% |
| Russian | 214 | 0.5% |
| Scandinavian | 53 | 0.1% |
| Scotch-Irish | 436 | 1.0% |
| Scottish | 550 | 1.3% |
| Serbian | 4 | 0.0% |
| Sioux | 6 | 0.0% |
| Slavic | 9 | 0.0% |
| Slovak | 242 | 0.5% |
| Slovene | 6 | 0.0% |
| South American | 12 | 0.0% |
| South American Indian | 5 | 0.0% |
| Spaniard | 7 | 0.0% |
| Spanish | 24 | 0.1% |
| Subsaharan African | 68 | 0.2% |
| Swedish | 172 | 0.4% |
| Swiss | 122 | 0.3% |
| Syrian | 12 | 0.0% |
| Thai | 46 | 0.1% |
| Turkish | 8 | 0.0% |
| Ukrainian | 115 | 0.3% |
| Welsh | 308 | 0.7% |
| West Indian | 1 | 0.0% | View All 80 Rows |
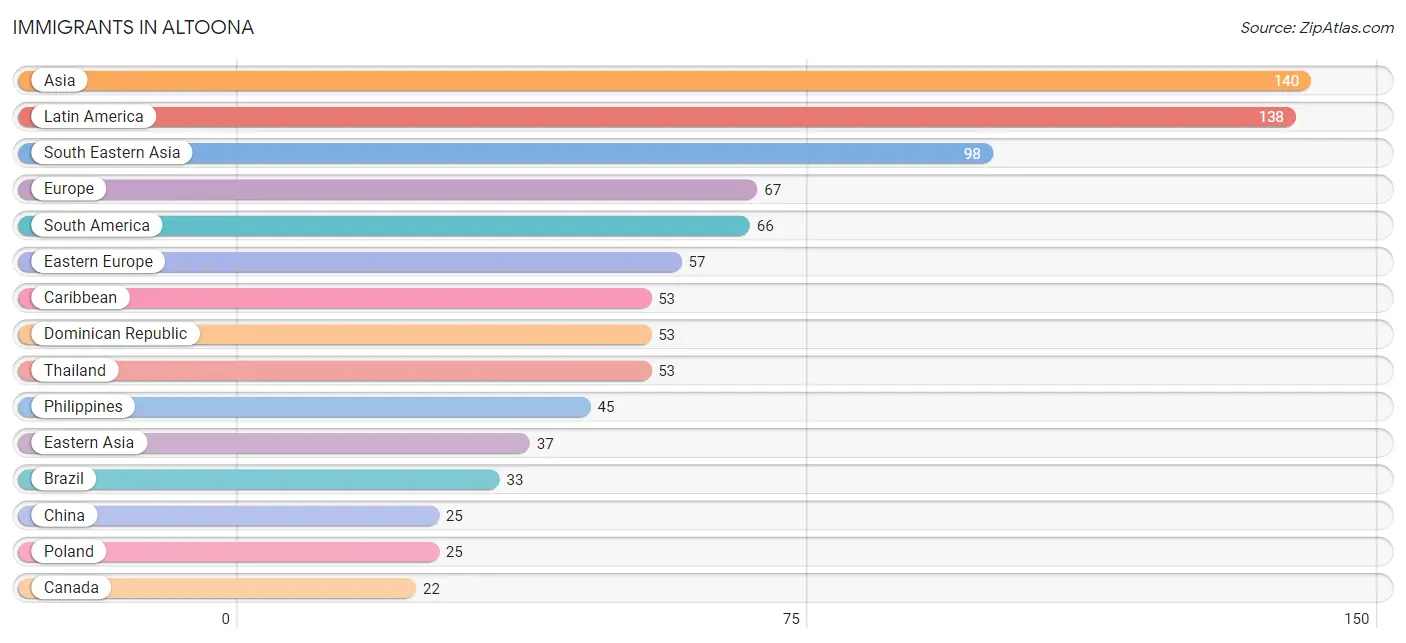
Immigrants in Altoona
The most numerous immigrant groups reported in Altoona came from Asia (140 | 0.3%), Latin America (138 | 0.3%), South Eastern Asia (98 | 0.2%), Europe (67 | 0.2%), and South America (66 | 0.2%), together accounting for 1.1% of all Altoona residents.
| Immigration Origin | # Population | % Population |
| Africa | 20 | 0.1% |
| Albania | 10 | 0.0% |
| Asia | 140 | 0.3% |
| Brazil | 33 | 0.1% |
| Canada | 22 | 0.1% |
| Caribbean | 53 | 0.1% |
| Central America | 19 | 0.0% |
| China | 25 | 0.1% |
| Colombia | 6 | 0.0% |
| Dominican Republic | 53 | 0.1% |
| Eastern Africa | 20 | 0.1% |
| Eastern Asia | 37 | 0.1% |
| Eastern Europe | 57 | 0.1% |
| Ecuador | 7 | 0.0% |
| Eritrea | 20 | 0.1% |
| Europe | 67 | 0.2% |
| Germany | 5 | 0.0% |
| Guyana | 15 | 0.0% |
| Japan | 12 | 0.0% |
| Latin America | 138 | 0.3% |
| Mexico | 12 | 0.0% |
| Northern Europe | 5 | 0.0% |
| Pakistan | 5 | 0.0% |
| Panama | 7 | 0.0% |
| Philippines | 45 | 0.1% |
| Poland | 25 | 0.1% |
| Russia | 22 | 0.1% |
| South America | 66 | 0.2% |
| South Central Asia | 5 | 0.0% |
| South Eastern Asia | 98 | 0.2% |
| Sweden | 5 | 0.0% |
| Taiwan | 8 | 0.0% |
| Thailand | 53 | 0.1% |
| Western Europe | 5 | 0.0% | View All 34 Rows |
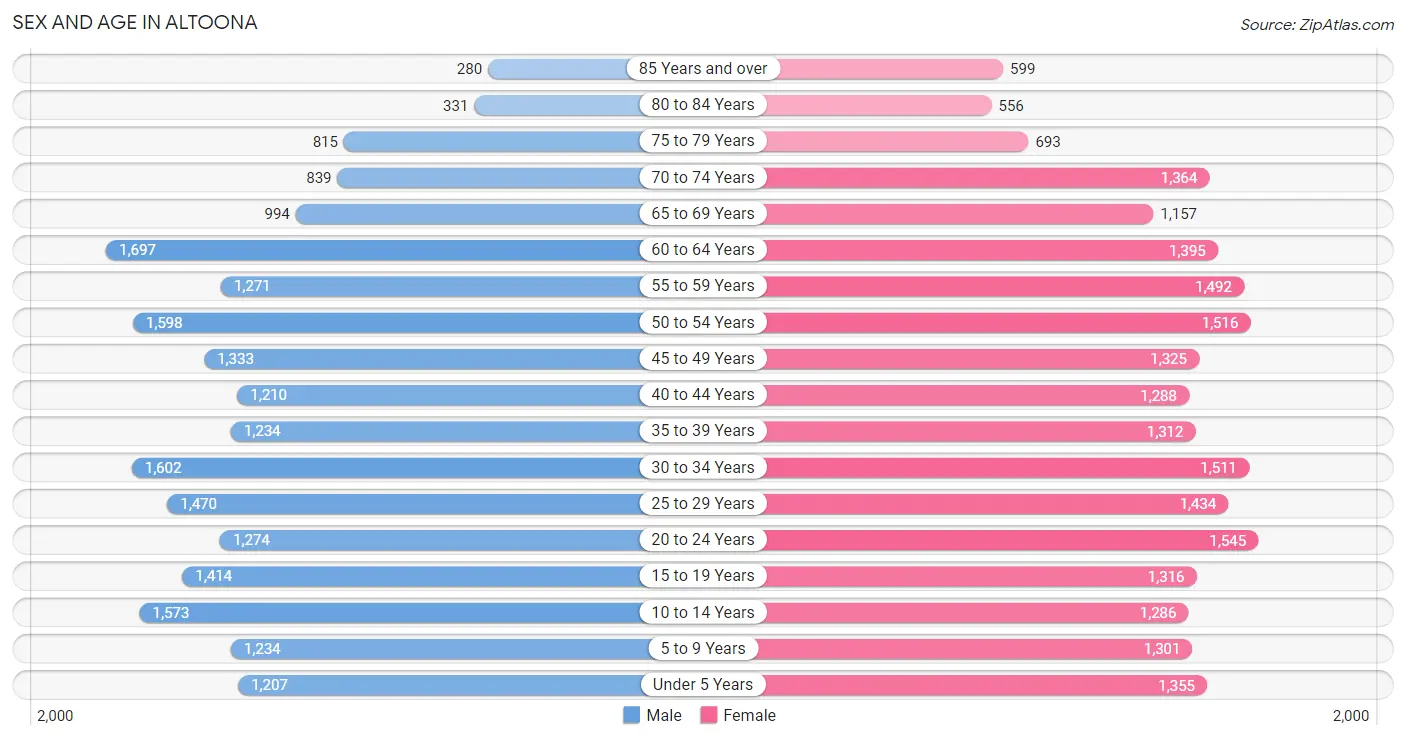
Sex and Age in Altoona
Sex and Age in Altoona
The most populous age groups in Altoona are 60 to 64 Years (1,697 | 7.9%) for men and 20 to 24 Years (1,545 | 6.9%) for women.
| Age Bracket | Male | Female |
| Under 5 Years | 1,207 (5.7%) | 1,355 (6.0%) |
| 5 to 9 Years | 1,234 (5.8%) | 1,301 (5.8%) |
| 10 to 14 Years | 1,573 (7.4%) | 1,286 (5.7%) |
| 15 to 19 Years | 1,414 (6.6%) | 1,316 (5.9%) |
| 20 to 24 Years | 1,274 (6.0%) | 1,545 (6.9%) |
| 25 to 29 Years | 1,470 (6.9%) | 1,434 (6.4%) |
| 30 to 34 Years | 1,602 (7.5%) | 1,511 (6.7%) |
| 35 to 39 Years | 1,234 (5.8%) | 1,312 (5.9%) |
| 40 to 44 Years | 1,210 (5.7%) | 1,288 (5.7%) |
| 45 to 49 Years | 1,333 (6.2%) | 1,325 (5.9%) |
| 50 to 54 Years | 1,598 (7.5%) | 1,516 (6.8%) |
| 55 to 59 Years | 1,271 (5.9%) | 1,492 (6.7%) |
| 60 to 64 Years | 1,697 (7.9%) | 1,395 (6.2%) |
| 65 to 69 Years | 994 (4.6%) | 1,157 (5.1%) |
| 70 to 74 Years | 839 (3.9%) | 1,364 (6.1%) |
| 75 to 79 Years | 815 (3.8%) | 693 (3.1%) |
| 80 to 84 Years | 331 (1.5%) | 556 (2.5%) |
| 85 Years and over | 280 (1.3%) | 599 (2.7%) |
| Total | 21,376 (100.0%) | 22,445 (100.0%) |
Families and Households in Altoona
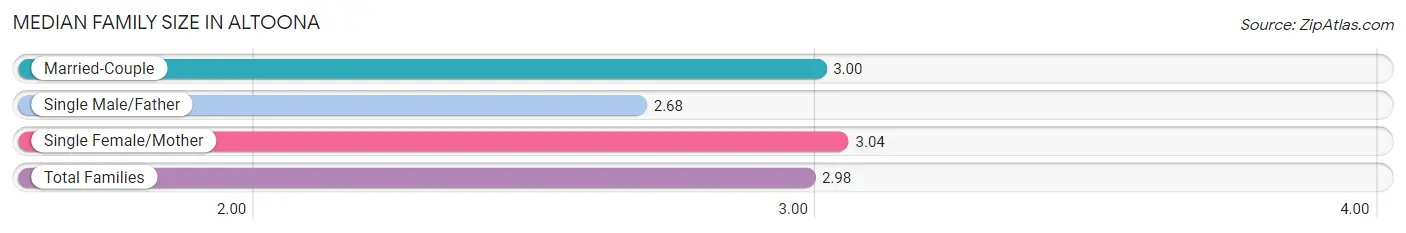
Median Family Size in Altoona
The median family size in Altoona is 2.98 persons per family, with single female/mother families (2,750 | 25.4%) accounting for the largest median family size of 3.04 persons per family. On the other hand, single male/father families (1,084 | 10.0%) represent the smallest median family size with 2.68 persons per family.
| Family Type | # Families | Family Size |
| Married-Couple | 7,005 (64.6%) | 3.00 |
| Single Male/Father | 1,084 (10.0%) | 2.68 |
| Single Female/Mother | 2,750 (25.4%) | 3.04 |
| Total Families | 10,839 (100.0%) | 2.98 |
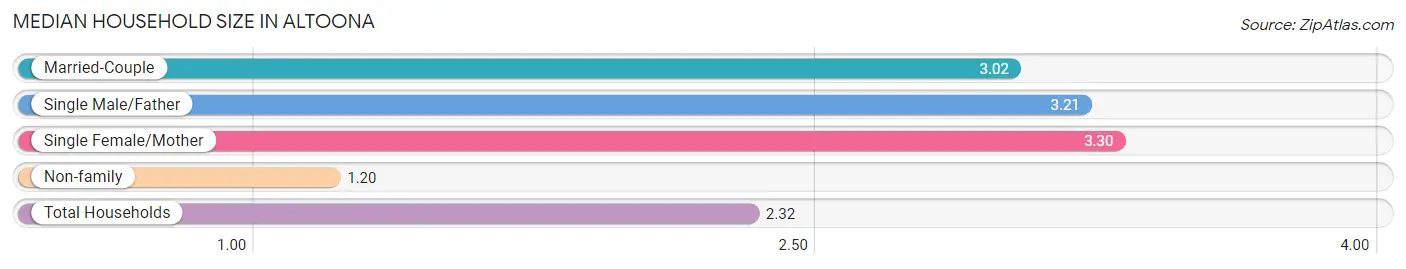
Median Household Size in Altoona
The median household size in Altoona is 2.32 persons per household, with single female/mother households (2,750 | 14.9%) accounting for the largest median household size of 3.3 persons per household. non-family households (7,579 | 41.1%) represent the smallest median household size with 1.20 persons per household.
| Household Type | # Households | Household Size |
| Married-Couple | 7,005 (38.0%) | 3.02 |
| Single Male/Father | 1,084 (5.9%) | 3.21 |
| Single Female/Mother | 2,750 (14.9%) | 3.30 |
| Non-family | 7,579 (41.1%) | 1.20 |
| Total Households | 18,418 (100.0%) | 2.32 |
Household Size by Marriage Status in Altoona
Out of a total of 18,418 households in Altoona, 10,839 (58.9%) are family households, while 7,579 (41.1%) are nonfamily households. The most numerous type of family households are 2-person households, comprising 4,813, and the most common type of nonfamily households are 1-person households, comprising 6,226.
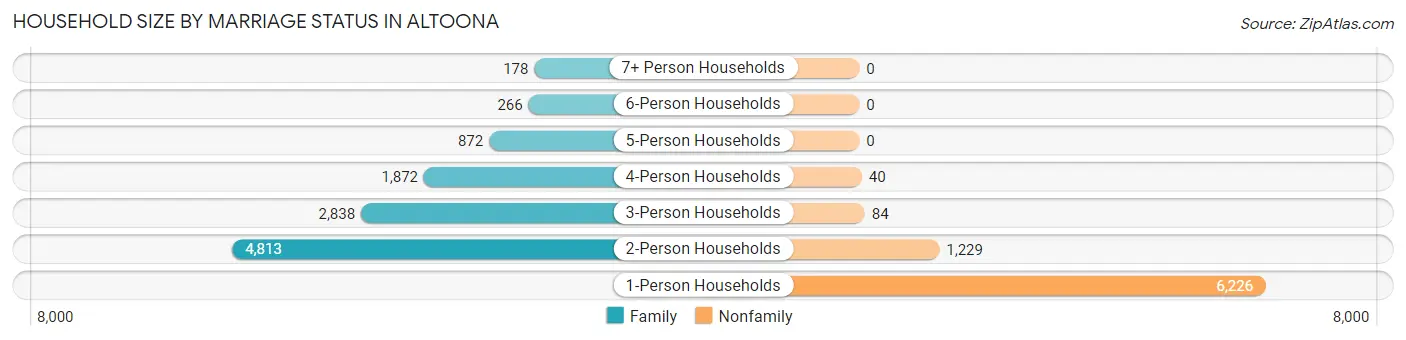
| Household Size | Family Households | Nonfamily Households |
| 1-Person Households | - | 6,226 (33.8%) |
| 2-Person Households | 4,813 (26.1%) | 1,229 (6.7%) |
| 3-Person Households | 2,838 (15.4%) | 84 (0.5%) |
| 4-Person Households | 1,872 (10.2%) | 40 (0.2%) |
| 5-Person Households | 872 (4.7%) | 0 (0.0%) |
| 6-Person Households | 266 (1.4%) | 0 (0.0%) |
| 7+ Person Households | 178 (1.0%) | 0 (0.0%) |
| Total | 10,839 (58.9%) | 7,579 (41.1%) |
Female Fertility in Altoona
Fertility by Age in Altoona
Average fertility rate in Altoona is 41.0 births per 1,000 women. Women in the age bracket of 20 to 34 years have the highest fertility rate with 73.0 births per 1,000 women. Women in the age bracket of 20 to 34 years acount for 79.0% of all women with births.
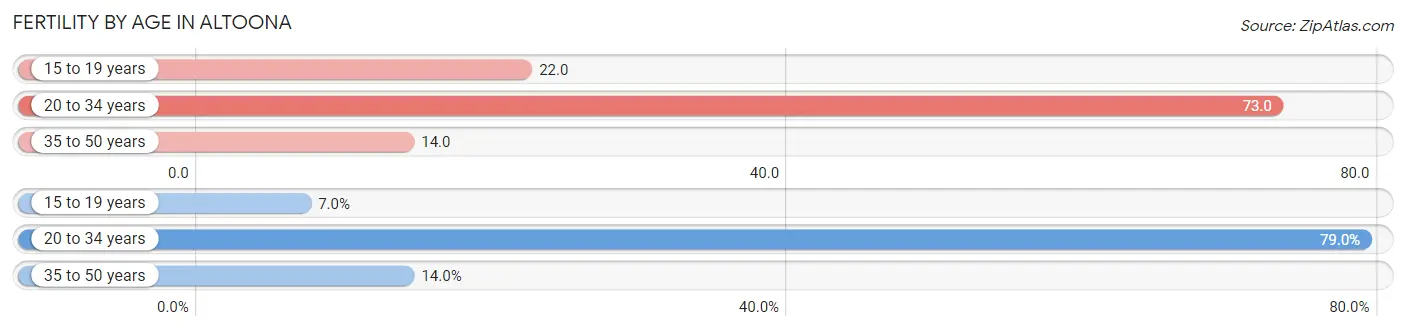
| Age Bracket | Women with Births | Births / 1,000 Women |
| 15 to 19 years | 29 (7.0%) | 22.0 |
| 20 to 34 years | 327 (79.0%) | 73.0 |
| 35 to 50 years | 58 (14.0%) | 14.0 |
| Total | 414 (100.0%) | 41.0 |
Fertility by Age by Marriage Status in Altoona
62.8% of women with births (414) in Altoona are married. The highest percentage of unmarried women with births falls into 15 to 19 years age bracket with 100.0% of them unmarried at the time of birth, while the lowest percentage of unmarried women with births belong to 35 to 50 years age bracket with 29.3% of them unmarried.
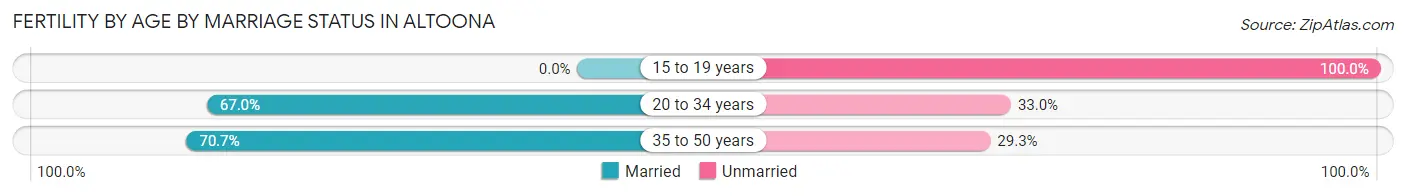
| Age Bracket | Married | Unmarried |
| 15 to 19 years | 0 (0.0%) | 29 (100.0%) |
| 20 to 34 years | 219 (67.0%) | 108 (33.0%) |
| 35 to 50 years | 41 (70.7%) | 17 (29.3%) |
| Total | 260 (62.8%) | 154 (37.2%) |
Fertility by Education in Altoona
Average fertility rate in Altoona is 41.0 births per 1,000 women. Women with the education attainment of graduate degree have the highest fertility rate of 79.0 births per 1,000 women, while women with the education attainment of high school diploma have the lowest fertility at 29.0 births per 1,000 women. Women with the education attainment of college or associate's degree represent 38.4% of all women with births.
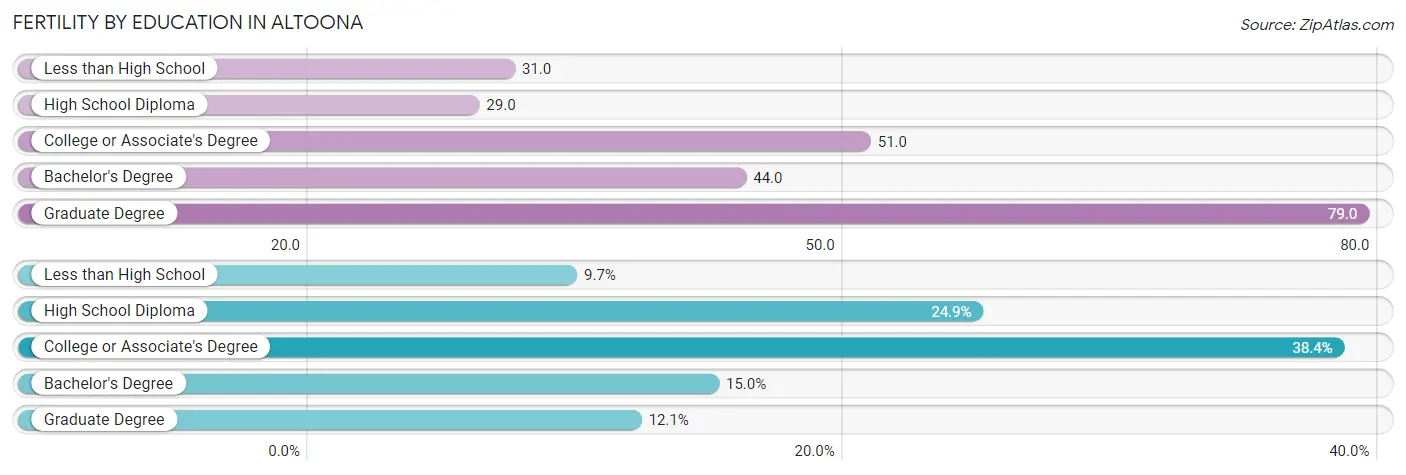
| Educational Attainment | Women with Births | Births / 1,000 Women |
| Less than High School | 40 (9.7%) | 31.0 |
| High School Diploma | 103 (24.9%) | 29.0 |
| College or Associate's Degree | 159 (38.4%) | 51.0 |
| Bachelor's Degree | 62 (15.0%) | 44.0 |
| Graduate Degree | 50 (12.1%) | 79.0 |
| Total | 414 (100.0%) | 41.0 |
Fertility by Education by Marriage Status in Altoona
37.2% of women with births in Altoona are unmarried. Women with the educational attainment of bachelor's degree are most likely to be married with 100.0% of them married at childbirth, while women with the educational attainment of high school diploma are least likely to be married with 57.3% of them unmarried at childbirth.
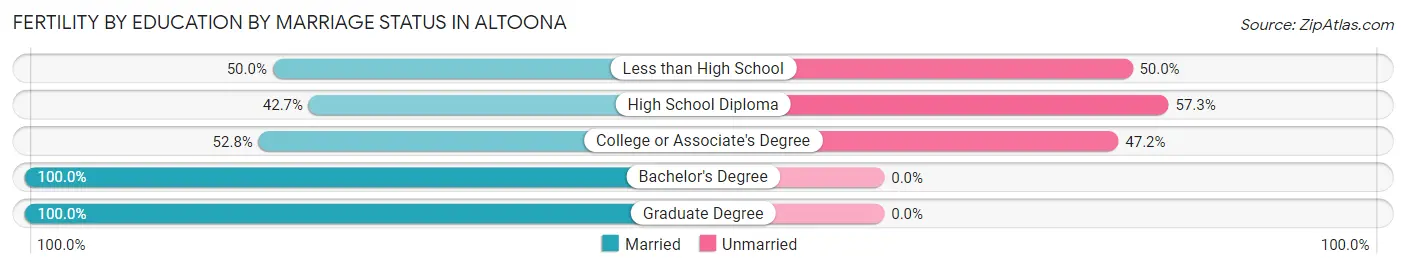
| Educational Attainment | Married | Unmarried |
| Less than High School | 20 (50.0%) | 20 (50.0%) |
| High School Diploma | 44 (42.7%) | 59 (57.3%) |
| College or Associate's Degree | 84 (52.8%) | 75 (47.2%) |
| Bachelor's Degree | 62 (100.0%) | 0 (0.0%) |
| Graduate Degree | 50 (100.0%) | 0 (0.0%) |
| Total | 260 (62.8%) | 154 (37.2%) |
Employment Characteristics in Altoona
Employment by Class of Employer in Altoona
Among the 19,206 employed individuals in Altoona, private company employees (13,373 | 69.6%), not-for-profit organizations (2,264 | 11.8%), and local government employees (1,334 | 7.0%) make up the most common classes of employment.
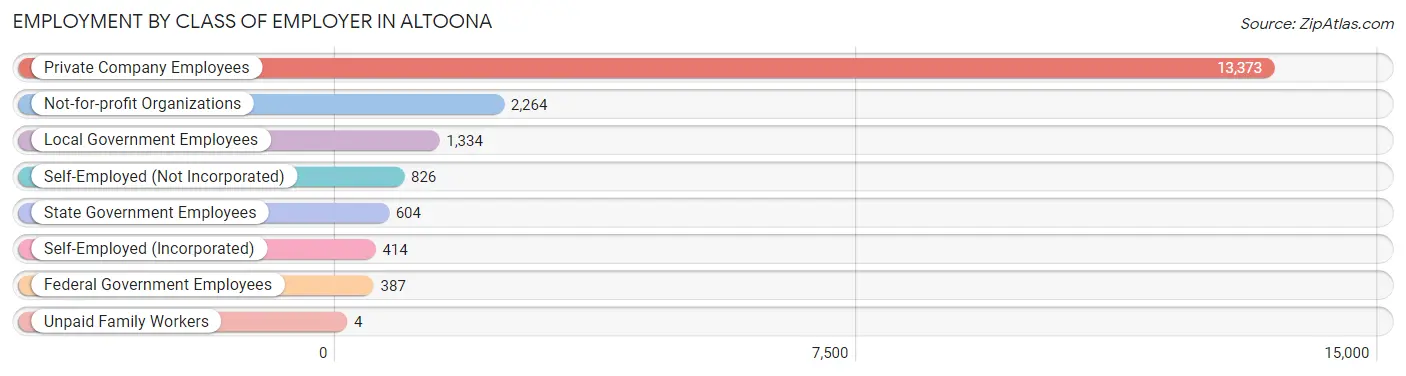
| Employer Class | # Employees | % Employees |
| Private Company Employees | 13,373 | 69.6% |
| Self-Employed (Incorporated) | 414 | 2.2% |
| Self-Employed (Not Incorporated) | 826 | 4.3% |
| Not-for-profit Organizations | 2,264 | 11.8% |
| Local Government Employees | 1,334 | 7.0% |
| State Government Employees | 604 | 3.1% |
| Federal Government Employees | 387 | 2.0% |
| Unpaid Family Workers | 4 | 0.0% |
| Total | 19,206 | 100.0% |
Employment Status by Age in Altoona
According to the labor force statistics for Altoona, out of the total population over 16 years of age (35,386), 58.8% or 20,807 individuals are in the labor force, with 6.0% or 1,248 of them unemployed. The age group with the highest labor force participation rate is 25 to 29 years, with 87.3% or 2,535 individuals in the labor force. Within the labor force, the 20 to 24 years age range has the highest percentage of unemployed individuals, with 15.6% or 333 of them being unemployed.
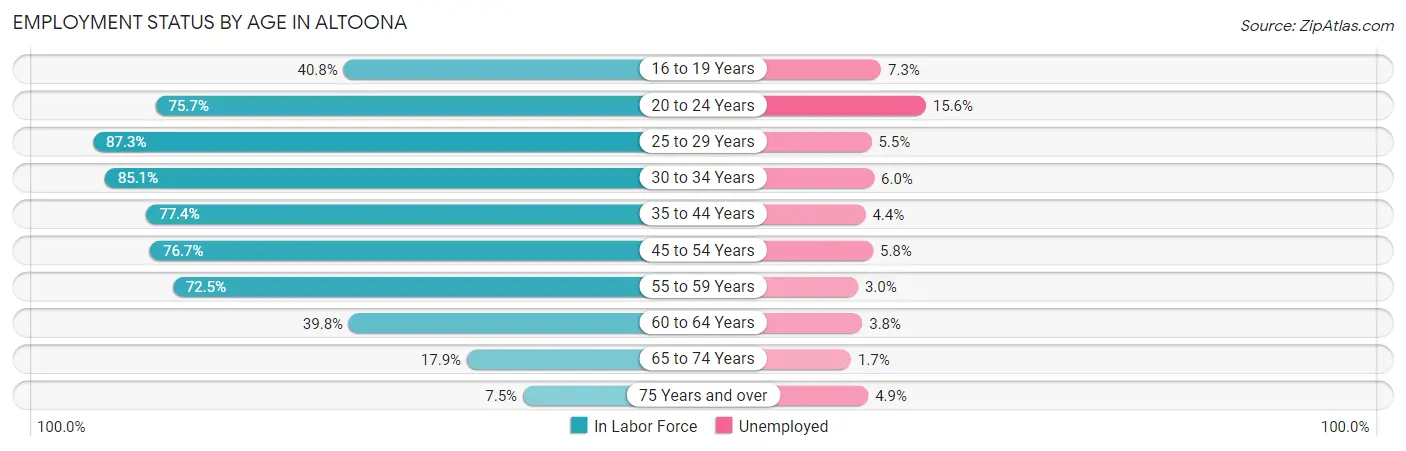
| Age Bracket | In Labor Force | Unemployed |
| 16 to 19 Years | 918 (40.8%) | 67 (7.3%) |
| 20 to 24 Years | 2,134 (75.7%) | 333 (15.6%) |
| 25 to 29 Years | 2,535 (87.3%) | 139 (5.5%) |
| 30 to 34 Years | 2,649 (85.1%) | 159 (6.0%) |
| 35 to 44 Years | 3,904 (77.4%) | 172 (4.4%) |
| 45 to 54 Years | 4,427 (76.7%) | 257 (5.8%) |
| 55 to 59 Years | 2,003 (72.5%) | 60 (3.0%) |
| 60 to 64 Years | 1,231 (39.8%) | 47 (3.8%) |
| 65 to 74 Years | 779 (17.9%) | 13 (1.7%) |
| 75 Years and over | 246 (7.5%) | 12 (4.9%) |
| Total | 20,807 (58.8%) | 1,248 (6.0%) |
Employment Status by Educational Attainment in Altoona
According to labor force statistics for Altoona, 73.8% of individuals (16,744) out of the total population between 25 and 64 years of age (22,688) are in the labor force, with 5.0% or 837 of them being unemployed. The group with the highest labor force participation rate are those with the educational attainment of bachelor's degree or higher, with 87.8% or 4,023 individuals in the labor force. Within the labor force, individuals with less than high school education have the highest percentage of unemployment, with 16.6% or 160 of them being unemployed.
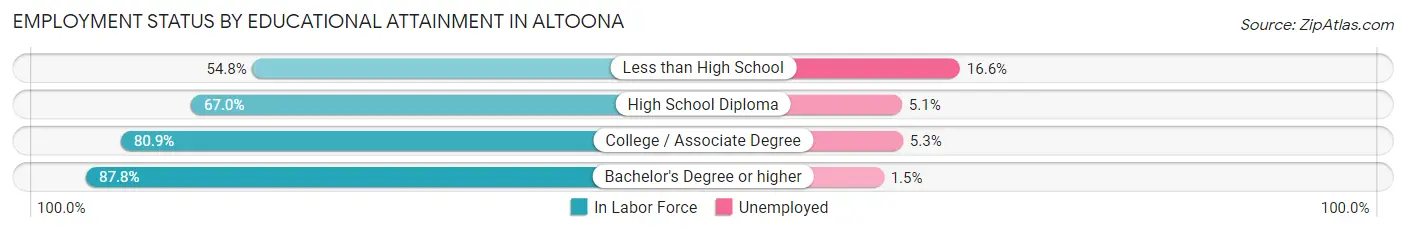
| Educational Attainment | In Labor Force | Unemployed |
| Less than High School | 961 (54.8%) | 291 (16.6%) |
| High School Diploma | 7,053 (67.0%) | 537 (5.1%) |
| College / Associate Degree | 4,713 (80.9%) | 309 (5.3%) |
| Bachelor's Degree or higher | 4,023 (87.8%) | 69 (1.5%) |
| Total | 16,744 (73.8%) | 1,134 (5.0%) |
Employment Occupations by Sex in Altoona
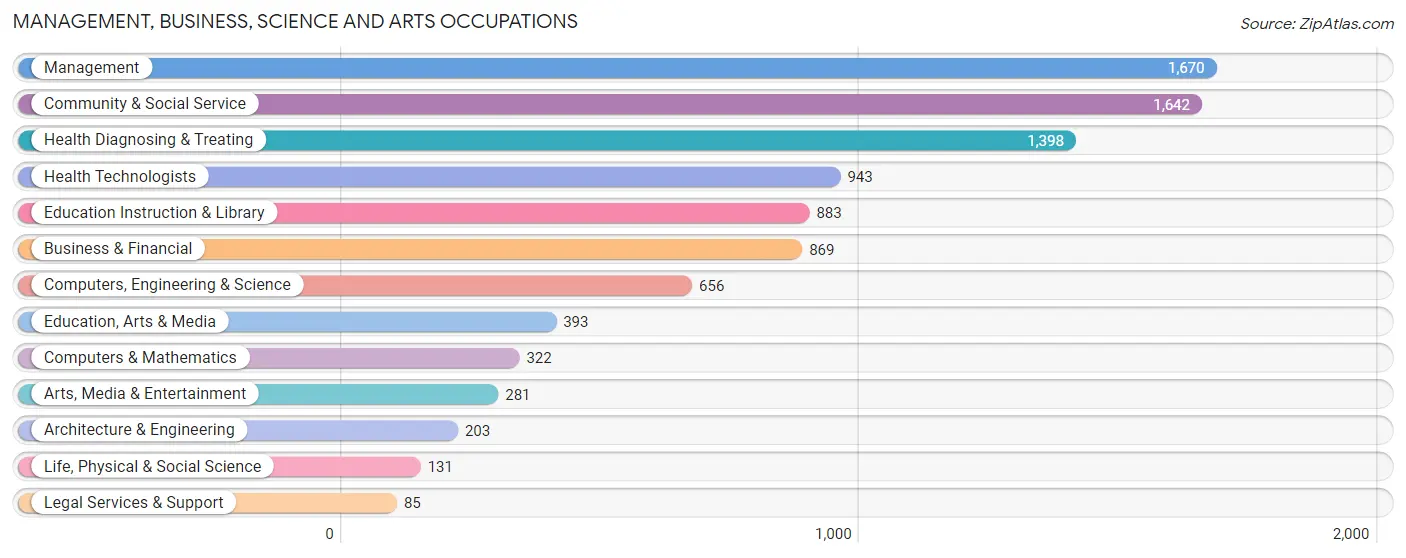
Management, Business, Science and Arts Occupations
The most common Management, Business, Science and Arts occupations in Altoona are Management (1,670 | 8.5%), Community & Social Service (1,642 | 8.4%), Health Diagnosing & Treating (1,398 | 7.1%), Health Technologists (943 | 4.8%), and Education Instruction & Library (883 | 4.5%).
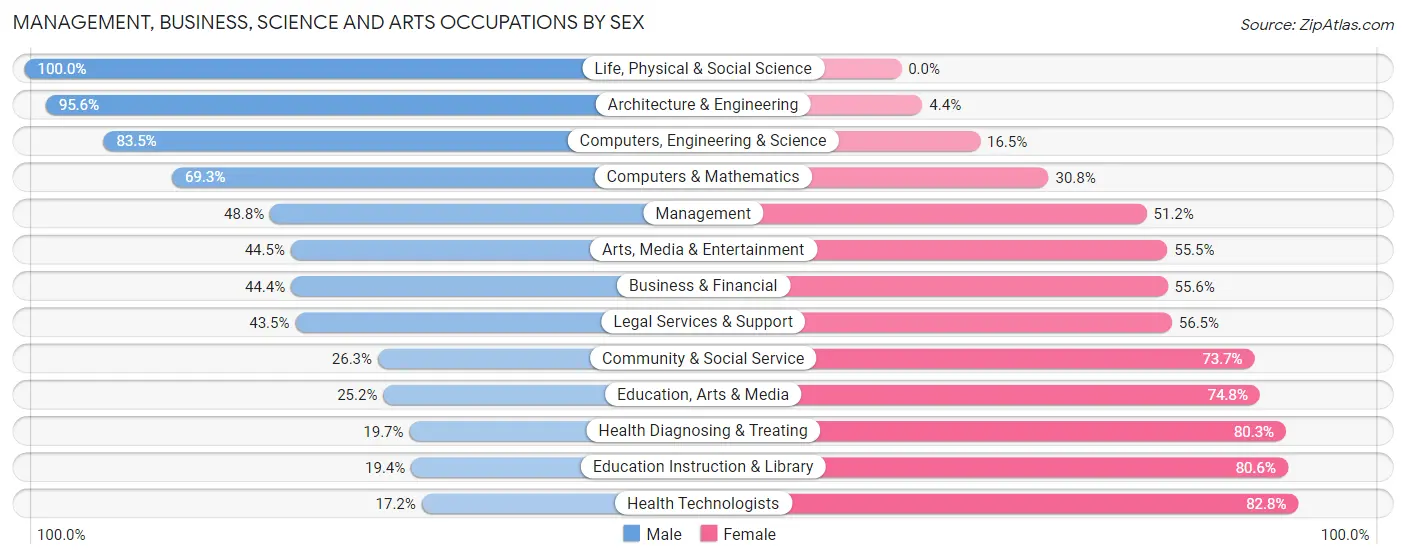
Management, Business, Science and Arts Occupations by Sex
Within the Management, Business, Science and Arts occupations in Altoona, the most male-oriented occupations are Life, Physical & Social Science (100.0%), Architecture & Engineering (95.6%), and Computers, Engineering & Science (83.5%), while the most female-oriented occupations are Health Technologists (82.8%), Education Instruction & Library (80.6%), and Health Diagnosing & Treating (80.3%).
| Occupation | Male | Female |
| Management | 815 (48.8%) | 855 (51.2%) |
| Business & Financial | 386 (44.4%) | 483 (55.6%) |
| Computers, Engineering & Science | 548 (83.5%) | 108 (16.5%) |
| Computers & Mathematics | 223 (69.3%) | 99 (30.7%) |
| Architecture & Engineering | 194 (95.6%) | 9 (4.4%) |
| Life, Physical & Social Science | 131 (100.0%) | 0 (0.0%) |
| Community & Social Service | 432 (26.3%) | 1,210 (73.7%) |
| Education, Arts & Media | 99 (25.2%) | 294 (74.8%) |
| Legal Services & Support | 37 (43.5%) | 48 (56.5%) |
| Education Instruction & Library | 171 (19.4%) | 712 (80.6%) |
| Arts, Media & Entertainment | 125 (44.5%) | 156 (55.5%) |
| Health Diagnosing & Treating | 276 (19.7%) | 1,122 (80.3%) |
| Health Technologists | 162 (17.2%) | 781 (82.8%) |
| Total (Category) | 2,457 (39.4%) | 3,778 (60.6%) |
| Total (Overall) | 9,850 (50.4%) | 9,704 (49.6%) |
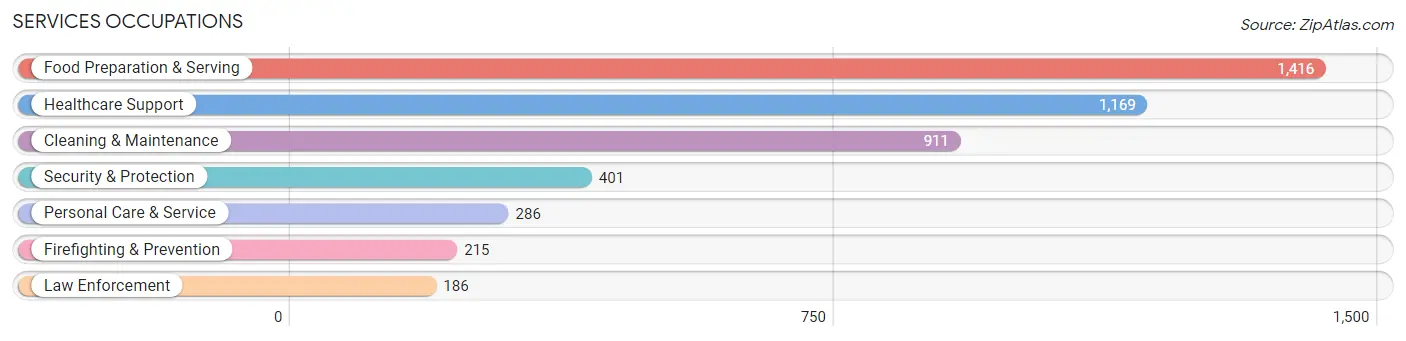
Services Occupations
The most common Services occupations in Altoona are Food Preparation & Serving (1,416 | 7.2%), Healthcare Support (1,169 | 6.0%), Cleaning & Maintenance (911 | 4.7%), Security & Protection (401 | 2.1%), and Personal Care & Service (286 | 1.5%).
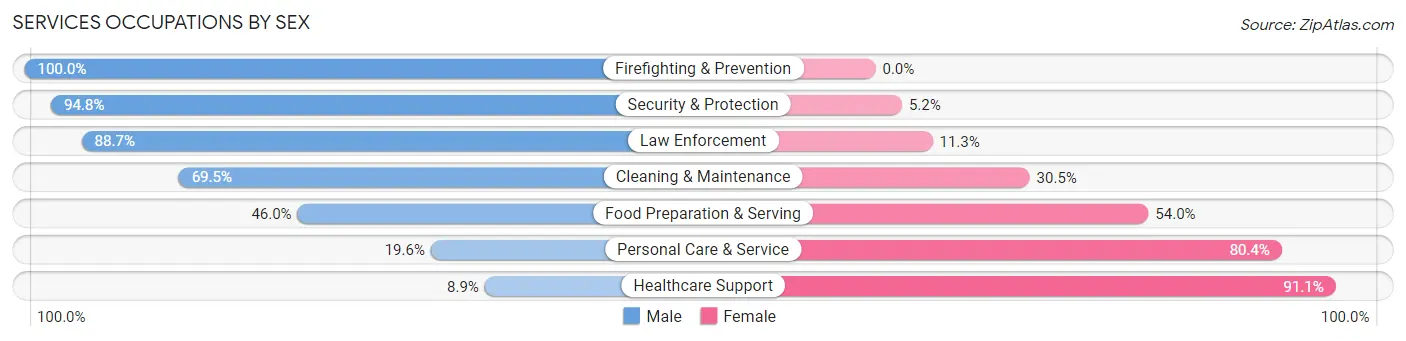
Services Occupations by Sex
Within the Services occupations in Altoona, the most male-oriented occupations are Firefighting & Prevention (100.0%), Security & Protection (94.8%), and Law Enforcement (88.7%), while the most female-oriented occupations are Healthcare Support (91.1%), Personal Care & Service (80.4%), and Food Preparation & Serving (54.0%).
| Occupation | Male | Female |
| Healthcare Support | 104 (8.9%) | 1,065 (91.1%) |
| Security & Protection | 380 (94.8%) | 21 (5.2%) |
| Firefighting & Prevention | 215 (100.0%) | 0 (0.0%) |
| Law Enforcement | 165 (88.7%) | 21 (11.3%) |
| Food Preparation & Serving | 651 (46.0%) | 765 (54.0%) |
| Cleaning & Maintenance | 633 (69.5%) | 278 (30.5%) |
| Personal Care & Service | 56 (19.6%) | 230 (80.4%) |
| Total (Category) | 1,824 (43.6%) | 2,359 (56.4%) |
| Total (Overall) | 9,850 (50.4%) | 9,704 (49.6%) |
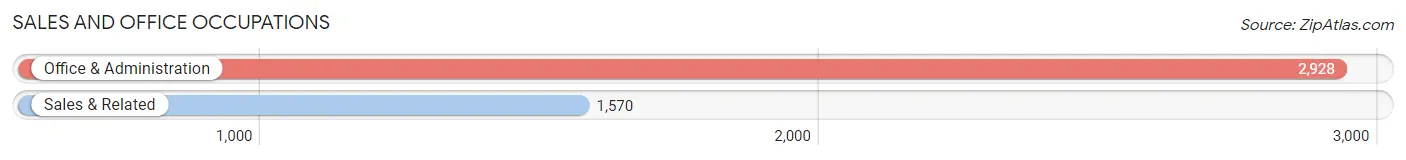
Sales and Office Occupations
The most common Sales and Office occupations in Altoona are Office & Administration (2,928 | 15.0%), and Sales & Related (1,570 | 8.0%).
Sales and Office Occupations by Sex
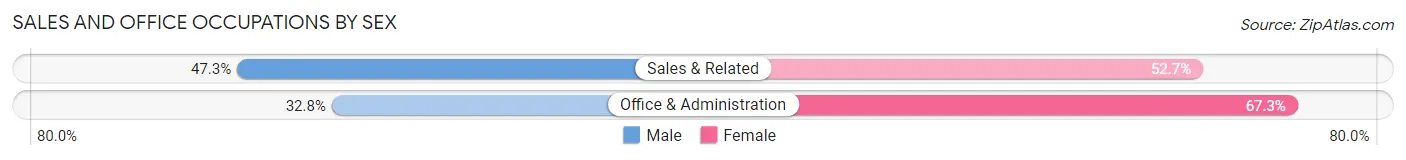
| Occupation | Male | Female |
| Sales & Related | 743 (47.3%) | 827 (52.7%) |
| Office & Administration | 959 (32.8%) | 1,969 (67.2%) |
| Total (Category) | 1,702 (37.8%) | 2,796 (62.2%) |
| Total (Overall) | 9,850 (50.4%) | 9,704 (49.6%) |
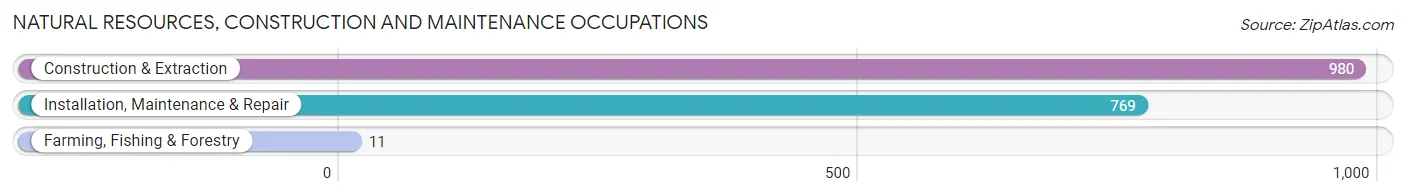
Natural Resources, Construction and Maintenance Occupations
The most common Natural Resources, Construction and Maintenance occupations in Altoona are Construction & Extraction (980 | 5.0%), Installation, Maintenance & Repair (769 | 3.9%), and Farming, Fishing & Forestry (11 | 0.1%).
Natural Resources, Construction and Maintenance Occupations by Sex
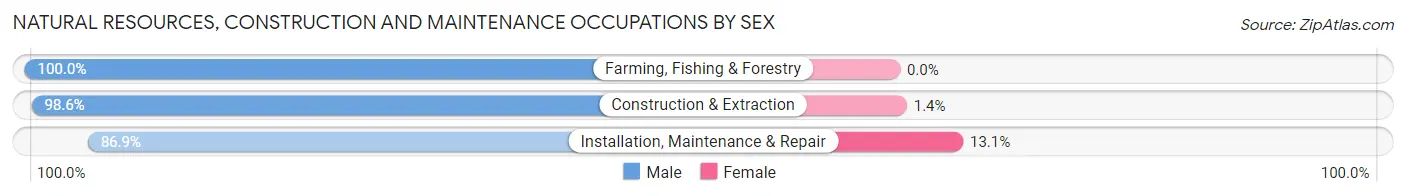
| Occupation | Male | Female |
| Farming, Fishing & Forestry | 11 (100.0%) | 0 (0.0%) |
| Construction & Extraction | 966 (98.6%) | 14 (1.4%) |
| Installation, Maintenance & Repair | 668 (86.9%) | 101 (13.1%) |
| Total (Category) | 1,645 (93.5%) | 115 (6.5%) |
| Total (Overall) | 9,850 (50.4%) | 9,704 (49.6%) |
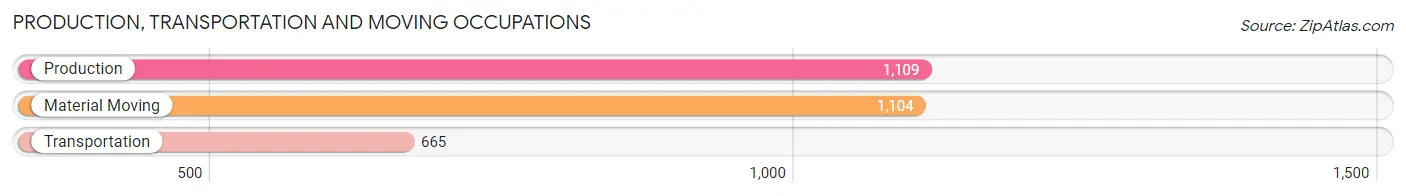
Production, Transportation and Moving Occupations
The most common Production, Transportation and Moving occupations in Altoona are Production (1,109 | 5.7%), Material Moving (1,104 | 5.7%), and Transportation (665 | 3.4%).
Production, Transportation and Moving Occupations by Sex
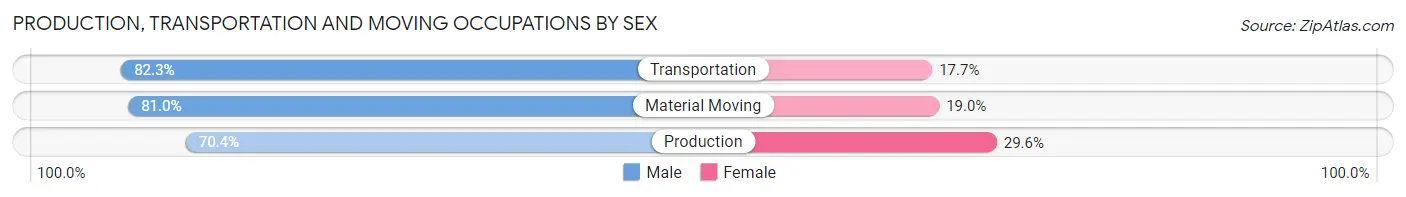
| Occupation | Male | Female |
| Production | 781 (70.4%) | 328 (29.6%) |
| Transportation | 547 (82.3%) | 118 (17.7%) |
| Material Moving | 894 (81.0%) | 210 (19.0%) |
| Total (Category) | 2,222 (77.2%) | 656 (22.8%) |
| Total (Overall) | 9,850 (50.4%) | 9,704 (49.6%) |
Employment Industries by Sex in Altoona
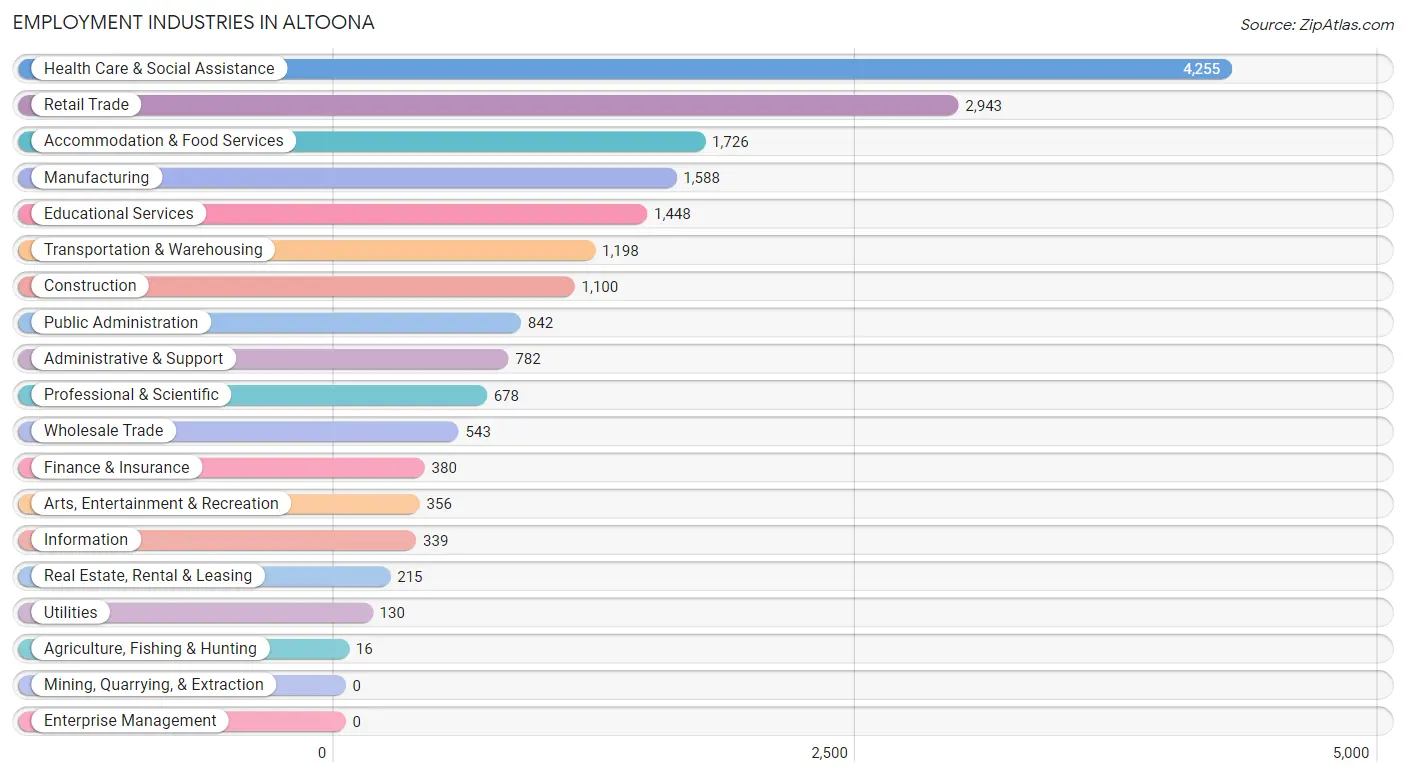
Employment Industries in Altoona
The major employment industries in Altoona include Health Care & Social Assistance (4,255 | 21.8%), Retail Trade (2,943 | 15.0%), Accommodation & Food Services (1,726 | 8.8%), Manufacturing (1,588 | 8.1%), and Educational Services (1,448 | 7.4%).
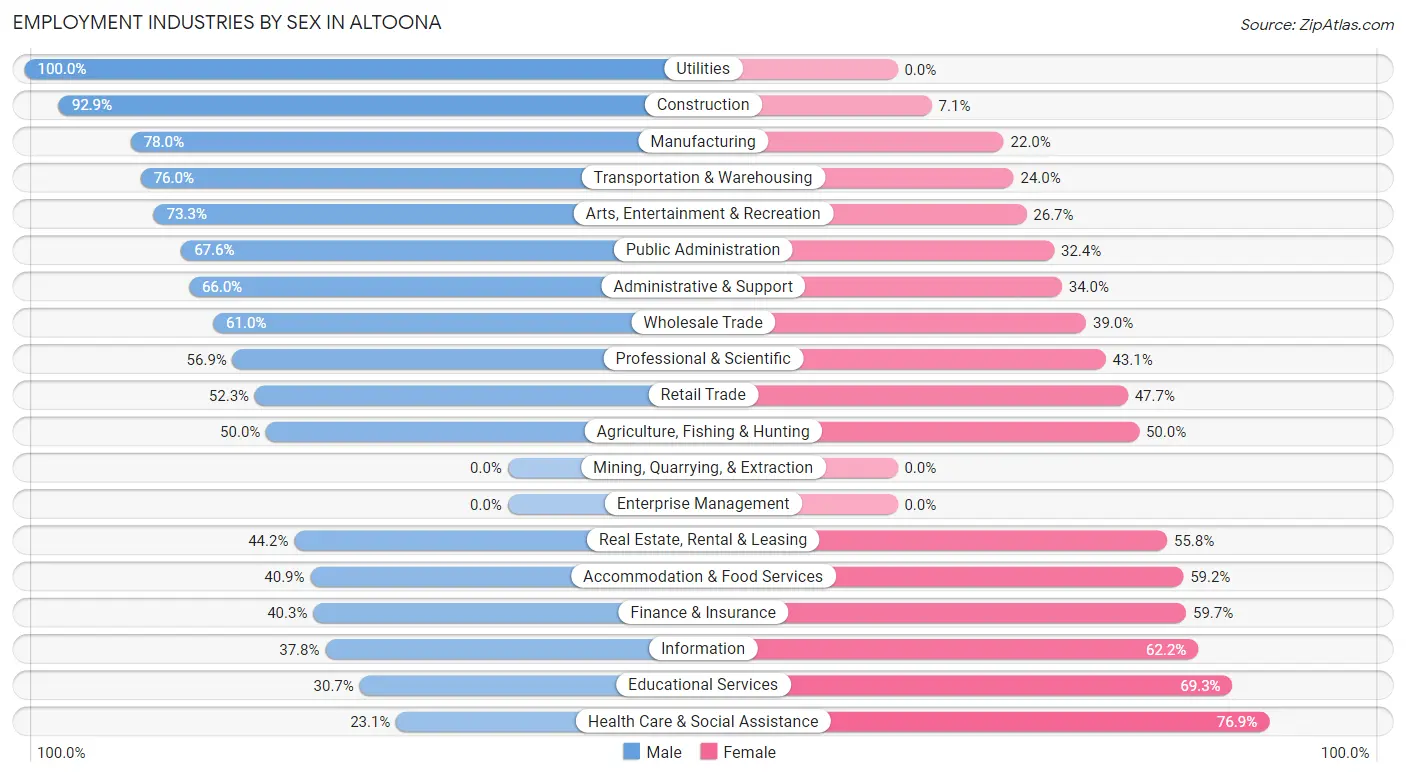
Employment Industries by Sex in Altoona
The Altoona industries that see more men than women are Utilities (100.0%), Construction (92.9%), and Manufacturing (78.0%), whereas the industries that tend to have a higher number of women are Health Care & Social Assistance (76.9%), Educational Services (69.3%), and Information (62.2%).
| Industry | Male | Female |
| Agriculture, Fishing & Hunting | 8 (50.0%) | 8 (50.0%) |
| Mining, Quarrying, & Extraction | 0 (0.0%) | 0 (0.0%) |
| Construction | 1,022 (92.9%) | 78 (7.1%) |
| Manufacturing | 1,239 (78.0%) | 349 (22.0%) |
| Wholesale Trade | 331 (61.0%) | 212 (39.0%) |
| Retail Trade | 1,540 (52.3%) | 1,403 (47.7%) |
| Transportation & Warehousing | 910 (76.0%) | 288 (24.0%) |
| Utilities | 130 (100.0%) | 0 (0.0%) |
| Information | 128 (37.8%) | 211 (62.2%) |
| Finance & Insurance | 153 (40.3%) | 227 (59.7%) |
| Real Estate, Rental & Leasing | 95 (44.2%) | 120 (55.8%) |
| Professional & Scientific | 386 (56.9%) | 292 (43.1%) |
| Enterprise Management | 0 (0.0%) | 0 (0.0%) |
| Administrative & Support | 516 (66.0%) | 266 (34.0%) |
| Educational Services | 444 (30.7%) | 1,004 (69.3%) |
| Health Care & Social Assistance | 982 (23.1%) | 3,273 (76.9%) |
| Arts, Entertainment & Recreation | 261 (73.3%) | 95 (26.7%) |
| Accommodation & Food Services | 705 (40.8%) | 1,021 (59.2%) |
| Public Administration | 569 (67.6%) | 273 (32.4%) |
| Total | 9,850 (50.4%) | 9,704 (49.6%) |
Education in Altoona
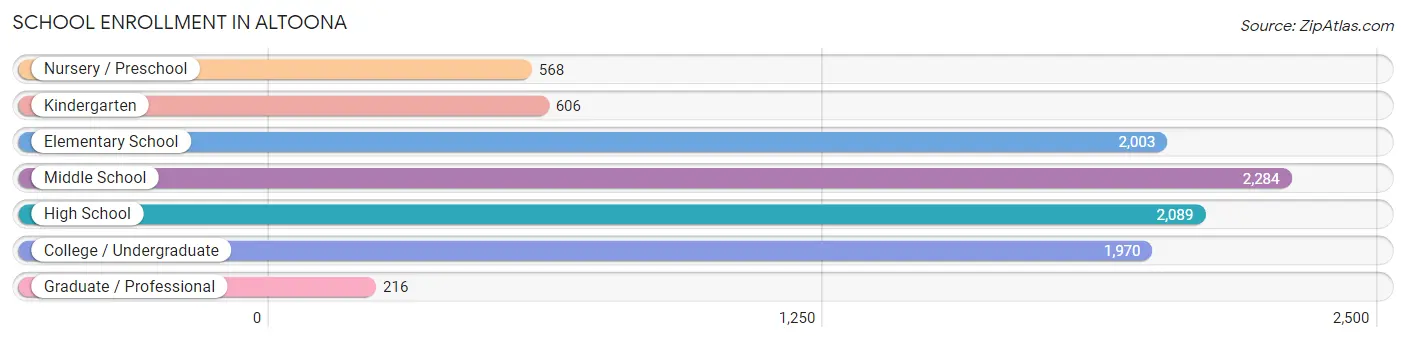
School Enrollment in Altoona
The most common levels of schooling among the 9,736 students in Altoona are middle school (2,284 | 23.5%), high school (2,089 | 21.5%), and elementary school (2,003 | 20.6%).
| School Level | # Students | % Students |
| Nursery / Preschool | 568 | 5.8% |
| Kindergarten | 606 | 6.2% |
| Elementary School | 2,003 | 20.6% |
| Middle School | 2,284 | 23.5% |
| High School | 2,089 | 21.5% |
| College / Undergraduate | 1,970 | 20.2% |
| Graduate / Professional | 216 | 2.2% |
| Total | 9,736 | 100.0% |
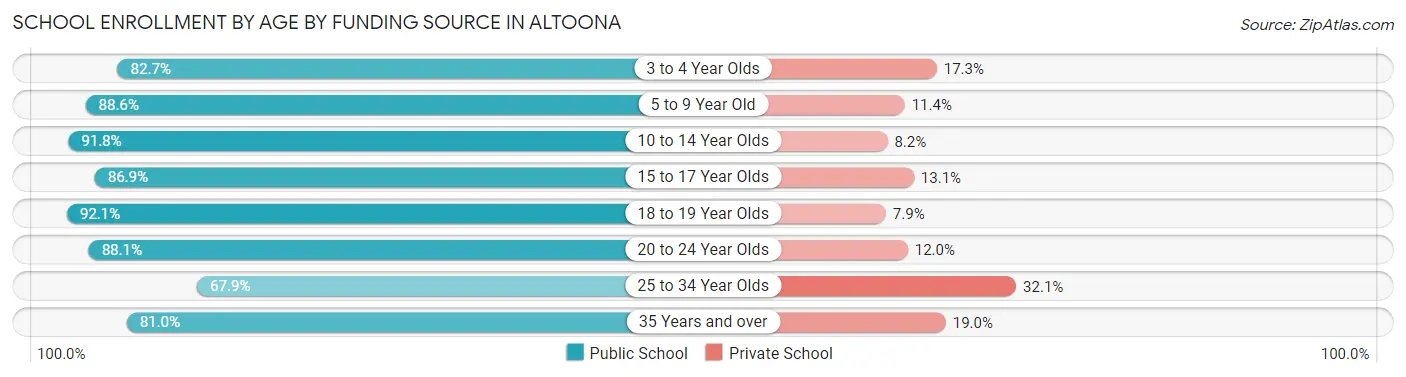
School Enrollment by Age by Funding Source in Altoona
Out of a total of 9,736 students who are enrolled in schools in Altoona, 1,149 (11.8%) attend a private institution, while the remaining 8,587 (88.2%) are enrolled in public schools. The age group of 25 to 34 year olds has the highest likelihood of being enrolled in private schools, with 143 (32.1% in the age bracket) enrolled. Conversely, the age group of 18 to 19 year olds has the lowest likelihood of being enrolled in a private school, with 854 (92.1% in the age bracket) attending a public institution.
| Age Bracket | Public School | Private School |
| 3 to 4 Year Olds | 348 (82.7%) | 73 (17.3%) |
| 5 to 9 Year Old | 2,206 (88.6%) | 283 (11.4%) |
| 10 to 14 Year Olds | 2,578 (91.8%) | 229 (8.2%) |
| 15 to 17 Year Olds | 1,322 (86.9%) | 199 (13.1%) |
| 18 to 19 Year Olds | 854 (92.1%) | 73 (7.9%) |
| 20 to 24 Year Olds | 774 (88.0%) | 105 (11.9%) |
| 25 to 34 Year Olds | 302 (67.9%) | 143 (32.1%) |
| 35 Years and over | 200 (81.0%) | 47 (19.0%) |
| Total | 8,587 (88.2%) | 1,149 (11.8%) |
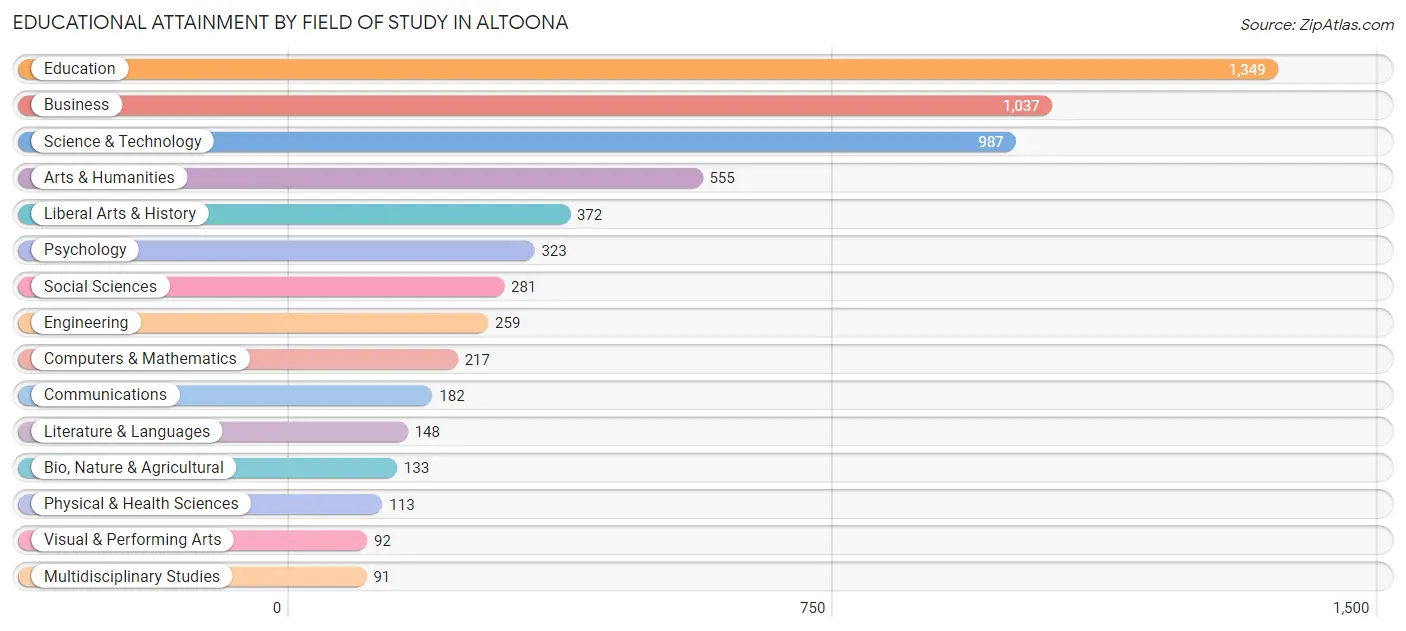
Educational Attainment by Field of Study in Altoona
Education (1,349 | 22.0%), business (1,037 | 16.9%), science & technology (987 | 16.1%), arts & humanities (555 | 9.0%), and liberal arts & history (372 | 6.1%) are the most common fields of study among 6,139 individuals in Altoona who have obtained a bachelor's degree or higher.
| Field of Study | # Graduates | % Graduates |
| Computers & Mathematics | 217 | 3.5% |
| Bio, Nature & Agricultural | 133 | 2.2% |
| Physical & Health Sciences | 113 | 1.8% |
| Psychology | 323 | 5.3% |
| Social Sciences | 281 | 4.6% |
| Engineering | 259 | 4.2% |
| Multidisciplinary Studies | 91 | 1.5% |
| Science & Technology | 987 | 16.1% |
| Business | 1,037 | 16.9% |
| Education | 1,349 | 22.0% |
| Literature & Languages | 148 | 2.4% |
| Liberal Arts & History | 372 | 6.1% |
| Visual & Performing Arts | 92 | 1.5% |
| Communications | 182 | 3.0% |
| Arts & Humanities | 555 | 9.0% |
| Total | 6,139 | 100.0% |
Transportation & Commute in Altoona
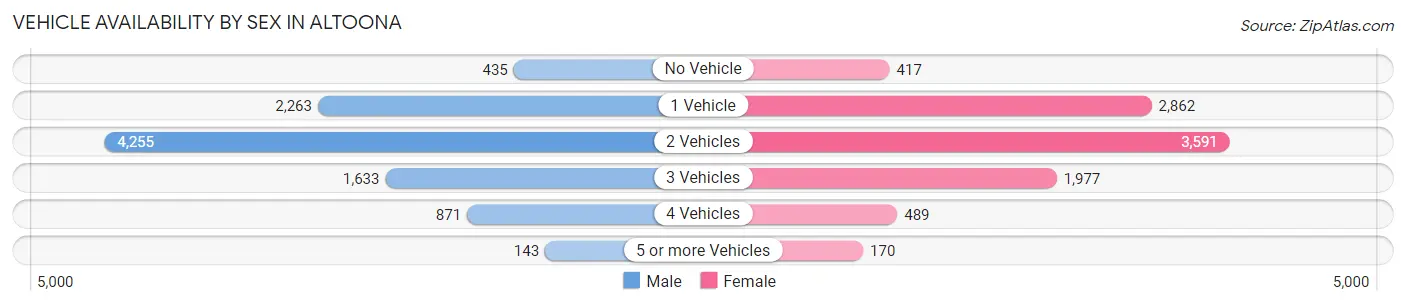
Vehicle Availability by Sex in Altoona
The most prevalent vehicle ownership categories in Altoona are males with 2 vehicles (4,255, accounting for 44.3%) and females with 2 vehicles (3,591, making up 44.8%).
| Vehicles Available | Male | Female |
| No Vehicle | 435 (4.5%) | 417 (4.4%) |
| 1 Vehicle | 2,263 (23.6%) | 2,862 (30.1%) |
| 2 Vehicles | 4,255 (44.3%) | 3,591 (37.8%) |
| 3 Vehicles | 1,633 (17.0%) | 1,977 (20.8%) |
| 4 Vehicles | 871 (9.1%) | 489 (5.1%) |
| 5 or more Vehicles | 143 (1.5%) | 170 (1.8%) |
| Total | 9,600 (100.0%) | 9,506 (100.0%) |
Commute Time in Altoona
The most frequently occuring commute durations in Altoona are 10 to 14 minutes (4,771 commuters, 26.4%), 5 to 9 minutes (3,384 commuters, 18.7%), and 15 to 19 minutes (3,314 commuters, 18.3%).
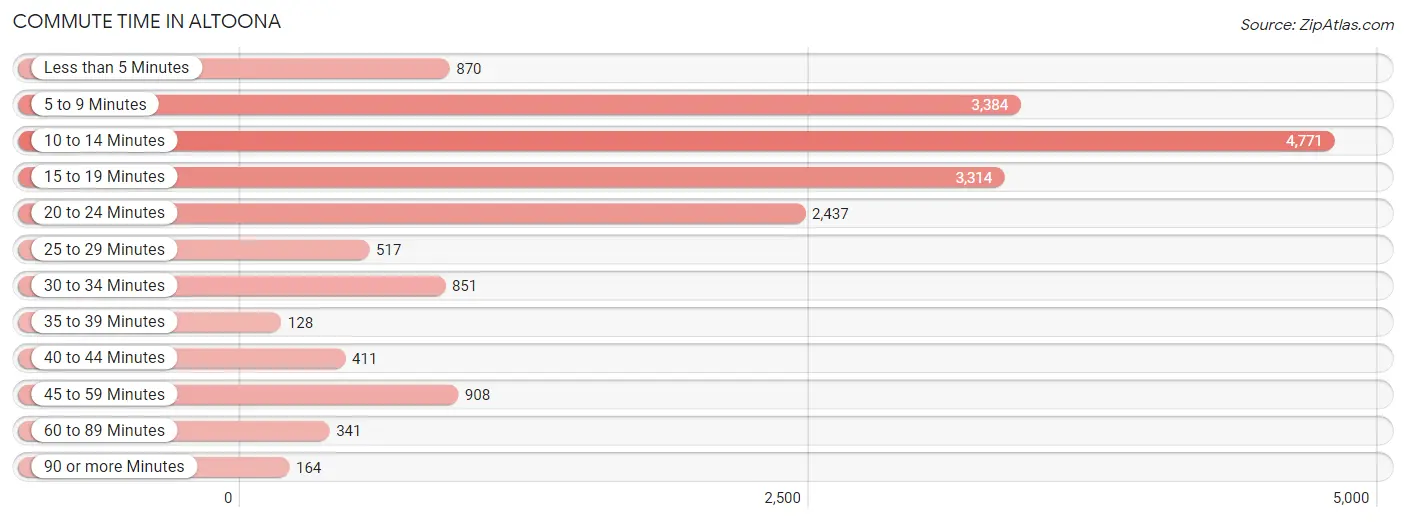
| Commute Time | # Commuters | % Commuters |
| Less than 5 Minutes | 870 | 4.8% |
| 5 to 9 Minutes | 3,384 | 18.7% |
| 10 to 14 Minutes | 4,771 | 26.4% |
| 15 to 19 Minutes | 3,314 | 18.3% |
| 20 to 24 Minutes | 2,437 | 13.5% |
| 25 to 29 Minutes | 517 | 2.9% |
| 30 to 34 Minutes | 851 | 4.7% |
| 35 to 39 Minutes | 128 | 0.7% |
| 40 to 44 Minutes | 411 | 2.3% |
| 45 to 59 Minutes | 908 | 5.0% |
| 60 to 89 Minutes | 341 | 1.9% |
| 90 or more Minutes | 164 | 0.9% |
Commute Time by Sex in Altoona
The most common commute times in Altoona are 10 to 14 minutes (2,130 commuters, 23.2%) for males and 10 to 14 minutes (2,641 commuters, 29.7%) for females.
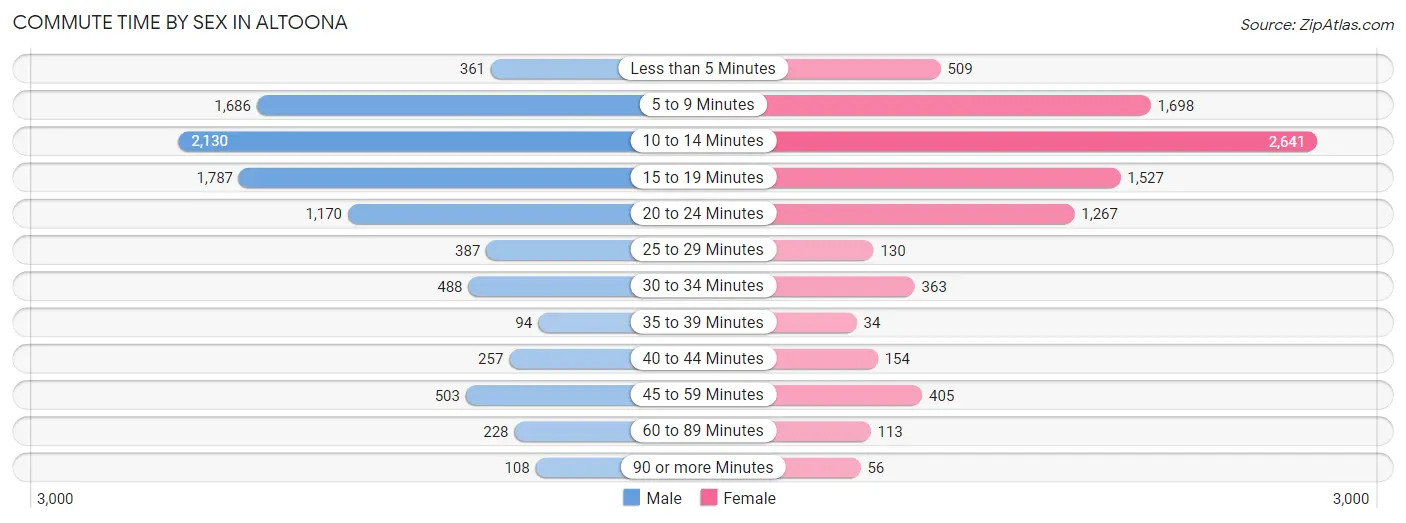
| Commute Time | Male | Female |
| Less than 5 Minutes | 361 (3.9%) | 509 (5.7%) |
| 5 to 9 Minutes | 1,686 (18.3%) | 1,698 (19.1%) |
| 10 to 14 Minutes | 2,130 (23.2%) | 2,641 (29.7%) |
| 15 to 19 Minutes | 1,787 (19.4%) | 1,527 (17.2%) |
| 20 to 24 Minutes | 1,170 (12.7%) | 1,267 (14.2%) |
| 25 to 29 Minutes | 387 (4.2%) | 130 (1.5%) |
| 30 to 34 Minutes | 488 (5.3%) | 363 (4.1%) |
| 35 to 39 Minutes | 94 (1.0%) | 34 (0.4%) |
| 40 to 44 Minutes | 257 (2.8%) | 154 (1.7%) |
| 45 to 59 Minutes | 503 (5.5%) | 405 (4.5%) |
| 60 to 89 Minutes | 228 (2.5%) | 113 (1.3%) |
| 90 or more Minutes | 108 (1.2%) | 56 (0.6%) |
Time of Departure to Work by Sex in Altoona
The most frequent times of departure to work in Altoona are 4:00 PM to 11:59 PM (1,044, 11.4%) for males and 7:00 AM to 7:29 AM (1,521, 17.1%) for females.
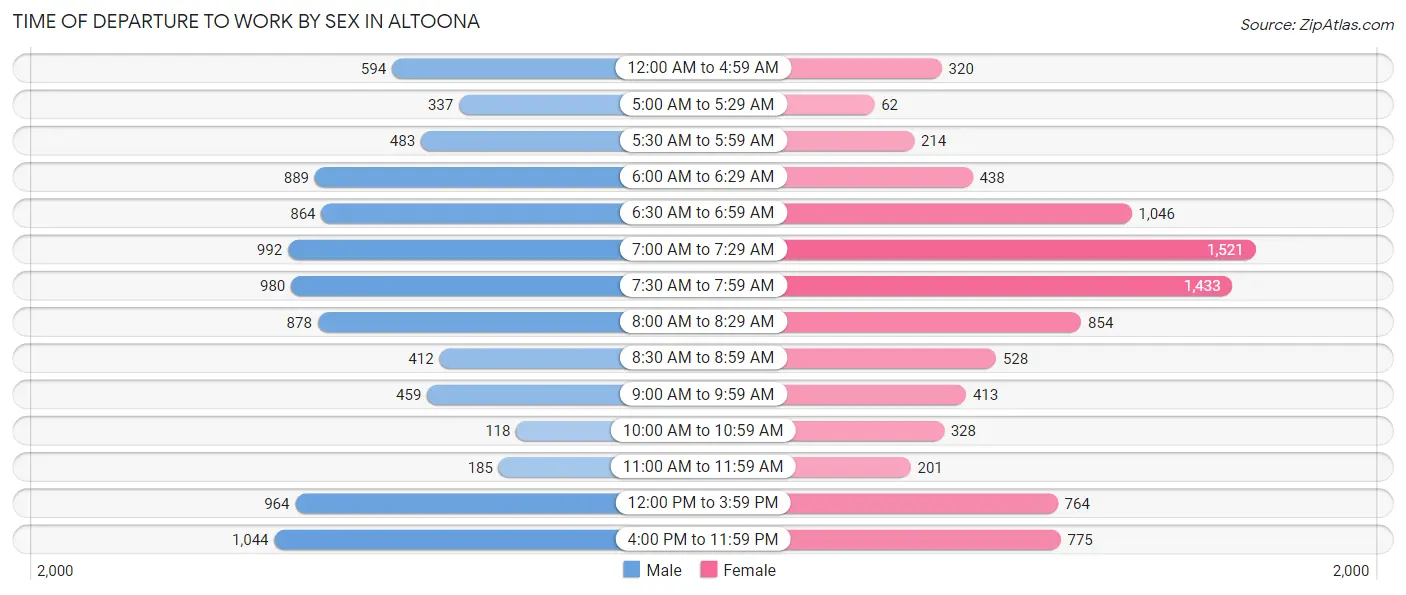
| Time of Departure | Male | Female |
| 12:00 AM to 4:59 AM | 594 (6.5%) | 320 (3.6%) |
| 5:00 AM to 5:29 AM | 337 (3.7%) | 62 (0.7%) |
| 5:30 AM to 5:59 AM | 483 (5.2%) | 214 (2.4%) |
| 6:00 AM to 6:29 AM | 889 (9.7%) | 438 (4.9%) |
| 6:30 AM to 6:59 AM | 864 (9.4%) | 1,046 (11.8%) |
| 7:00 AM to 7:29 AM | 992 (10.8%) | 1,521 (17.1%) |
| 7:30 AM to 7:59 AM | 980 (10.6%) | 1,433 (16.1%) |
| 8:00 AM to 8:29 AM | 878 (9.5%) | 854 (9.6%) |
| 8:30 AM to 8:59 AM | 412 (4.5%) | 528 (5.9%) |
| 9:00 AM to 9:59 AM | 459 (5.0%) | 413 (4.6%) |
| 10:00 AM to 10:59 AM | 118 (1.3%) | 328 (3.7%) |
| 11:00 AM to 11:59 AM | 185 (2.0%) | 201 (2.3%) |
| 12:00 PM to 3:59 PM | 964 (10.5%) | 764 (8.6%) |
| 4:00 PM to 11:59 PM | 1,044 (11.4%) | 775 (8.7%) |
| Total | 9,199 (100.0%) | 8,897 (100.0%) |
Housing Occupancy in Altoona
Occupancy by Ownership in Altoona
Of the total 18,418 dwellings in Altoona, owner-occupied units account for 12,057 (65.5%), while renter-occupied units make up 6,361 (34.5%).
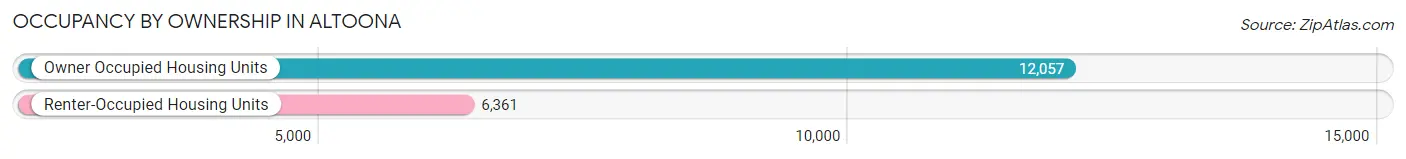
| Occupancy | # Housing Units | % Housing Units |
| Owner Occupied Housing Units | 12,057 | 65.5% |
| Renter-Occupied Housing Units | 6,361 | 34.5% |
| Total Occupied Housing Units | 18,418 | 100.0% |
Occupancy by Household Size in Altoona
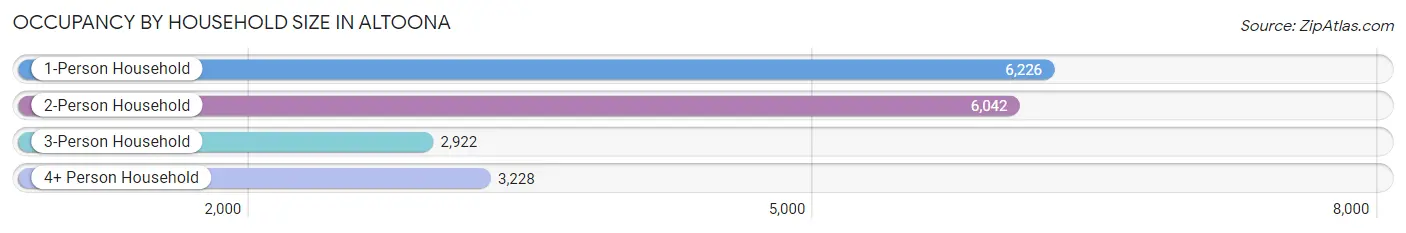
| Household Size | # Housing Units | % Housing Units |
| 1-Person Household | 6,226 | 33.8% |
| 2-Person Household | 6,042 | 32.8% |
| 3-Person Household | 2,922 | 15.9% |
| 4+ Person Household | 3,228 | 17.5% |
| Total Housing Units | 18,418 | 100.0% |
Occupancy by Ownership by Household Size in Altoona
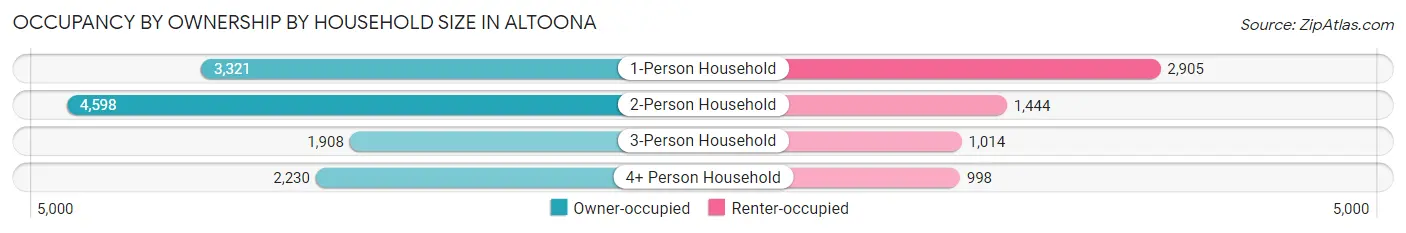
| Household Size | Owner-occupied | Renter-occupied |
| 1-Person Household | 3,321 (53.3%) | 2,905 (46.7%) |
| 2-Person Household | 4,598 (76.1%) | 1,444 (23.9%) |
| 3-Person Household | 1,908 (65.3%) | 1,014 (34.7%) |
| 4+ Person Household | 2,230 (69.1%) | 998 (30.9%) |
| Total Housing Units | 12,057 (65.5%) | 6,361 (34.5%) |
Occupancy by Educational Attainment in Altoona
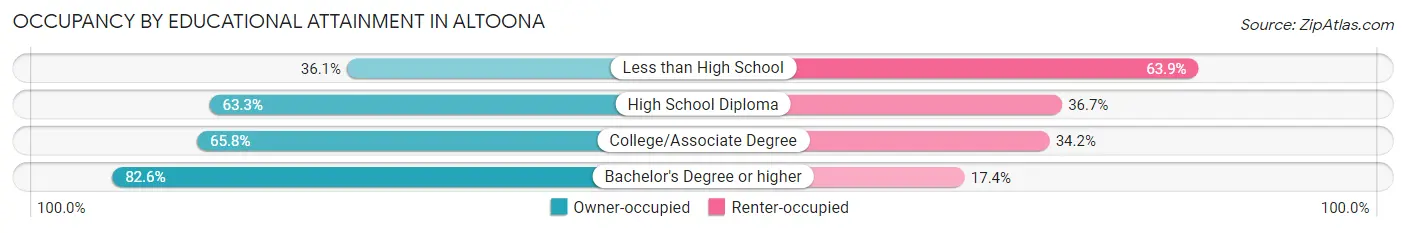
| Household Size | Owner-occupied | Renter-occupied |
| Less than High School | 551 (36.1%) | 975 (63.9%) |
| High School Diploma | 5,359 (63.3%) | 3,104 (36.7%) |
| College/Associate Degree | 3,195 (65.8%) | 1,661 (34.2%) |
| Bachelor's Degree or higher | 2,952 (82.6%) | 621 (17.4%) |
Occupancy by Age of Householder in Altoona
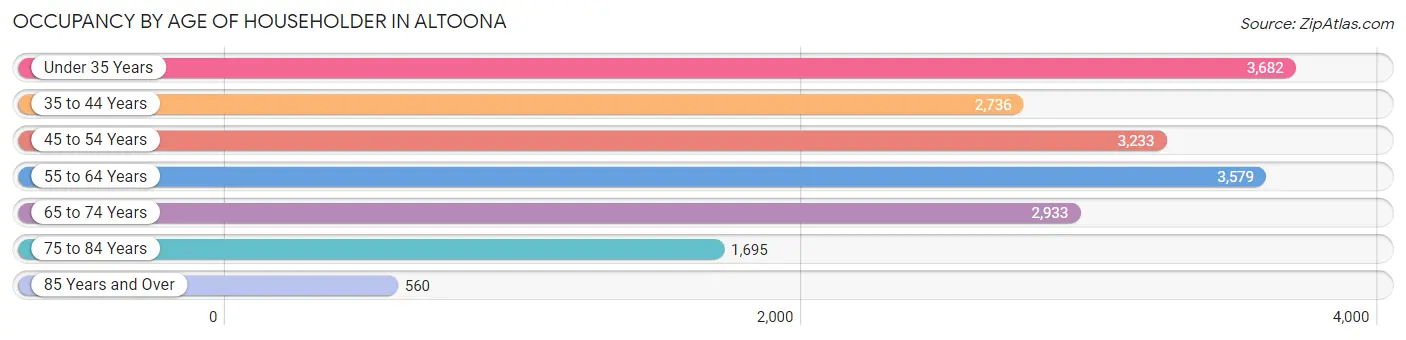
| Age Bracket | # Households | % Households |
| Under 35 Years | 3,682 | 20.0% |
| 35 to 44 Years | 2,736 | 14.9% |
| 45 to 54 Years | 3,233 | 17.5% |
| 55 to 64 Years | 3,579 | 19.4% |
| 65 to 74 Years | 2,933 | 15.9% |
| 75 to 84 Years | 1,695 | 9.2% |
| 85 Years and Over | 560 | 3.0% |
| Total | 18,418 | 100.0% |
Housing Finances in Altoona
Median Income by Occupancy in Altoona
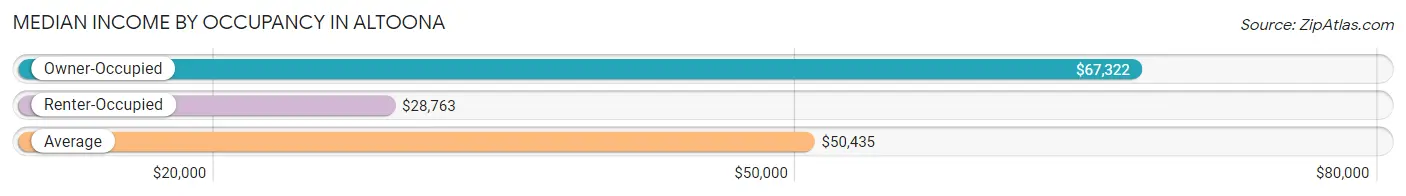
| Occupancy Type | # Households | Median Income |
| Owner-Occupied | 12,057 (65.5%) | $67,322 |
| Renter-Occupied | 6,361 (34.5%) | $28,763 |
| Average | 18,418 (100.0%) | $50,435 |
Occupancy by Householder Income Bracket in Altoona
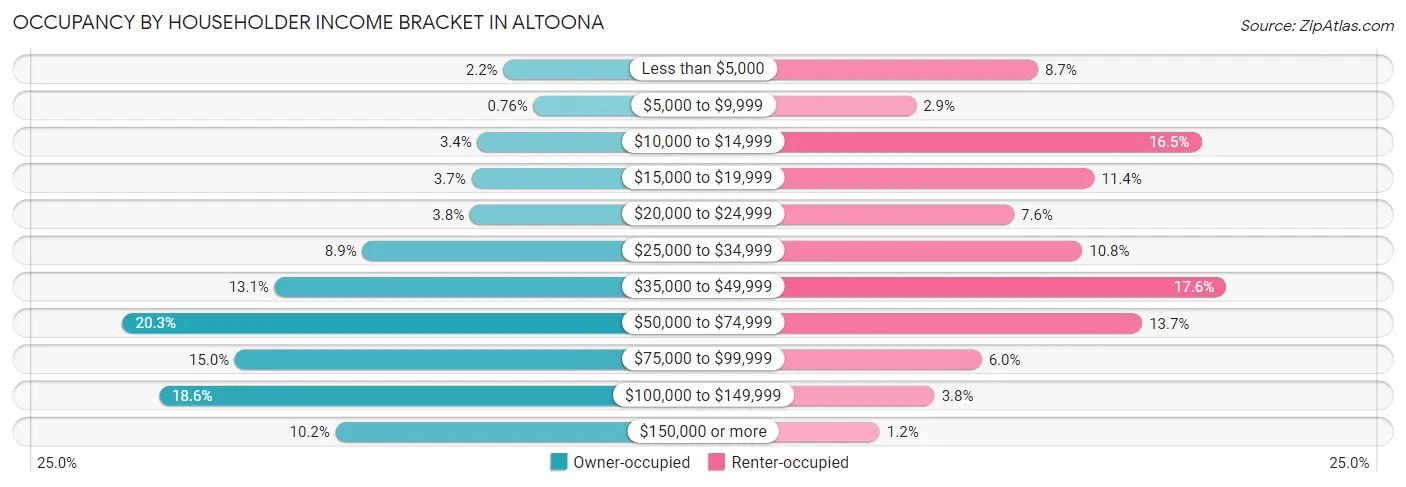
| Income Bracket | Owner-occupied | Renter-occupied |
| Less than $5,000 | 265 (2.2%) | 553 (8.7%) |
| $5,000 to $9,999 | 92 (0.8%) | 184 (2.9%) |
| $10,000 to $14,999 | 414 (3.4%) | 1,047 (16.5%) |
| $15,000 to $19,999 | 448 (3.7%) | 724 (11.4%) |
| $20,000 to $24,999 | 457 (3.8%) | 480 (7.5%) |
| $25,000 to $34,999 | 1,074 (8.9%) | 687 (10.8%) |
| $35,000 to $49,999 | 1,578 (13.1%) | 1,122 (17.6%) |
| $50,000 to $74,999 | 2,451 (20.3%) | 868 (13.7%) |
| $75,000 to $99,999 | 1,806 (15.0%) | 382 (6.0%) |
| $100,000 to $149,999 | 2,243 (18.6%) | 240 (3.8%) |
| $150,000 or more | 1,229 (10.2%) | 74 (1.2%) |
| Total | 12,057 (100.0%) | 6,361 (100.0%) |
Monthly Housing Cost Tiers in Altoona
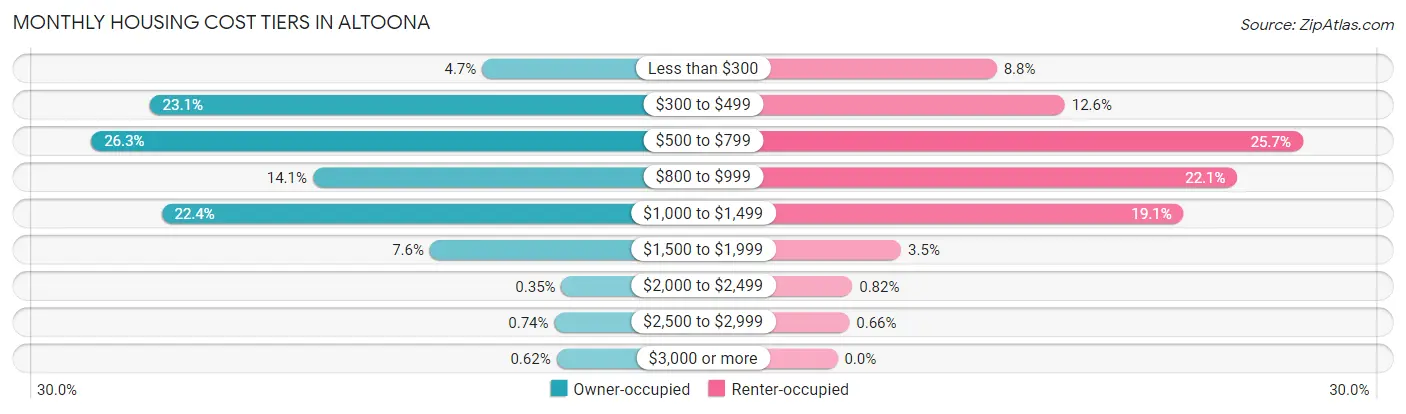
| Monthly Cost | Owner-occupied | Renter-occupied |
| Less than $300 | 570 (4.7%) | 560 (8.8%) |
| $300 to $499 | 2,784 (23.1%) | 799 (12.6%) |
| $500 to $799 | 3,174 (26.3%) | 1,635 (25.7%) |
| $800 to $999 | 1,698 (14.1%) | 1,405 (22.1%) |
| $1,000 to $1,499 | 2,706 (22.4%) | 1,216 (19.1%) |
| $1,500 to $1,999 | 919 (7.6%) | 224 (3.5%) |
| $2,000 to $2,499 | 42 (0.4%) | 52 (0.8%) |
| $2,500 to $2,999 | 89 (0.7%) | 42 (0.7%) |
| $3,000 or more | 75 (0.6%) | 0 (0.0%) |
| Total | 12,057 (100.0%) | 6,361 (100.0%) |
Physical Housing Characteristics in Altoona
Housing Structures in Altoona
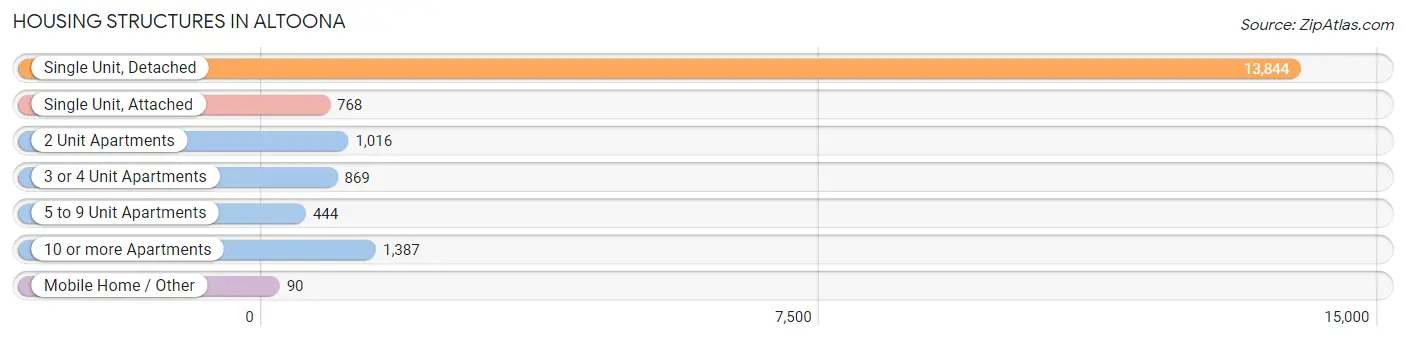
| Structure Type | # Housing Units | % Housing Units |
| Single Unit, Detached | 13,844 | 75.2% |
| Single Unit, Attached | 768 | 4.2% |
| 2 Unit Apartments | 1,016 | 5.5% |
| 3 or 4 Unit Apartments | 869 | 4.7% |
| 5 to 9 Unit Apartments | 444 | 2.4% |
| 10 or more Apartments | 1,387 | 7.5% |
| Mobile Home / Other | 90 | 0.5% |
| Total | 18,418 | 100.0% |
Housing Structures by Occupancy in Altoona
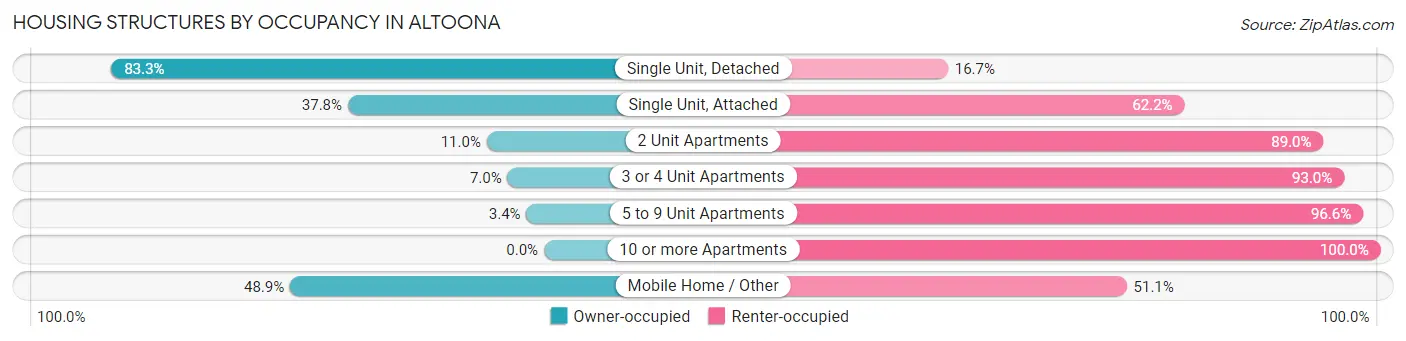
| Structure Type | Owner-occupied | Renter-occupied |
| Single Unit, Detached | 11,535 (83.3%) | 2,309 (16.7%) |
| Single Unit, Attached | 290 (37.8%) | 478 (62.2%) |
| 2 Unit Apartments | 112 (11.0%) | 904 (89.0%) |
| 3 or 4 Unit Apartments | 61 (7.0%) | 808 (93.0%) |
| 5 to 9 Unit Apartments | 15 (3.4%) | 429 (96.6%) |
| 10 or more Apartments | 0 (0.0%) | 1,387 (100.0%) |
| Mobile Home / Other | 44 (48.9%) | 46 (51.1%) |
| Total | 12,057 (65.5%) | 6,361 (34.5%) |
Housing Structures by Number of Rooms in Altoona
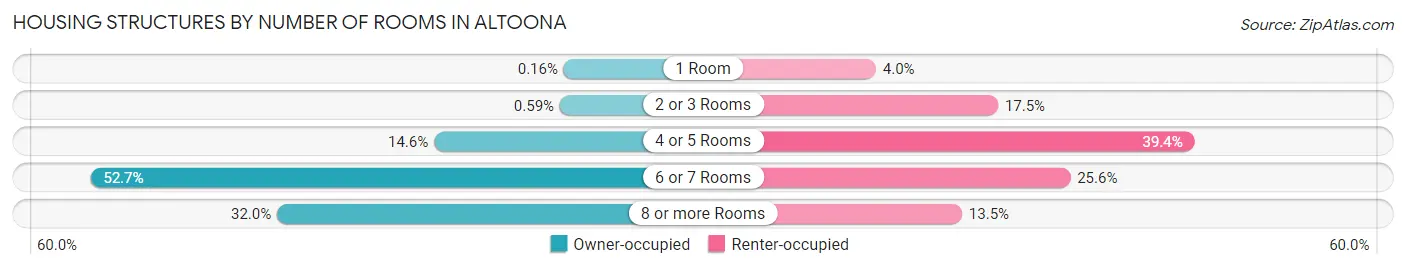
| Number of Rooms | Owner-occupied | Renter-occupied |
| 1 Room | 19 (0.2%) | 254 (4.0%) |
| 2 or 3 Rooms | 71 (0.6%) | 1,116 (17.5%) |
| 4 or 5 Rooms | 1,756 (14.6%) | 2,504 (39.4%) |
| 6 or 7 Rooms | 6,355 (52.7%) | 1,626 (25.6%) |
| 8 or more Rooms | 3,856 (32.0%) | 861 (13.5%) |
| Total | 12,057 (100.0%) | 6,361 (100.0%) |
Housing Structure by Heating Type in Altoona
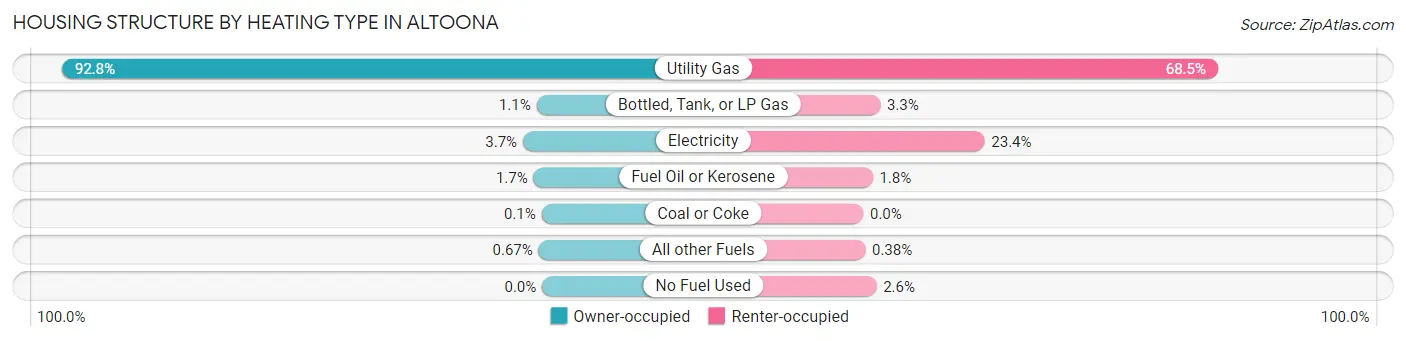
| Heating Type | Owner-occupied | Renter-occupied |
| Utility Gas | 11,189 (92.8%) | 4,360 (68.5%) |
| Bottled, Tank, or LP Gas | 129 (1.1%) | 208 (3.3%) |
| Electricity | 446 (3.7%) | 1,491 (23.4%) |
| Fuel Oil or Kerosene | 200 (1.7%) | 116 (1.8%) |
| Coal or Coke | 12 (0.1%) | 0 (0.0%) |
| All other Fuels | 81 (0.7%) | 24 (0.4%) |
| No Fuel Used | 0 (0.0%) | 162 (2.5%) |
| Total | 12,057 (100.0%) | 6,361 (100.0%) |
Household Vehicle Usage in Altoona
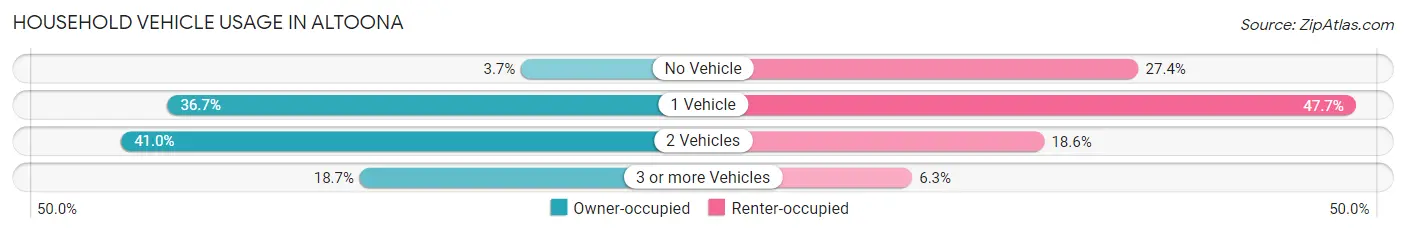
| Vehicles per Household | Owner-occupied | Renter-occupied |
| No Vehicle | 440 (3.6%) | 1,744 (27.4%) |
| 1 Vehicle | 4,420 (36.7%) | 3,032 (47.7%) |
| 2 Vehicles | 4,941 (41.0%) | 1,185 (18.6%) |
| 3 or more Vehicles | 2,256 (18.7%) | 400 (6.3%) |
| Total | 12,057 (100.0%) | 6,361 (100.0%) |
Real Estate & Mortgages in Altoona
Real Estate and Mortgage Overview in Altoona
| Characteristic | Without Mortgage | With Mortgage |
| Housing Units | 5,031 | 7,026 |
| Median Property Value | $99,400 | $118,300 |
| Median Household Income | $50,085 | $811 |
| Monthly Housing Costs | $450 | $58 |
| Real Estate Taxes | $1,272 | $101 |
Property Value by Mortgage Status in Altoona

| Property Value | Without Mortgage | With Mortgage |
| Less than $50,000 | 690 (13.7%) | 292 (4.2%) |
| $50,000 to $99,999 | 1,856 (36.9%) | 2,338 (33.3%) |
| $100,000 to $299,999 | 2,387 (47.4%) | 4,110 (58.5%) |
| $300,000 to $499,999 | 70 (1.4%) | 270 (3.8%) |
| $500,000 to $749,999 | 12 (0.2%) | 0 (0.0%) |
| $750,000 to $999,999 | 0 (0.0%) | 16 (0.2%) |
| $1,000,000 or more | 16 (0.3%) | 0 (0.0%) |
| Total | 5,031 (100.0%) | 7,026 (100.0%) |
Household Income by Mortgage Status in Altoona
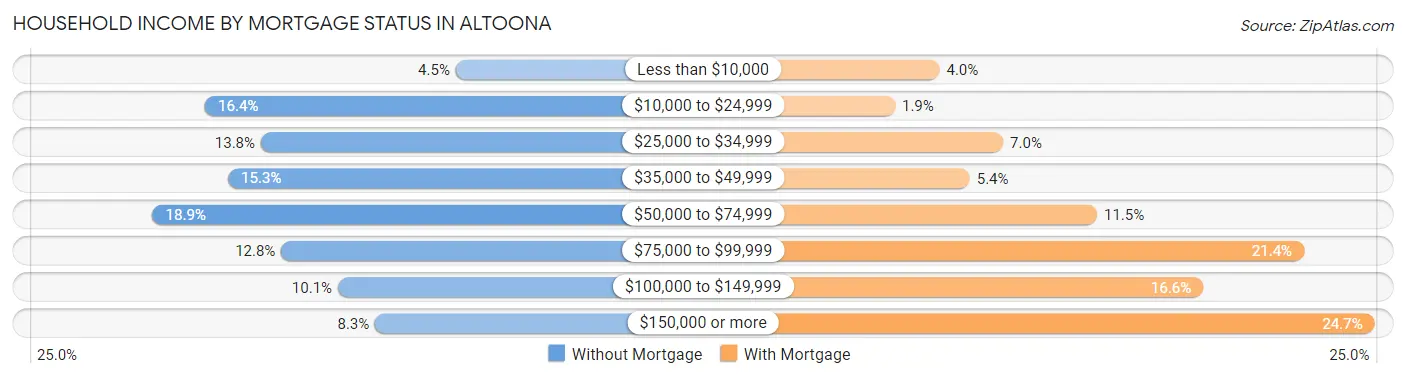
| Household Income | Without Mortgage | With Mortgage |
| Less than $10,000 | 225 (4.5%) | 281 (4.0%) |
| $10,000 to $24,999 | 825 (16.4%) | 132 (1.9%) |
| $25,000 to $34,999 | 692 (13.8%) | 494 (7.0%) |
| $35,000 to $49,999 | 770 (15.3%) | 382 (5.4%) |
| $50,000 to $74,999 | 951 (18.9%) | 808 (11.5%) |
| $75,000 to $99,999 | 643 (12.8%) | 1,500 (21.3%) |
| $100,000 to $149,999 | 507 (10.1%) | 1,163 (16.6%) |
| $150,000 or more | 418 (8.3%) | 1,736 (24.7%) |
| Total | 5,031 (100.0%) | 7,026 (100.0%) |
Property Value to Household Income Ratio in Altoona
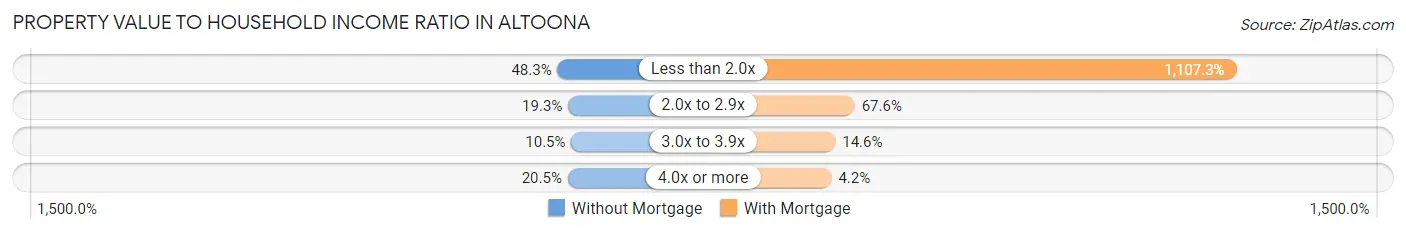
| Value-to-Income Ratio | Without Mortgage | With Mortgage |
| Less than 2.0x | 2,430 (48.3%) | 77,800 (1,107.3%) |
| 2.0x to 2.9x | 971 (19.3%) | 4,751 (67.6%) |
| 3.0x to 3.9x | 530 (10.5%) | 1,027 (14.6%) |
| 4.0x or more | 1,029 (20.4%) | 297 (4.2%) |
| Total | 5,031 (100.0%) | 7,026 (100.0%) |
Real Estate Taxes by Mortgage Status in Altoona
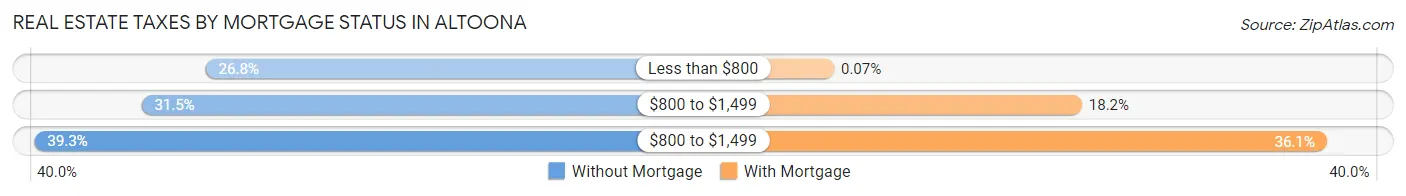
| Property Taxes | Without Mortgage | With Mortgage |
| Less than $800 | 1,347 (26.8%) | 5 (0.1%) |
| $800 to $1,499 | 1,583 (31.5%) | 1,277 (18.2%) |
| $800 to $1,499 | 1,976 (39.3%) | 2,534 (36.1%) |
| Total | 5,031 (100.0%) | 7,026 (100.0%) |
Health & Disability in Altoona
Health Insurance Coverage by Age in Altoona
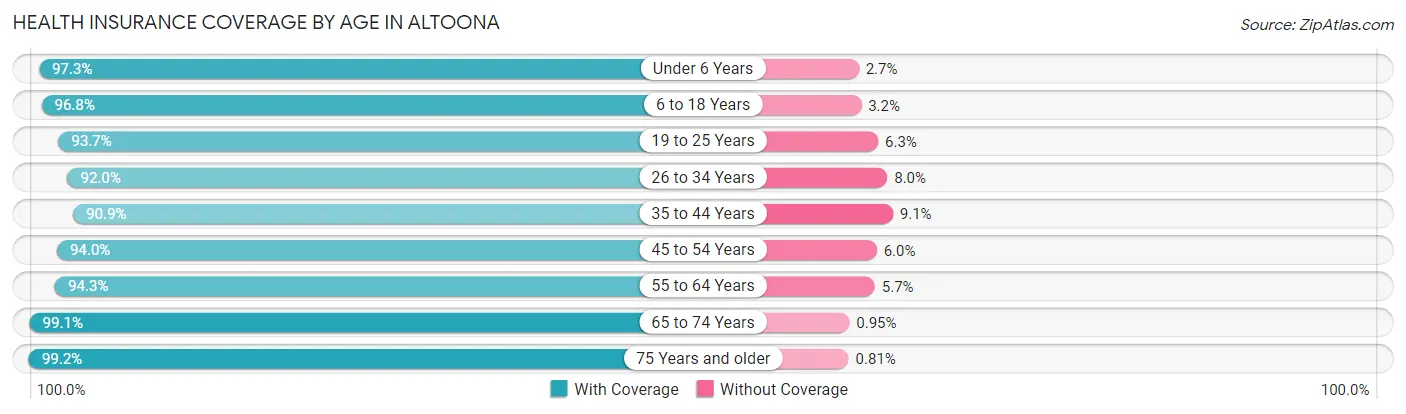
| Age Bracket | With Coverage | Without Coverage |
| Under 6 Years | 2,889 (97.3%) | 80 (2.7%) |
| 6 to 18 Years | 6,950 (96.8%) | 227 (3.2%) |
| 19 to 25 Years | 3,825 (93.7%) | 257 (6.3%) |
| 26 to 34 Years | 4,852 (92.0%) | 423 (8.0%) |
| 35 to 44 Years | 4,587 (90.9%) | 457 (9.1%) |
| 45 to 54 Years | 5,413 (94.0%) | 348 (6.0%) |
| 55 to 64 Years | 5,506 (94.3%) | 333 (5.7%) |
| 65 to 74 Years | 4,289 (99.1%) | 41 (0.9%) |
| 75 Years and older | 2,951 (99.2%) | 24 (0.8%) |
| Total | 41,262 (95.0%) | 2,190 (5.0%) |
Health Insurance Coverage by Citizenship Status in Altoona
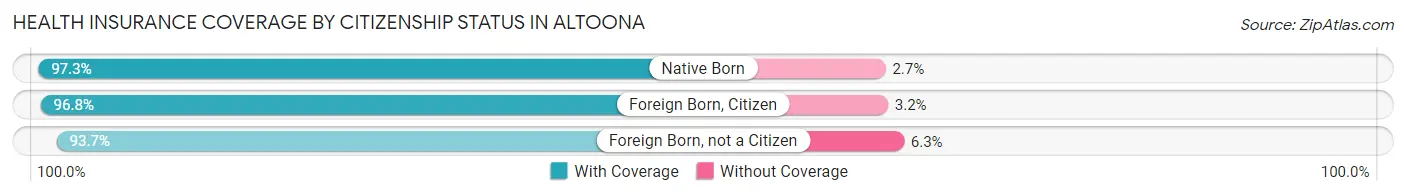
| Citizenship Status | With Coverage | Without Coverage |
| Native Born | 2,889 (97.3%) | 80 (2.7%) |
| Foreign Born, Citizen | 6,950 (96.8%) | 227 (3.2%) |
| Foreign Born, not a Citizen | 3,825 (93.7%) | 257 (6.3%) |
Health Insurance Coverage by Household Income in Altoona
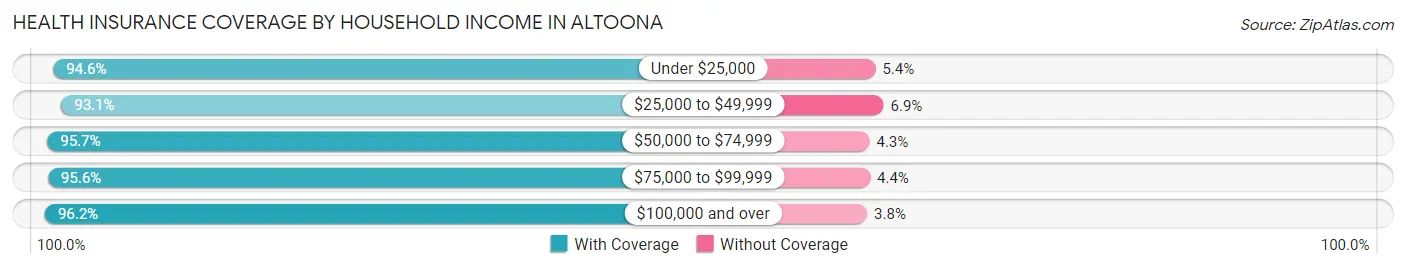
| Household Income | With Coverage | Without Coverage |
| Under $25,000 | 6,941 (94.6%) | 394 (5.4%) |
| $25,000 to $49,999 | 9,195 (93.1%) | 680 (6.9%) |
| $50,000 to $74,999 | 7,780 (95.7%) | 346 (4.3%) |
| $75,000 to $99,999 | 5,455 (95.6%) | 249 (4.4%) |
| $100,000 and over | 11,258 (96.2%) | 447 (3.8%) |
Public vs Private Health Insurance Coverage by Age in Altoona
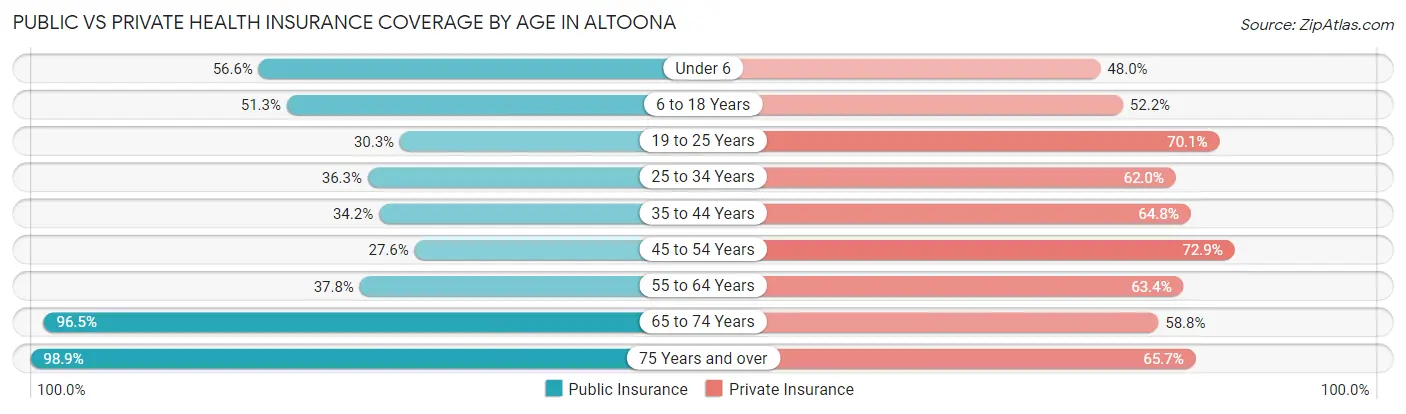
| Age Bracket | Public Insurance | Private Insurance |
| Under 6 | 1,679 (56.6%) | 1,425 (48.0%) |
| 6 to 18 Years | 3,684 (51.3%) | 3,745 (52.2%) |
| 19 to 25 Years | 1,238 (30.3%) | 2,860 (70.1%) |
| 25 to 34 Years | 1,915 (36.3%) | 3,270 (62.0%) |
| 35 to 44 Years | 1,726 (34.2%) | 3,266 (64.7%) |
| 45 to 54 Years | 1,591 (27.6%) | 4,199 (72.9%) |
| 55 to 64 Years | 2,207 (37.8%) | 3,703 (63.4%) |
| 65 to 74 Years | 4,177 (96.5%) | 2,544 (58.8%) |
| 75 Years and over | 2,943 (98.9%) | 1,953 (65.6%) |
| Total | 21,160 (48.7%) | 26,965 (62.1%) |
Disability Status by Sex by Age in Altoona
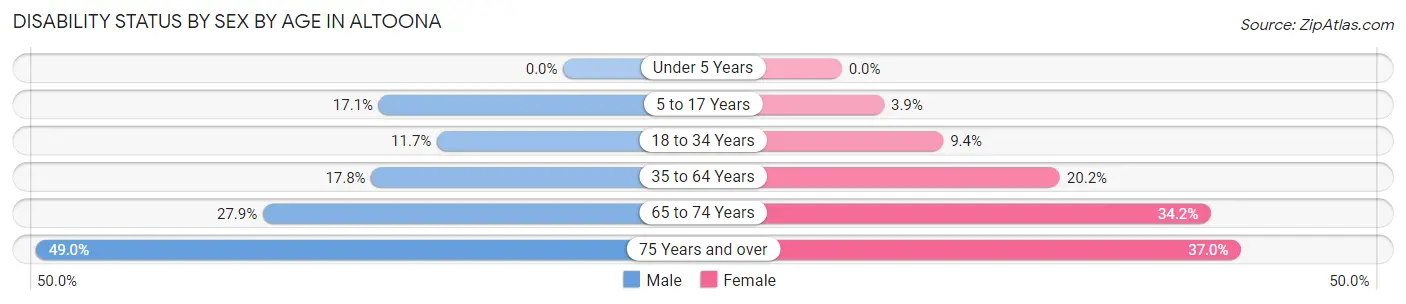
| Age Bracket | Male | Female |
| Under 5 Years | 0 (0.0%) | 0 (0.0%) |
| 5 to 17 Years | 619 (17.1%) | 131 (3.9%) |
| 18 to 34 Years | 578 (11.7%) | 475 (9.4%) |
| 35 to 64 Years | 1,483 (17.8%) | 1,683 (20.2%) |
| 65 to 74 Years | 508 (27.9%) | 857 (34.2%) |
| 75 Years and over | 674 (48.9%) | 591 (37.0%) |
Disability Class by Sex by Age in Altoona
Disability Class: Hearing Difficulty
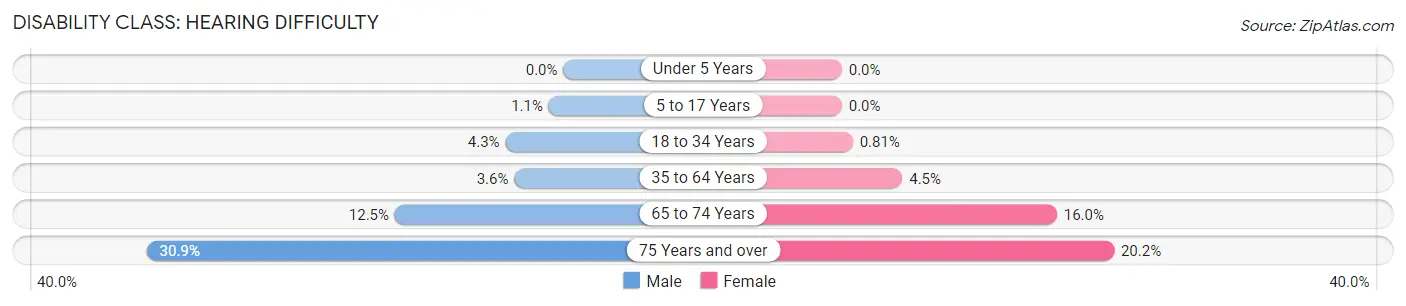
| Age Bracket | Male | Female |
| Under 5 Years | 0 (0.0%) | 0 (0.0%) |
| 5 to 17 Years | 39 (1.1%) | 0 (0.0%) |
| 18 to 34 Years | 212 (4.3%) | 41 (0.8%) |
| 35 to 64 Years | 303 (3.6%) | 373 (4.5%) |
| 65 to 74 Years | 228 (12.5%) | 400 (16.0%) |
| 75 Years and over | 426 (30.9%) | 323 (20.2%) |
Disability Class: Vision Difficulty
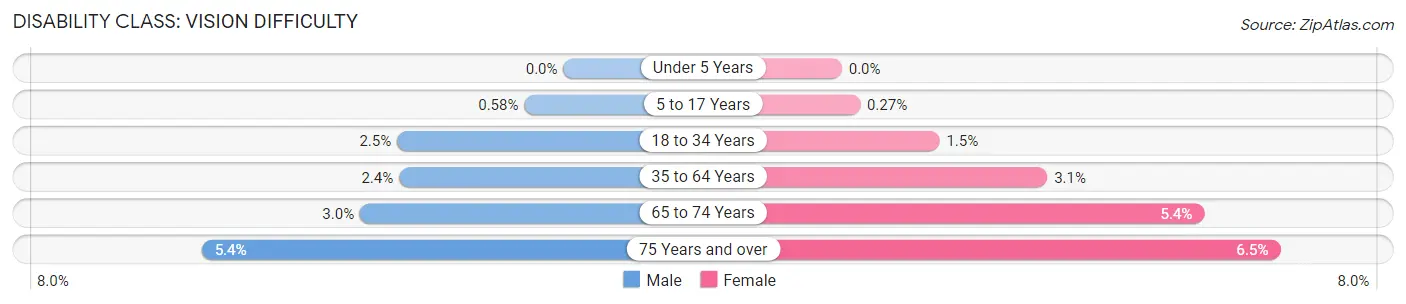
| Age Bracket | Male | Female |
| Under 5 Years | 0 (0.0%) | 0 (0.0%) |
| 5 to 17 Years | 21 (0.6%) | 9 (0.3%) |
| 18 to 34 Years | 122 (2.5%) | 73 (1.5%) |
| 35 to 64 Years | 203 (2.4%) | 254 (3.0%) |
| 65 to 74 Years | 55 (3.0%) | 135 (5.4%) |
| 75 Years and over | 74 (5.4%) | 104 (6.5%) |
Disability Class: Cognitive Difficulty
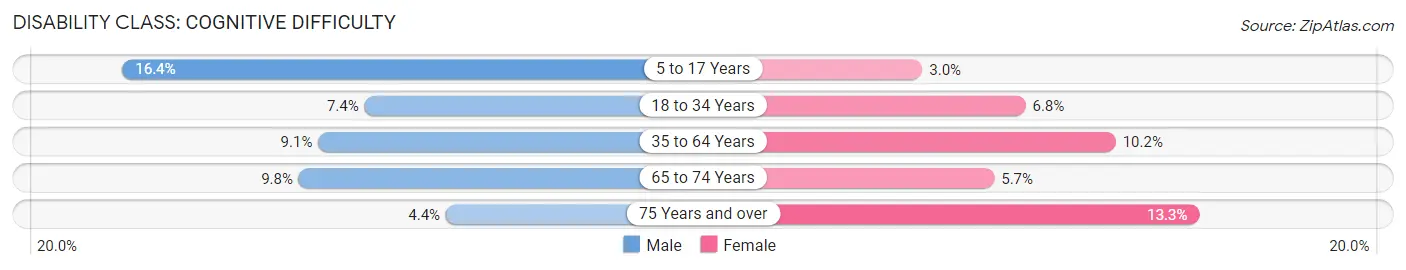
| Age Bracket | Male | Female |
| 5 to 17 Years | 592 (16.4%) | 100 (3.0%) |
| 18 to 34 Years | 364 (7.4%) | 344 (6.8%) |
| 35 to 64 Years | 758 (9.1%) | 846 (10.2%) |
| 65 to 74 Years | 179 (9.8%) | 142 (5.7%) |
| 75 Years and over | 60 (4.4%) | 212 (13.3%) |
Disability Class: Ambulatory Difficulty
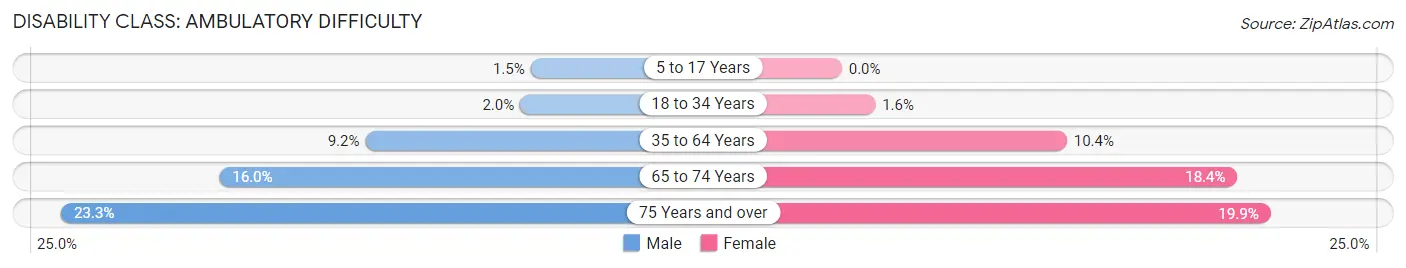
| Age Bracket | Male | Female |
| 5 to 17 Years | 55 (1.5%) | 0 (0.0%) |
| 18 to 34 Years | 99 (2.0%) | 78 (1.5%) |
| 35 to 64 Years | 765 (9.2%) | 868 (10.4%) |
| 65 to 74 Years | 291 (16.0%) | 460 (18.3%) |
| 75 Years and over | 321 (23.3%) | 318 (19.9%) |
Disability Class: Self-Care Difficulty
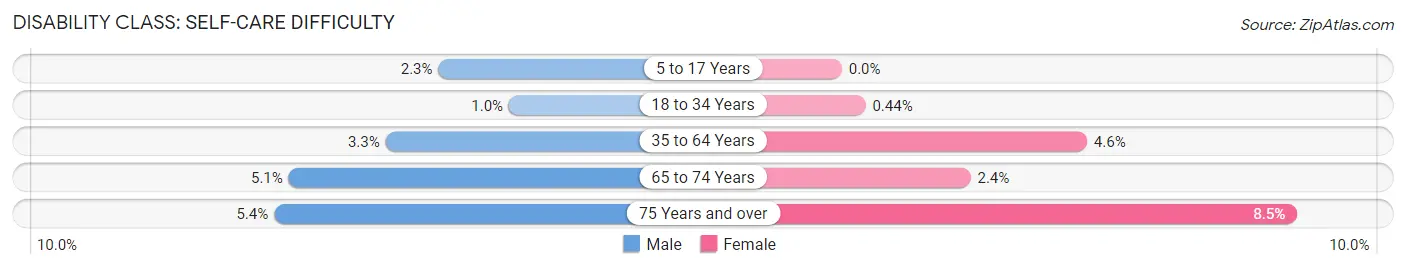
| Age Bracket | Male | Female |
| 5 to 17 Years | 84 (2.3%) | 0 (0.0%) |
| 18 to 34 Years | 50 (1.0%) | 22 (0.4%) |
| 35 to 64 Years | 275 (3.3%) | 378 (4.5%) |
| 65 to 74 Years | 93 (5.1%) | 60 (2.4%) |
| 75 Years and over | 74 (5.4%) | 135 (8.5%) |
Technology Access in Altoona
Computing Device Access in Altoona
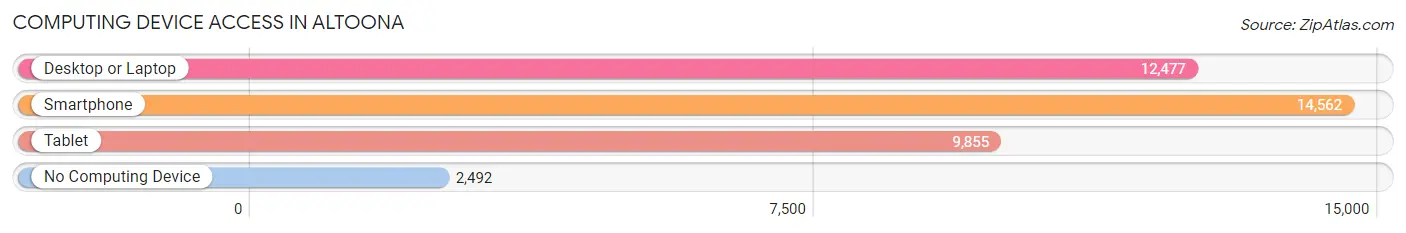
| Device Type | # Households | % Households |
| Desktop or Laptop | 12,477 | 67.7% |
| Smartphone | 14,562 | 79.1% |
| Tablet | 9,855 | 53.5% |
| No Computing Device | 2,492 | 13.5% |
| Total | 18,418 | 100.0% |
Internet Access in Altoona
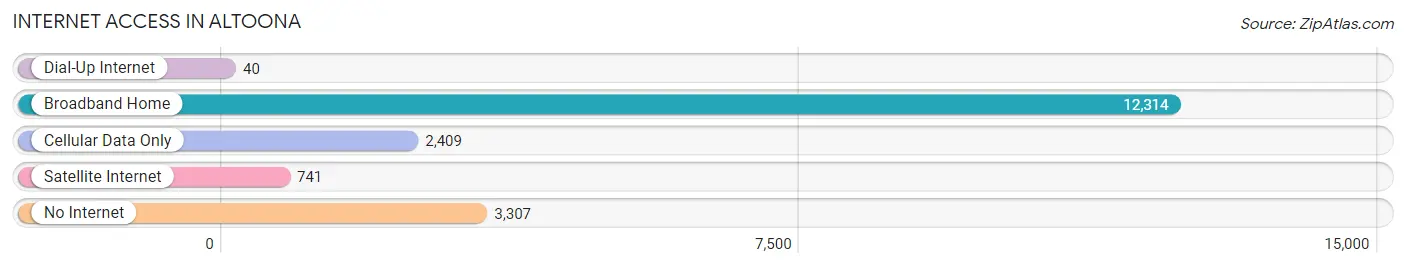
| Internet Type | # Households | % Households |
| Dial-Up Internet | 40 | 0.2% |
| Broadband Home | 12,314 | 66.9% |
| Cellular Data Only | 2,409 | 13.1% |
| Satellite Internet | 741 | 4.0% |
| No Internet | 3,307 | 18.0% |
| Total | 18,418 | 100.0% |
Altoona Summary
Altoona, Pennsylvania is a city located in Blair County, Pennsylvania, United States. It is the county seat of Blair County and the principal city of the Altoona Metropolitan Statistical Area (MSA). The population of Altoona was 46,320 at the 2010 census, making it the tenth most populous city in Pennsylvania. The MSA had a population of 127,089 at the 2010 census, making it the tenth largest metropolitan area in the state.
History
Altoona was founded in 1849 by the Pennsylvania Railroad (PRR) as the site for a shop and maintenance complex. The city was named after the PRR's president, John Edgar Thomson, whose middle name was Altona. The town grew rapidly in the late 19th century, its population increasing from a few hundred in 1860 to more than 20,000 in 1880. The PRR's extensive rail yards and repair shops were the major employer in the city for much of the 19th and 20th centuries.
Geography
Altoona is located in central Pennsylvania at 40°29′N 78°23′W (40.48, -78.38). It is at the base of the Allegheny Mountains and is surrounded by several smaller mountains. The city is situated along the Juniata River, which flows through the city from east to west.
Altoona is located in the Ridge and Valley physiographic province of the Appalachian Mountains. The city is located in the Allegheny Plateau, which is characterized by rolling hills and valleys. The city is located in the Horseshoe Curve, a large bend in the Juniata River.
Economy
Altoona's economy is largely based on the service sector, with healthcare, retail, and education being the largest employers. The city is also home to several manufacturing companies, including Sheetz, a convenience store chain, and GKN Sinter Metals, a manufacturer of powdered metal parts.
The city is also home to several major transportation companies, including Norfolk Southern, CSX, and Amtrak. The city is served by the Altoona-Blair County Airport, which provides regional air service.
Demographics
As of the 2010 census, the population of Altoona was 46,320, with a population density of 1,845.7 people per square mile. The racial makeup of the city was 87.2% White, 8.3% African American, 0.3% Native American, 1.2% Asian, 0.1% Pacific Islander, 0.7% from other races, and 2.3% from two or more races. Hispanic or Latino of any race were 2.7% of the population.
The median income for a household in the city was $31,945, and the median income for a family was $41,945. The per capita income for the city was $18,945. About 14.2% of families and 17.3% of the population were below the poverty line, including 25.2% of those under age 18 and 8.7% of those age 65 or over.
Altoona is home to a diverse population, with a variety of ethnic and religious backgrounds. The city is home to a large Catholic population, as well as a significant Jewish population. The city also has a large population of immigrants from Eastern Europe, particularly from Ukraine and Russia.
Common Questions
What is Per Capita Income in Altoona?
Per Capita income in Altoona is $29,320.
What is the Median Family Income in Altoona?
Median Family Income in Altoona is $67,910.
What is the Median Household income in Altoona?
Median Household Income in Altoona is $50,435.
What is Income or Wage Gap in Altoona?
Income or Wage Gap in Altoona is 27.4%.
Women in Altoona earn 72.6 cents for every dollar earned by a man.
What is Family Income Deficit in Altoona?
Family Income Deficit in Altoona is $10,505.
Families that are below poverty line in Altoona earn $10,505 less on average than the poverty threshold level.
What is Inequality or Gini Index in Altoona?
Inequality or Gini Index in Altoona is 0.46.
What is the Total Population of Altoona?
Total Population of Altoona is 43,821.
What is the Total Male Population of Altoona?
Total Male Population of Altoona is 21,376.
What is the Total Female Population of Altoona?
Total Female Population of Altoona is 22,445.
What is the Ratio of Males per 100 Females in Altoona?
There are 95.24 Males per 100 Females in Altoona.
What is the Ratio of Females per 100 Males in Altoona?
There are 105.00 Females per 100 Males in Altoona.
What is the Median Population Age in Altoona?
Median Population Age in Altoona is 39.7 Years.
What is the Average Family Size in Altoona
Average Family Size in Altoona is 3.0 People.
What is the Average Household Size in Altoona
Average Household Size in Altoona is 2.3 People.
How Large is the Labor Force in Altoona?
There are 20,807 People in the Labor Forcein in Altoona.
What is the Percentage of People in the Labor Force in Altoona?
58.8% of People are in the Labor Force in Altoona.
What is the Unemployment Rate in Altoona?
Unemployment Rate in Altoona is 6.0%.