Philadelphia County, PA Map & Demographics
Philadelphia County Map
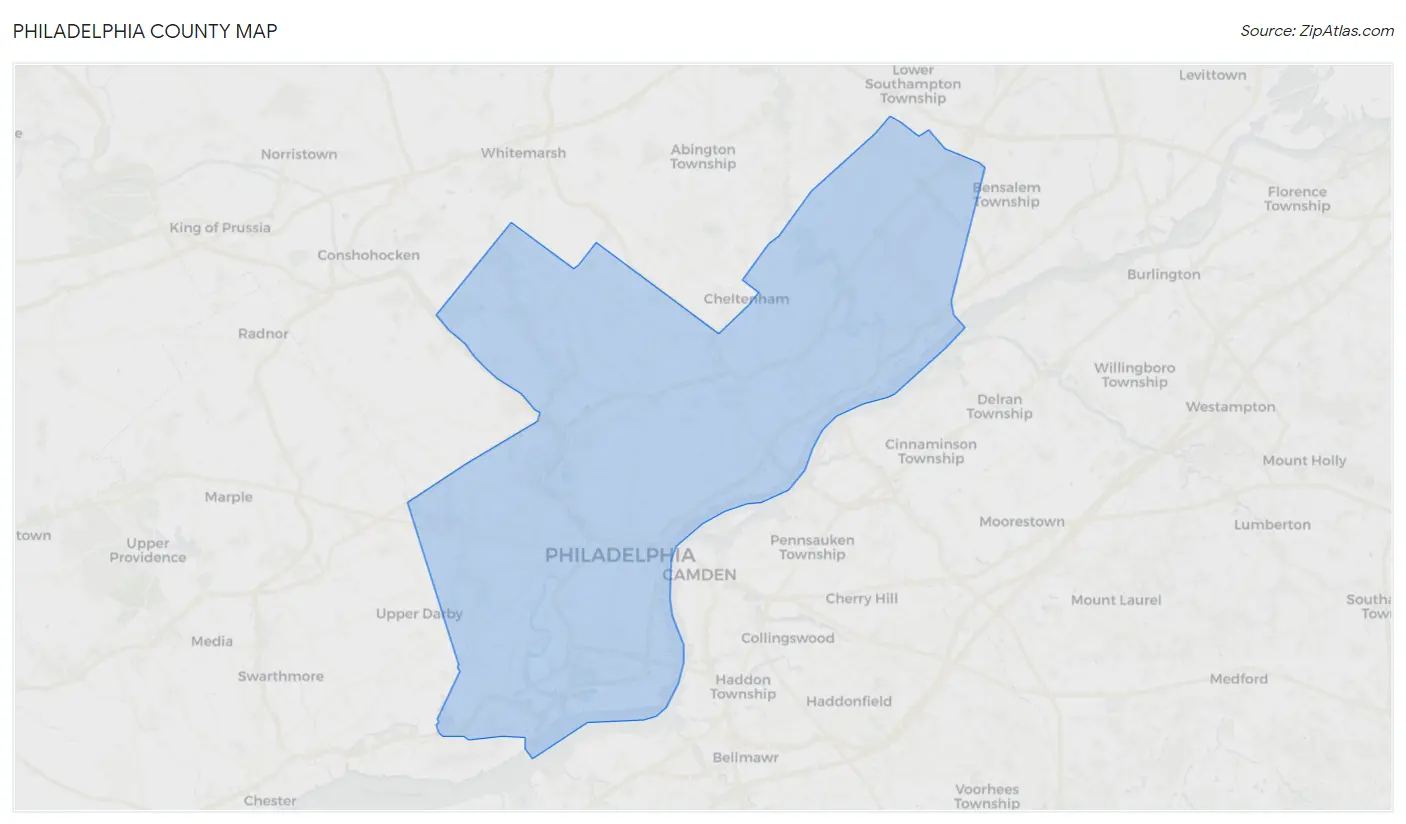
Philadelphia County Overview
$35,553
PER CAPITA INCOME
$67,168
AVG FAMILY INCOME
$57,537
AVG HOUSEHOLD INCOME
15.6%
WAGE / INCOME GAP [ % ]
84.4¢/ $1
WAGE / INCOME GAP [ $ ]
$11,385
FAMILY INCOME DEFICIT
0.52
INEQUALITY / GINI INDEX
1,593,208
TOTAL POPULATION
757,083
MALE POPULATION
836,125
FEMALE POPULATION
90.55
MALES / 100 FEMALES
110.44
FEMALES / 100 MALES
34.8
MEDIAN AGE
3.2
AVG FAMILY SIZE
2.3
AVG HOUSEHOLD SIZE
806,680
LABOR FORCE [ PEOPLE ]
62.8%
PERCENT IN LABOR FORCE
8.6%
UNEMPLOYMENT RATE
Income in Philadelphia County
Income Overview in Philadelphia County
Per Capita Income in Philadelphia County is $35,553, while median incomes of families and households are $67,168 and $57,537 respectively.
| Characteristic | Number | Measure |
| Per Capita Income | 1,593,208 | $35,553 |
| Median Family Income | 350,182 | $67,168 |
| Mean Family Income | 350,182 | $97,591 |
| Median Household Income | 659,129 | $57,537 |
| Mean Household Income | 659,129 | $84,435 |
| Income Deficit | 350,182 | $11,385 |
| Wage / Income Gap (%) | 1,593,208 | 15.59% |
| Wage / Income Gap ($) | 1,593,208 | 84.41¢ per $1 |
| Gini / Inequality Index | 1,593,208 | 0.52 |
Earnings by Sex in Philadelphia County
Average Earnings in Philadelphia County are $40,230, $43,784 for men and $36,960 for women, a difference of 15.6%.
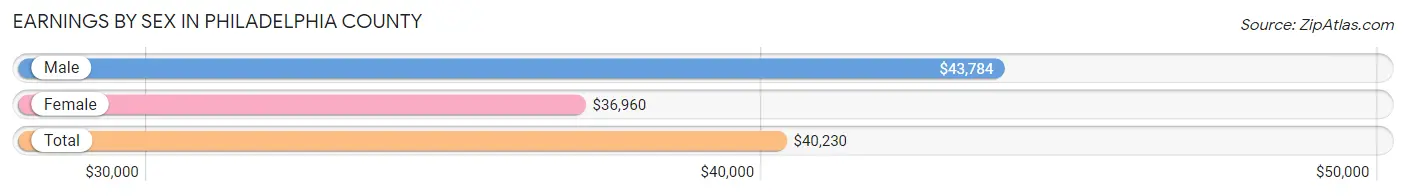
| Sex | Number | Average Earnings |
| Male | 402,142 (48.6%) | $43,784 |
| Female | 425,953 (51.4%) | $36,960 |
| Total | 828,095 (100.0%) | $40,230 |
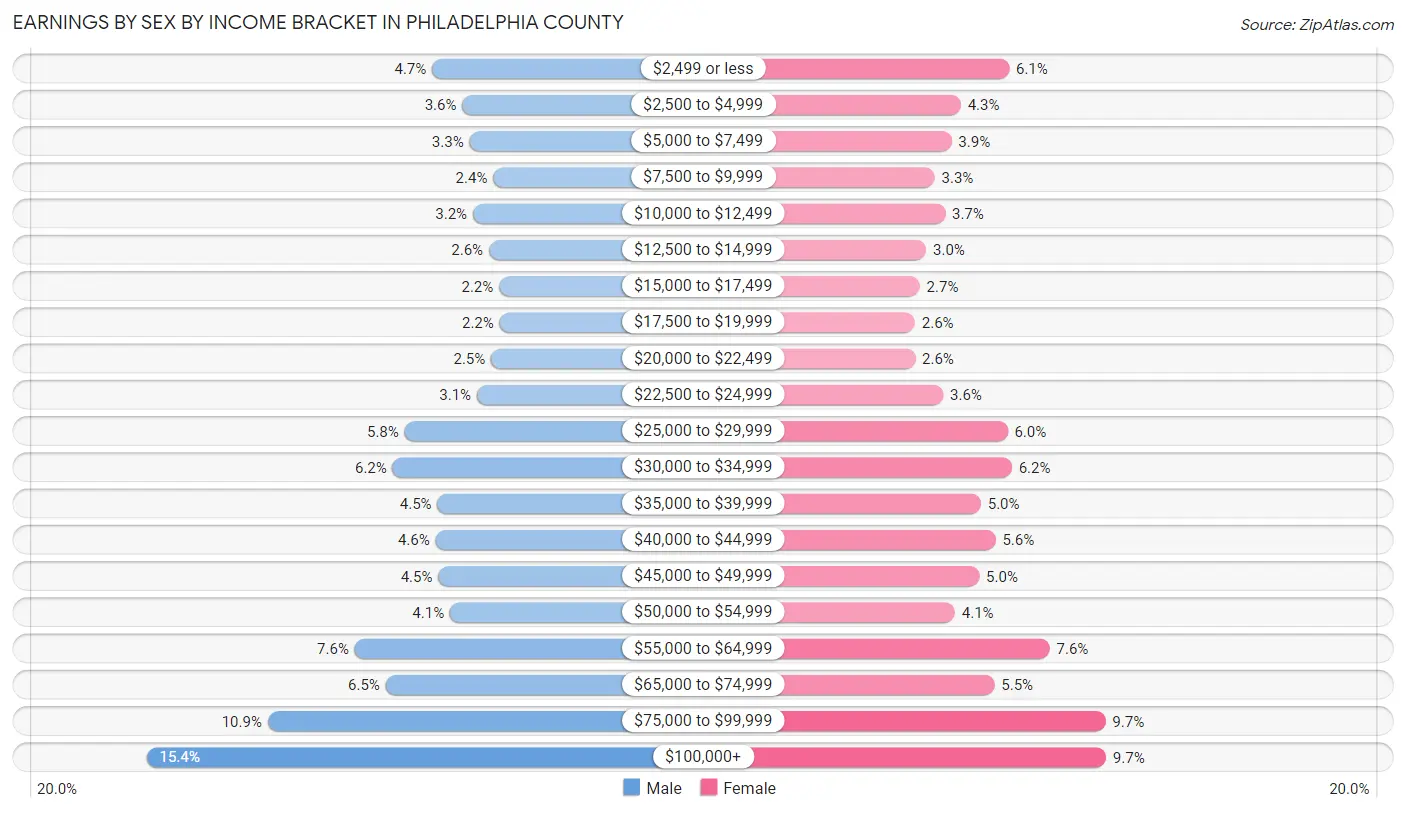
Earnings by Sex by Income Bracket in Philadelphia County
The most common earnings brackets in Philadelphia County are $100,000+ for men (62,063 | 15.4%) and $100,000+ for women (41,378 | 9.7%).
| Income | Male | Female |
| $2,499 or less | 19,037 (4.7%) | 25,887 (6.1%) |
| $2,500 to $4,999 | 14,490 (3.6%) | 18,194 (4.3%) |
| $5,000 to $7,499 | 13,398 (3.3%) | 16,717 (3.9%) |
| $7,500 to $9,999 | 9,813 (2.4%) | 14,017 (3.3%) |
| $10,000 to $12,499 | 12,884 (3.2%) | 15,679 (3.7%) |
| $12,500 to $14,999 | 10,463 (2.6%) | 12,667 (3.0%) |
| $15,000 to $17,499 | 8,919 (2.2%) | 11,618 (2.7%) |
| $17,500 to $19,999 | 8,855 (2.2%) | 10,842 (2.5%) |
| $20,000 to $22,499 | 10,138 (2.5%) | 10,917 (2.6%) |
| $22,500 to $24,999 | 12,280 (3.0%) | 15,375 (3.6%) |
| $25,000 to $29,999 | 23,170 (5.8%) | 25,633 (6.0%) |
| $30,000 to $34,999 | 24,977 (6.2%) | 26,327 (6.2%) |
| $35,000 to $39,999 | 18,214 (4.5%) | 21,402 (5.0%) |
| $40,000 to $44,999 | 18,514 (4.6%) | 23,718 (5.6%) |
| $45,000 to $49,999 | 18,100 (4.5%) | 21,114 (5.0%) |
| $50,000 to $54,999 | 16,336 (4.1%) | 17,250 (4.1%) |
| $55,000 to $64,999 | 30,682 (7.6%) | 32,372 (7.6%) |
| $65,000 to $74,999 | 26,011 (6.5%) | 23,564 (5.5%) |
| $75,000 to $99,999 | 43,798 (10.9%) | 41,282 (9.7%) |
| $100,000+ | 62,063 (15.4%) | 41,378 (9.7%) |
| Total | 402,142 (100.0%) | 425,953 (100.0%) |
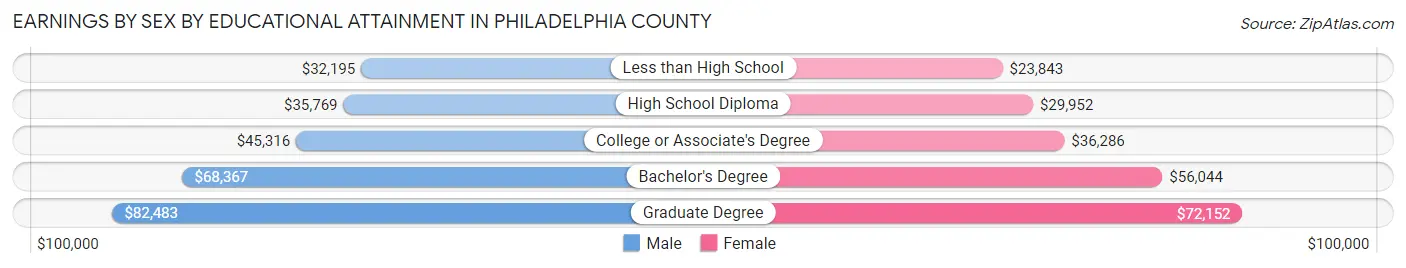
Earnings by Sex by Educational Attainment in Philadelphia County
Average earnings in Philadelphia County are $49,952 for men and $42,761 for women, a difference of 14.4%. Men with an educational attainment of graduate degree enjoy the highest average annual earnings of $82,483, while those with less than high school education earn the least with $32,195. Women with an educational attainment of graduate degree earn the most with the average annual earnings of $72,152, while those with less than high school education have the smallest earnings of $23,843.
| Educational Attainment | Male Income | Female Income |
| Less than High School | $32,195 | $23,843 |
| High School Diploma | $35,769 | $29,952 |
| College or Associate's Degree | $45,316 | $36,286 |
| Bachelor's Degree | $68,367 | $56,044 |
| Graduate Degree | $82,483 | $72,152 |
| Total | $49,952 | $42,761 |
Family Income in Philadelphia County
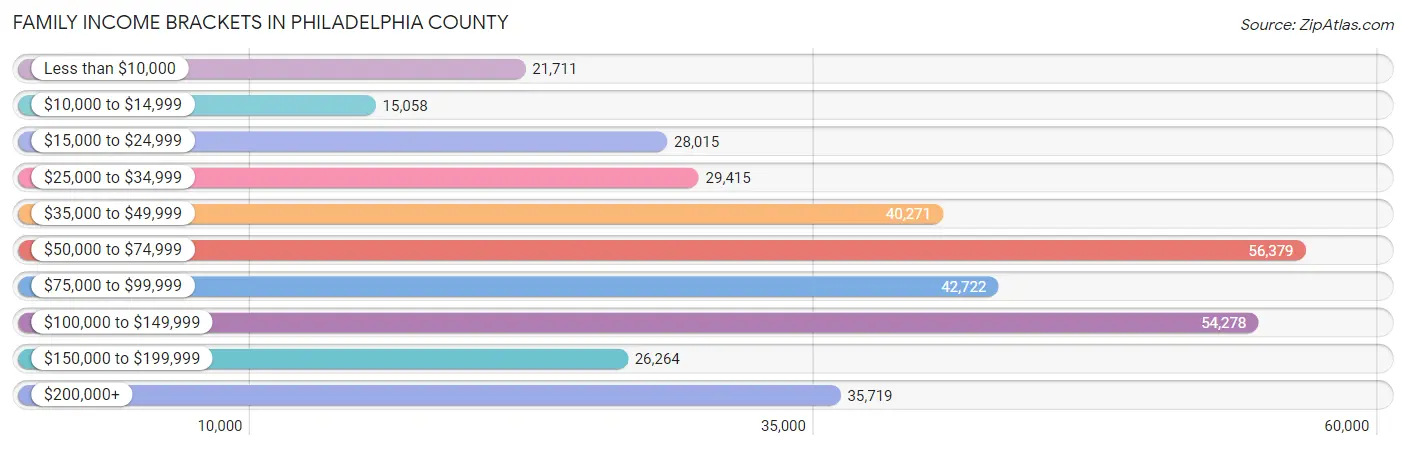
Family Income Brackets in Philadelphia County
According to the Philadelphia County family income data, there are 56,379 families falling into the $50,000 to $74,999 income range, which is the most common income bracket and makes up 16.1% of all families. Conversely, the $10,000 to $14,999 income bracket is the least frequent group with only 15,058 families (4.3%) belonging to this category.
| Income Bracket | # Families | % Families |
| Less than $10,000 | 21,711 | 6.2% |
| $10,000 to $14,999 | 15,058 | 4.3% |
| $15,000 to $24,999 | 28,015 | 8.0% |
| $25,000 to $34,999 | 29,415 | 8.4% |
| $35,000 to $49,999 | 40,271 | 11.5% |
| $50,000 to $74,999 | 56,379 | 16.1% |
| $75,000 to $99,999 | 42,722 | 12.2% |
| $100,000 to $149,999 | 54,278 | 15.5% |
| $150,000 to $199,999 | 26,264 | 7.5% |
| $200,000+ | 35,719 | 10.2% |
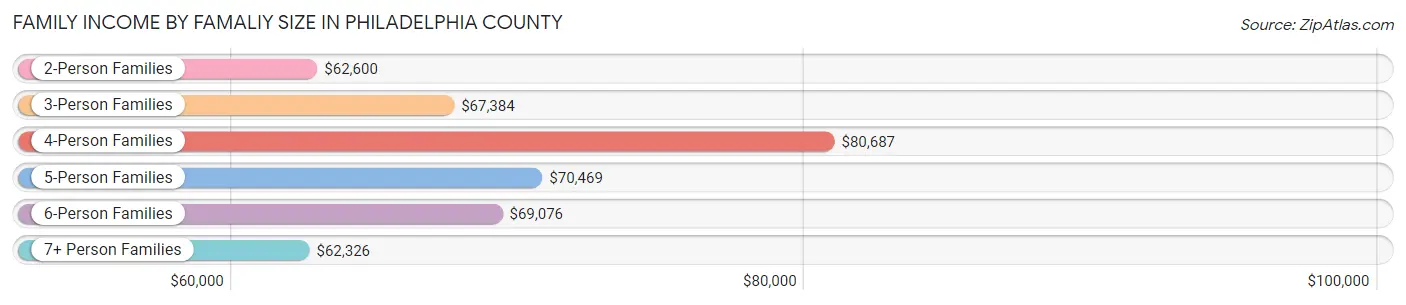
Family Income by Famaliy Size in Philadelphia County
4-person families (58,253 | 16.6%) account for the highest median family income in Philadelphia County with $80,687 per family, while 2-person families (157,208 | 44.9%) have the highest median income of $31,300 per family member.
| Income Bracket | # Families | Median Income |
| 2-Person Families | 157,208 (44.9%) | $62,600 |
| 3-Person Families | 89,826 (25.7%) | $67,384 |
| 4-Person Families | 58,253 (16.6%) | $80,687 |
| 5-Person Families | 27,714 (7.9%) | $70,469 |
| 6-Person Families | 9,937 (2.8%) | $69,076 |
| 7+ Person Families | 7,244 (2.1%) | $62,326 |
| Total | 350,182 (100.0%) | $67,168 |
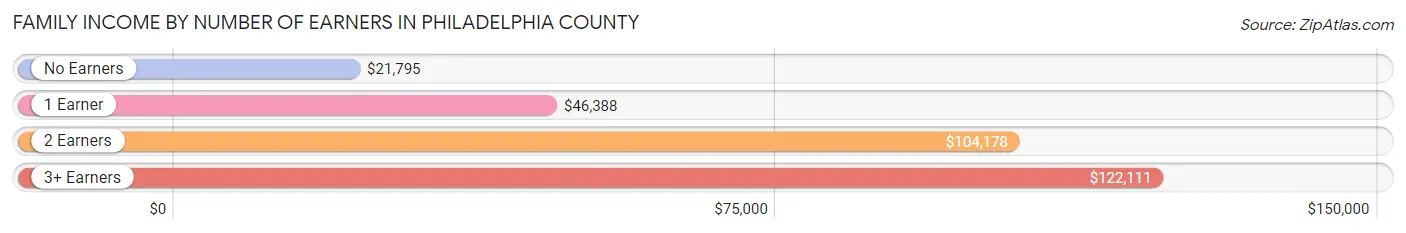
Family Income by Number of Earners in Philadelphia County
The median family income in Philadelphia County is $67,168, with families comprising 3+ earners (35,207) having the highest median family income of $122,111, while families with no earners (51,862) have the lowest median family income of $21,795, accounting for 10.1% and 14.8% of families, respectively.
| Number of Earners | # Families | Median Income |
| No Earners | 51,862 (14.8%) | $21,795 |
| 1 Earner | 132,072 (37.7%) | $46,388 |
| 2 Earners | 131,041 (37.4%) | $104,178 |
| 3+ Earners | 35,207 (10.1%) | $122,111 |
| Total | 350,182 (100.0%) | $67,168 |
Household Income in Philadelphia County
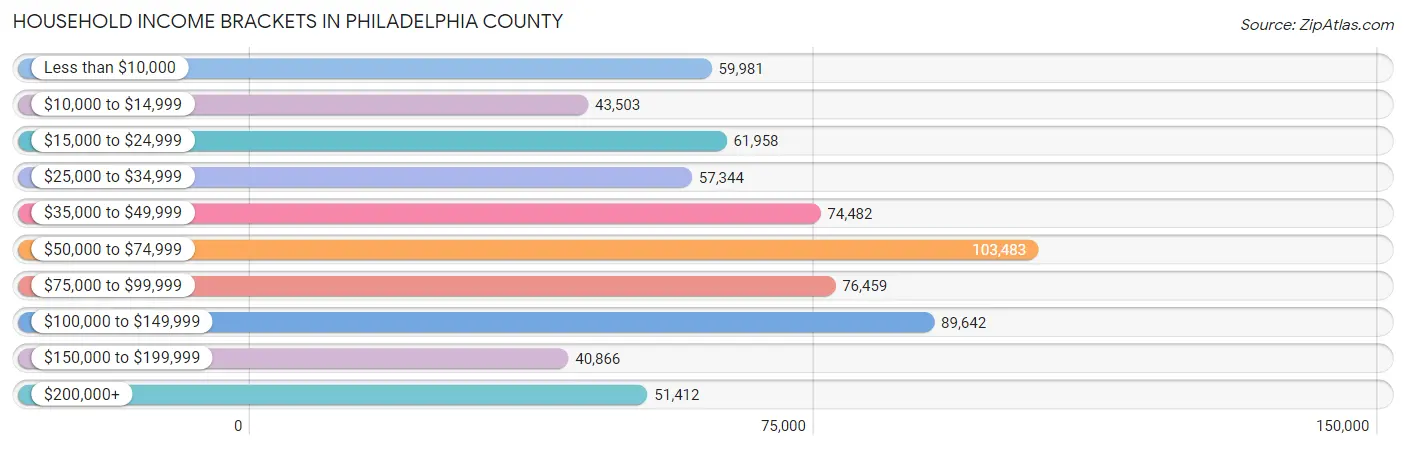
Household Income Brackets in Philadelphia County
With 103,483 households falling in the category, the $50,000 to $74,999 income range is the most frequent in Philadelphia County, accounting for 15.7% of all households. In contrast, only 40,866 households (6.2%) fall into the $150,000 to $199,999 income bracket, making it the least populous group.
| Income Bracket | # Households | % Households |
| Less than $10,000 | 59,981 | 9.1% |
| $10,000 to $14,999 | 43,503 | 6.6% |
| $15,000 to $24,999 | 61,958 | 9.4% |
| $25,000 to $34,999 | 57,344 | 8.7% |
| $35,000 to $49,999 | 74,482 | 11.3% |
| $50,000 to $74,999 | 103,483 | 15.7% |
| $75,000 to $99,999 | 76,459 | 11.6% |
| $100,000 to $149,999 | 89,642 | 13.6% |
| $150,000 to $199,999 | 40,866 | 6.2% |
| $200,000+ | 51,412 | 7.8% |
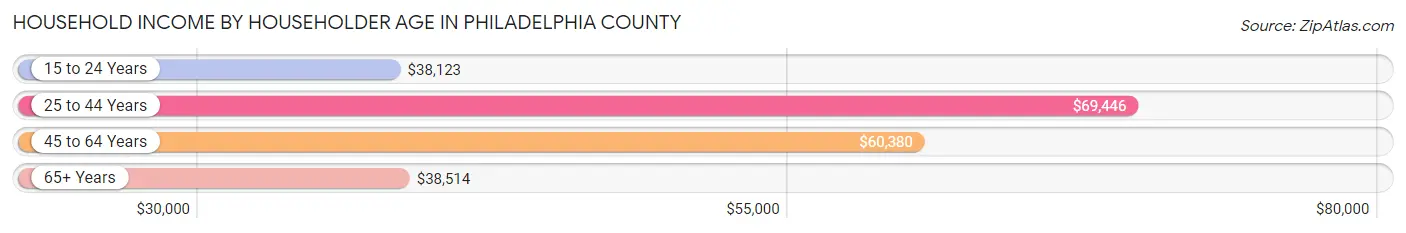
Household Income by Householder Age in Philadelphia County
The median household income in Philadelphia County is $57,537, with the highest median household income of $69,446 found in the 25 to 44 years age bracket for the primary householder. A total of 262,021 households (39.8%) fall into this category. Meanwhile, the 15 to 24 years age bracket for the primary householder has the lowest median household income of $38,123, with 27,067 households (4.1%) in this group.
| Income Bracket | # Households | Median Income |
| 15 to 24 Years | 27,067 (4.1%) | $38,123 |
| 25 to 44 Years | 262,021 (39.8%) | $69,446 |
| 45 to 64 Years | 218,812 (33.2%) | $60,380 |
| 65+ Years | 151,229 (22.9%) | $38,514 |
| Total | 659,129 (100.0%) | $57,537 |
Poverty in Philadelphia County
Income Below Poverty by Sex and Age in Philadelphia County
With 21.3% poverty level for males and 24.0% for females among the residents of Philadelphia County, 6 to 11 year old males and 6 to 11 year old females are the most vulnerable to poverty, with 20,431 males (35.1%) and 18,832 females (33.7%) in their respective age groups living below the poverty level.
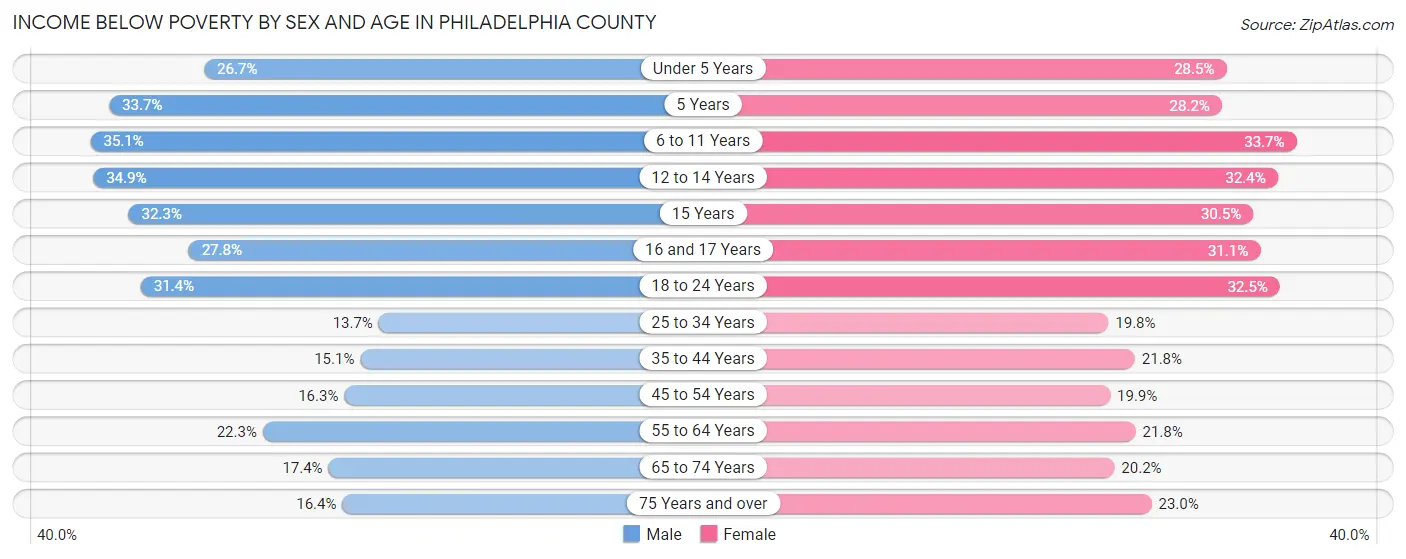
| Age Bracket | Male | Female |
| Under 5 Years | 13,105 (26.7%) | 13,594 (28.5%) |
| 5 Years | 2,994 (33.7%) | 2,139 (28.2%) |
| 6 to 11 Years | 20,431 (35.1%) | 18,832 (33.7%) |
| 12 to 14 Years | 9,807 (34.9%) | 9,028 (32.4%) |
| 15 Years | 3,180 (32.3%) | 2,802 (30.5%) |
| 16 and 17 Years | 4,620 (27.8%) | 5,184 (31.0%) |
| 18 to 24 Years | 20,915 (31.4%) | 22,005 (32.5%) |
| 25 to 34 Years | 19,617 (13.7%) | 30,545 (19.8%) |
| 35 to 44 Years | 15,000 (15.1%) | 23,559 (21.8%) |
| 45 to 54 Years | 13,508 (16.3%) | 18,223 (19.9%) |
| 55 to 64 Years | 18,770 (22.3%) | 21,333 (21.8%) |
| 65 to 74 Years | 9,853 (17.4%) | 14,917 (20.2%) |
| 75 Years and over | 5,206 (16.4%) | 12,644 (23.0%) |
| Total | 157,006 (21.3%) | 194,805 (24.0%) |
Income Above Poverty by Sex and Age in Philadelphia County
According to the poverty statistics in Philadelphia County, males aged 25 to 34 years and females aged 25 to 34 years are the age groups that are most secure financially, with 86.3% of males and 80.2% of females in these age groups living above the poverty line.
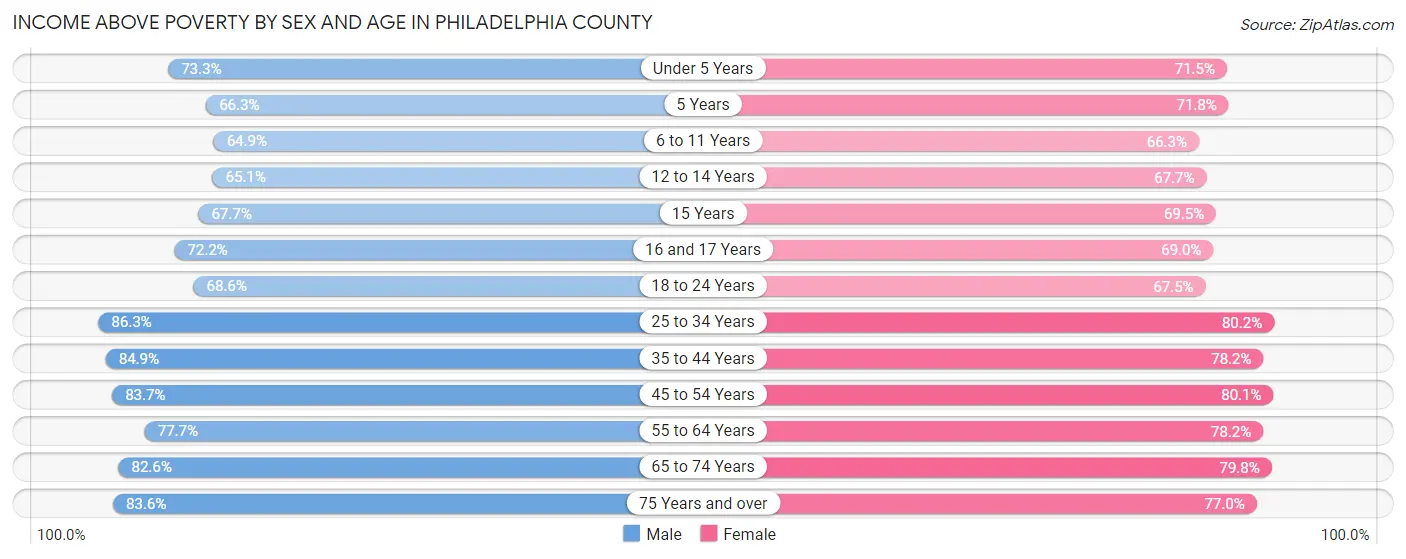
| Age Bracket | Male | Female |
| Under 5 Years | 36,024 (73.3%) | 34,030 (71.5%) |
| 5 Years | 5,884 (66.3%) | 5,447 (71.8%) |
| 6 to 11 Years | 37,766 (64.9%) | 36,977 (66.3%) |
| 12 to 14 Years | 18,295 (65.1%) | 18,876 (67.6%) |
| 15 Years | 6,672 (67.7%) | 6,375 (69.5%) |
| 16 and 17 Years | 11,993 (72.2%) | 11,512 (69.0%) |
| 18 to 24 Years | 45,753 (68.6%) | 45,674 (67.5%) |
| 25 to 34 Years | 123,479 (86.3%) | 123,804 (80.2%) |
| 35 to 44 Years | 84,462 (84.9%) | 84,711 (78.2%) |
| 45 to 54 Years | 69,505 (83.7%) | 73,237 (80.1%) |
| 55 to 64 Years | 65,343 (77.7%) | 76,502 (78.2%) |
| 65 to 74 Years | 46,637 (82.6%) | 58,787 (79.8%) |
| 75 Years and over | 26,510 (83.6%) | 42,334 (77.0%) |
| Total | 578,323 (78.6%) | 618,266 (76.0%) |
Income Below Poverty Among Married-Couple Families in Philadelphia County
The poverty statistics for married-couple families in Philadelphia County show that 8.7% or 15,865 of the total 182,114 families live below the poverty line. Families with 5 or more children have the highest poverty rate of 42.9%, comprising of 522 families. On the other hand, families with no children have the lowest poverty rate of 6.5%, which includes 6,907 families.
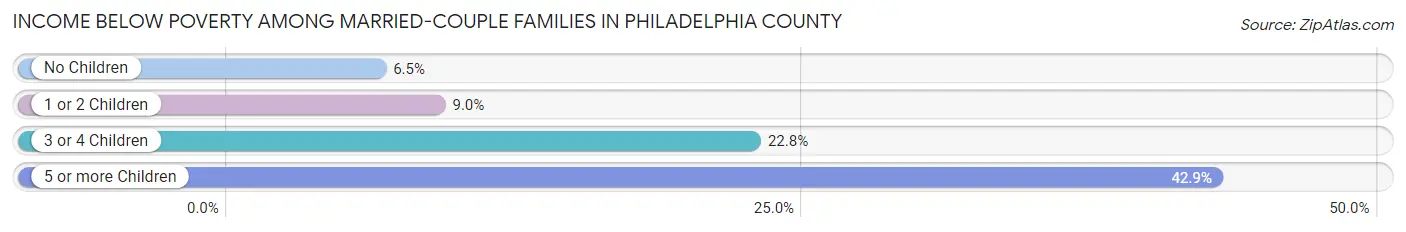
| Children | Above Poverty | Below Poverty |
| No Children | 100,101 (93.5%) | 6,907 (6.5%) |
| 1 or 2 Children | 55,525 (91.0%) | 5,511 (9.0%) |
| 3 or 4 Children | 9,928 (77.2%) | 2,925 (22.8%) |
| 5 or more Children | 695 (57.1%) | 522 (42.9%) |
| Total | 166,249 (91.3%) | 15,865 (8.7%) |
Income Below Poverty Among Single-Parent Households in Philadelphia County
According to the poverty data in Philadelphia County, 18.2% or 6,752 single-father households and 30.7% or 40,289 single-mother households are living below the poverty line. Among single-father households, those with 3 or 4 children have the highest poverty rate, with 989 households (38.2%) experiencing poverty. Likewise, among single-mother households, those with 5 or more children have the highest poverty rate, with 1,628 households (82.1%) falling below the poverty line.
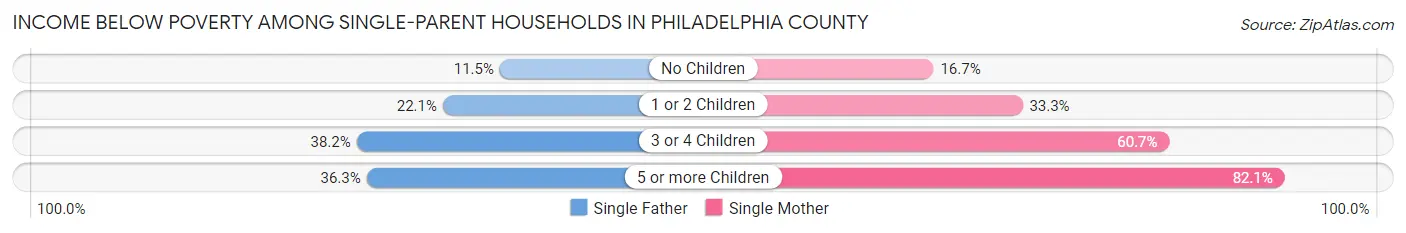
| Children | Single Father | Single Mother |
| No Children | 2,097 (11.5%) | 8,386 (16.7%) |
| 1 or 2 Children | 3,462 (22.1%) | 21,390 (33.3%) |
| 3 or 4 Children | 989 (38.2%) | 8,885 (60.7%) |
| 5 or more Children | 204 (36.3%) | 1,628 (82.1%) |
| Total | 6,752 (18.2%) | 40,289 (30.7%) |
Income Below Poverty Among Married-Couple vs Single-Parent Households in Philadelphia County
The poverty data for Philadelphia County shows that 15,865 of the married-couple family households (8.7%) and 47,041 of the single-parent households (28.0%) are living below the poverty level. Within the married-couple family households, those with 5 or more children have the highest poverty rate, with 522 households (42.9%) falling below the poverty line. Among the single-parent households, those with 5 or more children have the highest poverty rate, with 1,832 household (72.0%) living below poverty.
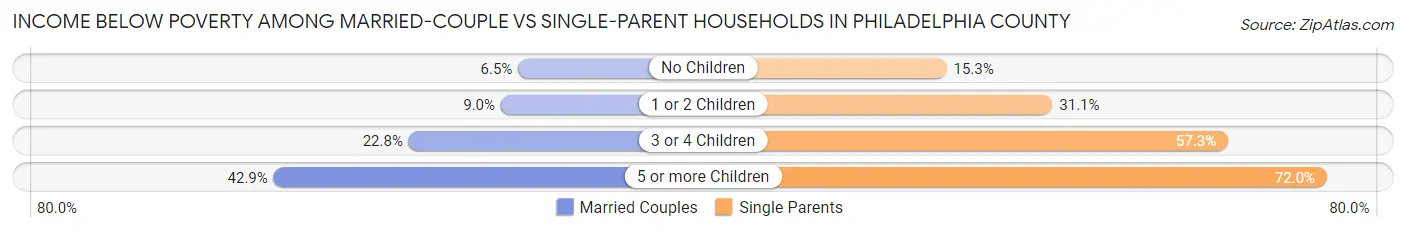
| Children | Married-Couple Families | Single-Parent Households |
| No Children | 6,907 (6.5%) | 10,483 (15.3%) |
| 1 or 2 Children | 5,511 (9.0%) | 24,852 (31.1%) |
| 3 or 4 Children | 2,925 (22.8%) | 9,874 (57.3%) |
| 5 or more Children | 522 (42.9%) | 1,832 (72.0%) |
| Total | 15,865 (8.7%) | 47,041 (28.0%) |
Race in Philadelphia County
The most populous races in Philadelphia County are Black / African American (638,907 | 40.1%), White / Caucasian (590,860 | 37.1%), and Hispanic or Latino (249,723 | 15.7%).
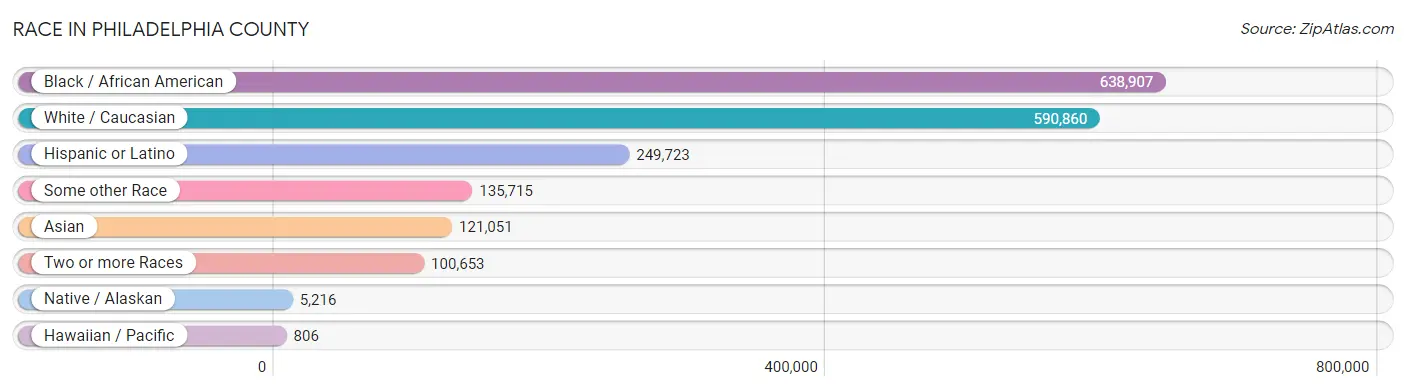
| Race | # Population | % Population |
| Asian | 121,051 | 7.6% |
| Black / African American | 638,907 | 40.1% |
| Hawaiian / Pacific | 806 | 0.1% |
| Hispanic or Latino | 249,723 | 15.7% |
| Native / Alaskan | 5,216 | 0.3% |
| White / Caucasian | 590,860 | 37.1% |
| Two or more Races | 100,653 | 6.3% |
| Some other Race | 135,715 | 8.5% |
| Total | 1,593,208 | 100.0% |
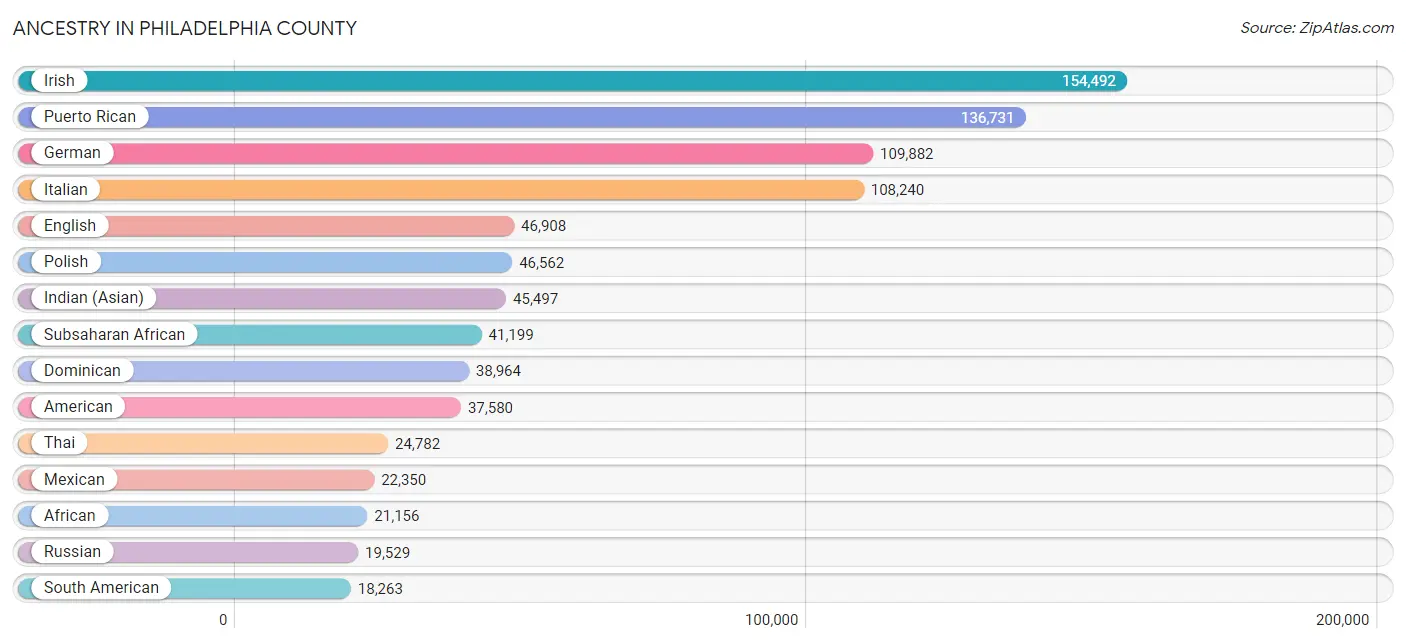
Ancestry in Philadelphia County
The most populous ancestries reported in Philadelphia County are Irish (154,492 | 9.7%), Puerto Rican (136,731 | 8.6%), German (109,882 | 6.9%), Italian (108,240 | 6.8%), and English (46,908 | 2.9%), together accounting for 34.9% of all Philadelphia County residents.
| Ancestry | # Population | % Population |
| Afghan | 581 | 0.0% |
| African | 21,156 | 1.3% |
| Alaska Native | 21 | 0.0% |
| Alaskan Athabascan | 20 | 0.0% |
| Albanian | 5,697 | 0.4% |
| Aleut | 21 | 0.0% |
| American | 37,580 | 2.4% |
| Apache | 136 | 0.0% |
| Arab | 12,468 | 0.8% |
| Argentinean | 2,149 | 0.1% |
| Armenian | 1,261 | 0.1% |
| Assyrian / Chaldean / Syriac | 19 | 0.0% |
| Australian | 304 | 0.0% |
| Austrian | 3,069 | 0.2% |
| Bahamian | 301 | 0.0% |
| Bangladeshi | 710 | 0.0% |
| Barbadian | 825 | 0.1% |
| Basque | 45 | 0.0% |
| Belgian | 312 | 0.0% |
| Belizean | 132 | 0.0% |
| Bermudan | 160 | 0.0% |
| Bhutanese | 2,596 | 0.2% |
| Blackfeet | 705 | 0.0% |
| Bolivian | 117 | 0.0% |
| Brazilian | 5,360 | 0.3% |
| British | 3,864 | 0.2% |
| British West Indian | 868 | 0.1% |
| Bulgarian | 291 | 0.0% |
| Burmese | 8,235 | 0.5% |
| Cajun | 52 | 0.0% |
| Cambodian | 263 | 0.0% |
| Canadian | 973 | 0.1% |
| Cape Verdean | 94 | 0.0% |
| Carpatho Rusyn | 40 | 0.0% |
| Celtic | 256 | 0.0% |
| Central American | 17,370 | 1.1% |
| Central American Indian | 2,528 | 0.2% |
| Cherokee | 3,846 | 0.2% |
| Cheyenne | 3 | 0.0% |
| Chickasaw | 71 | 0.0% |
| Chilean | 693 | 0.0% |
| Chippewa | 124 | 0.0% |
| Choctaw | 217 | 0.0% |
| Colombian | 7,545 | 0.5% |
| Costa Rican | 1,370 | 0.1% |
| Cree | 11 | 0.0% |
| Creek | 28 | 0.0% |
| Croatian | 1,082 | 0.1% |
| Crow | 19 | 0.0% |
| Cuban | 4,094 | 0.3% |
| Cypriot | 76 | 0.0% |
| Czech | 2,544 | 0.2% |
| Czechoslovakian | 469 | 0.0% |
| Danish | 1,719 | 0.1% |
| Delaware | 129 | 0.0% |
| Dominican | 38,964 | 2.5% |
| Dutch | 4,599 | 0.3% |
| Eastern European | 7,564 | 0.5% |
| Ecuadorian | 2,896 | 0.2% |
| Egyptian | 2,075 | 0.1% |
| English | 46,908 | 2.9% |
| Estonian | 213 | 0.0% |
| Ethiopian | 2,137 | 0.1% |
| European | 9,842 | 0.6% |
| Fijian | 13 | 0.0% |
| Filipino | 1,222 | 0.1% |
| Finnish | 669 | 0.0% |
| French | 11,952 | 0.7% |
| French American Indian | 63 | 0.0% |
| French Canadian | 1,573 | 0.1% |
| German | 109,882 | 6.9% |
| German Russian | 74 | 0.0% |
| Ghanaian | 1,764 | 0.1% |
| Greek | 5,017 | 0.3% |
| Guamanian / Chamorro | 123 | 0.0% |
| Guatemalan | 5,042 | 0.3% |
| Guyanese | 598 | 0.0% |
| Haitian | 11,327 | 0.7% |
| Hmong | 7 | 0.0% |
| Honduran | 5,009 | 0.3% |
| Houma | 137 | 0.0% |
| Hungarian | 5,763 | 0.4% |
| Icelander | 25 | 0.0% |
| Indian (Asian) | 45,497 | 2.9% |
| Indonesian | 615 | 0.0% |
| Inupiat | 72 | 0.0% |
| Iranian | 1,134 | 0.1% |
| Iraqi | 560 | 0.0% |
| Irish | 154,492 | 9.7% |
| Iroquois | 445 | 0.0% |
| Israeli | 914 | 0.1% |
| Italian | 108,240 | 6.8% |
| Jamaican | 13,723 | 0.9% |
| Japanese | 11,152 | 0.7% |
| Jordanian | 472 | 0.0% |
| Kenyan | 631 | 0.0% |
| Korean | 10,651 | 0.7% |
| Laotian | 2,594 | 0.2% |
| Latvian | 414 | 0.0% |
| Lebanese | 1,048 | 0.1% |
| Liberian | 4,896 | 0.3% |
| Lithuanian | 4,010 | 0.3% |
| Lumbee | 131 | 0.0% |
| Luxembourger | 8 | 0.0% |
| Macedonian | 23 | 0.0% |
| Malaysian | 1,249 | 0.1% |
| Mexican | 22,350 | 1.4% |
| Mexican American Indian | 584 | 0.0% |
| Mongolian | 224 | 0.0% |
| Moroccan | 1,677 | 0.1% |
| Native Hawaiian | 738 | 0.1% |
| Navajo | 245 | 0.0% |
| New Zealander | 54 | 0.0% |
| Nicaraguan | 1,612 | 0.1% |
| Nigerian | 5,746 | 0.4% |
| Northern European | 691 | 0.0% |
| Norwegian | 3,556 | 0.2% |
| Okinawan | 56 | 0.0% |
| Paiute | 20 | 0.0% |
| Pakistani | 1,262 | 0.1% |
| Palestinian | 1,971 | 0.1% |
| Panamanian | 950 | 0.1% |
| Paraguayan | 65 | 0.0% |
| Pennsylvania German | 1,783 | 0.1% |
| Peruvian | 1,653 | 0.1% |
| Pima | 5 | 0.0% |
| Polish | 46,562 | 2.9% |
| Portuguese | 3,062 | 0.2% |
| Potawatomi | 33 | 0.0% |
| Puerto Rican | 136,731 | 8.6% |
| Romanian | 1,875 | 0.1% |
| Russian | 19,529 | 1.2% |
| Salvadoran | 3,387 | 0.2% |
| Samoan | 431 | 0.0% |
| Scandinavian | 1,118 | 0.1% |
| Scotch-Irish | 3,616 | 0.2% |
| Scottish | 10,070 | 0.6% |
| Seminole | 45 | 0.0% |
| Senegalese | 406 | 0.0% |
| Serbian | 494 | 0.0% |
| Shoshone | 27 | 0.0% |
| Sierra Leonean | 1,039 | 0.1% |
| Sioux | 61 | 0.0% |
| Slavic | 655 | 0.0% |
| Slovak | 2,426 | 0.2% |
| Slovene | 207 | 0.0% |
| Somali | 157 | 0.0% |
| South African | 150 | 0.0% |
| South American | 18,263 | 1.1% |
| South American Indian | 253 | 0.0% |
| Soviet Union | 12 | 0.0% |
| Spaniard | 2,428 | 0.2% |
| Spanish | 2,150 | 0.1% |
| Spanish American | 53 | 0.0% |
| Spanish American Indian | 18 | 0.0% |
| Sri Lankan | 17,412 | 1.1% |
| Subsaharan African | 41,199 | 2.6% |
| Sudanese | 151 | 0.0% |
| Swedish | 4,187 | 0.3% |
| Swiss | 1,788 | 0.1% |
| Syrian | 581 | 0.0% |
| Thai | 24,782 | 1.6% |
| Tlingit-Haida | 2 | 0.0% |
| Trinidadian and Tobagonian | 3,134 | 0.2% |
| Turkish | 1,630 | 0.1% |
| U.S. Virgin Islander | 309 | 0.0% |
| Ugandan | 130 | 0.0% |
| Ukrainian | 13,782 | 0.9% |
| Uruguayan | 285 | 0.0% |
| Venezuelan | 2,701 | 0.2% |
| Vietnamese | 2,046 | 0.1% |
| Welsh | 4,952 | 0.3% |
| West Indian | 4,818 | 0.3% |
| Yaqui | 25 | 0.0% |
| Yugoslavian | 212 | 0.0% | View All 175 Rows |
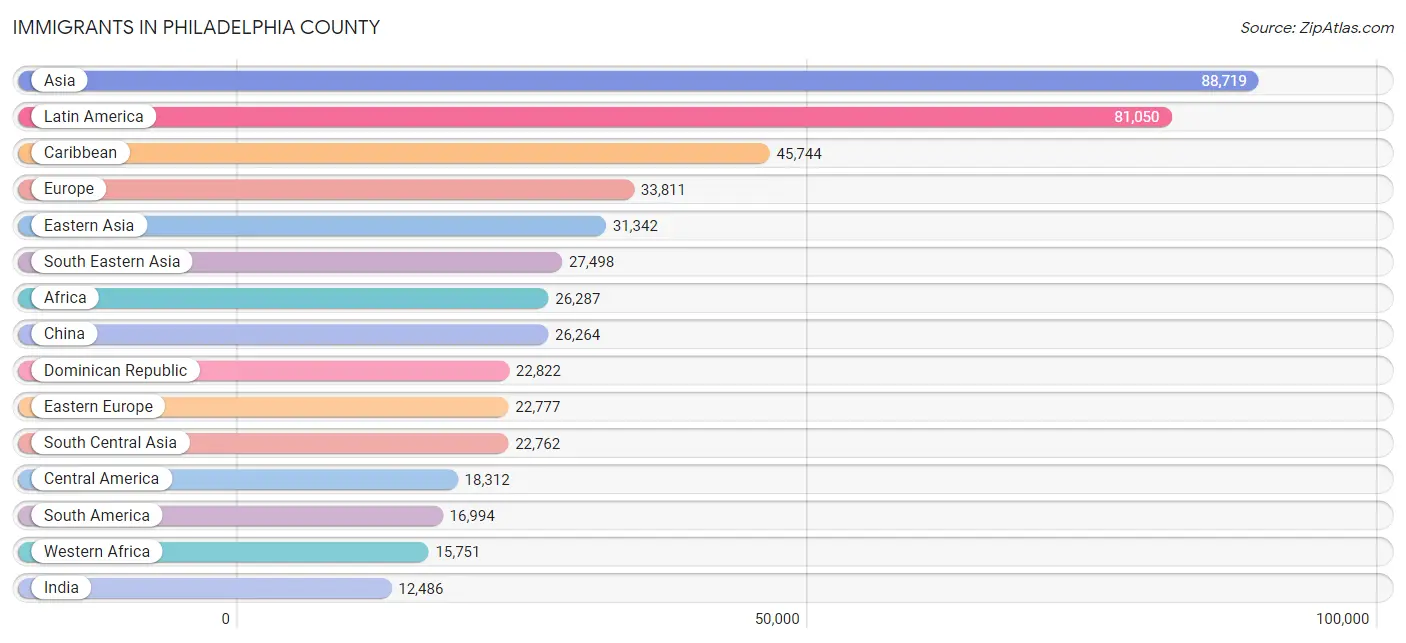
Immigrants in Philadelphia County
The most numerous immigrant groups reported in Philadelphia County came from Asia (88,719 | 5.6%), Latin America (81,050 | 5.1%), Caribbean (45,744 | 2.9%), Europe (33,811 | 2.1%), and Eastern Asia (31,342 | 2.0%), together accounting for 17.6% of all Philadelphia County residents.
| Immigration Origin | # Population | % Population |
| Afghanistan | 353 | 0.0% |
| Africa | 26,287 | 1.7% |
| Albania | 4,681 | 0.3% |
| Argentina | 1,303 | 0.1% |
| Armenia | 133 | 0.0% |
| Asia | 88,719 | 5.6% |
| Australia | 401 | 0.0% |
| Austria | 108 | 0.0% |
| Bahamas | 123 | 0.0% |
| Bangladesh | 2,914 | 0.2% |
| Barbados | 401 | 0.0% |
| Belarus | 1,403 | 0.1% |
| Belgium | 63 | 0.0% |
| Belize | 112 | 0.0% |
| Bolivia | 85 | 0.0% |
| Bosnia and Herzegovina | 86 | 0.0% |
| Brazil | 5,725 | 0.4% |
| Bulgaria | 252 | 0.0% |
| Cambodia | 5,707 | 0.4% |
| Cameroon | 842 | 0.1% |
| Canada | 2,244 | 0.1% |
| Caribbean | 45,744 | 2.9% |
| Central America | 18,312 | 1.1% |
| Chile | 371 | 0.0% |
| China | 26,264 | 1.7% |
| Colombia | 3,725 | 0.2% |
| Congo | 38 | 0.0% |
| Costa Rica | 1,514 | 0.1% |
| Croatia | 150 | 0.0% |
| Cuba | 1,076 | 0.1% |
| Czechoslovakia | 225 | 0.0% |
| Denmark | 36 | 0.0% |
| Dominica | 772 | 0.1% |
| Dominican Republic | 22,822 | 1.4% |
| Eastern Africa | 2,399 | 0.2% |
| Eastern Asia | 31,342 | 2.0% |
| Eastern Europe | 22,777 | 1.4% |
| Ecuador | 1,775 | 0.1% |
| Egypt | 1,293 | 0.1% |
| El Salvador | 1,630 | 0.1% |
| England | 835 | 0.1% |
| Eritrea | 115 | 0.0% |
| Ethiopia | 1,404 | 0.1% |
| Europe | 33,811 | 2.1% |
| Fiji | 9 | 0.0% |
| France | 590 | 0.0% |
| Germany | 1,849 | 0.1% |
| Ghana | 1,871 | 0.1% |
| Greece | 858 | 0.1% |
| Grenada | 89 | 0.0% |
| Guatemala | 3,751 | 0.2% |
| Guyana | 889 | 0.1% |
| Haiti | 6,877 | 0.4% |
| Honduras | 2,596 | 0.2% |
| Hong Kong | 1,010 | 0.1% |
| Hungary | 144 | 0.0% |
| India | 12,486 | 0.8% |
| Indonesia | 1,977 | 0.1% |
| Iran | 419 | 0.0% |
| Iraq | 616 | 0.0% |
| Ireland | 590 | 0.0% |
| Israel | 1,328 | 0.1% |
| Italy | 2,875 | 0.2% |
| Jamaica | 9,333 | 0.6% |
| Japan | 524 | 0.0% |
| Jordan | 616 | 0.0% |
| Kazakhstan | 130 | 0.0% |
| Kenya | 383 | 0.0% |
| Korea | 4,435 | 0.3% |
| Kuwait | 307 | 0.0% |
| Laos | 440 | 0.0% |
| Latin America | 81,050 | 5.1% |
| Latvia | 144 | 0.0% |
| Lebanon | 280 | 0.0% |
| Liberia | 5,607 | 0.4% |
| Lithuania | 199 | 0.0% |
| Malaysia | 545 | 0.0% |
| Mexico | 7,767 | 0.5% |
| Middle Africa | 1,470 | 0.1% |
| Moldova | 201 | 0.0% |
| Morocco | 1,471 | 0.1% |
| Nepal | 447 | 0.0% |
| Netherlands | 162 | 0.0% |
| Nicaragua | 706 | 0.0% |
| Nigeria | 4,107 | 0.3% |
| North Macedonia | 108 | 0.0% |
| Northern Africa | 4,130 | 0.3% |
| Northern Europe | 3,134 | 0.2% |
| Norway | 114 | 0.0% |
| Oceania | 611 | 0.0% |
| Pakistan | 2,711 | 0.2% |
| Panama | 236 | 0.0% |
| Peru | 960 | 0.1% |
| Philippines | 4,462 | 0.3% |
| Poland | 1,704 | 0.1% |
| Portugal | 754 | 0.1% |
| Romania | 822 | 0.1% |
| Russia | 3,062 | 0.2% |
| Saudi Arabia | 707 | 0.0% |
| Scotland | 122 | 0.0% |
| Senegal | 123 | 0.0% |
| Serbia | 215 | 0.0% |
| Sierra Leone | 1,111 | 0.1% |
| Singapore | 199 | 0.0% |
| Somalia | 29 | 0.0% |
| South Africa | 266 | 0.0% |
| South America | 16,994 | 1.1% |
| South Central Asia | 22,762 | 1.4% |
| South Eastern Asia | 27,498 | 1.7% |
| Southern Europe | 4,862 | 0.3% |
| Spain | 375 | 0.0% |
| Sri Lanka | 248 | 0.0% |
| St. Vincent and the Grenadines | 162 | 0.0% |
| Sudan | 327 | 0.0% |
| Sweden | 140 | 0.0% |
| Switzerland | 213 | 0.0% |
| Syria | 354 | 0.0% |
| Taiwan | 862 | 0.1% |
| Thailand | 1,548 | 0.1% |
| Trinidad and Tobago | 2,795 | 0.2% |
| Turkey | 791 | 0.1% |
| Uganda | 28 | 0.0% |
| Ukraine | 6,495 | 0.4% |
| Uruguay | 208 | 0.0% |
| Uzbekistan | 1,965 | 0.1% |
| Venezuela | 1,873 | 0.1% |
| Vietnam | 12,067 | 0.8% |
| West Indies | 488 | 0.0% |
| Western Africa | 15,751 | 1.0% |
| Western Asia | 6,627 | 0.4% |
| Western Europe | 2,985 | 0.2% |
| Yemen | 186 | 0.0% |
| Zaire | 133 | 0.0% |
| Zimbabwe | 256 | 0.0% | View All 134 Rows |
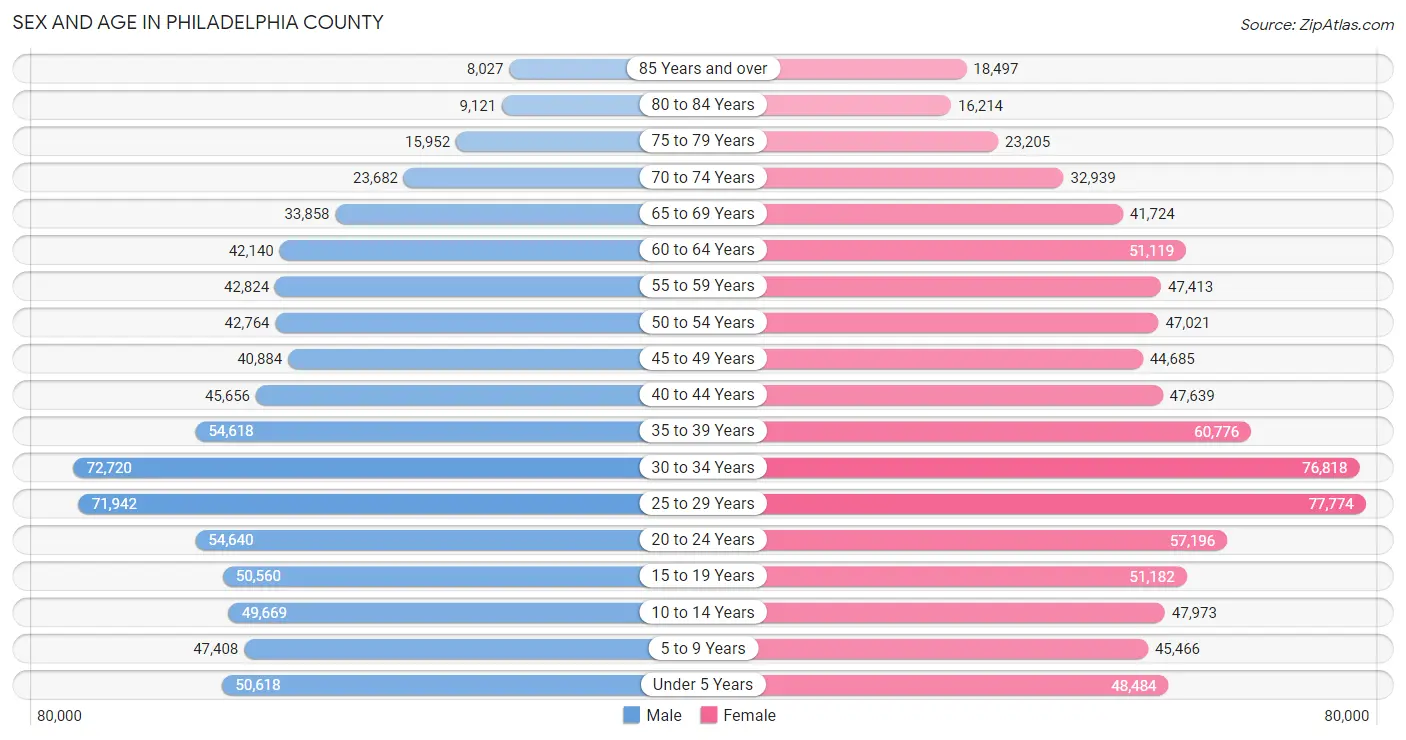
Sex and Age in Philadelphia County
Sex and Age in Philadelphia County
The most populous age groups in Philadelphia County are 30 to 34 Years (72,720 | 9.6%) for men and 25 to 29 Years (77,774 | 9.3%) for women.
| Age Bracket | Male | Female |
| Under 5 Years | 50,618 (6.7%) | 48,484 (5.8%) |
| 5 to 9 Years | 47,408 (6.3%) | 45,466 (5.4%) |
| 10 to 14 Years | 49,669 (6.6%) | 47,973 (5.7%) |
| 15 to 19 Years | 50,560 (6.7%) | 51,182 (6.1%) |
| 20 to 24 Years | 54,640 (7.2%) | 57,196 (6.8%) |
| 25 to 29 Years | 71,942 (9.5%) | 77,774 (9.3%) |
| 30 to 34 Years | 72,720 (9.6%) | 76,818 (9.2%) |
| 35 to 39 Years | 54,618 (7.2%) | 60,776 (7.3%) |
| 40 to 44 Years | 45,656 (6.0%) | 47,639 (5.7%) |
| 45 to 49 Years | 40,884 (5.4%) | 44,685 (5.3%) |
| 50 to 54 Years | 42,764 (5.7%) | 47,021 (5.6%) |
| 55 to 59 Years | 42,824 (5.7%) | 47,413 (5.7%) |
| 60 to 64 Years | 42,140 (5.6%) | 51,119 (6.1%) |
| 65 to 69 Years | 33,858 (4.5%) | 41,724 (5.0%) |
| 70 to 74 Years | 23,682 (3.1%) | 32,939 (3.9%) |
| 75 to 79 Years | 15,952 (2.1%) | 23,205 (2.8%) |
| 80 to 84 Years | 9,121 (1.2%) | 16,214 (1.9%) |
| 85 Years and over | 8,027 (1.1%) | 18,497 (2.2%) |
| Total | 757,083 (100.0%) | 836,125 (100.0%) |
Families and Households in Philadelphia County
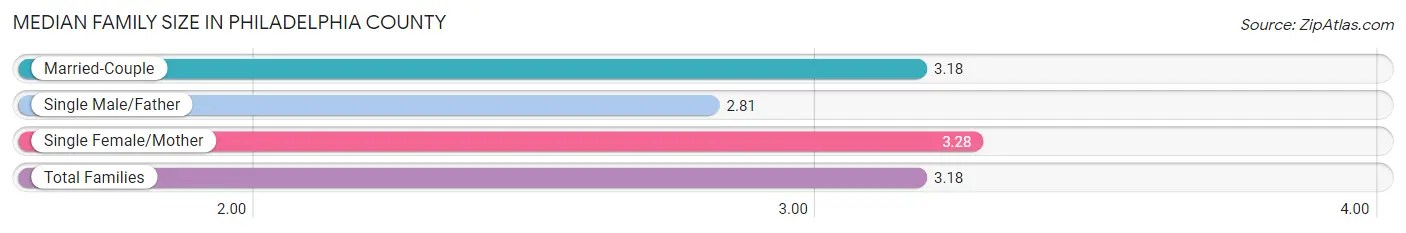
Median Family Size in Philadelphia County
The median family size in Philadelphia County is 3.18 persons per family, with single female/mother families (131,009 | 37.4%) accounting for the largest median family size of 3.28 persons per family. On the other hand, single male/father families (37,059 | 10.6%) represent the smallest median family size with 2.81 persons per family.
| Family Type | # Families | Family Size |
| Married-Couple | 182,114 (52.0%) | 3.18 |
| Single Male/Father | 37,059 (10.6%) | 2.81 |
| Single Female/Mother | 131,009 (37.4%) | 3.28 |
| Total Families | 350,182 (100.0%) | 3.18 |
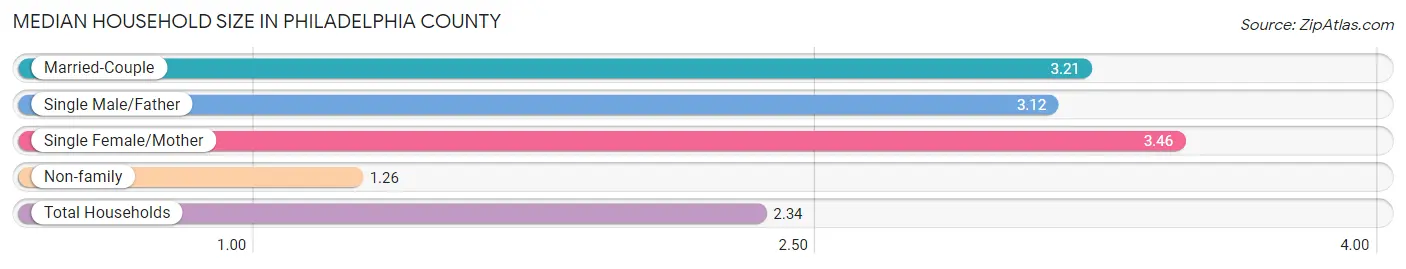
Median Household Size in Philadelphia County
The median household size in Philadelphia County is 2.34 persons per household, with single female/mother households (131,009 | 19.9%) accounting for the largest median household size of 3.46 persons per household. non-family households (308,947 | 46.9%) represent the smallest median household size with 1.26 persons per household.
| Household Type | # Households | Household Size |
| Married-Couple | 182,114 (27.6%) | 3.21 |
| Single Male/Father | 37,059 (5.6%) | 3.12 |
| Single Female/Mother | 131,009 (19.9%) | 3.46 |
| Non-family | 308,947 (46.9%) | 1.26 |
| Total Households | 659,129 (100.0%) | 2.34 |
Household Size by Marriage Status in Philadelphia County
Out of a total of 659,129 households in Philadelphia County, 350,182 (53.1%) are family households, while 308,947 (46.9%) are nonfamily households. The most numerous type of family households are 2-person households, comprising 142,864, and the most common type of nonfamily households are 1-person households, comprising 246,067.
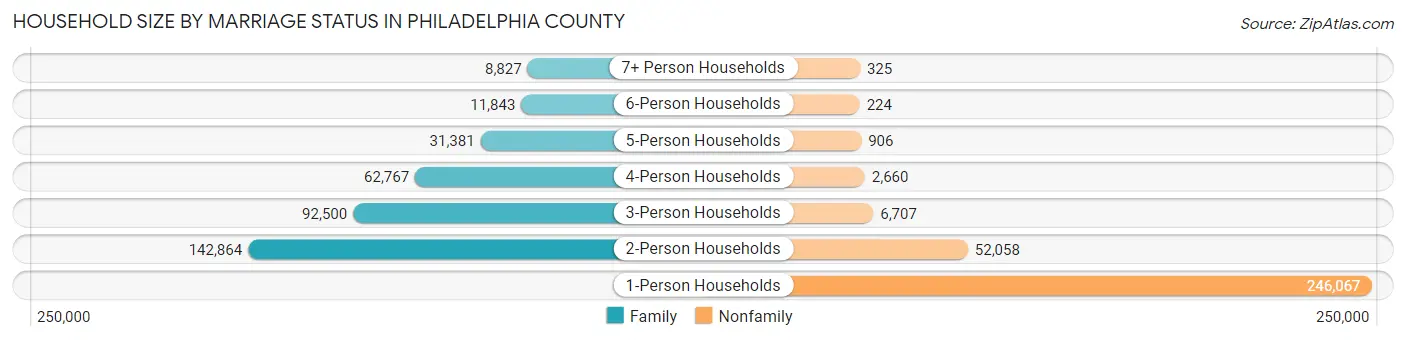
| Household Size | Family Households | Nonfamily Households |
| 1-Person Households | - | 246,067 (37.3%) |
| 2-Person Households | 142,864 (21.7%) | 52,058 (7.9%) |
| 3-Person Households | 92,500 (14.0%) | 6,707 (1.0%) |
| 4-Person Households | 62,767 (9.5%) | 2,660 (0.4%) |
| 5-Person Households | 31,381 (4.8%) | 906 (0.1%) |
| 6-Person Households | 11,843 (1.8%) | 224 (0.0%) |
| 7+ Person Households | 8,827 (1.3%) | 325 (0.1%) |
| Total | 350,182 (53.1%) | 308,947 (46.9%) |
Female Fertility in Philadelphia County
Fertility by Age in Philadelphia County
Average fertility rate in Philadelphia County is 49.0 births per 1,000 women. Women in the age bracket of 20 to 34 years have the highest fertility rate with 68.0 births per 1,000 women. Women in the age bracket of 20 to 34 years acount for 69.6% of all women with births.
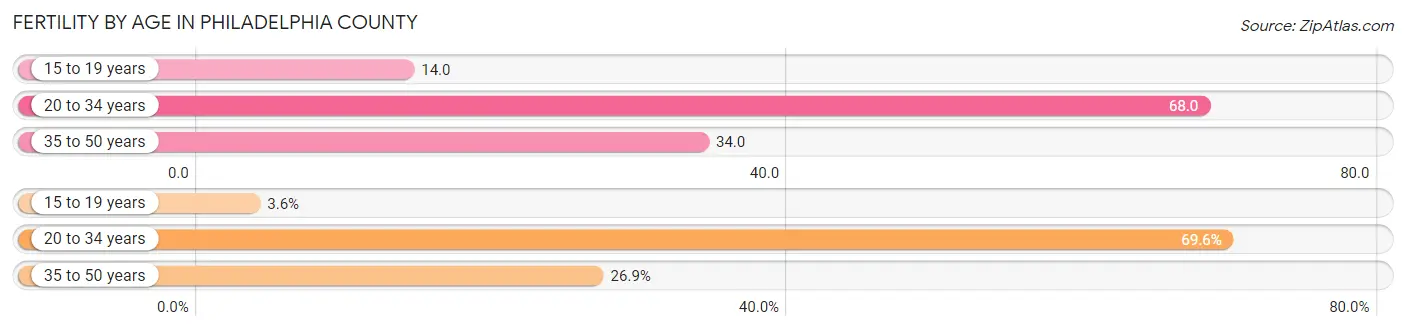
| Age Bracket | Women with Births | Births / 1,000 Women |
| 15 to 19 years | 738 (3.5%) | 14.0 |
| 20 to 34 years | 14,449 (69.6%) | 68.0 |
| 35 to 50 years | 5,574 (26.9%) | 34.0 |
| Total | 20,761 (100.0%) | 49.0 |
Fertility by Age by Marriage Status in Philadelphia County
52.7% of women with births (20,761) in Philadelphia County are married. The highest percentage of unmarried women with births falls into 15 to 19 years age bracket with 94.0% of them unmarried at the time of birth, while the lowest percentage of unmarried women with births belong to 35 to 50 years age bracket with 32.3% of them unmarried.
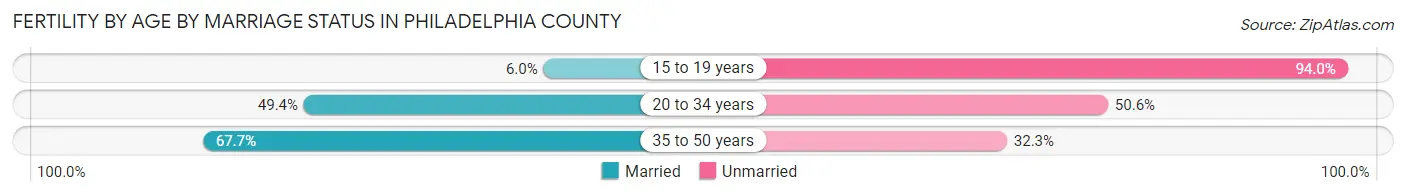
| Age Bracket | Married | Unmarried |
| 15 to 19 years | 44 (6.0%) | 694 (94.0%) |
| 20 to 34 years | 7,138 (49.4%) | 7,311 (50.6%) |
| 35 to 50 years | 3,774 (67.7%) | 1,800 (32.3%) |
| Total | 10,941 (52.7%) | 9,820 (47.3%) |
Fertility by Education in Philadelphia County
Average fertility rate in Philadelphia County is 49.0 births per 1,000 women. Women with the education attainment of high school diploma have the highest fertility rate of 56.0 births per 1,000 women, while women with the education attainment of less than high school have the lowest fertility at 38.0 births per 1,000 women. Women with the education attainment of college or associate's degree represent 27.2% of all women with births.
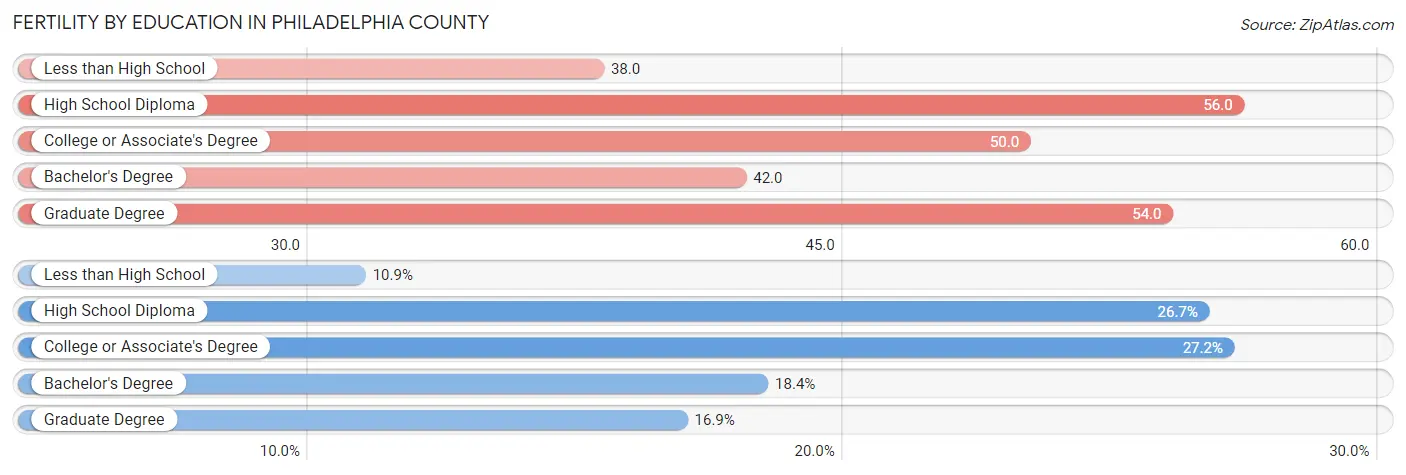
| Educational Attainment | Women with Births | Births / 1,000 Women |
| Less than High School | 2,256 (10.9%) | 38.0 |
| High School Diploma | 5,538 (26.7%) | 56.0 |
| College or Associate's Degree | 5,636 (27.2%) | 50.0 |
| Bachelor's Degree | 3,822 (18.4%) | 42.0 |
| Graduate Degree | 3,509 (16.9%) | 54.0 |
| Total | 20,761 (100.0%) | 49.0 |
Fertility by Education by Marriage Status in Philadelphia County
47.3% of women with births in Philadelphia County are unmarried. Women with the educational attainment of graduate degree are most likely to be married with 83.2% of them married at childbirth, while women with the educational attainment of high school diploma are least likely to be married with 68.3% of them unmarried at childbirth.
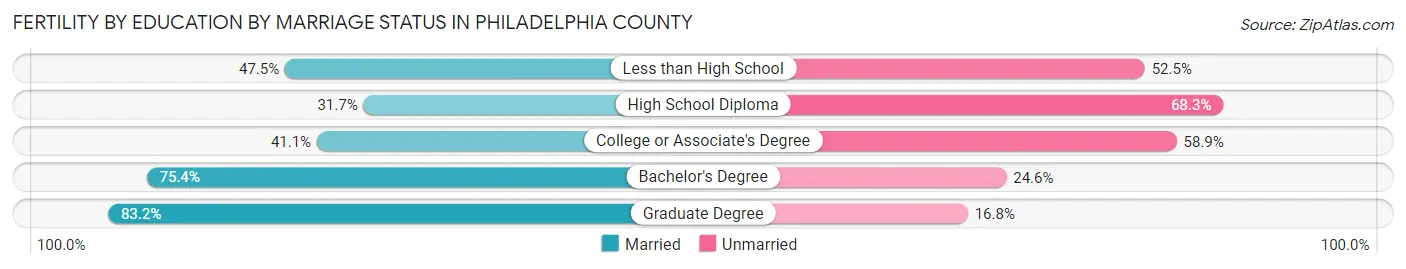
| Educational Attainment | Married | Unmarried |
| Less than High School | 1,072 (47.5%) | 1,184 (52.5%) |
| High School Diploma | 1,756 (31.7%) | 3,782 (68.3%) |
| College or Associate's Degree | 2,316 (41.1%) | 3,320 (58.9%) |
| Bachelor's Degree | 2,882 (75.4%) | 940 (24.6%) |
| Graduate Degree | 2,919 (83.2%) | 590 (16.8%) |
| Total | 10,941 (52.7%) | 9,820 (47.3%) |
Employment Characteristics in Philadelphia County
Employment by Class of Employer in Philadelphia County
Among the 717,569 employed individuals in Philadelphia County, private company employees (466,913 | 65.1%), not-for-profit organizations (113,614 | 15.8%), and local government employees (51,853 | 7.2%) make up the most common classes of employment.
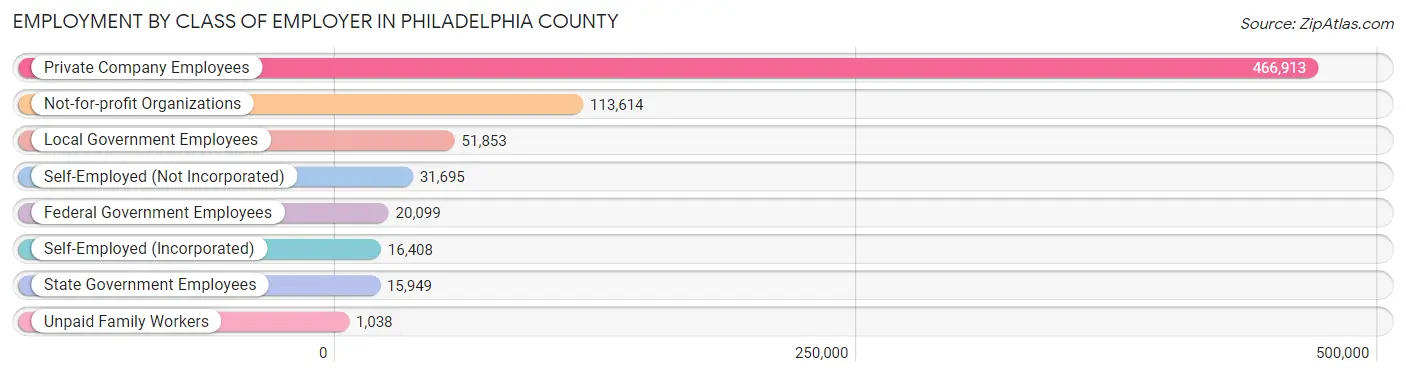
| Employer Class | # Employees | % Employees |
| Private Company Employees | 466,913 | 65.1% |
| Self-Employed (Incorporated) | 16,408 | 2.3% |
| Self-Employed (Not Incorporated) | 31,695 | 4.4% |
| Not-for-profit Organizations | 113,614 | 15.8% |
| Local Government Employees | 51,853 | 7.2% |
| State Government Employees | 15,949 | 2.2% |
| Federal Government Employees | 20,099 | 2.8% |
| Unpaid Family Workers | 1,038 | 0.1% |
| Total | 717,569 | 100.0% |
Employment Status by Age in Philadelphia County
According to the labor force statistics for Philadelphia County, out of the total population over 16 years of age (1,284,522), 62.8% or 806,680 individuals are in the labor force, with 8.6% or 69,374 of them unemployed. The age group with the highest labor force participation rate is 30 to 34 years, with 86.1% or 128,752 individuals in the labor force. Within the labor force, the 16 to 19 years age range has the highest percentage of unemployed individuals, with 27.3% or 7,448 of them being unemployed.
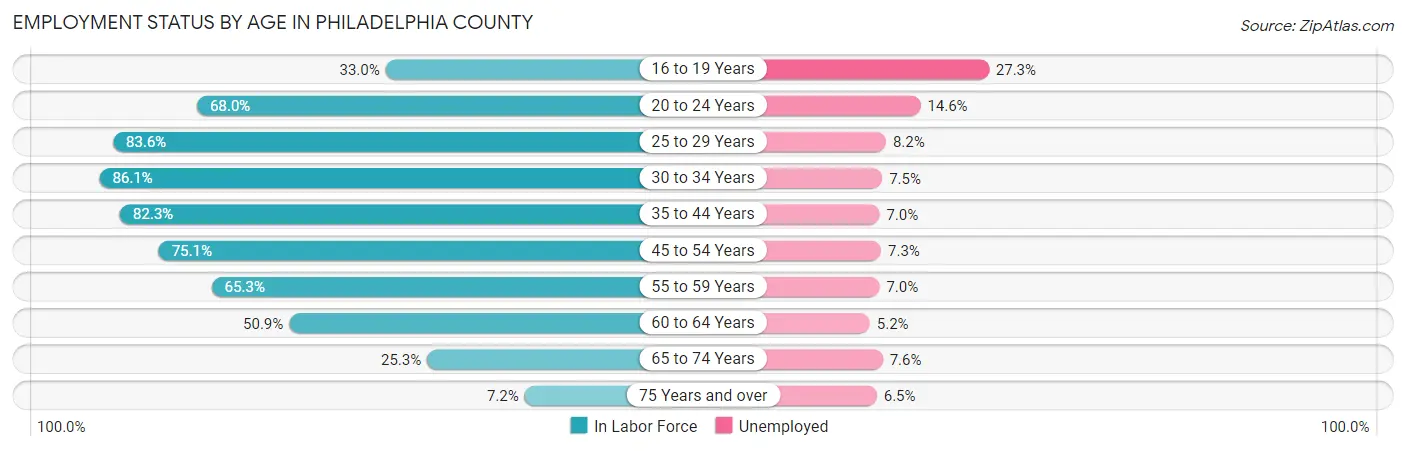
| Age Bracket | In Labor Force | Unemployed |
| 16 to 19 Years | 27,282 (33.0%) | 7,448 (27.3%) |
| 20 to 24 Years | 76,048 (68.0%) | 11,103 (14.6%) |
| 25 to 29 Years | 125,163 (83.6%) | 10,263 (8.2%) |
| 30 to 34 Years | 128,752 (86.1%) | 9,656 (7.5%) |
| 35 to 44 Years | 171,751 (82.3%) | 12,023 (7.0%) |
| 45 to 54 Years | 131,691 (75.1%) | 9,613 (7.3%) |
| 55 to 59 Years | 58,925 (65.3%) | 4,125 (7.0%) |
| 60 to 64 Years | 47,469 (50.9%) | 2,468 (5.2%) |
| 65 to 74 Years | 33,447 (25.3%) | 2,542 (7.6%) |
| 75 Years and over | 6,553 (7.2%) | 426 (6.5%) |
| Total | 806,680 (62.8%) | 69,374 (8.6%) |
Employment Status by Educational Attainment in Philadelphia County
According to labor force statistics for Philadelphia County, 76.6% of individuals (663,963) out of the total population between 25 and 64 years of age (866,793) are in the labor force, with 7.3% or 48,469 of them being unemployed. The group with the highest labor force participation rate are those with the educational attainment of bachelor's degree or higher, with 89.5% or 281,165 individuals in the labor force. Within the labor force, individuals with less than high school education have the highest percentage of unemployment, with 12.0% or 6,064 of them being unemployed.
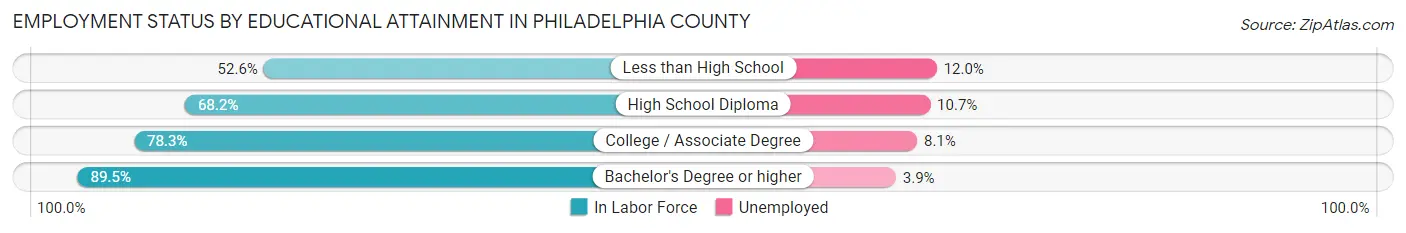
| Educational Attainment | In Labor Force | Unemployed |
| Less than High School | 50,531 (52.6%) | 11,528 (12.0%) |
| High School Diploma | 170,600 (68.2%) | 26,766 (10.7%) |
| College / Associate Degree | 161,635 (78.3%) | 16,721 (8.1%) |
| Bachelor's Degree or higher | 281,165 (89.5%) | 12,252 (3.9%) |
| Total | 663,963 (76.6%) | 63,276 (7.3%) |
Employment Occupations by Sex in Philadelphia County
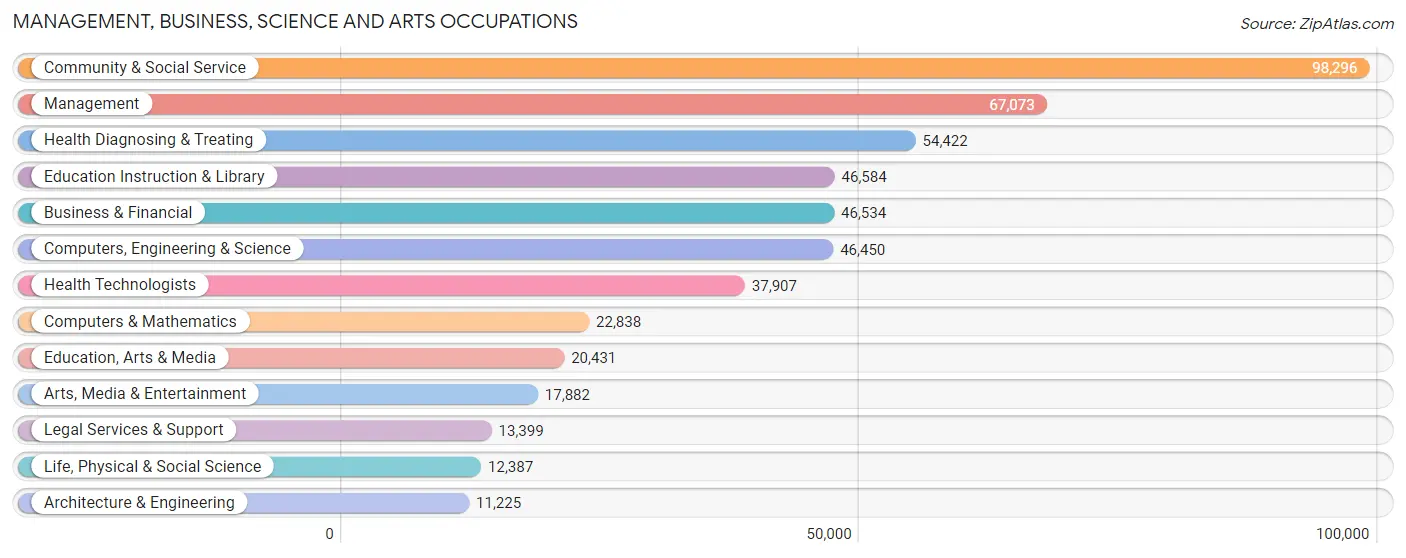
Management, Business, Science and Arts Occupations
The most common Management, Business, Science and Arts occupations in Philadelphia County are Community & Social Service (98,296 | 13.3%), Management (67,073 | 9.1%), Health Diagnosing & Treating (54,422 | 7.4%), Education Instruction & Library (46,584 | 6.3%), and Business & Financial (46,534 | 6.3%).
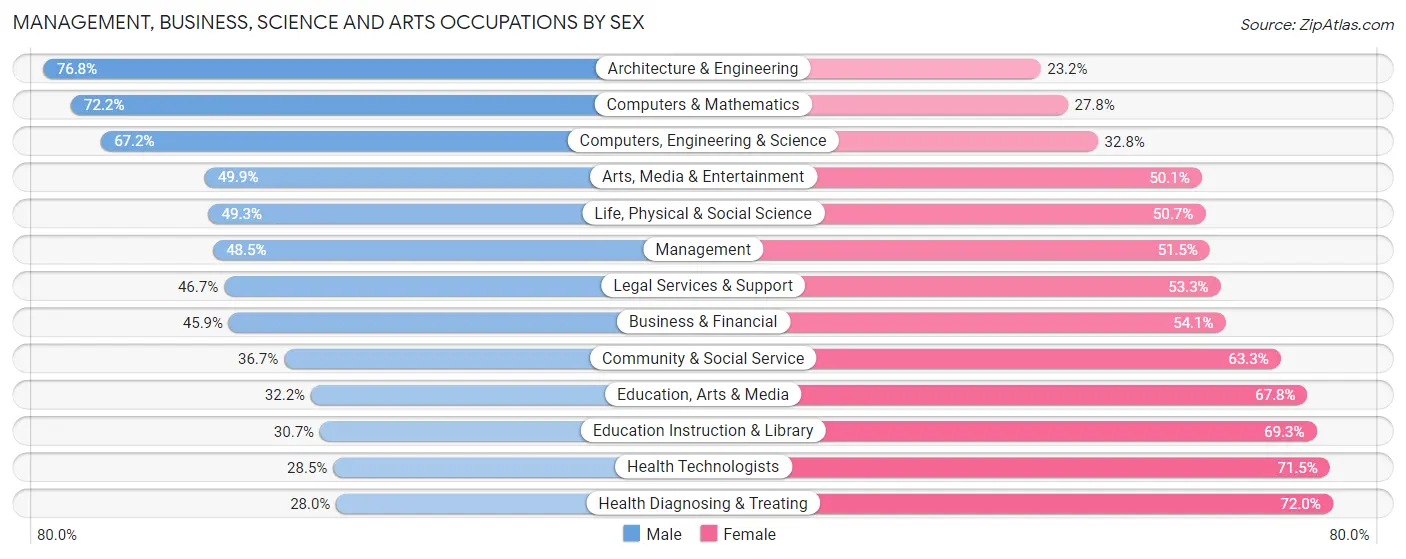
Management, Business, Science and Arts Occupations by Sex
Within the Management, Business, Science and Arts occupations in Philadelphia County, the most male-oriented occupations are Architecture & Engineering (76.8%), Computers & Mathematics (72.2%), and Computers, Engineering & Science (67.2%), while the most female-oriented occupations are Health Diagnosing & Treating (72.0%), Health Technologists (71.5%), and Education Instruction & Library (69.3%).
| Occupation | Male | Female |
| Management | 32,544 (48.5%) | 34,529 (51.5%) |
| Business & Financial | 21,364 (45.9%) | 25,170 (54.1%) |
| Computers, Engineering & Science | 31,220 (67.2%) | 15,230 (32.8%) |
| Computers & Mathematics | 16,497 (72.2%) | 6,341 (27.8%) |
| Architecture & Engineering | 8,619 (76.8%) | 2,606 (23.2%) |
| Life, Physical & Social Science | 6,104 (49.3%) | 6,283 (50.7%) |
| Community & Social Service | 36,075 (36.7%) | 62,221 (63.3%) |
| Education, Arts & Media | 6,583 (32.2%) | 13,848 (67.8%) |
| Legal Services & Support | 6,261 (46.7%) | 7,138 (53.3%) |
| Education Instruction & Library | 14,310 (30.7%) | 32,274 (69.3%) |
| Arts, Media & Entertainment | 8,921 (49.9%) | 8,961 (50.1%) |
| Health Diagnosing & Treating | 15,239 (28.0%) | 39,183 (72.0%) |
| Health Technologists | 10,807 (28.5%) | 27,100 (71.5%) |
| Total (Category) | 136,442 (43.6%) | 176,333 (56.4%) |
| Total (Overall) | 355,724 (48.3%) | 381,013 (51.7%) |
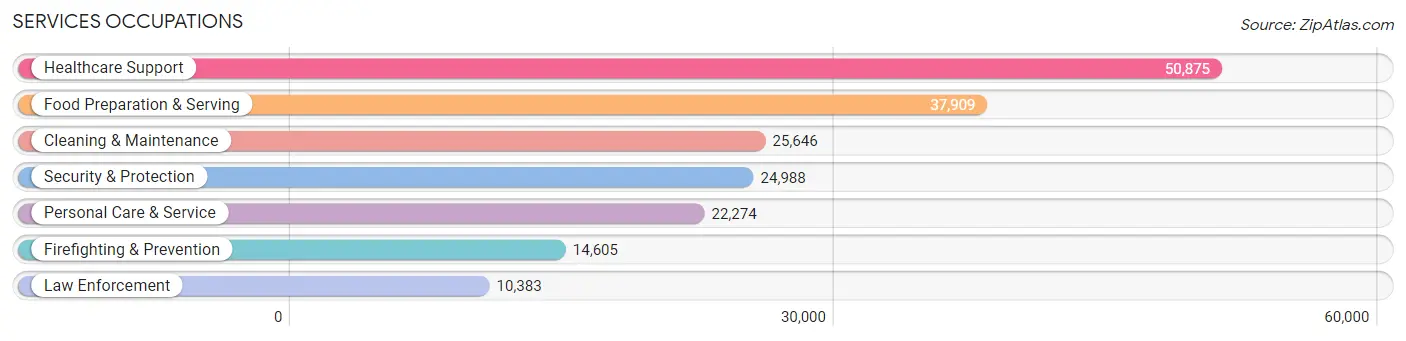
Services Occupations
The most common Services occupations in Philadelphia County are Healthcare Support (50,875 | 6.9%), Food Preparation & Serving (37,909 | 5.1%), Cleaning & Maintenance (25,646 | 3.5%), Security & Protection (24,988 | 3.4%), and Personal Care & Service (22,274 | 3.0%).
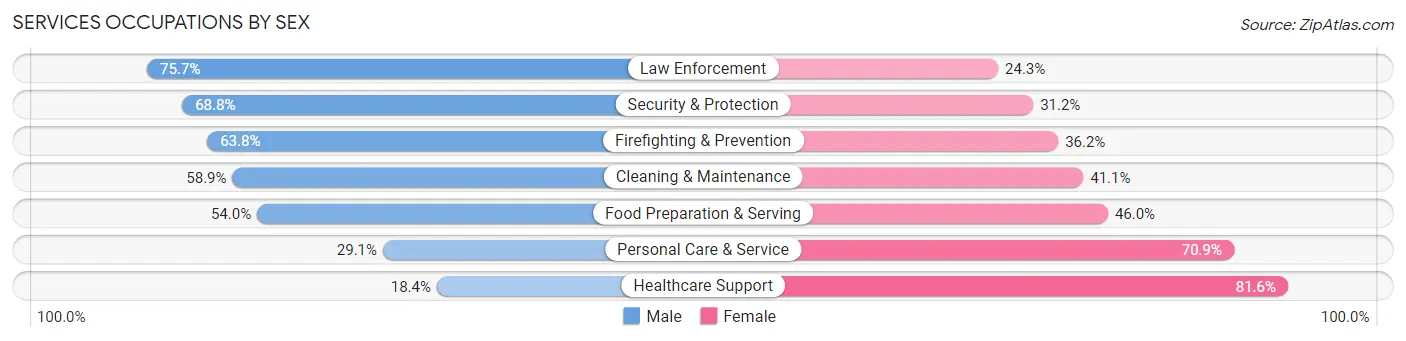
Services Occupations by Sex
Within the Services occupations in Philadelphia County, the most male-oriented occupations are Law Enforcement (75.7%), Security & Protection (68.8%), and Firefighting & Prevention (63.8%), while the most female-oriented occupations are Healthcare Support (81.6%), Personal Care & Service (70.9%), and Food Preparation & Serving (46.0%).
| Occupation | Male | Female |
| Healthcare Support | 9,349 (18.4%) | 41,526 (81.6%) |
| Security & Protection | 17,186 (68.8%) | 7,802 (31.2%) |
| Firefighting & Prevention | 9,323 (63.8%) | 5,282 (36.2%) |
| Law Enforcement | 7,863 (75.7%) | 2,520 (24.3%) |
| Food Preparation & Serving | 20,463 (54.0%) | 17,446 (46.0%) |
| Cleaning & Maintenance | 15,094 (58.9%) | 10,552 (41.1%) |
| Personal Care & Service | 6,473 (29.1%) | 15,801 (70.9%) |
| Total (Category) | 68,565 (42.4%) | 93,127 (57.6%) |
| Total (Overall) | 355,724 (48.3%) | 381,013 (51.7%) |
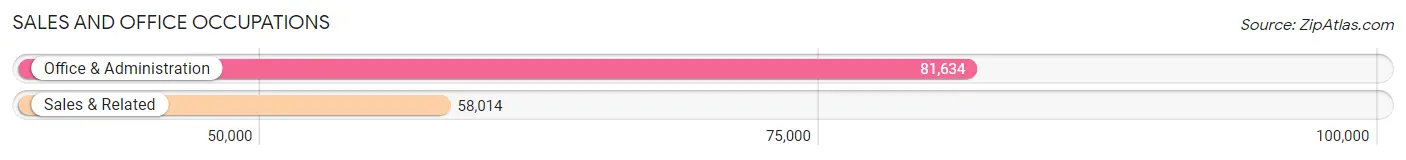
Sales and Office Occupations
The most common Sales and Office occupations in Philadelphia County are Office & Administration (81,634 | 11.1%), and Sales & Related (58,014 | 7.9%).
Sales and Office Occupations by Sex
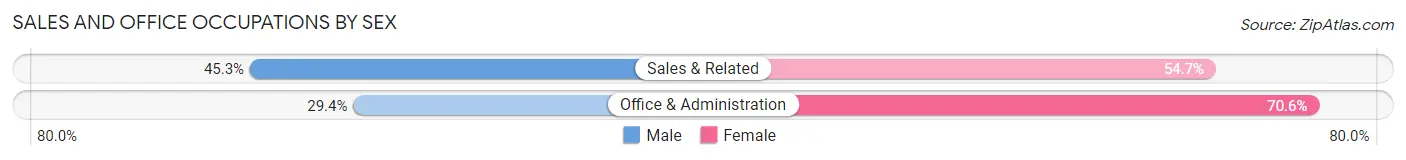
| Occupation | Male | Female |
| Sales & Related | 26,295 (45.3%) | 31,719 (54.7%) |
| Office & Administration | 24,021 (29.4%) | 57,613 (70.6%) |
| Total (Category) | 50,316 (36.0%) | 89,332 (64.0%) |
| Total (Overall) | 355,724 (48.3%) | 381,013 (51.7%) |
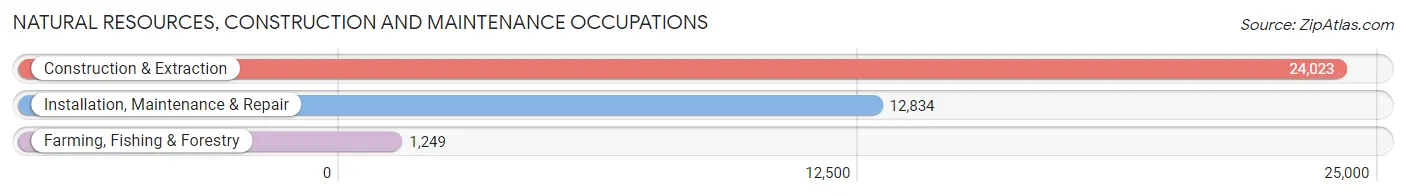
Natural Resources, Construction and Maintenance Occupations
The most common Natural Resources, Construction and Maintenance occupations in Philadelphia County are Construction & Extraction (24,023 | 3.3%), Installation, Maintenance & Repair (12,834 | 1.7%), and Farming, Fishing & Forestry (1,249 | 0.2%).
Natural Resources, Construction and Maintenance Occupations by Sex
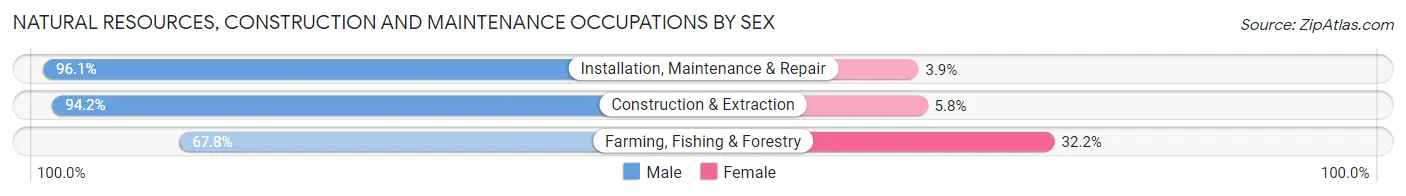
| Occupation | Male | Female |
| Farming, Fishing & Forestry | 847 (67.8%) | 402 (32.2%) |
| Construction & Extraction | 22,638 (94.2%) | 1,385 (5.8%) |
| Installation, Maintenance & Repair | 12,337 (96.1%) | 497 (3.9%) |
| Total (Category) | 35,822 (94.0%) | 2,284 (6.0%) |
| Total (Overall) | 355,724 (48.3%) | 381,013 (51.7%) |
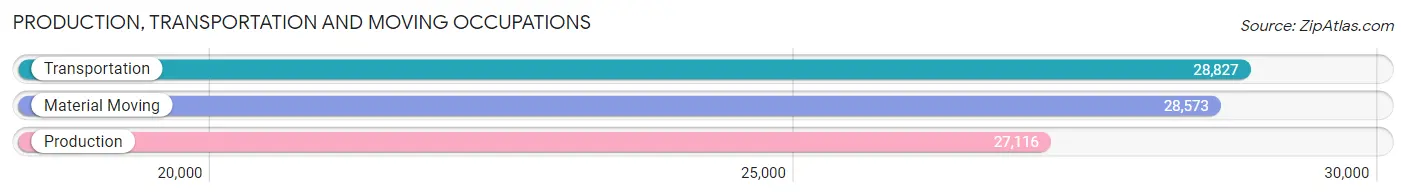
Production, Transportation and Moving Occupations
The most common Production, Transportation and Moving occupations in Philadelphia County are Transportation (28,827 | 3.9%), Material Moving (28,573 | 3.9%), and Production (27,116 | 3.7%).
Production, Transportation and Moving Occupations by Sex
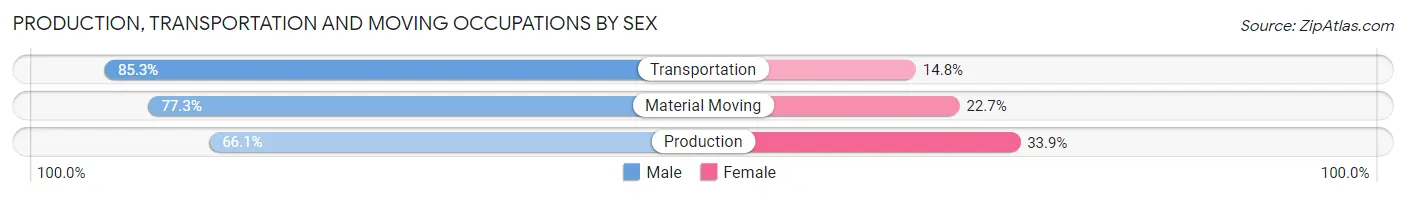
| Occupation | Male | Female |
| Production | 17,928 (66.1%) | 9,188 (33.9%) |
| Transportation | 24,575 (85.3%) | 4,252 (14.7%) |
| Material Moving | 22,076 (77.3%) | 6,497 (22.7%) |
| Total (Category) | 64,579 (76.4%) | 19,937 (23.6%) |
| Total (Overall) | 355,724 (48.3%) | 381,013 (51.7%) |
Employment Industries by Sex in Philadelphia County
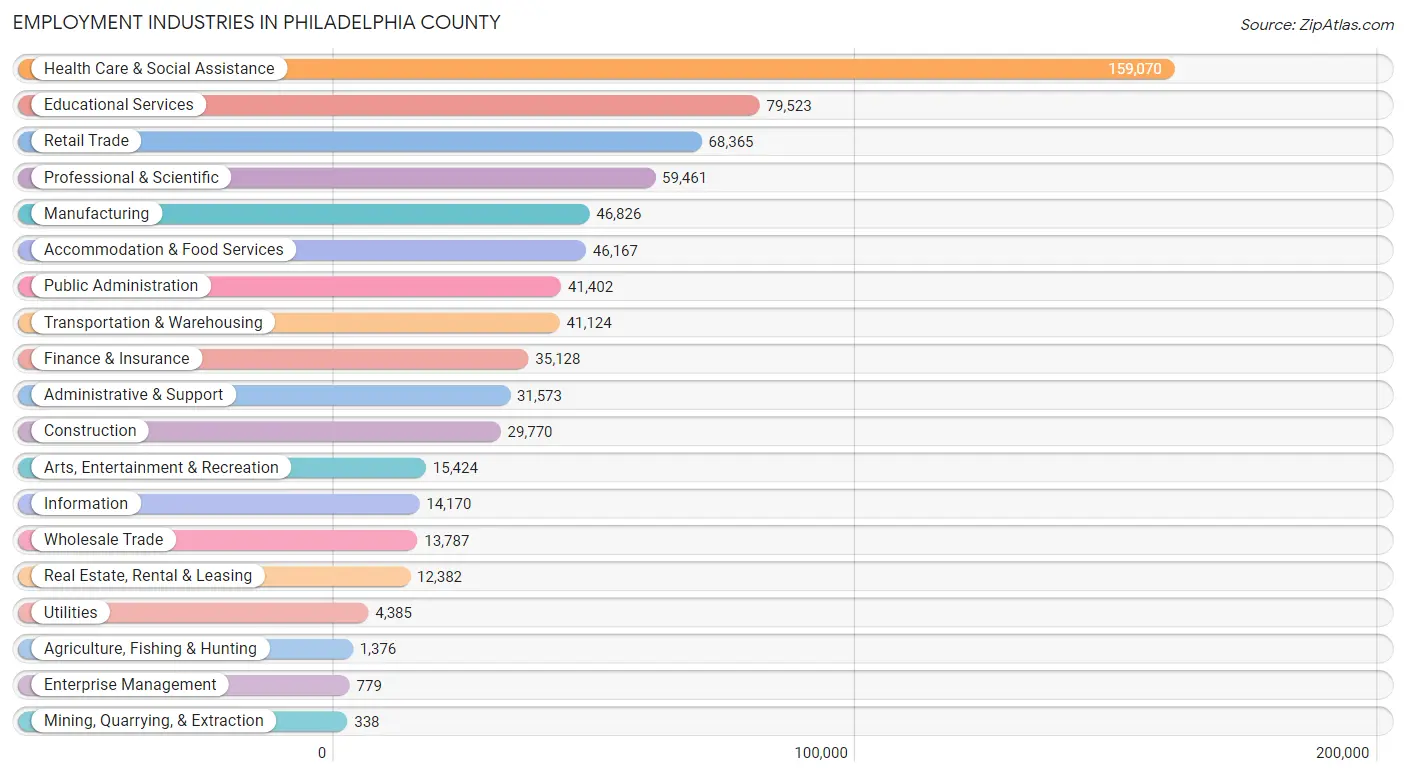
Employment Industries in Philadelphia County
The major employment industries in Philadelphia County include Health Care & Social Assistance (159,070 | 21.6%), Educational Services (79,523 | 10.8%), Retail Trade (68,365 | 9.3%), Professional & Scientific (59,461 | 8.1%), and Manufacturing (46,826 | 6.4%).
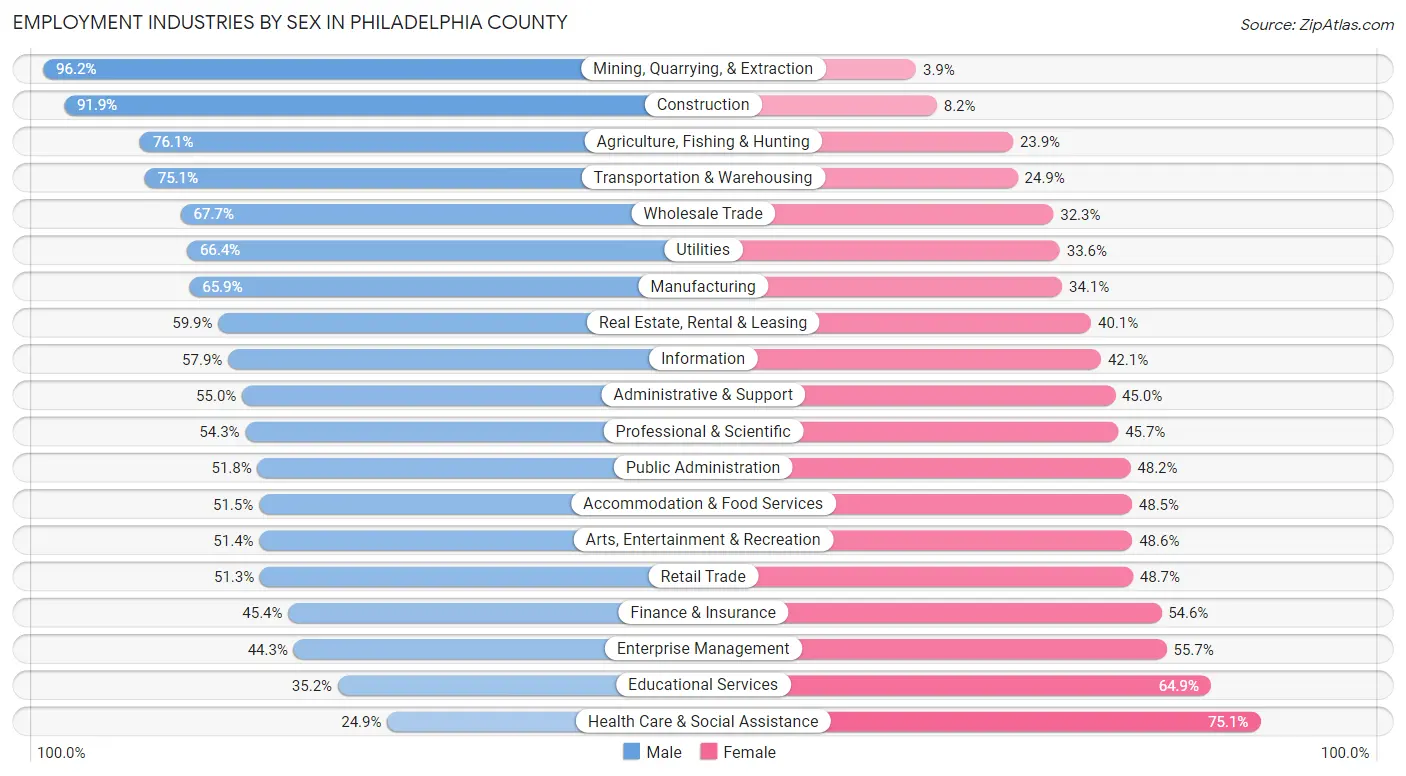
Employment Industries by Sex in Philadelphia County
The Philadelphia County industries that see more men than women are Mining, Quarrying, & Extraction (96.2%), Construction (91.8%), and Agriculture, Fishing & Hunting (76.1%), whereas the industries that tend to have a higher number of women are Health Care & Social Assistance (75.1%), Educational Services (64.8%), and Enterprise Management (55.7%).
| Industry | Male | Female |
| Agriculture, Fishing & Hunting | 1,047 (76.1%) | 329 (23.9%) |
| Mining, Quarrying, & Extraction | 325 (96.2%) | 13 (3.8%) |
| Construction | 27,343 (91.8%) | 2,427 (8.2%) |
| Manufacturing | 30,862 (65.9%) | 15,964 (34.1%) |
| Wholesale Trade | 9,338 (67.7%) | 4,449 (32.3%) |
| Retail Trade | 35,050 (51.3%) | 33,315 (48.7%) |
| Transportation & Warehousing | 30,893 (75.1%) | 10,231 (24.9%) |
| Utilities | 2,911 (66.4%) | 1,474 (33.6%) |
| Information | 8,200 (57.9%) | 5,970 (42.1%) |
| Finance & Insurance | 15,948 (45.4%) | 19,180 (54.6%) |
| Real Estate, Rental & Leasing | 7,418 (59.9%) | 4,964 (40.1%) |
| Professional & Scientific | 32,288 (54.3%) | 27,173 (45.7%) |
| Enterprise Management | 345 (44.3%) | 434 (55.7%) |
| Administrative & Support | 17,357 (55.0%) | 14,216 (45.0%) |
| Educational Services | 27,954 (35.1%) | 51,569 (64.8%) |
| Health Care & Social Assistance | 39,636 (24.9%) | 119,434 (75.1%) |
| Arts, Entertainment & Recreation | 7,928 (51.4%) | 7,496 (48.6%) |
| Accommodation & Food Services | 23,760 (51.5%) | 22,407 (48.5%) |
| Public Administration | 21,440 (51.8%) | 19,962 (48.2%) |
| Total | 355,724 (48.3%) | 381,013 (51.7%) |
Education in Philadelphia County
School Enrollment in Philadelphia County
The most common levels of schooling among the 397,505 students in Philadelphia County are college / undergraduate (93,263 | 23.5%), middle school (75,787 | 19.1%), and elementary school (73,571 | 18.5%).
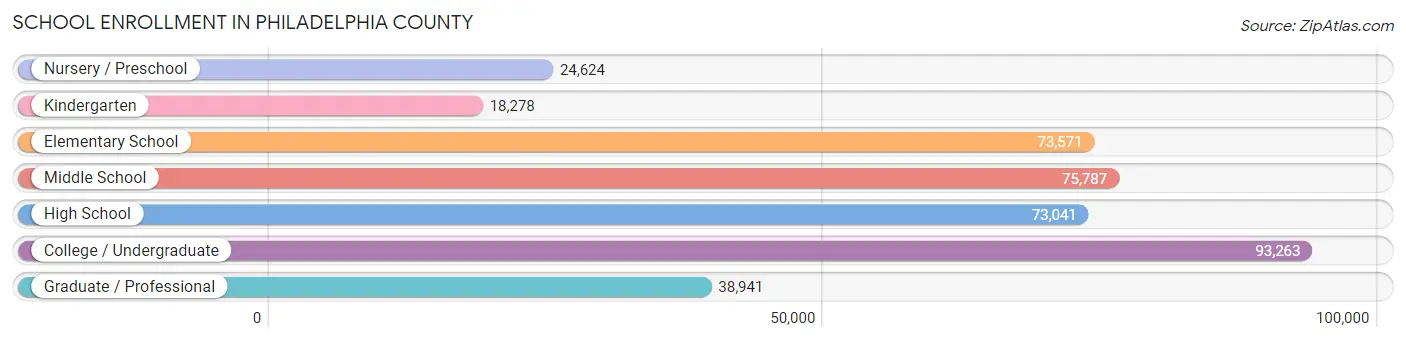
| School Level | # Students | % Students |
| Nursery / Preschool | 24,624 | 6.2% |
| Kindergarten | 18,278 | 4.6% |
| Elementary School | 73,571 | 18.5% |
| Middle School | 75,787 | 19.1% |
| High School | 73,041 | 18.4% |
| College / Undergraduate | 93,263 | 23.5% |
| Graduate / Professional | 38,941 | 9.8% |
| Total | 397,505 | 100.0% |
School Enrollment by Age by Funding Source in Philadelphia County
Out of a total of 397,505 students who are enrolled in schools in Philadelphia County, 137,934 (34.7%) attend a private institution, while the remaining 259,571 (65.3%) are enrolled in public schools. The age group of 20 to 24 year olds has the highest likelihood of being enrolled in private schools, with 28,283 (58.2% in the age bracket) enrolled. Conversely, the age group of 10 to 14 year olds has the lowest likelihood of being enrolled in a private school, with 74,714 (79.5% in the age bracket) attending a public institution.
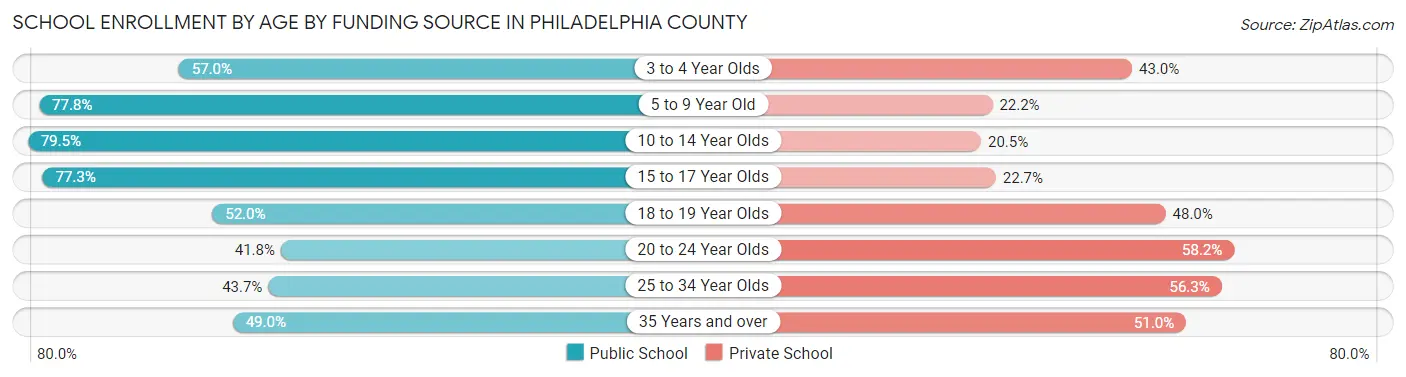
| Age Bracket | Public School | Private School |
| 3 to 4 Year Olds | 11,530 (57.0%) | 8,690 (43.0%) |
| 5 to 9 Year Old | 66,438 (77.8%) | 18,930 (22.2%) |
| 10 to 14 Year Olds | 74,714 (79.5%) | 19,225 (20.5%) |
| 15 to 17 Year Olds | 39,017 (77.3%) | 11,444 (22.7%) |
| 18 to 19 Year Olds | 19,555 (52.0%) | 18,032 (48.0%) |
| 20 to 24 Year Olds | 20,330 (41.8%) | 28,283 (58.2%) |
| 25 to 34 Year Olds | 16,925 (43.7%) | 21,809 (56.3%) |
| 35 Years and over | 11,062 (49.0%) | 11,521 (51.0%) |
| Total | 259,571 (65.3%) | 137,934 (34.7%) |
Educational Attainment by Field of Study in Philadelphia County
Business (69,757 | 17.5%), social sciences (39,104 | 9.8%), science & technology (38,102 | 9.6%), education (28,767 | 7.2%), and bio, nature & agricultural (28,727 | 7.2%) are the most common fields of study among 399,140 individuals in Philadelphia County who have obtained a bachelor's degree or higher.
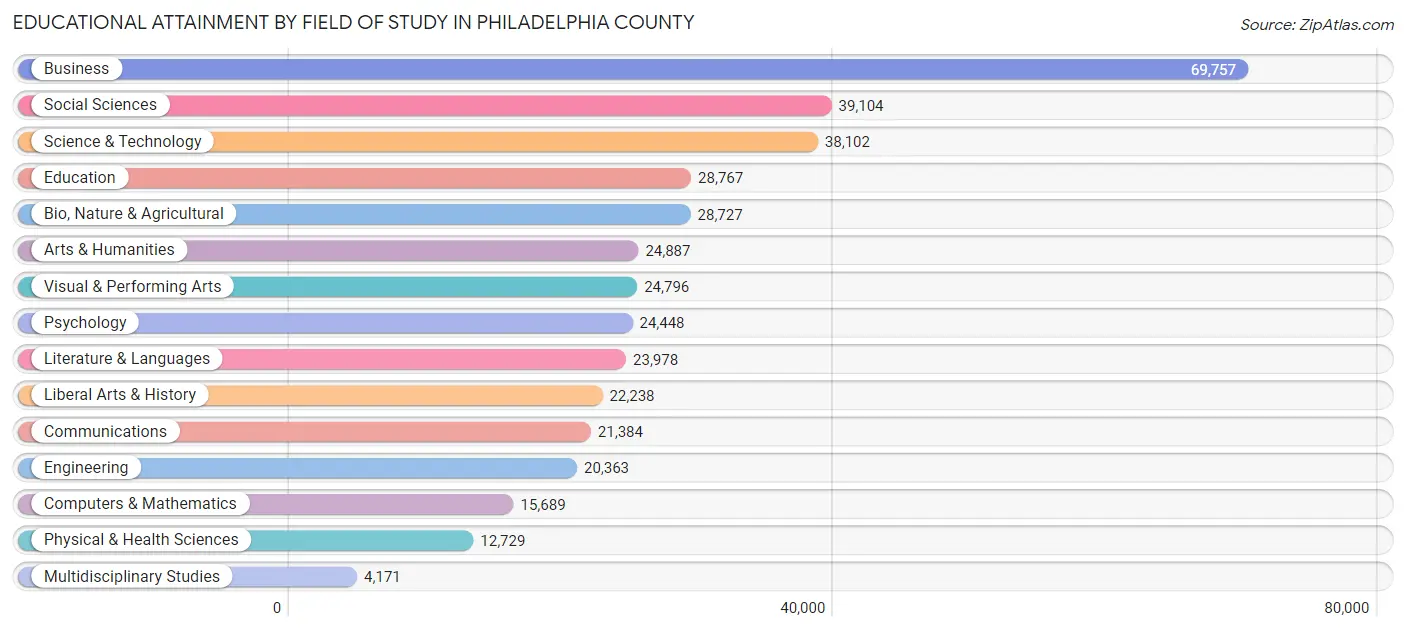
| Field of Study | # Graduates | % Graduates |
| Computers & Mathematics | 15,689 | 3.9% |
| Bio, Nature & Agricultural | 28,727 | 7.2% |
| Physical & Health Sciences | 12,729 | 3.2% |
| Psychology | 24,448 | 6.1% |
| Social Sciences | 39,104 | 9.8% |
| Engineering | 20,363 | 5.1% |
| Multidisciplinary Studies | 4,171 | 1.0% |
| Science & Technology | 38,102 | 9.6% |
| Business | 69,757 | 17.5% |
| Education | 28,767 | 7.2% |
| Literature & Languages | 23,978 | 6.0% |
| Liberal Arts & History | 22,238 | 5.6% |
| Visual & Performing Arts | 24,796 | 6.2% |
| Communications | 21,384 | 5.4% |
| Arts & Humanities | 24,887 | 6.2% |
| Total | 399,140 | 100.0% |
Transportation & Commute in Philadelphia County
Vehicle Availability by Sex in Philadelphia County
The most prevalent vehicle ownership categories in Philadelphia County are males with 1 vehicle (137,175, accounting for 39.8%) and females with 1 vehicle (155,675, making up 37.9%).
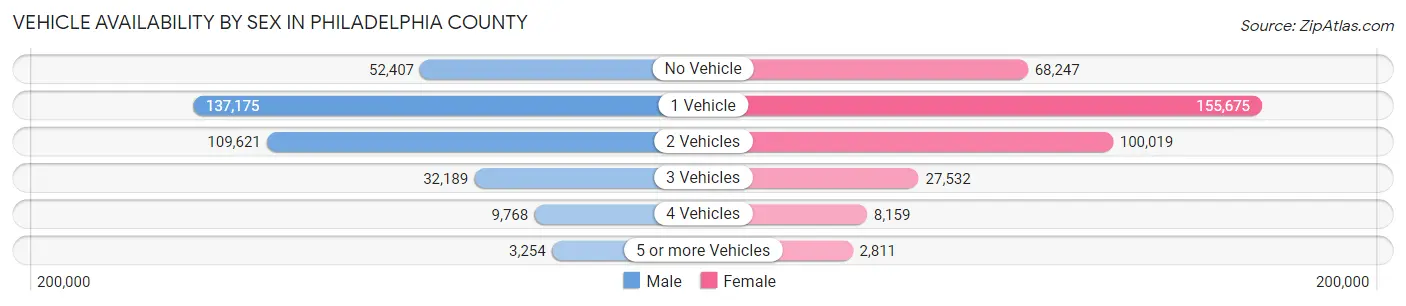
| Vehicles Available | Male | Female |
| No Vehicle | 52,407 (15.2%) | 68,247 (18.8%) |
| 1 Vehicle | 137,175 (39.8%) | 155,675 (42.9%) |
| 2 Vehicles | 109,621 (31.8%) | 100,019 (27.6%) |
| 3 Vehicles | 32,189 (9.3%) | 27,532 (7.6%) |
| 4 Vehicles | 9,768 (2.8%) | 8,159 (2.2%) |
| 5 or more Vehicles | 3,254 (0.9%) | 2,811 (0.8%) |
| Total | 344,414 (100.0%) | 362,443 (100.0%) |
Commute Time in Philadelphia County
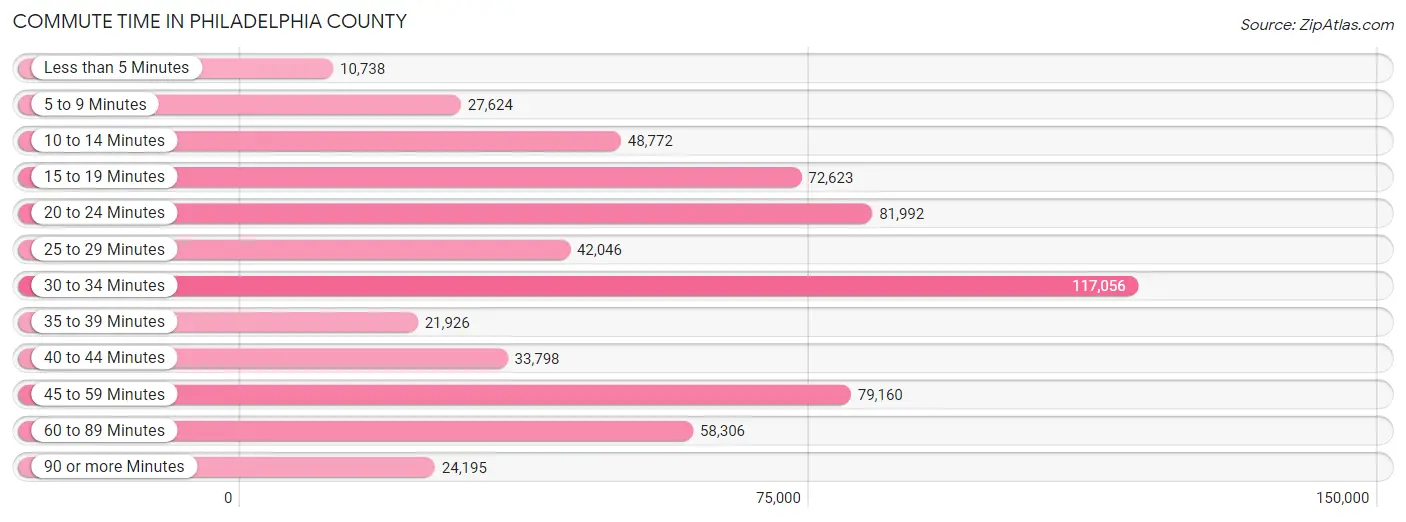
The most frequently occuring commute durations in Philadelphia County are 30 to 34 minutes (117,056 commuters, 18.9%), 20 to 24 minutes (81,992 commuters, 13.3%), and 45 to 59 minutes (79,160 commuters, 12.8%).
| Commute Time | # Commuters | % Commuters |
| Less than 5 Minutes | 10,738 | 1.7% |
| 5 to 9 Minutes | 27,624 | 4.5% |
| 10 to 14 Minutes | 48,772 | 7.9% |
| 15 to 19 Minutes | 72,623 | 11.7% |
| 20 to 24 Minutes | 81,992 | 13.3% |
| 25 to 29 Minutes | 42,046 | 6.8% |
| 30 to 34 Minutes | 117,056 | 18.9% |
| 35 to 39 Minutes | 21,926 | 3.5% |
| 40 to 44 Minutes | 33,798 | 5.5% |
| 45 to 59 Minutes | 79,160 | 12.8% |
| 60 to 89 Minutes | 58,306 | 9.4% |
| 90 or more Minutes | 24,195 | 3.9% |
Commute Time by Sex in Philadelphia County
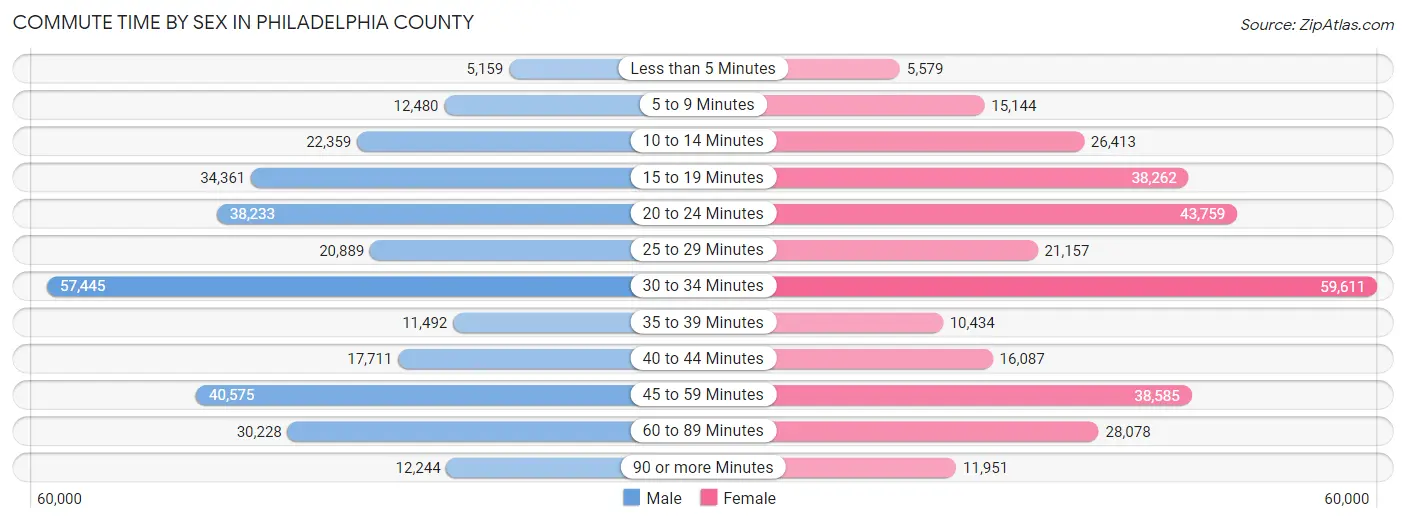
The most common commute times in Philadelphia County are 30 to 34 minutes (57,445 commuters, 19.0%) for males and 30 to 34 minutes (59,611 commuters, 18.9%) for females.
| Commute Time | Male | Female |
| Less than 5 Minutes | 5,159 (1.7%) | 5,579 (1.8%) |
| 5 to 9 Minutes | 12,480 (4.1%) | 15,144 (4.8%) |
| 10 to 14 Minutes | 22,359 (7.4%) | 26,413 (8.4%) |
| 15 to 19 Minutes | 34,361 (11.3%) | 38,262 (12.1%) |
| 20 to 24 Minutes | 38,233 (12.6%) | 43,759 (13.9%) |
| 25 to 29 Minutes | 20,889 (6.9%) | 21,157 (6.7%) |
| 30 to 34 Minutes | 57,445 (19.0%) | 59,611 (18.9%) |
| 35 to 39 Minutes | 11,492 (3.8%) | 10,434 (3.3%) |
| 40 to 44 Minutes | 17,711 (5.8%) | 16,087 (5.1%) |
| 45 to 59 Minutes | 40,575 (13.4%) | 38,585 (12.2%) |
| 60 to 89 Minutes | 30,228 (10.0%) | 28,078 (8.9%) |
| 90 or more Minutes | 12,244 (4.0%) | 11,951 (3.8%) |
Time of Departure to Work by Sex in Philadelphia County
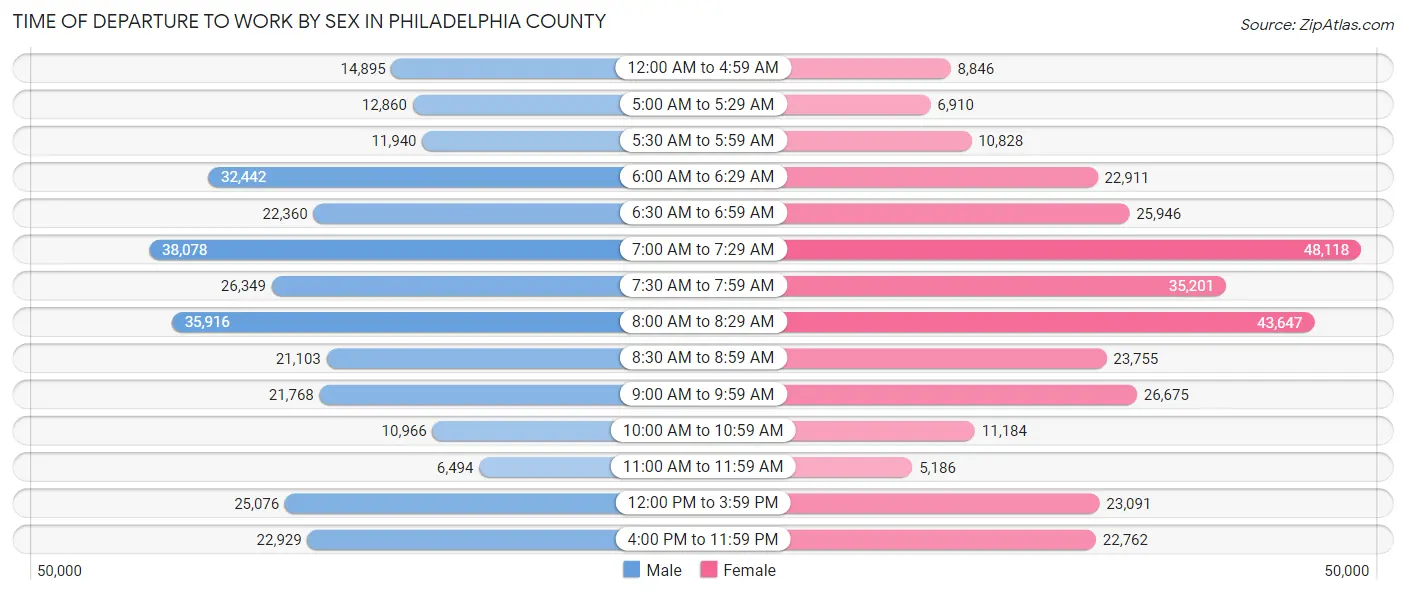
The most frequent times of departure to work in Philadelphia County are 7:00 AM to 7:29 AM (38,078, 12.6%) for males and 7:00 AM to 7:29 AM (48,118, 15.3%) for females.
| Time of Departure | Male | Female |
| 12:00 AM to 4:59 AM | 14,895 (4.9%) | 8,846 (2.8%) |
| 5:00 AM to 5:29 AM | 12,860 (4.2%) | 6,910 (2.2%) |
| 5:30 AM to 5:59 AM | 11,940 (3.9%) | 10,828 (3.4%) |
| 6:00 AM to 6:29 AM | 32,442 (10.7%) | 22,911 (7.3%) |
| 6:30 AM to 6:59 AM | 22,360 (7.4%) | 25,946 (8.2%) |
| 7:00 AM to 7:29 AM | 38,078 (12.6%) | 48,118 (15.3%) |
| 7:30 AM to 7:59 AM | 26,349 (8.7%) | 35,201 (11.2%) |
| 8:00 AM to 8:29 AM | 35,916 (11.8%) | 43,647 (13.9%) |
| 8:30 AM to 8:59 AM | 21,103 (7.0%) | 23,755 (7.5%) |
| 9:00 AM to 9:59 AM | 21,768 (7.2%) | 26,675 (8.5%) |
| 10:00 AM to 10:59 AM | 10,966 (3.6%) | 11,184 (3.5%) |
| 11:00 AM to 11:59 AM | 6,494 (2.1%) | 5,186 (1.7%) |
| 12:00 PM to 3:59 PM | 25,076 (8.3%) | 23,091 (7.3%) |
| 4:00 PM to 11:59 PM | 22,929 (7.6%) | 22,762 (7.2%) |
| Total | 303,176 (100.0%) | 315,060 (100.0%) |
Housing Occupancy in Philadelphia County
Occupancy by Ownership in Philadelphia County
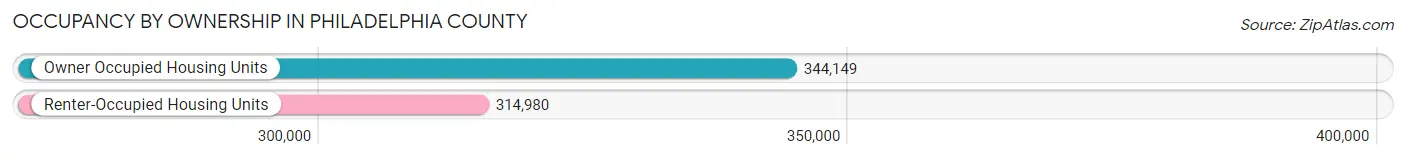
Of the total 659,129 dwellings in Philadelphia County, owner-occupied units account for 344,149 (52.2%), while renter-occupied units make up 314,980 (47.8%).
| Occupancy | # Housing Units | % Housing Units |
| Owner Occupied Housing Units | 344,149 | 52.2% |
| Renter-Occupied Housing Units | 314,980 | 47.8% |
| Total Occupied Housing Units | 659,129 | 100.0% |
Occupancy by Household Size in Philadelphia County
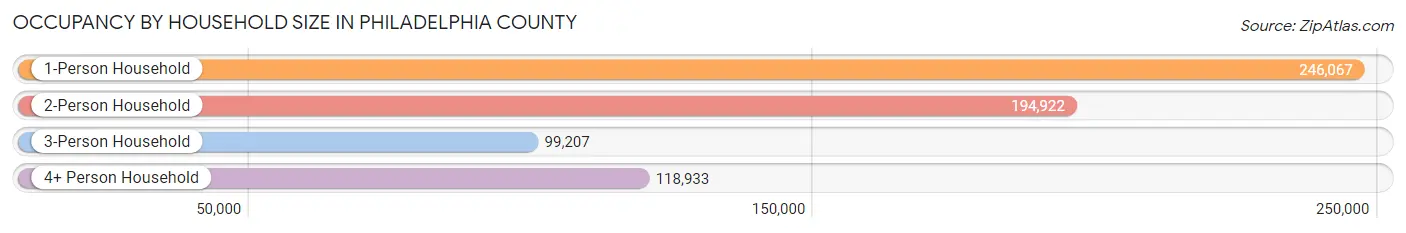
| Household Size | # Housing Units | % Housing Units |
| 1-Person Household | 246,067 | 37.3% |
| 2-Person Household | 194,922 | 29.6% |
| 3-Person Household | 99,207 | 15.0% |
| 4+ Person Household | 118,933 | 18.0% |
| Total Housing Units | 659,129 | 100.0% |
Occupancy by Ownership by Household Size in Philadelphia County
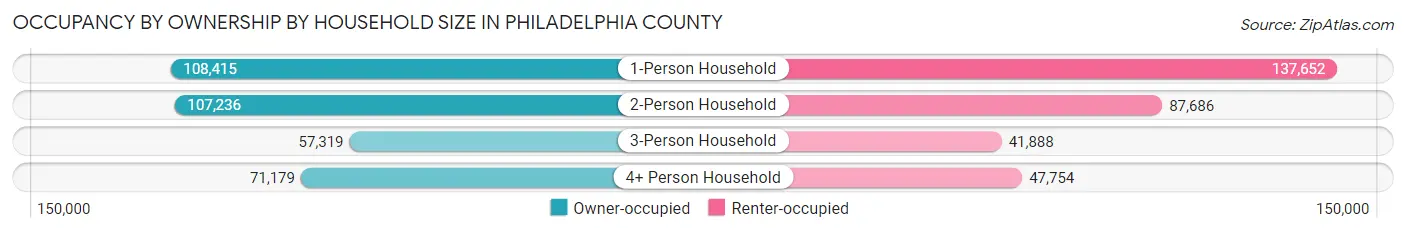
| Household Size | Owner-occupied | Renter-occupied |
| 1-Person Household | 108,415 (44.1%) | 137,652 (55.9%) |
| 2-Person Household | 107,236 (55.0%) | 87,686 (45.0%) |
| 3-Person Household | 57,319 (57.8%) | 41,888 (42.2%) |
| 4+ Person Household | 71,179 (59.9%) | 47,754 (40.2%) |
| Total Housing Units | 344,149 (52.2%) | 314,980 (47.8%) |
Occupancy by Educational Attainment in Philadelphia County
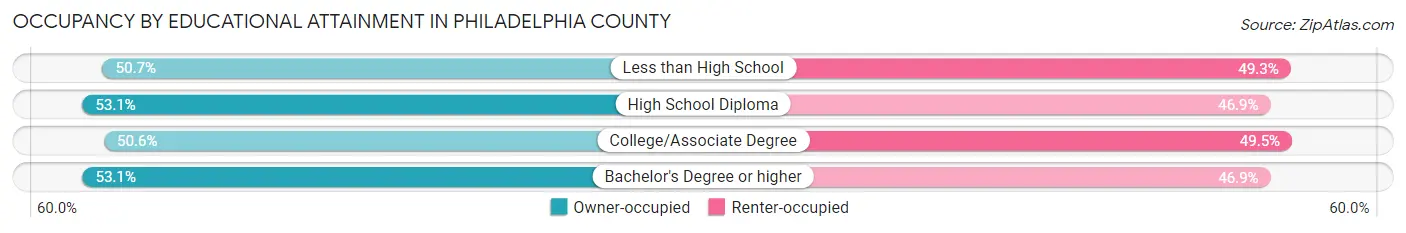
| Household Size | Owner-occupied | Renter-occupied |
| Less than High School | 37,633 (50.7%) | 36,585 (49.3%) |
| High School Diploma | 96,823 (53.1%) | 85,451 (46.9%) |
| College/Associate Degree | 81,516 (50.5%) | 79,732 (49.4%) |
| Bachelor's Degree or higher | 128,177 (53.1%) | 113,212 (46.9%) |
Occupancy by Age of Householder in Philadelphia County
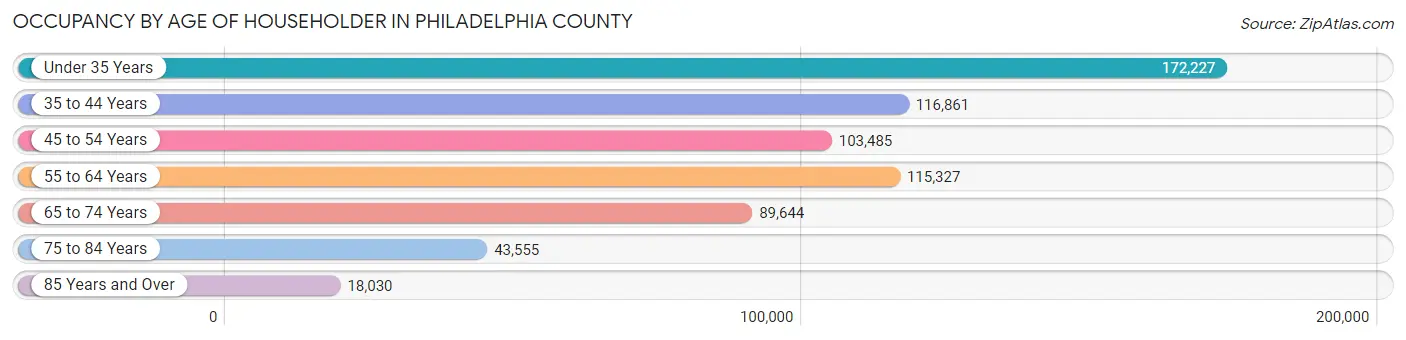
| Age Bracket | # Households | % Households |
| Under 35 Years | 172,227 | 26.1% |
| 35 to 44 Years | 116,861 | 17.7% |
| 45 to 54 Years | 103,485 | 15.7% |
| 55 to 64 Years | 115,327 | 17.5% |
| 65 to 74 Years | 89,644 | 13.6% |
| 75 to 84 Years | 43,555 | 6.6% |
| 85 Years and Over | 18,030 | 2.7% |
| Total | 659,129 | 100.0% |
Housing Finances in Philadelphia County
Median Income by Occupancy in Philadelphia County
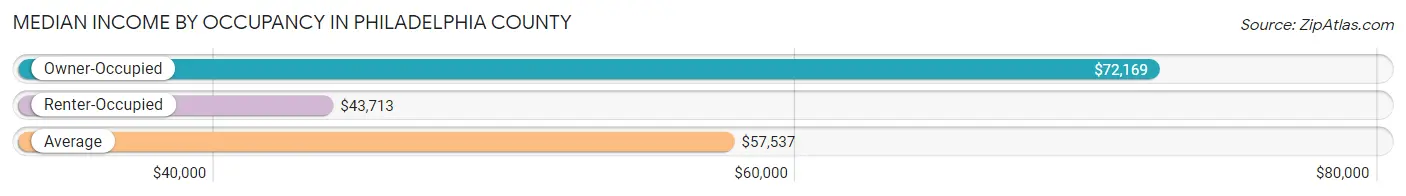
| Occupancy Type | # Households | Median Income |
| Owner-Occupied | 344,149 (52.2%) | $72,169 |
| Renter-Occupied | 314,980 (47.8%) | $43,713 |
| Average | 659,129 (100.0%) | $57,537 |
Occupancy by Householder Income Bracket in Philadelphia County
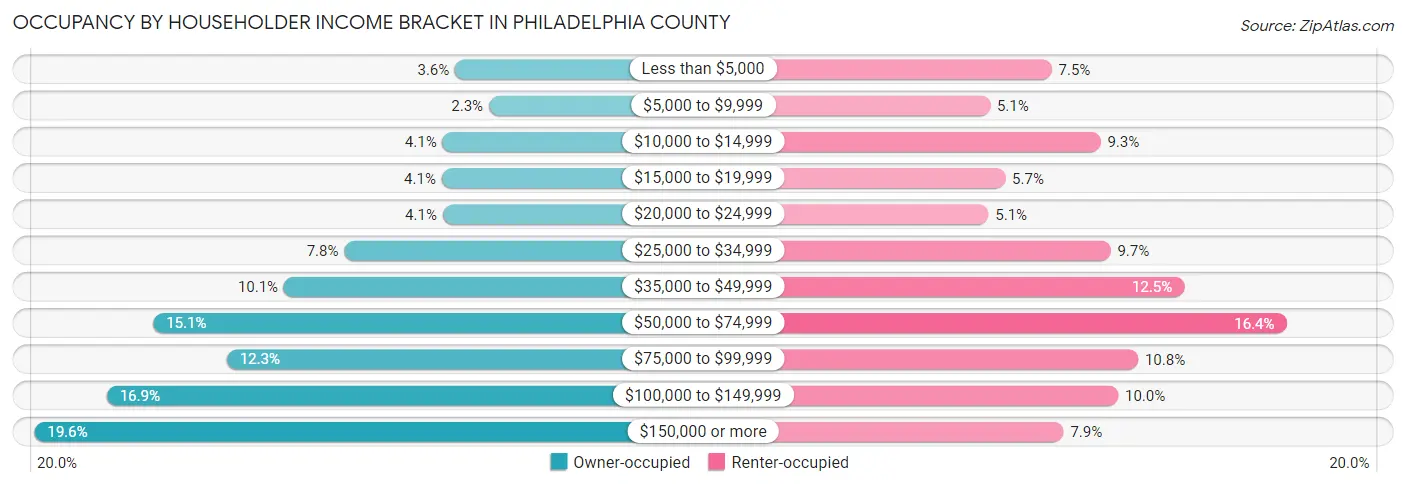
| Income Bracket | Owner-occupied | Renter-occupied |
| Less than $5,000 | 12,392 (3.6%) | 23,535 (7.5%) |
| $5,000 to $9,999 | 7,938 (2.3%) | 16,112 (5.1%) |
| $10,000 to $14,999 | 14,031 (4.1%) | 29,392 (9.3%) |
| $15,000 to $19,999 | 14,160 (4.1%) | 17,953 (5.7%) |
| $20,000 to $24,999 | 14,017 (4.1%) | 15,949 (5.1%) |
| $25,000 to $34,999 | 26,903 (7.8%) | 30,589 (9.7%) |
| $35,000 to $49,999 | 34,835 (10.1%) | 39,418 (12.5%) |
| $50,000 to $74,999 | 51,961 (15.1%) | 51,698 (16.4%) |
| $75,000 to $99,999 | 42,320 (12.3%) | 33,880 (10.8%) |
| $100,000 to $149,999 | 58,052 (16.9%) | 31,512 (10.0%) |
| $150,000 or more | 67,540 (19.6%) | 24,942 (7.9%) |
| Total | 344,149 (100.0%) | 314,980 (100.0%) |
Monthly Housing Cost Tiers in Philadelphia County
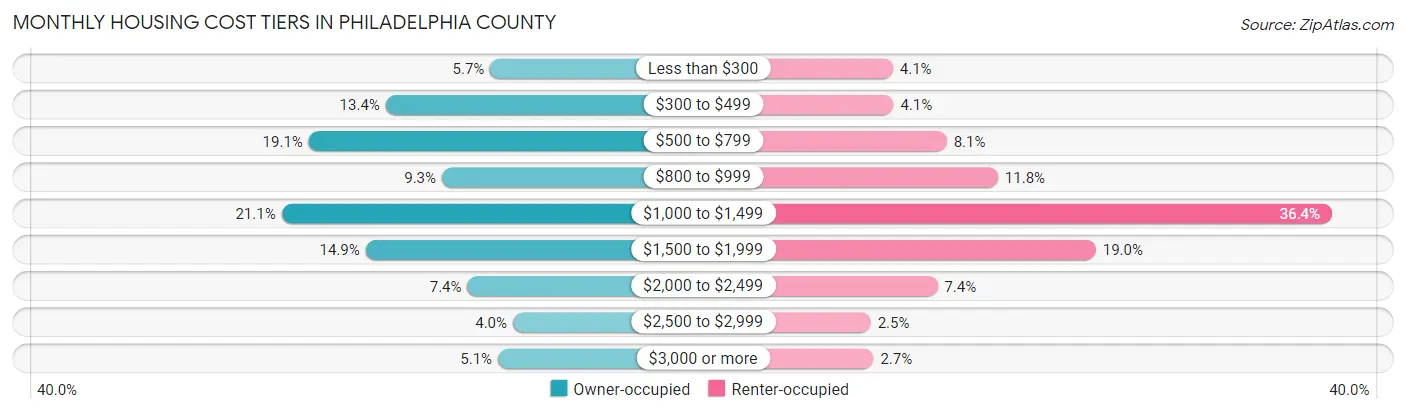
| Monthly Cost | Owner-occupied | Renter-occupied |
| Less than $300 | 19,635 (5.7%) | 12,850 (4.1%) |
| $300 to $499 | 46,138 (13.4%) | 13,019 (4.1%) |
| $500 to $799 | 65,648 (19.1%) | 25,345 (8.1%) |
| $800 to $999 | 31,916 (9.3%) | 37,222 (11.8%) |
| $1,000 to $1,499 | 72,556 (21.1%) | 114,688 (36.4%) |
| $1,500 to $1,999 | 51,241 (14.9%) | 59,940 (19.0%) |
| $2,000 to $2,499 | 25,427 (7.4%) | 23,217 (7.4%) |
| $2,500 to $2,999 | 13,897 (4.0%) | 7,702 (2.5%) |
| $3,000 or more | 17,691 (5.1%) | 8,363 (2.7%) |
| Total | 344,149 (100.0%) | 314,980 (100.0%) |
Physical Housing Characteristics in Philadelphia County
Housing Structures in Philadelphia County
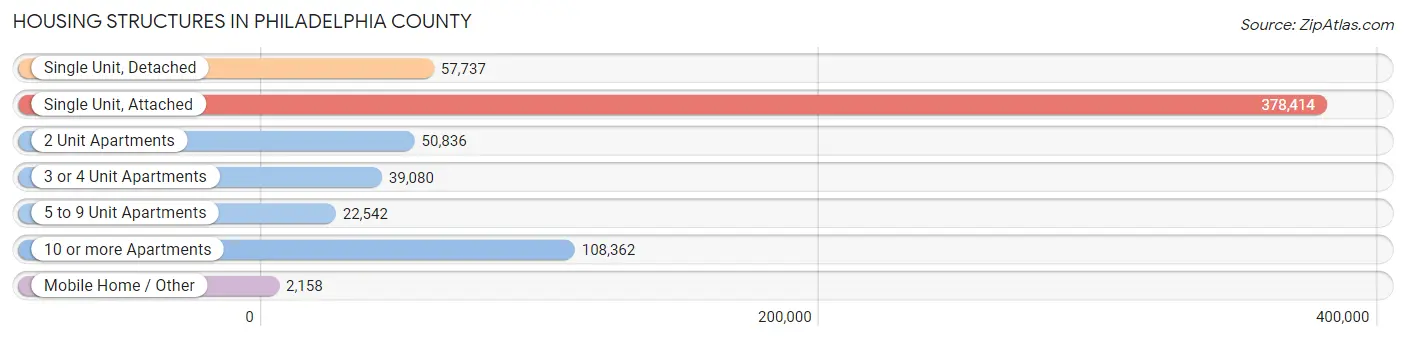
| Structure Type | # Housing Units | % Housing Units |
| Single Unit, Detached | 57,737 | 8.8% |
| Single Unit, Attached | 378,414 | 57.4% |
| 2 Unit Apartments | 50,836 | 7.7% |
| 3 or 4 Unit Apartments | 39,080 | 5.9% |
| 5 to 9 Unit Apartments | 22,542 | 3.4% |
| 10 or more Apartments | 108,362 | 16.4% |
| Mobile Home / Other | 2,158 | 0.3% |
| Total | 659,129 | 100.0% |
Housing Structures by Occupancy in Philadelphia County
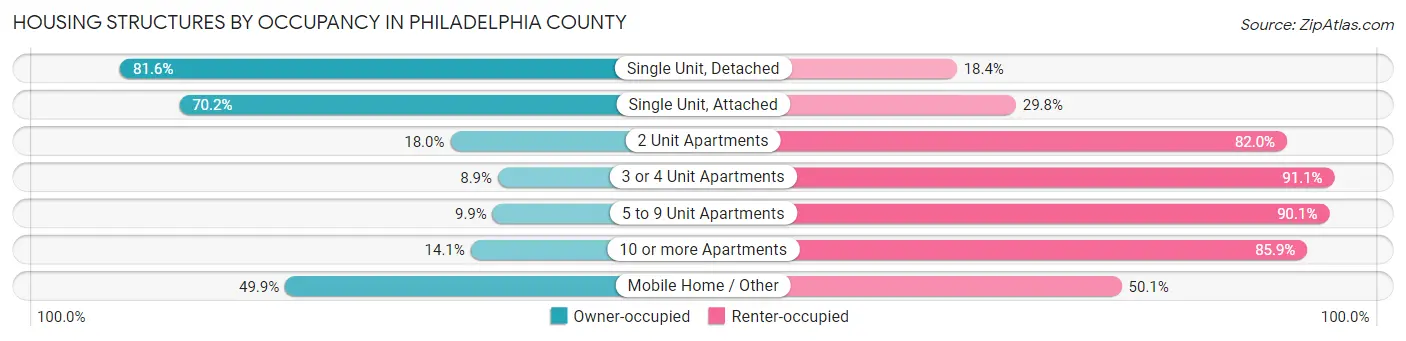
| Structure Type | Owner-occupied | Renter-occupied |
| Single Unit, Detached | 47,119 (81.6%) | 10,618 (18.4%) |
| Single Unit, Attached | 265,771 (70.2%) | 112,643 (29.8%) |
| 2 Unit Apartments | 9,167 (18.0%) | 41,669 (82.0%) |
| 3 or 4 Unit Apartments | 3,472 (8.9%) | 35,608 (91.1%) |
| 5 to 9 Unit Apartments | 2,229 (9.9%) | 20,313 (90.1%) |
| 10 or more Apartments | 15,315 (14.1%) | 93,047 (85.9%) |
| Mobile Home / Other | 1,076 (49.9%) | 1,082 (50.1%) |
| Total | 344,149 (52.2%) | 314,980 (47.8%) |
Housing Structures by Number of Rooms in Philadelphia County
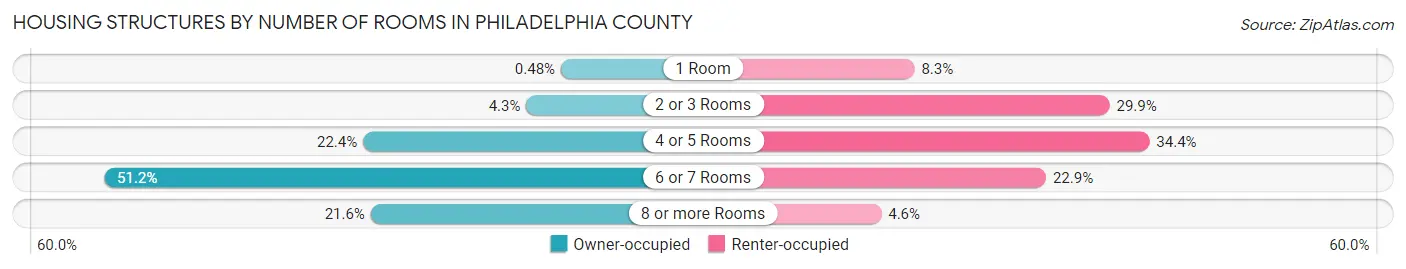
| Number of Rooms | Owner-occupied | Renter-occupied |
| 1 Room | 1,644 (0.5%) | 26,053 (8.3%) |
| 2 or 3 Rooms | 14,860 (4.3%) | 94,237 (29.9%) |
| 4 or 5 Rooms | 77,224 (22.4%) | 108,182 (34.4%) |
| 6 or 7 Rooms | 176,119 (51.2%) | 72,042 (22.9%) |
| 8 or more Rooms | 74,302 (21.6%) | 14,466 (4.6%) |
| Total | 344,149 (100.0%) | 314,980 (100.0%) |
Housing Structure by Heating Type in Philadelphia County
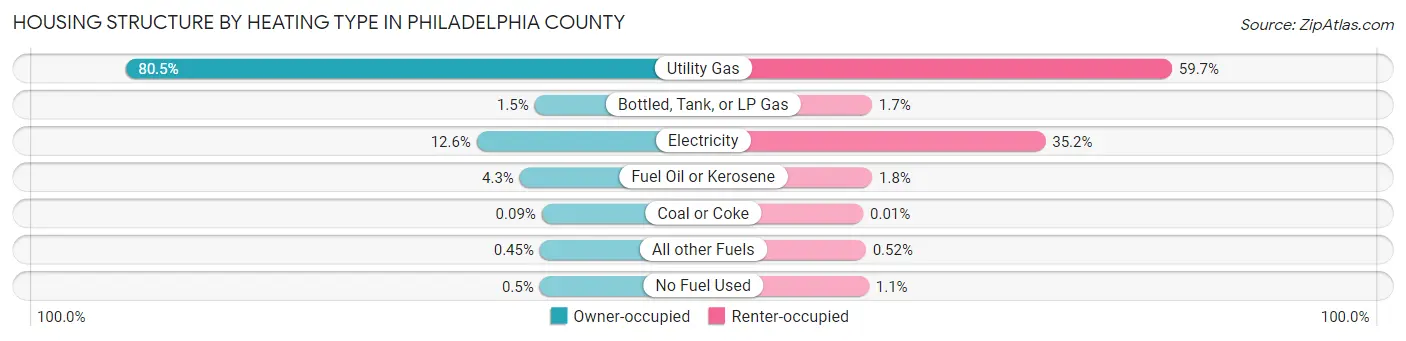
| Heating Type | Owner-occupied | Renter-occupied |
| Utility Gas | 277,135 (80.5%) | 187,939 (59.7%) |
| Bottled, Tank, or LP Gas | 5,037 (1.5%) | 5,389 (1.7%) |
| Electricity | 43,501 (12.6%) | 110,935 (35.2%) |
| Fuel Oil or Kerosene | 14,898 (4.3%) | 5,501 (1.8%) |
| Coal or Coke | 304 (0.1%) | 27 (0.0%) |
| All other Fuels | 1,537 (0.4%) | 1,648 (0.5%) |
| No Fuel Used | 1,737 (0.5%) | 3,541 (1.1%) |
| Total | 344,149 (100.0%) | 314,980 (100.0%) |
Household Vehicle Usage in Philadelphia County
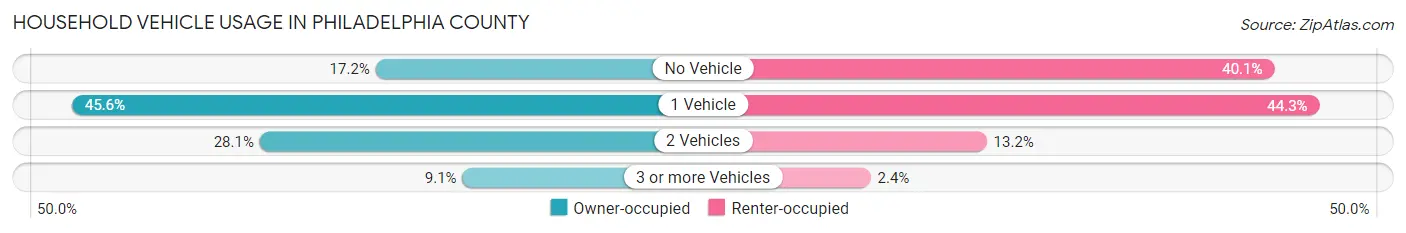
| Vehicles per Household | Owner-occupied | Renter-occupied |
| No Vehicle | 59,293 (17.2%) | 126,257 (40.1%) |
| 1 Vehicle | 156,885 (45.6%) | 139,517 (44.3%) |
| 2 Vehicles | 96,543 (28.1%) | 41,657 (13.2%) |
| 3 or more Vehicles | 31,428 (9.1%) | 7,549 (2.4%) |
| Total | 344,149 (100.0%) | 314,980 (100.0%) |
Real Estate & Mortgages in Philadelphia County
Real Estate and Mortgage Overview in Philadelphia County
| Characteristic | Without Mortgage | With Mortgage |
| Housing Units | 138,788 | 205,361 |
| Median Property Value | $178,800 | $236,000 |
| Median Household Income | $49,964 | $51,001 |
| Monthly Housing Costs | $524 | $16,731 |
| Real Estate Taxes | $1,604 | $6,475 |
Property Value by Mortgage Status in Philadelphia County
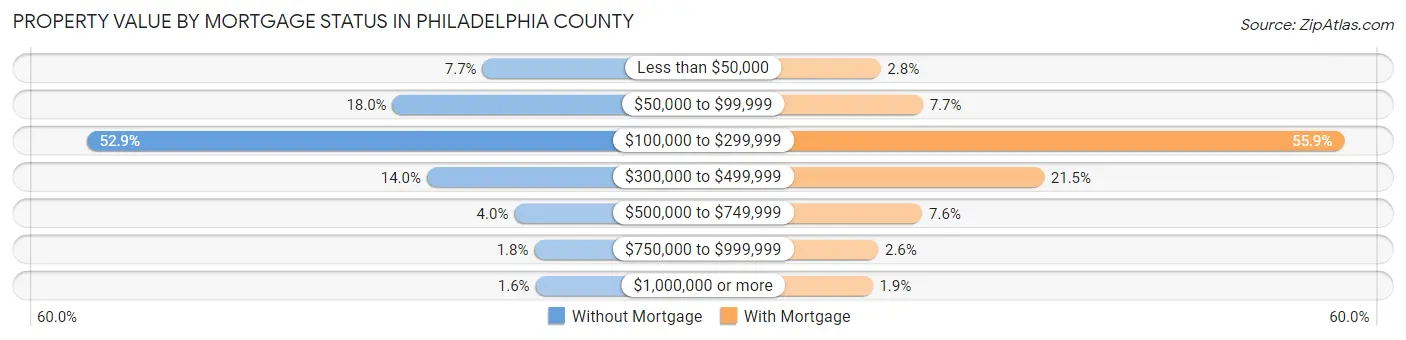
| Property Value | Without Mortgage | With Mortgage |
| Less than $50,000 | 10,654 (7.7%) | 5,826 (2.8%) |
| $50,000 to $99,999 | 24,932 (18.0%) | 15,768 (7.7%) |
| $100,000 to $299,999 | 73,435 (52.9%) | 114,700 (55.8%) |
| $300,000 to $499,999 | 19,485 (14.0%) | 44,191 (21.5%) |
| $500,000 to $749,999 | 5,609 (4.0%) | 15,630 (7.6%) |
| $750,000 to $999,999 | 2,424 (1.8%) | 5,282 (2.6%) |
| $1,000,000 or more | 2,249 (1.6%) | 3,964 (1.9%) |
| Total | 138,788 (100.0%) | 205,361 (100.0%) |
Household Income by Mortgage Status in Philadelphia County
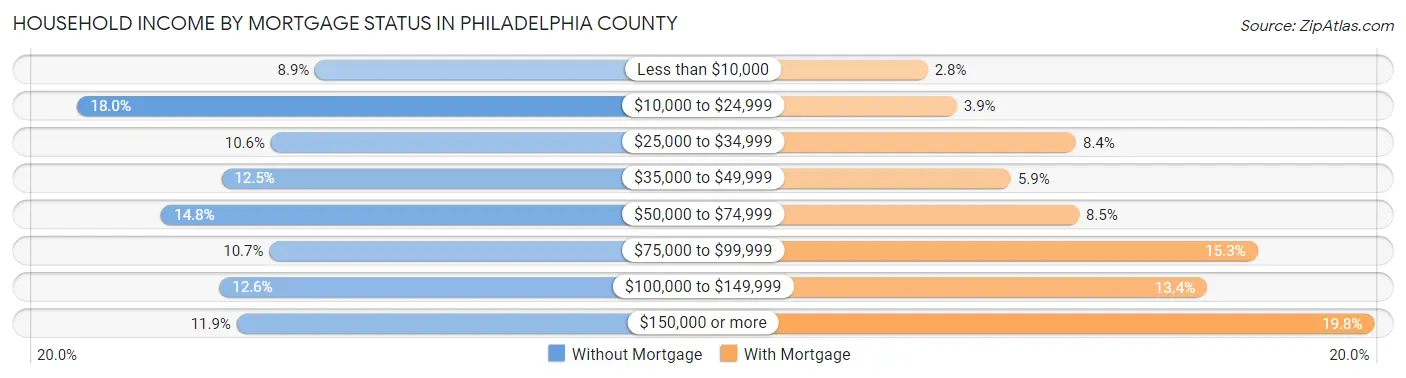
| Household Income | Without Mortgage | With Mortgage |
| Less than $10,000 | 12,393 (8.9%) | 5,644 (2.8%) |
| $10,000 to $24,999 | 24,950 (18.0%) | 7,937 (3.9%) |
| $25,000 to $34,999 | 14,739 (10.6%) | 17,258 (8.4%) |
| $35,000 to $49,999 | 17,349 (12.5%) | 12,164 (5.9%) |
| $50,000 to $74,999 | 20,526 (14.8%) | 17,486 (8.5%) |
| $75,000 to $99,999 | 14,826 (10.7%) | 31,435 (15.3%) |
| $100,000 to $149,999 | 17,466 (12.6%) | 27,494 (13.4%) |
| $150,000 or more | 16,539 (11.9%) | 40,586 (19.8%) |
| Total | 138,788 (100.0%) | 205,361 (100.0%) |
Property Value to Household Income Ratio in Philadelphia County
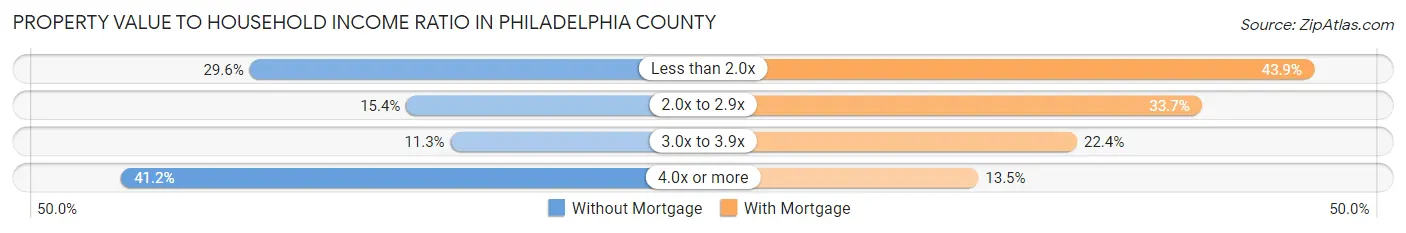
| Value-to-Income Ratio | Without Mortgage | With Mortgage |
| Less than 2.0x | 41,049 (29.6%) | 90,242 (43.9%) |
| 2.0x to 2.9x | 21,306 (15.3%) | 69,285 (33.7%) |
| 3.0x to 3.9x | 15,727 (11.3%) | 46,091 (22.4%) |
| 4.0x or more | 57,202 (41.2%) | 27,685 (13.5%) |
| Total | 138,788 (100.0%) | 205,361 (100.0%) |
Real Estate Taxes by Mortgage Status in Philadelphia County
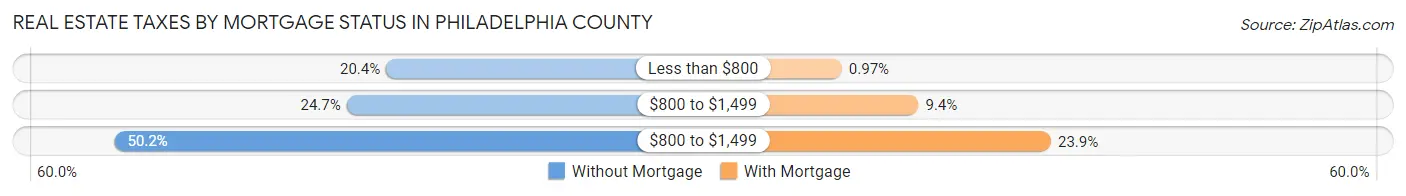
| Property Taxes | Without Mortgage | With Mortgage |
| Less than $800 | 28,292 (20.4%) | 1,987 (1.0%) |
| $800 to $1,499 | 34,304 (24.7%) | 19,234 (9.4%) |
| $800 to $1,499 | 69,596 (50.1%) | 49,070 (23.9%) |
| Total | 138,788 (100.0%) | 205,361 (100.0%) |
Health & Disability in Philadelphia County
Health Insurance Coverage by Age in Philadelphia County
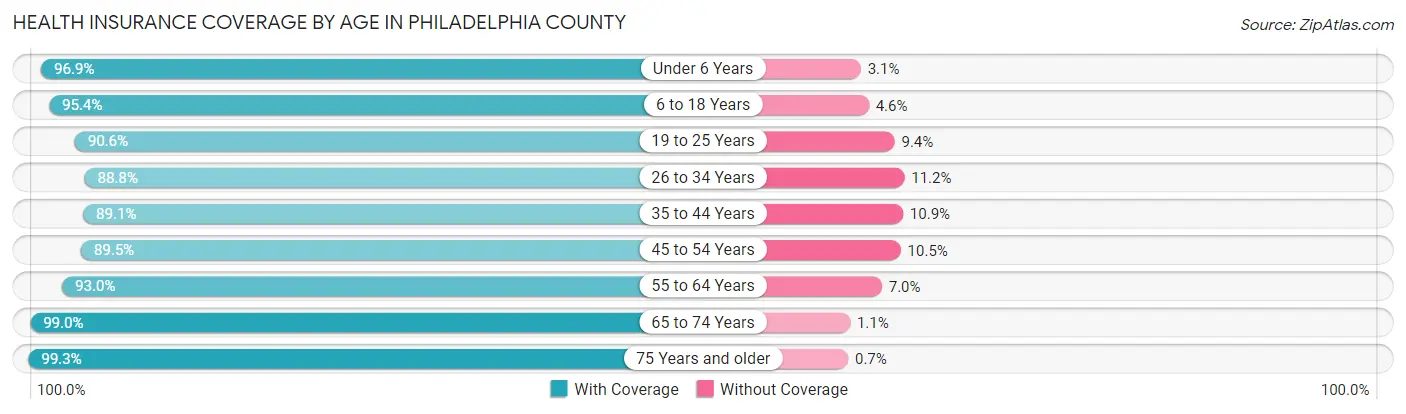
| Age Bracket | With Coverage | Without Coverage |
| Under 6 Years | 112,190 (96.9%) | 3,552 (3.1%) |
| 6 to 18 Years | 241,168 (95.4%) | 11,528 (4.6%) |
| 19 to 25 Years | 145,794 (90.6%) | 15,082 (9.4%) |
| 26 to 34 Years | 240,226 (88.8%) | 30,256 (11.2%) |
| 35 to 44 Years | 184,879 (89.1%) | 22,687 (10.9%) |
| 45 to 54 Years | 156,125 (89.5%) | 18,328 (10.5%) |
| 55 to 64 Years | 169,253 (93.0%) | 12,722 (7.0%) |
| 65 to 74 Years | 128,829 (99.0%) | 1,365 (1.1%) |
| 75 Years and older | 86,086 (99.3%) | 608 (0.7%) |
| Total | 1,464,550 (92.6%) | 116,128 (7.3%) |
Health Insurance Coverage by Citizenship Status in Philadelphia County
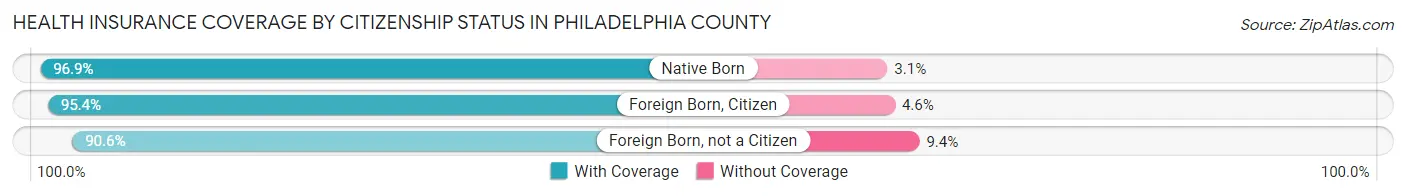
| Citizenship Status | With Coverage | Without Coverage |
| Native Born | 112,190 (96.9%) | 3,552 (3.1%) |
| Foreign Born, Citizen | 241,168 (95.4%) | 11,528 (4.6%) |
| Foreign Born, not a Citizen | 145,794 (90.6%) | 15,082 (9.4%) |
Health Insurance Coverage by Household Income in Philadelphia County
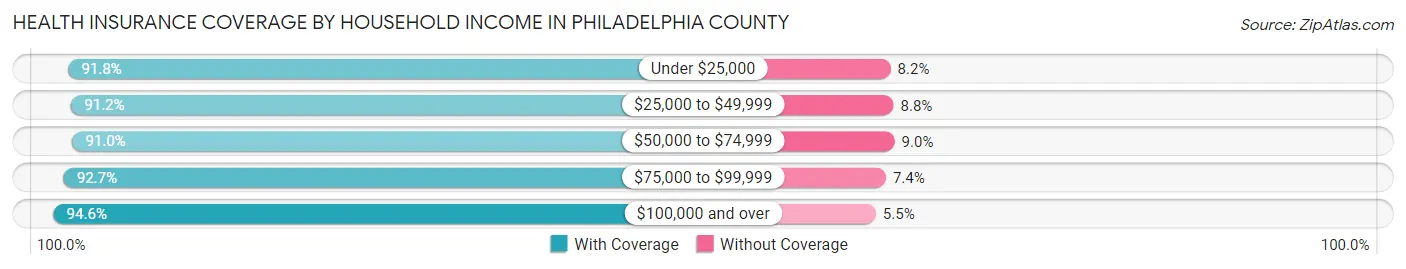
| Household Income | With Coverage | Without Coverage |
| Under $25,000 | 282,342 (91.8%) | 25,274 (8.2%) |
| $25,000 to $49,999 | 270,779 (91.2%) | 26,039 (8.8%) |
| $50,000 to $74,999 | 222,145 (91.0%) | 21,889 (9.0%) |
| $75,000 to $99,999 | 174,762 (92.6%) | 13,874 (7.3%) |
| $100,000 and over | 480,041 (94.6%) | 27,648 (5.4%) |
Public vs Private Health Insurance Coverage by Age in Philadelphia County
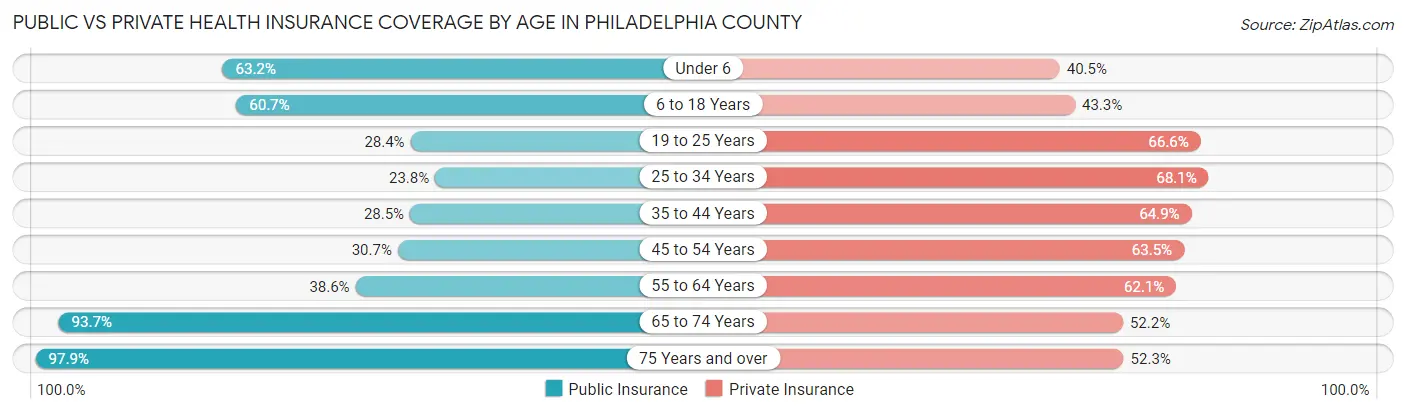
| Age Bracket | Public Insurance | Private Insurance |
| Under 6 | 73,201 (63.2%) | 46,825 (40.5%) |
| 6 to 18 Years | 153,359 (60.7%) | 109,389 (43.3%) |
| 19 to 25 Years | 45,652 (28.4%) | 107,125 (66.6%) |
| 25 to 34 Years | 64,399 (23.8%) | 184,109 (68.1%) |
| 35 to 44 Years | 59,099 (28.5%) | 134,696 (64.9%) |
| 45 to 54 Years | 53,634 (30.7%) | 110,768 (63.5%) |
| 55 to 64 Years | 70,218 (38.6%) | 112,927 (62.1%) |
| 65 to 74 Years | 121,956 (93.7%) | 67,944 (52.2%) |
| 75 Years and over | 84,906 (97.9%) | 45,358 (52.3%) |
| Total | 726,424 (46.0%) | 919,141 (58.2%) |
Disability Status by Sex by Age in Philadelphia County
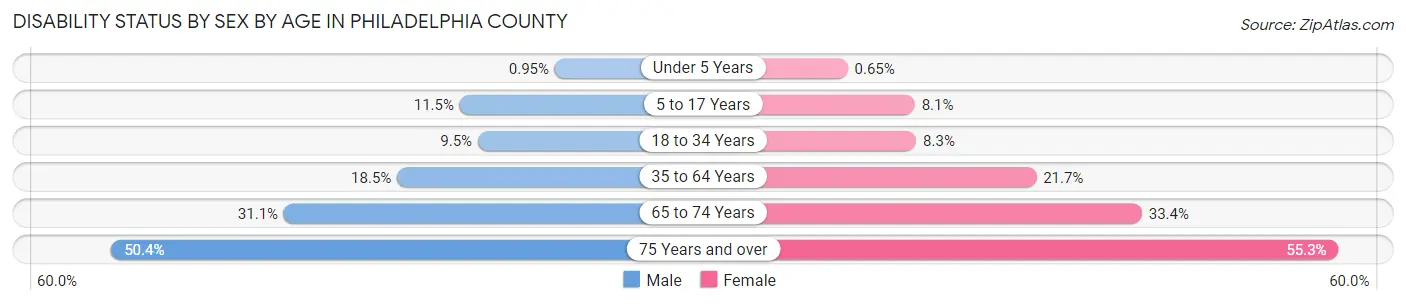
| Age Bracket | Male | Female |
| Under 5 Years | 478 (0.9%) | 315 (0.6%) |
| 5 to 17 Years | 14,264 (11.5%) | 9,709 (8.1%) |
| 18 to 34 Years | 21,012 (9.5%) | 19,587 (8.3%) |
| 35 to 64 Years | 49,316 (18.5%) | 64,411 (21.6%) |
| 65 to 74 Years | 17,581 (31.1%) | 24,625 (33.4%) |
| 75 Years and over | 15,970 (50.3%) | 30,407 (55.3%) |
Disability Class by Sex by Age in Philadelphia County
Disability Class: Hearing Difficulty
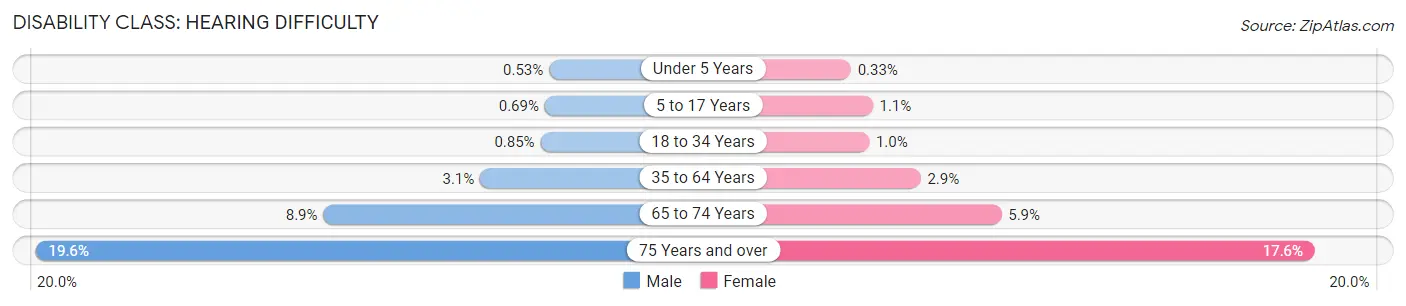
| Age Bracket | Male | Female |
| Under 5 Years | 269 (0.5%) | 161 (0.3%) |
| 5 to 17 Years | 856 (0.7%) | 1,361 (1.1%) |
| 18 to 34 Years | 1,878 (0.9%) | 2,396 (1.0%) |
| 35 to 64 Years | 8,228 (3.1%) | 8,696 (2.9%) |
| 65 to 74 Years | 5,035 (8.9%) | 4,362 (5.9%) |
| 75 Years and over | 6,214 (19.6%) | 9,656 (17.6%) |
Disability Class: Vision Difficulty
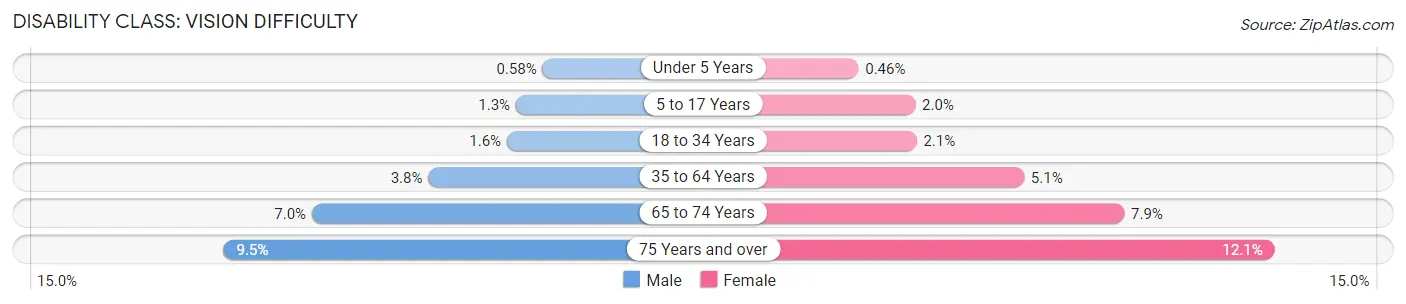
| Age Bracket | Male | Female |
| Under 5 Years | 293 (0.6%) | 224 (0.5%) |
| 5 to 17 Years | 1,632 (1.3%) | 2,440 (2.0%) |
| 18 to 34 Years | 3,473 (1.6%) | 4,915 (2.1%) |
| 35 to 64 Years | 10,009 (3.8%) | 15,071 (5.1%) |
| 65 to 74 Years | 3,952 (7.0%) | 5,793 (7.9%) |
| 75 Years and over | 3,001 (9.5%) | 6,623 (12.0%) |
Disability Class: Cognitive Difficulty
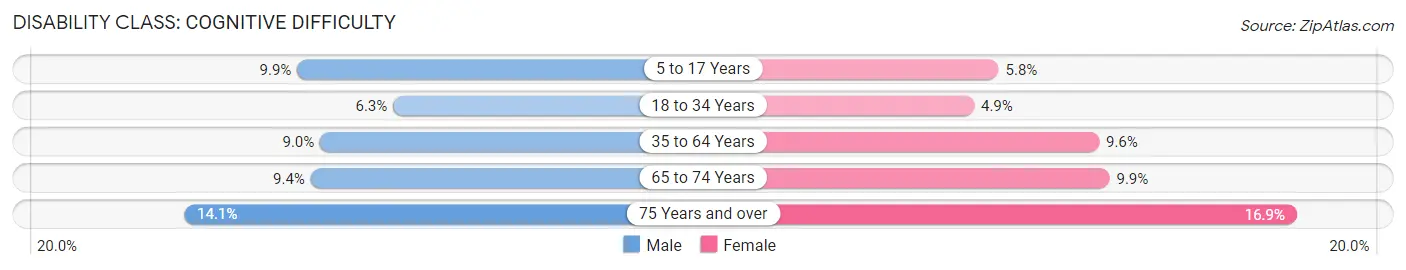
| Age Bracket | Male | Female |
| 5 to 17 Years | 12,220 (9.9%) | 6,961 (5.8%) |
| 18 to 34 Years | 13,963 (6.3%) | 11,621 (4.9%) |
| 35 to 64 Years | 24,053 (9.0%) | 28,408 (9.6%) |
| 65 to 74 Years | 5,298 (9.4%) | 7,327 (9.9%) |
| 75 Years and over | 4,467 (14.1%) | 9,286 (16.9%) |
Disability Class: Ambulatory Difficulty
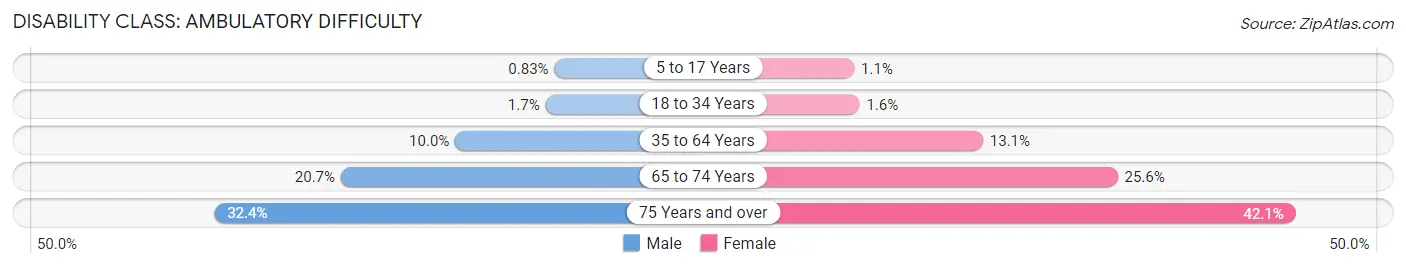
| Age Bracket | Male | Female |
| 5 to 17 Years | 1,028 (0.8%) | 1,359 (1.1%) |
| 18 to 34 Years | 3,672 (1.7%) | 3,874 (1.6%) |
| 35 to 64 Years | 26,756 (10.0%) | 38,932 (13.1%) |
| 65 to 74 Years | 11,668 (20.6%) | 18,861 (25.6%) |
| 75 Years and over | 10,275 (32.4%) | 23,159 (42.1%) |
Disability Class: Self-Care Difficulty
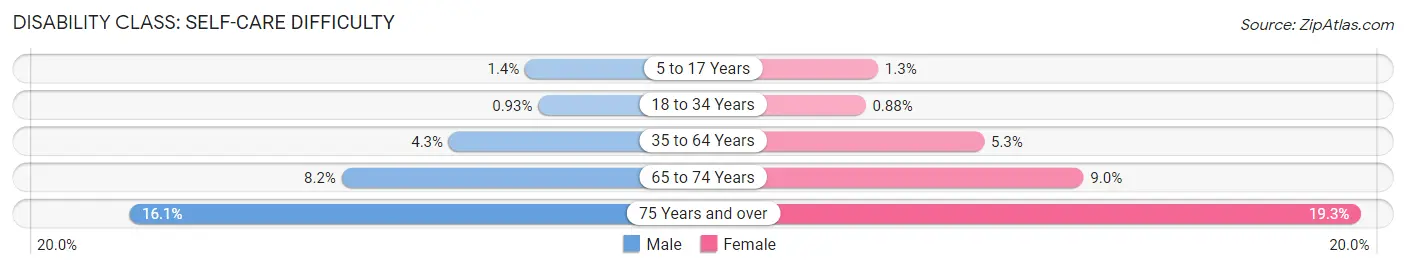
| Age Bracket | Male | Female |
| 5 to 17 Years | 1,759 (1.4%) | 1,602 (1.3%) |
| 18 to 34 Years | 2,054 (0.9%) | 2,072 (0.9%) |
| 35 to 64 Years | 11,320 (4.3%) | 15,703 (5.3%) |
| 65 to 74 Years | 4,649 (8.2%) | 6,610 (9.0%) |
| 75 Years and over | 5,113 (16.1%) | 10,602 (19.3%) |
Technology Access in Philadelphia County
Computing Device Access in Philadelphia County
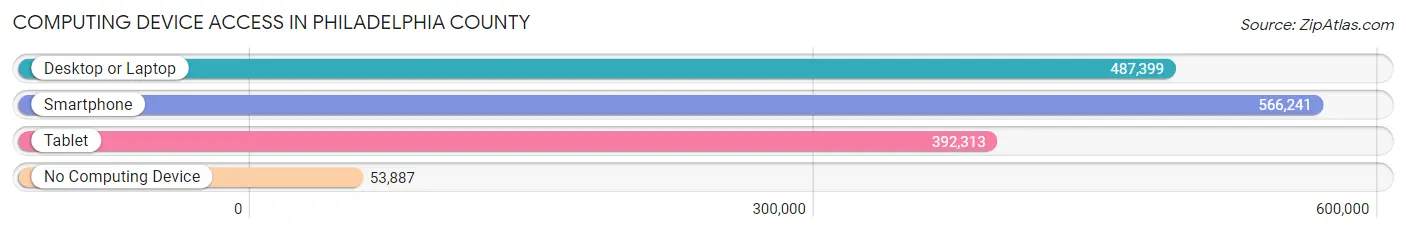
| Device Type | # Households | % Households |
| Desktop or Laptop | 487,399 | 74.0% |
| Smartphone | 566,241 | 85.9% |
| Tablet | 392,313 | 59.5% |
| No Computing Device | 53,887 | 8.2% |
| Total | 659,129 | 100.0% |
Internet Access in Philadelphia County
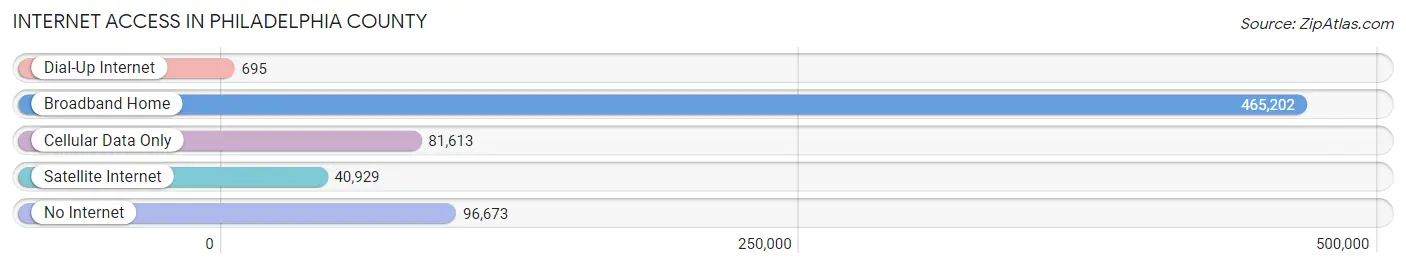
| Internet Type | # Households | % Households |
| Dial-Up Internet | 695 | 0.1% |
| Broadband Home | 465,202 | 70.6% |
| Cellular Data Only | 81,613 | 12.4% |
| Satellite Internet | 40,929 | 6.2% |
| No Internet | 96,673 | 14.7% |
| Total | 659,129 | 100.0% |
Philadelphia County Summary
Philadelphia County, Pennsylvania is located in the southeastern corner of the state and is the most populous county in Pennsylvania. It is bordered by Montgomery County to the north, Bucks County to the northeast, Delaware County to the east, and Chester County to the west. The county seat is Philadelphia, the largest city in Pennsylvania and the fifth-most populous city in the United States.
History
Philadelphia County was established in 1682 by William Penn, who named it after the city of Philadelphia, which he had founded the same year. The county was originally part of Bucks County, but was split off in 1719. The county was the site of the signing of the Declaration of Independence in 1776, and the Constitutional Convention in 1787.
Geography
Philadelphia County covers an area of 135 square miles, making it the smallest county in Pennsylvania. The county is located in the southeastern corner of the state, and is bordered by Montgomery County to the north, Bucks County to the northeast, Delaware County to the east, and Chester County to the west. The county is divided into 12 townships, including the City of Philadelphia. The county is located in the Atlantic Coastal Plain, and is mostly flat with some rolling hills. The Schuylkill River runs through the county, and the Delaware River forms its eastern border.
Economy
Philadelphia County is home to a diverse economy, with a mix of manufacturing, services, and government. The county is home to several Fortune 500 companies, including Comcast, Cigna, and Aramark. The county is also home to several universities, including the University of Pennsylvania, Drexel University, and Temple University. The county is also home to the Philadelphia Stock Exchange, the oldest stock exchange in the United States.
Demographics
As of the 2010 census, Philadelphia County had a population of 1,526,006, making it the most populous county in Pennsylvania. The population was 56.2% White, 37.2% African American, 4.2% Asian, and 2.4% Hispanic or Latino. The median household income was $37,460, and the median family income was $45,890. The per capita income was $24,898.
Conclusion
Philadelphia County is a diverse and vibrant county located in the southeastern corner of Pennsylvania. It is home to a diverse economy, with a mix of manufacturing, services, and government. The county is also home to several universities, and is the site of the signing of the Declaration of Independence and the Constitutional Convention. The population of the county is diverse, with a majority of the population being White, African American, Asian, and Hispanic or Latino. The median household income is lower than the national average, but the county is home to several Fortune 500 companies.
Common Questions
What is Per Capita Income in Philadelphia County?
Per Capita income in Philadelphia County is $35,553.
What is the Median Family Income in Philadelphia County?
Median Family Income in Philadelphia County is $67,168.
What is the Median Household income in Philadelphia County?
Median Household Income in Philadelphia County is $57,537.
What is Income or Wage Gap in Philadelphia County?
Income or Wage Gap in Philadelphia County is 15.6%.
Women in Philadelphia County earn 84.4 cents for every dollar earned by a man.
What is Family Income Deficit in Philadelphia County?
Family Income Deficit in Philadelphia County is $11,385.
Families that are below poverty line in Philadelphia County earn $11,385 less on average than the poverty threshold level.
What is Inequality or Gini Index in Philadelphia County?
Inequality or Gini Index in Philadelphia County is 0.52.
What is the Total Population of Philadelphia County?
Total Population of Philadelphia County is 1,593,208.
What is the Total Male Population of Philadelphia County?
Total Male Population of Philadelphia County is 757,083.
What is the Total Female Population of Philadelphia County?
Total Female Population of Philadelphia County is 836,125.
What is the Ratio of Males per 100 Females in Philadelphia County?
There are 90.55 Males per 100 Females in Philadelphia County.
What is the Ratio of Females per 100 Males in Philadelphia County?
There are 110.44 Females per 100 Males in Philadelphia County.
What is the Median Population Age in Philadelphia County?
Median Population Age in Philadelphia County is 34.8 Years.
What is the Average Family Size in Philadelphia County
Average Family Size in Philadelphia County is 3.2 People.
What is the Average Household Size in Philadelphia County
Average Household Size in Philadelphia County is 2.3 People.
How Large is the Labor Force in Philadelphia County?
There are 806,680 People in the Labor Forcein in Philadelphia County.
What is the Percentage of People in the Labor Force in Philadelphia County?
62.8% of People are in the Labor Force in Philadelphia County.
What is the Unemployment Rate in Philadelphia County?
Unemployment Rate in Philadelphia County is 8.6%.