Area Code 412 Map & Demographics
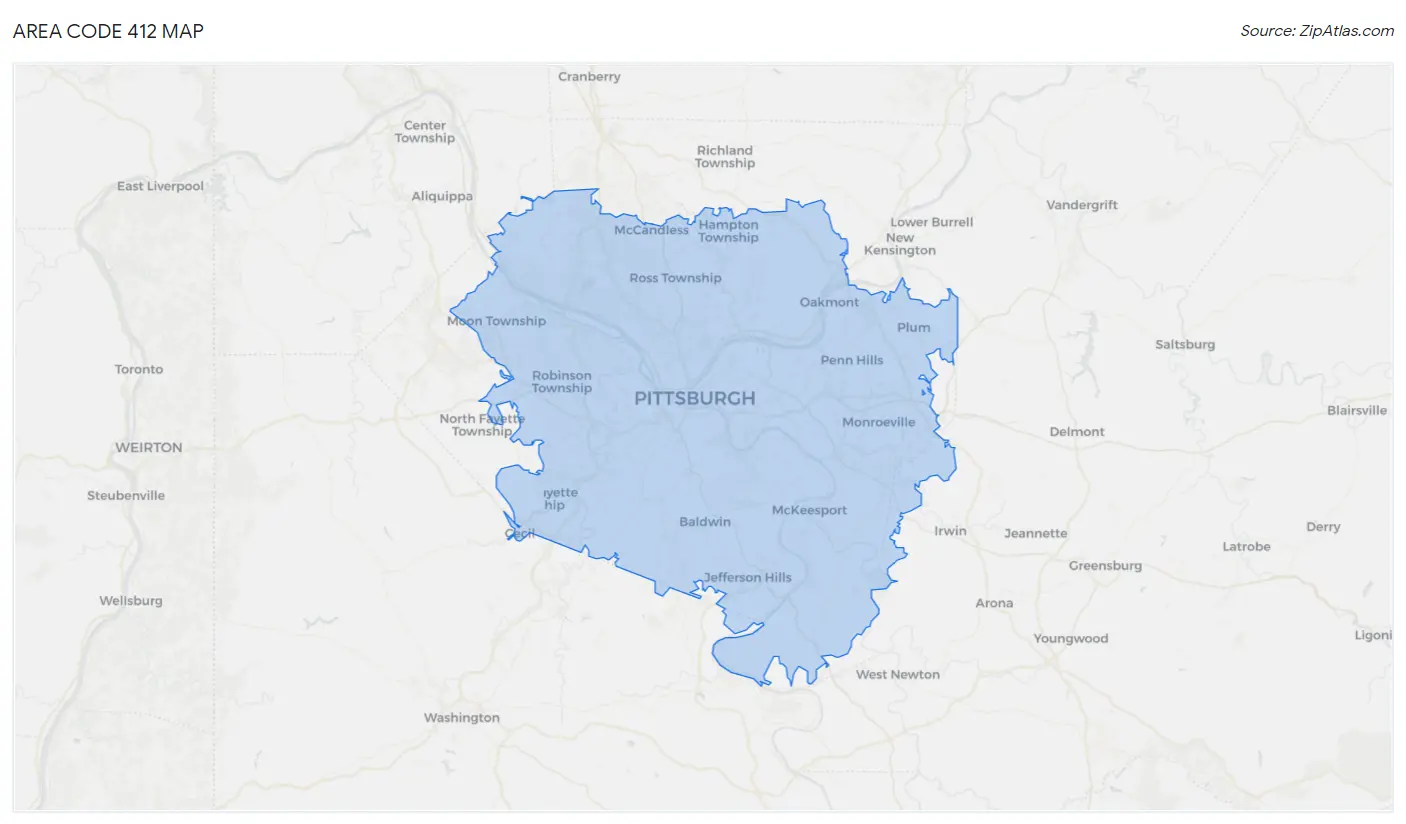
Area Code 412 Map
Area Code 412 Overview
$42,798
PER CAPITA INCOME
$97,796
AVG FAMILY INCOME
$71,798
AVG HOUSEHOLD INCOME
27.7%
WAGE / INCOME GAP [ % ]
72.3¢/ $1
WAGE / INCOME GAP [ $ ]
$11,427
FAMILY INCOME DEFICIT
45.39
INEQUALITY / GINI INDEX
1,527,656
TOTAL POPULATION
746,244
MALE POPULATION
781,412
FEMALE POPULATION
95.50
MALES / 100 FEMALES
104.71
FEMALES / 100 MALES
42.2
MEDIAN AGE
2.9
AVG FAMILY SIZE
2.2
AVG HOUSEHOLD SIZE
804,163
LABOR FORCE [ PEOPLE ]
63.0%
PERCENT IN LABOR FORCE
5.8%
UNEMPLOYMENT RATE
Income in Area Code 412
Income Overview in Area Code 412
Per Capita Income in Area Code 412 is $42,798, while median incomes of families and households are $97,796 and $71,798 respectively.
| Characteristic | Number | Measure |
| Per Capita Income | 1,527,656 | $42,798 |
| Median Family Income | 372,816 | $97,796 |
| Mean Family Income | 372,816 | $12,326,503 |
| Median Household Income | 669,339 | $71,798 |
| Mean Household Income | 669,339 | $9,687,504 |
| Income Deficit | 372,816 | $11,427 |
| Wage / Income Gap (%) | 1,527,656 | 27.72% |
| Wage / Income Gap ($) | 1,527,656 | 72.28¢ per $1 |
| Gini / Inequality Index | 1,527,656 | 45.39 |
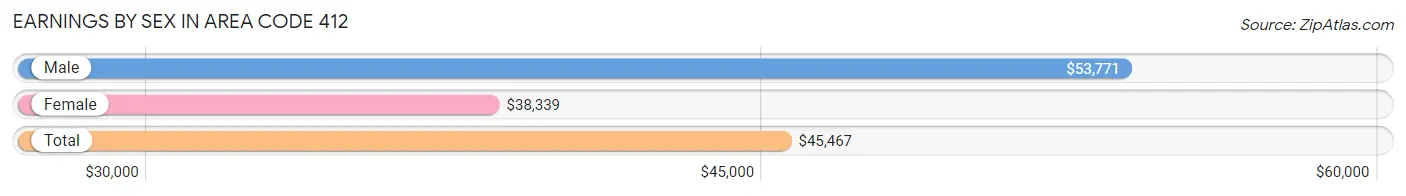
Earnings by Sex in Area Code 412
Average Earnings in Area Code 412 are $45,467, $53,771 for men and $38,339 for women, a difference of 28.7%.
| Sex | Number | Average Earnings |
| Male | 444,301 (51.9%) | $53,771 |
| Female | 411,860 (48.1%) | $38,339 |
| Total | 856,161 (100.0%) | $45,467 |
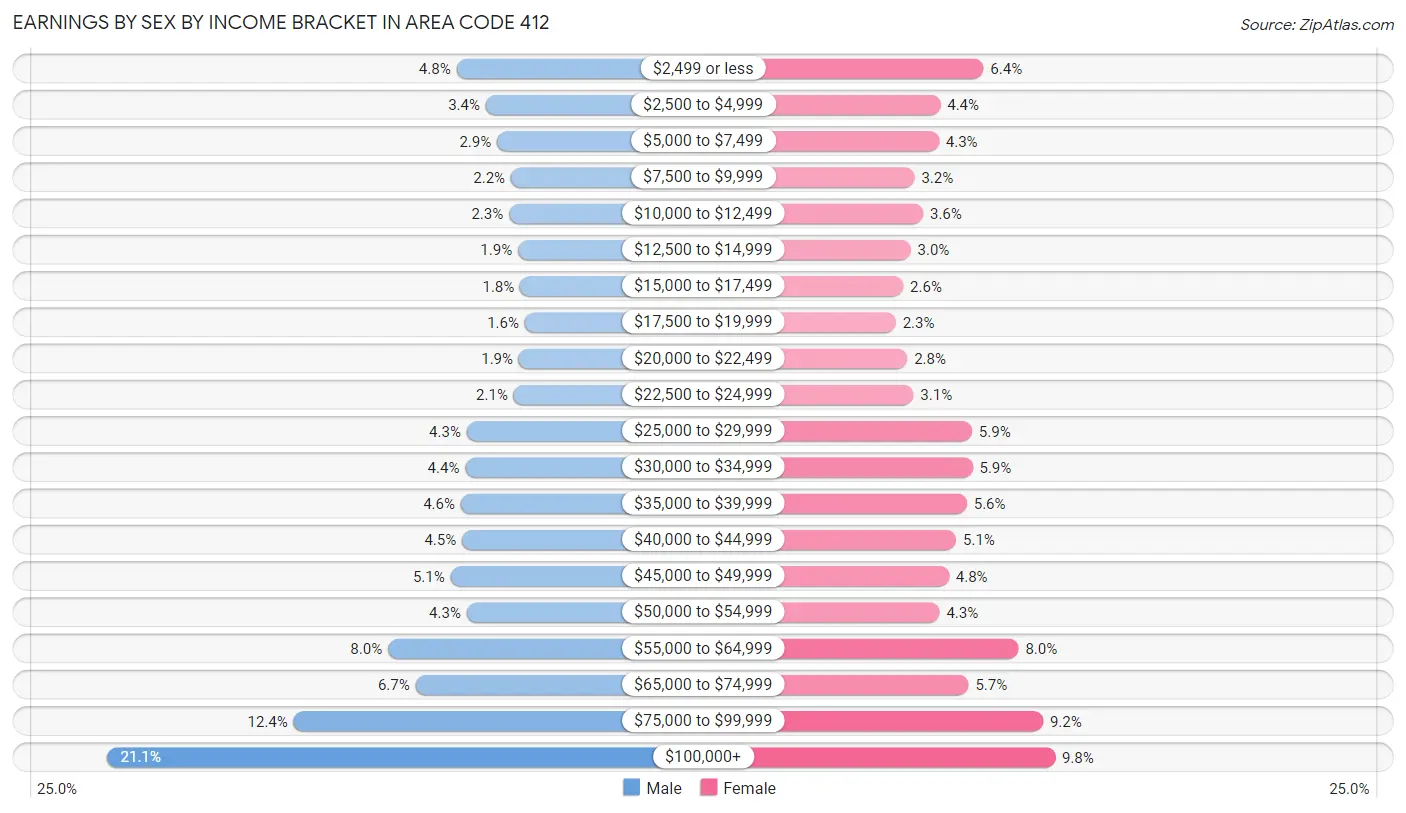
Earnings by Sex by Income Bracket in Area Code 412
The most common earnings brackets in Area Code 412 are $100,000+ for men (93,783 | 21.1%) and $100,000+ for women (40,144 | 9.8%).
| Income | Male | Female |
| $2,499 or less | 21,182 (4.8%) | 26,349 (6.4%) |
| $2,500 to $4,999 | 15,111 (3.4%) | 18,042 (4.4%) |
| $5,000 to $7,499 | 12,765 (2.9%) | 17,763 (4.3%) |
| $7,500 to $9,999 | 9,851 (2.2%) | 13,069 (3.2%) |
| $10,000 to $12,499 | 10,258 (2.3%) | 14,714 (3.6%) |
| $12,500 to $14,999 | 8,377 (1.9%) | 12,335 (3.0%) |
| $15,000 to $17,499 | 7,961 (1.8%) | 10,884 (2.6%) |
| $17,500 to $19,999 | 6,973 (1.6%) | 9,420 (2.3%) |
| $20,000 to $22,499 | 8,200 (1.8%) | 11,648 (2.8%) |
| $22,500 to $24,999 | 9,300 (2.1%) | 12,867 (3.1%) |
| $25,000 to $29,999 | 19,074 (4.3%) | 24,119 (5.9%) |
| $30,000 to $34,999 | 19,363 (4.4%) | 24,238 (5.9%) |
| $35,000 to $39,999 | 20,286 (4.6%) | 23,152 (5.6%) |
| $40,000 to $44,999 | 20,030 (4.5%) | 21,073 (5.1%) |
| $45,000 to $49,999 | 22,419 (5.1%) | 19,695 (4.8%) |
| $50,000 to $54,999 | 19,055 (4.3%) | 17,889 (4.3%) |
| $55,000 to $64,999 | 35,455 (8.0%) | 33,112 (8.0%) |
| $65,000 to $74,999 | 29,745 (6.7%) | 23,479 (5.7%) |
| $75,000 to $99,999 | 55,113 (12.4%) | 37,868 (9.2%) |
| $100,000+ | 93,783 (21.1%) | 40,144 (9.8%) |
| Total | 444,301 (100.0%) | 411,860 (100.0%) |
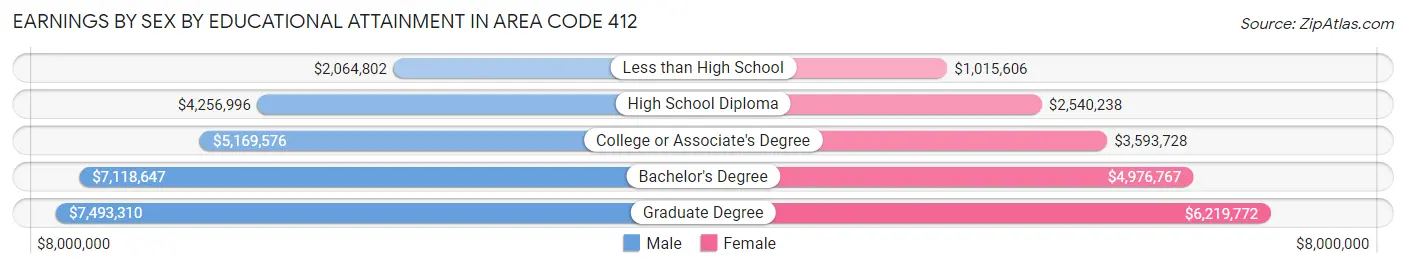
Earnings by Sex by Educational Attainment in Area Code 412
Average earnings in Area Code 412 are $6,119,395 for men and $4,341,906 for women, a difference of 29.0%. Men with an educational attainment of graduate degree enjoy the highest average annual earnings of $7,493,310, while those with less than high school education earn the least with $2,064,802. Women with an educational attainment of graduate degree earn the most with the average annual earnings of $6,219,772, while those with less than high school education have the smallest earnings of $1,015,606.
| Educational Attainment | Male Income | Female Income |
| Less than High School | $2,064,802 | $1,015,606 |
| High School Diploma | $4,256,996 | $2,540,238 |
| College or Associate's Degree | $5,169,576 | $3,593,728 |
| Bachelor's Degree | $7,118,647 | $4,976,767 |
| Graduate Degree | $7,493,310 | $6,219,772 |
| Total | $6,119,395 | $4,341,906 |
Family Income in Area Code 412
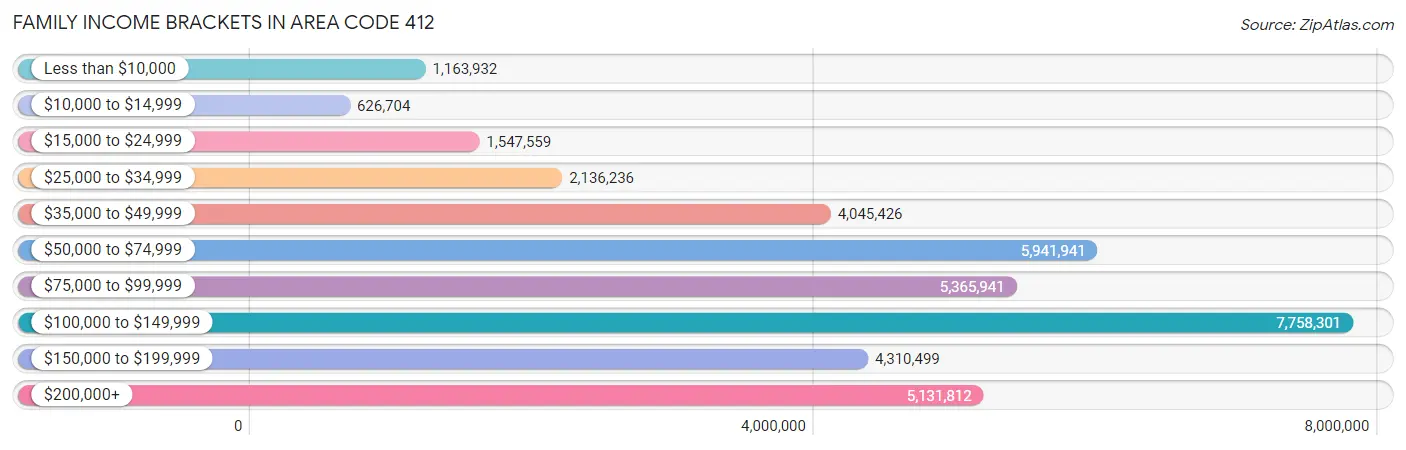
Family Income Brackets in Area Code 412
According to the Area Code 412 family income data, there are 7,758,301 families falling into the $100,000 to $149,999 income range, which is the most common income bracket and makes up 2,081.0% of all families. Conversely, the $10,000 to $14,999 income bracket is the least frequent group with only 626,704 families (168.1%) belonging to this category.
| Income Bracket | # Families | % Families |
| Less than $10,000 | 1,163,932 | 312.2% |
| $10,000 to $14,999 | 626,704 | 168.1% |
| $15,000 to $24,999 | 1,547,559 | 415.1% |
| $25,000 to $34,999 | 2,136,236 | 573.0% |
| $35,000 to $49,999 | 4,045,426 | 1,085.1% |
| $50,000 to $74,999 | 5,941,941 | 1,593.8% |
| $75,000 to $99,999 | 5,365,941 | 1,439.3% |
| $100,000 to $149,999 | 7,758,301 | 2,081.0% |
| $150,000 to $199,999 | 4,310,499 | 1,156.2% |
| $200,000+ | 5,131,812 | 1,376.5% |
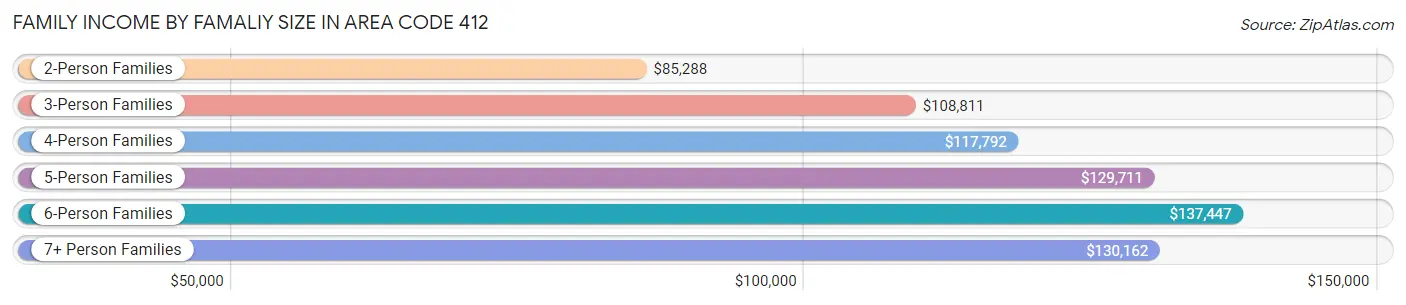
Family Income by Famaliy Size in Area Code 412
6-person families (6,328 | 1.7%) account for the highest median family income in Area Code 412 with $137,447 per family, while 2-person families (196,330 | 52.7%) have the highest median income of $42,644 per family member.
| Income Bracket | # Families | Median Income |
| 2-Person Families | 196,330 (52.7%) | $85,288 |
| 3-Person Families | 81,646 (21.9%) | $108,811 |
| 4-Person Families | 63,424 (17.0%) | $117,792 |
| 5-Person Families | 22,172 (5.9%) | $129,711 |
| 6-Person Families | 6,328 (1.7%) | $137,447 |
| 7+ Person Families | 2,916 (0.8%) | $130,162 |
| Total | 372,816 (100.0%) | $97,796 |
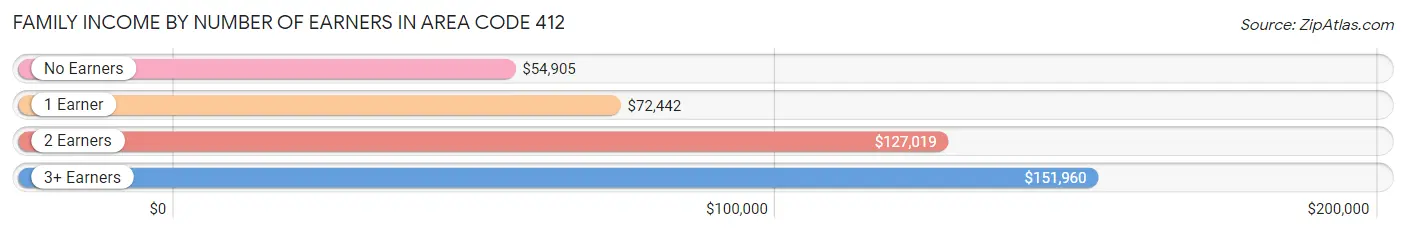
Family Income by Number of Earners in Area Code 412
The median family income in Area Code 412 is $97,796, with families comprising 3+ earners (38,579) having the highest median family income of $151,960, while families with no earners (58,965) have the lowest median family income of $54,905, accounting for 10.3% and 15.8% of families, respectively.
| Number of Earners | # Families | Median Income |
| No Earners | 58,965 (15.8%) | $54,905 |
| 1 Earner | 111,594 (29.9%) | $72,442 |
| 2 Earners | 163,678 (43.9%) | $127,019 |
| 3+ Earners | 38,579 (10.3%) | $151,960 |
| Total | 372,816 (100.0%) | $97,796 |
Household Income in Area Code 412
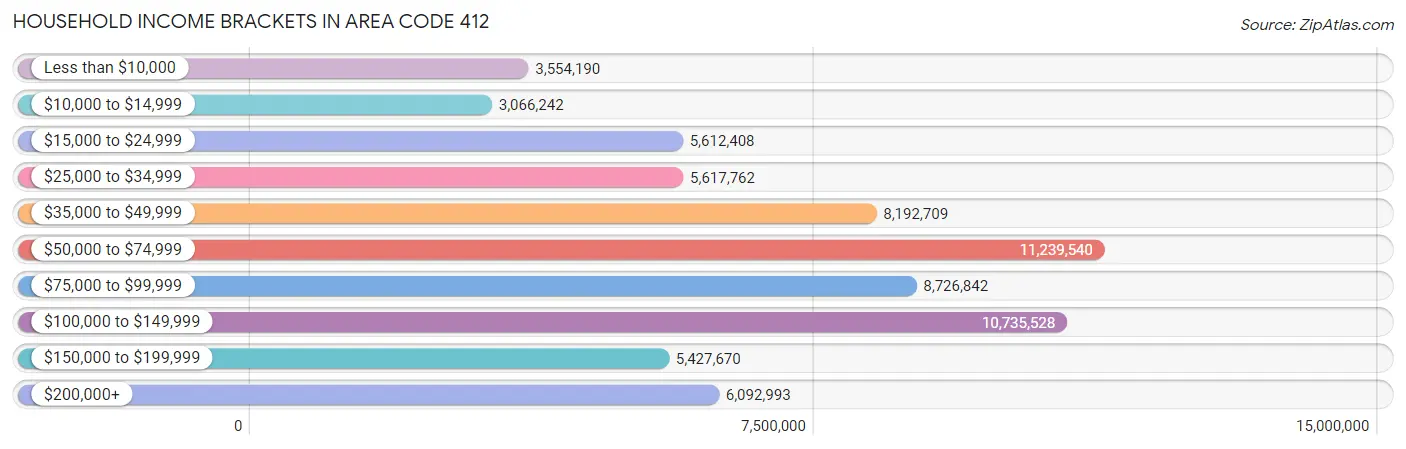
Household Income Brackets in Area Code 412
With 11,239,540 households falling in the category, the $50,000 to $74,999 income range is the most frequent in Area Code 412, accounting for 1,679.2% of all households. In contrast, only 3,066,242 households (458.1%) fall into the $10,000 to $14,999 income bracket, making it the least populous group.
| Income Bracket | # Households | % Households |
| Less than $10,000 | 3,554,190 | 531.0% |
| $10,000 to $14,999 | 3,066,242 | 458.1% |
| $15,000 to $24,999 | 5,612,408 | 838.5% |
| $25,000 to $34,999 | 5,617,762 | 839.3% |
| $35,000 to $49,999 | 8,192,709 | 1,224.0% |
| $50,000 to $74,999 | 11,239,540 | 1,679.2% |
| $75,000 to $99,999 | 8,726,842 | 1,303.8% |
| $100,000 to $149,999 | 10,735,528 | 1,603.9% |
| $150,000 to $199,999 | 5,427,670 | 810.9% |
| $200,000+ | 6,092,993 | 910.3% |
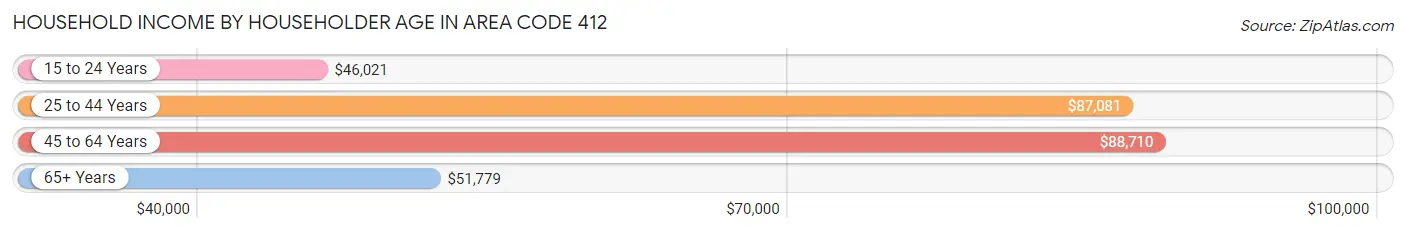
Household Income by Householder Age in Area Code 412
The median household income in Area Code 412 is $71,798, with the highest median household income of $88,710 found in the 45 to 64 years age bracket for the primary householder. A total of 230,191 households (34.4%) fall into this category. Meanwhile, the 15 to 24 years age bracket for the primary householder has the lowest median household income of $46,021, with 24,480 households (3.7%) in this group.
| Income Bracket | # Households | Median Income |
| 15 to 24 Years | 24,480 (3.7%) | $46,021 |
| 25 to 44 Years | 212,498 (31.8%) | $87,081 |
| 45 to 64 Years | 230,191 (34.4%) | $88,710 |
| 65+ Years | 202,170 (30.2%) | $51,779 |
| Total | 669,339 (100.0%) | $71,798 |
Poverty in Area Code 412
Income Below Poverty by Sex and Age in Area Code 412
With 10.1% poverty level for males and 12.5% for females among the residents of Area Code 412, 18 to 24 year old males and 18 to 24 year old females are the most vulnerable to poverty, with 11,155 males (19.5%) and 14,540 females (26.5%) in their respective age groups living below the poverty level.
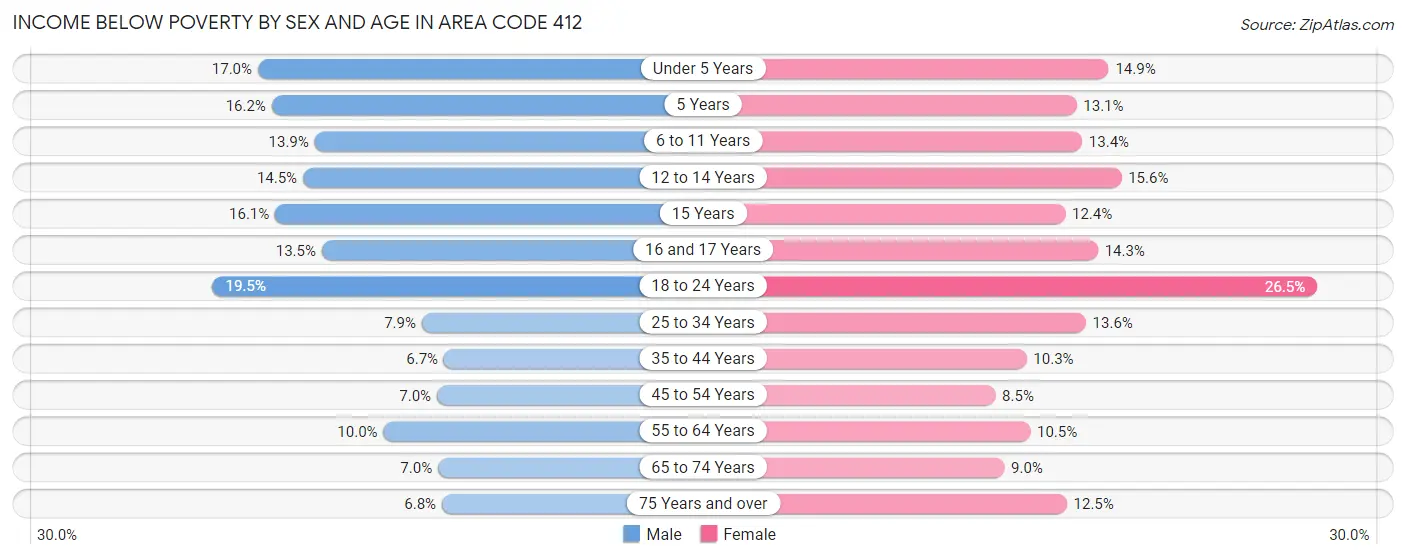
| Age Bracket | Male | Female |
| Under 5 Years | 6,543 (17.0%) | 5,587 (14.8%) |
| 5 Years | 1,225 (16.2%) | 1,054 (13.1%) |
| 6 to 11 Years | 6,662 (13.9%) | 5,871 (13.4%) |
| 12 to 14 Years | 3,412 (14.5%) | 3,622 (15.6%) |
| 15 Years | 1,320 (16.1%) | 975 (12.4%) |
| 16 and 17 Years | 2,210 (13.5%) | 2,246 (14.2%) |
| 18 to 24 Years | 11,155 (19.5%) | 14,540 (26.5%) |
| 25 to 34 Years | 8,835 (7.9%) | 14,702 (13.6%) |
| 35 to 44 Years | 6,344 (6.7%) | 9,452 (10.3%) |
| 45 to 54 Years | 6,095 (7.0%) | 7,541 (8.5%) |
| 55 to 64 Years | 10,286 (10.0%) | 11,509 (10.5%) |
| 65 to 74 Years | 5,596 (7.0%) | 8,269 (9.0%) |
| 75 Years and over | 3,239 (6.8%) | 9,638 (12.5%) |
| Total | 72,922 (10.1%) | 95,006 (12.5%) |
Income Above Poverty by Sex and Age in Area Code 412
According to the poverty statistics in Area Code 412, males aged 35 to 44 years and females aged 45 to 54 years are the age groups that are most secure financially, with 93.3% of males and 91.5% of females in these age groups living above the poverty line.
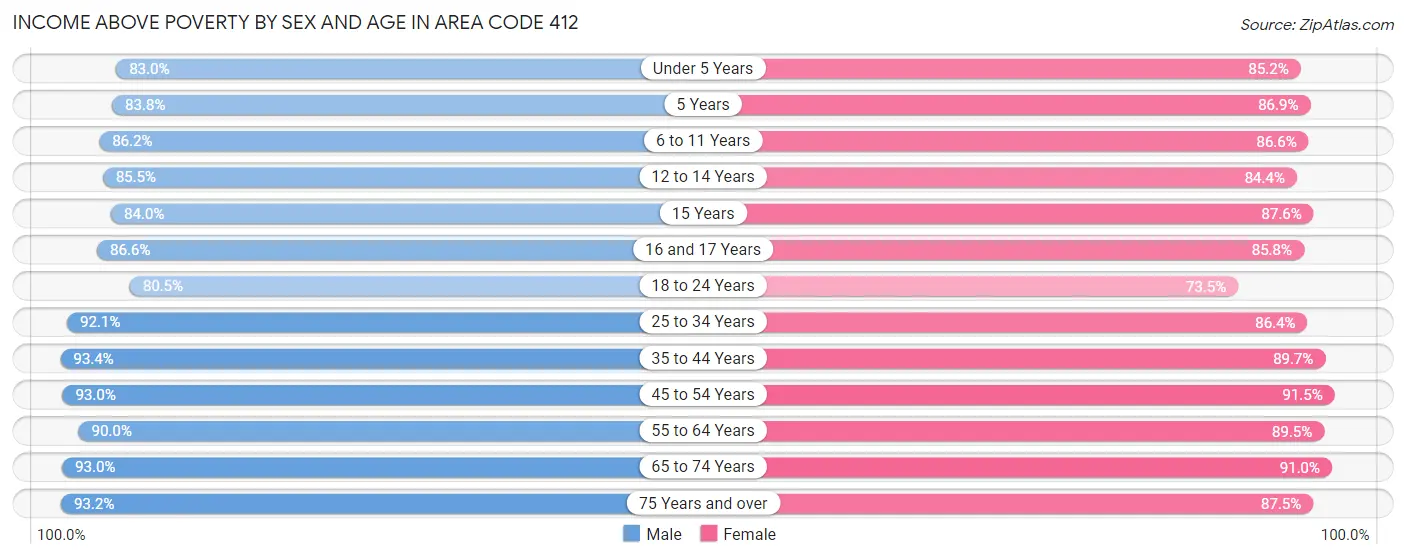
| Age Bracket | Male | Female |
| Under 5 Years | 31,931 (83.0%) | 32,036 (85.2%) |
| 5 Years | 6,316 (83.8%) | 7,019 (86.9%) |
| 6 to 11 Years | 41,435 (86.2%) | 38,046 (86.6%) |
| 12 to 14 Years | 20,122 (85.5%) | 19,658 (84.4%) |
| 15 Years | 6,903 (84.0%) | 6,871 (87.6%) |
| 16 and 17 Years | 14,222 (86.6%) | 13,515 (85.8%) |
| 18 to 24 Years | 45,958 (80.5%) | 40,401 (73.5%) |
| 25 to 34 Years | 103,225 (92.1%) | 93,573 (86.4%) |
| 35 to 44 Years | 89,046 (93.3%) | 82,456 (89.7%) |
| 45 to 54 Years | 80,486 (93.0%) | 80,806 (91.5%) |
| 55 to 64 Years | 92,346 (90.0%) | 98,326 (89.5%) |
| 65 to 74 Years | 74,532 (93.0%) | 83,228 (91.0%) |
| 75 Years and over | 44,708 (93.2%) | 67,369 (87.5%) |
| Total | 651,230 (89.9%) | 663,304 (87.5%) |
Income Below Poverty Among Married-Couple Families in Area Code 412
The poverty statistics for married-couple families in Area Code 412 show that 2.8% or 7,724 of the total 281,293 families live below the poverty line. Families with 5 or more children have the highest poverty rate of 14.3%, comprising of 184 families. On the other hand, families with no children have the lowest poverty rate of 2.6%, which includes 4,594 families.
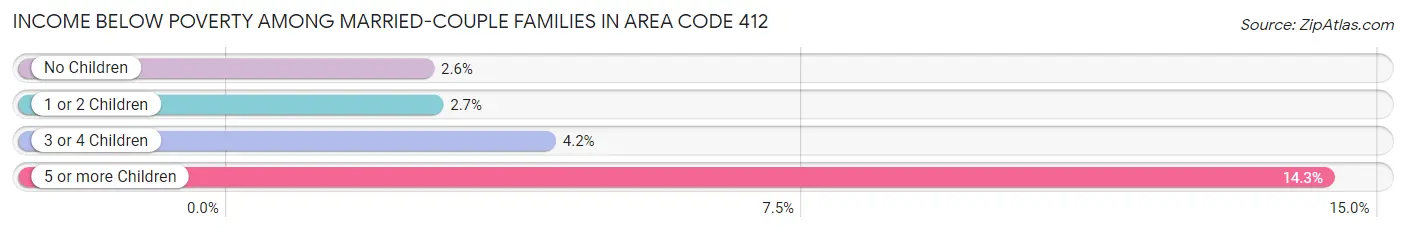
| Children | Above Poverty | Below Poverty |
| No Children | 174,588 (97.4%) | 4,594 (2.6%) |
| 1 or 2 Children | 81,740 (97.3%) | 2,248 (2.7%) |
| 3 or 4 Children | 16,140 (95.9%) | 698 (4.2%) |
| 5 or more Children | 1,101 (85.7%) | 184 (14.3%) |
| Total | 273,569 (97.3%) | 7,724 (2.8%) |
Income Below Poverty Among Single-Parent Households in Area Code 412
According to the poverty data in Area Code 412, 11.0% or 2,709 single-father households and 23.1% or 15,412 single-mother households are living below the poverty line. Among single-father households, those with 3 or 4 children have the highest poverty rate, with 445 households (31.7%) experiencing poverty. Likewise, among single-mother households, those with 5 or more children have the highest poverty rate, with 628 households (89.7%) falling below the poverty line.
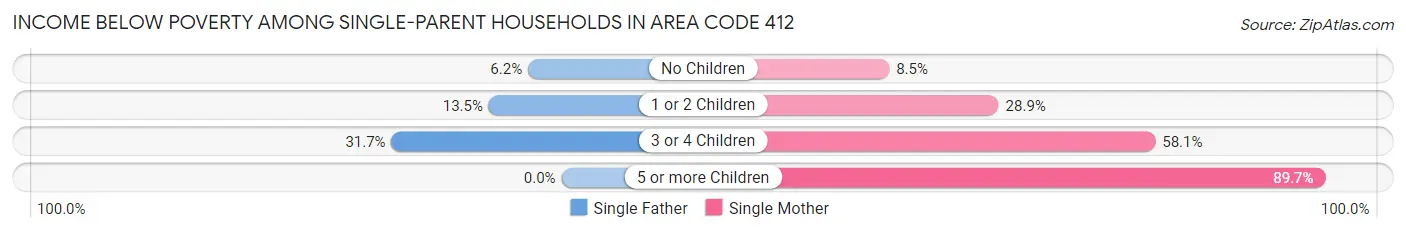
| Children | Single Father | Single Mother |
| No Children | 747 (6.2%) | 2,457 (8.5%) |
| 1 or 2 Children | 1,517 (13.5%) | 9,157 (28.9%) |
| 3 or 4 Children | 445 (31.7%) | 3,170 (58.1%) |
| 5 or more Children | 0 (0.0%) | 628 (89.7%) |
| Total | 2,709 (11.0%) | 15,412 (23.1%) |
Income Below Poverty Among Married-Couple vs Single-Parent Households in Area Code 412
The poverty data for Area Code 412 shows that 7,724 of the married-couple family households (2.8%) and 18,121 of the single-parent households (19.8%) are living below the poverty level. Within the married-couple family households, those with 5 or more children have the highest poverty rate, with 184 households (14.3%) falling below the poverty line. Among the single-parent households, those with 5 or more children have the highest poverty rate, with 628 household (79.9%) living below poverty.
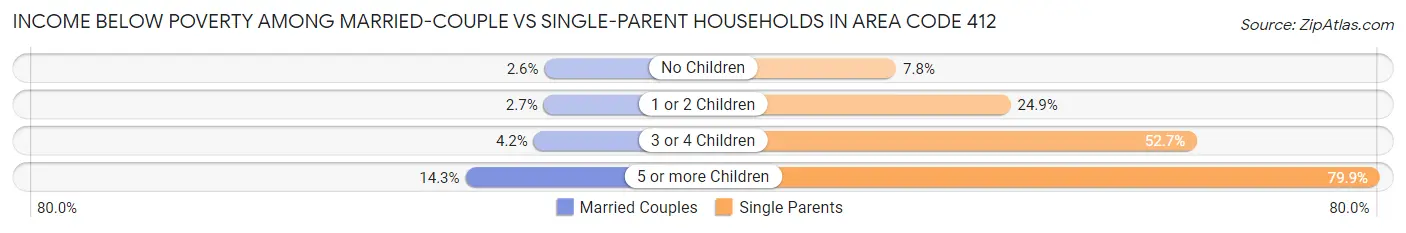
| Children | Married-Couple Families | Single-Parent Households |
| No Children | 4,594 (2.6%) | 3,204 (7.8%) |
| 1 or 2 Children | 2,248 (2.7%) | 10,674 (24.9%) |
| 3 or 4 Children | 698 (4.2%) | 3,615 (52.6%) |
| 5 or more Children | 184 (14.3%) | 628 (79.9%) |
| Total | 7,724 (2.8%) | 18,121 (19.8%) |
Race in Area Code 412
The most populous races in Area Code 412 are White / Caucasian (1,229,903 | 80.5%), Black / African American (167,978 | 11.0%), and Two or more Races (64,410 | 4.2%).
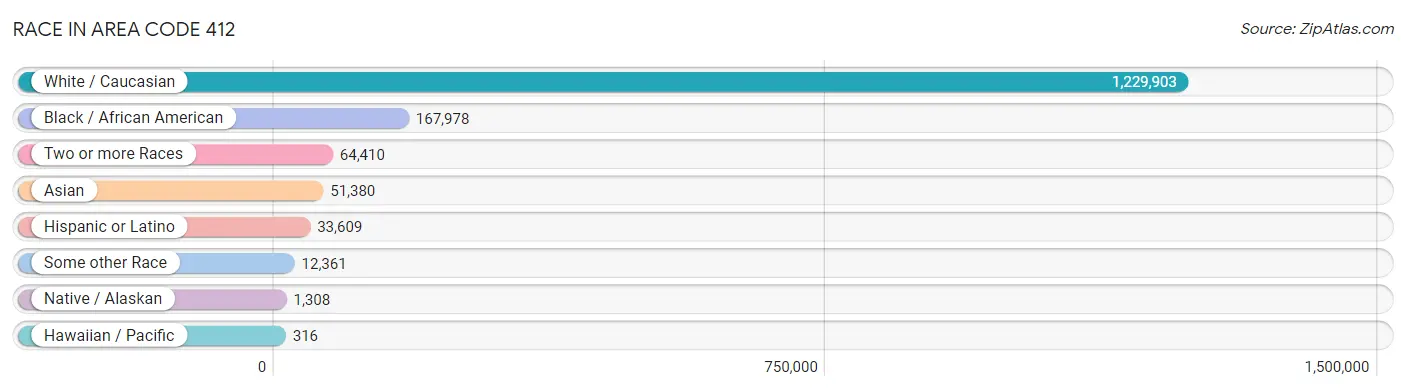
| Race | # Population | % Population |
| Asian | 51,380 | 3.4% |
| Black / African American | 167,978 | 11.0% |
| Hawaiian / Pacific | 316 | 0.0% |
| Hispanic or Latino | 33,609 | 2.2% |
| Native / Alaskan | 1,308 | 0.1% |
| White / Caucasian | 1,229,903 | 80.5% |
| Two or more Races | 64,410 | 4.2% |
| Some other Race | 12,361 | 0.8% |
| Total | 1,527,656 | 100.0% |
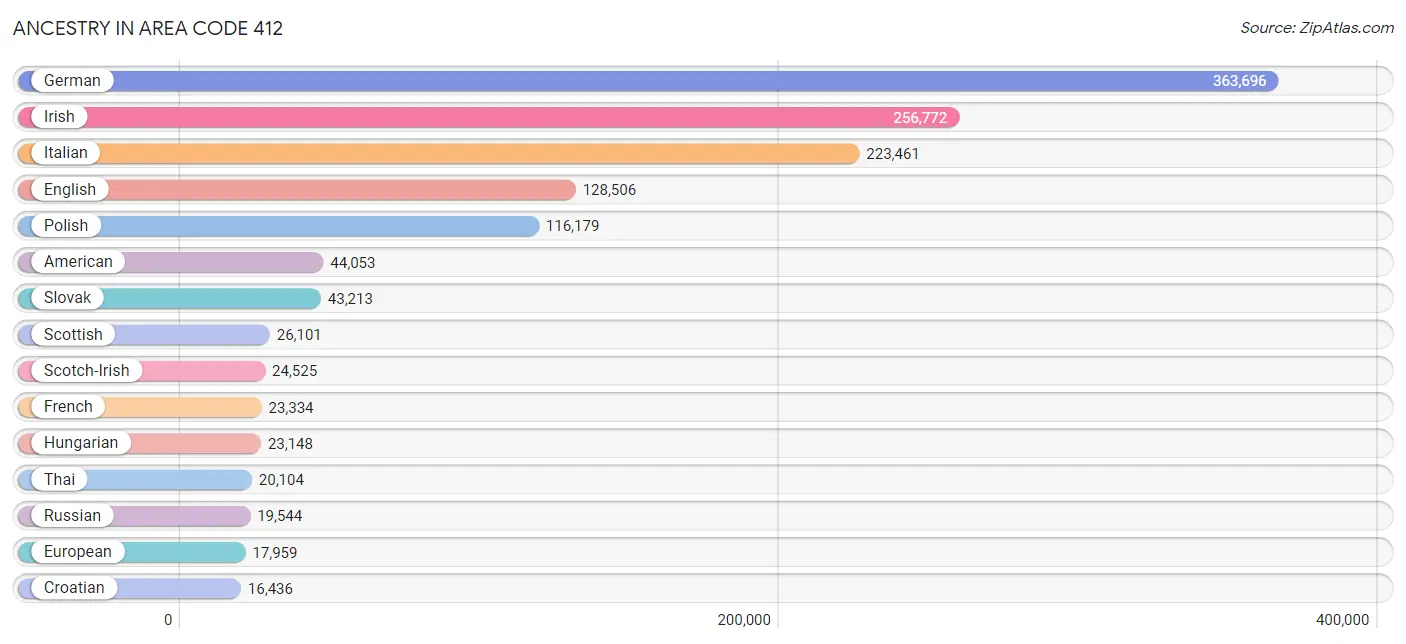
Ancestry in Area Code 412
The most populous ancestries reported in Area Code 412 are German (363,696 | 23.8%), Irish (256,772 | 16.8%), Italian (223,461 | 14.6%), English (128,506 | 8.4%), and Polish (116,179 | 7.6%), together accounting for 71.3% of all Area Code 412 residents.
| Ancestry | # Population | % Population |
| Afghan | 292 | 0.0% |
| African | 8,770 | 0.6% |
| Alaska Native | 22 | 0.0% |
| Albanian | 344 | 0.0% |
| Aleut | 4 | 0.0% |
| Alsatian | 44 | 0.0% |
| American | 44,053 | 2.9% |
| Apache | 206 | 0.0% |
| Arab | 12,221 | 0.8% |
| Argentinean | 686 | 0.0% |
| Armenian | 656 | 0.0% |
| Assyrian / Chaldean / Syriac | 5 | 0.0% |
| Australian | 642 | 0.0% |
| Austrian | 5,591 | 0.4% |
| Bahamian | 217 | 0.0% |
| Bangladeshi | 9 | 0.0% |
| Barbadian | 156 | 0.0% |
| Basque | 75 | 0.0% |
| Belgian | 1,383 | 0.1% |
| Belizean | 16 | 0.0% |
| Bermudan | 30 | 0.0% |
| Bhutanese | 2,875 | 0.2% |
| Blackfeet | 1,351 | 0.1% |
| Bolivian | 220 | 0.0% |
| Brazilian | 627 | 0.0% |
| British | 6,141 | 0.4% |
| British West Indian | 68 | 0.0% |
| Bulgarian | 681 | 0.0% |
| Burmese | 4,934 | 0.3% |
| Cajun | 62 | 0.0% |
| Cambodian | 59 | 0.0% |
| Canadian | 1,654 | 0.1% |
| Cape Verdean | 108 | 0.0% |
| Carpatho Rusyn | 812 | 0.1% |
| Celtic | 123 | 0.0% |
| Central American | 3,048 | 0.2% |
| Central American Indian | 327 | 0.0% |
| Cherokee | 2,637 | 0.2% |
| Cheyenne | 19 | 0.0% |
| Chickasaw | 38 | 0.0% |
| Chilean | 451 | 0.0% |
| Chinese | 13 | 0.0% |
| Chippewa | 140 | 0.0% |
| Choctaw | 62 | 0.0% |
| Colombian | 1,586 | 0.1% |
| Comanche | 79 | 0.0% |
| Costa Rican | 179 | 0.0% |
| Cree | 2 | 0.0% |
| Creek | 116 | 0.0% |
| Croatian | 16,436 | 1.1% |
| Crow | 4 | 0.0% |
| Cuban | 1,240 | 0.1% |
| Cypriot | 77 | 0.0% |
| Czech | 8,935 | 0.6% |
| Czechoslovakian | 4,371 | 0.3% |
| Danish | 1,681 | 0.1% |
| Delaware | 110 | 0.0% |
| Dominican | 1,750 | 0.1% |
| Dutch | 12,221 | 0.8% |
| Dutch West Indian | 29 | 0.0% |
| Eastern European | 10,185 | 0.7% |
| Ecuadorian | 329 | 0.0% |
| Egyptian | 922 | 0.1% |
| English | 128,506 | 8.4% |
| Estonian | 16 | 0.0% |
| Ethiopian | 298 | 0.0% |
| European | 17,959 | 1.2% |
| Filipino | 661 | 0.0% |
| Finnish | 880 | 0.1% |
| French | 23,334 | 1.5% |
| French American Indian | 59 | 0.0% |
| French Canadian | 2,849 | 0.2% |
| German | 363,696 | 23.8% |
| German Russian | 112 | 0.0% |
| Ghanaian | 463 | 0.0% |
| Greek | 8,234 | 0.5% |
| Guamanian / Chamorro | 132 | 0.0% |
| Guatemalan | 1,180 | 0.1% |
| Guyanese | 160 | 0.0% |
| Haitian | 1,081 | 0.1% |
| Hmong | 6 | 0.0% |
| Honduran | 616 | 0.0% |
| Hopi | 12 | 0.0% |
| Houma | 8 | 0.0% |
| Hungarian | 23,148 | 1.5% |
| Icelander | 27 | 0.0% |
| Indian (Asian) | 14,493 | 0.9% |
| Indonesian | 396 | 0.0% |
| Iranian | 884 | 0.1% |
| Iraqi | 604 | 0.0% |
| Irish | 256,772 | 16.8% |
| Iroquois | 341 | 0.0% |
| Israeli | 887 | 0.1% |
| Italian | 223,461 | 14.6% |
| Jamaican | 2,443 | 0.2% |
| Japanese | 253 | 0.0% |
| Jordanian | 343 | 0.0% |
| Kenyan | 544 | 0.0% |
| Kiowa | 2 | 0.0% |
| Korean | 4,885 | 0.3% |
| Laotian | 401 | 0.0% |
| Latvian | 254 | 0.0% |
| Lebanese | 4,108 | 0.3% |
| Liberian | 172 | 0.0% |
| Lithuanian | 6,944 | 0.4% |
| Lumbee | 14 | 0.0% |
| Luxembourger | 171 | 0.0% |
| Macedonian | 220 | 0.0% |
| Malaysian | 160 | 0.0% |
| Maltese | 47 | 0.0% |
| Mexican | 10,617 | 0.7% |
| Mexican American Indian | 146 | 0.0% |
| Mongolian | 259 | 0.0% |
| Moroccan | 647 | 0.0% |
| Native Hawaiian | 431 | 0.0% |
| Navajo | 93 | 0.0% |
| New Zealander | 30 | 0.0% |
| Nicaraguan | 117 | 0.0% |
| Nigerian | 2,181 | 0.1% |
| Northern European | 1,284 | 0.1% |
| Norwegian | 4,350 | 0.3% |
| Okinawan | 15 | 0.0% |
| Ottawa | 4 | 0.0% |
| Pakistani | 854 | 0.1% |
| Palestinian | 127 | 0.0% |
| Panamanian | 321 | 0.0% |
| Paraguayan | 243 | 0.0% |
| Pennsylvania German | 2,032 | 0.1% |
| Peruvian | 636 | 0.0% |
| Polish | 116,179 | 7.6% |
| Portuguese | 1,266 | 0.1% |
| Potawatomi | 3 | 0.0% |
| Pueblo | 7 | 0.0% |
| Puerto Rican | 7,544 | 0.5% |
| Romanian | 2,250 | 0.2% |
| Russian | 19,544 | 1.3% |
| Salvadoran | 614 | 0.0% |
| Samoan | 192 | 0.0% |
| Scandinavian | 1,976 | 0.1% |
| Scotch-Irish | 24,525 | 1.6% |
| Scottish | 26,101 | 1.7% |
| Seminole | 235 | 0.0% |
| Senegalese | 45 | 0.0% |
| Serbian | 5,804 | 0.4% |
| Shoshone | 31 | 0.0% |
| Sierra Leonean | 19 | 0.0% |
| Sioux | 319 | 0.0% |
| Slavic | 2,712 | 0.2% |
| Slovak | 43,213 | 2.8% |
| Slovene | 5,114 | 0.3% |
| Somali | 245 | 0.0% |
| South African | 171 | 0.0% |
| South American | 4,991 | 0.3% |
| South American Indian | 84 | 0.0% |
| Soviet Union | 57 | 0.0% |
| Spaniard | 1,150 | 0.1% |
| Spanish | 1,769 | 0.1% |
| Spanish American | 15 | 0.0% |
| Sri Lankan | 2,827 | 0.2% |
| Subsaharan African | 14,175 | 0.9% |
| Sudanese | 321 | 0.0% |
| Swedish | 10,792 | 0.7% |
| Swiss | 4,089 | 0.3% |
| Syrian | 2,867 | 0.2% |
| Taiwanese | 5 | 0.0% |
| Thai | 20,104 | 1.3% |
| Tlingit-Haida | 18 | 0.0% |
| Tongan | 12 | 0.0% |
| Trinidadian and Tobagonian | 245 | 0.0% |
| Turkish | 1,417 | 0.1% |
| U.S. Virgin Islander | 78 | 0.0% |
| Ugandan | 70 | 0.0% |
| Ukrainian | 13,605 | 0.9% |
| Uruguayan | 69 | 0.0% |
| Ute | 40 | 0.0% |
| Venezuelan | 771 | 0.1% |
| Vietnamese | 473 | 0.0% |
| Welsh | 15,873 | 1.0% |
| West Indian | 349 | 0.0% |
| Yakama | 4 | 0.0% |
| Yaqui | 44 | 0.0% |
| Yugoslavian | 1,739 | 0.1% |
| Yup'ik | 4 | 0.0% |
| Zimbabwean | 19 | 0.0% | View All 184 Rows |
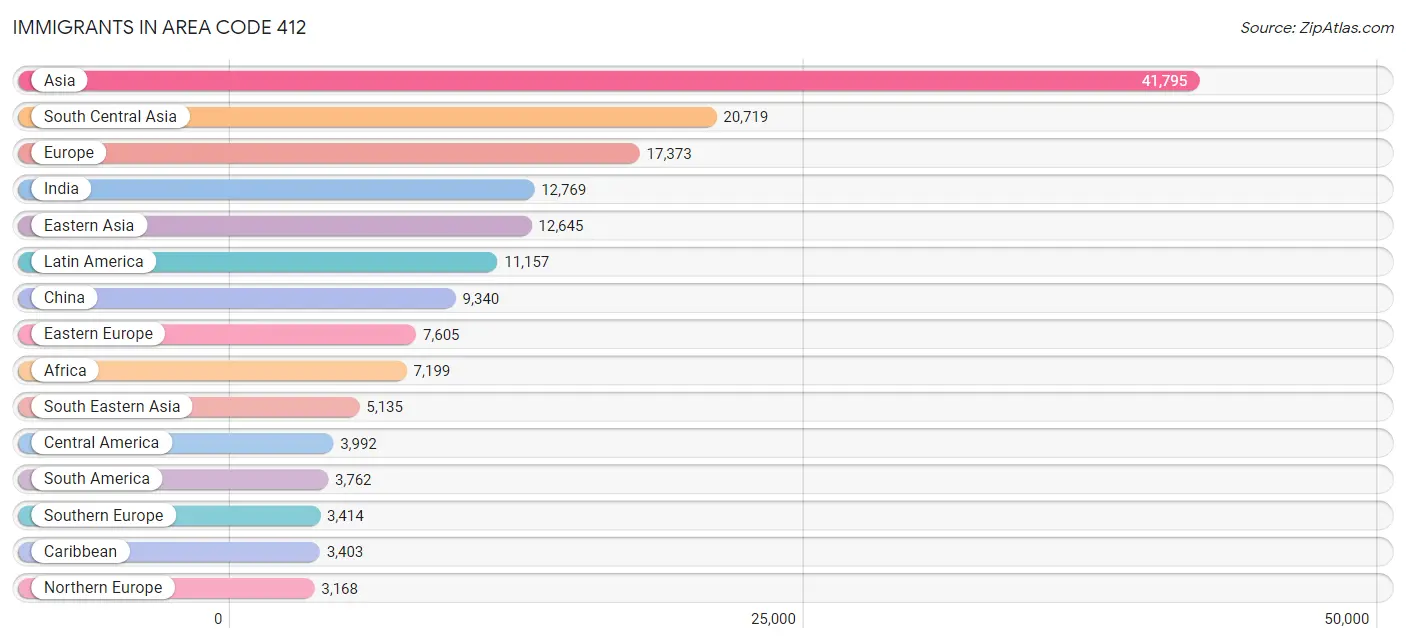
Immigrants in Area Code 412
The most numerous immigrant groups reported in Area Code 412 came from Asia (41,795 | 2.7%), South Central Asia (20,719 | 1.4%), Europe (17,373 | 1.1%), India (12,769 | 0.8%), and Eastern Asia (12,645 | 0.8%), together accounting for 6.9% of all Area Code 412 residents.
| Immigration Origin | # Population | % Population |
| Afghanistan | 256 | 0.0% |
| Africa | 7,199 | 0.5% |
| Albania | 47 | 0.0% |
| Argentina | 358 | 0.0% |
| Asia | 41,795 | 2.7% |
| Australia | 737 | 0.1% |
| Austria | 106 | 0.0% |
| Bahamas | 186 | 0.0% |
| Bangladesh | 500 | 0.0% |
| Belarus | 242 | 0.0% |
| Belgium | 81 | 0.0% |
| Belize | 16 | 0.0% |
| Bolivia | 187 | 0.0% |
| Bosnia and Herzegovina | 532 | 0.0% |
| Brazil | 934 | 0.1% |
| Bulgaria | 422 | 0.0% |
| Cambodia | 149 | 0.0% |
| Cameroon | 242 | 0.0% |
| Canada | 2,725 | 0.2% |
| Caribbean | 3,403 | 0.2% |
| Central America | 3,992 | 0.3% |
| Chile | 146 | 0.0% |
| China | 9,340 | 0.6% |
| Colombia | 617 | 0.0% |
| Congo | 151 | 0.0% |
| Costa Rica | 96 | 0.0% |
| Croatia | 102 | 0.0% |
| Cuba | 233 | 0.0% |
| Czechoslovakia | 539 | 0.0% |
| Denmark | 24 | 0.0% |
| Dominica | 30 | 0.0% |
| Dominican Republic | 754 | 0.1% |
| Eastern Africa | 1,890 | 0.1% |
| Eastern Asia | 12,645 | 0.8% |
| Eastern Europe | 7,605 | 0.5% |
| Ecuador | 131 | 0.0% |
| Egypt | 482 | 0.0% |
| El Salvador | 243 | 0.0% |
| England | 1,150 | 0.1% |
| Eritrea | 103 | 0.0% |
| Ethiopia | 242 | 0.0% |
| Europe | 17,373 | 1.1% |
| France | 421 | 0.0% |
| Germany | 2,209 | 0.1% |
| Ghana | 329 | 0.0% |
| Greece | 350 | 0.0% |
| Guatemala | 633 | 0.0% |
| Guyana | 130 | 0.0% |
| Haiti | 424 | 0.0% |
| Honduras | 280 | 0.0% |
| Hong Kong | 320 | 0.0% |
| Hungary | 269 | 0.0% |
| India | 12,769 | 0.8% |
| Indonesia | 315 | 0.0% |
| Iran | 595 | 0.0% |
| Iraq | 431 | 0.0% |
| Ireland | 375 | 0.0% |
| Israel | 413 | 0.0% |
| Italy | 2,507 | 0.2% |
| Jamaica | 1,400 | 0.1% |
| Japan | 1,069 | 0.1% |
| Jordan | 346 | 0.0% |
| Kazakhstan | 129 | 0.0% |
| Kenya | 724 | 0.1% |
| Korea | 2,199 | 0.1% |
| Kuwait | 85 | 0.0% |
| Latin America | 11,157 | 0.7% |
| Latvia | 61 | 0.0% |
| Lebanon | 200 | 0.0% |
| Liberia | 165 | 0.0% |
| Lithuania | 207 | 0.0% |
| Malaysia | 280 | 0.0% |
| Mexico | 2,524 | 0.2% |
| Middle Africa | 677 | 0.0% |
| Moldova | 43 | 0.0% |
| Morocco | 509 | 0.0% |
| Nepal | 1,731 | 0.1% |
| Netherlands | 222 | 0.0% |
| Nicaragua | 14 | 0.0% |
| Nigeria | 1,231 | 0.1% |
| North Macedonia | 8 | 0.0% |
| Northern Africa | 1,928 | 0.1% |
| Northern Europe | 3,168 | 0.2% |
| Norway | 36 | 0.0% |
| Oceania | 802 | 0.1% |
| Pakistan | 1,045 | 0.1% |
| Panama | 186 | 0.0% |
| Peru | 350 | 0.0% |
| Philippines | 1,798 | 0.1% |
| Poland | 781 | 0.1% |
| Portugal | 105 | 0.0% |
| Romania | 595 | 0.0% |
| Russia | 1,898 | 0.1% |
| Saudi Arabia | 461 | 0.0% |
| Scotland | 74 | 0.0% |
| Senegal | 36 | 0.0% |
| Serbia | 197 | 0.0% |
| Sierra Leone | 17 | 0.0% |
| Singapore | 76 | 0.0% |
| Somalia | 265 | 0.0% |
| South Africa | 263 | 0.0% |
| South America | 3,762 | 0.3% |
| South Central Asia | 20,719 | 1.4% |
| South Eastern Asia | 5,135 | 0.3% |
| Southern Europe | 3,414 | 0.2% |
| Spain | 422 | 0.0% |
| Sri Lanka | 53 | 0.0% |
| Sudan | 296 | 0.0% |
| Sweden | 171 | 0.0% |
| Switzerland | 117 | 0.0% |
| Syria | 368 | 0.0% |
| Taiwan | 1,134 | 0.1% |
| Thailand | 548 | 0.0% |
| Trinidad and Tobago | 238 | 0.0% |
| Turkey | 612 | 0.0% |
| Uganda | 46 | 0.0% |
| Ukraine | 1,143 | 0.1% |
| Uruguay | 44 | 0.0% |
| Uzbekistan | 631 | 0.0% |
| Venezuela | 685 | 0.0% |
| Vietnam | 1,641 | 0.1% |
| Western Africa | 2,359 | 0.2% |
| Western Asia | 3,158 | 0.2% |
| Western Europe | 3,166 | 0.2% |
| Zaire | 239 | 0.0% |
| Zimbabwe | 19 | 0.0% | View All 126 Rows |
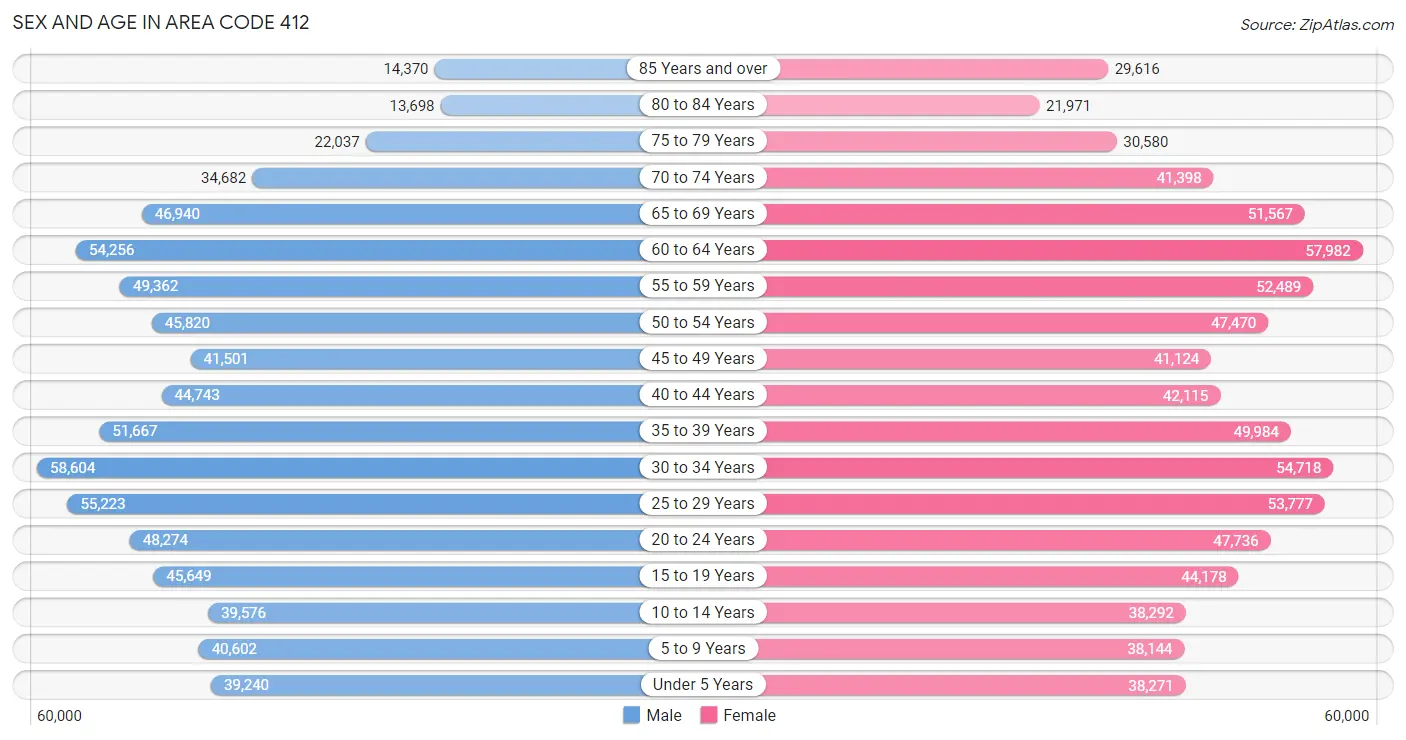
Sex and Age in Area Code 412
Sex and Age in Area Code 412
The most populous age groups in Area Code 412 are 30 to 34 Years (58,604 | 7.9%) for men and 60 to 64 Years (57,982 | 7.4%) for women.
| Age Bracket | Male | Female |
| Under 5 Years | 39,240 (5.3%) | 38,271 (4.9%) |
| 5 to 9 Years | 40,602 (5.4%) | 38,144 (4.9%) |
| 10 to 14 Years | 39,576 (5.3%) | 38,292 (4.9%) |
| 15 to 19 Years | 45,649 (6.1%) | 44,178 (5.7%) |
| 20 to 24 Years | 48,274 (6.5%) | 47,736 (6.1%) |
| 25 to 29 Years | 55,223 (7.4%) | 53,777 (6.9%) |
| 30 to 34 Years | 58,604 (7.9%) | 54,718 (7.0%) |
| 35 to 39 Years | 51,667 (6.9%) | 49,984 (6.4%) |
| 40 to 44 Years | 44,743 (6.0%) | 42,115 (5.4%) |
| 45 to 49 Years | 41,501 (5.6%) | 41,124 (5.3%) |
| 50 to 54 Years | 45,820 (6.1%) | 47,470 (6.1%) |
| 55 to 59 Years | 49,362 (6.6%) | 52,489 (6.7%) |
| 60 to 64 Years | 54,256 (7.3%) | 57,982 (7.4%) |
| 65 to 69 Years | 46,940 (6.3%) | 51,567 (6.6%) |
| 70 to 74 Years | 34,682 (4.6%) | 41,398 (5.3%) |
| 75 to 79 Years | 22,037 (2.9%) | 30,580 (3.9%) |
| 80 to 84 Years | 13,698 (1.8%) | 21,971 (2.8%) |
| 85 Years and over | 14,370 (1.9%) | 29,616 (3.8%) |
| Total | 746,244 (100.0%) | 781,412 (100.0%) |
Families and Households in Area Code 412
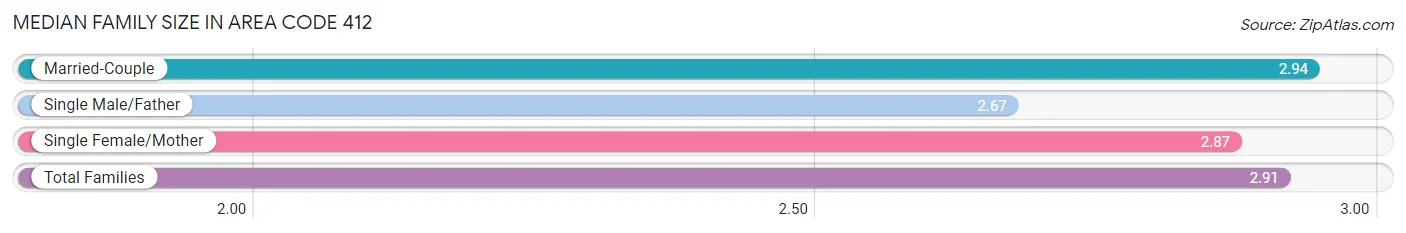
Median Family Size in Area Code 412
The median family size in Area Code 412 is 2.91 persons per family, with married-couple families (281,293 | 75.4%) accounting for the largest median family size of 2.94029 persons per family. On the other hand, single male/father families (24,658 | 6.6%) represent the smallest median family size with 2.67 persons per family.
| Family Type | # Families | Family Size |
| Married-Couple | 281,293 (75.4%) | 2.94 |
| Single Male/Father | 24,658 (6.6%) | 2.67 |
| Single Female/Mother | 66,865 (17.9%) | 2.87 |
| Total Families | 372,816 (100.0%) | 2.91 |
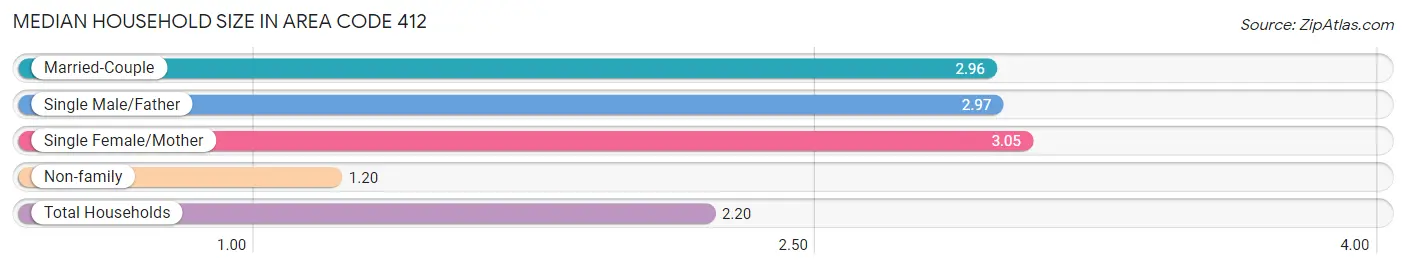
Median Household Size in Area Code 412
The median household size in Area Code 412 is 2.20 persons per household, with single female/mother households (66,865 | 10.0%) accounting for the largest median household size of 3.05257 persons per household. non-family households (296,523 | 44.3%) represent the smallest median household size with 1.20 persons per household.
| Household Type | # Households | Household Size |
| Married-Couple | 281,293 (42.0%) | 2.96 |
| Single Male/Father | 24,658 (3.7%) | 2.97 |
| Single Female/Mother | 66,865 (10.0%) | 3.05 |
| Non-family | 296,523 (44.3%) | 1.20 |
| Total Households | 669,339 (100.0%) | 2.20 |
Household Size by Marriage Status in Area Code 412
Out of a total of 669,339 households in Area Code 412, 372,816 (55.7%) are family households, while 296,523 (44.3%) are nonfamily households. The most numerous type of family households are 2-person households, comprising 186,893, and the most common type of nonfamily households are 1-person households, comprising 246,152.
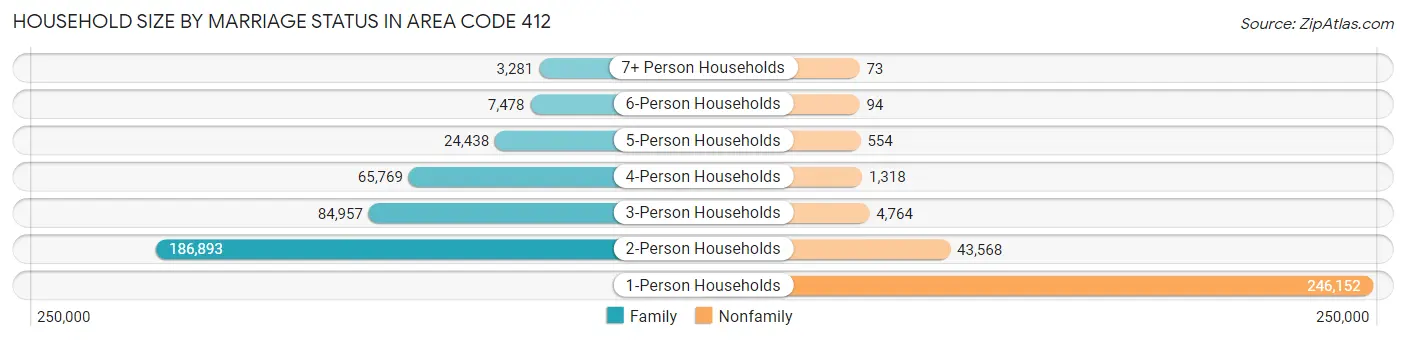
| Household Size | Family Households | Nonfamily Households |
| 1-Person Households | - | 246,152 (36.8%) |
| 2-Person Households | 186,893 (27.9%) | 43,568 (6.5%) |
| 3-Person Households | 84,957 (12.7%) | 4,764 (0.7%) |
| 4-Person Households | 65,769 (9.8%) | 1,318 (0.2%) |
| 5-Person Households | 24,438 (3.6%) | 554 (0.1%) |
| 6-Person Households | 7,478 (1.1%) | 94 (0.0%) |
| 7+ Person Households | 3,281 (0.5%) | 73 (0.0%) |
| Total | 372,816 (55.7%) | 296,523 (44.3%) |
Female Fertility in Area Code 412
Fertility by Age in Area Code 412
Average fertility rate in Area Code 412 is 55.1 births per 1,000 women. Women in the age bracket of 20 to 34 years have the highest fertility rate with 101.8 births per 1,000 women. Women in the age bracket of 20 to 34 years acount for 74.4% of all women with births.
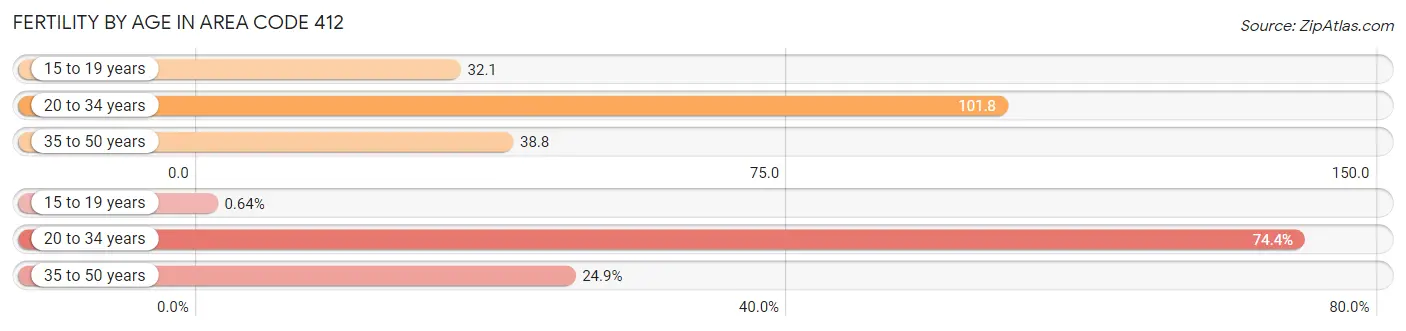
| Age Bracket | Women with Births | Births / 1,000 Women |
| 15 to 19 years | 107 (0.6%) | 32.1 |
| 20 to 34 years | 12,521 (74.4%) | 101.8 |
| 35 to 50 years | 4,192 (24.9%) | 38.8 |
| Total | 16,820 (100.0%) | 55.1 |
Fertility by Age by Marriage Status in Area Code 412
61.5% of women with births (16,820) in Area Code 412 are married. The highest percentage of unmarried women with births falls into 15 to 19 years age bracket with 100.0% of them unmarried at the time of birth, while the lowest percentage of unmarried women with births belong to 20 to 34 years age bracket with 44.1% of them unmarried.
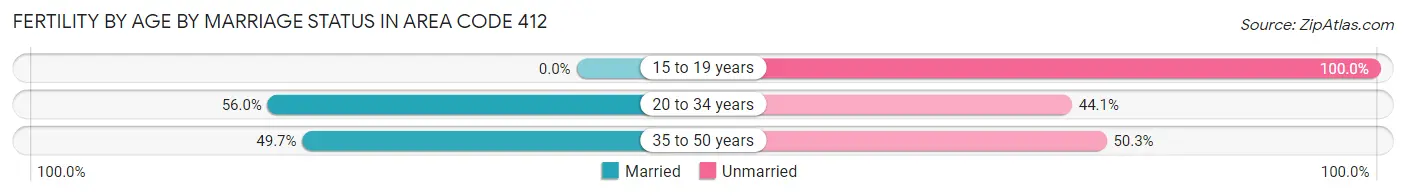
| Age Bracket | Married | Unmarried |
| 15 to 19 years | 0 (0.0%) | 107 (100.0%) |
| 20 to 34 years | 7,005 (55.9%) | 5,516 (44.1%) |
| 35 to 50 years | 2,082 (49.7%) | 2,110 (50.3%) |
| Total | 10,339 (61.5%) | 6,481 (38.5%) |
Fertility by Education in Area Code 412
Average fertility rate in Area Code 412 is 55.1 births per 1,000 women. Women with the education attainment of graduate degree have the highest fertility rate of 100.7 births per 1,000 women, while women with the education attainment of less than high school have the lowest fertility at 51.6 births per 1,000 women. Women with the education attainment of bachelor's degree represent 27.3% of all women with births.
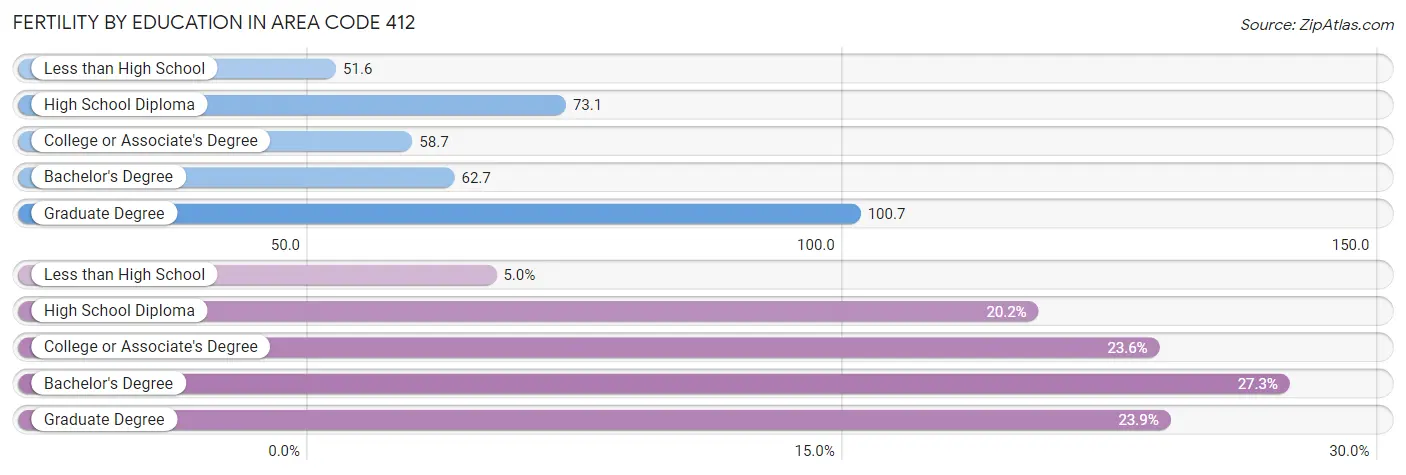
| Educational Attainment | Women with Births | Births / 1,000 Women |
| Less than High School | 838 (5.0%) | 51.6 |
| High School Diploma | 3,400 (20.2%) | 73.1 |
| College or Associate's Degree | 3,972 (23.6%) | 58.7 |
| Bachelor's Degree | 4,587 (27.3%) | 62.7 |
| Graduate Degree | 4,023 (23.9%) | 100.7 |
| Total | 16,820 (100.0%) | 55.1 |
Fertility by Education by Marriage Status in Area Code 412
38.5% of women with births in Area Code 412 are unmarried. Women with the educational attainment of bachelor's degree are most likely to be married with 70.3% of them married at childbirth, while women with the educational attainment of less than high school are least likely to be married with 90.7% of them unmarried at childbirth.
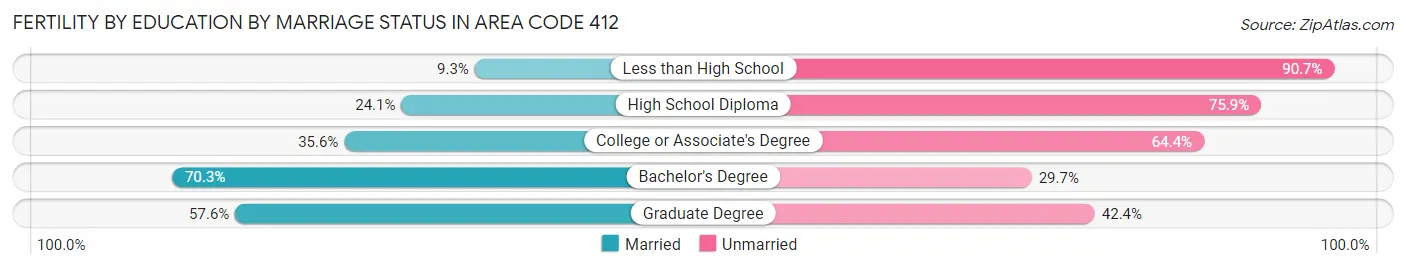
| Educational Attainment | Married | Unmarried |
| Less than High School | 78 (9.3%) | 760 (90.7%) |
| High School Diploma | 819 (24.1%) | 2,581 (75.9%) |
| College or Associate's Degree | 1,414 (35.6%) | 2,558 (64.4%) |
| Bachelor's Degree | 3,224 (70.3%) | 1,363 (29.7%) |
| Graduate Degree | 2,316 (57.6%) | 1,707 (42.4%) |
| Total | 10,339 (61.5%) | 6,481 (38.5%) |
Employment Characteristics in Area Code 412
Employment by Class of Employer in Area Code 412
Among the 754,325 employed individuals in Area Code 412, private company employees (502,932 | 66.7%), not-for-profit organizations (120,748 | 16.0%), and local government employees (42,095 | 5.6%) make up the most common classes of employment.
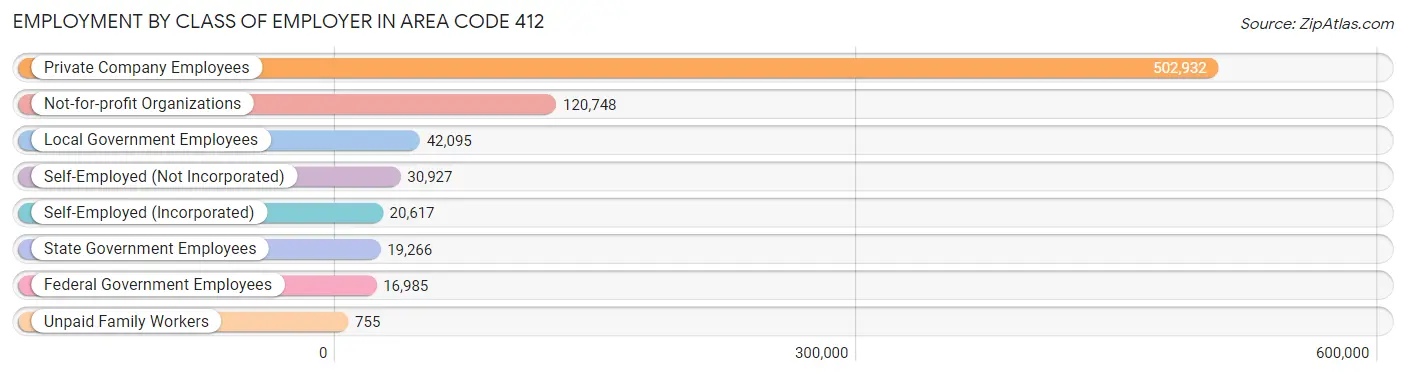
| Employer Class | # Employees | % Employees |
| Private Company Employees | 502,932 | 66.7% |
| Self-Employed (Incorporated) | 20,617 | 2.7% |
| Self-Employed (Not Incorporated) | 30,927 | 4.1% |
| Not-for-profit Organizations | 120,748 | 16.0% |
| Local Government Employees | 42,095 | 5.6% |
| State Government Employees | 19,266 | 2.5% |
| Federal Government Employees | 16,985 | 2.2% |
| Unpaid Family Workers | 755 | 0.1% |
| Total | 754,325 | 100.0% |
Employment Status by Age in Area Code 412
According to the labor force statistics for Area Code 412, out of the total population over 16 years of age (1,277,395), 62.9% or 804,120 individuals are in the labor force, with 5.8% or 46,800 of them unemployed. The age group with the highest labor force participation rate is 25 to 29 years, with 87.9% or 95,844 individuals in the labor force. Within the labor force, the 16 to 19 years age range has the highest percentage of unemployed individuals, with 1,321.7% or 464,882 of them being unemployed.
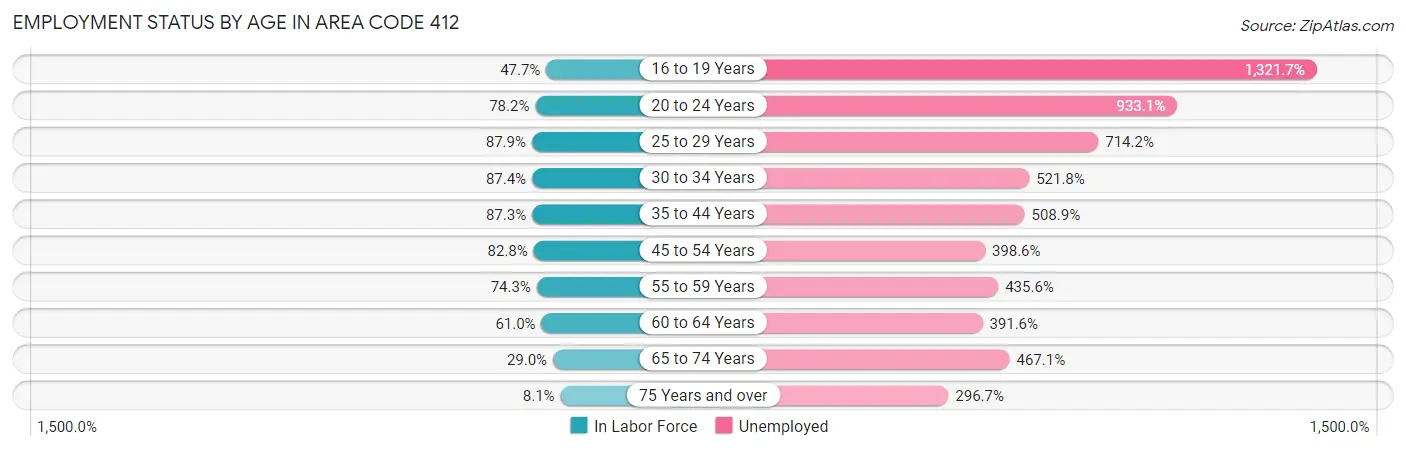
| Age Bracket | In Labor Force | Unemployed |
| 16 to 19 Years | 35,169 (47.7%) | 464,882 (1,321.7%) |
| 20 to 24 Years | 75,075 (78.2%) | 700,571 (933.1%) |
| 25 to 29 Years | 95,847 (87.9%) | 684,518 (714.2%) |
| 30 to 34 Years | 99,038 (87.4%) | 516,806 (521.8%) |
| 35 to 44 Years | 164,589 (87.3%) | 837,583 (508.9%) |
| 45 to 54 Years | 145,698 (82.8%) | 580,732 (398.6%) |
| 55 to 59 Years | 75,652 (74.3%) | 329,553 (435.6%) |
| 60 to 64 Years | 68,436 (61.0%) | 267,980 (391.6%) |
| 65 to 74 Years | 50,648 (29.0%) | 236,577 (467.1%) |
| 75 Years and over | 10,707 (8.1%) | 31,750 (296.7%) |
| Total | 804,163 (62.9%) | 46,818 (5.8%) |
Employment Status by Educational Attainment in Area Code 412
According to labor force statistics for Area Code 412, 79.4% of individuals (635,943) out of the total population between 25 and 64 years of age (800,835) are in the labor force, with 499.6% or 3,177,171 of them being unemployed. The group with the highest labor force participation rate are those with the educational attainment of bachelor's degree or higher, with 87.9% or 320,335 individuals in the labor force. Within the labor force, individuals with less than high school education have the highest percentage of unemployment, with 1,124.9% or 212,111 of them being unemployed.
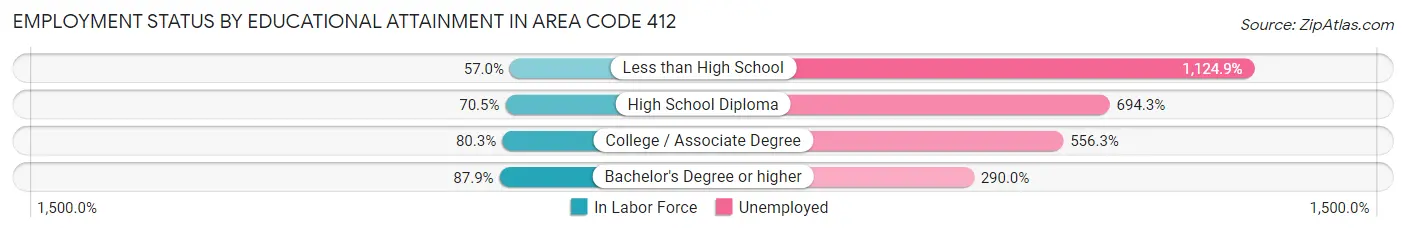
| Educational Attainment | In Labor Force | Unemployed |
| Less than High School | 18,857 (57.0%) | 371,858 (1,124.9%) |
| High School Diploma | 134,026 (70.5%) | 1,320,524 (694.3%) |
| College / Associate Degree | 171,122 (80.2%) | 1,186,226 (556.3%) |
| Bachelor's Degree or higher | 320,350 (87.9%) | 1,056,609 (290.0%) |
| Total | 635,924 (79.4%) | 4,000,972 (499.6%) |
Employment Occupations by Sex in Area Code 412
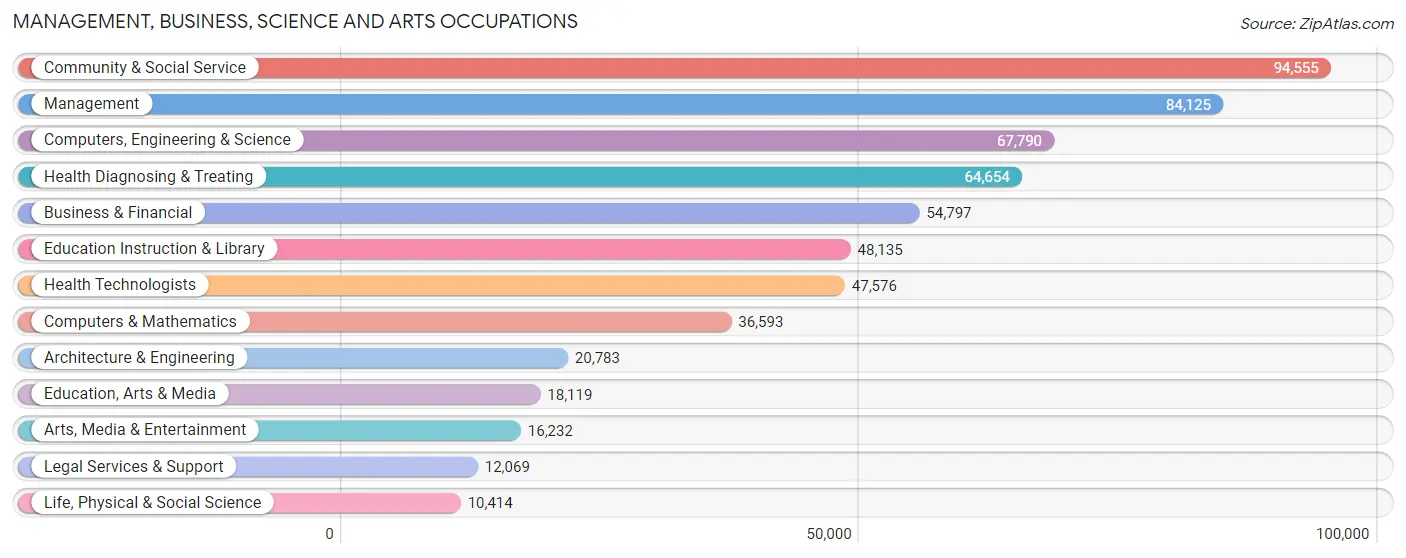
Management, Business, Science and Arts Occupations
The most common Management, Business, Science and Arts occupations in Area Code 412 are Community & Social Service (94,555 | 12.3%), Management (84,125 | 10.9%), Computers, Engineering & Science (67,790 | 8.8%), Health Diagnosing & Treating (64,654 | 8.4%), and Business & Financial (54,797 | 7.1%).
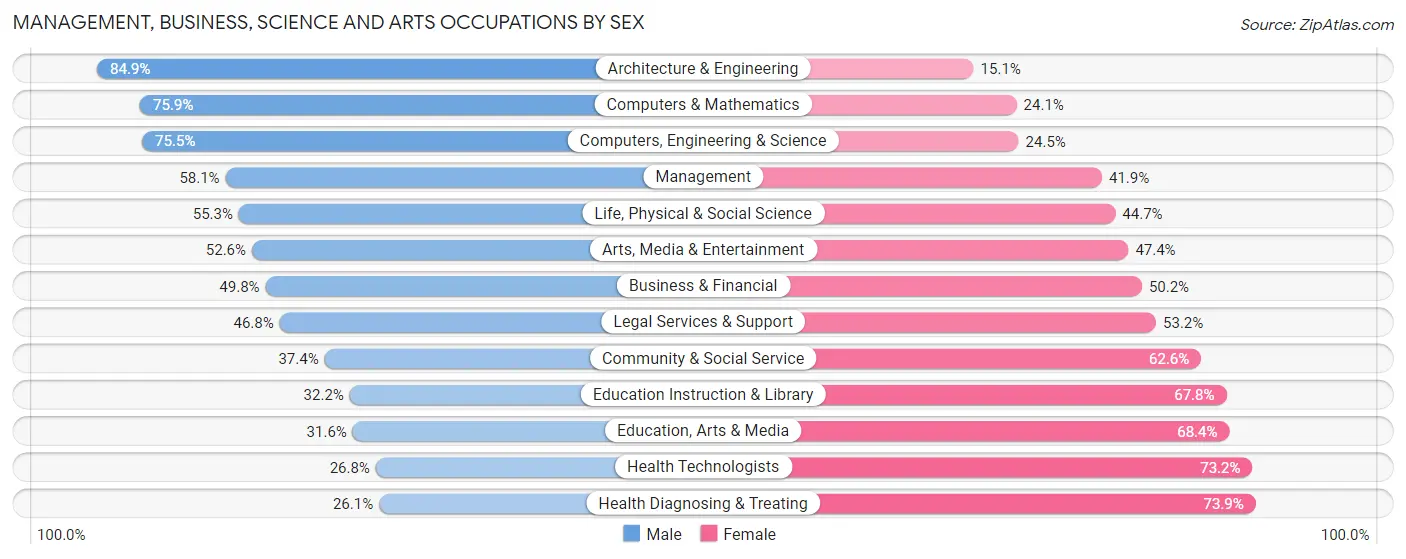
Management, Business, Science and Arts Occupations by Sex
Within the Management, Business, Science and Arts occupations in Area Code 412, the most male-oriented occupations are Architecture & Engineering (84.9%), Computers & Mathematics (75.9%), and Computers, Engineering & Science (75.5%), while the most female-oriented occupations are Health Diagnosing & Treating (73.9%), Health Technologists (73.2%), and Education, Arts & Media (68.4%).
| Occupation | Male | Female |
| Management | 48,873 (58.1%) | 35,252 (41.9%) |
| Business & Financial | 27,274 (49.8%) | 27,523 (50.2%) |
| Computers, Engineering & Science | 51,177 (75.5%) | 16,613 (24.5%) |
| Computers & Mathematics | 27,776 (75.9%) | 8,817 (24.1%) |
| Architecture & Engineering | 17,641 (84.9%) | 3,142 (15.1%) |
| Life, Physical & Social Science | 5,760 (55.3%) | 4,654 (44.7%) |
| Community & Social Service | 35,401 (37.4%) | 59,154 (62.6%) |
| Education, Arts & Media | 5,718 (31.6%) | 12,401 (68.4%) |
| Legal Services & Support | 5,651 (46.8%) | 6,418 (53.2%) |
| Education Instruction & Library | 15,496 (32.2%) | 32,639 (67.8%) |
| Arts, Media & Entertainment | 8,536 (52.6%) | 7,696 (47.4%) |
| Health Diagnosing & Treating | 16,853 (26.1%) | 47,801 (73.9%) |
| Health Technologists | 12,733 (26.8%) | 34,843 (73.2%) |
| Total (Category) | 179,578 (49.1%) | 186,343 (50.9%) |
| Total (Overall) | 398,545 (51.8%) | 370,473 (48.2%) |
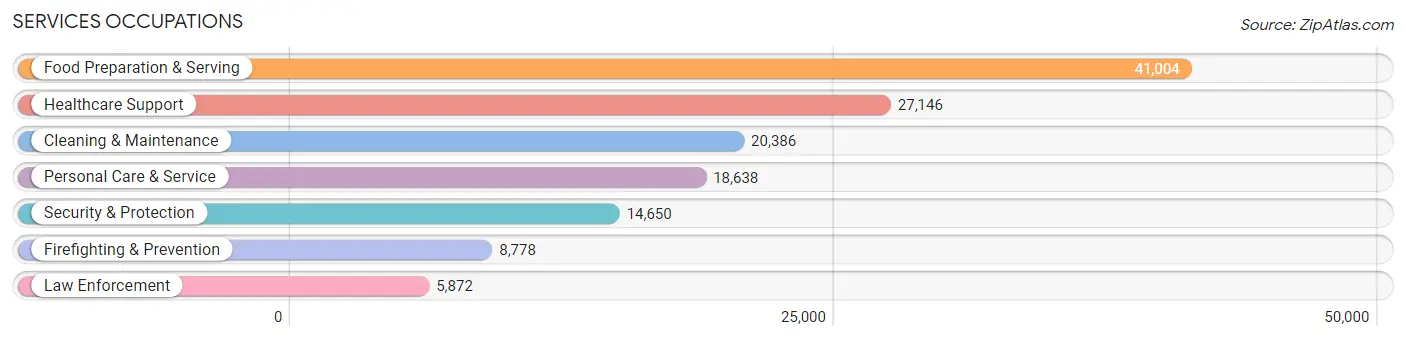
Services Occupations
The most common Services occupations in Area Code 412 are Food Preparation & Serving (41,004 | 5.3%), Healthcare Support (27,146 | 3.5%), Cleaning & Maintenance (20,386 | 2.6%), Personal Care & Service (18,638 | 2.4%), and Security & Protection (14,650 | 1.9%).
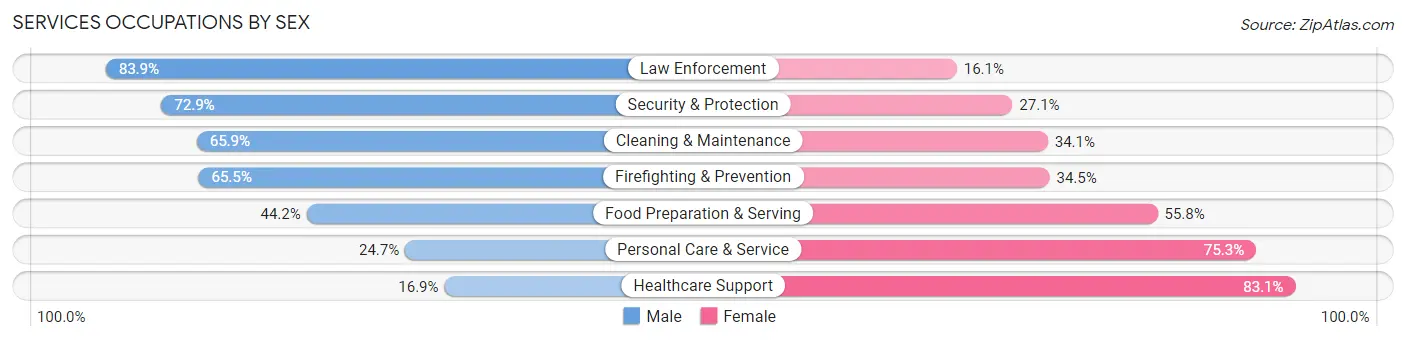
Services Occupations by Sex
Within the Services occupations in Area Code 412, the most male-oriented occupations are Law Enforcement (83.9%), Security & Protection (72.9%), and Cleaning & Maintenance (65.9%), while the most female-oriented occupations are Healthcare Support (83.1%), Personal Care & Service (75.3%), and Food Preparation & Serving (55.8%).
| Occupation | Male | Female |
| Healthcare Support | 4,582 (16.9%) | 22,564 (83.1%) |
| Security & Protection | 10,680 (72.9%) | 3,970 (27.1%) |
| Firefighting & Prevention | 5,753 (65.5%) | 3,025 (34.5%) |
| Law Enforcement | 4,927 (83.9%) | 945 (16.1%) |
| Food Preparation & Serving | 18,106 (44.2%) | 22,898 (55.8%) |
| Cleaning & Maintenance | 13,432 (65.9%) | 6,954 (34.1%) |
| Personal Care & Service | 4,597 (24.7%) | 14,041 (75.3%) |
| Total (Category) | 51,397 (42.2%) | 70,427 (57.8%) |
| Total (Overall) | 398,545 (51.8%) | 370,473 (48.2%) |
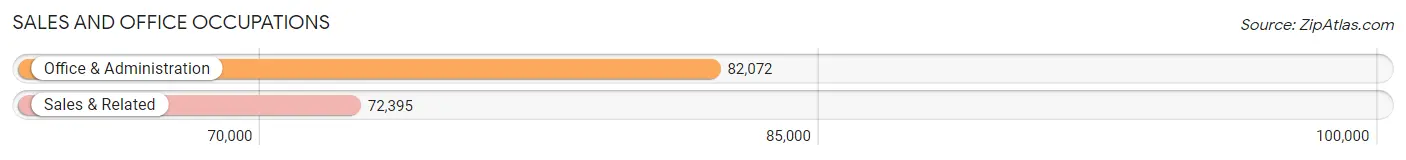
Sales and Office Occupations
The most common Sales and Office occupations in Area Code 412 are Office & Administration (82,072 | 10.7%), and Sales & Related (72,395 | 9.4%).
Sales and Office Occupations by Sex
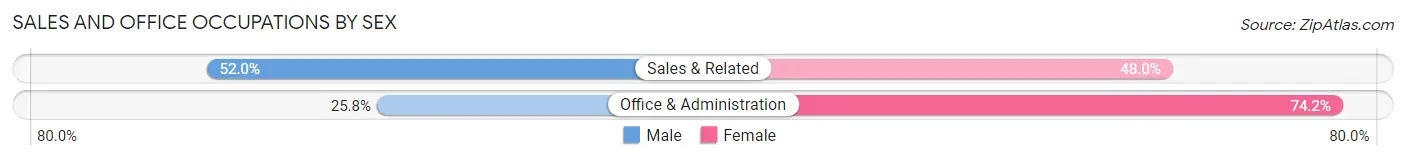
| Occupation | Male | Female |
| Sales & Related | 37,635 (52.0%) | 34,760 (48.0%) |
| Office & Administration | 21,193 (25.8%) | 60,879 (74.2%) |
| Total (Category) | 58,828 (38.1%) | 95,639 (61.9%) |
| Total (Overall) | 398,545 (51.8%) | 370,473 (48.2%) |
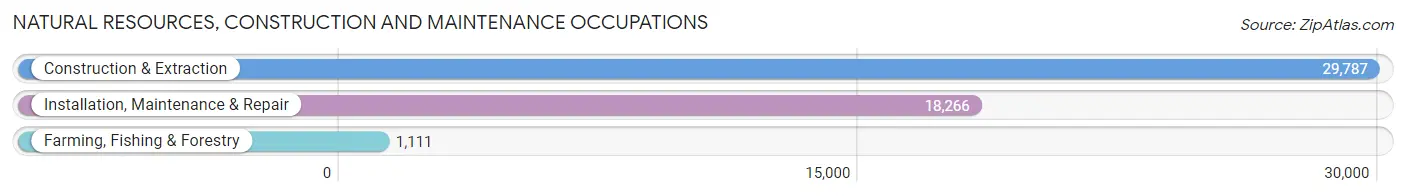
Natural Resources, Construction and Maintenance Occupations
The most common Natural Resources, Construction and Maintenance occupations in Area Code 412 are Construction & Extraction (29,787 | 3.9%), Installation, Maintenance & Repair (18,266 | 2.4%), and Farming, Fishing & Forestry (1,111 | 0.1%).
Natural Resources, Construction and Maintenance Occupations by Sex
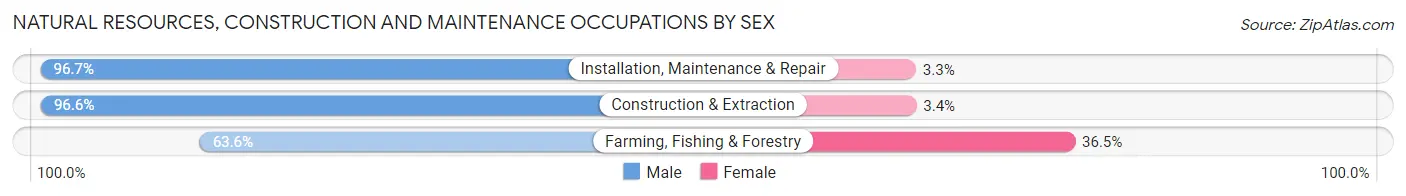
| Occupation | Male | Female |
| Farming, Fishing & Forestry | 706 (63.5%) | 405 (36.4%) |
| Construction & Extraction | 28,767 (96.6%) | 1,020 (3.4%) |
| Installation, Maintenance & Repair | 17,657 (96.7%) | 609 (3.3%) |
| Total (Category) | 47,130 (95.9%) | 2,034 (4.1%) |
| Total (Overall) | 398,545 (51.8%) | 370,473 (48.2%) |
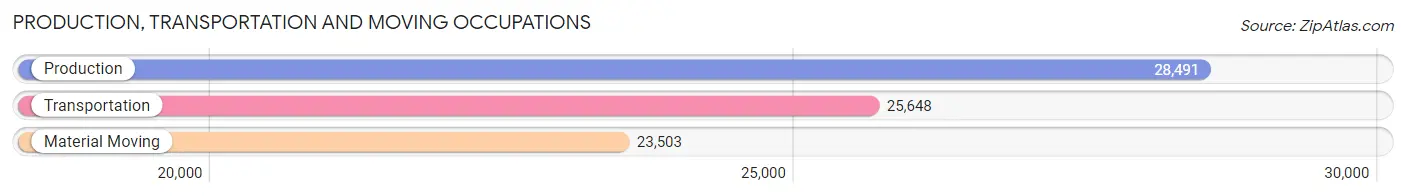
Production, Transportation and Moving Occupations
The most common Production, Transportation and Moving occupations in Area Code 412 are Production (28,491 | 3.7%), Transportation (25,648 | 3.3%), and Material Moving (23,503 | 3.1%).
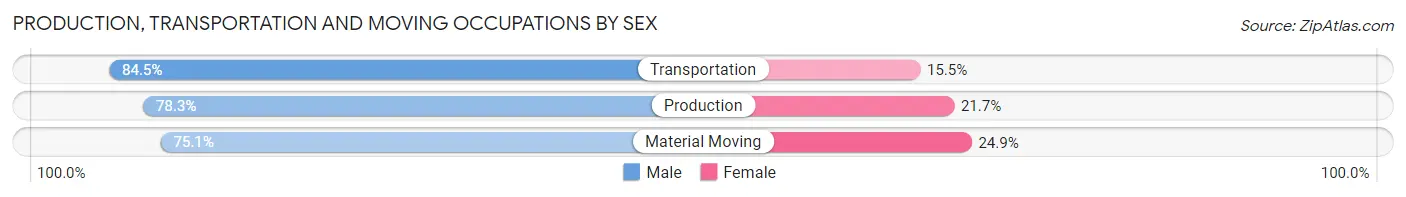
Production, Transportation and Moving Occupations by Sex
| Occupation | Male | Female |
| Production | 22,299 (78.3%) | 6,192 (21.7%) |
| Transportation | 21,671 (84.5%) | 3,977 (15.5%) |
| Material Moving | 17,642 (75.1%) | 5,861 (24.9%) |
| Total (Category) | 61,612 (79.3%) | 16,030 (20.6%) |
| Total (Overall) | 398,545 (51.8%) | 370,473 (48.2%) |
Employment Industries by Sex in Area Code 412
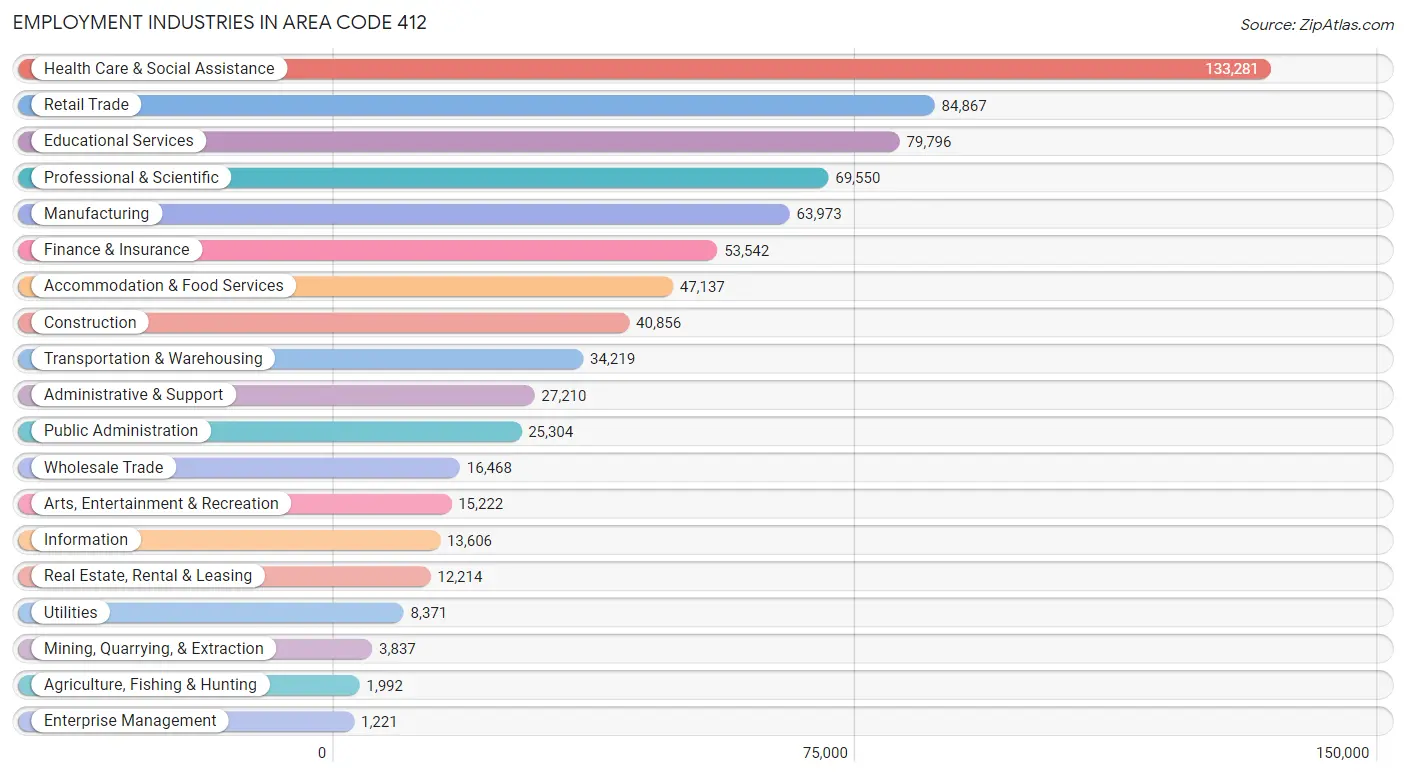
Employment Industries in Area Code 412
The major employment industries in Area Code 412 include Health Care & Social Assistance (133,281 | 17.3%), Retail Trade (84,867 | 11.0%), Educational Services (79,796 | 10.4%), Professional & Scientific (69,550 | 9.0%), and Manufacturing (63,973 | 8.3%).
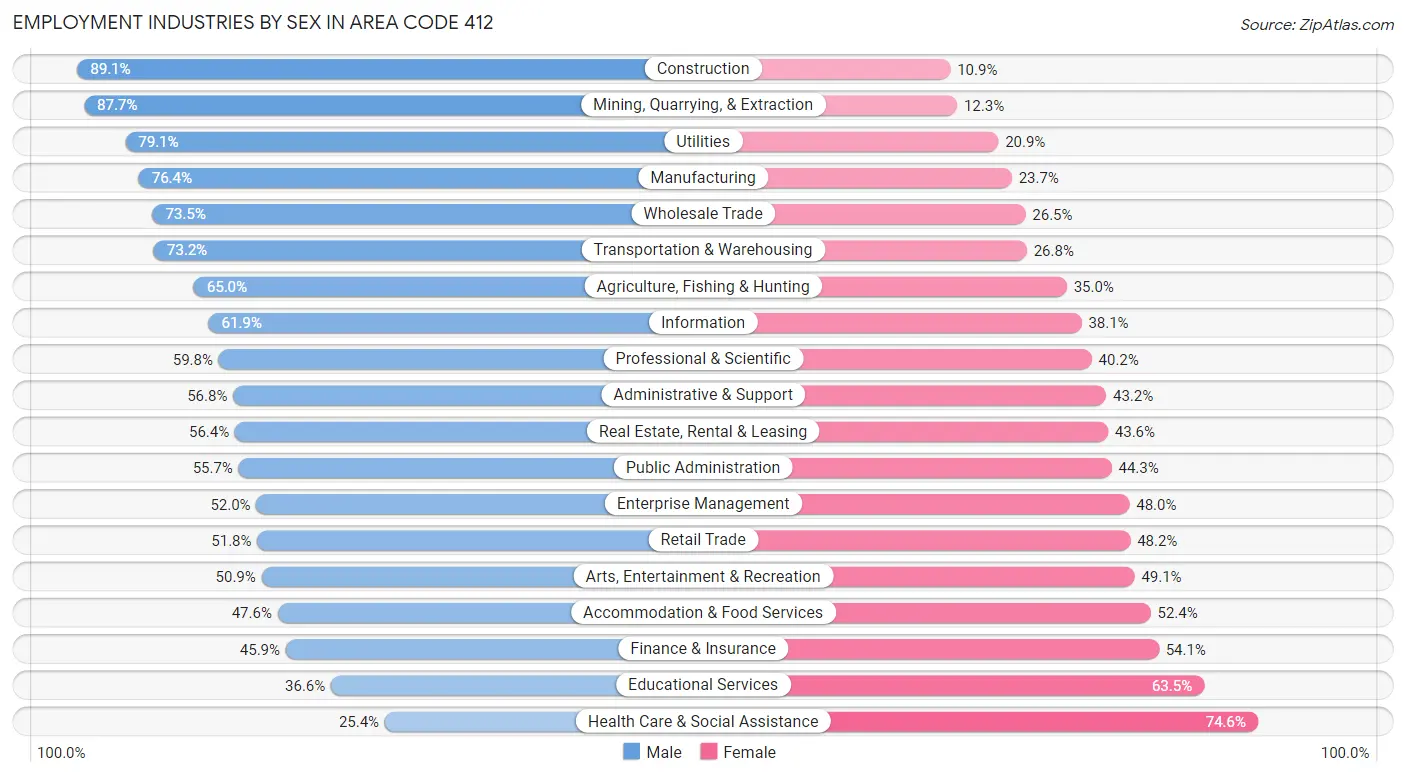
Employment Industries by Sex in Area Code 412
The Area Code 412 industries that see more men than women are Construction (89.1%), Mining, Quarrying, & Extraction (87.7%), and Utilities (79.1%), whereas the industries that tend to have a higher number of women are Health Care & Social Assistance (74.6%), Educational Services (63.4%), and Finance & Insurance (54.1%).
| Industry | Male | Female |
| Agriculture, Fishing & Hunting | 1,294 (65.0%) | 698 (35.0%) |
| Mining, Quarrying, & Extraction | 3,364 (87.7%) | 473 (12.3%) |
| Construction | 36,390 (89.1%) | 4,466 (10.9%) |
| Manufacturing | 48,842 (76.3%) | 15,131 (23.6%) |
| Wholesale Trade | 12,107 (73.5%) | 4,361 (26.5%) |
| Retail Trade | 43,977 (51.8%) | 40,890 (48.2%) |
| Transportation & Warehousing | 25,059 (73.2%) | 9,160 (26.8%) |
| Utilities | 6,625 (79.1%) | 1,746 (20.9%) |
| Information | 8,423 (61.9%) | 5,183 (38.1%) |
| Finance & Insurance | 24,589 (45.9%) | 28,953 (54.1%) |
| Real Estate, Rental & Leasing | 6,893 (56.4%) | 5,321 (43.6%) |
| Professional & Scientific | 41,590 (59.8%) | 27,960 (40.2%) |
| Enterprise Management | 635 (52.0%) | 586 (48.0%) |
| Administrative & Support | 15,461 (56.8%) | 11,749 (43.2%) |
| Educational Services | 29,164 (36.5%) | 50,632 (63.4%) |
| Health Care & Social Assistance | 33,873 (25.4%) | 99,408 (74.6%) |
| Arts, Entertainment & Recreation | 7,754 (50.9%) | 7,468 (49.1%) |
| Accommodation & Food Services | 22,436 (47.6%) | 24,701 (52.4%) |
| Public Administration | 14,089 (55.7%) | 11,215 (44.3%) |
| Total | 398,545 (51.8%) | 370,473 (48.2%) |
Education in Area Code 412
School Enrollment in Area Code 412
The most common levels of schooling among the 330,563 students in Area Code 412 are college / undergraduate (79,041 | 23.9%), high school (64,114 | 19.4%), and elementary school (61,512 | 18.6%).
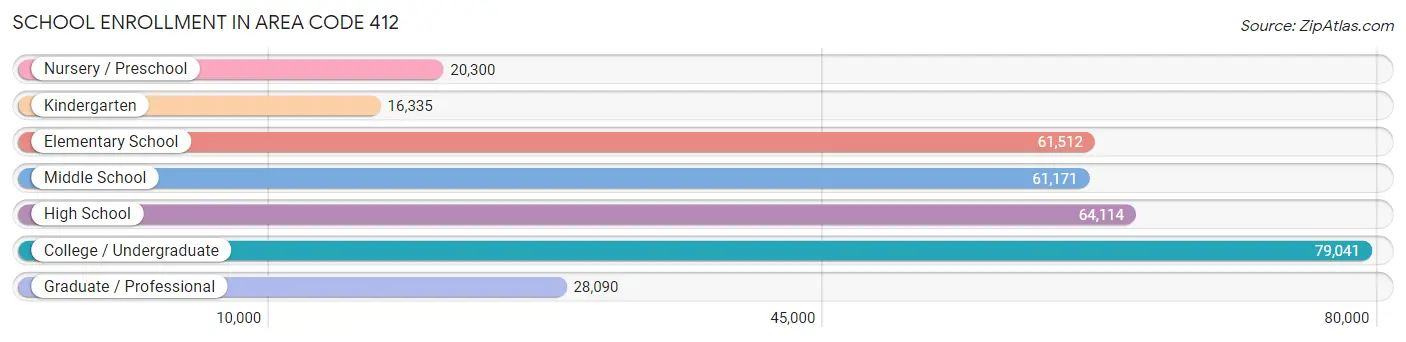
| School Level | # Students | % Students |
| Nursery / Preschool | 20,300 | 6.1% |
| Kindergarten | 16,335 | 4.9% |
| Elementary School | 61,512 | 18.6% |
| Middle School | 61,171 | 18.5% |
| High School | 64,114 | 19.4% |
| College / Undergraduate | 79,041 | 23.9% |
| Graduate / Professional | 28,090 | 8.5% |
| Total | 330,563 | 100.0% |
School Enrollment by Age by Funding Source in Area Code 412
Out of a total of 330,563 students who are enrolled in schools in Area Code 412, 79,160 (23.9%) attend a private institution, while the remaining 251,403 (76.0%) are enrolled in public schools. The age group of 3 to 4 year olds has the highest likelihood of being enrolled in private schools, with 7,638 (51.2% in the age bracket) enrolled. Conversely, the age group of 15 to 17 year olds has the lowest likelihood of being enrolled in a private school, with 41,610 (88.1% in the age bracket) attending a public institution.
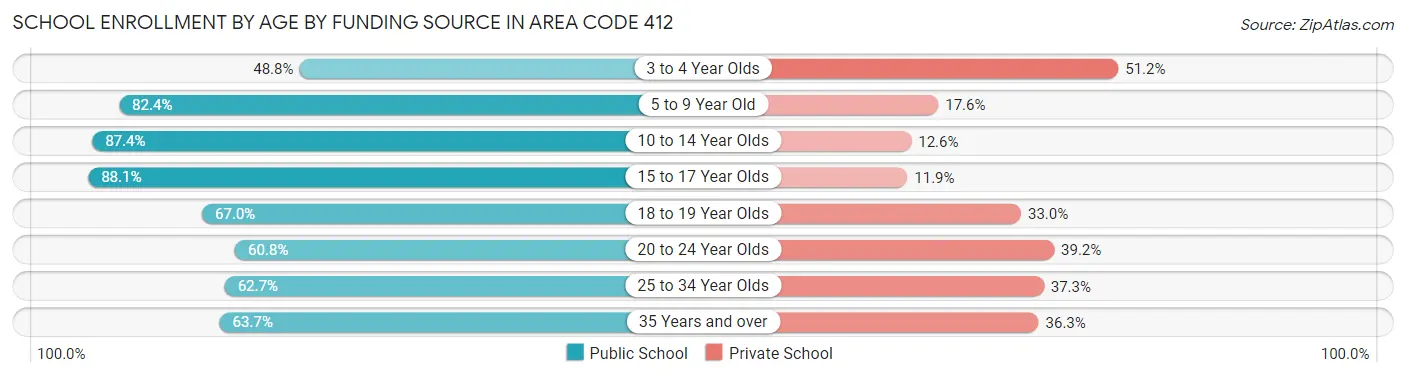
| Age Bracket | Public School | Private School |
| 3 to 4 Year Olds | 7,293 (48.8%) | 7,638 (51.2%) |
| 5 to 9 Year Old | 60,982 (82.4%) | 13,044 (17.6%) |
| 10 to 14 Year Olds | 66,777 (87.4%) | 9,623 (12.6%) |
| 15 to 17 Year Olds | 41,610 (88.1%) | 5,599 (11.9%) |
| 18 to 19 Year Olds | 23,021 (67.0%) | 11,361 (33.0%) |
| 20 to 24 Year Olds | 27,917 (60.8%) | 17,997 (39.2%) |
| 25 to 34 Year Olds | 14,424 (62.7%) | 8,575 (37.3%) |
| 35 Years and over | 9,364 (63.7%) | 5,338 (36.3%) |
| Total | 251,403 (76.0%) | 79,160 (23.9%) |
Educational Attainment by Field of Study in Area Code 412
Business (94,732 | 19.0%), education (54,217 | 10.9%), science & technology (50,638 | 10.2%), engineering (39,070 | 7.8%), and social sciences (38,399 | 7.7%) are the most common fields of study among 498,094 individuals in Area Code 412 who have obtained a bachelor's degree or higher.
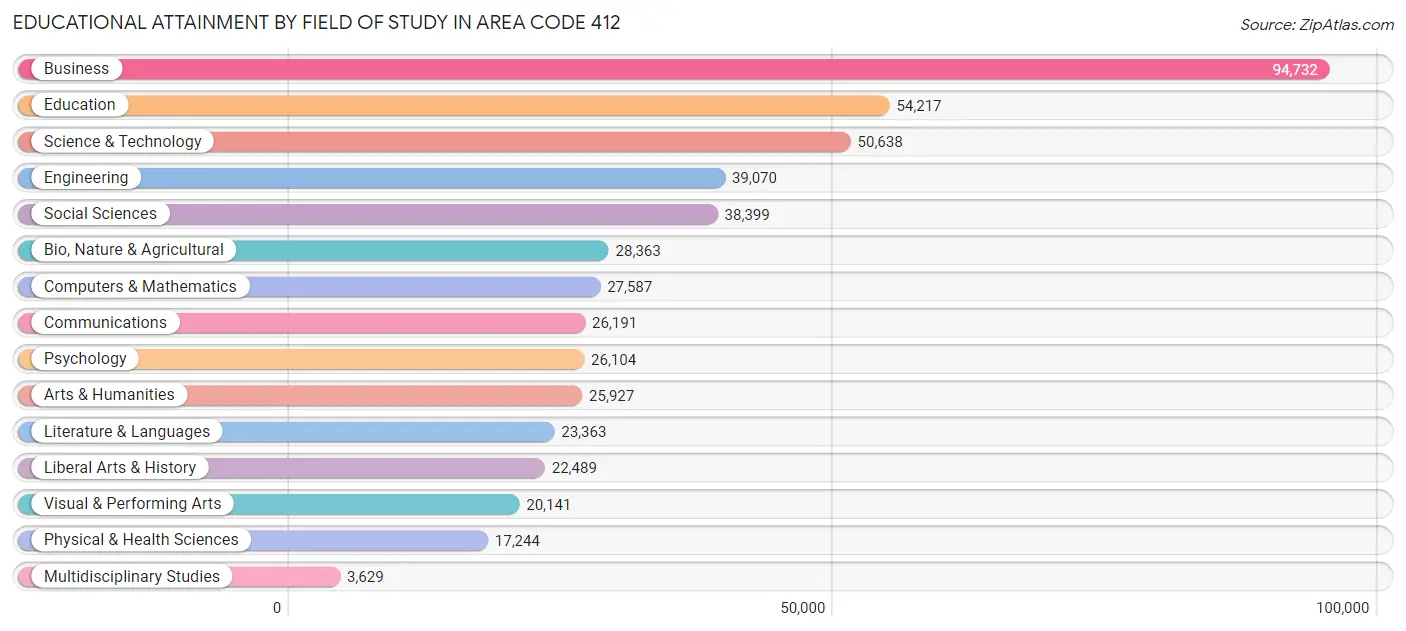
| Field of Study | # Graduates | % Graduates |
| Computers & Mathematics | 27,587 | 5.5% |
| Bio, Nature & Agricultural | 28,363 | 5.7% |
| Physical & Health Sciences | 17,244 | 3.5% |
| Psychology | 26,104 | 5.2% |
| Social Sciences | 38,399 | 7.7% |
| Engineering | 39,070 | 7.8% |
| Multidisciplinary Studies | 3,629 | 0.7% |
| Science & Technology | 50,638 | 10.2% |
| Business | 94,732 | 19.0% |
| Education | 54,217 | 10.9% |
| Literature & Languages | 23,363 | 4.7% |
| Liberal Arts & History | 22,489 | 4.5% |
| Visual & Performing Arts | 20,141 | 4.0% |
| Communications | 26,191 | 5.3% |
| Arts & Humanities | 25,927 | 5.2% |
| Total | 498,094 | 100.0% |
Transportation & Commute in Area Code 412
Vehicle Availability by Sex in Area Code 412
The most prevalent vehicle ownership categories in Area Code 412 are males with 2 vehicles (176,089, accounting for 45.3%) and females with 2 vehicles (153,739, making up 49.4%).
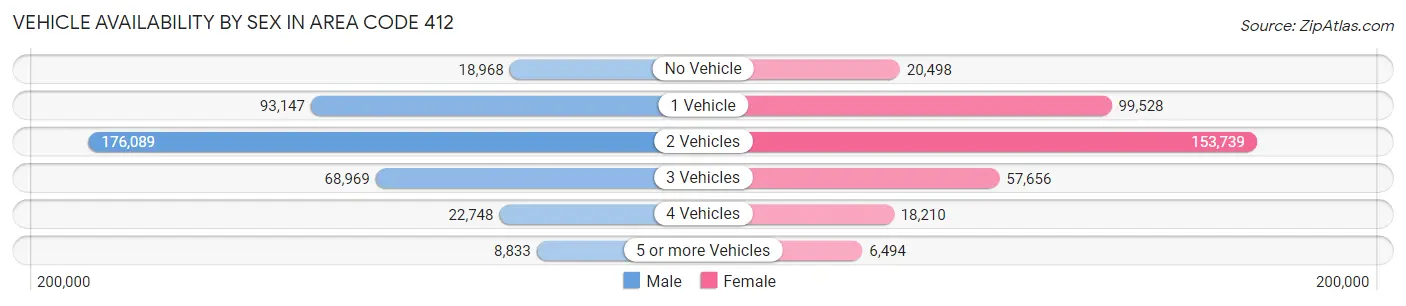
| Vehicles Available | Male | Female |
| No Vehicle | 18,968 (4.9%) | 20,498 (5.8%) |
| 1 Vehicle | 93,147 (24.0%) | 99,528 (28.0%) |
| 2 Vehicles | 176,089 (45.3%) | 153,739 (43.2%) |
| 3 Vehicles | 68,969 (17.7%) | 57,656 (16.2%) |
| 4 Vehicles | 22,748 (5.9%) | 18,210 (5.1%) |
| 5 or more Vehicles | 8,833 (2.3%) | 6,494 (1.8%) |
| Total | 388,754 (100.0%) | 356,125 (100.0%) |
Commute Time in Area Code 412
The most frequently occuring commute durations in Area Code 412 are 15 to 19 minutes (97,544 commuters, 15.1%), 20 to 24 minutes (93,194 commuters, 14.5%), and 30 to 34 minutes (92,639 commuters, 14.4%).
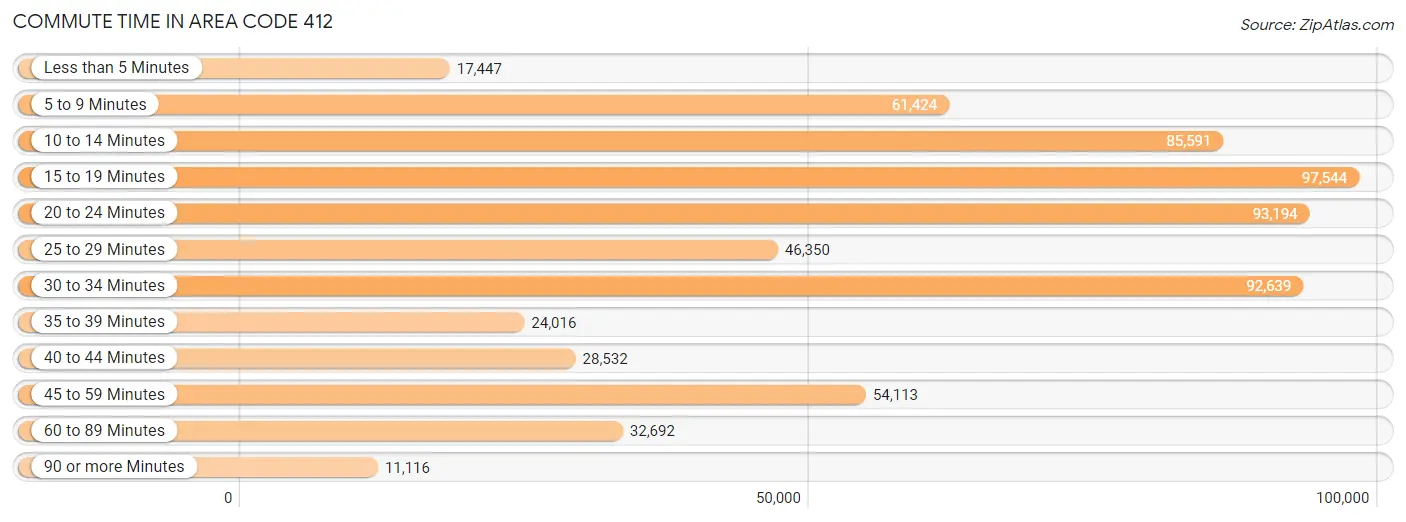
| Commute Time | # Commuters | % Commuters |
| Less than 5 Minutes | 17,447 | 2.7% |
| 5 to 9 Minutes | 61,424 | 9.5% |
| 10 to 14 Minutes | 85,591 | 13.3% |
| 15 to 19 Minutes | 97,544 | 15.1% |
| 20 to 24 Minutes | 93,194 | 14.5% |
| 25 to 29 Minutes | 46,350 | 7.2% |
| 30 to 34 Minutes | 92,639 | 14.4% |
| 35 to 39 Minutes | 24,016 | 3.7% |
| 40 to 44 Minutes | 28,532 | 4.4% |
| 45 to 59 Minutes | 54,113 | 8.4% |
| 60 to 89 Minutes | 32,692 | 5.1% |
| 90 or more Minutes | 11,116 | 1.7% |
Commute Time by Sex in Area Code 412
The most common commute times in Area Code 412 are 30 to 34 minutes (51,340 commuters, 15.1%) for males and 15 to 19 minutes (49,310 commuters, 16.2%) for females.
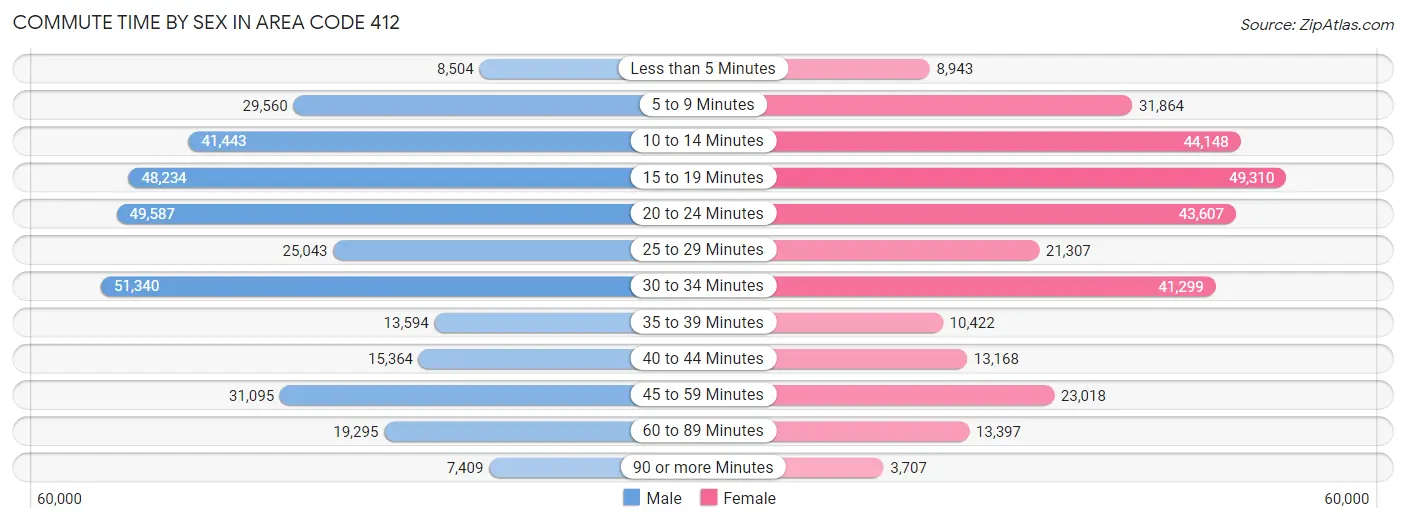
| Commute Time | Male | Female |
| Less than 5 Minutes | 8,504 (2.5%) | 8,943 (2.9%) |
| 5 to 9 Minutes | 29,560 (8.7%) | 31,864 (10.5%) |
| 10 to 14 Minutes | 41,443 (12.2%) | 44,148 (14.5%) |
| 15 to 19 Minutes | 48,234 (14.2%) | 49,310 (16.2%) |
| 20 to 24 Minutes | 49,587 (14.6%) | 43,607 (14.3%) |
| 25 to 29 Minutes | 25,043 (7.4%) | 21,307 (7.0%) |
| 30 to 34 Minutes | 51,340 (15.1%) | 41,299 (13.6%) |
| 35 to 39 Minutes | 13,594 (4.0%) | 10,422 (3.4%) |
| 40 to 44 Minutes | 15,364 (4.5%) | 13,168 (4.3%) |
| 45 to 59 Minutes | 31,095 (9.1%) | 23,018 (7.6%) |
| 60 to 89 Minutes | 19,295 (5.7%) | 13,397 (4.4%) |
| 90 or more Minutes | 7,409 (2.2%) | 3,707 (1.2%) |
Time of Departure to Work by Sex in Area Code 412
The most frequent times of departure to work in Area Code 412 are 7:00 AM to 7:29 AM (44,622, 13.1%) for males and 7:00 AM to 7:29 AM (43,475, 14.3%) for females.
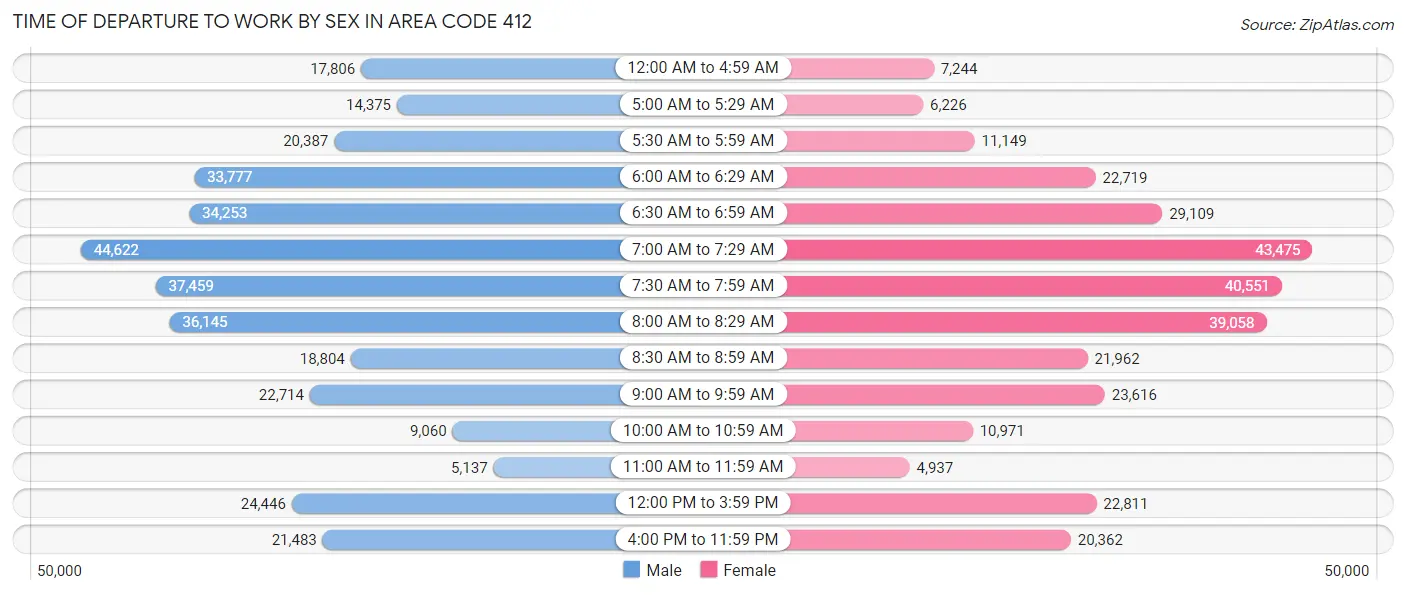
| Time of Departure | Male | Female |
| 12:00 AM to 4:59 AM | 17,806 (5.2%) | 7,244 (2.4%) |
| 5:00 AM to 5:29 AM | 14,375 (4.2%) | 6,226 (2.1%) |
| 5:30 AM to 5:59 AM | 20,387 (6.0%) | 11,149 (3.7%) |
| 6:00 AM to 6:29 AM | 33,777 (9.9%) | 22,719 (7.5%) |
| 6:30 AM to 6:59 AM | 34,253 (10.1%) | 29,109 (9.6%) |
| 7:00 AM to 7:29 AM | 44,622 (13.1%) | 43,475 (14.3%) |
| 7:30 AM to 7:59 AM | 37,459 (11.0%) | 40,551 (13.3%) |
| 8:00 AM to 8:29 AM | 36,145 (10.6%) | 39,058 (12.8%) |
| 8:30 AM to 8:59 AM | 18,804 (5.5%) | 21,962 (7.2%) |
| 9:00 AM to 9:59 AM | 22,714 (6.7%) | 23,616 (7.8%) |
| 10:00 AM to 10:59 AM | 9,060 (2.7%) | 10,971 (3.6%) |
| 11:00 AM to 11:59 AM | 5,137 (1.5%) | 4,937 (1.6%) |
| 12:00 PM to 3:59 PM | 24,446 (7.2%) | 22,811 (7.5%) |
| 4:00 PM to 11:59 PM | 21,483 (6.3%) | 20,362 (6.7%) |
| Total | 340,468 (100.0%) | 304,190 (100.0%) |
Housing Occupancy in Area Code 412
Occupancy by Ownership in Area Code 412
Of the total 669,339 dwellings in Area Code 412, owner-occupied units account for 440,233 (65.8%), while renter-occupied units make up 229,106 (34.2%).
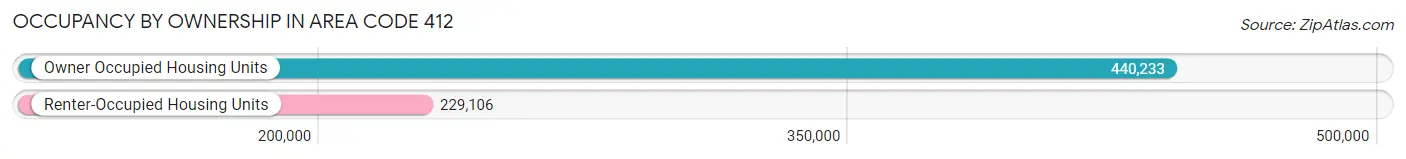
| Occupancy | # Housing Units | % Housing Units |
| Owner Occupied Housing Units | 440,233 | 65.8% |
| Renter-Occupied Housing Units | 229,106 | 34.2% |
| Total Occupied Housing Units | 669,339 | 100.0% |
Occupancy by Household Size in Area Code 412
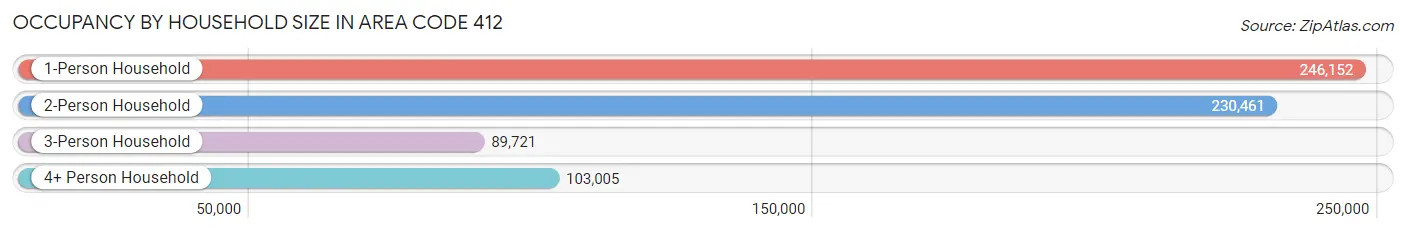
| Household Size | # Housing Units | % Housing Units |
| 1-Person Household | 246,152 | 36.8% |
| 2-Person Household | 230,461 | 34.4% |
| 3-Person Household | 89,721 | 13.4% |
| 4+ Person Household | 103,005 | 15.4% |
| Total Housing Units | 669,339 | 100.0% |
Occupancy by Ownership by Household Size in Area Code 412
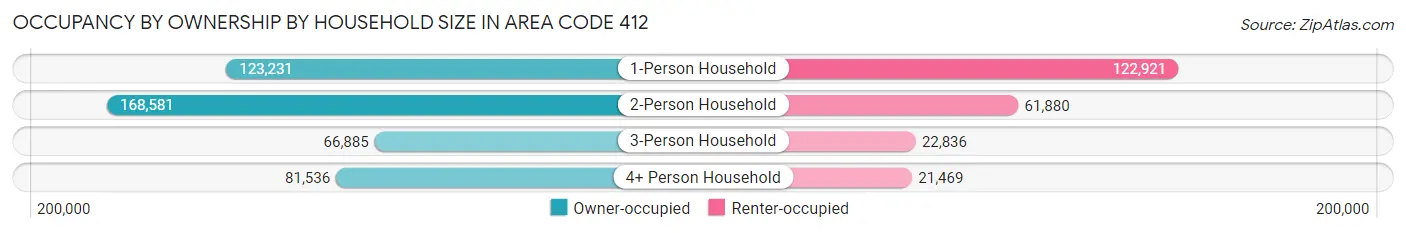
| Household Size | Owner-occupied | Renter-occupied |
| 1-Person Household | 123,231 (50.1%) | 122,921 (49.9%) |
| 2-Person Household | 168,581 (73.2%) | 61,880 (26.9%) |
| 3-Person Household | 66,885 (74.6%) | 22,836 (25.5%) |
| 4+ Person Household | 81,536 (79.2%) | 21,469 (20.8%) |
| Total Housing Units | 440,233 (65.8%) | 229,106 (34.2%) |
Occupancy by Educational Attainment in Area Code 412
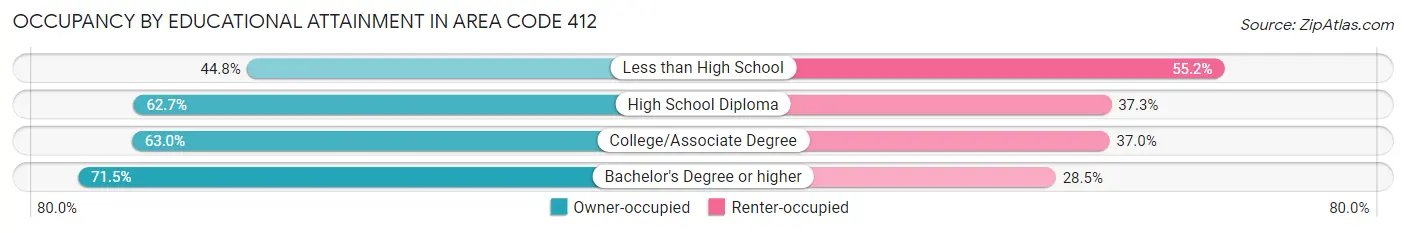
| Household Size | Owner-occupied | Renter-occupied |
| Less than High School | 13,194 (44.8%) | 16,256 (55.2%) |
| High School Diploma | 106,971 (62.7%) | 63,584 (37.3%) |
| College/Associate Degree | 115,089 (63.0%) | 67,642 (37.0%) |
| Bachelor's Degree or higher | 204,979 (71.5%) | 81,624 (28.5%) |
Occupancy by Age of Householder in Area Code 412
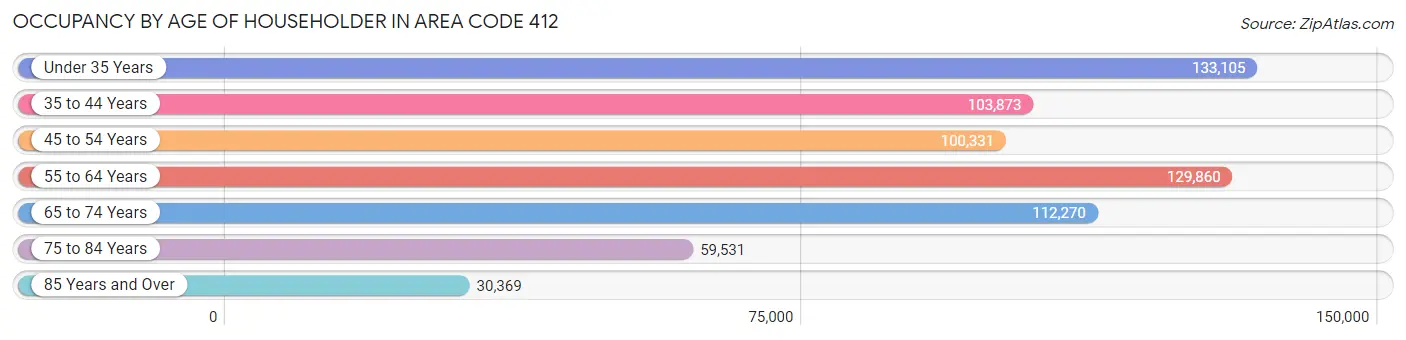
| Age Bracket | # Households | % Households |
| Under 35 Years | 133,105 | 19.9% |
| 35 to 44 Years | 103,873 | 15.5% |
| 45 to 54 Years | 100,331 | 15.0% |
| 55 to 64 Years | 129,860 | 19.4% |
| 65 to 74 Years | 112,270 | 16.8% |
| 75 to 84 Years | 59,531 | 8.9% |
| 85 Years and Over | 30,369 | 4.5% |
| Total | 669,339 | 100.0% |
Housing Finances in Area Code 412
Median Income by Occupancy in Area Code 412
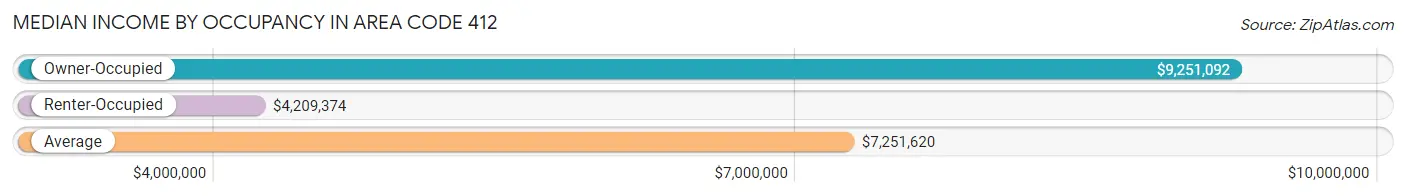
| Occupancy Type | # Households | Median Income |
| Owner-Occupied | 440,233 (65.8%) | $9,251,092 |
| Renter-Occupied | 229,106 (34.2%) | $4,209,374 |
| Average | 669,339 (100.0%) | $7,251,620 |
Occupancy by Householder Income Bracket in Area Code 412
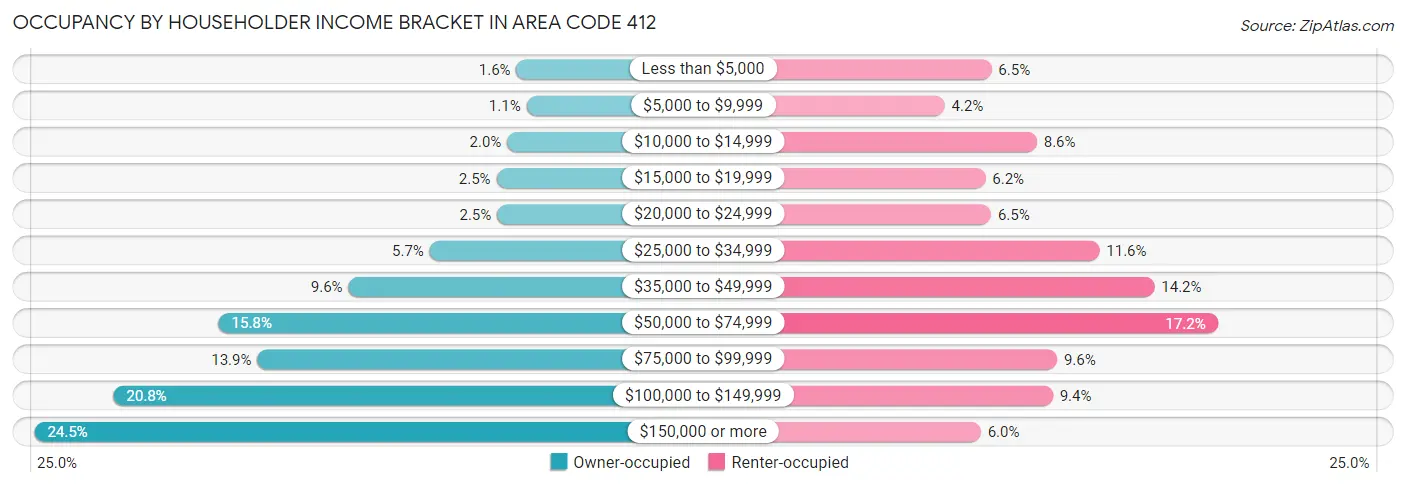
| Income Bracket | Owner-occupied | Renter-occupied |
| Less than $5,000 | 6,944 (1.6%) | 14,828 (6.5%) |
| $5,000 to $9,999 | 4,846 (1.1%) | 9,715 (4.2%) |
| $10,000 to $14,999 | 8,897 (2.0%) | 19,777 (8.6%) |
| $15,000 to $19,999 | 11,122 (2.5%) | 14,170 (6.2%) |
| $20,000 to $24,999 | 11,022 (2.5%) | 14,772 (6.5%) |
| $25,000 to $34,999 | 25,138 (5.7%) | 26,595 (11.6%) |
| $35,000 to $49,999 | 42,179 (9.6%) | 32,592 (14.2%) |
| $50,000 to $74,999 | 69,372 (15.8%) | 39,506 (17.2%) |
| $75,000 to $99,999 | 61,282 (13.9%) | 21,969 (9.6%) |
| $100,000 to $149,999 | 91,439 (20.8%) | 21,521 (9.4%) |
| $150,000 or more | 107,992 (24.5%) | 13,661 (6.0%) |
| Total | 440,233 (100.0%) | 229,106 (100.0%) |
Monthly Housing Cost Tiers in Area Code 412
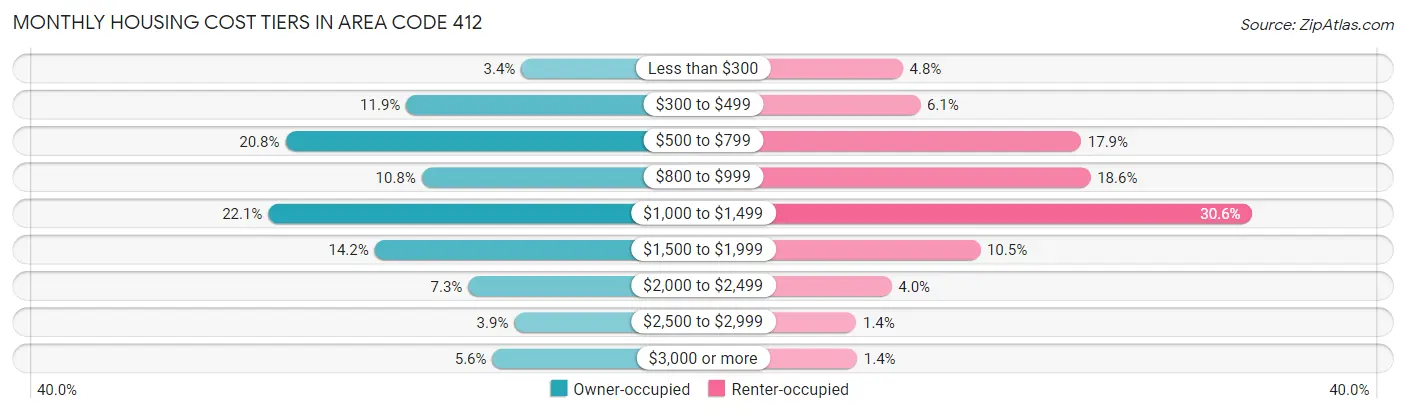
| Monthly Cost | Owner-occupied | Renter-occupied |
| Less than $300 | 15,109 (3.4%) | 10,991 (4.8%) |
| $300 to $499 | 52,385 (11.9%) | 13,926 (6.1%) |
| $500 to $799 | 91,557 (20.8%) | 41,070 (17.9%) |
| $800 to $999 | 47,351 (10.8%) | 42,659 (18.6%) |
| $1,000 to $1,499 | 97,127 (22.1%) | 70,013 (30.6%) |
| $1,500 to $1,999 | 62,653 (14.2%) | 24,060 (10.5%) |
| $2,000 to $2,499 | 32,274 (7.3%) | 9,105 (4.0%) |
| $2,500 to $2,999 | 17,340 (3.9%) | 3,131 (1.4%) |
| $3,000 or more | 24,437 (5.6%) | 3,269 (1.4%) |
| Total | 440,233 (100.0%) | 229,106 (100.0%) |
Physical Housing Characteristics in Area Code 412
Housing Structures in Area Code 412
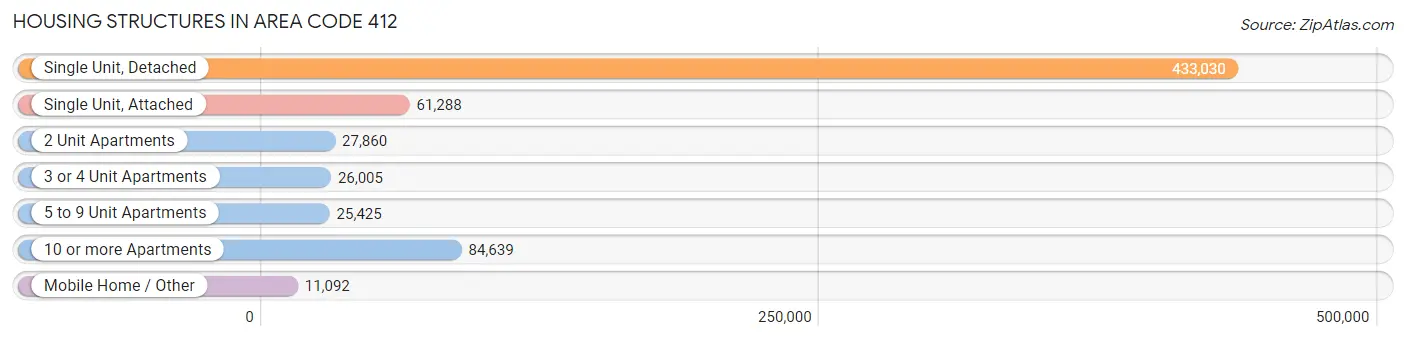
| Structure Type | # Housing Units | % Housing Units |
| Single Unit, Detached | 433,030 | 64.7% |
| Single Unit, Attached | 61,288 | 9.2% |
| 2 Unit Apartments | 27,860 | 4.2% |
| 3 or 4 Unit Apartments | 26,005 | 3.9% |
| 5 to 9 Unit Apartments | 25,425 | 3.8% |
| 10 or more Apartments | 84,639 | 12.7% |
| Mobile Home / Other | 11,092 | 1.7% |
| Total | 669,339 | 100.0% |
Housing Structures by Occupancy in Area Code 412
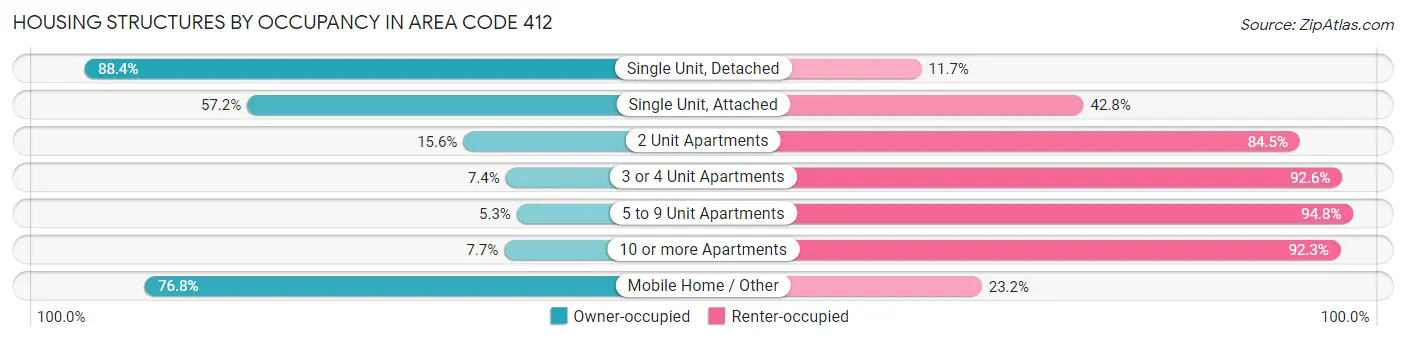
| Structure Type | Owner-occupied | Renter-occupied |
| Single Unit, Detached | 382,587 (88.3%) | 50,443 (11.7%) |
| Single Unit, Attached | 35,038 (57.2%) | 26,250 (42.8%) |
| 2 Unit Apartments | 4,331 (15.5%) | 23,529 (84.5%) |
| 3 or 4 Unit Apartments | 1,921 (7.4%) | 24,084 (92.6%) |
| 5 to 9 Unit Apartments | 1,336 (5.2%) | 24,089 (94.8%) |
| 10 or more Apartments | 6,504 (7.7%) | 78,135 (92.3%) |
| Mobile Home / Other | 8,516 (76.8%) | 2,576 (23.2%) |
| Total | 440,233 (65.8%) | 229,106 (34.2%) |
Housing Structures by Number of Rooms in Area Code 412
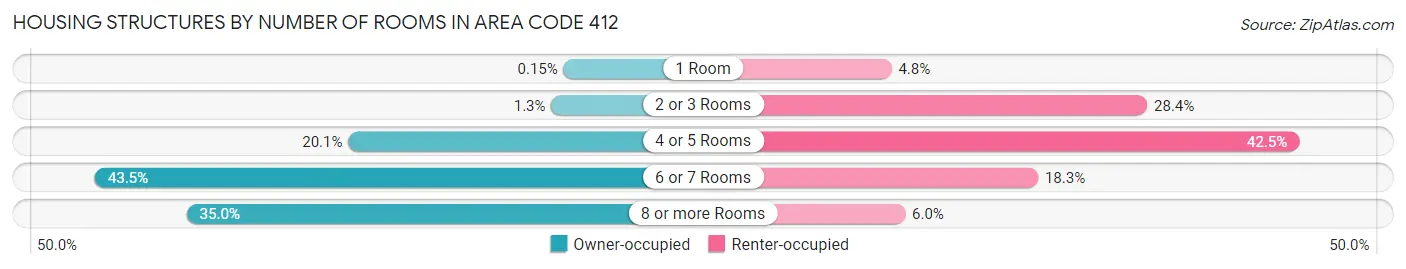
| Number of Rooms | Owner-occupied | Renter-occupied |
| 1 Room | 665 (0.2%) | 10,938 (4.8%) |
| 2 or 3 Rooms | 5,629 (1.3%) | 65,089 (28.4%) |
| 4 or 5 Rooms | 88,315 (20.1%) | 97,277 (42.5%) |
| 6 or 7 Rooms | 191,511 (43.5%) | 41,977 (18.3%) |
| 8 or more Rooms | 154,113 (35.0%) | 13,825 (6.0%) |
| Total | 440,233 (100.0%) | 229,106 (100.0%) |
Housing Structure by Heating Type in Area Code 412
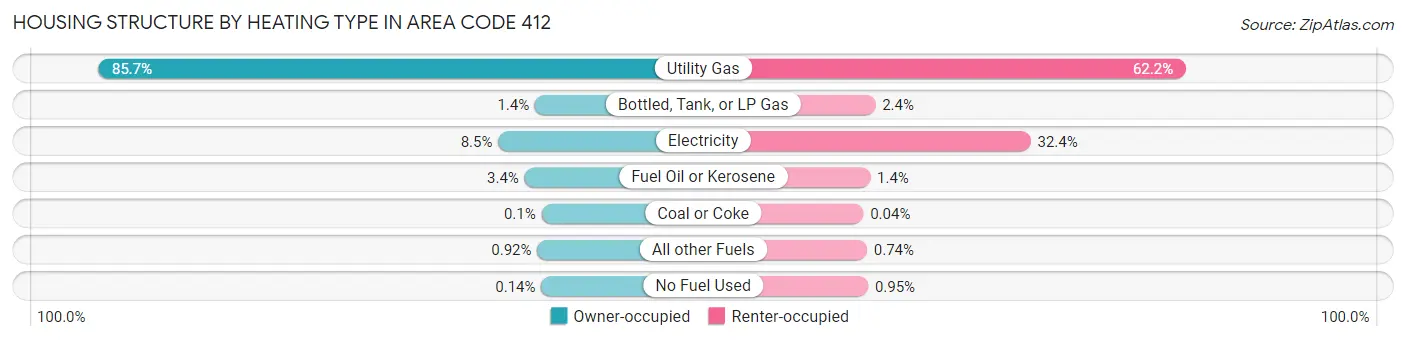
| Heating Type | Owner-occupied | Renter-occupied |
| Utility Gas | 377,045 (85.7%) | 142,493 (62.2%) |
| Bottled, Tank, or LP Gas | 6,022 (1.4%) | 5,379 (2.4%) |
| Electricity | 37,255 (8.5%) | 74,161 (32.4%) |
| Fuel Oil or Kerosene | 14,821 (3.4%) | 3,112 (1.4%) |
| Coal or Coke | 427 (0.1%) | 91 (0.0%) |
| All other Fuels | 4,036 (0.9%) | 1,689 (0.7%) |
| No Fuel Used | 627 (0.1%) | 2,181 (0.9%) |
| Total | 440,233 (100.0%) | 229,106 (100.0%) |
Household Vehicle Usage in Area Code 412
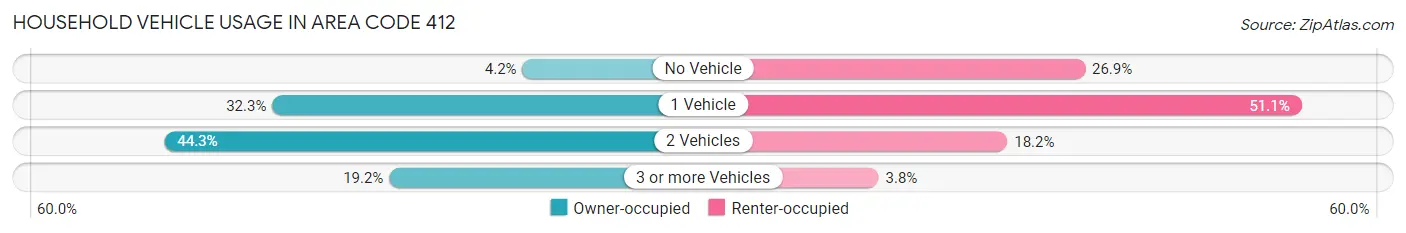
| Vehicles per Household | Owner-occupied | Renter-occupied |
| No Vehicle | 18,632 (4.2%) | 61,634 (26.9%) |
| 1 Vehicle | 142,023 (32.3%) | 117,163 (51.1%) |
| 2 Vehicles | 195,212 (44.3%) | 41,675 (18.2%) |
| 3 or more Vehicles | 84,366 (19.2%) | 8,634 (3.8%) |
| Total | 440,233 (100.0%) | 229,106 (100.0%) |
Real Estate & Mortgages in Area Code 412
Real Estate and Mortgage Overview in Area Code 412
| Characteristic | Without Mortgage | With Mortgage |
| Housing Units | 187,668 | 252,565 |
| Median Property Value | $17,701,600 | $20,892,299 |
| Median Household Income | $7,005,269 | $77,512 |
| Monthly Housing Costs | $60,427 | $23,751 |
| Real Estate Taxes | $278,987 | $3,931 |
Property Value by Mortgage Status in Area Code 412
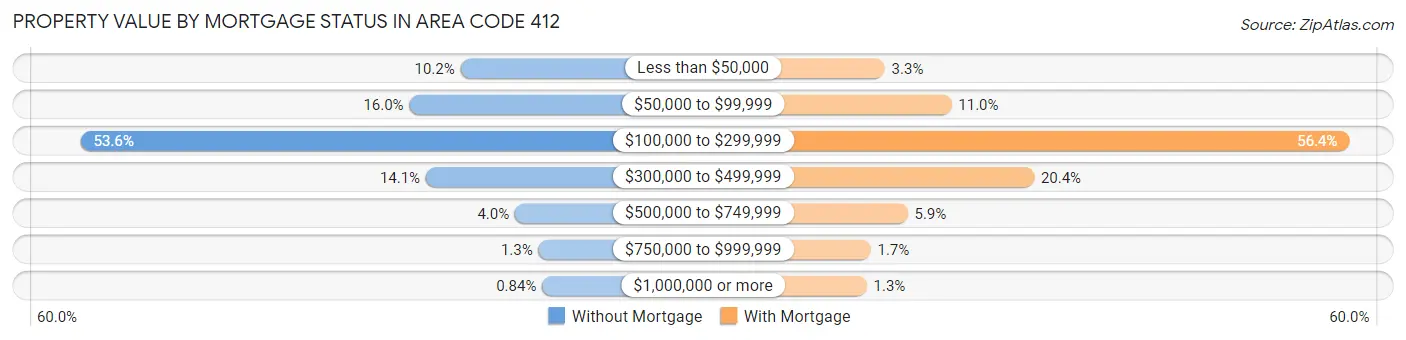
| Property Value | Without Mortgage | With Mortgage |
| Less than $50,000 | 19,109 (10.2%) | 8,409 (3.3%) |
| $50,000 to $99,999 | 30,064 (16.0%) | 27,663 (11.0%) |
| $100,000 to $299,999 | 100,606 (53.6%) | 142,514 (56.4%) |
| $300,000 to $499,999 | 26,524 (14.1%) | 51,488 (20.4%) |
| $500,000 to $749,999 | 7,408 (4.0%) | 14,997 (5.9%) |
| $750,000 to $999,999 | 2,374 (1.3%) | 4,308 (1.7%) |
| $1,000,000 or more | 1,583 (0.8%) | 3,186 (1.3%) |
| Total | 187,668 (100.0%) | 252,565 (100.0%) |
Household Income by Mortgage Status in Area Code 412
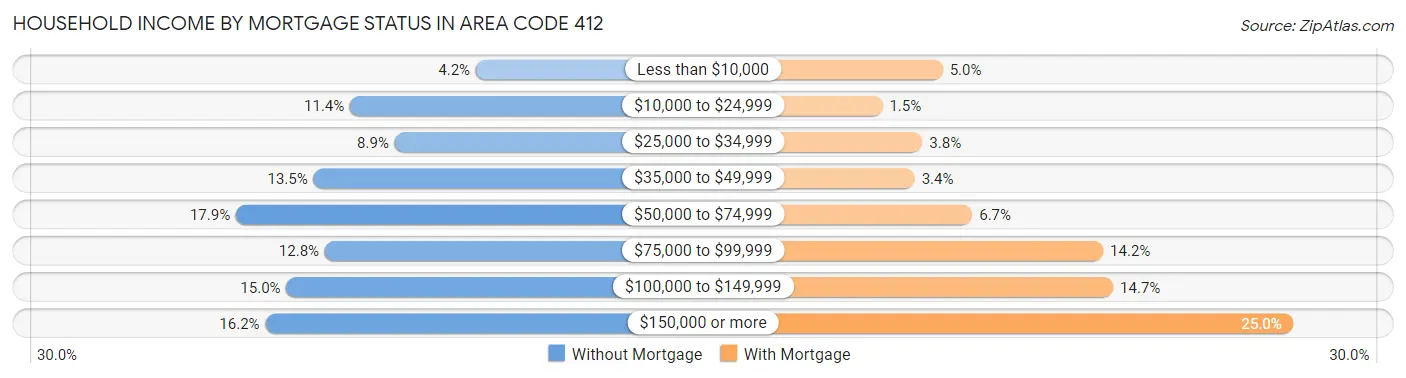
| Household Income | Without Mortgage | With Mortgage |
| Less than $10,000 | 7,896 (4.2%) | 12,577 (5.0%) |
| $10,000 to $24,999 | 21,399 (11.4%) | 3,894 (1.5%) |
| $25,000 to $34,999 | 16,602 (8.8%) | 9,642 (3.8%) |
| $35,000 to $49,999 | 25,324 (13.5%) | 8,536 (3.4%) |
| $50,000 to $74,999 | 33,636 (17.9%) | 16,855 (6.7%) |
| $75,000 to $99,999 | 24,103 (12.8%) | 35,736 (14.1%) |
| $100,000 to $149,999 | 28,228 (15.0%) | 37,179 (14.7%) |
| $150,000 or more | 30,480 (16.2%) | 63,211 (25.0%) |
| Total | 187,668 (100.0%) | 252,565 (100.0%) |
Property Value to Household Income Ratio in Area Code 412
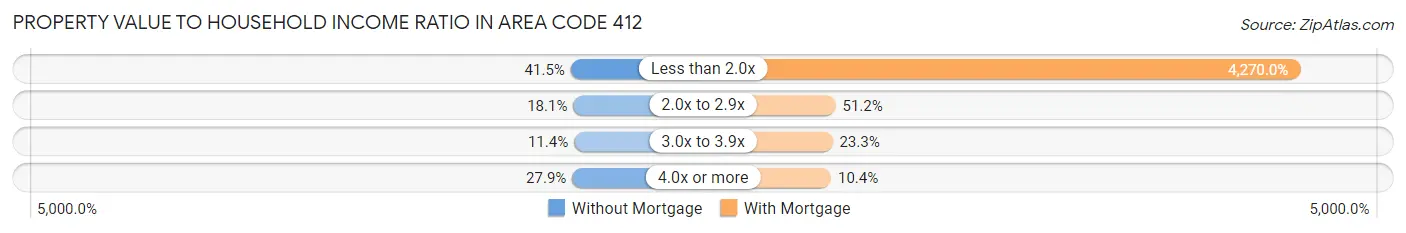
| Value-to-Income Ratio | Without Mortgage | With Mortgage |
| Less than 2.0x | 77,859 (41.5%) | 10,784,417 (4,270.0%) |
| 2.0x to 2.9x | 33,885 (18.1%) | 129,407 (51.2%) |
| 3.0x to 3.9x | 21,414 (11.4%) | 58,741 (23.3%) |
| 4.0x or more | 52,345 (27.9%) | 26,359 (10.4%) |
| Total | 187,668 (100.0%) | 252,565 (100.0%) |
Real Estate Taxes by Mortgage Status in Area Code 412
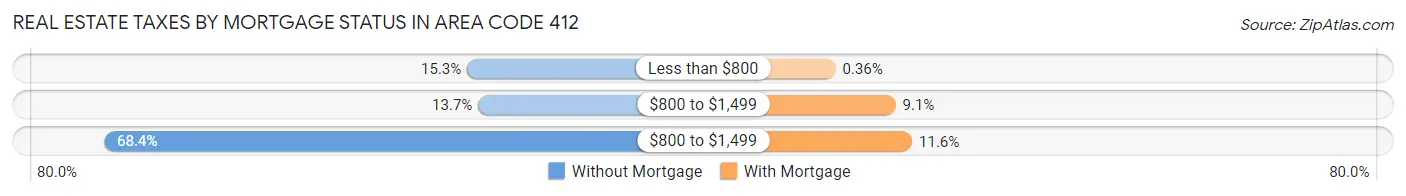
| Property Taxes | Without Mortgage | With Mortgage |
| Less than $800 | 28,786 (15.3%) | 903 (0.4%) |
| $800 to $1,499 | 25,771 (13.7%) | 23,087 (9.1%) |
| $800 to $1,499 | 128,322 (68.4%) | 29,177 (11.6%) |
| Total | 187,668 (100.0%) | 252,565 (100.0%) |
Health & Disability in Area Code 412
Health Insurance Coverage by Age in Area Code 412
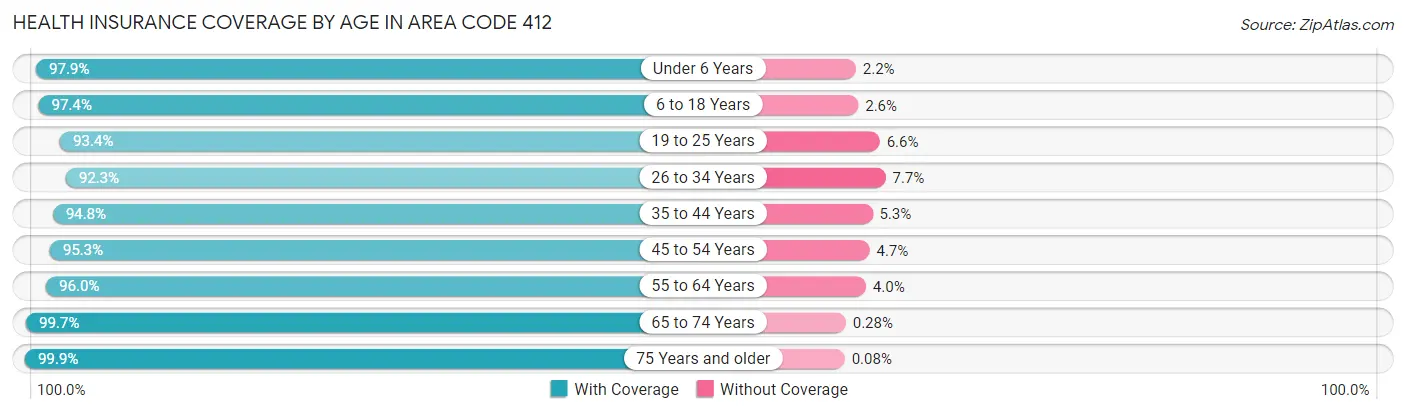
| Age Bracket | With Coverage | Without Coverage |
| Under 6 Years | 91,327 (97.9%) | 2,008 (2.1%) |
| 6 to 18 Years | 203,897 (97.4%) | 5,465 (2.6%) |
| 19 to 25 Years | 127,331 (93.4%) | 9,005 (6.6%) |
| 26 to 34 Years | 183,967 (92.3%) | 15,336 (7.7%) |
| 35 to 44 Years | 177,070 (94.8%) | 9,804 (5.2%) |
| 45 to 54 Years | 166,616 (95.3%) | 8,227 (4.7%) |
| 55 to 64 Years | 203,874 (96.0%) | 8,556 (4.0%) |
| 65 to 74 Years | 171,153 (99.7%) | 472 (0.3%) |
| 75 Years and older | 124,850 (99.9%) | 104 (0.1%) |
| Total | 1,450,085 (96.1%) | 58,977 (3.9%) |
Health Insurance Coverage by Citizenship Status in Area Code 412
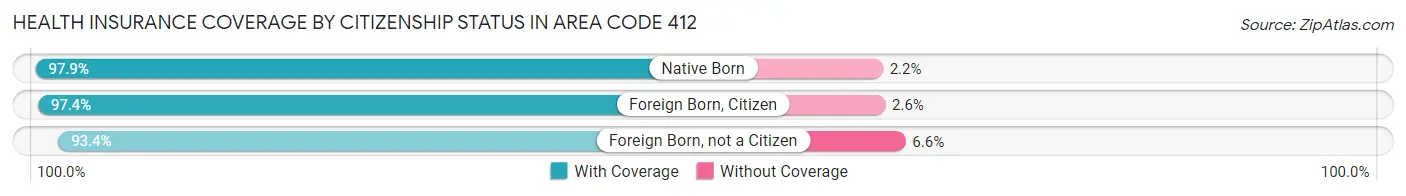
| Citizenship Status | With Coverage | Without Coverage |
| Native Born | 91,327 (97.9%) | 2,008 (2.1%) |
| Foreign Born, Citizen | 203,897 (97.4%) | 5,465 (2.6%) |
| Foreign Born, not a Citizen | 127,331 (93.4%) | 9,005 (6.6%) |
Health Insurance Coverage by Household Income in Area Code 412
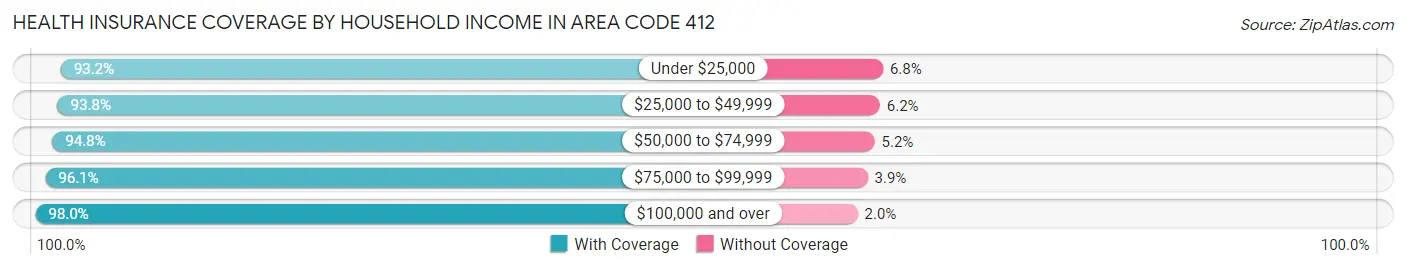
| Household Income | With Coverage | Without Coverage |
| Under $25,000 | 163,971 (93.2%) | 11,922 (6.8%) |
| $25,000 to $49,999 | 207,213 (93.8%) | 13,678 (6.2%) |
| $50,000 to $74,999 | 207,725 (94.8%) | 11,416 (5.2%) |
| $75,000 to $99,999 | 187,629 (96.1%) | 7,592 (3.9%) |
| $100,000 and over | 654,072 (98.0%) | 13,522 (2.0%) |
Public vs Private Health Insurance Coverage by Age in Area Code 412
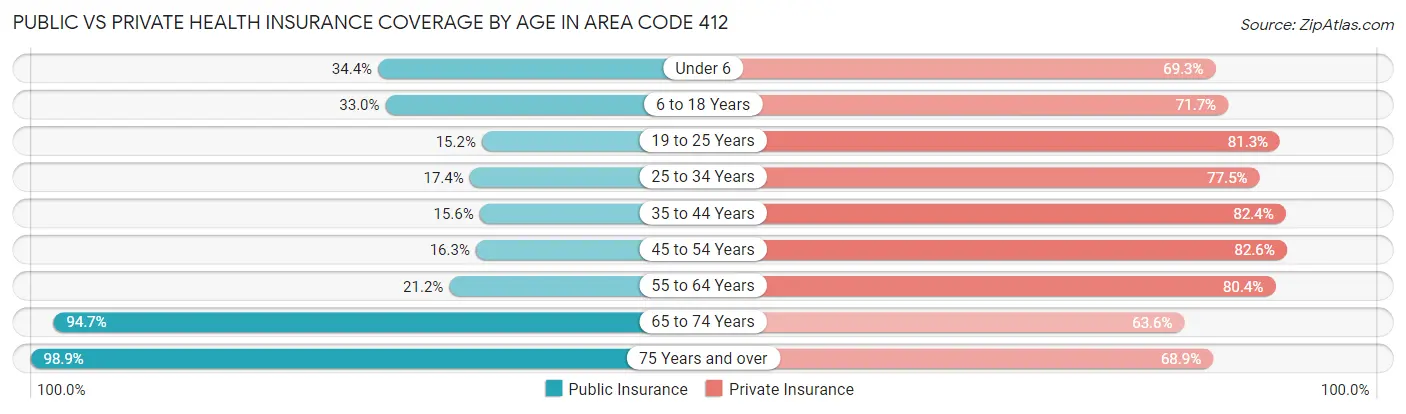
| Age Bracket | Public Insurance | Private Insurance |
| Under 6 | 32,127 (34.4%) | 64,712 (69.3%) |
| 6 to 18 Years | 69,167 (33.0%) | 150,026 (71.7%) |
| 19 to 25 Years | 20,652 (15.1%) | 110,853 (81.3%) |
| 25 to 34 Years | 34,690 (17.4%) | 154,474 (77.5%) |
| 35 to 44 Years | 29,073 (15.6%) | 153,905 (82.4%) |
| 45 to 54 Years | 28,427 (16.3%) | 144,353 (82.6%) |
| 55 to 64 Years | 45,026 (21.2%) | 170,866 (80.4%) |
| 65 to 74 Years | 162,438 (94.7%) | 109,093 (63.6%) |
| 75 Years and over | 123,592 (98.9%) | 86,080 (68.9%) |
| Total | 545,192 (36.1%) | 1,144,362 (75.8%) |
Disability Status by Sex by Age in Area Code 412
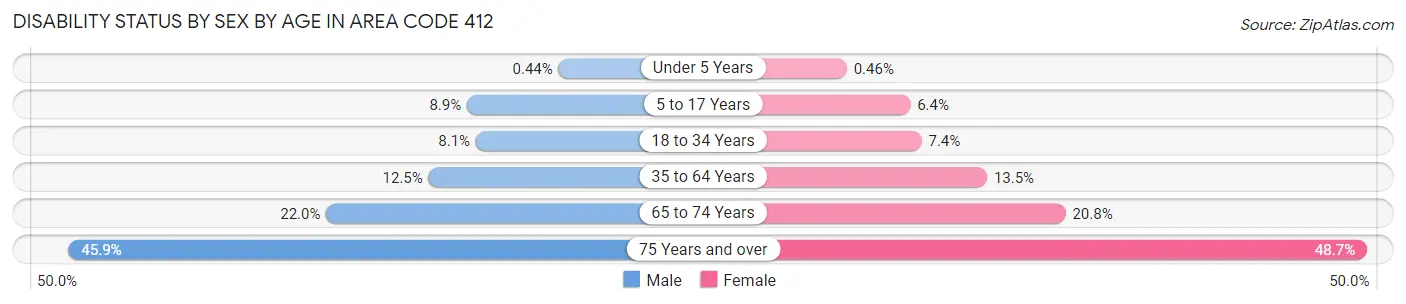
| Age Bracket | Male | Female |
| Under 5 Years | 174 (0.4%) | 177 (0.5%) |
| 5 to 17 Years | 9,363 (8.9%) | 6,356 (6.4%) |
| 18 to 34 Years | 14,574 (8.1%) | 13,057 (7.4%) |
| 35 to 64 Years | 35,540 (12.5%) | 39,086 (13.5%) |
| 65 to 74 Years | 17,629 (22.0%) | 18,996 (20.8%) |
| 75 Years and over | 22,024 (45.9%) | 37,535 (48.7%) |
Disability Class by Sex by Age in Area Code 412
Disability Class: Hearing Difficulty
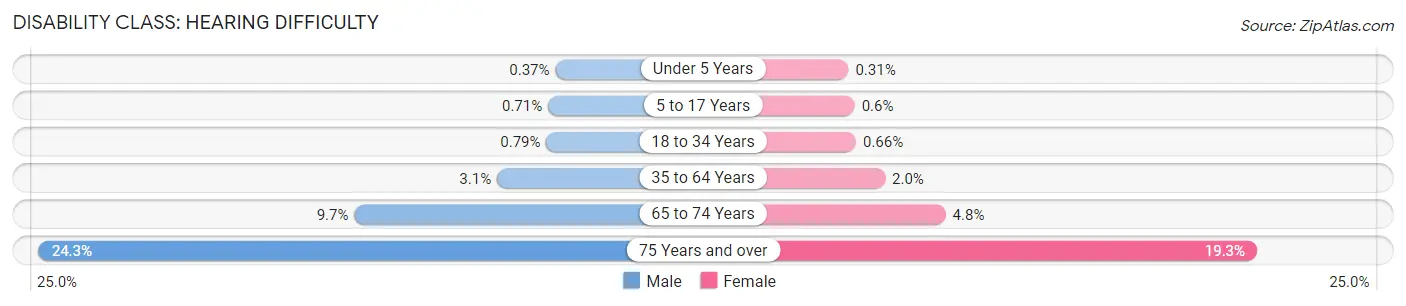
| Age Bracket | Male | Female |
| Under 5 Years | 144 (0.4%) | 120 (0.3%) |
| 5 to 17 Years | 743 (0.7%) | 599 (0.6%) |
| 18 to 34 Years | 1,424 (0.8%) | 1,157 (0.7%) |
| 35 to 64 Years | 8,738 (3.1%) | 5,818 (2.0%) |
| 65 to 74 Years | 7,770 (9.7%) | 4,413 (4.8%) |
| 75 Years and over | 11,668 (24.3%) | 14,832 (19.3%) |
Disability Class: Vision Difficulty
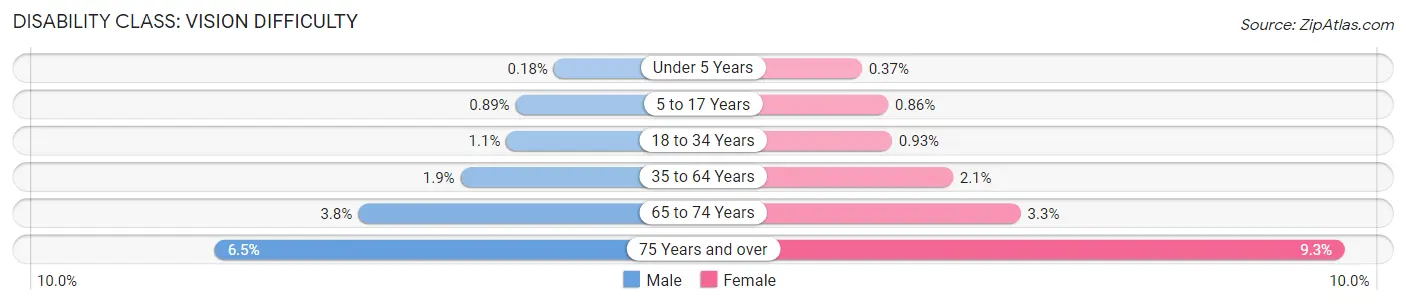
| Age Bracket | Male | Female |
| Under 5 Years | 70 (0.2%) | 141 (0.4%) |
| 5 to 17 Years | 936 (0.9%) | 858 (0.9%) |
| 18 to 34 Years | 1,909 (1.1%) | 1,633 (0.9%) |
| 35 to 64 Years | 5,433 (1.9%) | 5,971 (2.1%) |
| 65 to 74 Years | 3,049 (3.8%) | 3,036 (3.3%) |
| 75 Years and over | 3,104 (6.5%) | 7,177 (9.3%) |
Disability Class: Cognitive Difficulty
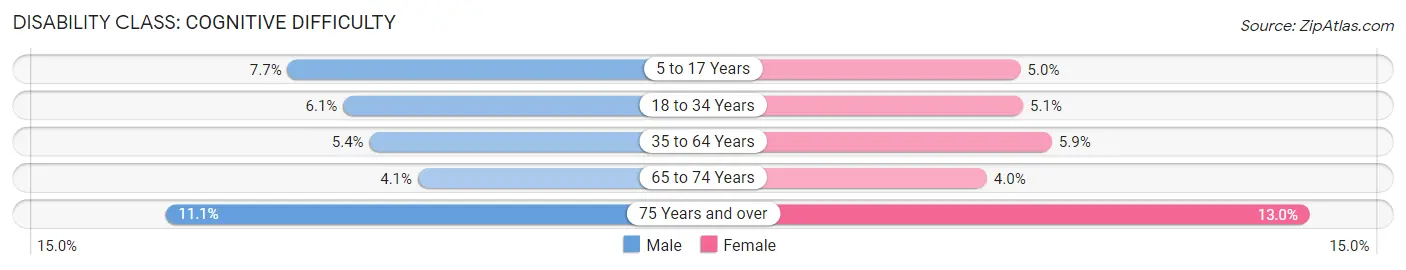
| Age Bracket | Male | Female |
| 5 to 17 Years | 8,048 (7.7%) | 4,987 (5.0%) |
| 18 to 34 Years | 11,011 (6.1%) | 8,904 (5.1%) |
| 35 to 64 Years | 15,331 (5.4%) | 16,983 (5.9%) |
| 65 to 74 Years | 3,247 (4.1%) | 3,695 (4.0%) |
| 75 Years and over | 5,312 (11.1%) | 10,036 (13.0%) |
Disability Class: Ambulatory Difficulty
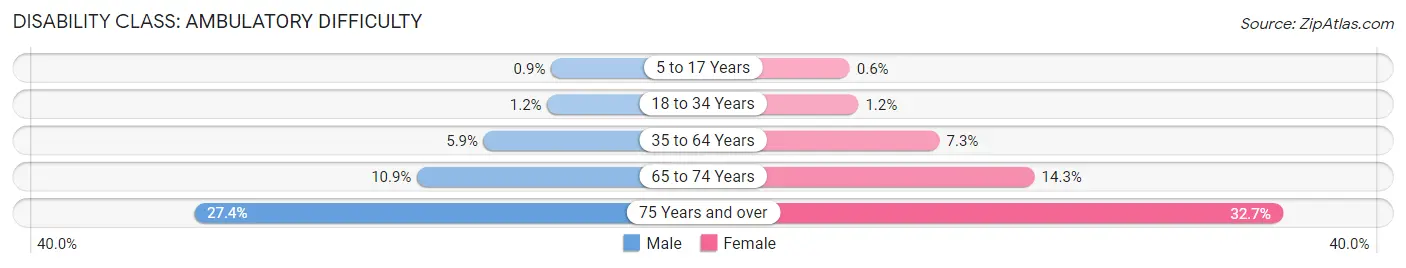
| Age Bracket | Male | Female |
| 5 to 17 Years | 944 (0.9%) | 600 (0.6%) |
| 18 to 34 Years | 2,111 (1.2%) | 2,192 (1.2%) |
| 35 to 64 Years | 16,747 (5.9%) | 21,052 (7.3%) |
| 65 to 74 Years | 8,693 (10.8%) | 13,101 (14.3%) |
| 75 Years and over | 13,145 (27.4%) | 25,199 (32.7%) |
Disability Class: Self-Care Difficulty
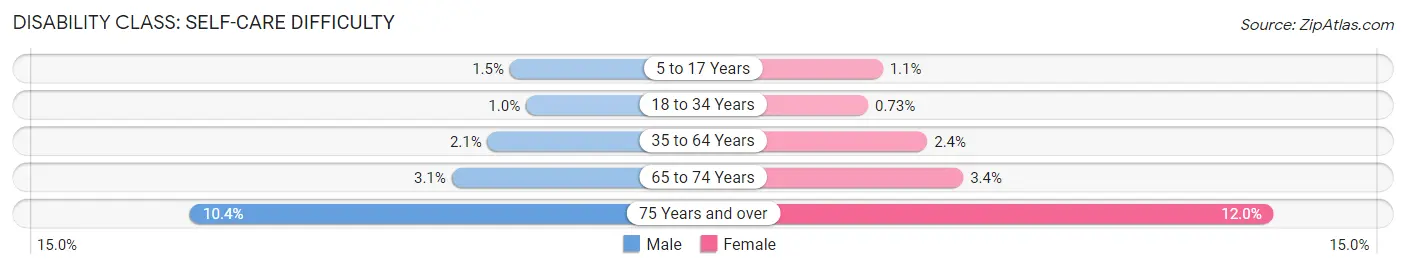
| Age Bracket | Male | Female |
| 5 to 17 Years | 1,566 (1.5%) | 1,145 (1.1%) |
| 18 to 34 Years | 1,867 (1.0%) | 1,288 (0.7%) |
| 35 to 64 Years | 5,981 (2.1%) | 6,905 (2.4%) |
| 65 to 74 Years | 2,491 (3.1%) | 3,091 (3.4%) |
| 75 Years and over | 4,982 (10.4%) | 9,258 (12.0%) |
Technology Access in Area Code 412
Computing Device Access in Area Code 412
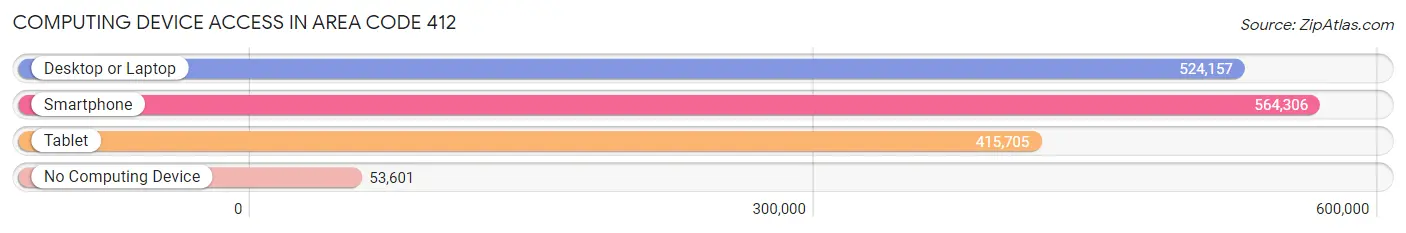
| Device Type | # Households | % Households |
| Desktop or Laptop | 524,157 | 78.3% |
| Smartphone | 564,306 | 84.3% |
| Tablet | 415,705 | 62.1% |
| No Computing Device | 53,601 | 8.0% |
| Total | 669,339 | 100.0% |
Internet Access in Area Code 412
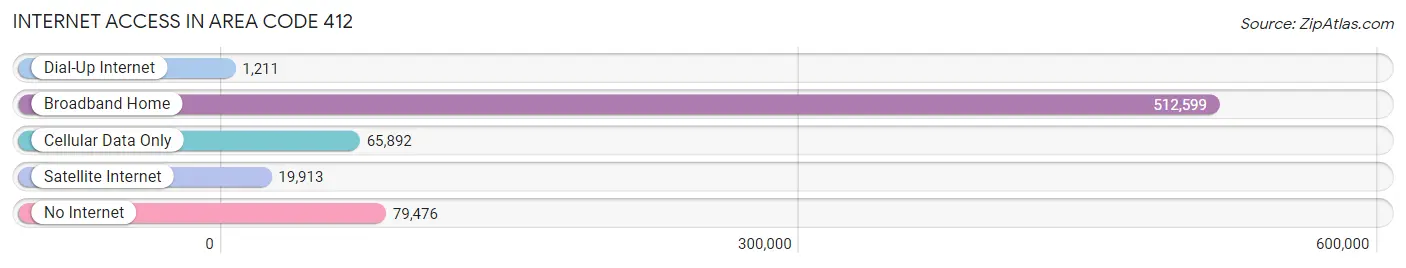
| Internet Type | # Households | % Households |
| Dial-Up Internet | 1,211 | 0.2% |
| Broadband Home | 512,599 | 76.6% |
| Cellular Data Only | 65,892 | 9.8% |
| Satellite Internet | 19,913 | 3.0% |
| No Internet | 79,476 | 11.9% |
| Total | 669,339 | 100.0% |
Area Code 412 Summary
Geography
Area code 412 is an area code in the North American Numbering Plan (NANP) for the city of Pittsburgh, Pennsylvania and some of its surrounding suburbs. It is one of the original area codes created in 1947, and covers an area of approximately 1,400 square miles.
Social
Area code 412 is a major hub for the arts and culture in the Pittsburgh area. It is home to a variety of museums, galleries, and performance venues, as well as a vibrant music and nightlife scene. The area is also home to a number of professional sports teams, including the Pittsburgh Steelers, Pirates, and Penguins.
Economics
Area code 412 is a major economic center in the region. It is home to a number of Fortune 500 companies, including U.S. Steel, PPG Industries, and PNC Financial Services. The area is also home to a number of universities and colleges, including the University of Pittsburgh, Carnegie Mellon University, and Duquesne University.
Demographics
Area code 412 is home to a diverse population of over 1.3 million people. The area is home to a variety of ethnic and racial groups, including African Americans, Hispanics, Asians, and Native Americans. The median household income in the area is approximately $50,000, and the median age is 38.
Common Questions
What is Per Capita Income in Area Code 412?
Per Capita income in Area Code 412 is $42,798.
What is the Median Family Income in Area Code 412?
Median Family Income in Area Code 412 is $97,796.
What is the Median Household income in Area Code 412?
Median Household Income in Area Code 412 is $71,798.
What is Income or Wage Gap in Area Code 412?
Income or Wage Gap in Area Code 412 is 27.7%.
Women in Area Code 412 earn 72.3 cents for every dollar earned by a man.
What is Family Income Deficit in Area Code 412?
Family Income Deficit in Area Code 412 is $11,427.
Families that are below poverty line in Area Code 412 earn $11,427 less on average than the poverty threshold level.
What is Inequality or Gini Index in Area Code 412?
Inequality or Gini Index in Area Code 412 is 45.39.
What is the Total Population of Area Code 412?
Total Population of Area Code 412 is 1,527,656.
What is the Total Male Population of Area Code 412?
Total Male Population of Area Code 412 is 746,244.
What is the Total Female Population of Area Code 412?
Total Female Population of Area Code 412 is 781,412.
What is the Ratio of Males per 100 Females in Area Code 412?
There are 95.50 Males per 100 Females in Area Code 412.
What is the Ratio of Females per 100 Males in Area Code 412?
There are 104.71 Females per 100 Males in Area Code 412.
What is the Median Population Age in Area Code 412?
Median Population Age in Area Code 412 is 42.2 Years.
What is the Average Family Size in Area Code 412
Average Family Size in Area Code 412 is 2.9 People.
What is the Average Household Size in Area Code 412
Average Household Size in Area Code 412 is 2.2 People.
How Large is the Labor Force in Area Code 412?
There are 804,163 People in the Labor Forcein in Area Code 412.
What is the Percentage of People in the Labor Force in Area Code 412?
63.0% of People are in the Labor Force in Area Code 412.
What is the Unemployment Rate in Area Code 412?
Unemployment Rate in Area Code 412 is 5.8%.