Levittown, PA Map & Demographics
Levittown Map
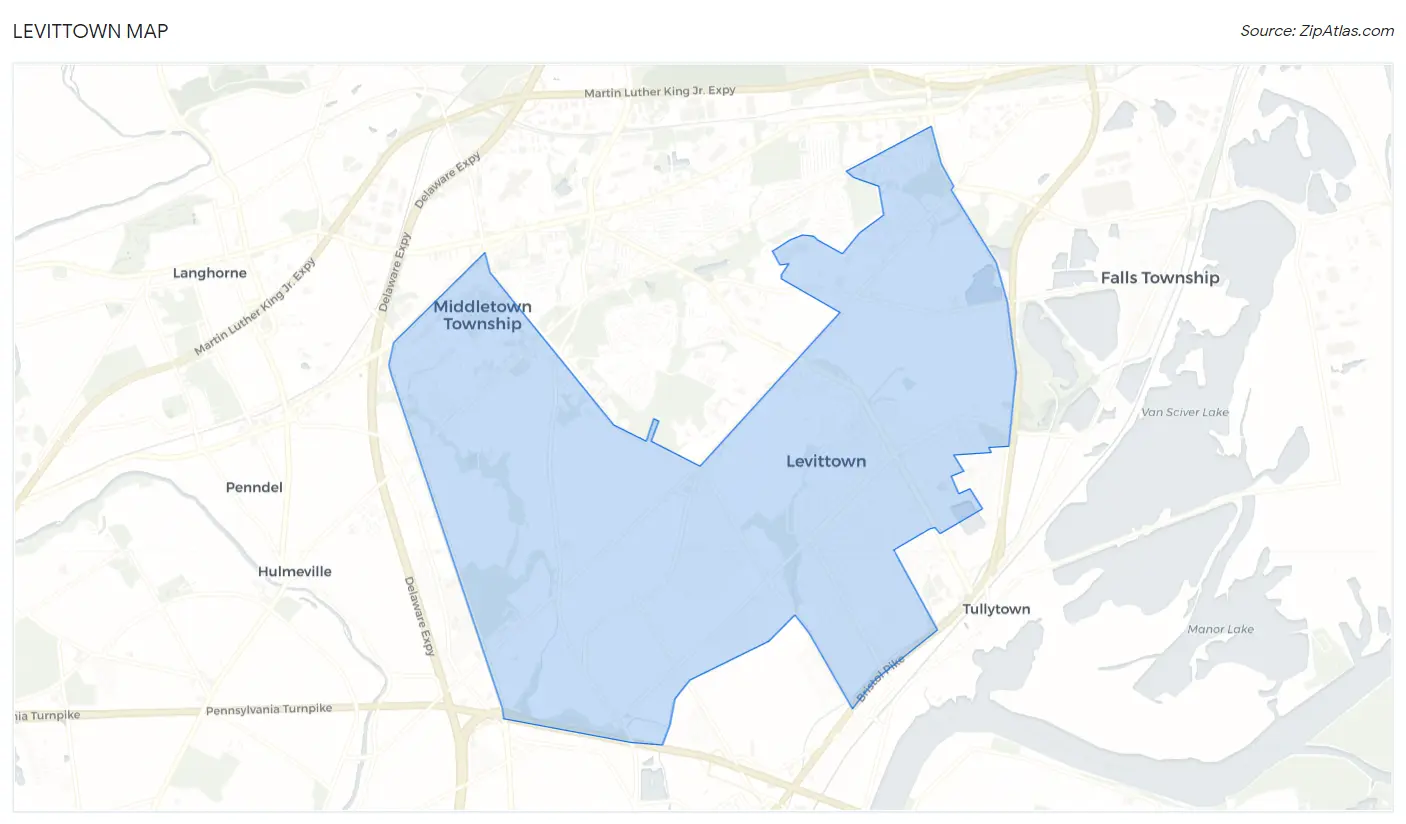
Levittown Overview
$38,713
PER CAPITA INCOME
$103,187
AVG FAMILY INCOME
$97,750
AVG HOUSEHOLD INCOME
27.8%
WAGE / INCOME GAP [ % ]
72.2¢/ $1
WAGE / INCOME GAP [ $ ]
0.36
INEQUALITY / GINI INDEX
51,152
TOTAL POPULATION
25,595
MALE POPULATION
25,557
FEMALE POPULATION
100.15
MALES / 100 FEMALES
99.85
FEMALES / 100 MALES
39.7
MEDIAN AGE
3.2
AVG FAMILY SIZE
2.9
AVG HOUSEHOLD SIZE
28,456
LABOR FORCE [ PEOPLE ]
67.2%
PERCENT IN LABOR FORCE
4.8%
UNEMPLOYMENT RATE
Income in Levittown
Income Overview in Levittown
Per Capita Income in Levittown is $38,713, while median incomes of families and households are $103,187 and $97,750 respectively.
| Characteristic | Number | Measure |
| Per Capita Income | 51,152 | $38,713 |
| Median Family Income | 13,404 | $103,187 |
| Mean Family Income | 13,404 | $116,590 |
| Median Household Income | 17,799 | $97,750 |
| Mean Household Income | 17,799 | $108,546 |
| Income Deficit | 13,404 | $0 |
| Wage / Income Gap (%) | 51,152 | 27.77% |
| Wage / Income Gap ($) | 51,152 | 72.23¢ per $1 |
| Gini / Inequality Index | 51,152 | 0.36 |
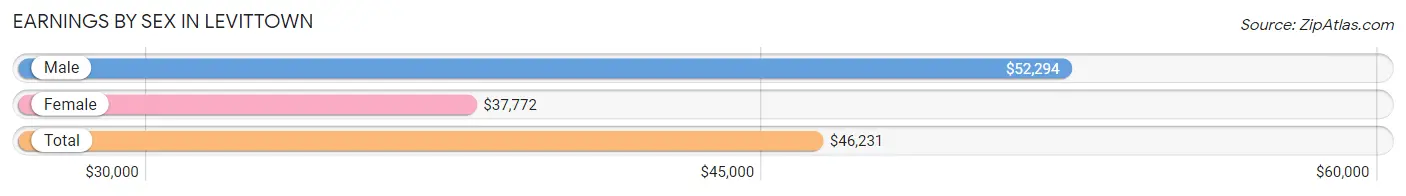
Earnings by Sex in Levittown
Average Earnings in Levittown are $46,231, $52,294 for men and $37,772 for women, a difference of 27.8%.
| Sex | Number | Average Earnings |
| Male | 15,718 (53.6%) | $52,294 |
| Female | 13,629 (46.4%) | $37,772 |
| Total | 29,347 (100.0%) | $46,231 |
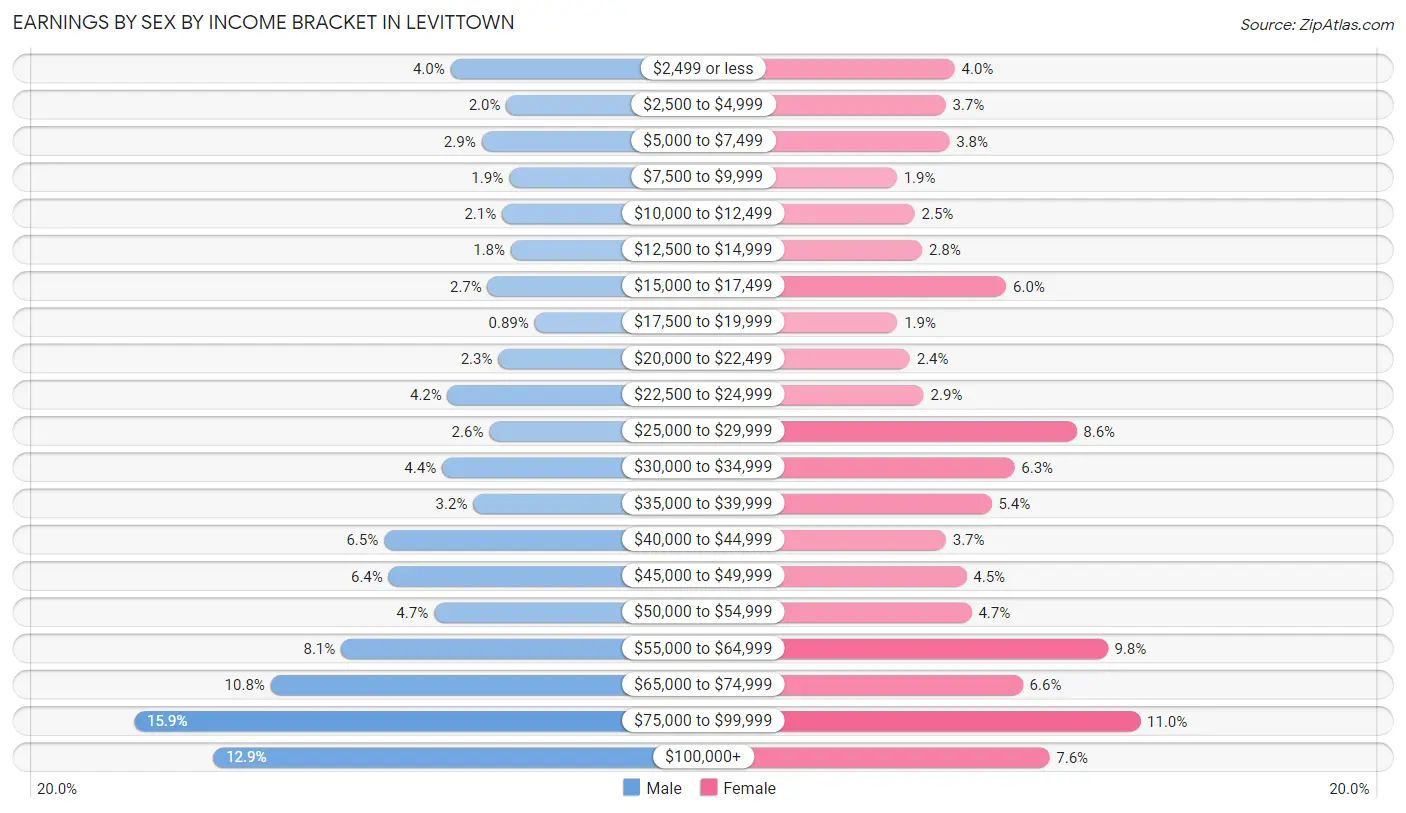
Earnings by Sex by Income Bracket in Levittown
The most common earnings brackets in Levittown are $75,000 to $99,999 for men (2,499 | 15.9%) and $75,000 to $99,999 for women (1,498 | 11.0%).
| Income | Male | Female |
| $2,499 or less | 635 (4.0%) | 551 (4.0%) |
| $2,500 to $4,999 | 307 (1.9%) | 504 (3.7%) |
| $5,000 to $7,499 | 453 (2.9%) | 523 (3.8%) |
| $7,500 to $9,999 | 290 (1.8%) | 255 (1.9%) |
| $10,000 to $12,499 | 332 (2.1%) | 346 (2.5%) |
| $12,500 to $14,999 | 280 (1.8%) | 385 (2.8%) |
| $15,000 to $17,499 | 416 (2.6%) | 813 (6.0%) |
| $17,500 to $19,999 | 140 (0.9%) | 257 (1.9%) |
| $20,000 to $22,499 | 353 (2.2%) | 321 (2.4%) |
| $22,500 to $24,999 | 653 (4.2%) | 392 (2.9%) |
| $25,000 to $29,999 | 407 (2.6%) | 1,172 (8.6%) |
| $30,000 to $34,999 | 686 (4.4%) | 856 (6.3%) |
| $35,000 to $39,999 | 502 (3.2%) | 739 (5.4%) |
| $40,000 to $44,999 | 1,026 (6.5%) | 506 (3.7%) |
| $45,000 to $49,999 | 1,000 (6.4%) | 611 (4.5%) |
| $50,000 to $54,999 | 732 (4.7%) | 637 (4.7%) |
| $55,000 to $64,999 | 1,280 (8.1%) | 1,331 (9.8%) |
| $65,000 to $74,999 | 1,695 (10.8%) | 898 (6.6%) |
| $75,000 to $99,999 | 2,499 (15.9%) | 1,498 (11.0%) |
| $100,000+ | 2,032 (12.9%) | 1,034 (7.6%) |
| Total | 15,718 (100.0%) | 13,629 (100.0%) |
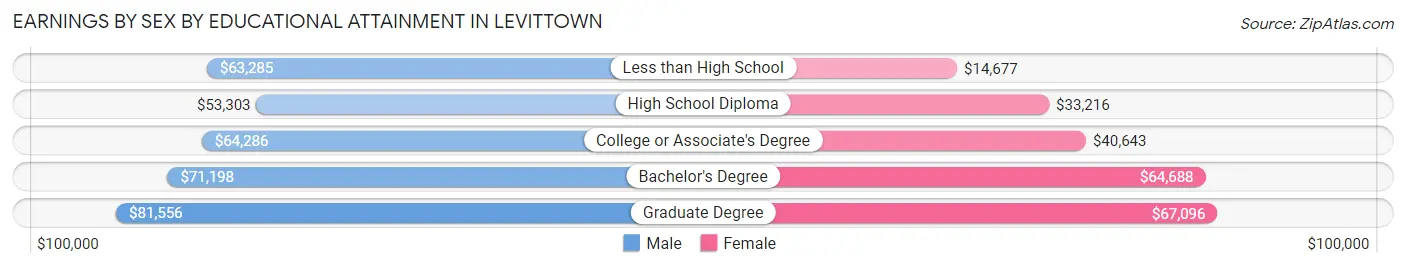
Earnings by Sex by Educational Attainment in Levittown
Average earnings in Levittown are $60,564 for men and $45,689 for women, a difference of 24.6%. Men with an educational attainment of graduate degree enjoy the highest average annual earnings of $81,556, while those with high school diploma education earn the least with $53,303. Women with an educational attainment of graduate degree earn the most with the average annual earnings of $67,096, while those with less than high school education have the smallest earnings of $14,677.
| Educational Attainment | Male Income | Female Income |
| Less than High School | $63,285 | $14,677 |
| High School Diploma | $53,303 | $33,216 |
| College or Associate's Degree | $64,286 | $40,643 |
| Bachelor's Degree | $71,198 | $64,688 |
| Graduate Degree | $81,556 | $67,096 |
| Total | $60,564 | $45,689 |
Family Income in Levittown
Family Income Brackets in Levittown
According to the Levittown family income data, there are 4,209 families falling into the $100,000 to $149,999 income range, which is the most common income bracket and makes up 31.4% of all families. Conversely, the $10,000 to $14,999 income bracket is the least frequent group with only 13 families (0.1%) belonging to this category.
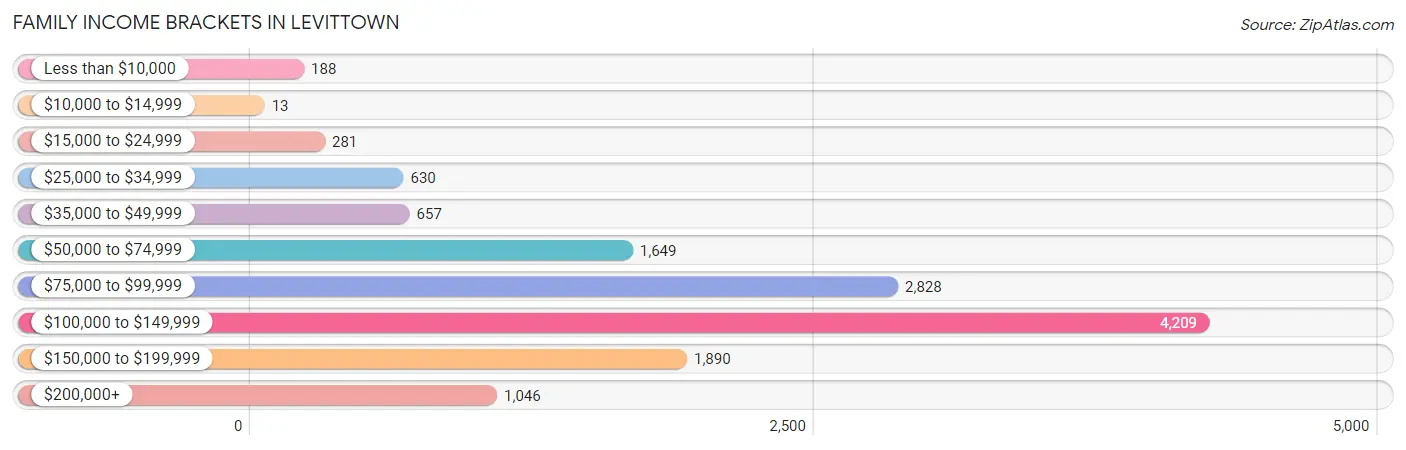
| Income Bracket | # Families | % Families |
| Less than $10,000 | 188 | 1.4% |
| $10,000 to $14,999 | 13 | 0.1% |
| $15,000 to $24,999 | 281 | 2.1% |
| $25,000 to $34,999 | 630 | 4.7% |
| $35,000 to $49,999 | 657 | 4.9% |
| $50,000 to $74,999 | 1,649 | 12.3% |
| $75,000 to $99,999 | 2,828 | 21.1% |
| $100,000 to $149,999 | 4,209 | 31.4% |
| $150,000 to $199,999 | 1,890 | 14.1% |
| $200,000+ | 1,046 | 7.8% |
Family Income by Famaliy Size in Levittown
7+ person families (304 | 2.3%) account for the highest median family income in Levittown with $141,645 per family, while 2-person families (4,994 | 37.3%) have the highest median income of $44,419 per family member.
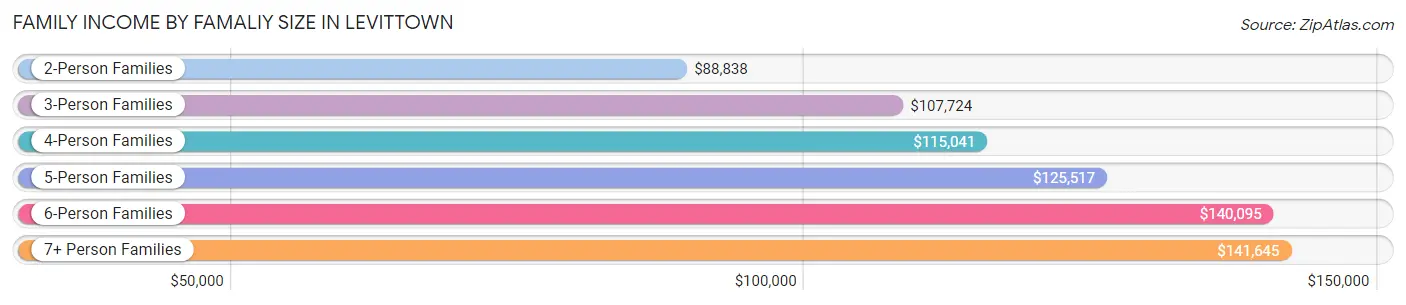
| Income Bracket | # Families | Median Income |
| 2-Person Families | 4,994 (37.3%) | $88,838 |
| 3-Person Families | 3,570 (26.6%) | $107,724 |
| 4-Person Families | 2,955 (22.1%) | $115,041 |
| 5-Person Families | 1,084 (8.1%) | $125,517 |
| 6-Person Families | 497 (3.7%) | $140,095 |
| 7+ Person Families | 304 (2.3%) | $141,645 |
| Total | 13,404 (100.0%) | $103,187 |
Family Income by Number of Earners in Levittown
The median family income in Levittown is $103,187, with families comprising 3+ earners (2,608) having the highest median family income of $142,190, while families with no earners (1,515) have the lowest median family income of $54,552, accounting for 19.5% and 11.3% of families, respectively.
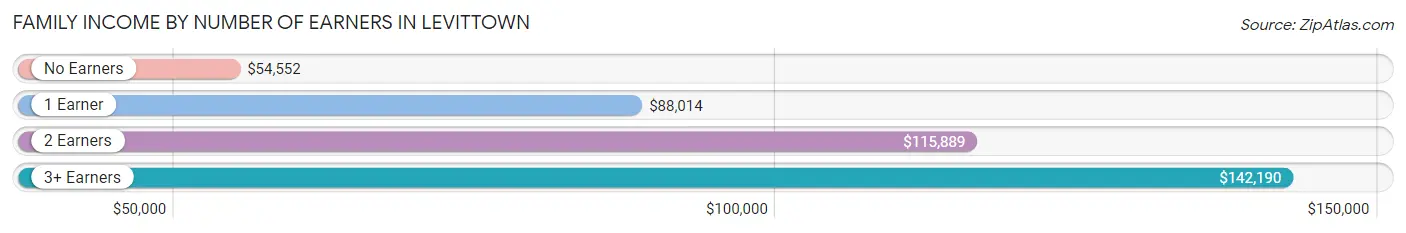
| Number of Earners | # Families | Median Income |
| No Earners | 1,515 (11.3%) | $54,552 |
| 1 Earner | 3,658 (27.3%) | $88,014 |
| 2 Earners | 5,623 (41.9%) | $115,889 |
| 3+ Earners | 2,608 (19.5%) | $142,190 |
| Total | 13,404 (100.0%) | $103,187 |
Household Income in Levittown
Household Income Brackets in Levittown
With 4,735 households falling in the category, the $100,000 to $149,999 income range is the most frequent in Levittown, accounting for 26.6% of all households. In contrast, only 267 households (1.5%) fall into the $10,000 to $14,999 income bracket, making it the least populous group.
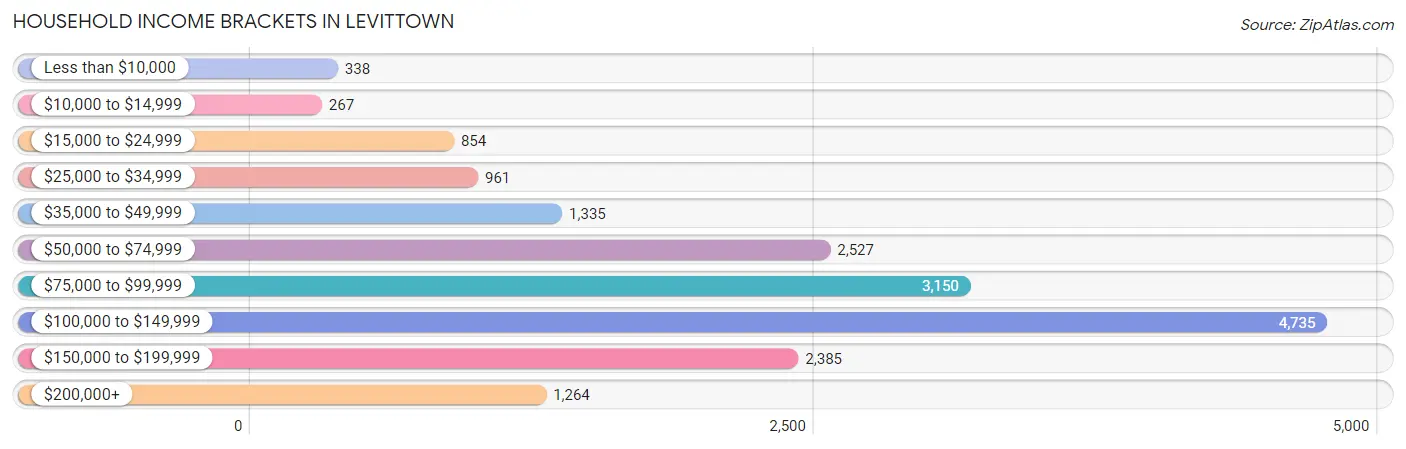
| Income Bracket | # Households | % Households |
| Less than $10,000 | 338 | 1.9% |
| $10,000 to $14,999 | 267 | 1.5% |
| $15,000 to $24,999 | 854 | 4.8% |
| $25,000 to $34,999 | 961 | 5.4% |
| $35,000 to $49,999 | 1,335 | 7.5% |
| $50,000 to $74,999 | 2,527 | 14.2% |
| $75,000 to $99,999 | 3,150 | 17.7% |
| $100,000 to $149,999 | 4,735 | 26.6% |
| $150,000 to $199,999 | 2,385 | 13.4% |
| $200,000+ | 1,264 | 7.1% |
Household Income by Householder Age in Levittown
The median household income in Levittown is $97,750, with the highest median household income of $116,552 found in the 45 to 64 years age bracket for the primary householder. A total of 7,172 households (40.3%) fall into this category. Meanwhile, the 15 to 24 years age bracket for the primary householder has the lowest median household income of $34,872, with 336 households (1.9%) in this group.
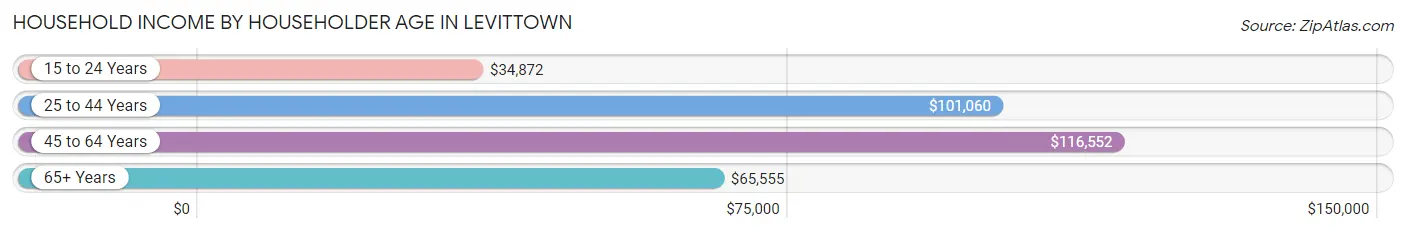
| Income Bracket | # Households | Median Income |
| 15 to 24 Years | 336 (1.9%) | $34,872 |
| 25 to 44 Years | 5,370 (30.2%) | $101,060 |
| 45 to 64 Years | 7,172 (40.3%) | $116,552 |
| 65+ Years | 4,921 (27.7%) | $65,555 |
| Total | 17,799 (100.0%) | $97,750 |
Poverty in Levittown
Income Below Poverty by Sex and Age in Levittown
With 6.0% poverty level for males and 7.2% for females among the residents of Levittown, 16 and 17 year old males and 15 year old females are the most vulnerable to poverty, with 145 males (16.7%) and 69 females (23.2%) in their respective age groups living below the poverty level.
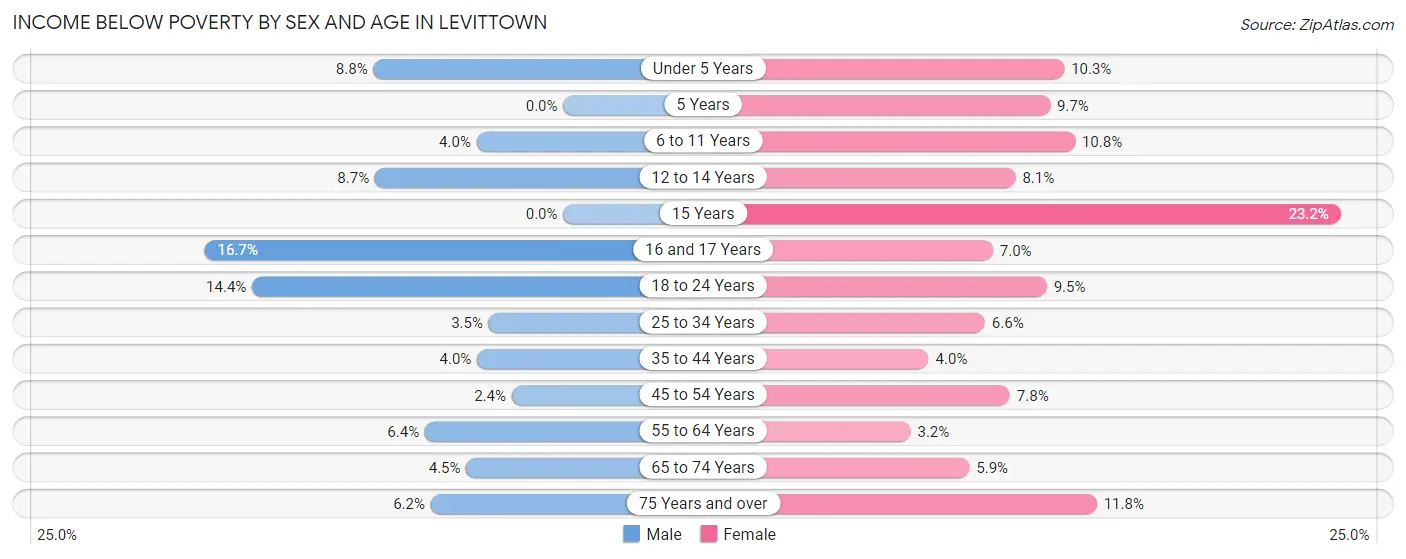
| Age Bracket | Male | Female |
| Under 5 Years | 130 (8.8%) | 134 (10.3%) |
| 5 Years | 0 (0.0%) | 14 (9.7%) |
| 6 to 11 Years | 66 (4.0%) | 159 (10.8%) |
| 12 to 14 Years | 61 (8.7%) | 74 (8.1%) |
| 15 Years | 0 (0.0%) | 69 (23.2%) |
| 16 and 17 Years | 145 (16.7%) | 62 (7.0%) |
| 18 to 24 Years | 345 (14.4%) | 239 (9.5%) |
| 25 to 34 Years | 132 (3.5%) | 209 (6.6%) |
| 35 to 44 Years | 148 (4.0%) | 144 (4.0%) |
| 45 to 54 Years | 75 (2.4%) | 248 (7.8%) |
| 55 to 64 Years | 225 (6.4%) | 117 (3.2%) |
| 65 to 74 Years | 105 (4.5%) | 133 (5.9%) |
| 75 Years and over | 82 (6.1%) | 228 (11.8%) |
| Total | 1,514 (6.0%) | 1,830 (7.2%) |
Income Above Poverty by Sex and Age in Levittown
According to the poverty statistics in Levittown, males aged 5 years and females aged 55 to 64 years are the age groups that are most secure financially, with 100.0% of males and 96.8% of females in these age groups living above the poverty line.
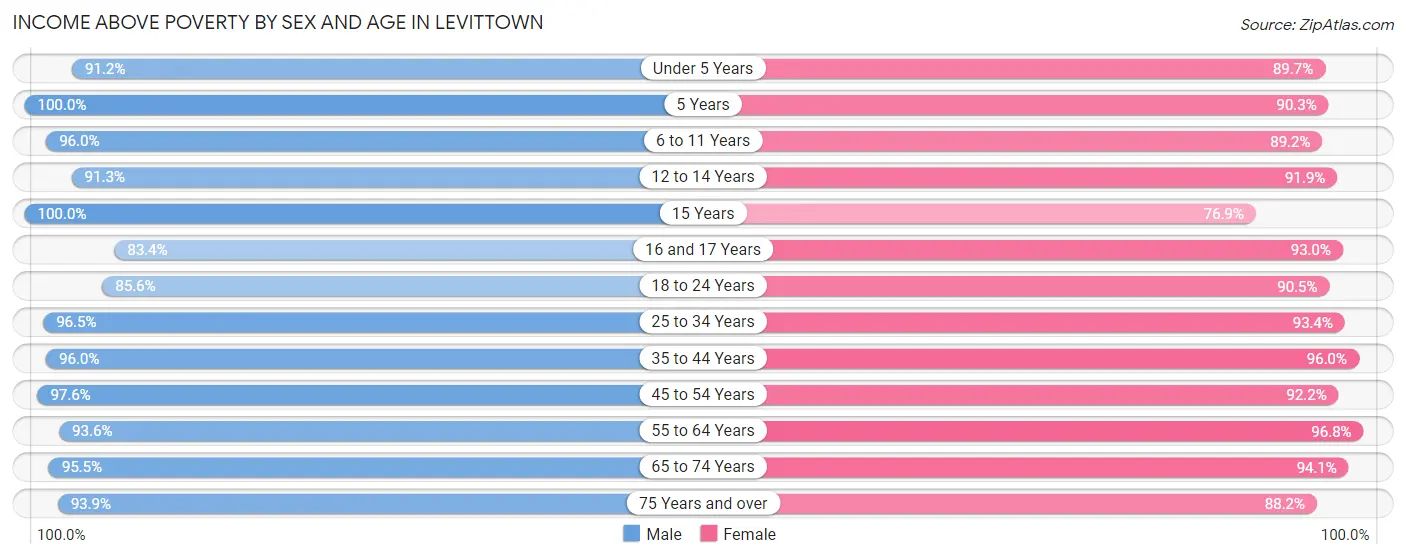
| Age Bracket | Male | Female |
| Under 5 Years | 1,345 (91.2%) | 1,165 (89.7%) |
| 5 Years | 215 (100.0%) | 131 (90.3%) |
| 6 to 11 Years | 1,577 (96.0%) | 1,311 (89.2%) |
| 12 to 14 Years | 637 (91.3%) | 844 (91.9%) |
| 15 Years | 259 (100.0%) | 229 (76.8%) |
| 16 and 17 Years | 726 (83.4%) | 822 (93.0%) |
| 18 to 24 Years | 2,045 (85.6%) | 2,273 (90.5%) |
| 25 to 34 Years | 3,680 (96.5%) | 2,939 (93.4%) |
| 35 to 44 Years | 3,555 (96.0%) | 3,430 (96.0%) |
| 45 to 54 Years | 3,061 (97.6%) | 2,931 (92.2%) |
| 55 to 64 Years | 3,278 (93.6%) | 3,549 (96.8%) |
| 65 to 74 Years | 2,228 (95.5%) | 2,112 (94.1%) |
| 75 Years and over | 1,251 (93.9%) | 1,699 (88.2%) |
| Total | 23,857 (94.0%) | 23,435 (92.8%) |
Income Below Poverty Among Married-Couple Families in Levittown
The poverty statistics for married-couple families in Levittown show that 2.6% or 247 of the total 9,632 families live below the poverty line. Families with 3 or 4 children have the highest poverty rate of 6.2%, comprising of 30 families. On the other hand, families with 5 or more children have the lowest poverty rate of 0.0%, which includes 0 families.
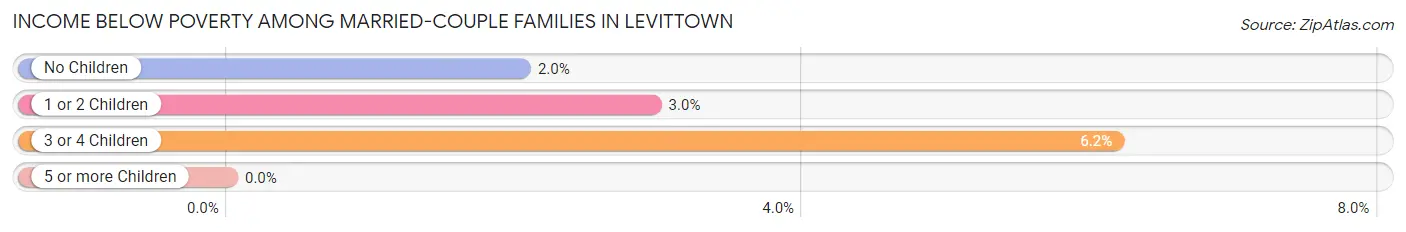
| Children | Above Poverty | Below Poverty |
| No Children | 5,524 (98.0%) | 115 (2.0%) |
| 1 or 2 Children | 3,350 (97.1%) | 102 (2.9%) |
| 3 or 4 Children | 456 (93.8%) | 30 (6.2%) |
| 5 or more Children | 55 (100.0%) | 0 (0.0%) |
| Total | 9,385 (97.4%) | 247 (2.6%) |
Income Below Poverty Among Single-Parent Households in Levittown
According to the poverty data in Levittown, 0.7% or 7 single-father households and 10.0% or 279 single-mother households are living below the poverty line. Among single-father households, those with no children have the highest poverty rate, with 7 households (1.3%) experiencing poverty. Likewise, among single-mother households, those with 3 or 4 children have the highest poverty rate, with 113 households (31.5%) falling below the poverty line.
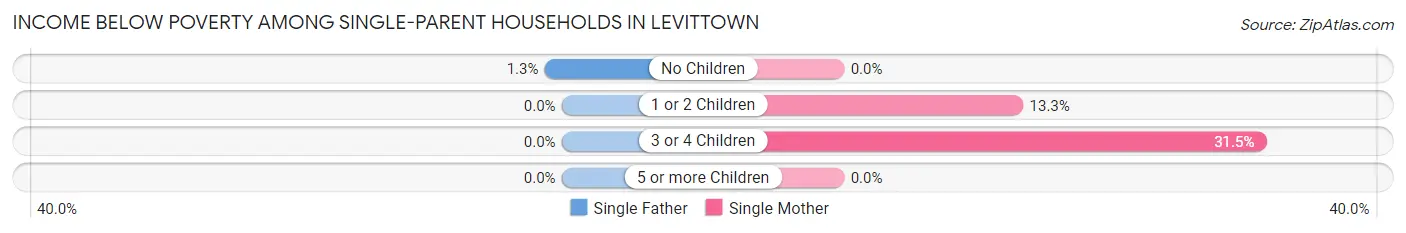
| Children | Single Father | Single Mother |
| No Children | 7 (1.3%) | 0 (0.0%) |
| 1 or 2 Children | 0 (0.0%) | 166 (13.3%) |
| 3 or 4 Children | 0 (0.0%) | 113 (31.5%) |
| 5 or more Children | 0 (0.0%) | 0 (0.0%) |
| Total | 7 (0.7%) | 279 (10.0%) |
Income Below Poverty Among Married-Couple vs Single-Parent Households in Levittown
The poverty data for Levittown shows that 247 of the married-couple family households (2.6%) and 286 of the single-parent households (7.6%) are living below the poverty level. Within the married-couple family households, those with 3 or 4 children have the highest poverty rate, with 30 households (6.2%) falling below the poverty line. Among the single-parent households, those with 3 or 4 children have the highest poverty rate, with 113 household (31.5%) living below poverty.
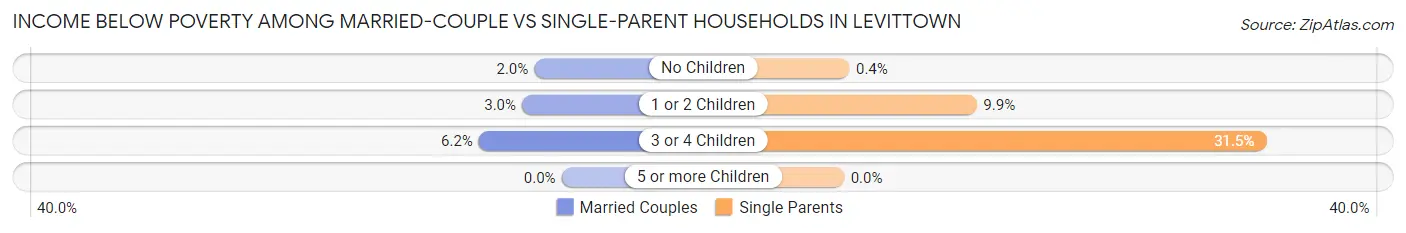
| Children | Married-Couple Families | Single-Parent Households |
| No Children | 115 (2.0%) | 7 (0.4%) |
| 1 or 2 Children | 102 (2.9%) | 166 (9.9%) |
| 3 or 4 Children | 30 (6.2%) | 113 (31.5%) |
| 5 or more Children | 0 (0.0%) | 0 (0.0%) |
| Total | 247 (2.6%) | 286 (7.6%) |
Race in Levittown
The most populous races in Levittown are White / Caucasian (42,539 | 83.2%), Hispanic or Latino (5,026 | 9.8%), and Two or more Races (3,754 | 7.3%).
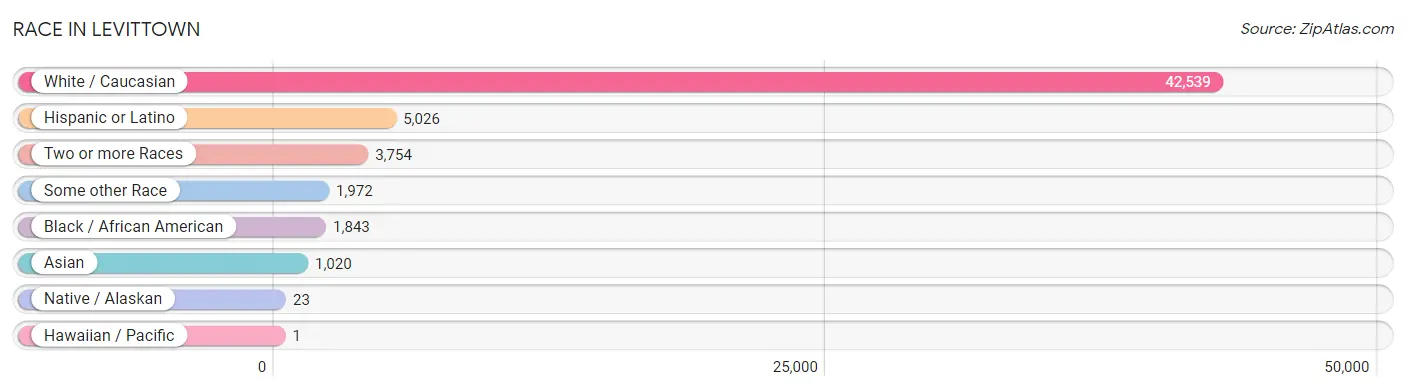
| Race | # Population | % Population |
| Asian | 1,020 | 2.0% |
| Black / African American | 1,843 | 3.6% |
| Hawaiian / Pacific | 1 | 0.0% |
| Hispanic or Latino | 5,026 | 9.8% |
| Native / Alaskan | 23 | 0.0% |
| White / Caucasian | 42,539 | 83.2% |
| Two or more Races | 3,754 | 7.3% |
| Some other Race | 1,972 | 3.9% |
| Total | 51,152 | 100.0% |
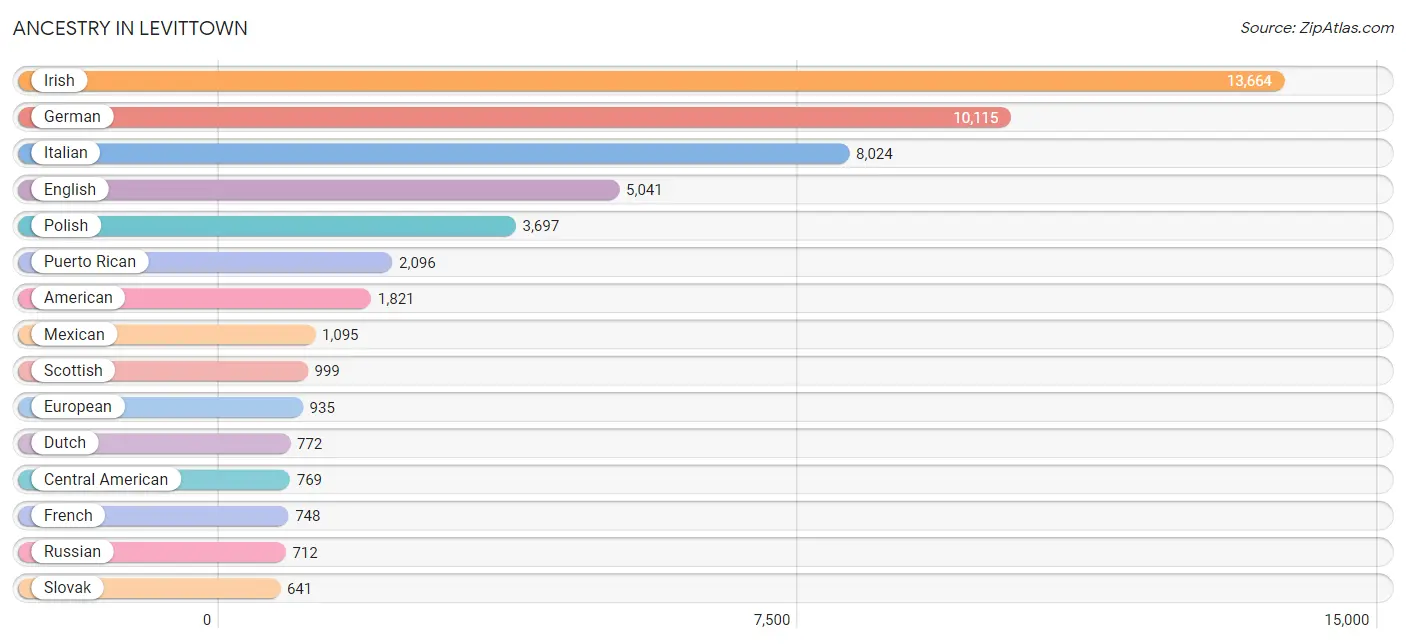
Ancestry in Levittown
The most populous ancestries reported in Levittown are Irish (13,664 | 26.7%), German (10,115 | 19.8%), Italian (8,024 | 15.7%), English (5,041 | 9.9%), and Polish (3,697 | 7.2%), together accounting for 79.3% of all Levittown residents.
| Ancestry | # Population | % Population |
| African | 84 | 0.2% |
| American | 1,821 | 3.6% |
| Arab | 320 | 0.6% |
| Australian | 5 | 0.0% |
| Austrian | 174 | 0.3% |
| Belgian | 69 | 0.1% |
| Bhutanese | 118 | 0.2% |
| Blackfeet | 2 | 0.0% |
| Brazilian | 18 | 0.0% |
| British | 229 | 0.4% |
| Burmese | 324 | 0.6% |
| Canadian | 69 | 0.1% |
| Central American | 769 | 1.5% |
| Central American Indian | 38 | 0.1% |
| Cherokee | 6 | 0.0% |
| Colombian | 44 | 0.1% |
| Costa Rican | 141 | 0.3% |
| Croatian | 31 | 0.1% |
| Cuban | 84 | 0.2% |
| Czech | 180 | 0.4% |
| Czechoslovakian | 70 | 0.1% |
| Danish | 107 | 0.2% |
| Delaware | 157 | 0.3% |
| Dominican | 378 | 0.7% |
| Dutch | 772 | 1.5% |
| Eastern European | 134 | 0.3% |
| Ecuadorian | 75 | 0.2% |
| Egyptian | 200 | 0.4% |
| English | 5,041 | 9.9% |
| Estonian | 25 | 0.1% |
| Ethiopian | 16 | 0.0% |
| European | 935 | 1.8% |
| Finnish | 28 | 0.1% |
| French | 748 | 1.5% |
| French Canadian | 161 | 0.3% |
| German | 10,115 | 19.8% |
| Greek | 34 | 0.1% |
| Guamanian / Chamorro | 12 | 0.0% |
| Guatemalan | 369 | 0.7% |
| Guyanese | 46 | 0.1% |
| Honduran | 78 | 0.2% |
| Hungarian | 604 | 1.2% |
| Indian (Asian) | 74 | 0.1% |
| Irish | 13,664 | 26.7% |
| Italian | 8,024 | 15.7% |
| Jamaican | 73 | 0.1% |
| Japanese | 269 | 0.5% |
| Korean | 462 | 0.9% |
| Lebanese | 120 | 0.2% |
| Lithuanian | 326 | 0.6% |
| Mexican | 1,095 | 2.1% |
| Mexican American Indian | 38 | 0.1% |
| Native Hawaiian | 33 | 0.1% |
| Nicaraguan | 23 | 0.0% |
| Nigerian | 21 | 0.0% |
| Northern European | 7 | 0.0% |
| Norwegian | 100 | 0.2% |
| Pakistani | 50 | 0.1% |
| Pennsylvania German | 152 | 0.3% |
| Peruvian | 19 | 0.0% |
| Polish | 3,697 | 7.2% |
| Portuguese | 24 | 0.1% |
| Puerto Rican | 2,096 | 4.1% |
| Romanian | 79 | 0.2% |
| Russian | 712 | 1.4% |
| Salvadoran | 158 | 0.3% |
| Scandinavian | 95 | 0.2% |
| Scotch-Irish | 594 | 1.2% |
| Scottish | 999 | 1.9% |
| Slavic | 41 | 0.1% |
| Slovak | 641 | 1.3% |
| South American | 203 | 0.4% |
| Spaniard | 169 | 0.3% |
| Spanish | 65 | 0.1% |
| Sri Lankan | 205 | 0.4% |
| Subsaharan African | 121 | 0.2% |
| Swedish | 404 | 0.8% |
| Swiss | 102 | 0.2% |
| Thai | 308 | 0.6% |
| Trinidadian and Tobagonian | 68 | 0.1% |
| Turkish | 131 | 0.3% |
| Ukrainian | 577 | 1.1% |
| Welsh | 373 | 0.7% |
| Yugoslavian | 49 | 0.1% | View All 84 Rows |
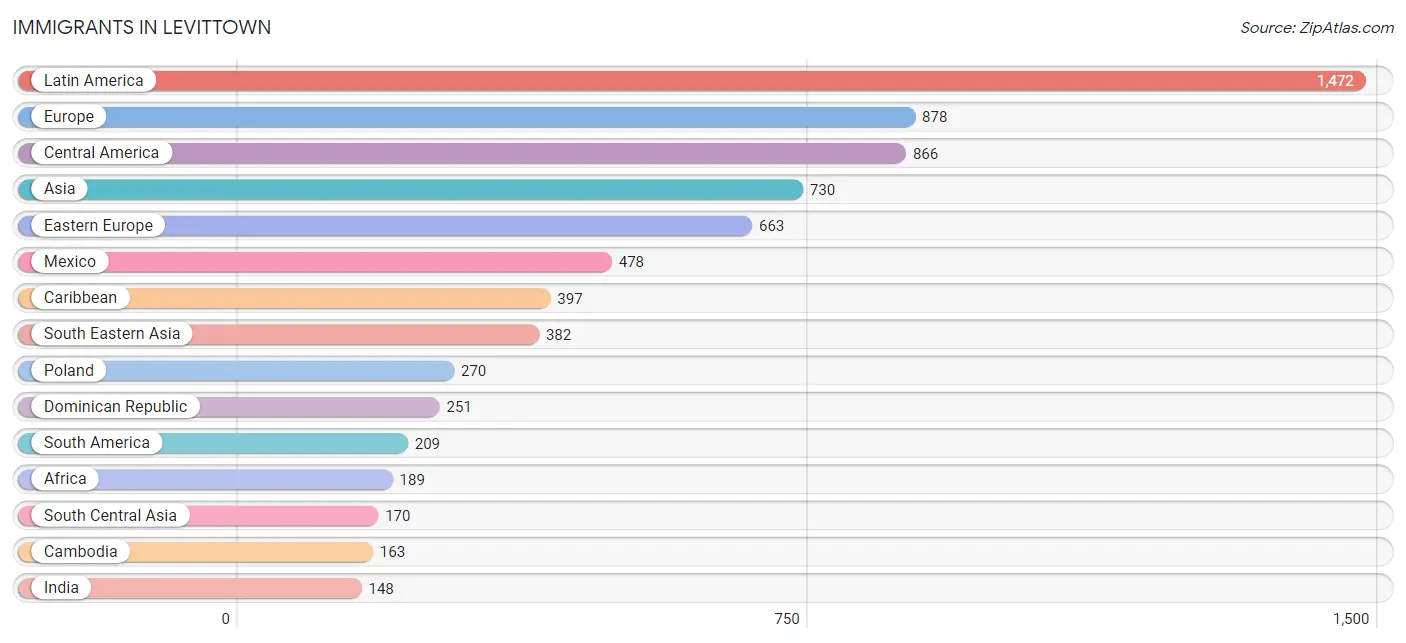
Immigrants in Levittown
The most numerous immigrant groups reported in Levittown came from Latin America (1,472 | 2.9%), Europe (878 | 1.7%), Central America (866 | 1.7%), Asia (730 | 1.4%), and Eastern Europe (663 | 1.3%), together accounting for 9.0% of all Levittown residents.
| Immigration Origin | # Population | % Population |
| Africa | 189 | 0.4% |
| Albania | 3 | 0.0% |
| Asia | 730 | 1.4% |
| Bosnia and Herzegovina | 33 | 0.1% |
| Cambodia | 163 | 0.3% |
| Canada | 39 | 0.1% |
| Caribbean | 397 | 0.8% |
| Central America | 866 | 1.7% |
| China | 11 | 0.0% |
| Colombia | 44 | 0.1% |
| Costa Rica | 143 | 0.3% |
| Croatia | 15 | 0.0% |
| Dominican Republic | 251 | 0.5% |
| Eastern Africa | 17 | 0.0% |
| Eastern Asia | 89 | 0.2% |
| Eastern Europe | 663 | 1.3% |
| Ecuador | 25 | 0.1% |
| Egypt | 61 | 0.1% |
| El Salvador | 90 | 0.2% |
| England | 14 | 0.0% |
| Ethiopia | 16 | 0.0% |
| Europe | 878 | 1.7% |
| Germany | 75 | 0.2% |
| Greece | 9 | 0.0% |
| Guatemala | 117 | 0.2% |
| Guyana | 121 | 0.2% |
| Honduras | 38 | 0.1% |
| India | 148 | 0.3% |
| Italy | 31 | 0.1% |
| Jamaica | 73 | 0.1% |
| Korea | 78 | 0.2% |
| Latin America | 1,472 | 2.9% |
| Liberia | 94 | 0.2% |
| Mexico | 478 | 0.9% |
| Netherlands | 4 | 0.0% |
| Northern Africa | 61 | 0.1% |
| Northern Europe | 83 | 0.2% |
| Peru | 19 | 0.0% |
| Philippines | 138 | 0.3% |
| Poland | 270 | 0.5% |
| Portugal | 13 | 0.0% |
| Romania | 143 | 0.3% |
| Russia | 48 | 0.1% |
| Scotland | 64 | 0.1% |
| South Africa | 17 | 0.0% |
| South America | 209 | 0.4% |
| South Central Asia | 170 | 0.3% |
| South Eastern Asia | 382 | 0.7% |
| Southern Europe | 53 | 0.1% |
| Thailand | 50 | 0.1% |
| Trinidad and Tobago | 73 | 0.1% |
| Turkey | 89 | 0.2% |
| Ukraine | 127 | 0.3% |
| Vietnam | 31 | 0.1% |
| Western Africa | 94 | 0.2% |
| Western Asia | 89 | 0.2% |
| Western Europe | 79 | 0.2% | View All 57 Rows |
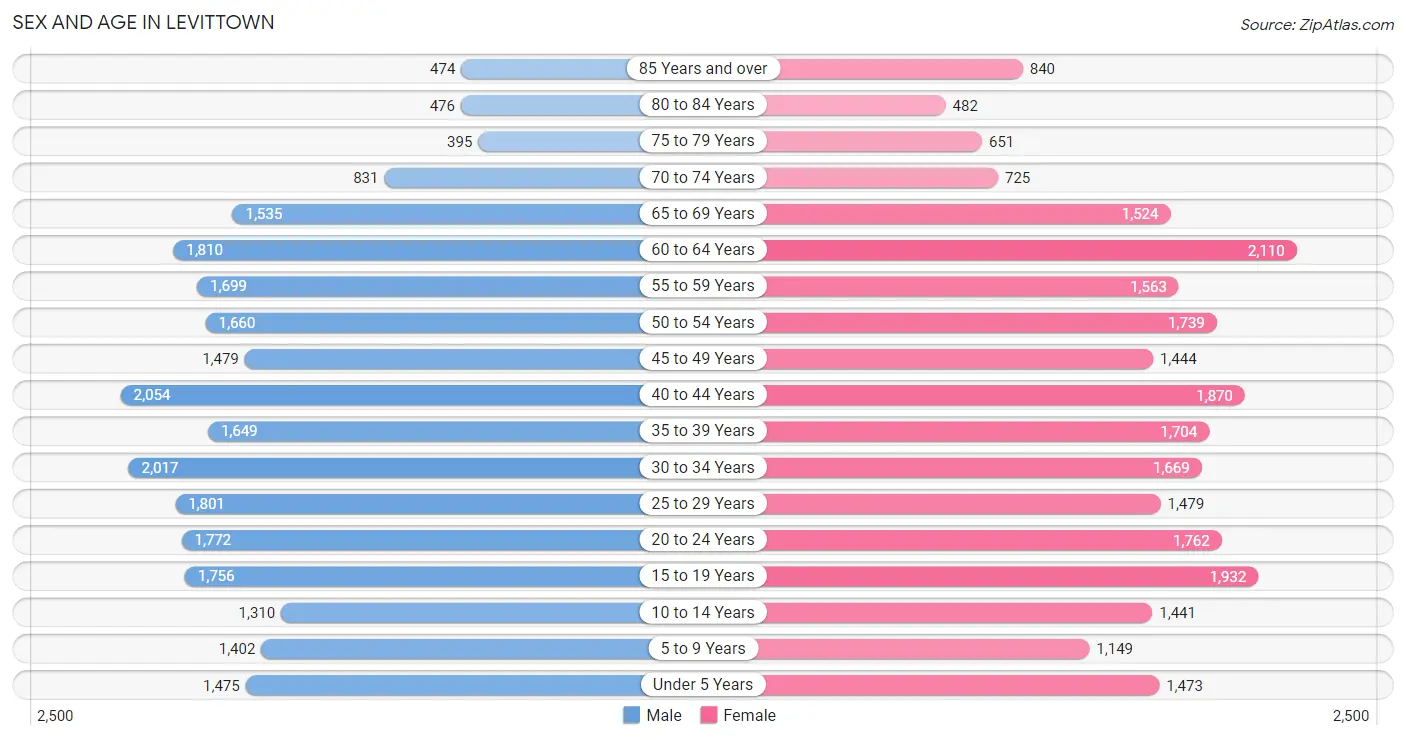
Sex and Age in Levittown
Sex and Age in Levittown
The most populous age groups in Levittown are 40 to 44 Years (2,054 | 8.0%) for men and 60 to 64 Years (2,110 | 8.3%) for women.
| Age Bracket | Male | Female |
| Under 5 Years | 1,475 (5.8%) | 1,473 (5.8%) |
| 5 to 9 Years | 1,402 (5.5%) | 1,149 (4.5%) |
| 10 to 14 Years | 1,310 (5.1%) | 1,441 (5.6%) |
| 15 to 19 Years | 1,756 (6.9%) | 1,932 (7.6%) |
| 20 to 24 Years | 1,772 (6.9%) | 1,762 (6.9%) |
| 25 to 29 Years | 1,801 (7.0%) | 1,479 (5.8%) |
| 30 to 34 Years | 2,017 (7.9%) | 1,669 (6.5%) |
| 35 to 39 Years | 1,649 (6.4%) | 1,704 (6.7%) |
| 40 to 44 Years | 2,054 (8.0%) | 1,870 (7.3%) |
| 45 to 49 Years | 1,479 (5.8%) | 1,444 (5.7%) |
| 50 to 54 Years | 1,660 (6.5%) | 1,739 (6.8%) |
| 55 to 59 Years | 1,699 (6.6%) | 1,563 (6.1%) |
| 60 to 64 Years | 1,810 (7.1%) | 2,110 (8.3%) |
| 65 to 69 Years | 1,535 (6.0%) | 1,524 (6.0%) |
| 70 to 74 Years | 831 (3.3%) | 725 (2.8%) |
| 75 to 79 Years | 395 (1.5%) | 651 (2.5%) |
| 80 to 84 Years | 476 (1.9%) | 482 (1.9%) |
| 85 Years and over | 474 (1.8%) | 840 (3.3%) |
| Total | 25,595 (100.0%) | 25,557 (100.0%) |
Families and Households in Levittown
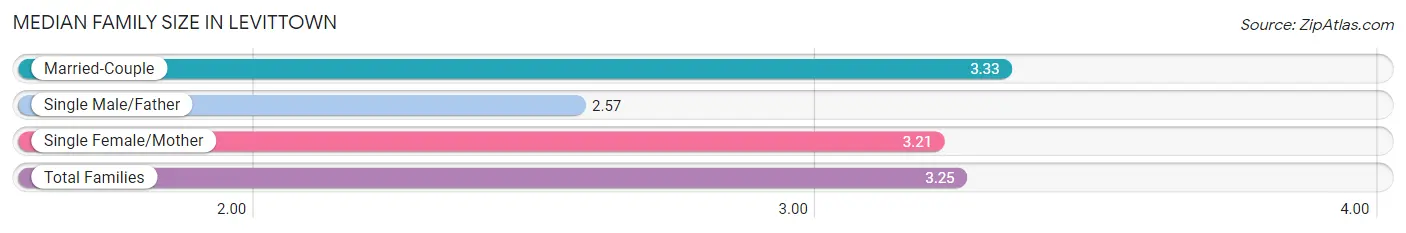
Median Family Size in Levittown
The median family size in Levittown is 3.25 persons per family, with married-couple families (9,632 | 71.9%) accounting for the largest median family size of 3.33 persons per family. On the other hand, single male/father families (979 | 7.3%) represent the smallest median family size with 2.57 persons per family.
| Family Type | # Families | Family Size |
| Married-Couple | 9,632 (71.9%) | 3.33 |
| Single Male/Father | 979 (7.3%) | 2.57 |
| Single Female/Mother | 2,793 (20.8%) | 3.21 |
| Total Families | 13,404 (100.0%) | 3.25 |
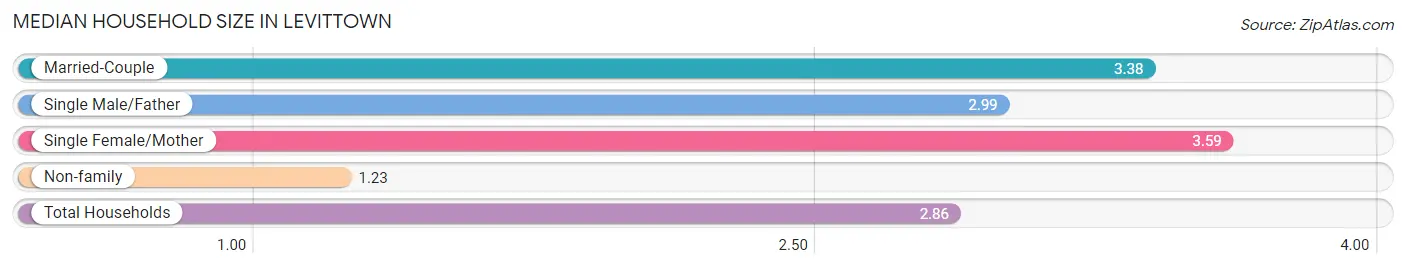
Median Household Size in Levittown
The median household size in Levittown is 2.86 persons per household, with single female/mother households (2,793 | 15.7%) accounting for the largest median household size of 3.59 persons per household. non-family households (4,395 | 24.7%) represent the smallest median household size with 1.23 persons per household.
| Household Type | # Households | Household Size |
| Married-Couple | 9,632 (54.1%) | 3.38 |
| Single Male/Father | 979 (5.5%) | 2.99 |
| Single Female/Mother | 2,793 (15.7%) | 3.59 |
| Non-family | 4,395 (24.7%) | 1.23 |
| Total Households | 17,799 (100.0%) | 2.86 |
Household Size by Marriage Status in Levittown
Out of a total of 17,799 households in Levittown, 13,404 (75.3%) are family households, while 4,395 (24.7%) are nonfamily households. The most numerous type of family households are 2-person households, comprising 4,546, and the most common type of nonfamily households are 1-person households, comprising 3,670.
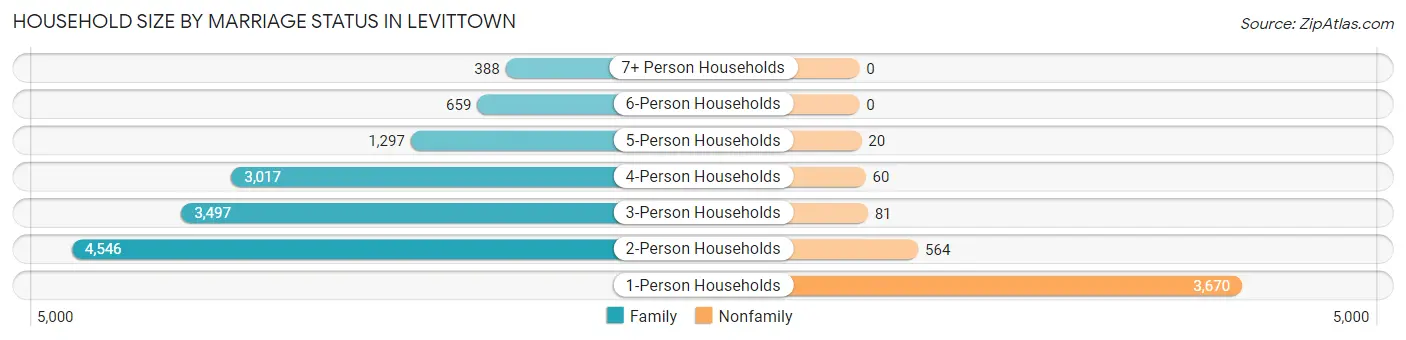
| Household Size | Family Households | Nonfamily Households |
| 1-Person Households | - | 3,670 (20.6%) |
| 2-Person Households | 4,546 (25.5%) | 564 (3.2%) |
| 3-Person Households | 3,497 (19.7%) | 81 (0.5%) |
| 4-Person Households | 3,017 (17.0%) | 60 (0.3%) |
| 5-Person Households | 1,297 (7.3%) | 20 (0.1%) |
| 6-Person Households | 659 (3.7%) | 0 (0.0%) |
| 7+ Person Households | 388 (2.2%) | 0 (0.0%) |
| Total | 13,404 (75.3%) | 4,395 (24.7%) |
Female Fertility in Levittown
Fertility by Age in Levittown
Average fertility rate in Levittown is 51.0 births per 1,000 women. Women in the age bracket of 20 to 34 years have the highest fertility rate with 97.0 births per 1,000 women. Women in the age bracket of 20 to 34 years acount for 77.1% of all women with births.
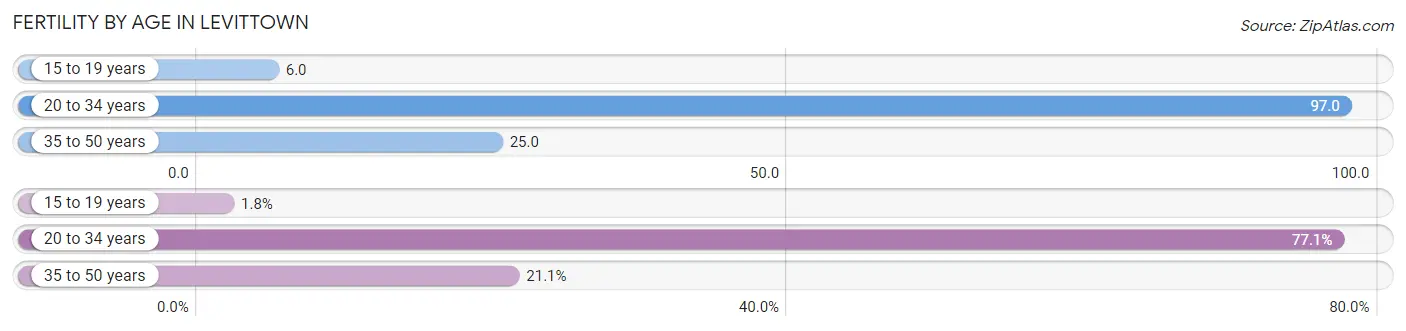
| Age Bracket | Women with Births | Births / 1,000 Women |
| 15 to 19 years | 11 (1.8%) | 6.0 |
| 20 to 34 years | 478 (77.1%) | 97.0 |
| 35 to 50 years | 131 (21.1%) | 25.0 |
| Total | 620 (100.0%) | 51.0 |
Fertility by Age by Marriage Status in Levittown
68.4% of women with births (620) in Levittown are married. The highest percentage of unmarried women with births falls into 20 to 34 years age bracket with 41.0% of them unmarried at the time of birth, while the lowest percentage of unmarried women with births belong to 15 to 19 years age bracket with 0.0% of them unmarried.
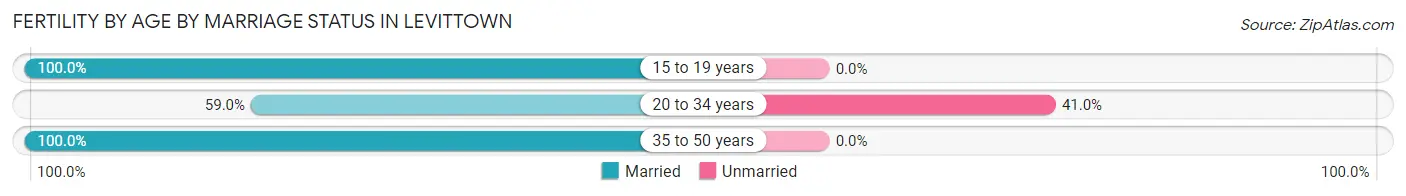
| Age Bracket | Married | Unmarried |
| 15 to 19 years | 11 (100.0%) | 0 (0.0%) |
| 20 to 34 years | 282 (59.0%) | 196 (41.0%) |
| 35 to 50 years | 131 (100.0%) | 0 (0.0%) |
| Total | 424 (68.4%) | 196 (31.6%) |
Fertility by Education in Levittown
Average fertility rate in Levittown is 51.0 births per 1,000 women. Women with the education attainment of bachelor's degree have the highest fertility rate of 106.0 births per 1,000 women, while women with the education attainment of less than high school have the lowest fertility at 7.0 births per 1,000 women. Women with the education attainment of bachelor's degree represent 40.8% of all women with births.
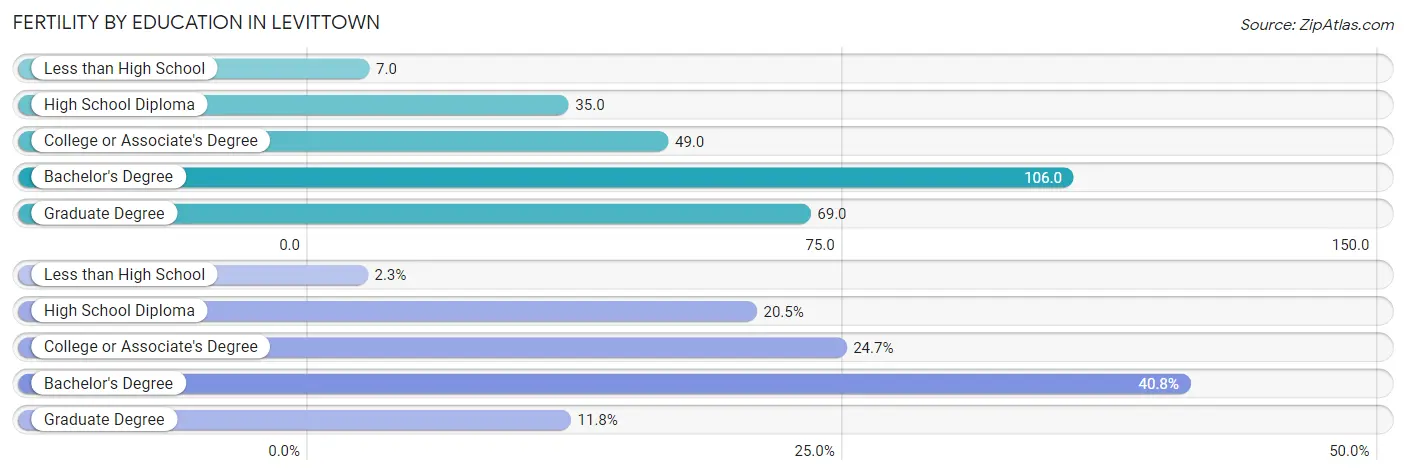
| Educational Attainment | Women with Births | Births / 1,000 Women |
| Less than High School | 14 (2.3%) | 7.0 |
| High School Diploma | 127 (20.5%) | 35.0 |
| College or Associate's Degree | 153 (24.7%) | 49.0 |
| Bachelor's Degree | 253 (40.8%) | 106.0 |
| Graduate Degree | 73 (11.8%) | 69.0 |
| Total | 620 (100.0%) | 51.0 |
Fertility by Education by Marriage Status in Levittown
31.6% of women with births in Levittown are unmarried. Women with the educational attainment of less than high school are most likely to be married with 100.0% of them married at childbirth, while women with the educational attainment of bachelor's degree are least likely to be married with 53.0% of them unmarried at childbirth.
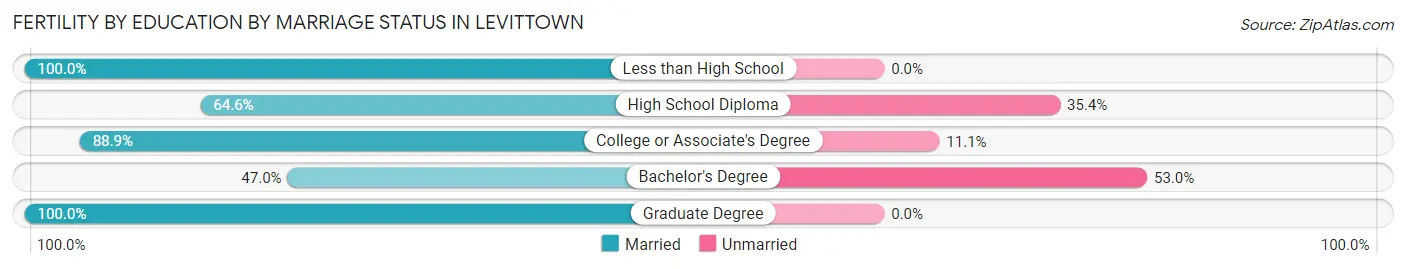
| Educational Attainment | Married | Unmarried |
| Less than High School | 14 (100.0%) | 0 (0.0%) |
| High School Diploma | 82 (64.6%) | 45 (35.4%) |
| College or Associate's Degree | 136 (88.9%) | 17 (11.1%) |
| Bachelor's Degree | 119 (47.0%) | 134 (53.0%) |
| Graduate Degree | 73 (100.0%) | 0 (0.0%) |
| Total | 424 (68.4%) | 196 (31.6%) |
Employment Characteristics in Levittown
Employment by Class of Employer in Levittown
Among the 26,425 employed individuals in Levittown, private company employees (19,161 | 72.5%), not-for-profit organizations (2,074 | 7.9%), and local government employees (2,012 | 7.6%) make up the most common classes of employment.
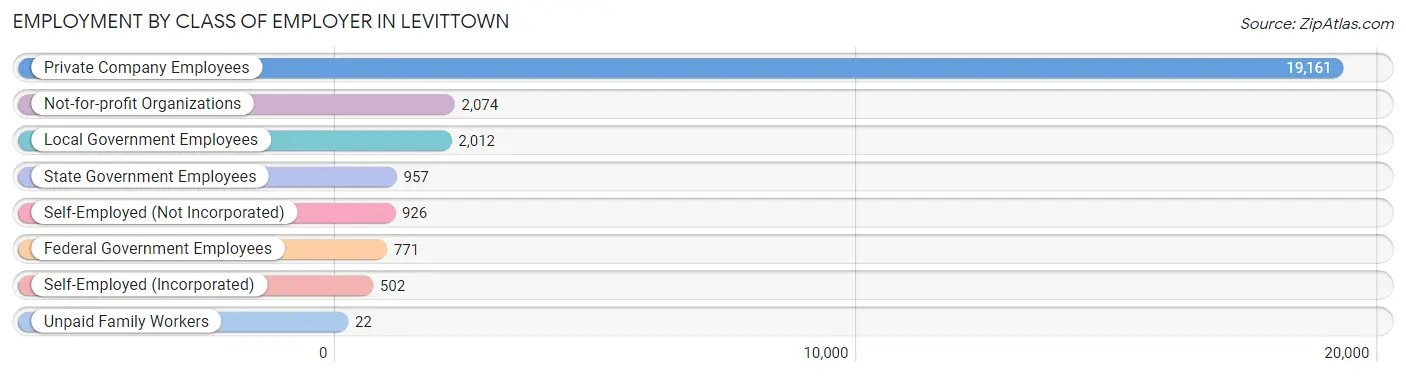
| Employer Class | # Employees | % Employees |
| Private Company Employees | 19,161 | 72.5% |
| Self-Employed (Incorporated) | 502 | 1.9% |
| Self-Employed (Not Incorporated) | 926 | 3.5% |
| Not-for-profit Organizations | 2,074 | 7.9% |
| Local Government Employees | 2,012 | 7.6% |
| State Government Employees | 957 | 3.6% |
| Federal Government Employees | 771 | 2.9% |
| Unpaid Family Workers | 22 | 0.1% |
| Total | 26,425 | 100.0% |
Employment Status by Age in Levittown
According to the labor force statistics for Levittown, out of the total population over 16 years of age (42,345), 67.2% or 28,456 individuals are in the labor force, with 4.8% or 1,366 of them unemployed. The age group with the highest labor force participation rate is 30 to 34 years, with 88.1% or 3,247 individuals in the labor force. Within the labor force, the 20 to 24 years age range has the highest percentage of unemployed individuals, with 12.5% or 318 of them being unemployed.
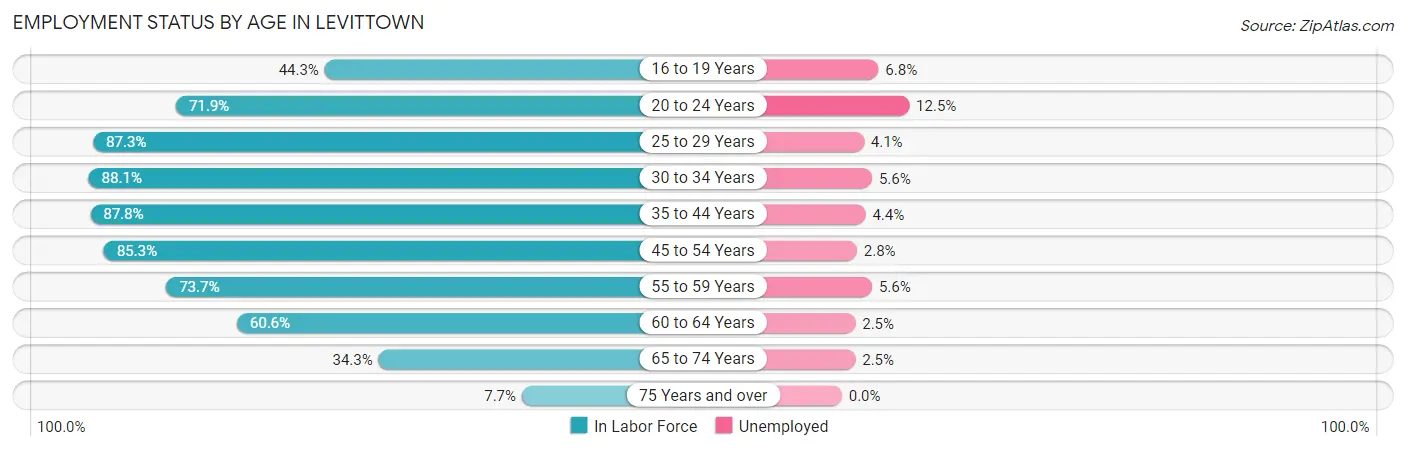
| Age Bracket | In Labor Force | Unemployed |
| 16 to 19 Years | 1,387 (44.3%) | 94 (6.8%) |
| 20 to 24 Years | 2,541 (71.9%) | 318 (12.5%) |
| 25 to 29 Years | 2,863 (87.3%) | 117 (4.1%) |
| 30 to 34 Years | 3,247 (88.1%) | 182 (5.6%) |
| 35 to 44 Years | 6,389 (87.8%) | 281 (4.4%) |
| 45 to 54 Years | 5,393 (85.3%) | 151 (2.8%) |
| 55 to 59 Years | 2,404 (73.7%) | 135 (5.6%) |
| 60 to 64 Years | 2,376 (60.6%) | 59 (2.5%) |
| 65 to 74 Years | 1,583 (34.3%) | 40 (2.5%) |
| 75 Years and over | 255 (7.7%) | 0 (0.0%) |
| Total | 28,456 (67.2%) | 1,366 (4.8%) |
Employment Status by Educational Attainment in Levittown
According to labor force statistics for Levittown, 81.7% of individuals (22,669) out of the total population between 25 and 64 years of age (27,747) are in the labor force, with 4.1% or 929 of them being unemployed. The group with the highest labor force participation rate are those with the educational attainment of bachelor's degree or higher, with 90.3% or 6,742 individuals in the labor force. Within the labor force, individuals with high school diploma education have the highest percentage of unemployment, with 4.6% or 394 of them being unemployed.
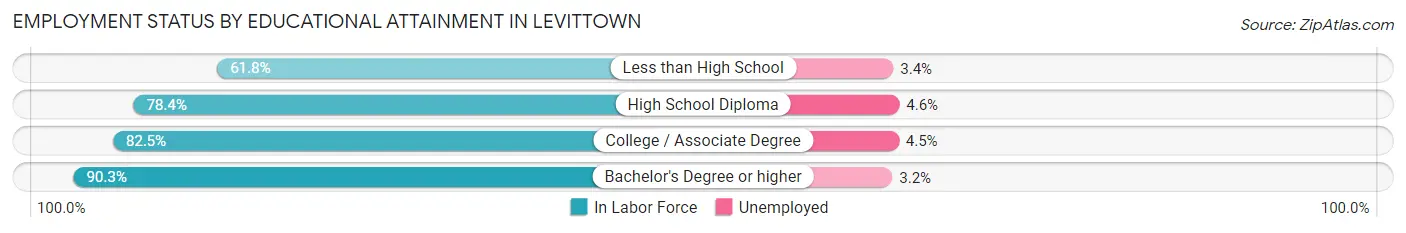
| Educational Attainment | In Labor Force | Unemployed |
| Less than High School | 1,052 (61.8%) | 58 (3.4%) |
| High School Diploma | 8,560 (78.4%) | 502 (4.6%) |
| College / Associate Degree | 6,320 (82.5%) | 345 (4.5%) |
| Bachelor's Degree or higher | 6,742 (90.3%) | 239 (3.2%) |
| Total | 22,669 (81.7%) | 1,138 (4.1%) |
Employment Occupations by Sex in Levittown
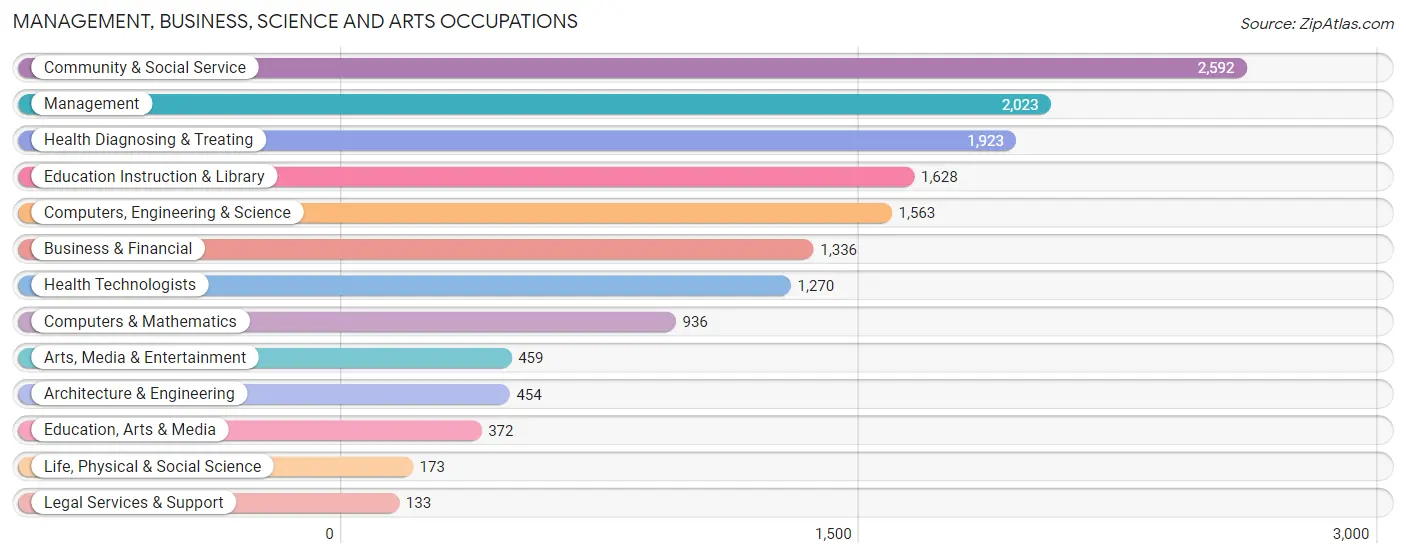
Management, Business, Science and Arts Occupations
The most common Management, Business, Science and Arts occupations in Levittown are Community & Social Service (2,592 | 9.6%), Management (2,023 | 7.5%), Health Diagnosing & Treating (1,923 | 7.1%), Education Instruction & Library (1,628 | 6.0%), and Computers, Engineering & Science (1,563 | 5.8%).
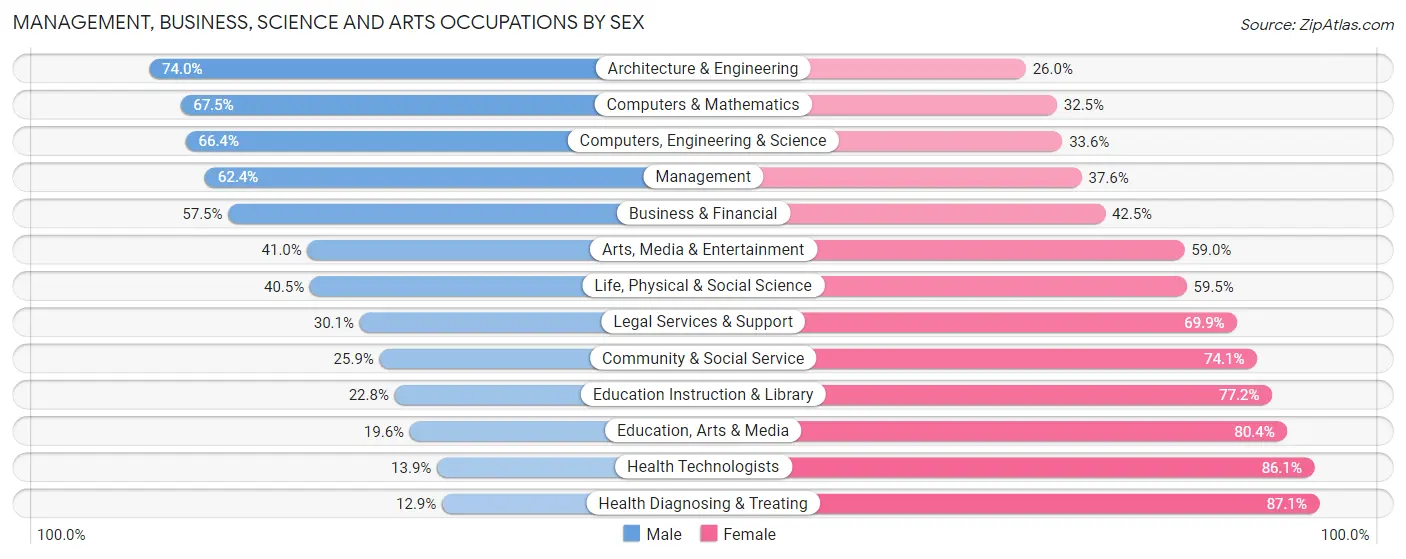
Management, Business, Science and Arts Occupations by Sex
Within the Management, Business, Science and Arts occupations in Levittown, the most male-oriented occupations are Architecture & Engineering (74.0%), Computers & Mathematics (67.5%), and Computers, Engineering & Science (66.4%), while the most female-oriented occupations are Health Diagnosing & Treating (87.1%), Health Technologists (86.1%), and Education, Arts & Media (80.4%).
| Occupation | Male | Female |
| Management | 1,262 (62.4%) | 761 (37.6%) |
| Business & Financial | 768 (57.5%) | 568 (42.5%) |
| Computers, Engineering & Science | 1,038 (66.4%) | 525 (33.6%) |
| Computers & Mathematics | 632 (67.5%) | 304 (32.5%) |
| Architecture & Engineering | 336 (74.0%) | 118 (26.0%) |
| Life, Physical & Social Science | 70 (40.5%) | 103 (59.5%) |
| Community & Social Service | 672 (25.9%) | 1,920 (74.1%) |
| Education, Arts & Media | 73 (19.6%) | 299 (80.4%) |
| Legal Services & Support | 40 (30.1%) | 93 (69.9%) |
| Education Instruction & Library | 371 (22.8%) | 1,257 (77.2%) |
| Arts, Media & Entertainment | 188 (41.0%) | 271 (59.0%) |
| Health Diagnosing & Treating | 248 (12.9%) | 1,675 (87.1%) |
| Health Technologists | 177 (13.9%) | 1,093 (86.1%) |
| Total (Category) | 3,988 (42.3%) | 5,449 (57.7%) |
| Total (Overall) | 14,499 (53.8%) | 12,452 (46.2%) |
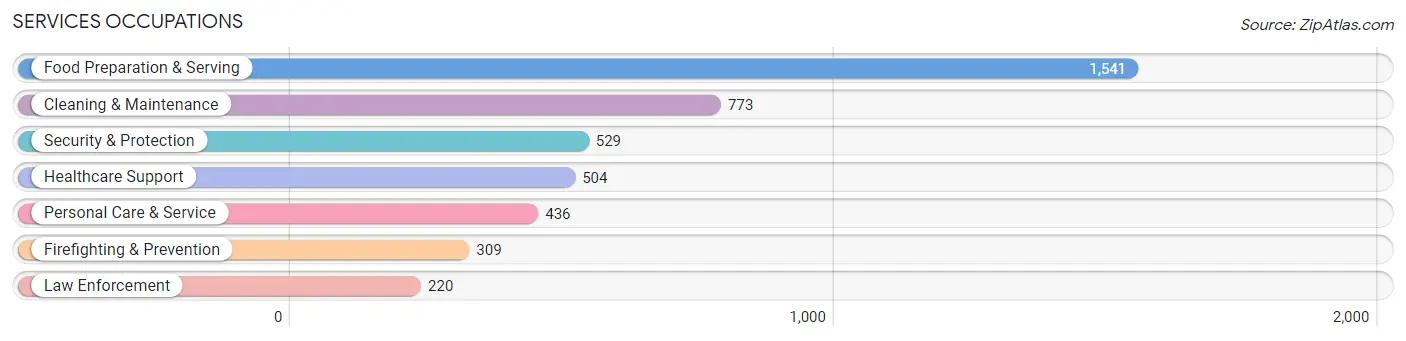
Services Occupations
The most common Services occupations in Levittown are Food Preparation & Serving (1,541 | 5.7%), Cleaning & Maintenance (773 | 2.9%), Security & Protection (529 | 2.0%), Healthcare Support (504 | 1.9%), and Personal Care & Service (436 | 1.6%).
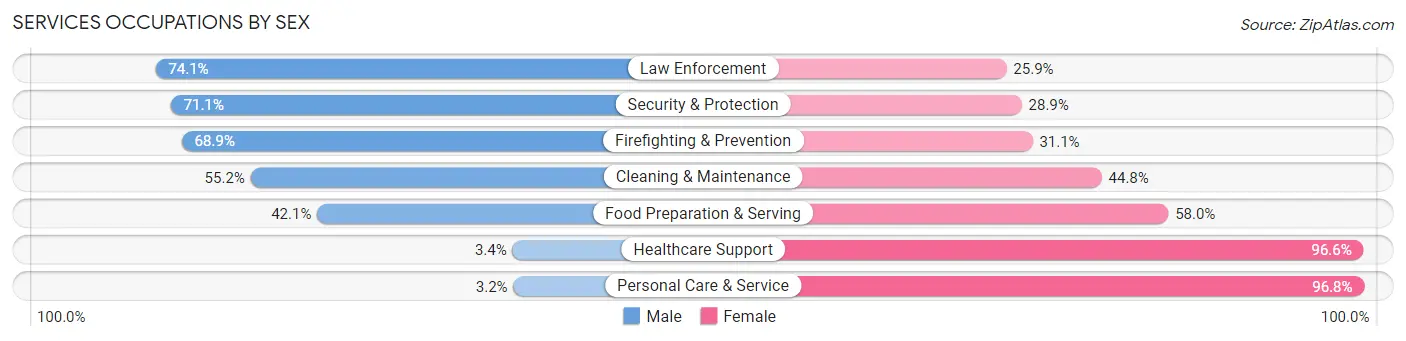
Services Occupations by Sex
Within the Services occupations in Levittown, the most male-oriented occupations are Law Enforcement (74.1%), Security & Protection (71.1%), and Firefighting & Prevention (68.9%), while the most female-oriented occupations are Personal Care & Service (96.8%), Healthcare Support (96.6%), and Food Preparation & Serving (58.0%).
| Occupation | Male | Female |
| Healthcare Support | 17 (3.4%) | 487 (96.6%) |
| Security & Protection | 376 (71.1%) | 153 (28.9%) |
| Firefighting & Prevention | 213 (68.9%) | 96 (31.1%) |
| Law Enforcement | 163 (74.1%) | 57 (25.9%) |
| Food Preparation & Serving | 648 (42.0%) | 893 (58.0%) |
| Cleaning & Maintenance | 427 (55.2%) | 346 (44.8%) |
| Personal Care & Service | 14 (3.2%) | 422 (96.8%) |
| Total (Category) | 1,482 (39.2%) | 2,301 (60.8%) |
| Total (Overall) | 14,499 (53.8%) | 12,452 (46.2%) |
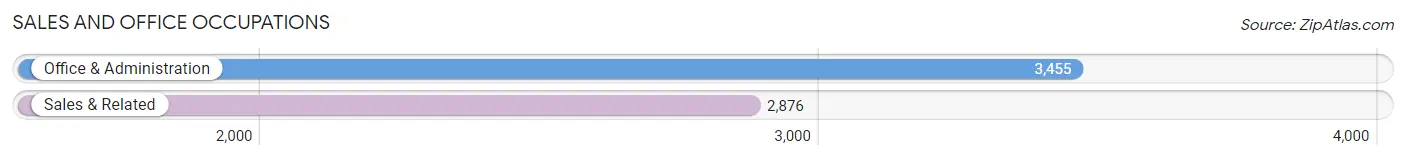
Sales and Office Occupations
The most common Sales and Office occupations in Levittown are Office & Administration (3,455 | 12.8%), and Sales & Related (2,876 | 10.7%).
Sales and Office Occupations by Sex
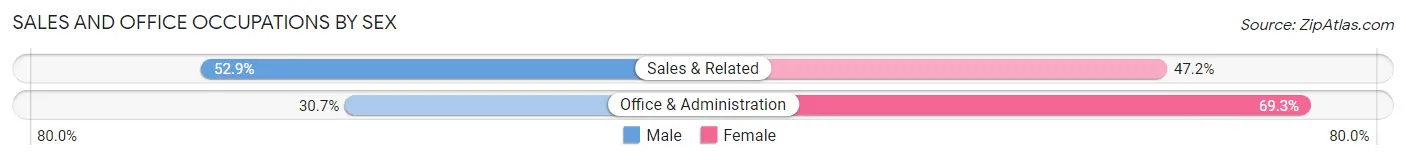
| Occupation | Male | Female |
| Sales & Related | 1,520 (52.8%) | 1,356 (47.1%) |
| Office & Administration | 1,061 (30.7%) | 2,394 (69.3%) |
| Total (Category) | 2,581 (40.8%) | 3,750 (59.2%) |
| Total (Overall) | 14,499 (53.8%) | 12,452 (46.2%) |
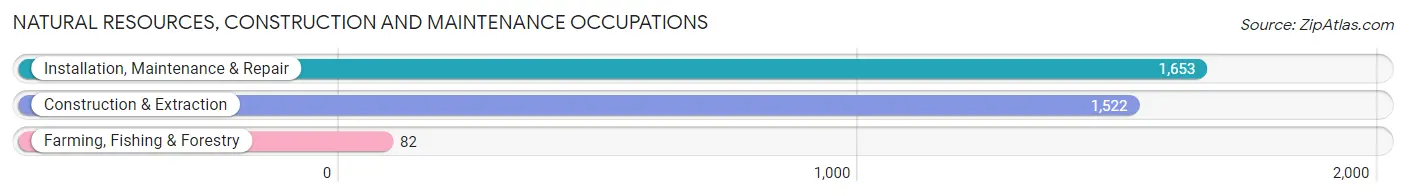
Natural Resources, Construction and Maintenance Occupations
The most common Natural Resources, Construction and Maintenance occupations in Levittown are Installation, Maintenance & Repair (1,653 | 6.1%), Construction & Extraction (1,522 | 5.7%), and Farming, Fishing & Forestry (82 | 0.3%).
Natural Resources, Construction and Maintenance Occupations by Sex
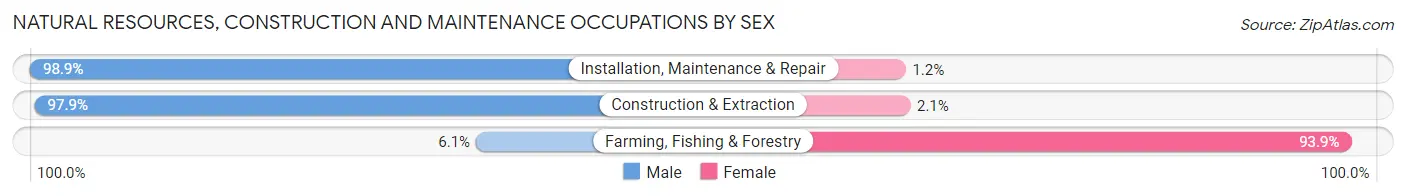
| Occupation | Male | Female |
| Farming, Fishing & Forestry | 5 (6.1%) | 77 (93.9%) |
| Construction & Extraction | 1,490 (97.9%) | 32 (2.1%) |
| Installation, Maintenance & Repair | 1,634 (98.9%) | 19 (1.1%) |
| Total (Category) | 3,129 (96.1%) | 128 (3.9%) |
| Total (Overall) | 14,499 (53.8%) | 12,452 (46.2%) |
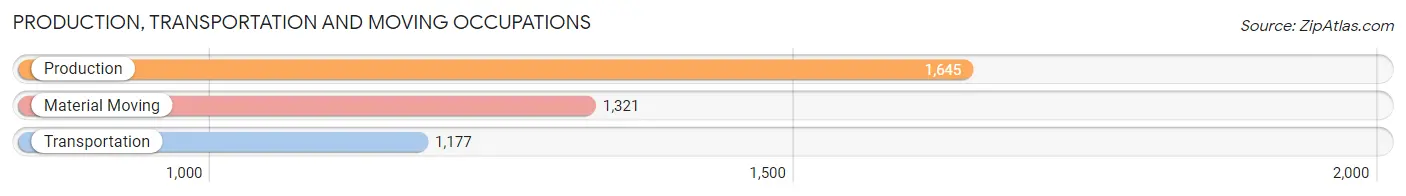
Production, Transportation and Moving Occupations
The most common Production, Transportation and Moving occupations in Levittown are Production (1,645 | 6.1%), Material Moving (1,321 | 4.9%), and Transportation (1,177 | 4.4%).
Production, Transportation and Moving Occupations by Sex
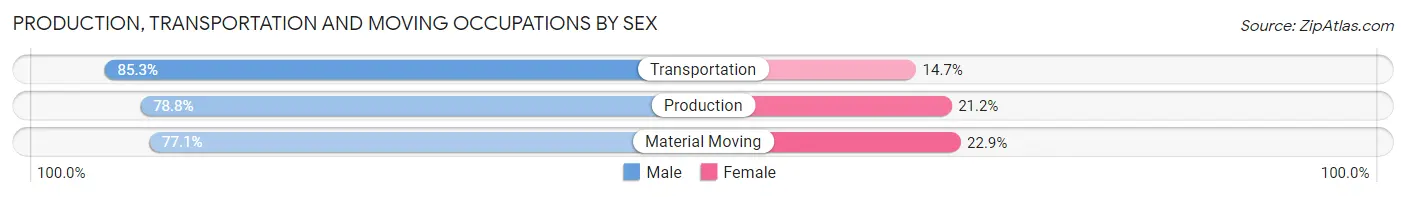
| Occupation | Male | Female |
| Production | 1,296 (78.8%) | 349 (21.2%) |
| Transportation | 1,004 (85.3%) | 173 (14.7%) |
| Material Moving | 1,019 (77.1%) | 302 (22.9%) |
| Total (Category) | 3,319 (80.1%) | 824 (19.9%) |
| Total (Overall) | 14,499 (53.8%) | 12,452 (46.2%) |
Employment Industries by Sex in Levittown
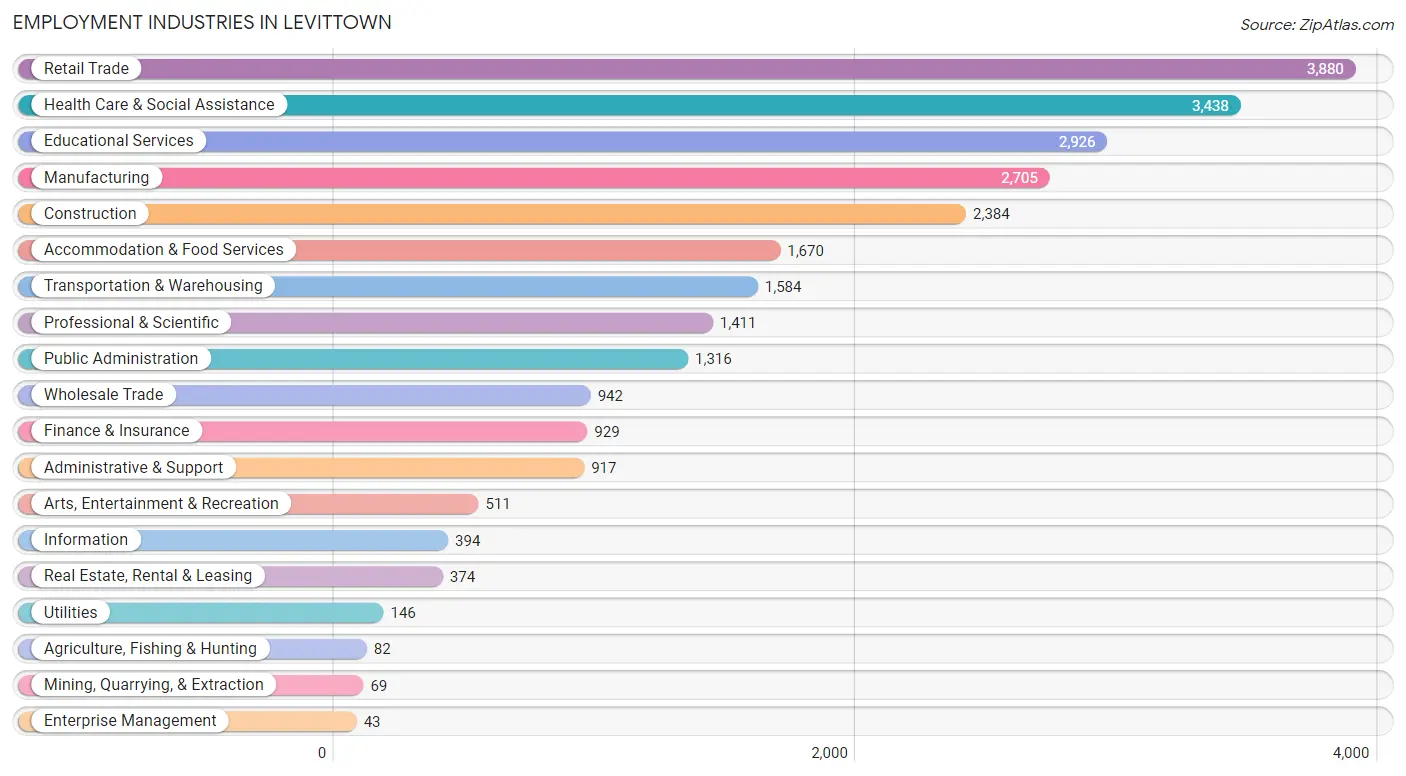
Employment Industries in Levittown
The major employment industries in Levittown include Retail Trade (3,880 | 14.4%), Health Care & Social Assistance (3,438 | 12.8%), Educational Services (2,926 | 10.9%), Manufacturing (2,705 | 10.0%), and Construction (2,384 | 8.8%).
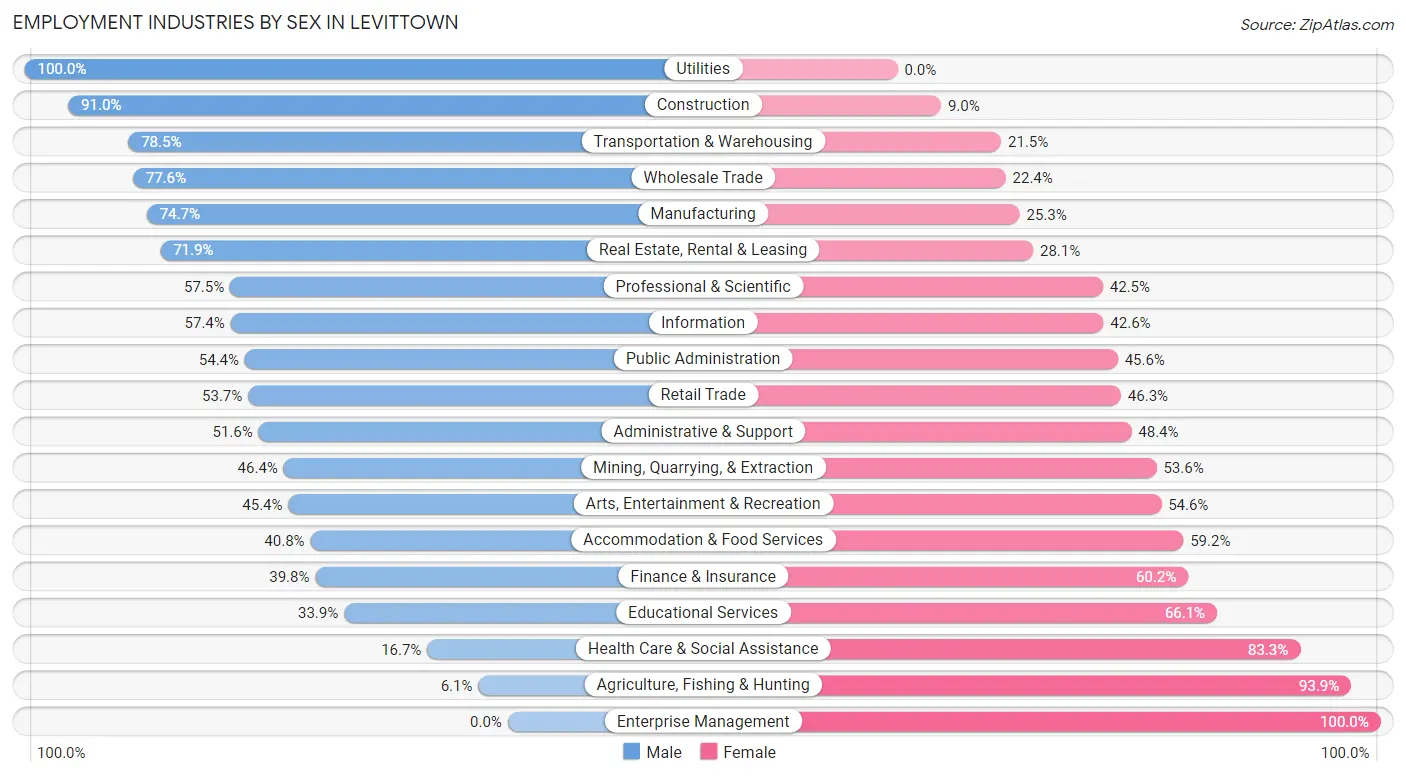
Employment Industries by Sex in Levittown
The Levittown industries that see more men than women are Utilities (100.0%), Construction (91.0%), and Transportation & Warehousing (78.5%), whereas the industries that tend to have a higher number of women are Enterprise Management (100.0%), Agriculture, Fishing & Hunting (93.9%), and Health Care & Social Assistance (83.3%).
| Industry | Male | Female |
| Agriculture, Fishing & Hunting | 5 (6.1%) | 77 (93.9%) |
| Mining, Quarrying, & Extraction | 32 (46.4%) | 37 (53.6%) |
| Construction | 2,169 (91.0%) | 215 (9.0%) |
| Manufacturing | 2,021 (74.7%) | 684 (25.3%) |
| Wholesale Trade | 731 (77.6%) | 211 (22.4%) |
| Retail Trade | 2,085 (53.7%) | 1,795 (46.3%) |
| Transportation & Warehousing | 1,244 (78.5%) | 340 (21.5%) |
| Utilities | 146 (100.0%) | 0 (0.0%) |
| Information | 226 (57.4%) | 168 (42.6%) |
| Finance & Insurance | 370 (39.8%) | 559 (60.2%) |
| Real Estate, Rental & Leasing | 269 (71.9%) | 105 (28.1%) |
| Professional & Scientific | 811 (57.5%) | 600 (42.5%) |
| Enterprise Management | 0 (0.0%) | 43 (100.0%) |
| Administrative & Support | 473 (51.6%) | 444 (48.4%) |
| Educational Services | 991 (33.9%) | 1,935 (66.1%) |
| Health Care & Social Assistance | 573 (16.7%) | 2,865 (83.3%) |
| Arts, Entertainment & Recreation | 232 (45.4%) | 279 (54.6%) |
| Accommodation & Food Services | 682 (40.8%) | 988 (59.2%) |
| Public Administration | 716 (54.4%) | 600 (45.6%) |
| Total | 14,499 (53.8%) | 12,452 (46.2%) |
Education in Levittown
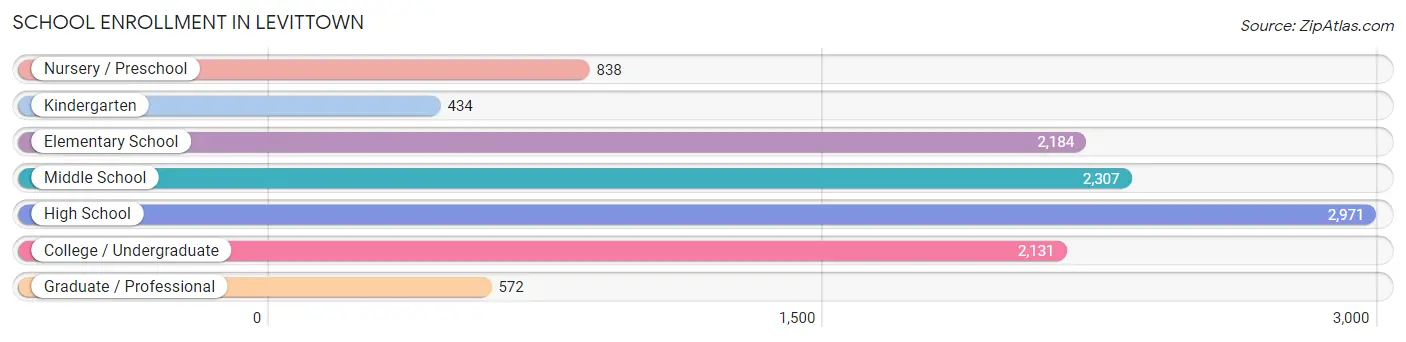
School Enrollment in Levittown
The most common levels of schooling among the 11,437 students in Levittown are high school (2,971 | 26.0%), middle school (2,307 | 20.2%), and elementary school (2,184 | 19.1%).
| School Level | # Students | % Students |
| Nursery / Preschool | 838 | 7.3% |
| Kindergarten | 434 | 3.8% |
| Elementary School | 2,184 | 19.1% |
| Middle School | 2,307 | 20.2% |
| High School | 2,971 | 26.0% |
| College / Undergraduate | 2,131 | 18.6% |
| Graduate / Professional | 572 | 5.0% |
| Total | 11,437 | 100.0% |
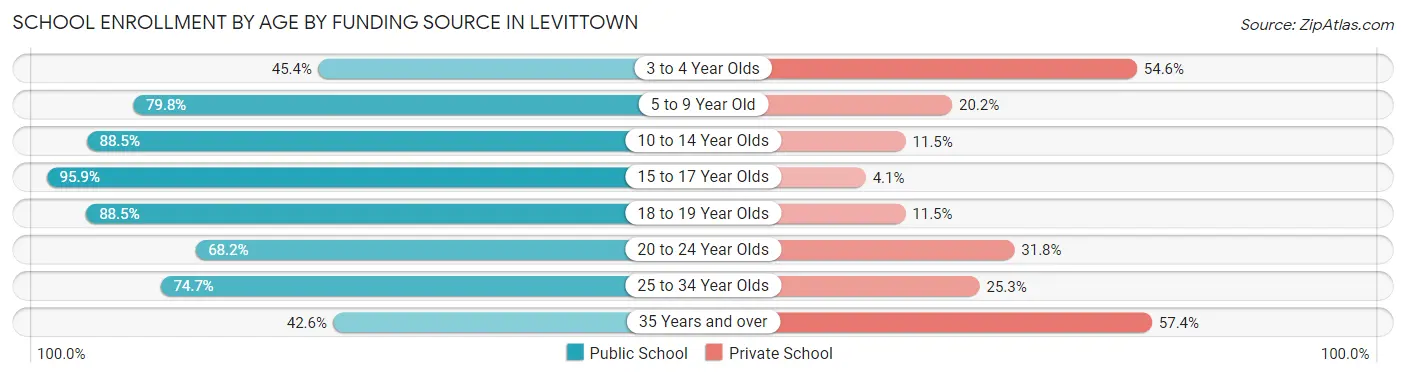
School Enrollment by Age by Funding Source in Levittown
Out of a total of 11,437 students who are enrolled in schools in Levittown, 2,310 (20.2%) attend a private institution, while the remaining 9,127 (79.8%) are enrolled in public schools. The age group of 35 years and over has the highest likelihood of being enrolled in private schools, with 357 (57.4% in the age bracket) enrolled. Conversely, the age group of 15 to 17 year olds has the lowest likelihood of being enrolled in a private school, with 2,060 (95.9% in the age bracket) attending a public institution.
| Age Bracket | Public School | Private School |
| 3 to 4 Year Olds | 335 (45.4%) | 403 (54.6%) |
| 5 to 9 Year Old | 1,965 (79.8%) | 497 (20.2%) |
| 10 to 14 Year Olds | 2,408 (88.5%) | 314 (11.5%) |
| 15 to 17 Year Olds | 2,060 (95.9%) | 88 (4.1%) |
| 18 to 19 Year Olds | 832 (88.5%) | 108 (11.5%) |
| 20 to 24 Year Olds | 897 (68.2%) | 418 (31.8%) |
| 25 to 34 Year Olds | 366 (74.7%) | 124 (25.3%) |
| 35 Years and over | 265 (42.6%) | 357 (57.4%) |
| Total | 9,127 (79.8%) | 2,310 (20.2%) |
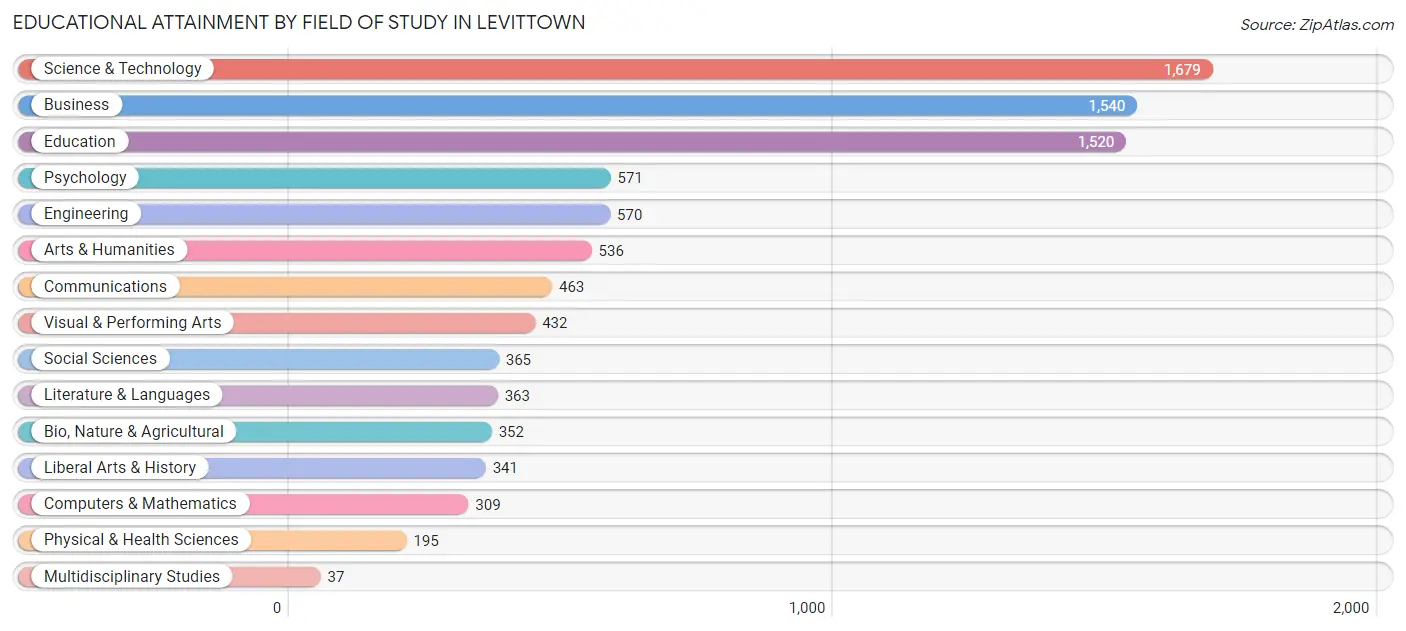
Educational Attainment by Field of Study in Levittown
Science & technology (1,679 | 18.1%), business (1,540 | 16.6%), education (1,520 | 16.4%), psychology (571 | 6.2%), and engineering (570 | 6.1%) are the most common fields of study among 9,273 individuals in Levittown who have obtained a bachelor's degree or higher.
| Field of Study | # Graduates | % Graduates |
| Computers & Mathematics | 309 | 3.3% |
| Bio, Nature & Agricultural | 352 | 3.8% |
| Physical & Health Sciences | 195 | 2.1% |
| Psychology | 571 | 6.2% |
| Social Sciences | 365 | 3.9% |
| Engineering | 570 | 6.1% |
| Multidisciplinary Studies | 37 | 0.4% |
| Science & Technology | 1,679 | 18.1% |
| Business | 1,540 | 16.6% |
| Education | 1,520 | 16.4% |
| Literature & Languages | 363 | 3.9% |
| Liberal Arts & History | 341 | 3.7% |
| Visual & Performing Arts | 432 | 4.7% |
| Communications | 463 | 5.0% |
| Arts & Humanities | 536 | 5.8% |
| Total | 9,273 | 100.0% |
Transportation & Commute in Levittown
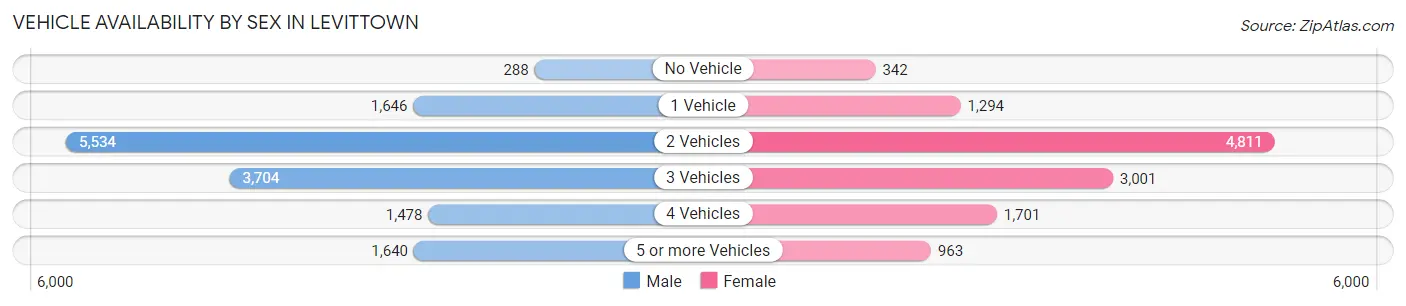
Vehicle Availability by Sex in Levittown
The most prevalent vehicle ownership categories in Levittown are males with 2 vehicles (5,534, accounting for 38.7%) and females with 2 vehicles (4,811, making up 45.7%).
| Vehicles Available | Male | Female |
| No Vehicle | 288 (2.0%) | 342 (2.8%) |
| 1 Vehicle | 1,646 (11.5%) | 1,294 (10.7%) |
| 2 Vehicles | 5,534 (38.7%) | 4,811 (39.7%) |
| 3 Vehicles | 3,704 (25.9%) | 3,001 (24.8%) |
| 4 Vehicles | 1,478 (10.3%) | 1,701 (14.0%) |
| 5 or more Vehicles | 1,640 (11.5%) | 963 (8.0%) |
| Total | 14,290 (100.0%) | 12,112 (100.0%) |
Commute Time in Levittown
The most frequently occuring commute durations in Levittown are 20 to 24 minutes (3,717 commuters, 15.2%), 10 to 14 minutes (3,534 commuters, 14.4%), and 15 to 19 minutes (3,185 commuters, 13.0%).
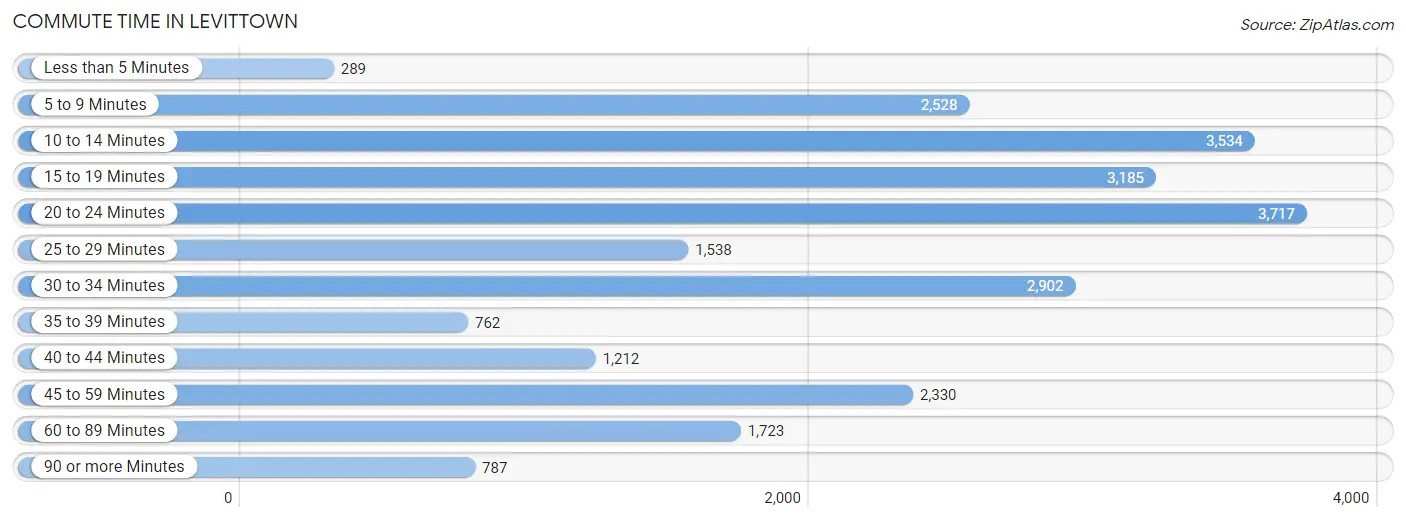
| Commute Time | # Commuters | % Commuters |
| Less than 5 Minutes | 289 | 1.2% |
| 5 to 9 Minutes | 2,528 | 10.3% |
| 10 to 14 Minutes | 3,534 | 14.4% |
| 15 to 19 Minutes | 3,185 | 13.0% |
| 20 to 24 Minutes | 3,717 | 15.2% |
| 25 to 29 Minutes | 1,538 | 6.3% |
| 30 to 34 Minutes | 2,902 | 11.8% |
| 35 to 39 Minutes | 762 | 3.1% |
| 40 to 44 Minutes | 1,212 | 5.0% |
| 45 to 59 Minutes | 2,330 | 9.5% |
| 60 to 89 Minutes | 1,723 | 7.0% |
| 90 or more Minutes | 787 | 3.2% |
Commute Time by Sex in Levittown
The most common commute times in Levittown are 10 to 14 minutes (2,099 commuters, 15.5%) for males and 20 to 24 minutes (1,998 commuters, 18.2%) for females.
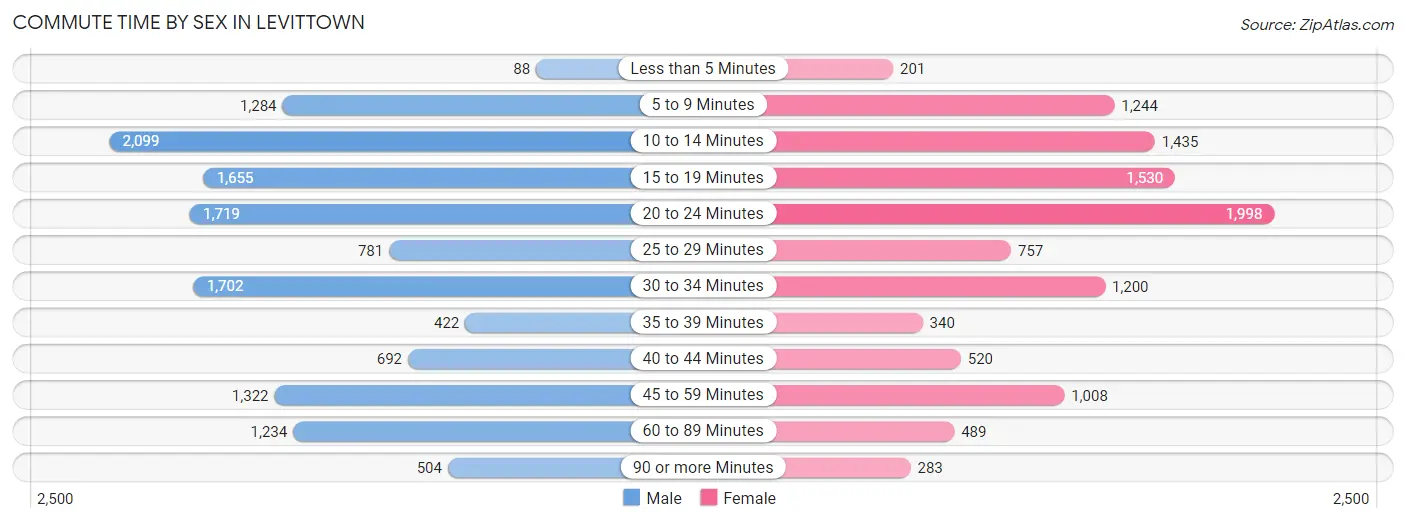
| Commute Time | Male | Female |
| Less than 5 Minutes | 88 (0.6%) | 201 (1.8%) |
| 5 to 9 Minutes | 1,284 (9.5%) | 1,244 (11.3%) |
| 10 to 14 Minutes | 2,099 (15.5%) | 1,435 (13.0%) |
| 15 to 19 Minutes | 1,655 (12.3%) | 1,530 (13.9%) |
| 20 to 24 Minutes | 1,719 (12.7%) | 1,998 (18.2%) |
| 25 to 29 Minutes | 781 (5.8%) | 757 (6.9%) |
| 30 to 34 Minutes | 1,702 (12.6%) | 1,200 (10.9%) |
| 35 to 39 Minutes | 422 (3.1%) | 340 (3.1%) |
| 40 to 44 Minutes | 692 (5.1%) | 520 (4.7%) |
| 45 to 59 Minutes | 1,322 (9.8%) | 1,008 (9.2%) |
| 60 to 89 Minutes | 1,234 (9.1%) | 489 (4.4%) |
| 90 or more Minutes | 504 (3.7%) | 283 (2.6%) |
Time of Departure to Work by Sex in Levittown
The most frequent times of departure to work in Levittown are 6:30 AM to 6:59 AM (1,764, 13.1%) for males and 7:30 AM to 7:59 AM (1,790, 16.3%) for females.
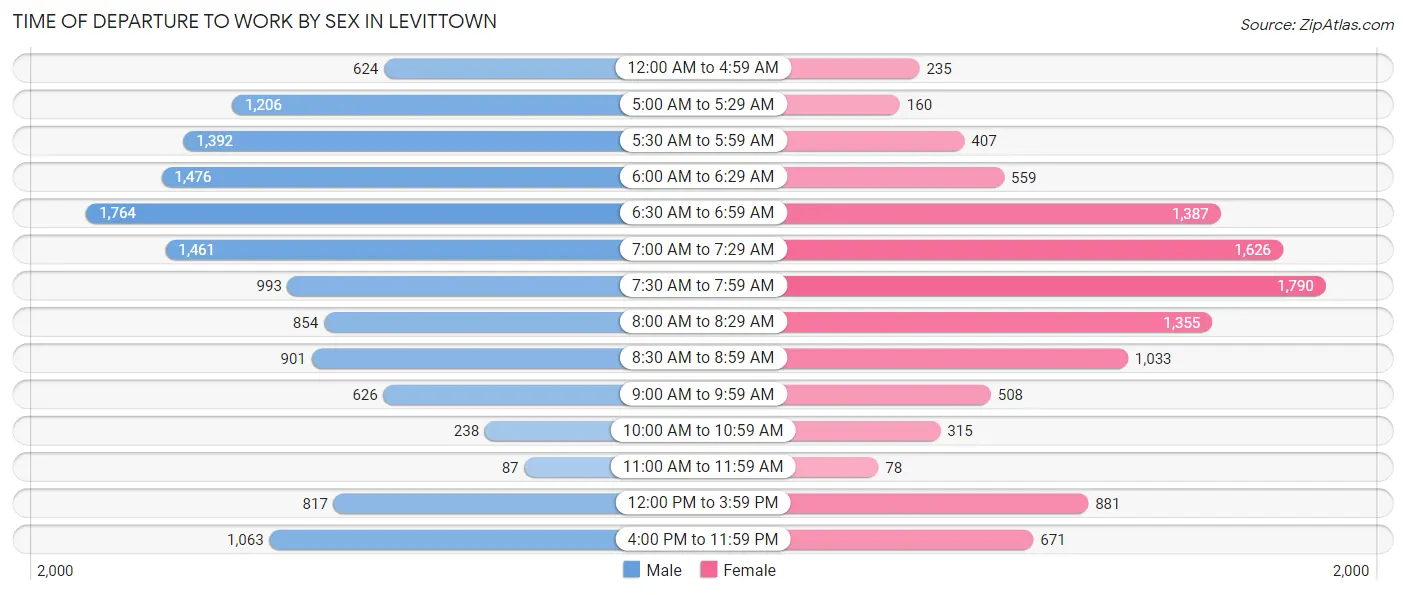
| Time of Departure | Male | Female |
| 12:00 AM to 4:59 AM | 624 (4.6%) | 235 (2.1%) |
| 5:00 AM to 5:29 AM | 1,206 (8.9%) | 160 (1.5%) |
| 5:30 AM to 5:59 AM | 1,392 (10.3%) | 407 (3.7%) |
| 6:00 AM to 6:29 AM | 1,476 (10.9%) | 559 (5.1%) |
| 6:30 AM to 6:59 AM | 1,764 (13.1%) | 1,387 (12.6%) |
| 7:00 AM to 7:29 AM | 1,461 (10.8%) | 1,626 (14.8%) |
| 7:30 AM to 7:59 AM | 993 (7.3%) | 1,790 (16.3%) |
| 8:00 AM to 8:29 AM | 854 (6.3%) | 1,355 (12.3%) |
| 8:30 AM to 8:59 AM | 901 (6.7%) | 1,033 (9.4%) |
| 9:00 AM to 9:59 AM | 626 (4.6%) | 508 (4.6%) |
| 10:00 AM to 10:59 AM | 238 (1.8%) | 315 (2.9%) |
| 11:00 AM to 11:59 AM | 87 (0.6%) | 78 (0.7%) |
| 12:00 PM to 3:59 PM | 817 (6.0%) | 881 (8.0%) |
| 4:00 PM to 11:59 PM | 1,063 (7.9%) | 671 (6.1%) |
| Total | 13,502 (100.0%) | 11,005 (100.0%) |
Housing Occupancy in Levittown
Occupancy by Ownership in Levittown
Of the total 17,799 dwellings in Levittown, owner-occupied units account for 15,471 (86.9%), while renter-occupied units make up 2,328 (13.1%).
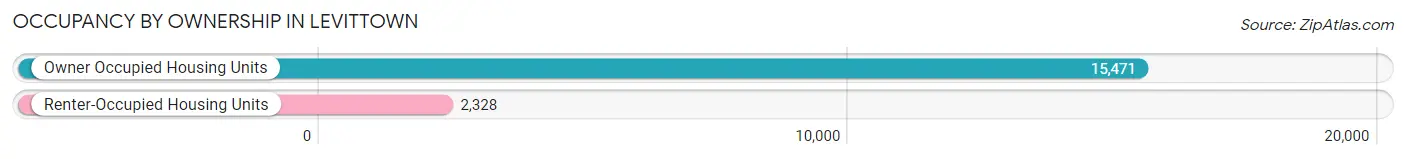
| Occupancy | # Housing Units | % Housing Units |
| Owner Occupied Housing Units | 15,471 | 86.9% |
| Renter-Occupied Housing Units | 2,328 | 13.1% |
| Total Occupied Housing Units | 17,799 | 100.0% |
Occupancy by Household Size in Levittown
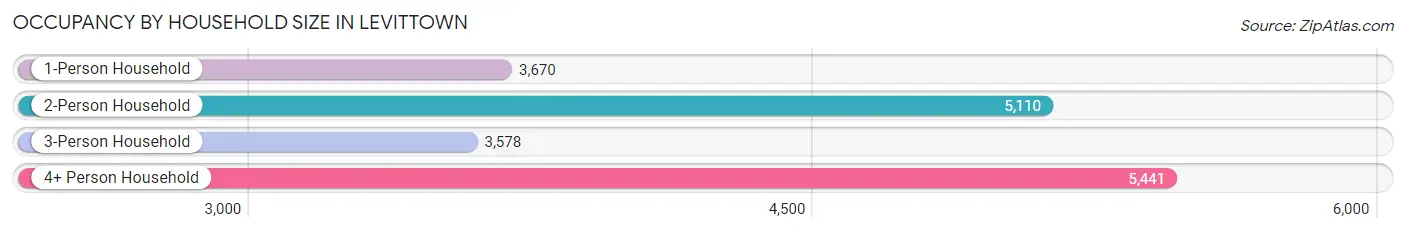
| Household Size | # Housing Units | % Housing Units |
| 1-Person Household | 3,670 | 20.6% |
| 2-Person Household | 5,110 | 28.7% |
| 3-Person Household | 3,578 | 20.1% |
| 4+ Person Household | 5,441 | 30.6% |
| Total Housing Units | 17,799 | 100.0% |
Occupancy by Ownership by Household Size in Levittown
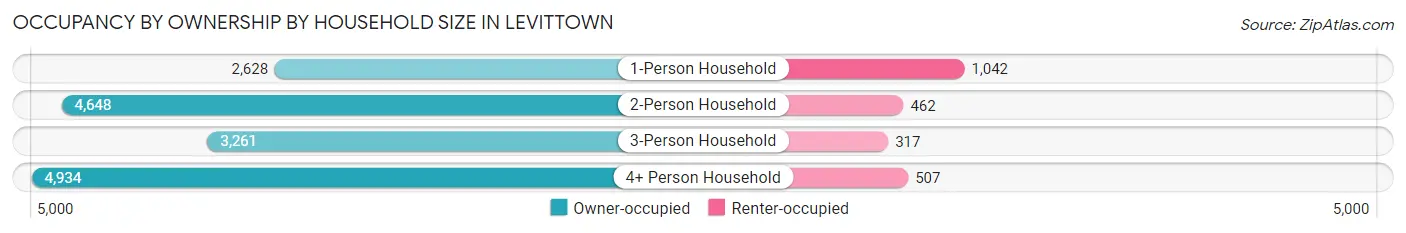
| Household Size | Owner-occupied | Renter-occupied |
| 1-Person Household | 2,628 (71.6%) | 1,042 (28.4%) |
| 2-Person Household | 4,648 (91.0%) | 462 (9.0%) |
| 3-Person Household | 3,261 (91.1%) | 317 (8.9%) |
| 4+ Person Household | 4,934 (90.7%) | 507 (9.3%) |
| Total Housing Units | 15,471 (86.9%) | 2,328 (13.1%) |
Occupancy by Educational Attainment in Levittown
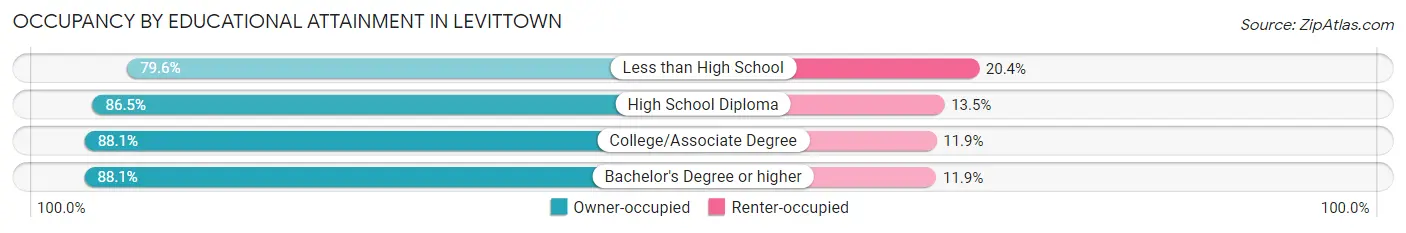
| Household Size | Owner-occupied | Renter-occupied |
| Less than High School | 1,029 (79.6%) | 263 (20.4%) |
| High School Diploma | 5,489 (86.5%) | 856 (13.5%) |
| College/Associate Degree | 4,661 (88.1%) | 631 (11.9%) |
| Bachelor's Degree or higher | 4,292 (88.1%) | 578 (11.9%) |
Occupancy by Age of Householder in Levittown
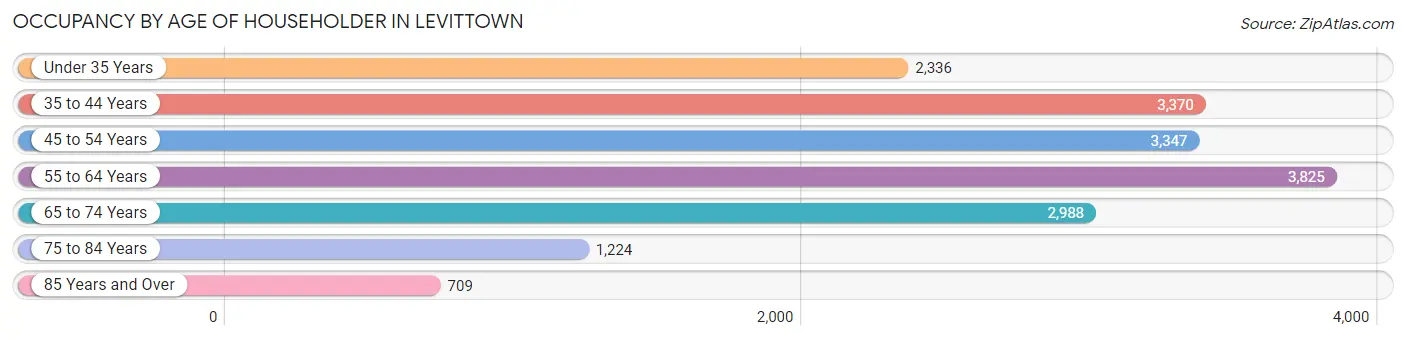
| Age Bracket | # Households | % Households |
| Under 35 Years | 2,336 | 13.1% |
| 35 to 44 Years | 3,370 | 18.9% |
| 45 to 54 Years | 3,347 | 18.8% |
| 55 to 64 Years | 3,825 | 21.5% |
| 65 to 74 Years | 2,988 | 16.8% |
| 75 to 84 Years | 1,224 | 6.9% |
| 85 Years and Over | 709 | 4.0% |
| Total | 17,799 | 100.0% |
Housing Finances in Levittown
Median Income by Occupancy in Levittown
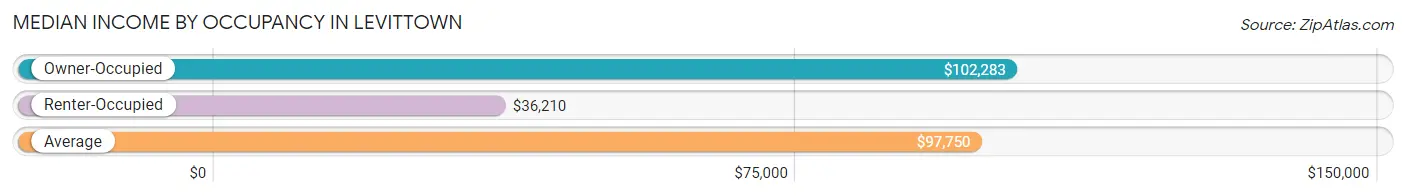
| Occupancy Type | # Households | Median Income |
| Owner-Occupied | 15,471 (86.9%) | $102,283 |
| Renter-Occupied | 2,328 (13.1%) | $36,210 |
| Average | 17,799 (100.0%) | $97,750 |
Occupancy by Householder Income Bracket in Levittown
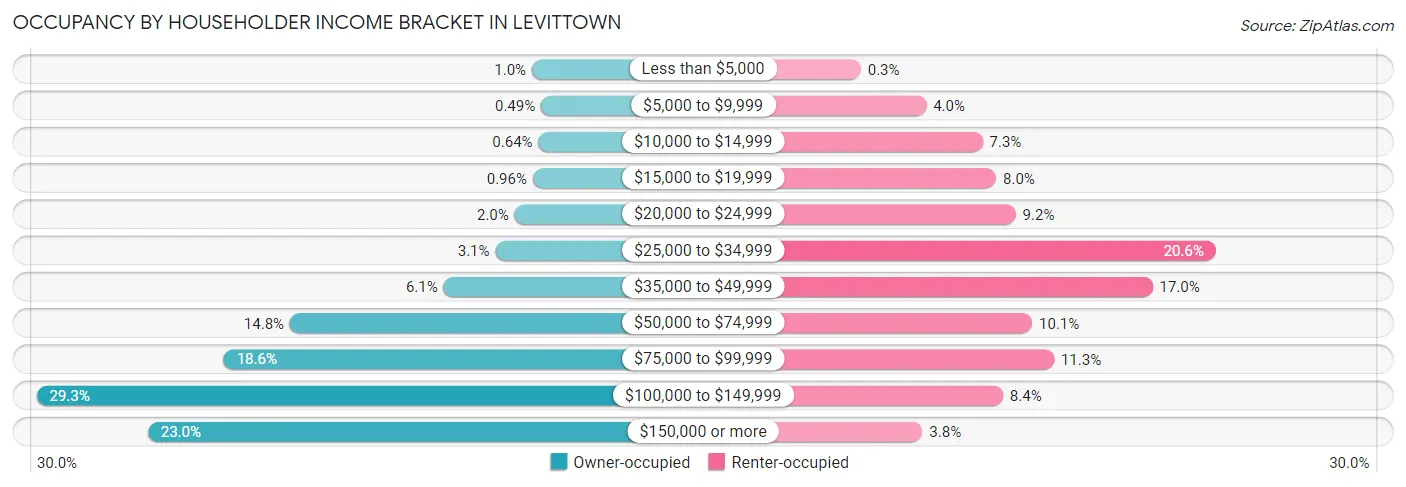
| Income Bracket | Owner-occupied | Renter-occupied |
| Less than $5,000 | 157 (1.0%) | 7 (0.3%) |
| $5,000 to $9,999 | 76 (0.5%) | 94 (4.0%) |
| $10,000 to $14,999 | 99 (0.6%) | 169 (7.3%) |
| $15,000 to $19,999 | 148 (1.0%) | 187 (8.0%) |
| $20,000 to $24,999 | 309 (2.0%) | 213 (9.1%) |
| $25,000 to $34,999 | 480 (3.1%) | 479 (20.6%) |
| $35,000 to $49,999 | 937 (6.1%) | 395 (17.0%) |
| $50,000 to $74,999 | 2,296 (14.8%) | 235 (10.1%) |
| $75,000 to $99,999 | 2,881 (18.6%) | 264 (11.3%) |
| $100,000 to $149,999 | 4,536 (29.3%) | 196 (8.4%) |
| $150,000 or more | 3,552 (23.0%) | 89 (3.8%) |
| Total | 15,471 (100.0%) | 2,328 (100.0%) |
Monthly Housing Cost Tiers in Levittown
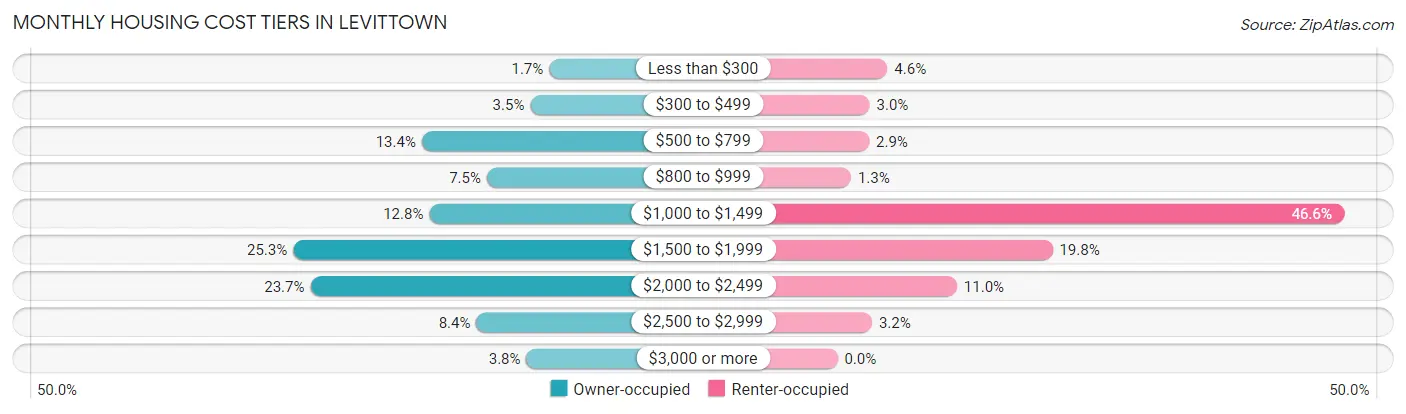
| Monthly Cost | Owner-occupied | Renter-occupied |
| Less than $300 | 265 (1.7%) | 107 (4.6%) |
| $300 to $499 | 533 (3.5%) | 69 (3.0%) |
| $500 to $799 | 2,079 (13.4%) | 68 (2.9%) |
| $800 to $999 | 1,153 (7.4%) | 29 (1.3%) |
| $1,000 to $1,499 | 1,972 (12.8%) | 1,085 (46.6%) |
| $1,500 to $1,999 | 3,912 (25.3%) | 461 (19.8%) |
| $2,000 to $2,499 | 3,666 (23.7%) | 256 (11.0%) |
| $2,500 to $2,999 | 1,302 (8.4%) | 74 (3.2%) |
| $3,000 or more | 589 (3.8%) | 0 (0.0%) |
| Total | 15,471 (100.0%) | 2,328 (100.0%) |
Physical Housing Characteristics in Levittown
Housing Structures in Levittown
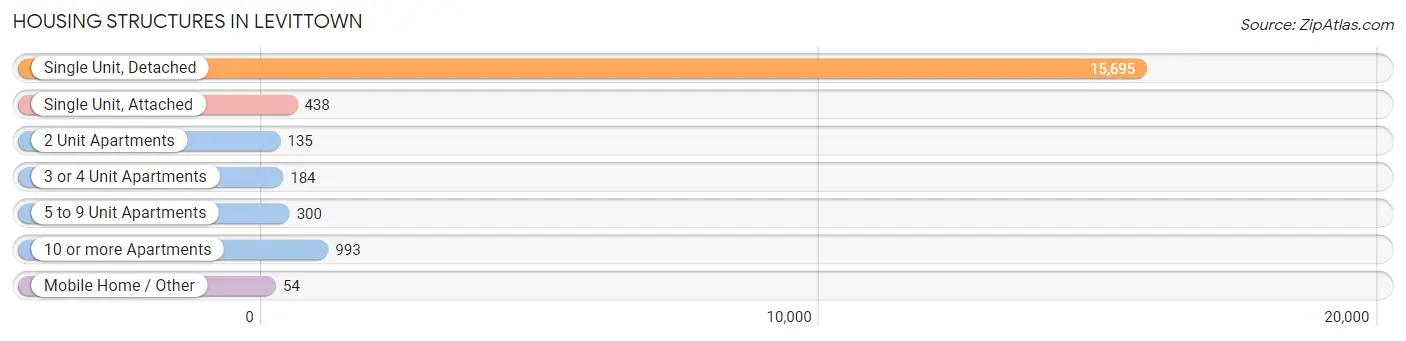
| Structure Type | # Housing Units | % Housing Units |
| Single Unit, Detached | 15,695 | 88.2% |
| Single Unit, Attached | 438 | 2.5% |
| 2 Unit Apartments | 135 | 0.8% |
| 3 or 4 Unit Apartments | 184 | 1.0% |
| 5 to 9 Unit Apartments | 300 | 1.7% |
| 10 or more Apartments | 993 | 5.6% |
| Mobile Home / Other | 54 | 0.3% |
| Total | 17,799 | 100.0% |
Housing Structures by Occupancy in Levittown
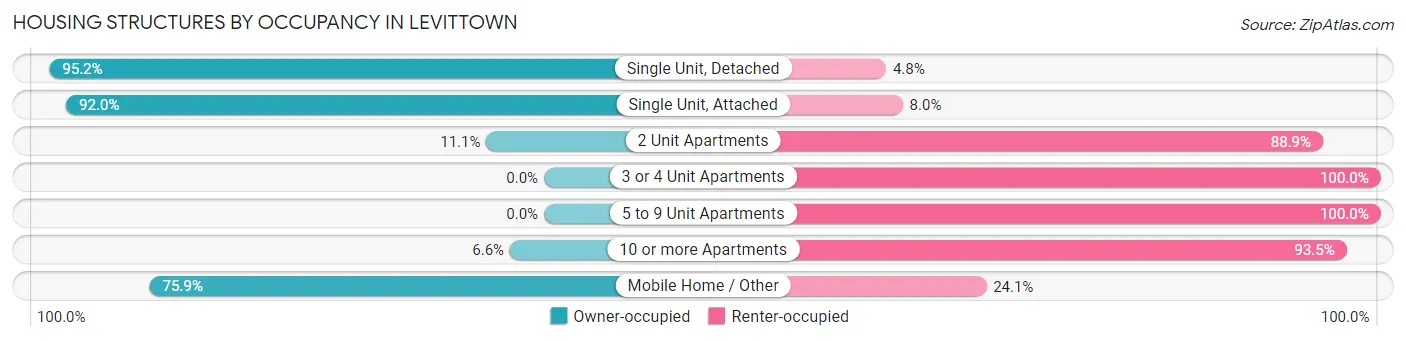
| Structure Type | Owner-occupied | Renter-occupied |
| Single Unit, Detached | 14,947 (95.2%) | 748 (4.8%) |
| Single Unit, Attached | 403 (92.0%) | 35 (8.0%) |
| 2 Unit Apartments | 15 (11.1%) | 120 (88.9%) |
| 3 or 4 Unit Apartments | 0 (0.0%) | 184 (100.0%) |
| 5 to 9 Unit Apartments | 0 (0.0%) | 300 (100.0%) |
| 10 or more Apartments | 65 (6.6%) | 928 (93.4%) |
| Mobile Home / Other | 41 (75.9%) | 13 (24.1%) |
| Total | 15,471 (86.9%) | 2,328 (13.1%) |
Housing Structures by Number of Rooms in Levittown
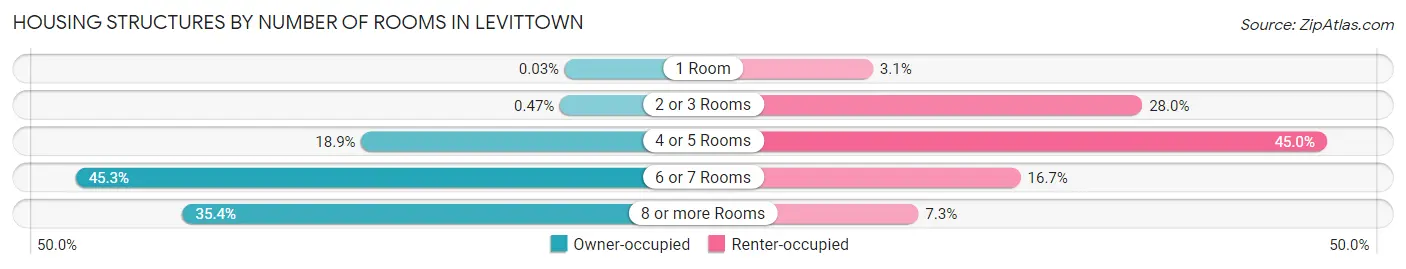
| Number of Rooms | Owner-occupied | Renter-occupied |
| 1 Room | 5 (0.0%) | 71 (3.0%) |
| 2 or 3 Rooms | 72 (0.5%) | 651 (28.0%) |
| 4 or 5 Rooms | 2,916 (18.9%) | 1,048 (45.0%) |
| 6 or 7 Rooms | 7,004 (45.3%) | 389 (16.7%) |
| 8 or more Rooms | 5,474 (35.4%) | 169 (7.3%) |
| Total | 15,471 (100.0%) | 2,328 (100.0%) |
Housing Structure by Heating Type in Levittown
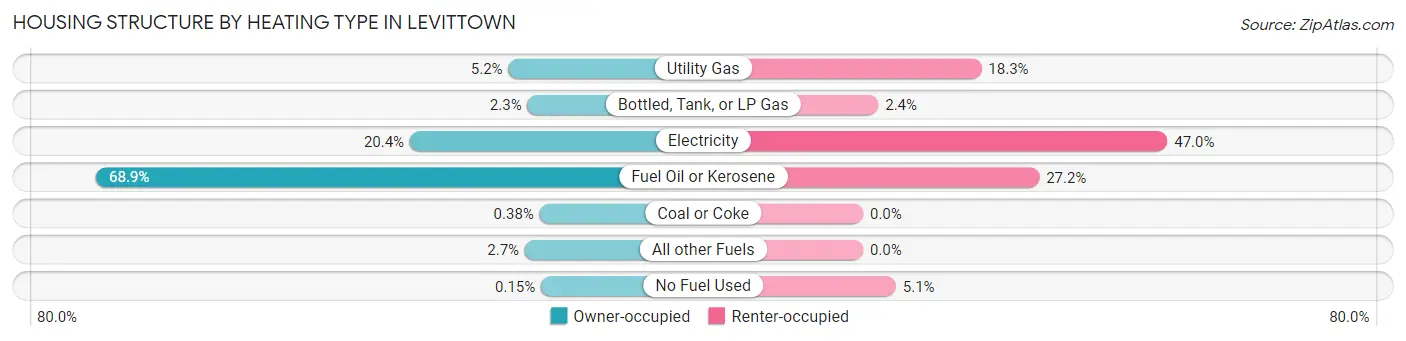
| Heating Type | Owner-occupied | Renter-occupied |
| Utility Gas | 804 (5.2%) | 426 (18.3%) |
| Bottled, Tank, or LP Gas | 349 (2.3%) | 55 (2.4%) |
| Electricity | 3,161 (20.4%) | 1,095 (47.0%) |
| Fuel Oil or Kerosene | 10,665 (68.9%) | 634 (27.2%) |
| Coal or Coke | 59 (0.4%) | 0 (0.0%) |
| All other Fuels | 410 (2.6%) | 0 (0.0%) |
| No Fuel Used | 23 (0.2%) | 118 (5.1%) |
| Total | 15,471 (100.0%) | 2,328 (100.0%) |
Household Vehicle Usage in Levittown
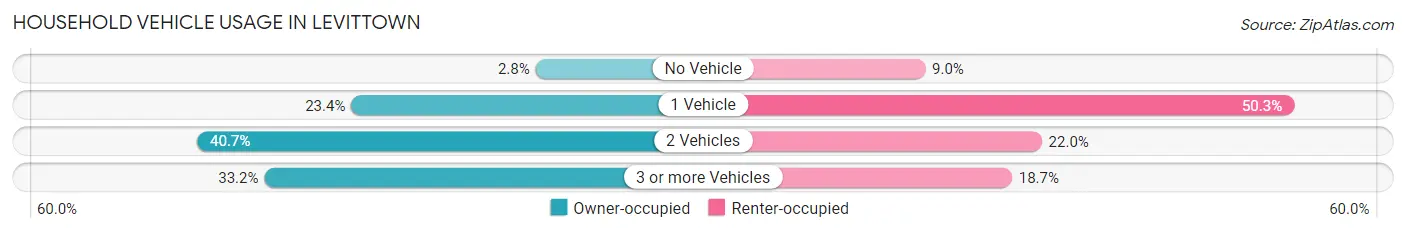
| Vehicles per Household | Owner-occupied | Renter-occupied |
| No Vehicle | 427 (2.8%) | 209 (9.0%) |
| 1 Vehicle | 3,622 (23.4%) | 1,171 (50.3%) |
| 2 Vehicles | 6,294 (40.7%) | 513 (22.0%) |
| 3 or more Vehicles | 5,128 (33.2%) | 435 (18.7%) |
| Total | 15,471 (100.0%) | 2,328 (100.0%) |
Real Estate & Mortgages in Levittown
Real Estate and Mortgage Overview in Levittown
| Characteristic | Without Mortgage | With Mortgage |
| Housing Units | 4,339 | 11,132 |
| Median Property Value | $273,900 | $286,400 |
| Median Household Income | $74,801 | $3,021 |
| Monthly Housing Costs | $748 | $589 |
| Real Estate Taxes | $4,549 | $117 |
Property Value by Mortgage Status in Levittown
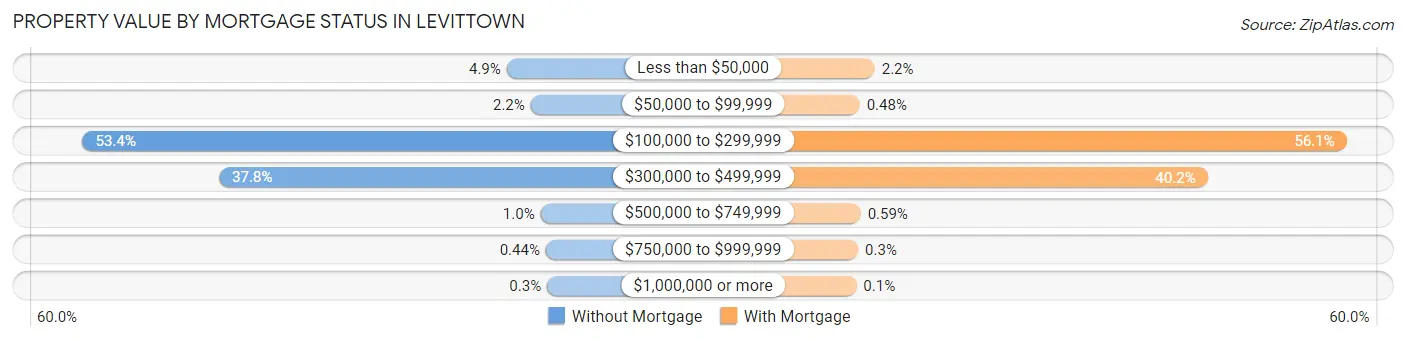
| Property Value | Without Mortgage | With Mortgage |
| Less than $50,000 | 213 (4.9%) | 245 (2.2%) |
| $50,000 to $99,999 | 94 (2.2%) | 53 (0.5%) |
| $100,000 to $299,999 | 2,316 (53.4%) | 6,246 (56.1%) |
| $300,000 to $499,999 | 1,639 (37.8%) | 4,478 (40.2%) |
| $500,000 to $749,999 | 45 (1.0%) | 66 (0.6%) |
| $750,000 to $999,999 | 19 (0.4%) | 33 (0.3%) |
| $1,000,000 or more | 13 (0.3%) | 11 (0.1%) |
| Total | 4,339 (100.0%) | 11,132 (100.0%) |
Household Income by Mortgage Status in Levittown
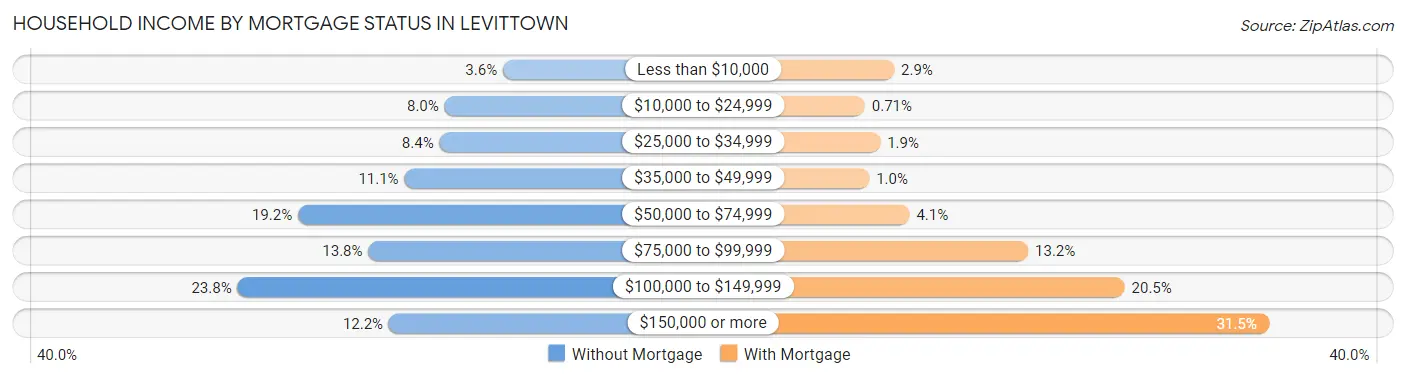
| Household Income | Without Mortgage | With Mortgage |
| Less than $10,000 | 154 (3.5%) | 327 (2.9%) |
| $10,000 to $24,999 | 347 (8.0%) | 79 (0.7%) |
| $25,000 to $34,999 | 364 (8.4%) | 209 (1.9%) |
| $35,000 to $49,999 | 480 (11.1%) | 116 (1.0%) |
| $50,000 to $74,999 | 832 (19.2%) | 457 (4.1%) |
| $75,000 to $99,999 | 599 (13.8%) | 1,464 (13.2%) |
| $100,000 to $149,999 | 1,032 (23.8%) | 2,282 (20.5%) |
| $150,000 or more | 531 (12.2%) | 3,504 (31.5%) |
| Total | 4,339 (100.0%) | 11,132 (100.0%) |
Property Value to Household Income Ratio in Levittown
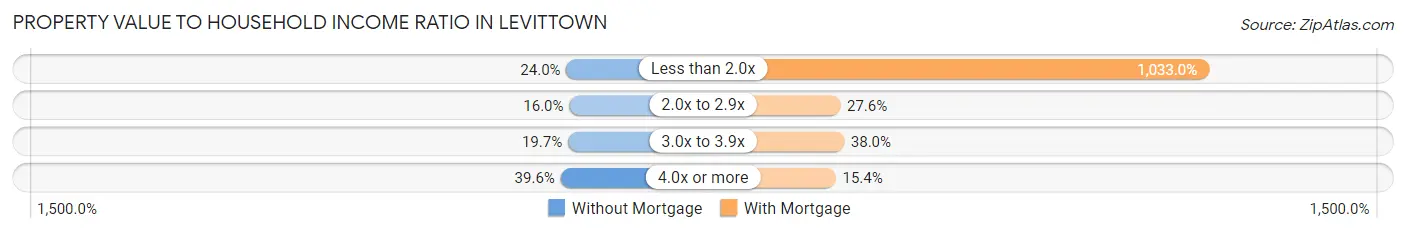
| Value-to-Income Ratio | Without Mortgage | With Mortgage |
| Less than 2.0x | 1,041 (24.0%) | 114,988 (1,032.9%) |
| 2.0x to 2.9x | 693 (16.0%) | 3,068 (27.6%) |
| 3.0x to 3.9x | 855 (19.7%) | 4,226 (38.0%) |
| 4.0x or more | 1,720 (39.6%) | 1,715 (15.4%) |
| Total | 4,339 (100.0%) | 11,132 (100.0%) |
Real Estate Taxes by Mortgage Status in Levittown
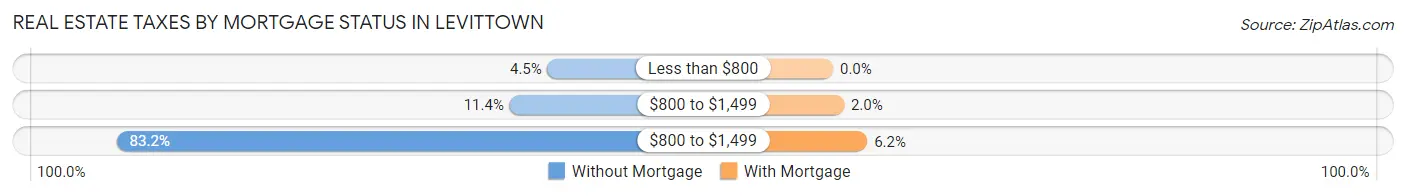
| Property Taxes | Without Mortgage | With Mortgage |
| Less than $800 | 194 (4.5%) | 0 (0.0%) |
| $800 to $1,499 | 494 (11.4%) | 222 (2.0%) |
| $800 to $1,499 | 3,609 (83.2%) | 695 (6.2%) |
| Total | 4,339 (100.0%) | 11,132 (100.0%) |
Health & Disability in Levittown
Health Insurance Coverage by Age in Levittown
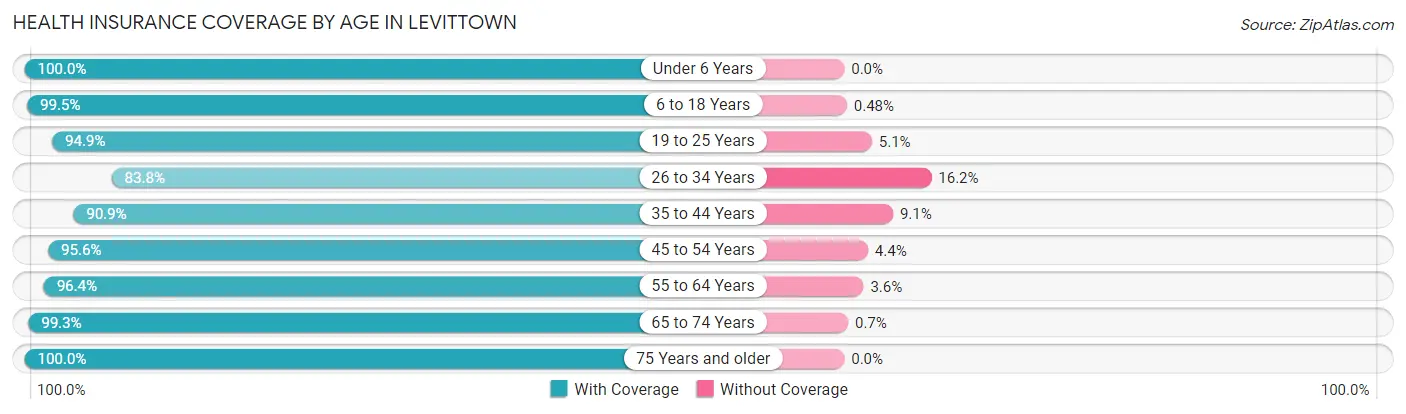
| Age Bracket | With Coverage | Without Coverage |
| Under 6 Years | 3,308 (100.0%) | 0 (0.0%) |
| 6 to 18 Years | 8,007 (99.5%) | 39 (0.5%) |
| 19 to 25 Years | 4,613 (94.9%) | 250 (5.1%) |
| 26 to 34 Years | 5,190 (83.8%) | 1,006 (16.2%) |
| 35 to 44 Years | 6,596 (90.9%) | 659 (9.1%) |
| 45 to 54 Years | 5,958 (95.6%) | 274 (4.4%) |
| 55 to 64 Years | 6,912 (96.4%) | 257 (3.6%) |
| 65 to 74 Years | 4,546 (99.3%) | 32 (0.7%) |
| 75 Years and older | 3,260 (100.0%) | 0 (0.0%) |
| Total | 48,390 (95.1%) | 2,517 (4.9%) |
Health Insurance Coverage by Citizenship Status in Levittown
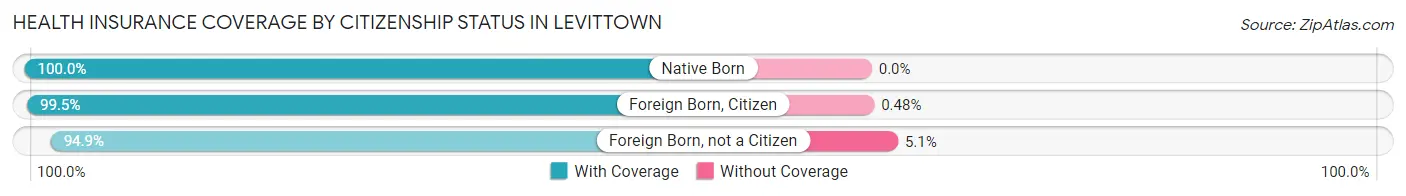
| Citizenship Status | With Coverage | Without Coverage |
| Native Born | 3,308 (100.0%) | 0 (0.0%) |
| Foreign Born, Citizen | 8,007 (99.5%) | 39 (0.5%) |
| Foreign Born, not a Citizen | 4,613 (94.9%) | 250 (5.1%) |
Health Insurance Coverage by Household Income in Levittown
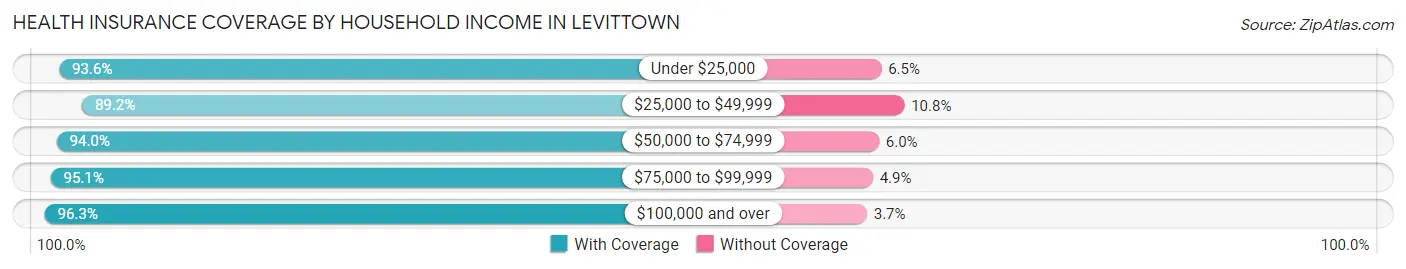
| Household Income | With Coverage | Without Coverage |
| Under $25,000 | 2,003 (93.5%) | 138 (6.5%) |
| $25,000 to $49,999 | 4,096 (89.2%) | 494 (10.8%) |
| $50,000 to $74,999 | 5,723 (94.0%) | 365 (6.0%) |
| $75,000 to $99,999 | 8,069 (95.1%) | 412 (4.9%) |
| $100,000 and over | 28,392 (96.3%) | 1,103 (3.7%) |
Public vs Private Health Insurance Coverage by Age in Levittown
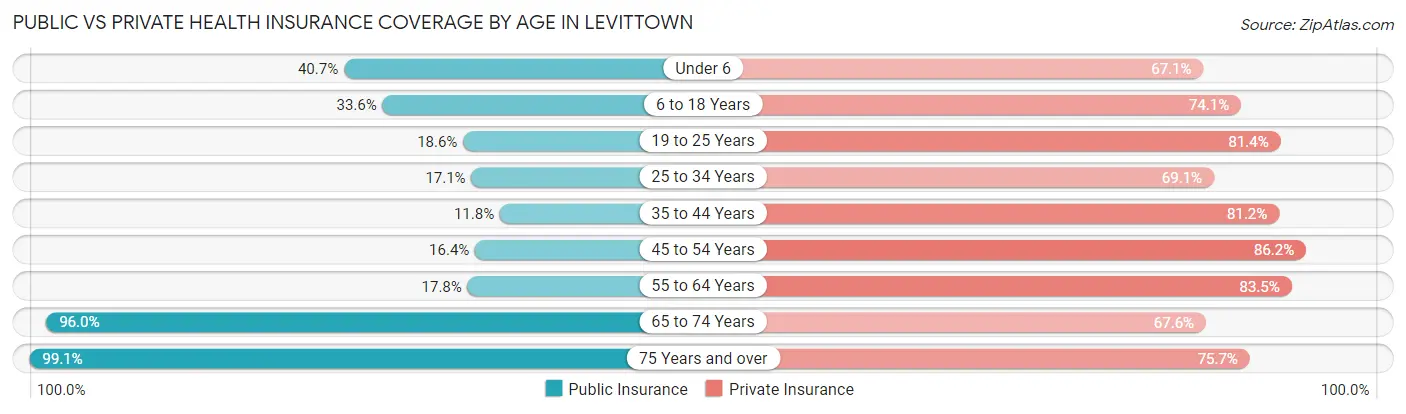
| Age Bracket | Public Insurance | Private Insurance |
| Under 6 | 1,347 (40.7%) | 2,220 (67.1%) |
| 6 to 18 Years | 2,700 (33.6%) | 5,962 (74.1%) |
| 19 to 25 Years | 904 (18.6%) | 3,960 (81.4%) |
| 25 to 34 Years | 1,057 (17.1%) | 4,279 (69.1%) |
| 35 to 44 Years | 853 (11.8%) | 5,889 (81.2%) |
| 45 to 54 Years | 1,020 (16.4%) | 5,370 (86.2%) |
| 55 to 64 Years | 1,274 (17.8%) | 5,985 (83.5%) |
| 65 to 74 Years | 4,394 (96.0%) | 3,094 (67.6%) |
| 75 Years and over | 3,231 (99.1%) | 2,468 (75.7%) |
| Total | 16,780 (33.0%) | 39,227 (77.1%) |
Disability Status by Sex by Age in Levittown
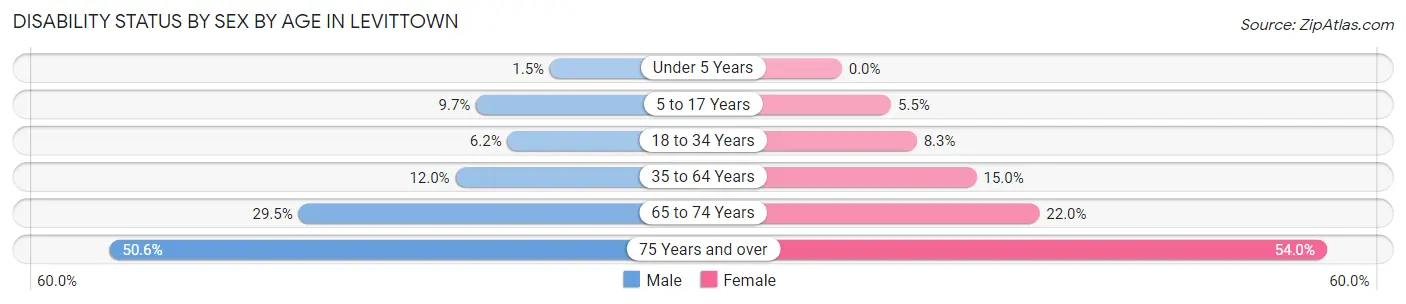
| Age Bracket | Male | Female |
| Under 5 Years | 22 (1.5%) | 0 (0.0%) |
| 5 to 17 Years | 373 (9.7%) | 207 (5.5%) |
| 18 to 34 Years | 386 (6.2%) | 471 (8.3%) |
| 35 to 64 Years | 1,243 (12.0%) | 1,548 (15.0%) |
| 65 to 74 Years | 688 (29.5%) | 494 (22.0%) |
| 75 Years and over | 674 (50.6%) | 1,041 (54.0%) |
Disability Class by Sex by Age in Levittown
Disability Class: Hearing Difficulty
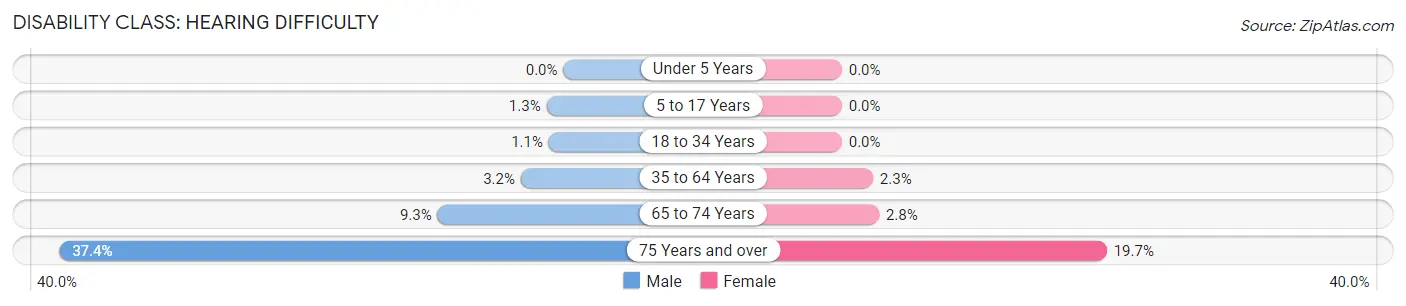
| Age Bracket | Male | Female |
| Under 5 Years | 0 (0.0%) | 0 (0.0%) |
| 5 to 17 Years | 48 (1.3%) | 0 (0.0%) |
| 18 to 34 Years | 67 (1.1%) | 0 (0.0%) |
| 35 to 64 Years | 327 (3.2%) | 238 (2.3%) |
| 65 to 74 Years | 218 (9.3%) | 62 (2.8%) |
| 75 Years and over | 499 (37.4%) | 379 (19.7%) |
Disability Class: Vision Difficulty
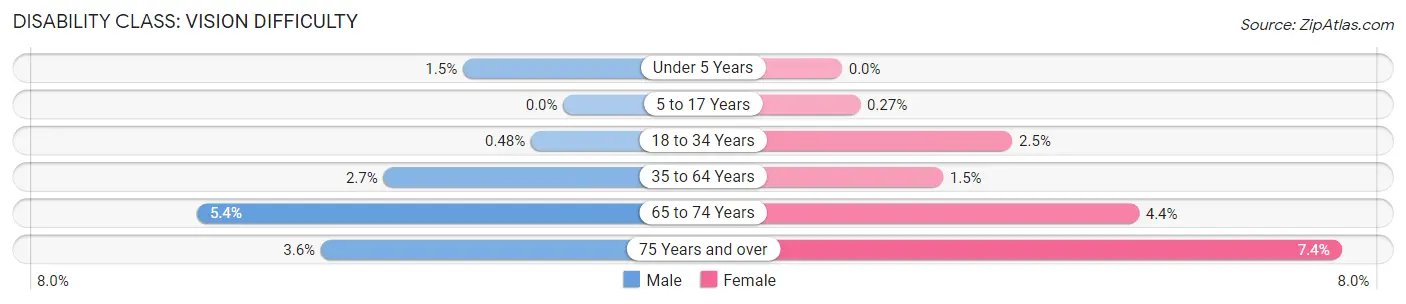
| Age Bracket | Male | Female |
| Under 5 Years | 22 (1.5%) | 0 (0.0%) |
| 5 to 17 Years | 0 (0.0%) | 10 (0.3%) |
| 18 to 34 Years | 30 (0.5%) | 143 (2.5%) |
| 35 to 64 Years | 276 (2.7%) | 155 (1.5%) |
| 65 to 74 Years | 127 (5.4%) | 99 (4.4%) |
| 75 Years and over | 48 (3.6%) | 143 (7.4%) |
Disability Class: Cognitive Difficulty
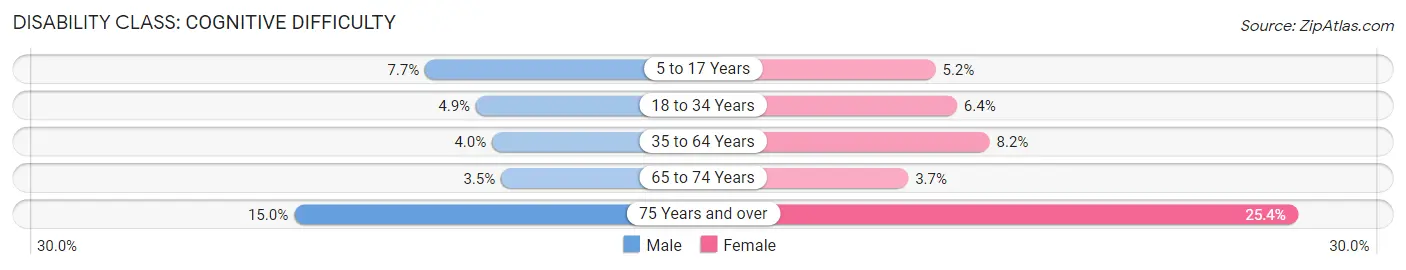
| Age Bracket | Male | Female |
| 5 to 17 Years | 296 (7.7%) | 197 (5.2%) |
| 18 to 34 Years | 302 (4.9%) | 362 (6.4%) |
| 35 to 64 Years | 411 (4.0%) | 849 (8.2%) |
| 65 to 74 Years | 81 (3.5%) | 83 (3.7%) |
| 75 Years and over | 200 (15.0%) | 489 (25.4%) |
Disability Class: Ambulatory Difficulty
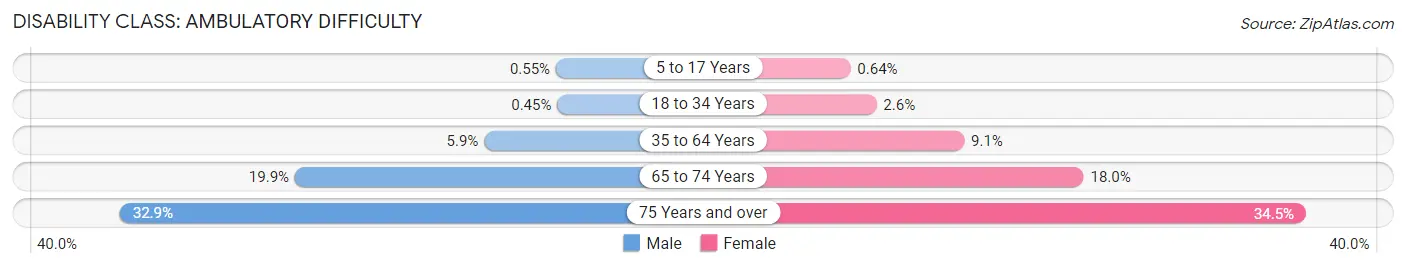
| Age Bracket | Male | Female |
| 5 to 17 Years | 21 (0.5%) | 24 (0.6%) |
| 18 to 34 Years | 28 (0.4%) | 145 (2.6%) |
| 35 to 64 Years | 608 (5.9%) | 936 (9.1%) |
| 65 to 74 Years | 465 (19.9%) | 403 (17.9%) |
| 75 Years and over | 439 (32.9%) | 664 (34.5%) |
Disability Class: Self-Care Difficulty
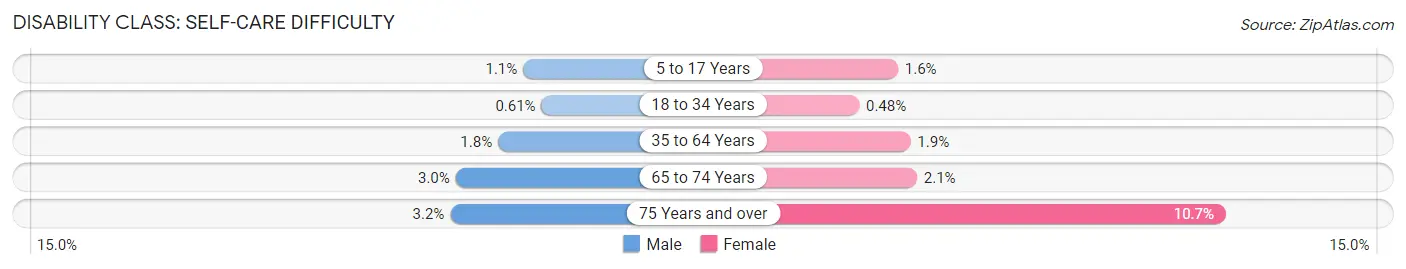
| Age Bracket | Male | Female |
| 5 to 17 Years | 43 (1.1%) | 59 (1.6%) |
| 18 to 34 Years | 38 (0.6%) | 27 (0.5%) |
| 35 to 64 Years | 188 (1.8%) | 197 (1.9%) |
| 65 to 74 Years | 70 (3.0%) | 47 (2.1%) |
| 75 Years and over | 42 (3.2%) | 206 (10.7%) |
Technology Access in Levittown
Computing Device Access in Levittown
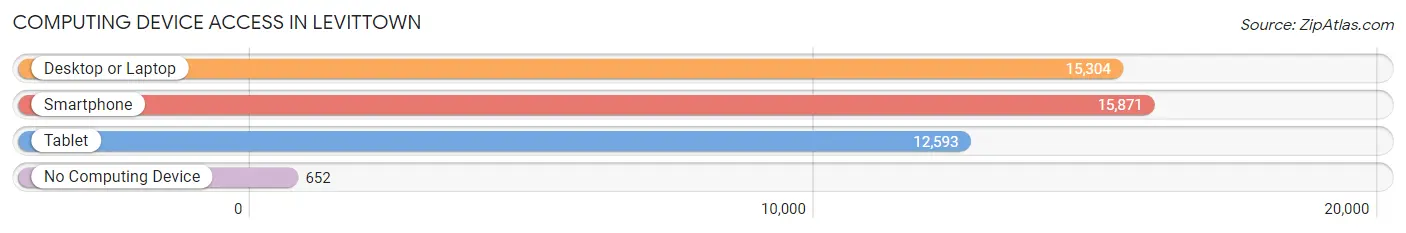
| Device Type | # Households | % Households |
| Desktop or Laptop | 15,304 | 86.0% |
| Smartphone | 15,871 | 89.2% |
| Tablet | 12,593 | 70.8% |
| No Computing Device | 652 | 3.7% |
| Total | 17,799 | 100.0% |
Internet Access in Levittown
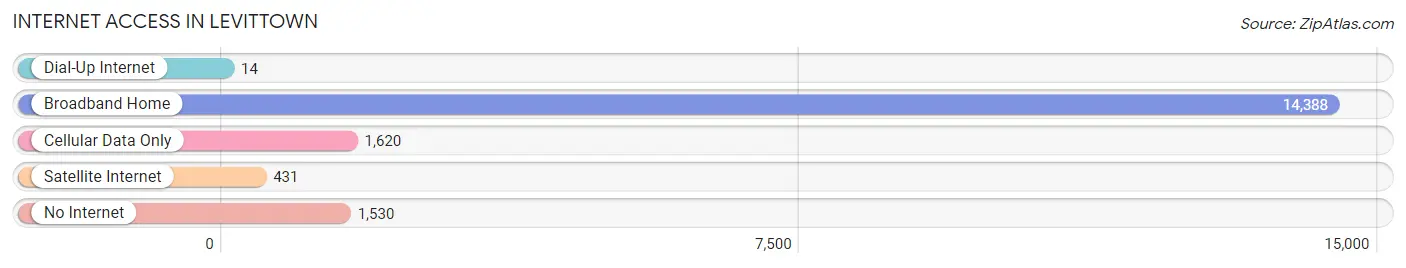
| Internet Type | # Households | % Households |
| Dial-Up Internet | 14 | 0.1% |
| Broadband Home | 14,388 | 80.8% |
| Cellular Data Only | 1,620 | 9.1% |
| Satellite Internet | 431 | 2.4% |
| No Internet | 1,530 | 8.6% |
| Total | 17,799 | 100.0% |
Levittown Summary
Levittown, Pennsylvania is a census-designated place located in Bucks County, Pennsylvania. It is a suburb of Philadelphia and is located approximately 25 miles northeast of the city. The population of Levittown was 52,983 at the 2010 census.
History
Levittown was founded in 1952 by William Levitt, a real estate developer who had previously developed the town of Levittown, New York. Levittown was the first large-scale, mass-produced suburb in the United States. Levittown was designed to provide affordable housing for returning World War II veterans and their families. The homes were designed to be affordable and easy to construct, with a simple, boxy design and a single-story floor plan. The homes were constructed in a modular fashion, with pre-fabricated parts that could be quickly assembled on site.
The town was designed to be a self-contained community, with shopping centers, schools, churches, and other amenities. The town was also designed to be racially segregated, with the majority of the homes being sold to white families. This policy was eventually overturned in the late 1960s, and the town has since become more diverse.
Geography
Levittown is located in Bucks County, Pennsylvania, approximately 25 miles northeast of Philadelphia. The town is situated on a flat plain, with the Neshaminy Creek running through the center of town. The town is bordered by the towns of Bristol, Middletown, and Falls Township.
The climate in Levittown is classified as humid subtropical, with hot, humid summers and cold, wet winters. The average annual temperature is around 54°F, with an average high of around 80°F in the summer and an average low of around 30°F in the winter.
Economy
The economy of Levittown is largely based on retail and services. The town is home to several large shopping centers, including the Oxford Valley Mall and the Levittown Town Center. The town is also home to several large employers, including the Neshaminy Mall, the Oxford Valley Mall, and the Levittown Town Center.
The town is also home to several small businesses, including restaurants, retail stores, and professional services. The town is also home to several industrial parks, which provide employment for many of the town's residents.
Demographics
As of the 2010 census, the population of Levittown was 52,983. The racial makeup of the town was 87.3% White, 5.3% African American, 0.3% Native American, 2.7% Asian, 0.1% Pacific Islander, 1.7% from other races, and 2.6% from two or more races. Hispanic or Latino of any race were 5.2% of the population.
The median income for a household in Levittown was $63,945, and the median income for a family was $76,945. The per capita income for the town was $30,945. About 4.3% of families and 5.7% of the population were below the poverty line, including 7.2% of those under age 18 and 4.2% of those age 65 or over.
Common Questions
What is Per Capita Income in Levittown?
Per Capita income in Levittown is $38,713.
What is the Median Family Income in Levittown?
Median Family Income in Levittown is $103,187.
What is the Median Household income in Levittown?
Median Household Income in Levittown is $97,750.
What is Income or Wage Gap in Levittown?
Income or Wage Gap in Levittown is 27.8%.
Women in Levittown earn 72.2 cents for every dollar earned by a man.
What is Inequality or Gini Index in Levittown?
Inequality or Gini Index in Levittown is 0.36.
What is the Total Population of Levittown?
Total Population of Levittown is 51,152.
What is the Total Male Population of Levittown?
Total Male Population of Levittown is 25,595.
What is the Total Female Population of Levittown?
Total Female Population of Levittown is 25,557.
What is the Ratio of Males per 100 Females in Levittown?
There are 100.15 Males per 100 Females in Levittown.
What is the Ratio of Females per 100 Males in Levittown?
There are 99.85 Females per 100 Males in Levittown.
What is the Median Population Age in Levittown?
Median Population Age in Levittown is 39.7 Years.
What is the Average Family Size in Levittown
Average Family Size in Levittown is 3.2 People.
What is the Average Household Size in Levittown
Average Household Size in Levittown is 2.9 People.
How Large is the Labor Force in Levittown?
There are 28,456 People in the Labor Forcein in Levittown.
What is the Percentage of People in the Labor Force in Levittown?
67.2% of People are in the Labor Force in Levittown.
What is the Unemployment Rate in Levittown?
Unemployment Rate in Levittown is 4.8%.