Lebanon, PA Map & Demographics
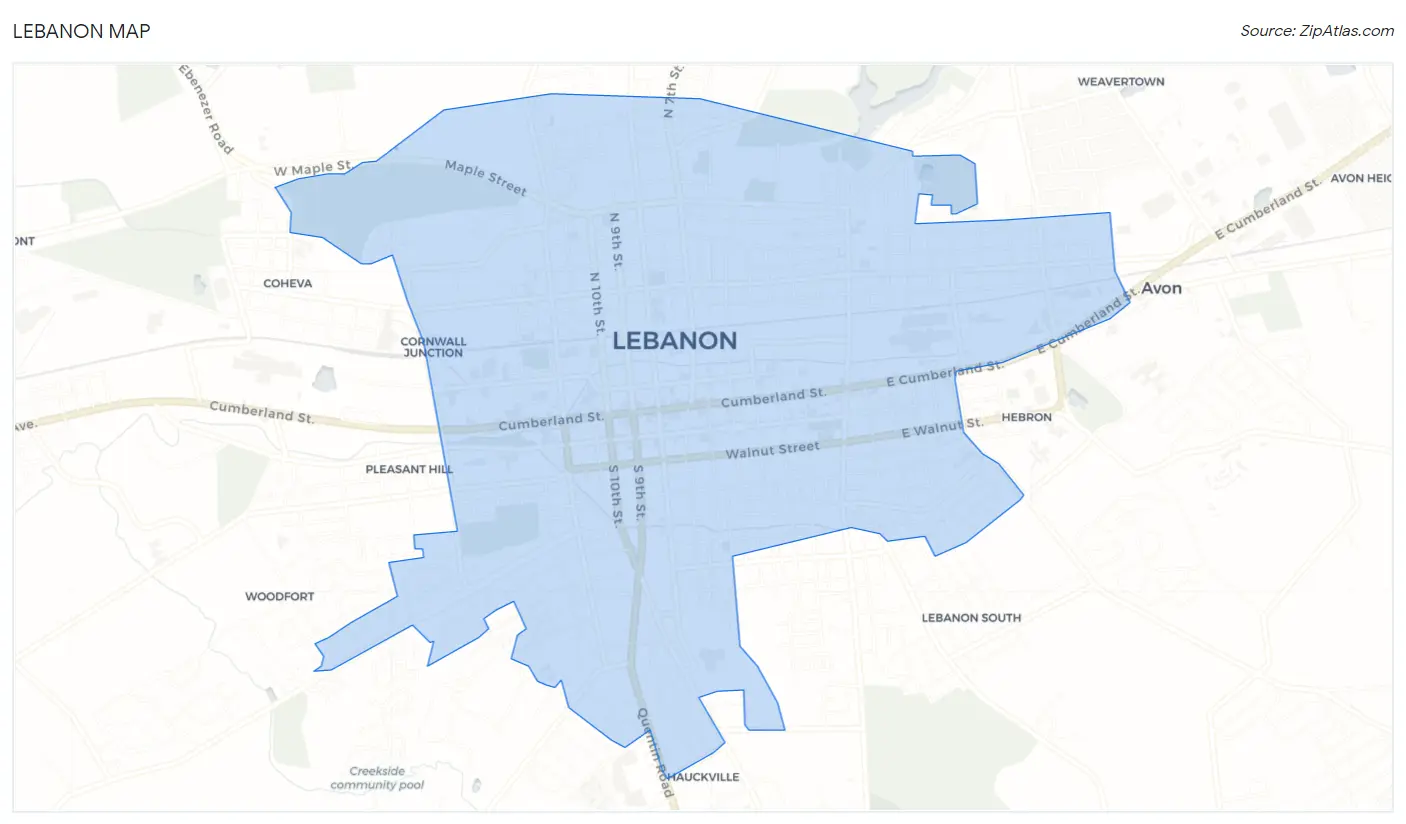
Lebanon Map
Lebanon Overview
$24,306
PER CAPITA INCOME
$47,454
AVG FAMILY INCOME
$47,160
AVG HOUSEHOLD INCOME
25.0%
WAGE / INCOME GAP [ % ]
75.0¢/ $1
WAGE / INCOME GAP [ $ ]
$9,784
FAMILY INCOME DEFICIT
0.44
INEQUALITY / GINI INDEX
26,679
TOTAL POPULATION
13,193
MALE POPULATION
13,486
FEMALE POPULATION
97.83
MALES / 100 FEMALES
102.22
FEMALES / 100 MALES
38.5
MEDIAN AGE
3.2
AVG FAMILY SIZE
2.5
AVG HOUSEHOLD SIZE
12,847
LABOR FORCE [ PEOPLE ]
61.1%
PERCENT IN LABOR FORCE
10.0%
UNEMPLOYMENT RATE
Lebanon Area Codes
Income in Lebanon
Income Overview in Lebanon
Per Capita Income in Lebanon is $24,306, while median incomes of families and households are $47,454 and $47,160 respectively.
| Characteristic | Number | Measure |
| Per Capita Income | 26,679 | $24,306 |
| Median Family Income | 6,308 | $47,454 |
| Mean Family Income | 6,308 | $64,316 |
| Median Household Income | 10,594 | $47,160 |
| Mean Household Income | 10,594 | $60,031 |
| Income Deficit | 6,308 | $9,784 |
| Wage / Income Gap (%) | 26,679 | 25.01% |
| Wage / Income Gap ($) | 26,679 | 74.99¢ per $1 |
| Gini / Inequality Index | 26,679 | 0.44 |
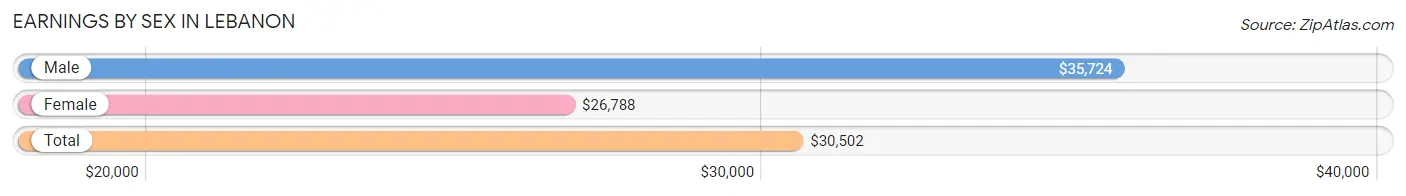
Earnings by Sex in Lebanon
Average Earnings in Lebanon are $30,502, $35,724 for men and $26,788 for women, a difference of 25.0%.
| Sex | Number | Average Earnings |
| Male | 6,856 (50.7%) | $35,724 |
| Female | 6,656 (49.3%) | $26,788 |
| Total | 13,512 (100.0%) | $30,502 |
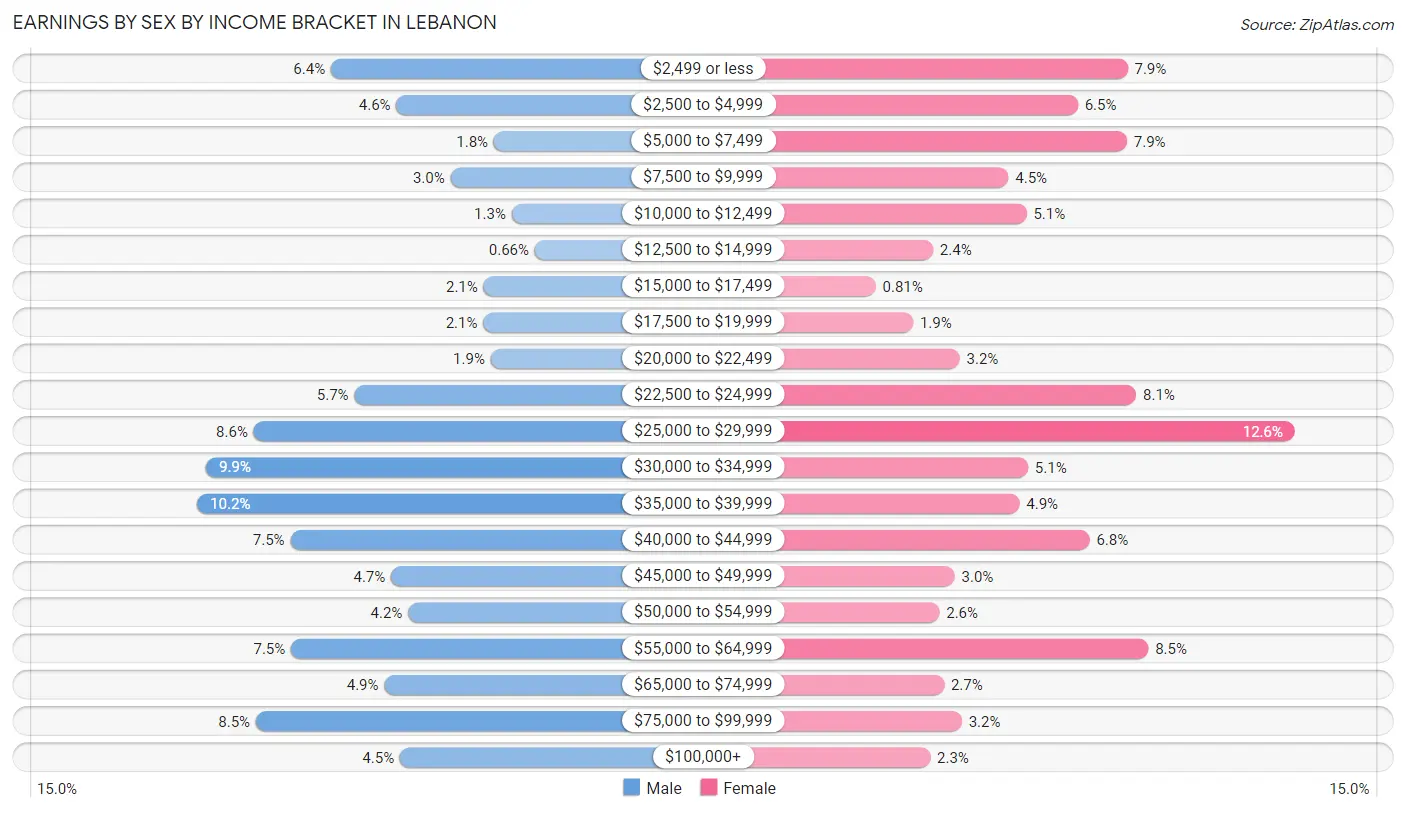
Earnings by Sex by Income Bracket in Lebanon
The most common earnings brackets in Lebanon are $35,000 to $39,999 for men (696 | 10.2%) and $25,000 to $29,999 for women (838 | 12.6%).
| Income | Male | Female |
| $2,499 or less | 438 (6.4%) | 525 (7.9%) |
| $2,500 to $4,999 | 312 (4.5%) | 432 (6.5%) |
| $5,000 to $7,499 | 124 (1.8%) | 524 (7.9%) |
| $7,500 to $9,999 | 208 (3.0%) | 302 (4.5%) |
| $10,000 to $12,499 | 90 (1.3%) | 336 (5.1%) |
| $12,500 to $14,999 | 45 (0.7%) | 161 (2.4%) |
| $15,000 to $17,499 | 144 (2.1%) | 54 (0.8%) |
| $17,500 to $19,999 | 145 (2.1%) | 124 (1.9%) |
| $20,000 to $22,499 | 130 (1.9%) | 211 (3.2%) |
| $22,500 to $24,999 | 393 (5.7%) | 541 (8.1%) |
| $25,000 to $29,999 | 587 (8.6%) | 838 (12.6%) |
| $30,000 to $34,999 | 679 (9.9%) | 339 (5.1%) |
| $35,000 to $39,999 | 696 (10.2%) | 323 (4.9%) |
| $40,000 to $44,999 | 516 (7.5%) | 454 (6.8%) |
| $45,000 to $49,999 | 322 (4.7%) | 202 (3.0%) |
| $50,000 to $54,999 | 289 (4.2%) | 173 (2.6%) |
| $55,000 to $64,999 | 515 (7.5%) | 564 (8.5%) |
| $65,000 to $74,999 | 335 (4.9%) | 182 (2.7%) |
| $75,000 to $99,999 | 583 (8.5%) | 215 (3.2%) |
| $100,000+ | 305 (4.4%) | 156 (2.3%) |
| Total | 6,856 (100.0%) | 6,656 (100.0%) |
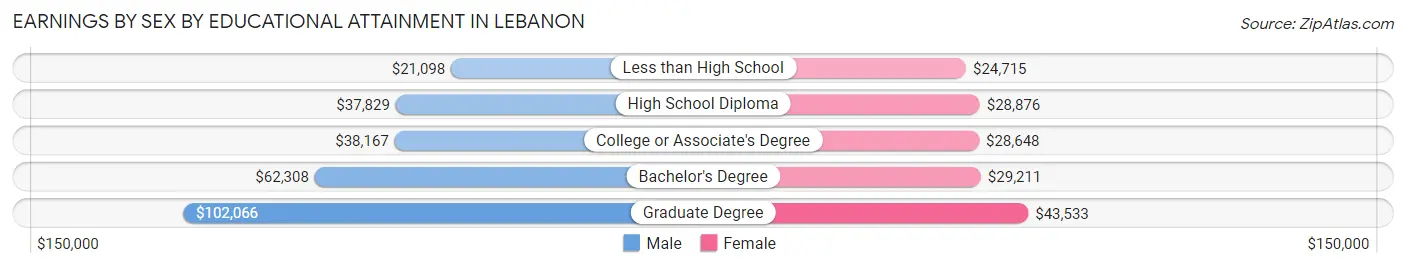
Earnings by Sex by Educational Attainment in Lebanon
Average earnings in Lebanon are $38,941 for men and $28,970 for women, a difference of 25.6%. Men with an educational attainment of graduate degree enjoy the highest average annual earnings of $102,066, while those with less than high school education earn the least with $21,098. Women with an educational attainment of graduate degree earn the most with the average annual earnings of $43,533, while those with less than high school education have the smallest earnings of $24,715.
| Educational Attainment | Male Income | Female Income |
| Less than High School | $21,098 | $24,715 |
| High School Diploma | $37,829 | $28,876 |
| College or Associate's Degree | $38,167 | $28,648 |
| Bachelor's Degree | $62,308 | $29,211 |
| Graduate Degree | $102,066 | $43,533 |
| Total | $38,941 | $28,970 |
Family Income in Lebanon
Family Income Brackets in Lebanon
According to the Lebanon family income data, there are 1,205 families falling into the $35,000 to $49,999 income range, which is the most common income bracket and makes up 19.1% of all families. Conversely, the $200,000+ income bracket is the least frequent group with only 158 families (2.5%) belonging to this category.
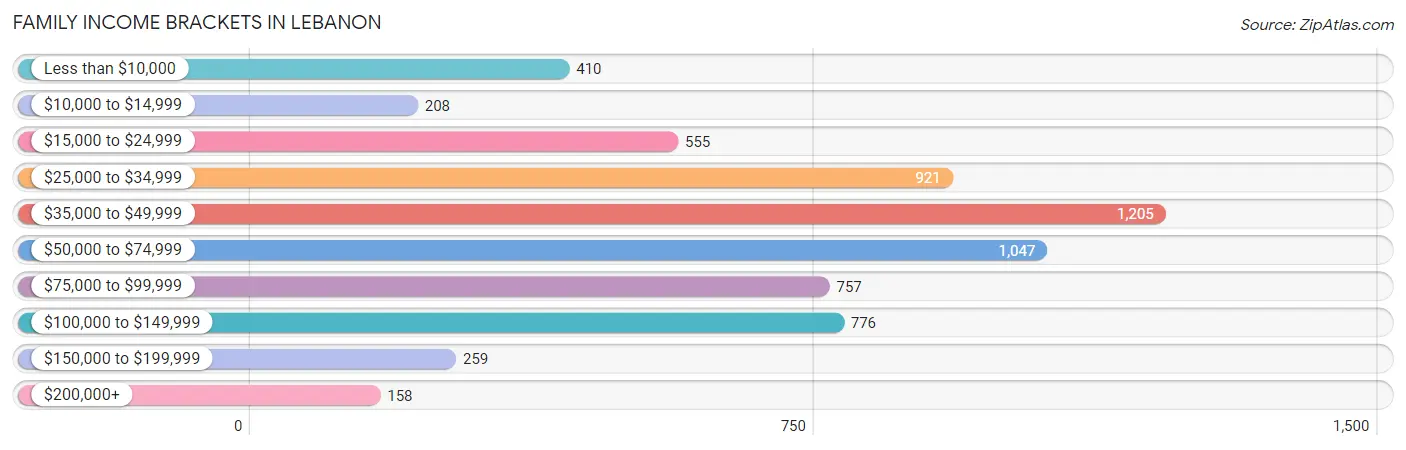
| Income Bracket | # Families | % Families |
| Less than $10,000 | 410 | 6.5% |
| $10,000 to $14,999 | 208 | 3.3% |
| $15,000 to $24,999 | 555 | 8.8% |
| $25,000 to $34,999 | 921 | 14.6% |
| $35,000 to $49,999 | 1,205 | 19.1% |
| $50,000 to $74,999 | 1,047 | 16.6% |
| $75,000 to $99,999 | 757 | 12.0% |
| $100,000 to $149,999 | 776 | 12.3% |
| $150,000 to $199,999 | 259 | 4.1% |
| $200,000+ | 158 | 2.5% |
Family Income by Famaliy Size in Lebanon
7+ person families (70 | 1.1%) account for the highest median family income in Lebanon with $95,789 per family, while 2-person families (2,826 | 44.8%) have the highest median income of $21,042 per family member.
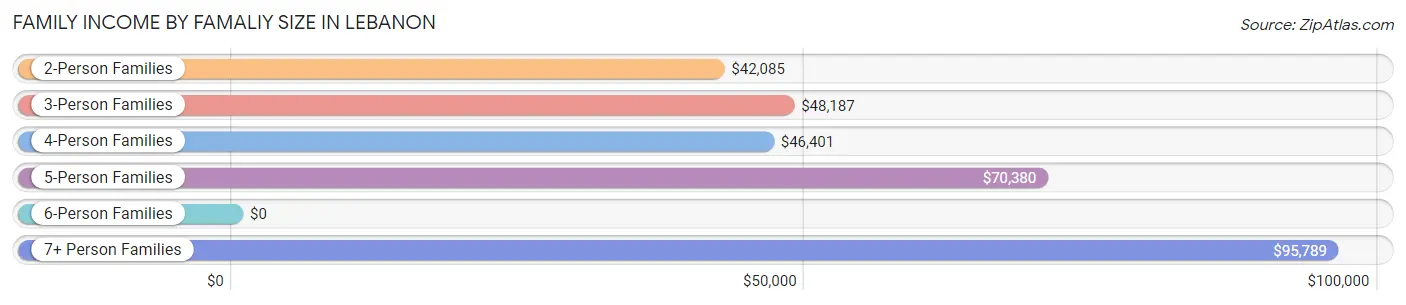
| Income Bracket | # Families | Median Income |
| 2-Person Families | 2,826 (44.8%) | $42,085 |
| 3-Person Families | 1,451 (23.0%) | $48,187 |
| 4-Person Families | 1,217 (19.3%) | $46,401 |
| 5-Person Families | 627 (9.9%) | $70,380 |
| 6-Person Families | 117 (1.8%) | $0 |
| 7+ Person Families | 70 (1.1%) | $95,789 |
| Total | 6,308 (100.0%) | $47,454 |
Family Income by Number of Earners in Lebanon
The median family income in Lebanon is $47,454, with families comprising 3+ earners (1,029) having the highest median family income of $117,744, while families with no earners (999) have the lowest median family income of $28,231, accounting for 16.3% and 15.8% of families, respectively.
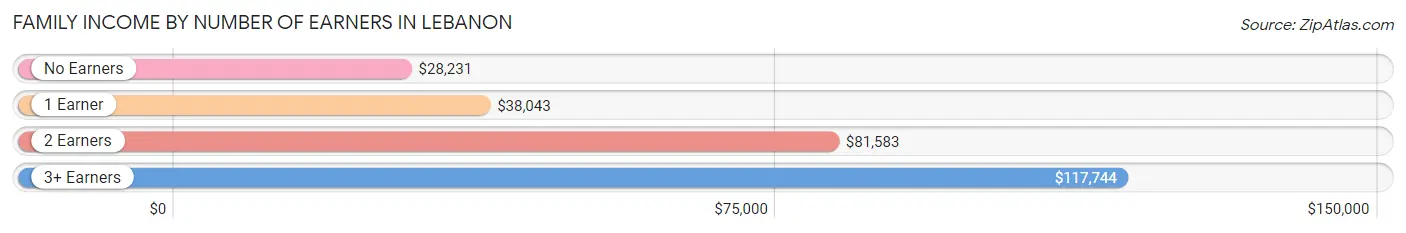
| Number of Earners | # Families | Median Income |
| No Earners | 999 (15.8%) | $28,231 |
| 1 Earner | 2,784 (44.1%) | $38,043 |
| 2 Earners | 1,496 (23.7%) | $81,583 |
| 3+ Earners | 1,029 (16.3%) | $117,744 |
| Total | 6,308 (100.0%) | $47,454 |
Household Income in Lebanon
Household Income Brackets in Lebanon
With 2,426 households falling in the category, the $50,000 to $74,999 income range is the most frequent in Lebanon, accounting for 22.9% of all households. In contrast, only 201 households (1.9%) fall into the $200,000+ income bracket, making it the least populous group.
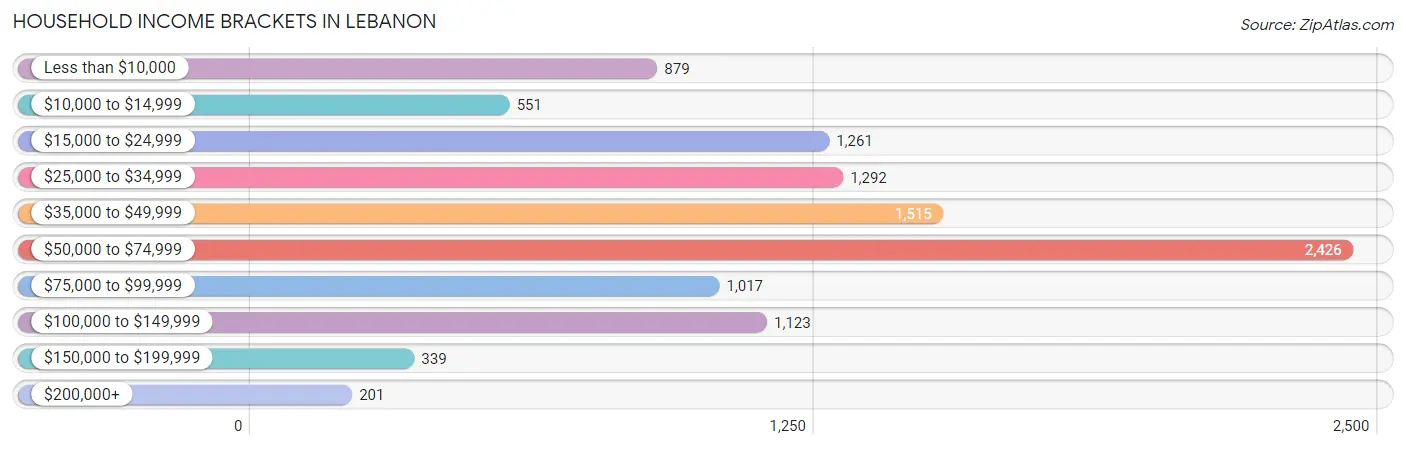
| Income Bracket | # Households | % Households |
| Less than $10,000 | 879 | 8.3% |
| $10,000 to $14,999 | 551 | 5.2% |
| $15,000 to $24,999 | 1,261 | 11.9% |
| $25,000 to $34,999 | 1,292 | 12.2% |
| $35,000 to $49,999 | 1,515 | 14.3% |
| $50,000 to $74,999 | 2,426 | 22.9% |
| $75,000 to $99,999 | 1,017 | 9.6% |
| $100,000 to $149,999 | 1,123 | 10.6% |
| $150,000 to $199,999 | 339 | 3.2% |
| $200,000+ | 201 | 1.9% |
Household Income by Householder Age in Lebanon
The median household income in Lebanon is $47,160, with the highest median household income of $56,048 found in the 45 to 64 years age bracket for the primary householder. A total of 3,666 households (34.6%) fall into this category. Meanwhile, the 15 to 24 years age bracket for the primary householder has the lowest median household income of $0, with 479 households (4.5%) in this group.
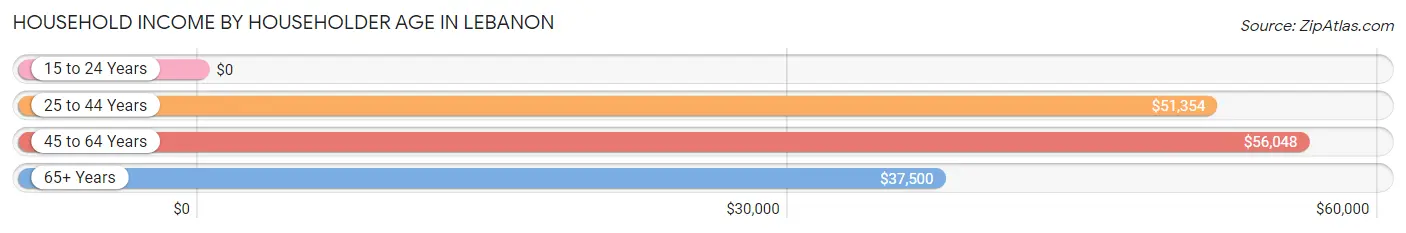
| Income Bracket | # Households | Median Income |
| 15 to 24 Years | 479 (4.5%) | $0 |
| 25 to 44 Years | 3,529 (33.3%) | $51,354 |
| 45 to 64 Years | 3,666 (34.6%) | $56,048 |
| 65+ Years | 2,920 (27.6%) | $37,500 |
| Total | 10,594 (100.0%) | $47,160 |
Poverty in Lebanon
Income Below Poverty by Sex and Age in Lebanon
With 20.7% poverty level for males and 26.0% for females among the residents of Lebanon, 5 year old males and under 5 year old females are the most vulnerable to poverty, with 161 males (73.5%) and 421 females (47.6%) in their respective age groups living below the poverty level.
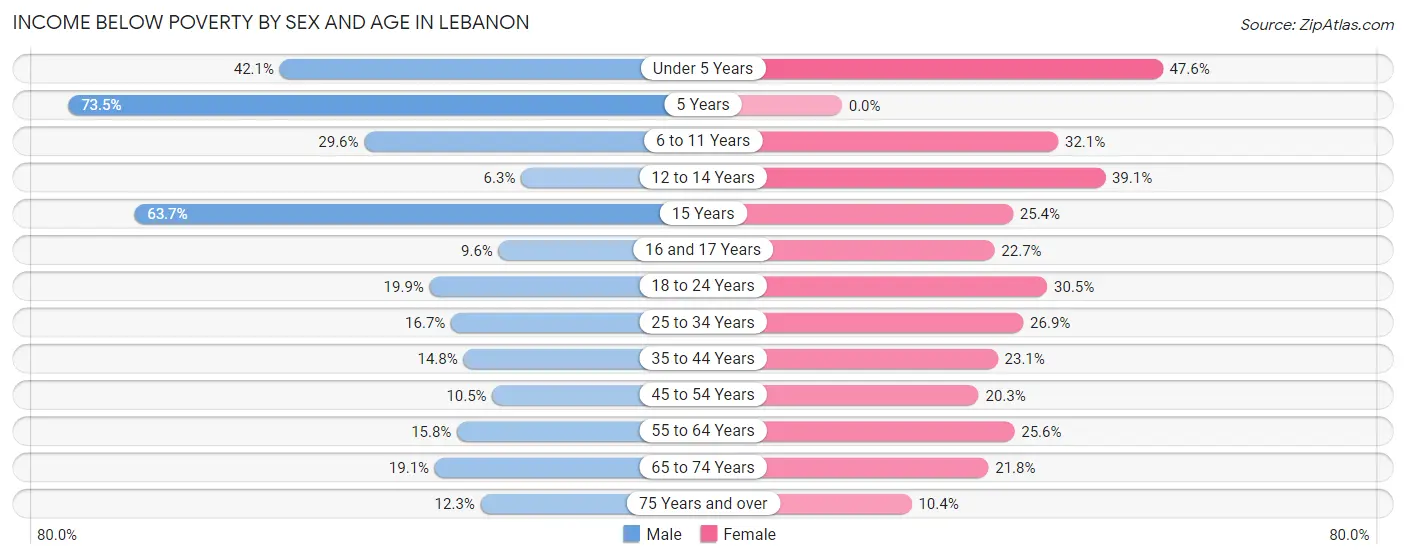
| Age Bracket | Male | Female |
| Under 5 Years | 443 (42.1%) | 421 (47.6%) |
| 5 Years | 161 (73.5%) | 0 (0.0%) |
| 6 to 11 Years | 318 (29.5%) | 306 (32.1%) |
| 12 to 14 Years | 21 (6.2%) | 179 (39.1%) |
| 15 Years | 223 (63.7%) | 48 (25.4%) |
| 16 and 17 Years | 29 (9.6%) | 97 (22.7%) |
| 18 to 24 Years | 232 (19.9%) | 347 (30.5%) |
| 25 to 34 Years | 299 (16.7%) | 474 (26.9%) |
| 35 to 44 Years | 272 (14.8%) | 467 (23.1%) |
| 45 to 54 Years | 172 (10.5%) | 265 (20.3%) |
| 55 to 64 Years | 266 (15.8%) | 475 (25.6%) |
| 65 to 74 Years | 206 (19.1%) | 297 (21.8%) |
| 75 Years and over | 76 (12.3%) | 97 (10.3%) |
| Total | 2,718 (20.7%) | 3,473 (26.0%) |
Income Above Poverty by Sex and Age in Lebanon
According to the poverty statistics in Lebanon, males aged 12 to 14 years and females aged 5 years are the age groups that are most secure financially, with 93.8% of males and 100.0% of females in these age groups living above the poverty line.
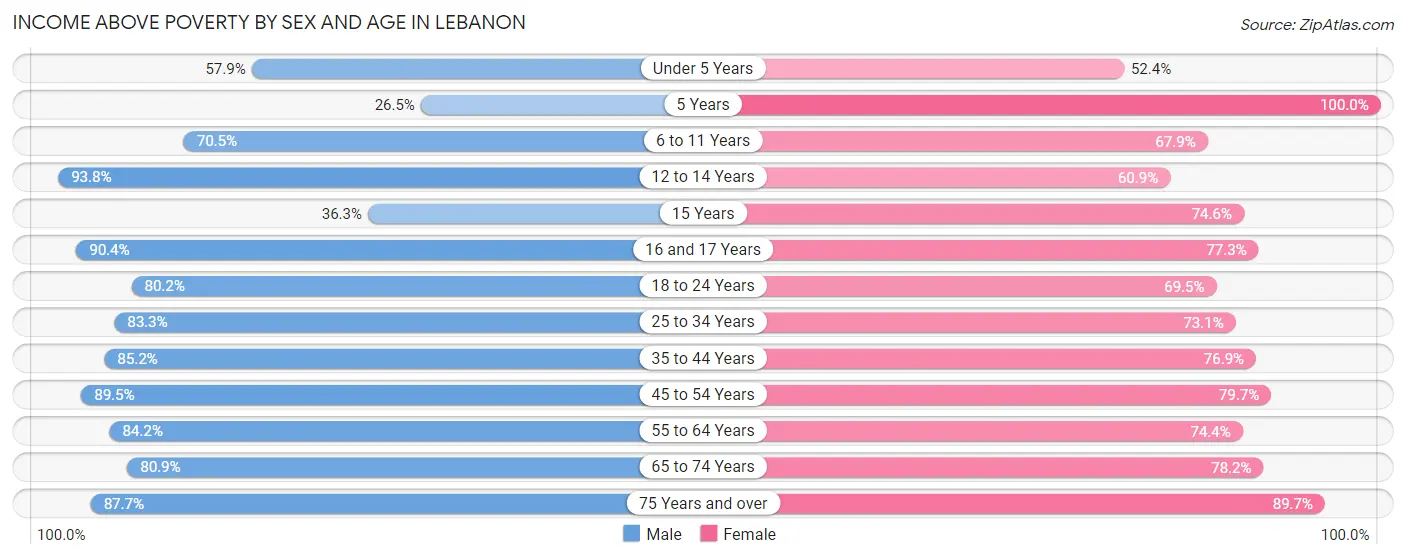
| Age Bracket | Male | Female |
| Under 5 Years | 609 (57.9%) | 463 (52.4%) |
| 5 Years | 58 (26.5%) | 85 (100.0%) |
| 6 to 11 Years | 758 (70.5%) | 647 (67.9%) |
| 12 to 14 Years | 315 (93.8%) | 279 (60.9%) |
| 15 Years | 127 (36.3%) | 141 (74.6%) |
| 16 and 17 Years | 273 (90.4%) | 331 (77.3%) |
| 18 to 24 Years | 937 (80.1%) | 791 (69.5%) |
| 25 to 34 Years | 1,496 (83.3%) | 1,286 (73.1%) |
| 35 to 44 Years | 1,563 (85.2%) | 1,551 (76.9%) |
| 45 to 54 Years | 1,462 (89.5%) | 1,040 (79.7%) |
| 55 to 64 Years | 1,422 (84.2%) | 1,380 (74.4%) |
| 65 to 74 Years | 874 (80.9%) | 1,068 (78.2%) |
| 75 Years and over | 543 (87.7%) | 840 (89.6%) |
| Total | 10,437 (79.3%) | 9,902 (74.0%) |
Income Below Poverty Among Married-Couple Families in Lebanon
The poverty statistics for married-couple families in Lebanon show that 10.7% or 375 of the total 3,496 families live below the poverty line. Families with 3 or 4 children have the highest poverty rate of 35.8%, comprising of 122 families. On the other hand, families with 5 or more children have the lowest poverty rate of 0.0%, which includes 0 families.
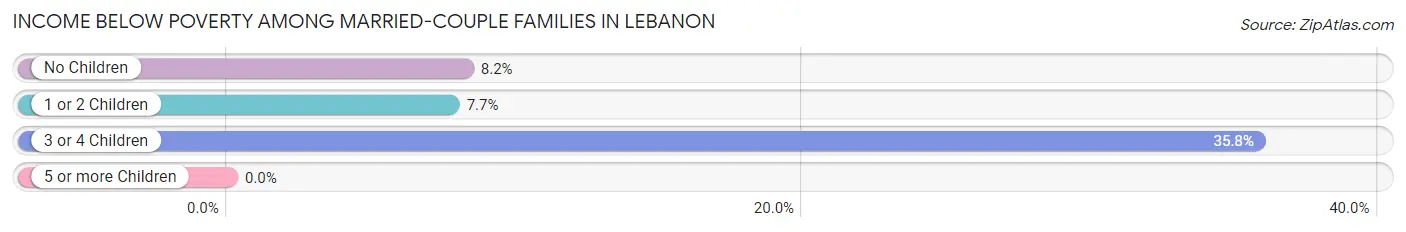
| Children | Above Poverty | Below Poverty |
| No Children | 1,956 (91.8%) | 175 (8.2%) |
| 1 or 2 Children | 932 (92.3%) | 78 (7.7%) |
| 3 or 4 Children | 219 (64.2%) | 122 (35.8%) |
| 5 or more Children | 14 (100.0%) | 0 (0.0%) |
| Total | 3,121 (89.3%) | 375 (10.7%) |
Income Below Poverty Among Single-Parent Households in Lebanon
According to the poverty data in Lebanon, 12.0% or 101 single-father households and 38.9% or 767 single-mother households are living below the poverty line. Among single-father households, those with no children have the highest poverty rate, with 101 households (37.0%) experiencing poverty. Likewise, among single-mother households, those with 3 or 4 children have the highest poverty rate, with 324 households (77.5%) falling below the poverty line.
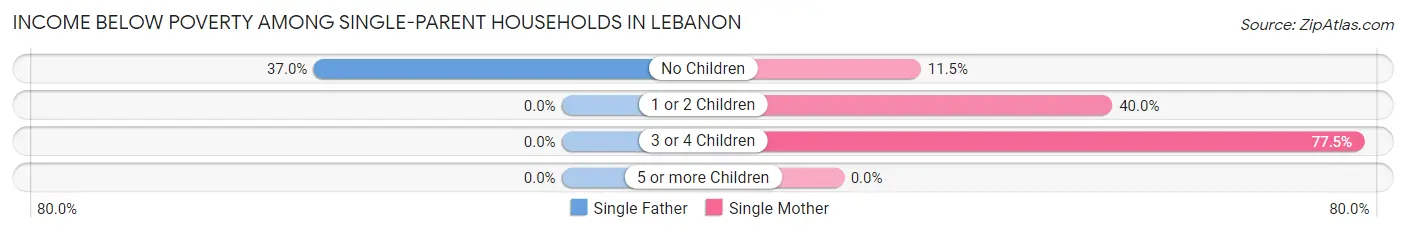
| Children | Single Father | Single Mother |
| No Children | 101 (37.0%) | 72 (11.5%) |
| 1 or 2 Children | 0 (0.0%) | 371 (40.0%) |
| 3 or 4 Children | 0 (0.0%) | 324 (77.5%) |
| 5 or more Children | 0 (0.0%) | 0 (0.0%) |
| Total | 101 (12.0%) | 767 (38.9%) |
Income Below Poverty Among Married-Couple vs Single-Parent Households in Lebanon
The poverty data for Lebanon shows that 375 of the married-couple family households (10.7%) and 868 of the single-parent households (30.9%) are living below the poverty level. Within the married-couple family households, those with 3 or 4 children have the highest poverty rate, with 122 households (35.8%) falling below the poverty line. Among the single-parent households, those with 3 or 4 children have the highest poverty rate, with 324 household (68.6%) living below poverty.
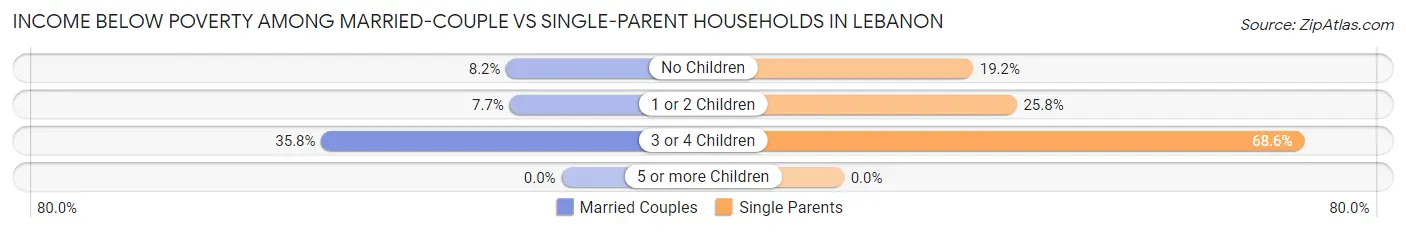
| Children | Married-Couple Families | Single-Parent Households |
| No Children | 175 (8.2%) | 173 (19.2%) |
| 1 or 2 Children | 78 (7.7%) | 371 (25.8%) |
| 3 or 4 Children | 122 (35.8%) | 324 (68.6%) |
| 5 or more Children | 0 (0.0%) | 0 (0.0%) |
| Total | 375 (10.7%) | 868 (30.9%) |
Race in Lebanon
The most populous races in Lebanon are White / Caucasian (15,198 | 57.0%), Hispanic or Latino (11,721 | 43.9%), and Some other Race (7,027 | 26.3%).
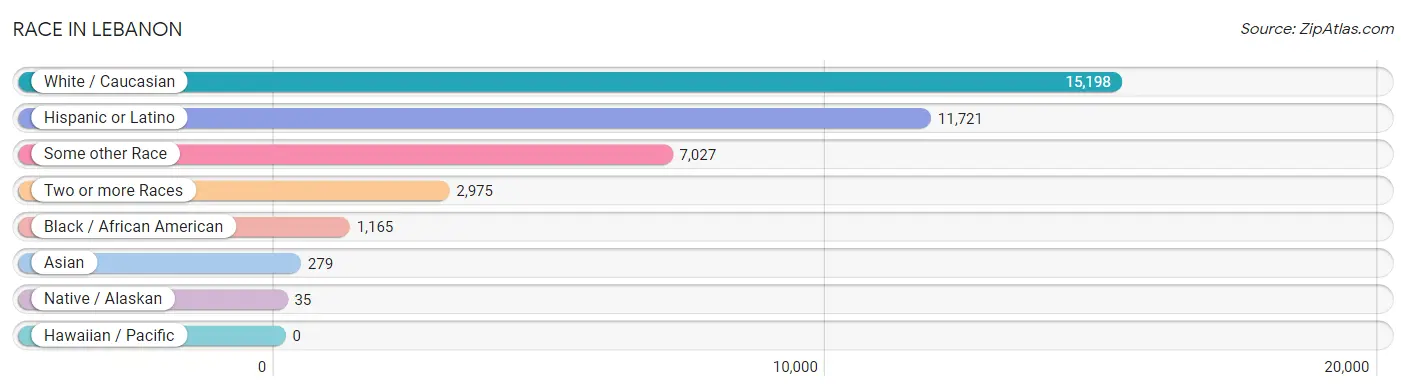
| Race | # Population | % Population |
| Asian | 279 | 1.1% |
| Black / African American | 1,165 | 4.4% |
| Hawaiian / Pacific | 0 | 0.0% |
| Hispanic or Latino | 11,721 | 43.9% |
| Native / Alaskan | 35 | 0.1% |
| White / Caucasian | 15,198 | 57.0% |
| Two or more Races | 2,975 | 11.2% |
| Some other Race | 7,027 | 26.3% |
| Total | 26,679 | 100.0% |
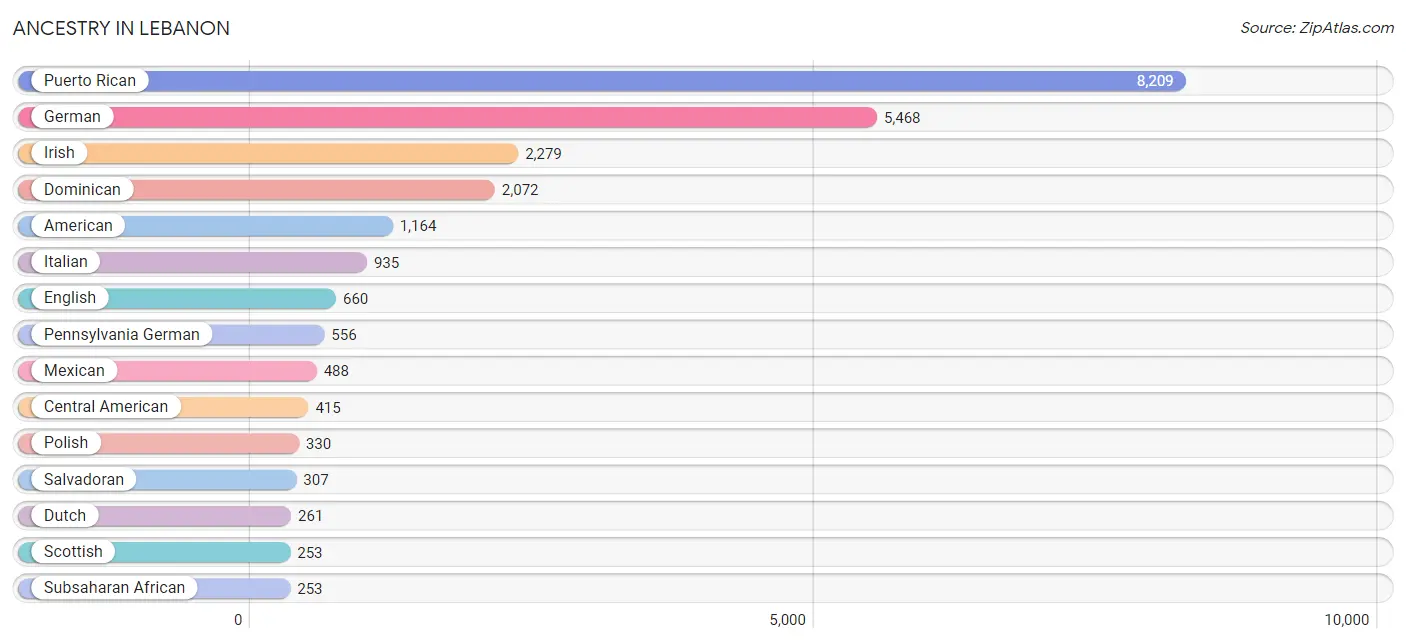
Ancestry in Lebanon
The most populous ancestries reported in Lebanon are Puerto Rican (8,209 | 30.8%), German (5,468 | 20.5%), Irish (2,279 | 8.5%), Dominican (2,072 | 7.8%), and American (1,164 | 4.4%), together accounting for 71.9% of all Lebanon residents.
| Ancestry | # Population | % Population |
| African | 230 | 0.9% |
| American | 1,164 | 4.4% |
| Arab | 195 | 0.7% |
| Australian | 10 | 0.0% |
| Austrian | 65 | 0.2% |
| British | 46 | 0.2% |
| Burmese | 36 | 0.1% |
| Central American | 415 | 1.6% |
| Central American Indian | 20 | 0.1% |
| Cherokee | 105 | 0.4% |
| Colombian | 61 | 0.2% |
| Croatian | 15 | 0.1% |
| Czech | 113 | 0.4% |
| Danish | 9 | 0.0% |
| Dominican | 2,072 | 7.8% |
| Dutch | 261 | 1.0% |
| Ecuadorian | 103 | 0.4% |
| English | 660 | 2.5% |
| European | 168 | 0.6% |
| French | 170 | 0.6% |
| French Canadian | 9 | 0.0% |
| German | 5,468 | 20.5% |
| Greek | 42 | 0.2% |
| Guatemalan | 88 | 0.3% |
| Guyanese | 45 | 0.2% |
| Haitian | 152 | 0.6% |
| Hungarian | 189 | 0.7% |
| Indian (Asian) | 95 | 0.4% |
| Irish | 2,279 | 8.5% |
| Italian | 935 | 3.5% |
| Jamaican | 34 | 0.1% |
| Korean | 27 | 0.1% |
| Laotian | 43 | 0.2% |
| Latvian | 20 | 0.1% |
| Lithuanian | 35 | 0.1% |
| Lumbee | 25 | 0.1% |
| Macedonian | 44 | 0.2% |
| Mexican | 488 | 1.8% |
| Moroccan | 174 | 0.6% |
| Nigerian | 23 | 0.1% |
| Panamanian | 20 | 0.1% |
| Pennsylvania German | 556 | 2.1% |
| Peruvian | 14 | 0.1% |
| Polish | 330 | 1.2% |
| Portuguese | 15 | 0.1% |
| Puerto Rican | 8,209 | 30.8% |
| Salvadoran | 307 | 1.1% |
| Scandinavian | 9 | 0.0% |
| Scotch-Irish | 49 | 0.2% |
| Scottish | 253 | 0.9% |
| Serbian | 11 | 0.0% |
| Slavic | 27 | 0.1% |
| Slovak | 127 | 0.5% |
| Slovene | 9 | 0.0% |
| South American | 178 | 0.7% |
| Subsaharan African | 253 | 0.9% |
| Swedish | 119 | 0.4% |
| Swiss | 40 | 0.2% |
| Thai | 54 | 0.2% |
| Ukrainian | 73 | 0.3% |
| Welsh | 123 | 0.5% |
| West Indian | 1 | 0.0% |
| Yugoslavian | 39 | 0.2% | View All 63 Rows |
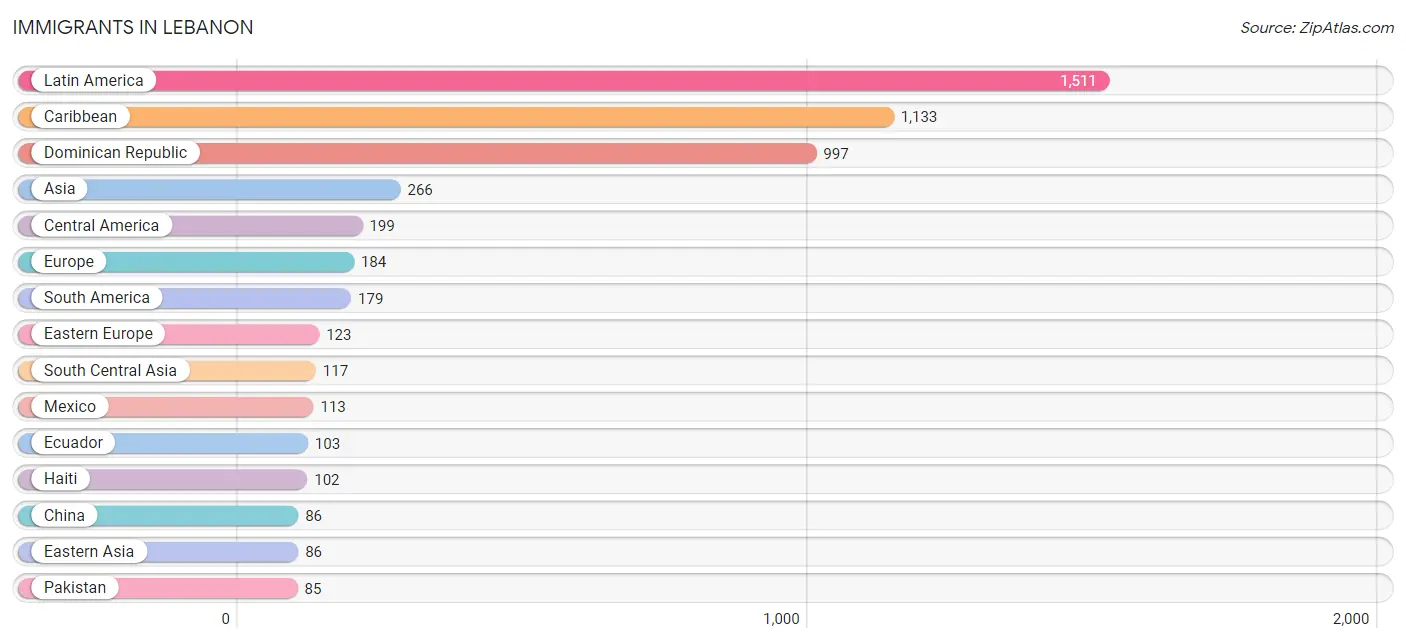
Immigrants in Lebanon
The most numerous immigrant groups reported in Lebanon came from Latin America (1,511 | 5.7%), Caribbean (1,133 | 4.3%), Dominican Republic (997 | 3.7%), Asia (266 | 1.0%), and Central America (199 | 0.7%), together accounting for 15.4% of all Lebanon residents.
| Immigration Origin | # Population | % Population |
| Africa | 81 | 0.3% |
| Asia | 266 | 1.0% |
| Austria | 15 | 0.1% |
| Caribbean | 1,133 | 4.3% |
| Central America | 199 | 0.7% |
| China | 86 | 0.3% |
| Colombia | 21 | 0.1% |
| Dominican Republic | 997 | 3.7% |
| Eastern Asia | 86 | 0.3% |
| Eastern Europe | 123 | 0.5% |
| Ecuador | 103 | 0.4% |
| El Salvador | 25 | 0.1% |
| Europe | 184 | 0.7% |
| Guatemala | 41 | 0.2% |
| Guyana | 45 | 0.2% |
| Haiti | 102 | 0.4% |
| India | 32 | 0.1% |
| Indonesia | 43 | 0.2% |
| Italy | 21 | 0.1% |
| Jamaica | 34 | 0.1% |
| Latin America | 1,511 | 5.7% |
| Lebanon | 17 | 0.1% |
| Mexico | 113 | 0.4% |
| Morocco | 81 | 0.3% |
| Netherlands | 25 | 0.1% |
| North Macedonia | 44 | 0.2% |
| Northern Africa | 81 | 0.3% |
| Pakistan | 85 | 0.3% |
| Panama | 20 | 0.1% |
| Peru | 10 | 0.0% |
| Philippines | 3 | 0.0% |
| Poland | 10 | 0.0% |
| South America | 179 | 0.7% |
| South Central Asia | 117 | 0.4% |
| South Eastern Asia | 46 | 0.2% |
| Southern Europe | 21 | 0.1% |
| Ukraine | 69 | 0.3% |
| Western Asia | 17 | 0.1% |
| Western Europe | 40 | 0.2% | View All 39 Rows |
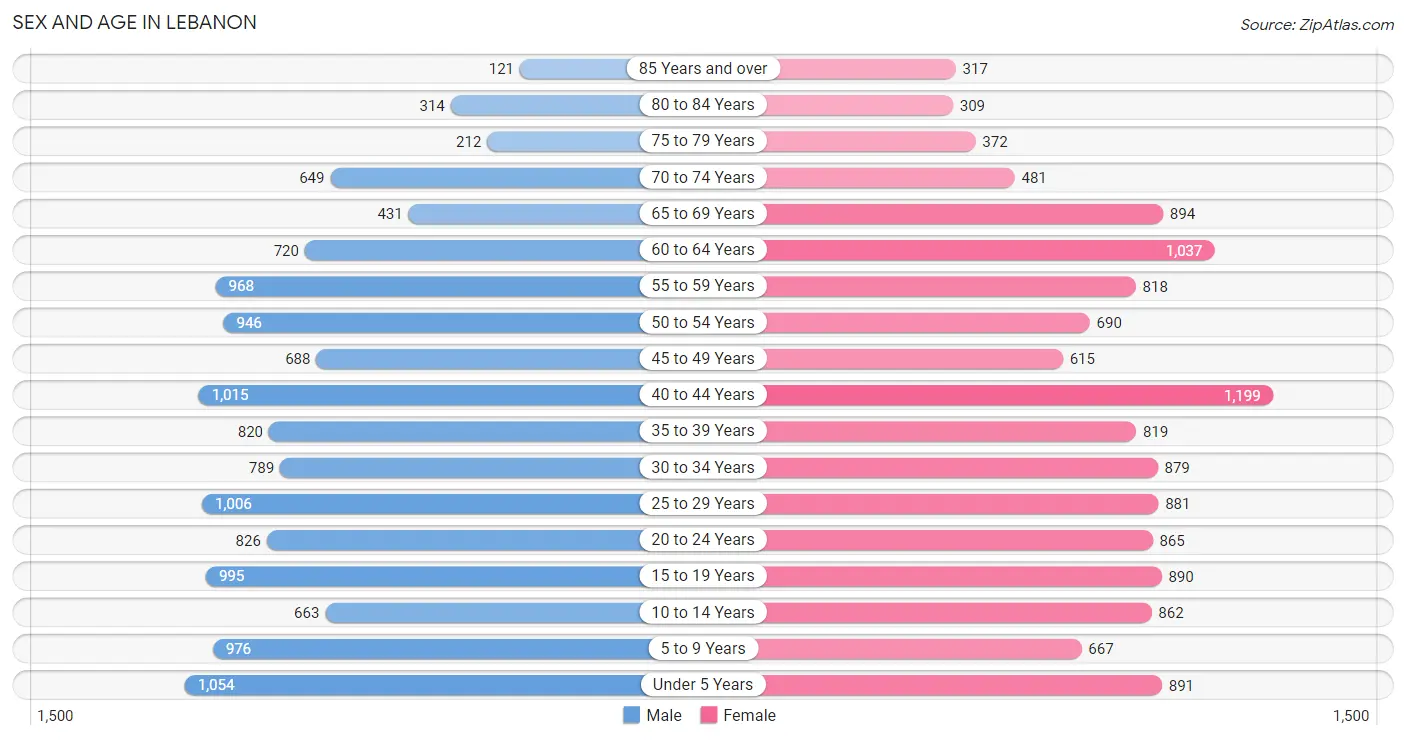
Sex and Age in Lebanon
Sex and Age in Lebanon
The most populous age groups in Lebanon are Under 5 Years (1,054 | 8.0%) for men and 40 to 44 Years (1,199 | 8.9%) for women.
| Age Bracket | Male | Female |
| Under 5 Years | 1,054 (8.0%) | 891 (6.6%) |
| 5 to 9 Years | 976 (7.4%) | 667 (5.0%) |
| 10 to 14 Years | 663 (5.0%) | 862 (6.4%) |
| 15 to 19 Years | 995 (7.5%) | 890 (6.6%) |
| 20 to 24 Years | 826 (6.3%) | 865 (6.4%) |
| 25 to 29 Years | 1,006 (7.6%) | 881 (6.5%) |
| 30 to 34 Years | 789 (6.0%) | 879 (6.5%) |
| 35 to 39 Years | 820 (6.2%) | 819 (6.1%) |
| 40 to 44 Years | 1,015 (7.7%) | 1,199 (8.9%) |
| 45 to 49 Years | 688 (5.2%) | 615 (4.6%) |
| 50 to 54 Years | 946 (7.2%) | 690 (5.1%) |
| 55 to 59 Years | 968 (7.3%) | 818 (6.1%) |
| 60 to 64 Years | 720 (5.5%) | 1,037 (7.7%) |
| 65 to 69 Years | 431 (3.3%) | 894 (6.6%) |
| 70 to 74 Years | 649 (4.9%) | 481 (3.6%) |
| 75 to 79 Years | 212 (1.6%) | 372 (2.8%) |
| 80 to 84 Years | 314 (2.4%) | 309 (2.3%) |
| 85 Years and over | 121 (0.9%) | 317 (2.4%) |
| Total | 13,193 (100.0%) | 13,486 (100.0%) |
Families and Households in Lebanon
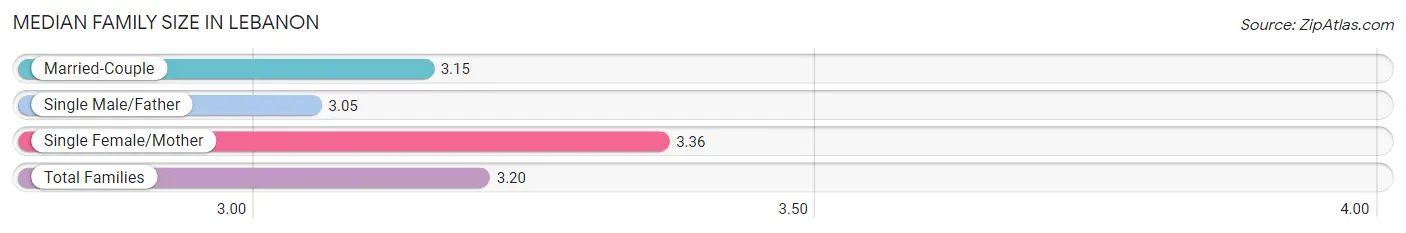
Median Family Size in Lebanon
The median family size in Lebanon is 3.20 persons per family, with single female/mother families (1,971 | 31.2%) accounting for the largest median family size of 3.36 persons per family. On the other hand, single male/father families (841 | 13.3%) represent the smallest median family size with 3.05 persons per family.
| Family Type | # Families | Family Size |
| Married-Couple | 3,496 (55.4%) | 3.15 |
| Single Male/Father | 841 (13.3%) | 3.05 |
| Single Female/Mother | 1,971 (31.2%) | 3.36 |
| Total Families | 6,308 (100.0%) | 3.20 |
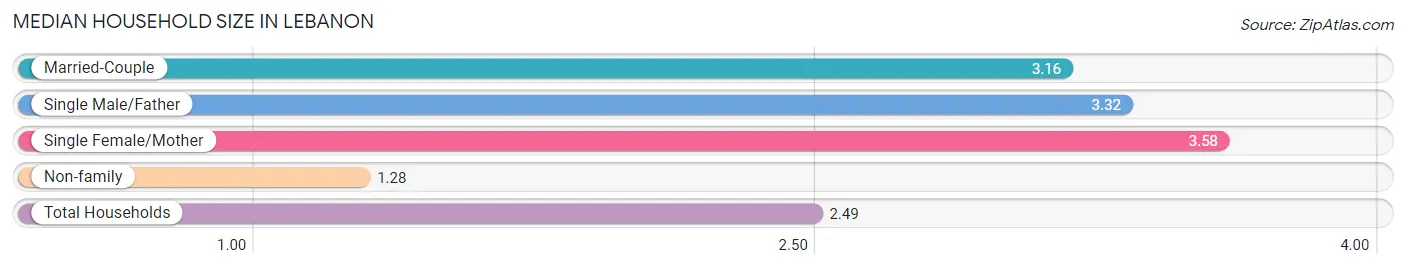
Median Household Size in Lebanon
The median household size in Lebanon is 2.49 persons per household, with single female/mother households (1,971 | 18.6%) accounting for the largest median household size of 3.58 persons per household. non-family households (4,286 | 40.5%) represent the smallest median household size with 1.28 persons per household.
| Household Type | # Households | Household Size |
| Married-Couple | 3,496 (33.0%) | 3.16 |
| Single Male/Father | 841 (7.9%) | 3.32 |
| Single Female/Mother | 1,971 (18.6%) | 3.58 |
| Non-family | 4,286 (40.5%) | 1.28 |
| Total Households | 10,594 (100.0%) | 2.49 |
Household Size by Marriage Status in Lebanon
Out of a total of 10,594 households in Lebanon, 6,308 (59.5%) are family households, while 4,286 (40.5%) are nonfamily households. The most numerous type of family households are 2-person households, comprising 2,543, and the most common type of nonfamily households are 1-person households, comprising 3,292.
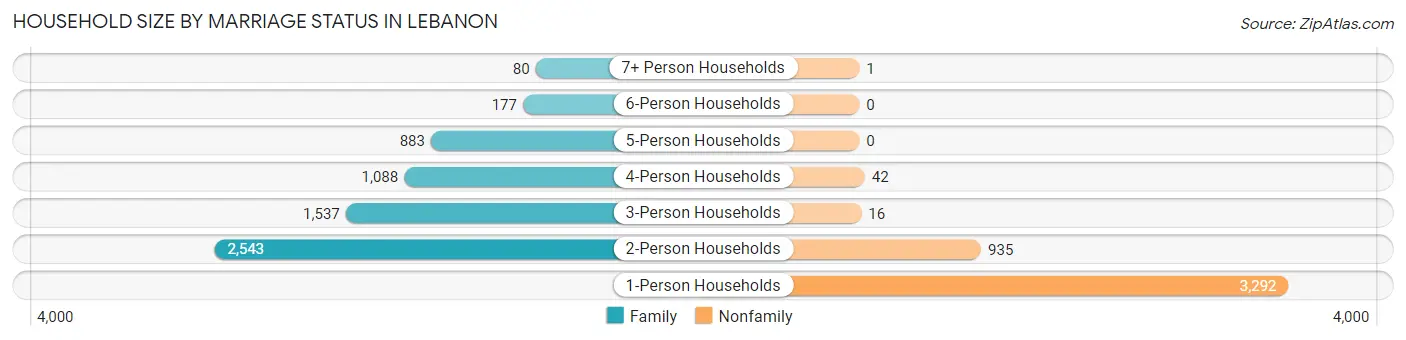
| Household Size | Family Households | Nonfamily Households |
| 1-Person Households | - | 3,292 (31.1%) |
| 2-Person Households | 2,543 (24.0%) | 935 (8.8%) |
| 3-Person Households | 1,537 (14.5%) | 16 (0.2%) |
| 4-Person Households | 1,088 (10.3%) | 42 (0.4%) |
| 5-Person Households | 883 (8.3%) | 0 (0.0%) |
| 6-Person Households | 177 (1.7%) | 0 (0.0%) |
| 7+ Person Households | 80 (0.8%) | 1 (0.0%) |
| Total | 6,308 (59.5%) | 4,286 (40.5%) |
Female Fertility in Lebanon
Fertility by Age in Lebanon
Average fertility rate in Lebanon is 41.0 births per 1,000 women. Women in the age bracket of 20 to 34 years have the highest fertility rate with 70.0 births per 1,000 women. Women in the age bracket of 20 to 34 years acount for 70.5% of all women with births.
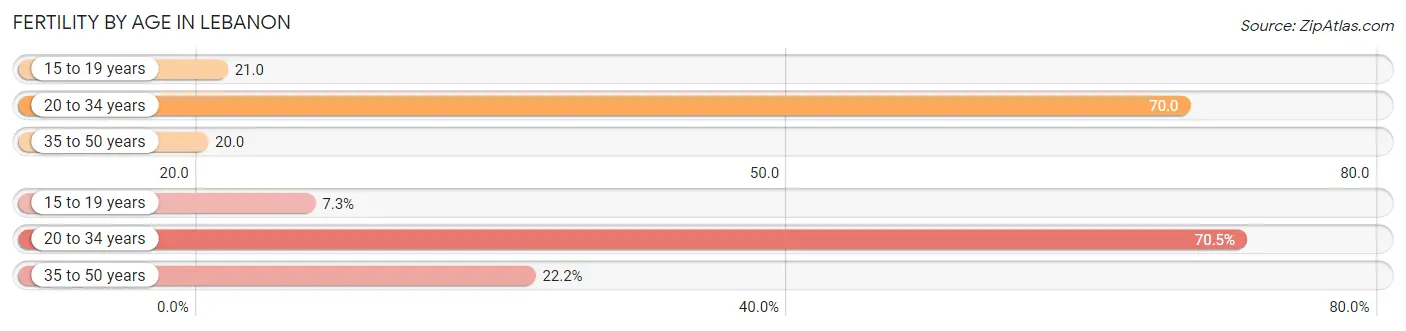
| Age Bracket | Women with Births | Births / 1,000 Women |
| 15 to 19 years | 19 (7.3%) | 21.0 |
| 20 to 34 years | 184 (70.5%) | 70.0 |
| 35 to 50 years | 58 (22.2%) | 20.0 |
| Total | 261 (100.0%) | 41.0 |
Fertility by Age by Marriage Status in Lebanon
73.2% of women with births (261) in Lebanon are married. The highest percentage of unmarried women with births falls into 20 to 34 years age bracket with 38.0% of them unmarried at the time of birth, while the lowest percentage of unmarried women with births belong to 15 to 19 years age bracket with 0.0% of them unmarried.
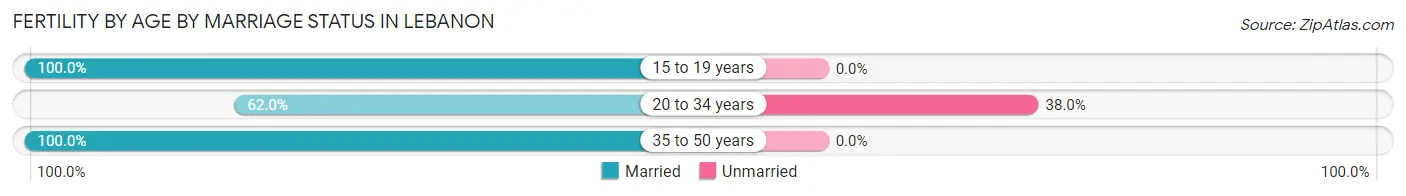
| Age Bracket | Married | Unmarried |
| 15 to 19 years | 19 (100.0%) | 0 (0.0%) |
| 20 to 34 years | 114 (62.0%) | 70 (38.0%) |
| 35 to 50 years | 58 (100.0%) | 0 (0.0%) |
| Total | 191 (73.2%) | 70 (26.8%) |
Fertility by Education in Lebanon
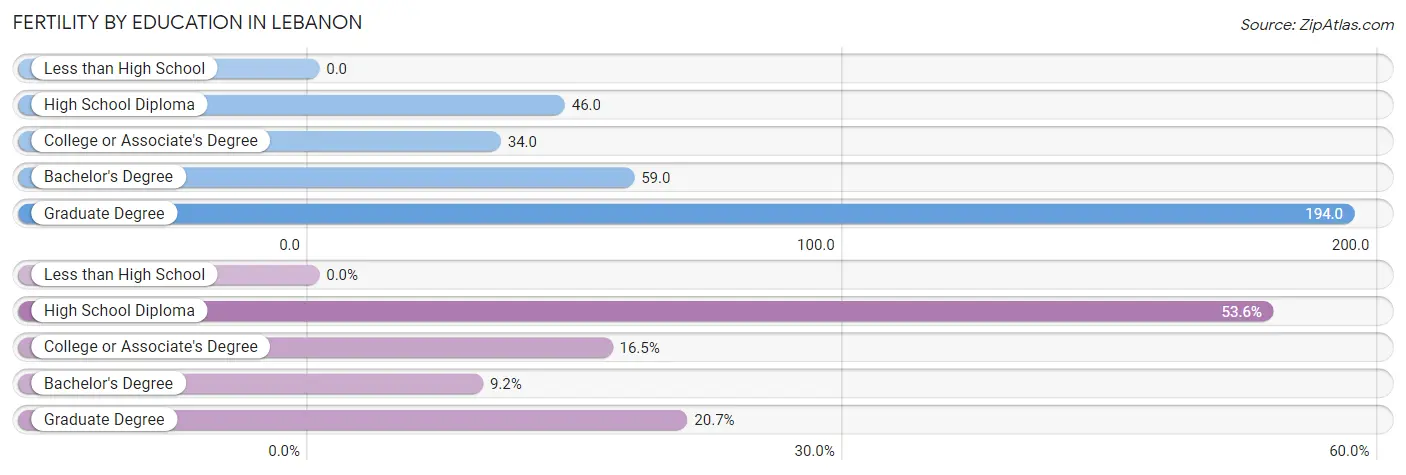
| Educational Attainment | Women with Births | Births / 1,000 Women |
| Less than High School | 0 (0.0%) | 0.0 |
| High School Diploma | 140 (53.6%) | 46.0 |
| College or Associate's Degree | 43 (16.5%) | 34.0 |
| Bachelor's Degree | 24 (9.2%) | 59.0 |
| Graduate Degree | 54 (20.7%) | 194.0 |
| Total | 261 (100.0%) | 41.0 |
Fertility by Education by Marriage Status in Lebanon
26.8% of women with births in Lebanon are unmarried. Women with the educational attainment of bachelor's degree are most likely to be married with 100.0% of them married at childbirth, while women with the educational attainment of college or associate's degree are least likely to be married with 46.5% of them unmarried at childbirth.
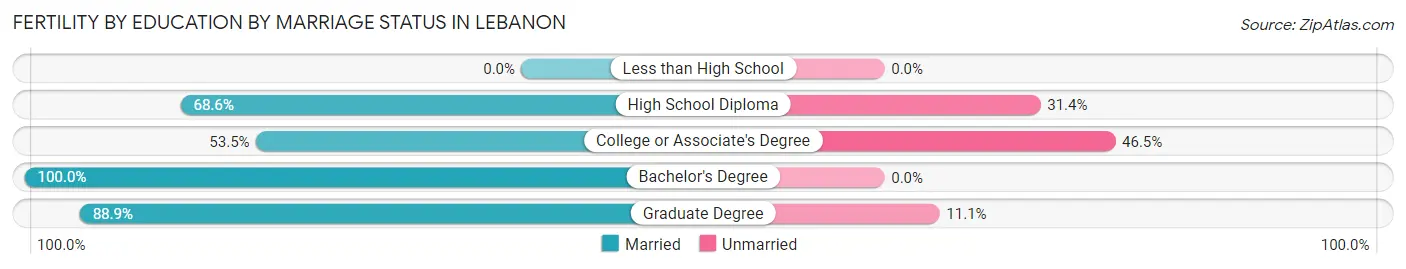
| Educational Attainment | Married | Unmarried |
| Less than High School | 0 (0.0%) | 0 (0.0%) |
| High School Diploma | 96 (68.6%) | 44 (31.4%) |
| College or Associate's Degree | 23 (53.5%) | 20 (46.5%) |
| Bachelor's Degree | 24 (100.0%) | 0 (0.0%) |
| Graduate Degree | 48 (88.9%) | 6 (11.1%) |
| Total | 191 (73.2%) | 70 (26.8%) |
Employment Characteristics in Lebanon
Employment by Class of Employer in Lebanon
Among the 11,518 employed individuals in Lebanon, private company employees (8,551 | 74.2%), not-for-profit organizations (1,252 | 10.9%), and local government employees (755 | 6.6%) make up the most common classes of employment.
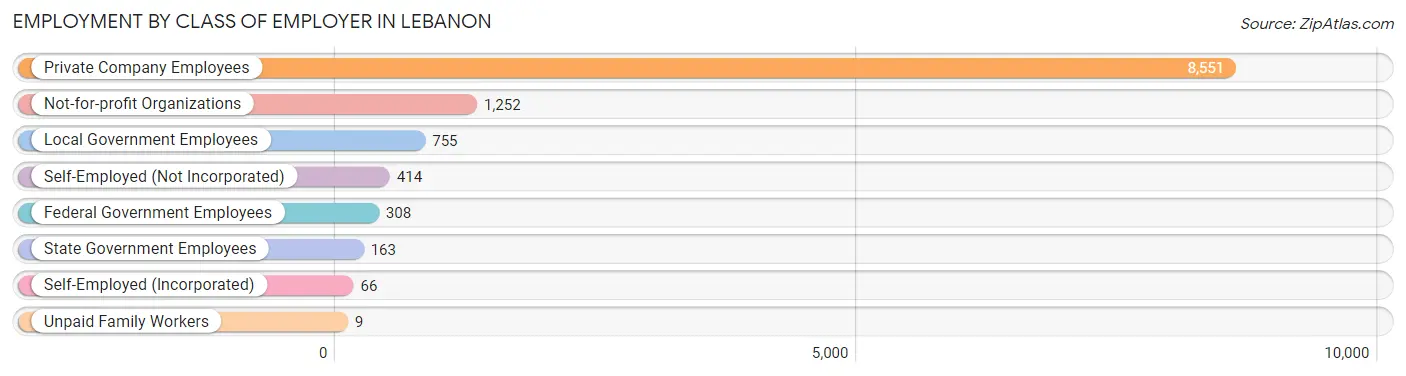
| Employer Class | # Employees | % Employees |
| Private Company Employees | 8,551 | 74.2% |
| Self-Employed (Incorporated) | 66 | 0.6% |
| Self-Employed (Not Incorporated) | 414 | 3.6% |
| Not-for-profit Organizations | 1,252 | 10.9% |
| Local Government Employees | 755 | 6.6% |
| State Government Employees | 163 | 1.4% |
| Federal Government Employees | 308 | 2.7% |
| Unpaid Family Workers | 9 | 0.1% |
| Total | 11,518 | 100.0% |
Employment Status by Age in Lebanon
According to the labor force statistics for Lebanon, out of the total population over 16 years of age (21,027), 61.1% or 12,847 individuals are in the labor force, with 10.0% or 1,285 of them unemployed. The age group with the highest labor force participation rate is 35 to 44 years, with 79.8% or 3,075 individuals in the labor force. Within the labor force, the 20 to 24 years age range has the highest percentage of unemployed individuals, with 18.9% or 254 of them being unemployed.
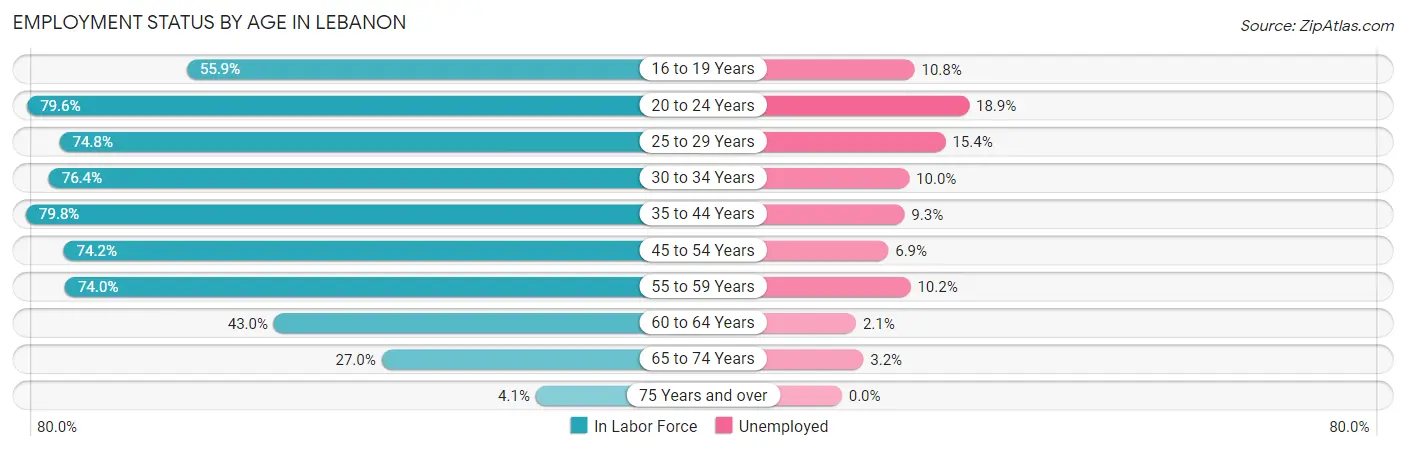
| Age Bracket | In Labor Force | Unemployed |
| 16 to 19 Years | 752 (55.9%) | 81 (10.8%) |
| 20 to 24 Years | 1,346 (79.6%) | 254 (18.9%) |
| 25 to 29 Years | 1,411 (74.8%) | 217 (15.4%) |
| 30 to 34 Years | 1,274 (76.4%) | 127 (10.0%) |
| 35 to 44 Years | 3,075 (79.8%) | 286 (9.3%) |
| 45 to 54 Years | 2,181 (74.2%) | 150 (6.9%) |
| 55 to 59 Years | 1,322 (74.0%) | 135 (10.2%) |
| 60 to 64 Years | 756 (43.0%) | 16 (2.1%) |
| 65 to 74 Years | 663 (27.0%) | 21 (3.2%) |
| 75 Years and over | 67 (4.1%) | 0 (0.0%) |
| Total | 12,847 (61.1%) | 1,285 (10.0%) |
Employment Status by Educational Attainment in Lebanon
According to labor force statistics for Lebanon, 72.1% of individuals (10,015) out of the total population between 25 and 64 years of age (13,890) are in the labor force, with 9.3% or 931 of them being unemployed. The group with the highest labor force participation rate are those with the educational attainment of bachelor's degree or higher, with 82.5% or 1,389 individuals in the labor force. Within the labor force, individuals with less than high school education have the highest percentage of unemployment, with 13.8% or 168 of them being unemployed.
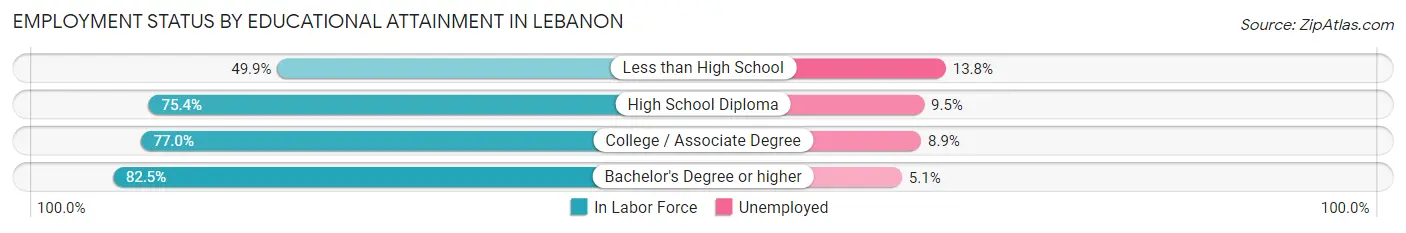
| Educational Attainment | In Labor Force | Unemployed |
| Less than High School | 1,221 (49.9%) | 338 (13.8%) |
| High School Diploma | 4,997 (75.4%) | 630 (9.5%) |
| College / Associate Degree | 2,412 (77.0%) | 279 (8.9%) |
| Bachelor's Degree or higher | 1,389 (82.5%) | 86 (5.1%) |
| Total | 10,015 (72.1%) | 1,292 (9.3%) |
Employment Occupations by Sex in Lebanon
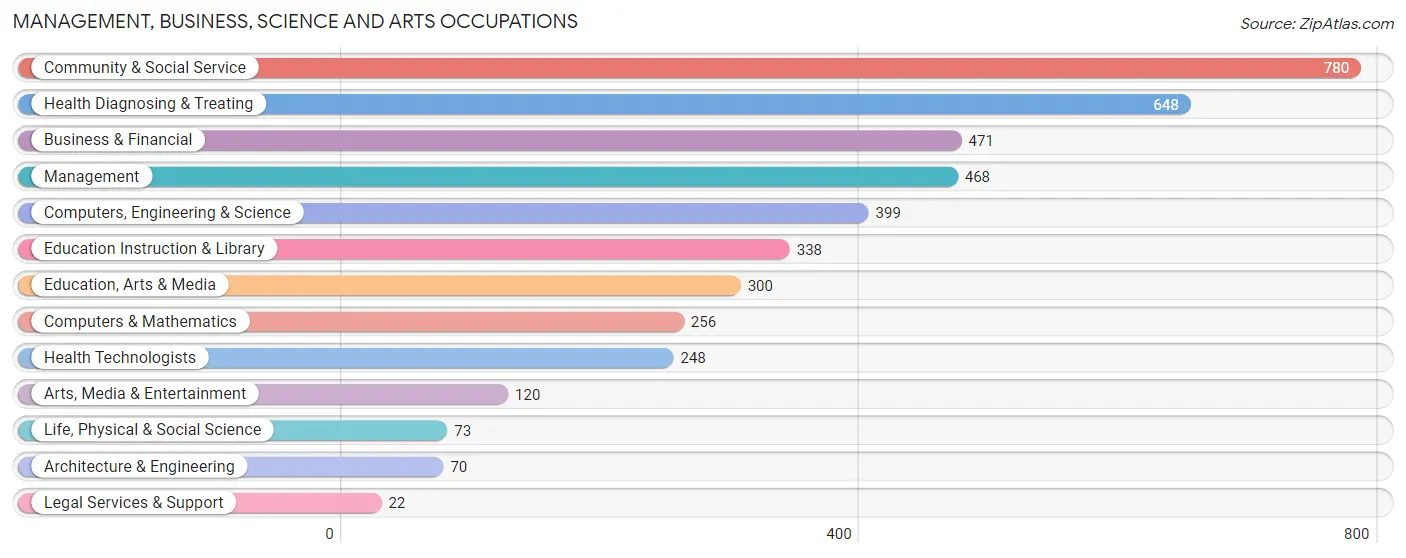
Management, Business, Science and Arts Occupations
The most common Management, Business, Science and Arts occupations in Lebanon are Community & Social Service (780 | 6.8%), Health Diagnosing & Treating (648 | 5.6%), Business & Financial (471 | 4.1%), Management (468 | 4.1%), and Computers, Engineering & Science (399 | 3.5%).
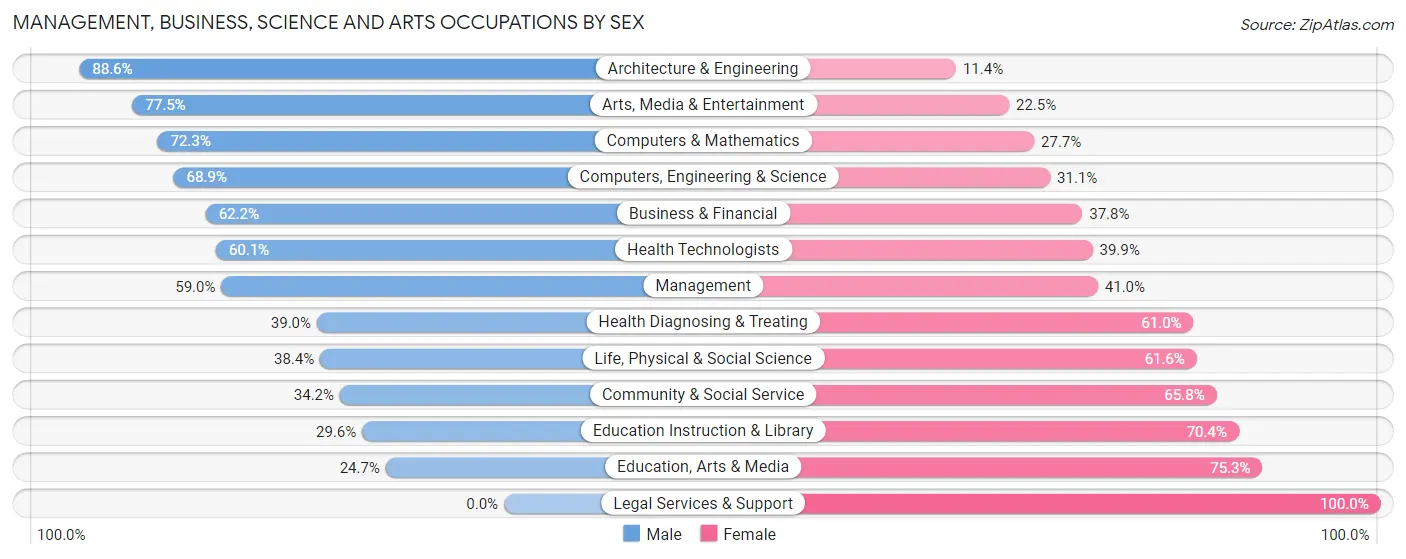
Management, Business, Science and Arts Occupations by Sex
Within the Management, Business, Science and Arts occupations in Lebanon, the most male-oriented occupations are Architecture & Engineering (88.6%), Arts, Media & Entertainment (77.5%), and Computers & Mathematics (72.3%), while the most female-oriented occupations are Legal Services & Support (100.0%), Education, Arts & Media (75.3%), and Education Instruction & Library (70.4%).
| Occupation | Male | Female |
| Management | 276 (59.0%) | 192 (41.0%) |
| Business & Financial | 293 (62.2%) | 178 (37.8%) |
| Computers, Engineering & Science | 275 (68.9%) | 124 (31.1%) |
| Computers & Mathematics | 185 (72.3%) | 71 (27.7%) |
| Architecture & Engineering | 62 (88.6%) | 8 (11.4%) |
| Life, Physical & Social Science | 28 (38.4%) | 45 (61.6%) |
| Community & Social Service | 267 (34.2%) | 513 (65.8%) |
| Education, Arts & Media | 74 (24.7%) | 226 (75.3%) |
| Legal Services & Support | 0 (0.0%) | 22 (100.0%) |
| Education Instruction & Library | 100 (29.6%) | 238 (70.4%) |
| Arts, Media & Entertainment | 93 (77.5%) | 27 (22.5%) |
| Health Diagnosing & Treating | 253 (39.0%) | 395 (61.0%) |
| Health Technologists | 149 (60.1%) | 99 (39.9%) |
| Total (Category) | 1,364 (49.3%) | 1,402 (50.7%) |
| Total (Overall) | 5,792 (50.2%) | 5,751 (49.8%) |
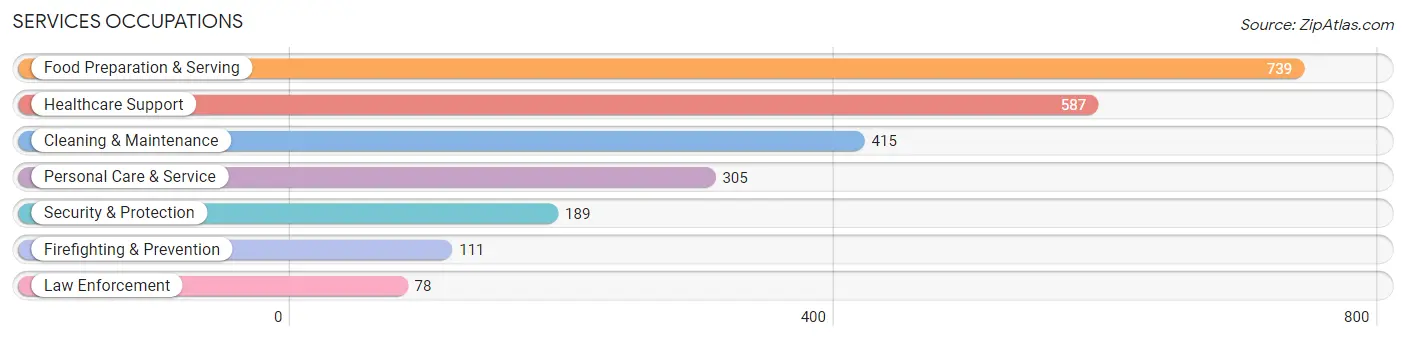
Services Occupations
The most common Services occupations in Lebanon are Food Preparation & Serving (739 | 6.4%), Healthcare Support (587 | 5.1%), Cleaning & Maintenance (415 | 3.6%), Personal Care & Service (305 | 2.6%), and Security & Protection (189 | 1.6%).
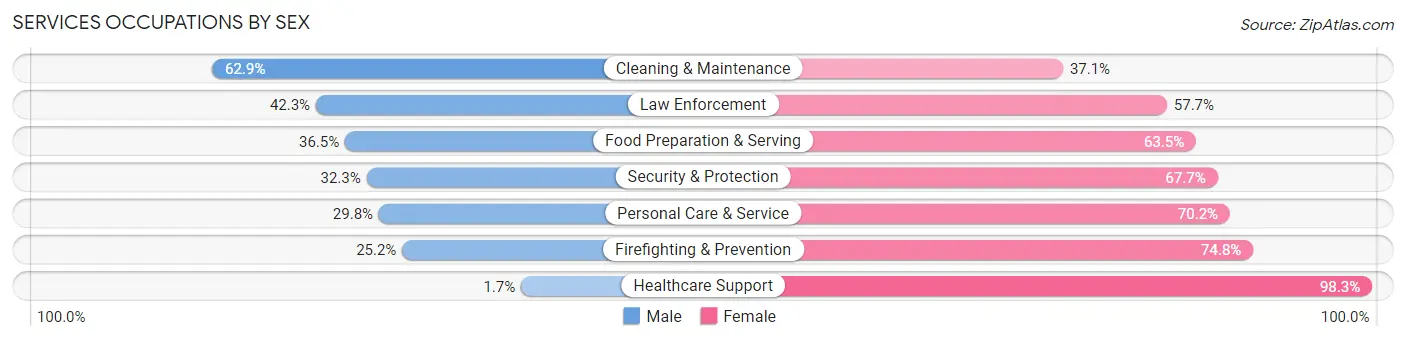
Services Occupations by Sex
Within the Services occupations in Lebanon, the most male-oriented occupations are Cleaning & Maintenance (62.9%), Law Enforcement (42.3%), and Food Preparation & Serving (36.5%), while the most female-oriented occupations are Healthcare Support (98.3%), Firefighting & Prevention (74.8%), and Personal Care & Service (70.2%).
| Occupation | Male | Female |
| Healthcare Support | 10 (1.7%) | 577 (98.3%) |
| Security & Protection | 61 (32.3%) | 128 (67.7%) |
| Firefighting & Prevention | 28 (25.2%) | 83 (74.8%) |
| Law Enforcement | 33 (42.3%) | 45 (57.7%) |
| Food Preparation & Serving | 270 (36.5%) | 469 (63.5%) |
| Cleaning & Maintenance | 261 (62.9%) | 154 (37.1%) |
| Personal Care & Service | 91 (29.8%) | 214 (70.2%) |
| Total (Category) | 693 (31.0%) | 1,542 (69.0%) |
| Total (Overall) | 5,792 (50.2%) | 5,751 (49.8%) |
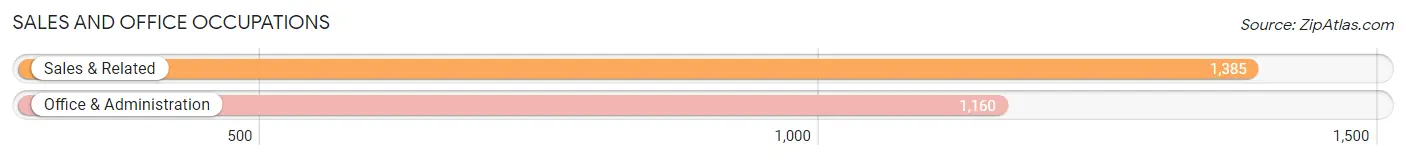
Sales and Office Occupations
The most common Sales and Office occupations in Lebanon are Sales & Related (1,385 | 12.0%), and Office & Administration (1,160 | 10.1%).
Sales and Office Occupations by Sex
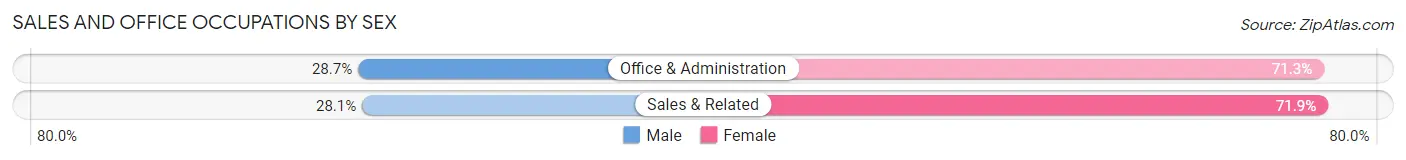
| Occupation | Male | Female |
| Sales & Related | 389 (28.1%) | 996 (71.9%) |
| Office & Administration | 333 (28.7%) | 827 (71.3%) |
| Total (Category) | 722 (28.4%) | 1,823 (71.6%) |
| Total (Overall) | 5,792 (50.2%) | 5,751 (49.8%) |
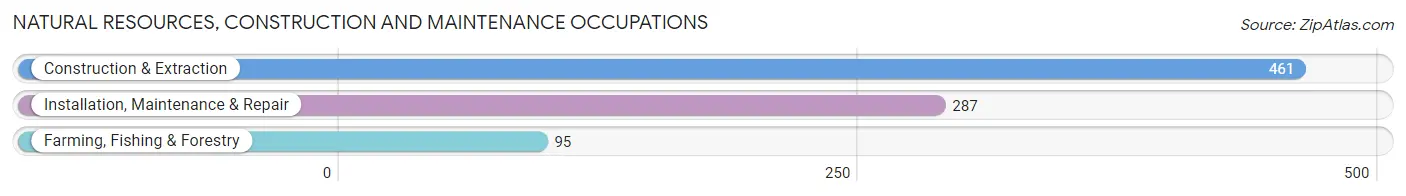
Natural Resources, Construction and Maintenance Occupations
The most common Natural Resources, Construction and Maintenance occupations in Lebanon are Construction & Extraction (461 | 4.0%), Installation, Maintenance & Repair (287 | 2.5%), and Farming, Fishing & Forestry (95 | 0.8%).
Natural Resources, Construction and Maintenance Occupations by Sex
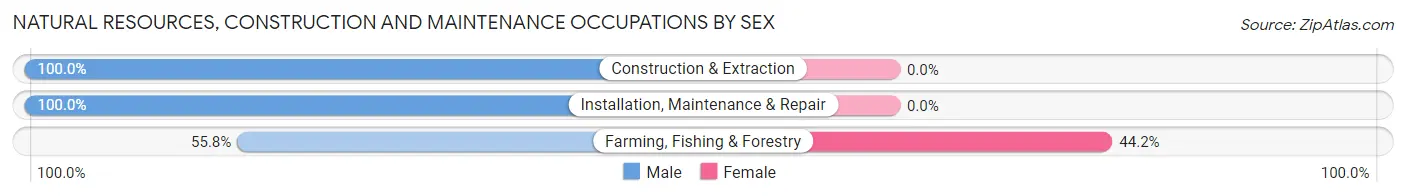
| Occupation | Male | Female |
| Farming, Fishing & Forestry | 53 (55.8%) | 42 (44.2%) |
| Construction & Extraction | 461 (100.0%) | 0 (0.0%) |
| Installation, Maintenance & Repair | 287 (100.0%) | 0 (0.0%) |
| Total (Category) | 801 (95.0%) | 42 (5.0%) |
| Total (Overall) | 5,792 (50.2%) | 5,751 (49.8%) |
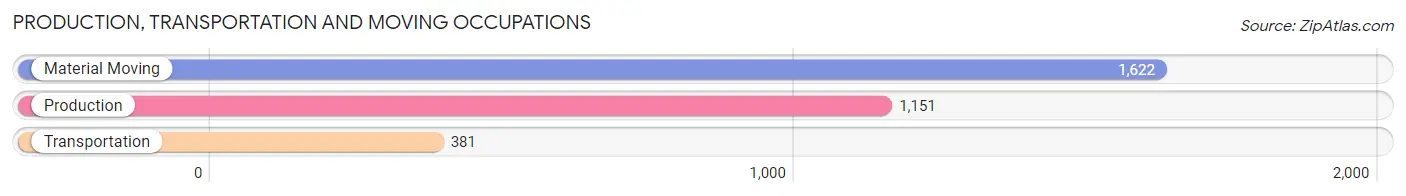
Production, Transportation and Moving Occupations
The most common Production, Transportation and Moving occupations in Lebanon are Material Moving (1,622 | 14.1%), Production (1,151 | 10.0%), and Transportation (381 | 3.3%).
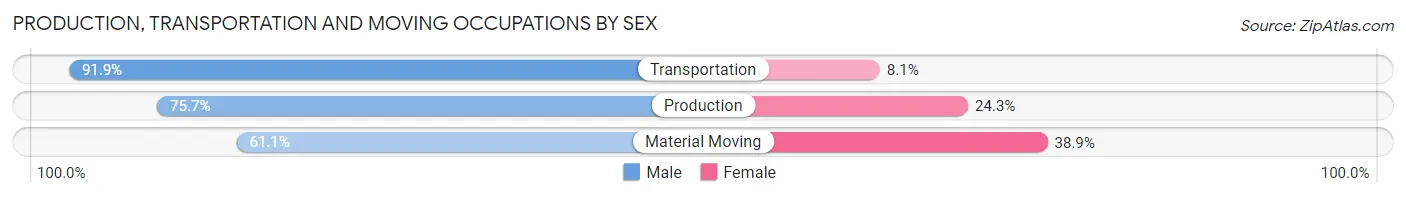
Production, Transportation and Moving Occupations by Sex
| Occupation | Male | Female |
| Production | 871 (75.7%) | 280 (24.3%) |
| Transportation | 350 (91.9%) | 31 (8.1%) |
| Material Moving | 991 (61.1%) | 631 (38.9%) |
| Total (Category) | 2,212 (70.1%) | 942 (29.9%) |
| Total (Overall) | 5,792 (50.2%) | 5,751 (49.8%) |
Employment Industries by Sex in Lebanon
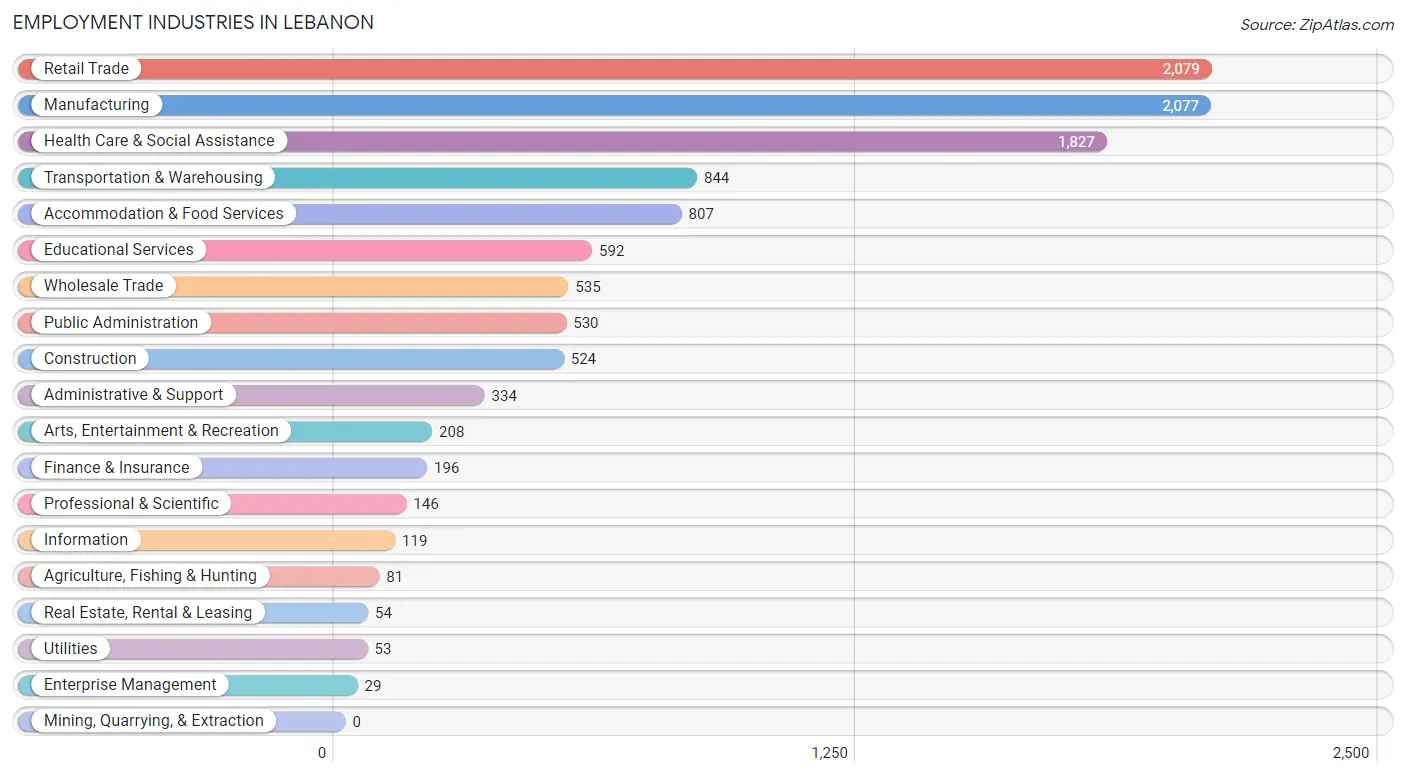
Employment Industries in Lebanon
The major employment industries in Lebanon include Retail Trade (2,079 | 18.0%), Manufacturing (2,077 | 18.0%), Health Care & Social Assistance (1,827 | 15.8%), Transportation & Warehousing (844 | 7.3%), and Accommodation & Food Services (807 | 7.0%).
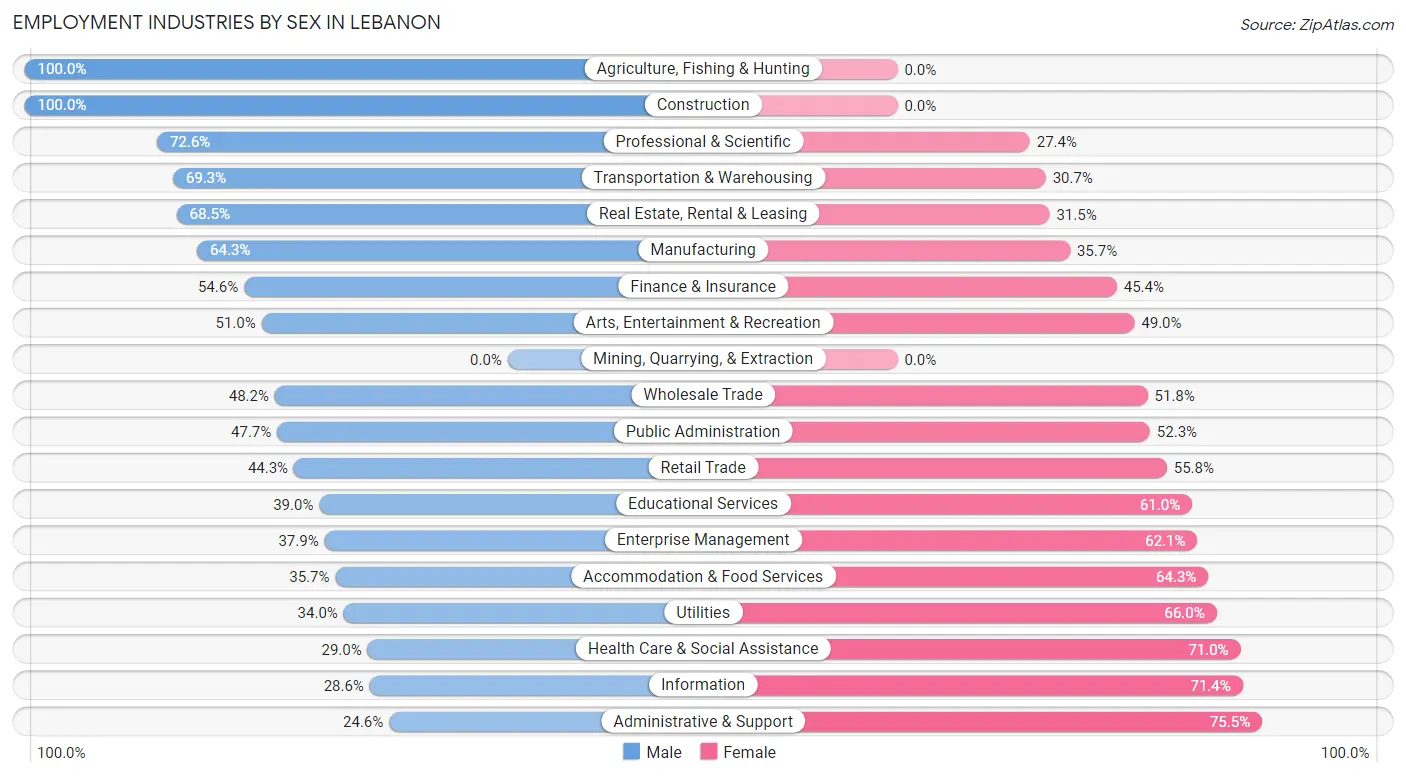
Employment Industries by Sex in Lebanon
The Lebanon industries that see more men than women are Agriculture, Fishing & Hunting (100.0%), Construction (100.0%), and Professional & Scientific (72.6%), whereas the industries that tend to have a higher number of women are Administrative & Support (75.4%), Information (71.4%), and Health Care & Social Assistance (71.0%).
| Industry | Male | Female |
| Agriculture, Fishing & Hunting | 81 (100.0%) | 0 (0.0%) |
| Mining, Quarrying, & Extraction | 0 (0.0%) | 0 (0.0%) |
| Construction | 524 (100.0%) | 0 (0.0%) |
| Manufacturing | 1,335 (64.3%) | 742 (35.7%) |
| Wholesale Trade | 258 (48.2%) | 277 (51.8%) |
| Retail Trade | 920 (44.3%) | 1,159 (55.7%) |
| Transportation & Warehousing | 585 (69.3%) | 259 (30.7%) |
| Utilities | 18 (34.0%) | 35 (66.0%) |
| Information | 34 (28.6%) | 85 (71.4%) |
| Finance & Insurance | 107 (54.6%) | 89 (45.4%) |
| Real Estate, Rental & Leasing | 37 (68.5%) | 17 (31.5%) |
| Professional & Scientific | 106 (72.6%) | 40 (27.4%) |
| Enterprise Management | 11 (37.9%) | 18 (62.1%) |
| Administrative & Support | 82 (24.5%) | 252 (75.4%) |
| Educational Services | 231 (39.0%) | 361 (61.0%) |
| Health Care & Social Assistance | 530 (29.0%) | 1,297 (71.0%) |
| Arts, Entertainment & Recreation | 106 (51.0%) | 102 (49.0%) |
| Accommodation & Food Services | 288 (35.7%) | 519 (64.3%) |
| Public Administration | 253 (47.7%) | 277 (52.3%) |
| Total | 5,792 (50.2%) | 5,751 (49.8%) |
Education in Lebanon
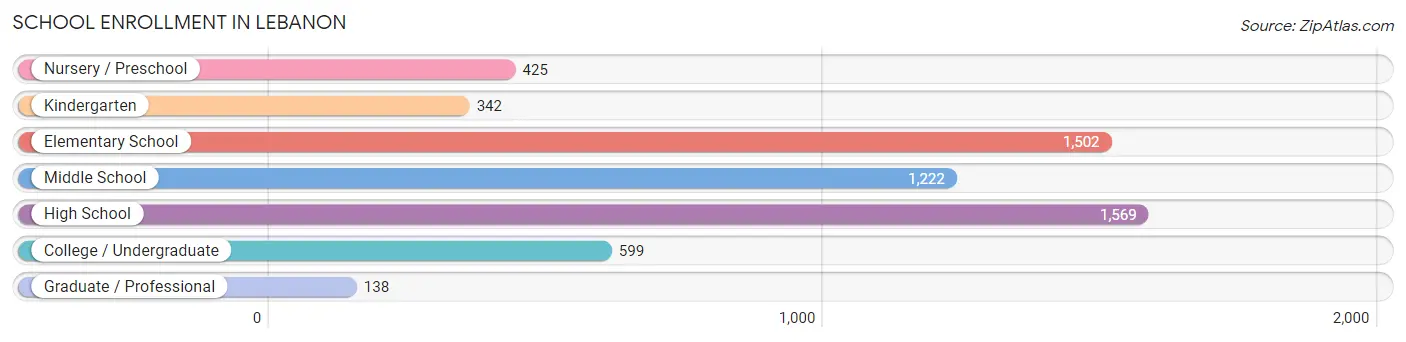
School Enrollment in Lebanon
The most common levels of schooling among the 5,797 students in Lebanon are high school (1,569 | 27.1%), elementary school (1,502 | 25.9%), and middle school (1,222 | 21.1%).
| School Level | # Students | % Students |
| Nursery / Preschool | 425 | 7.3% |
| Kindergarten | 342 | 5.9% |
| Elementary School | 1,502 | 25.9% |
| Middle School | 1,222 | 21.1% |
| High School | 1,569 | 27.1% |
| College / Undergraduate | 599 | 10.3% |
| Graduate / Professional | 138 | 2.4% |
| Total | 5,797 | 100.0% |
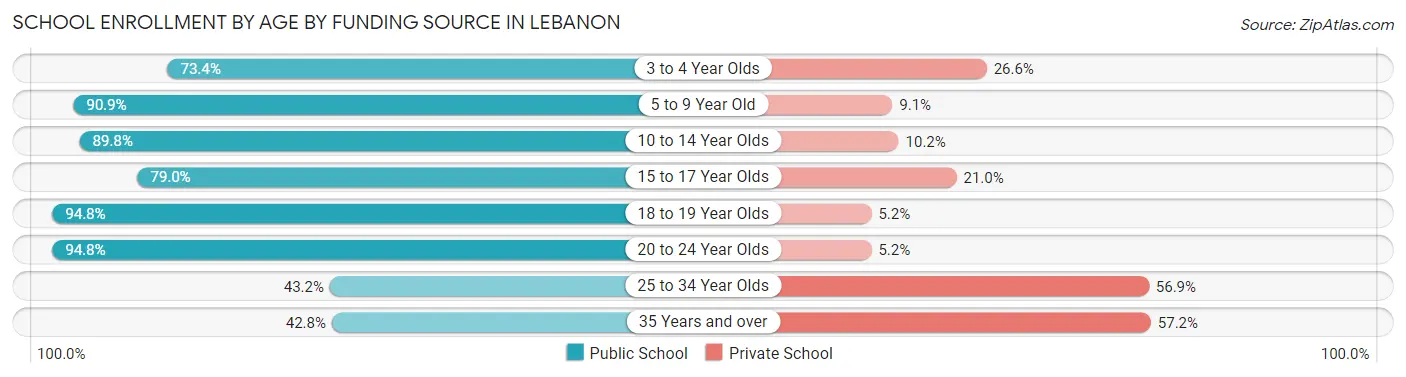
School Enrollment by Age by Funding Source in Lebanon
Out of a total of 5,797 students who are enrolled in schools in Lebanon, 980 (16.9%) attend a private institution, while the remaining 4,817 (83.1%) are enrolled in public schools. The age group of 35 years and over has the highest likelihood of being enrolled in private schools, with 111 (57.2% in the age bracket) enrolled. Conversely, the age group of 20 to 24 year olds has the lowest likelihood of being enrolled in a private school, with 275 (94.8% in the age bracket) attending a public institution.
| Age Bracket | Public School | Private School |
| 3 to 4 Year Olds | 358 (73.4%) | 130 (26.6%) |
| 5 to 9 Year Old | 1,413 (90.9%) | 141 (9.1%) |
| 10 to 14 Year Olds | 1,308 (89.8%) | 149 (10.2%) |
| 15 to 17 Year Olds | 943 (79.0%) | 251 (21.0%) |
| 18 to 19 Year Olds | 311 (94.8%) | 17 (5.2%) |
| 20 to 24 Year Olds | 275 (94.8%) | 15 (5.2%) |
| 25 to 34 Year Olds | 126 (43.1%) | 166 (56.9%) |
| 35 Years and over | 83 (42.8%) | 111 (57.2%) |
| Total | 4,817 (83.1%) | 980 (16.9%) |
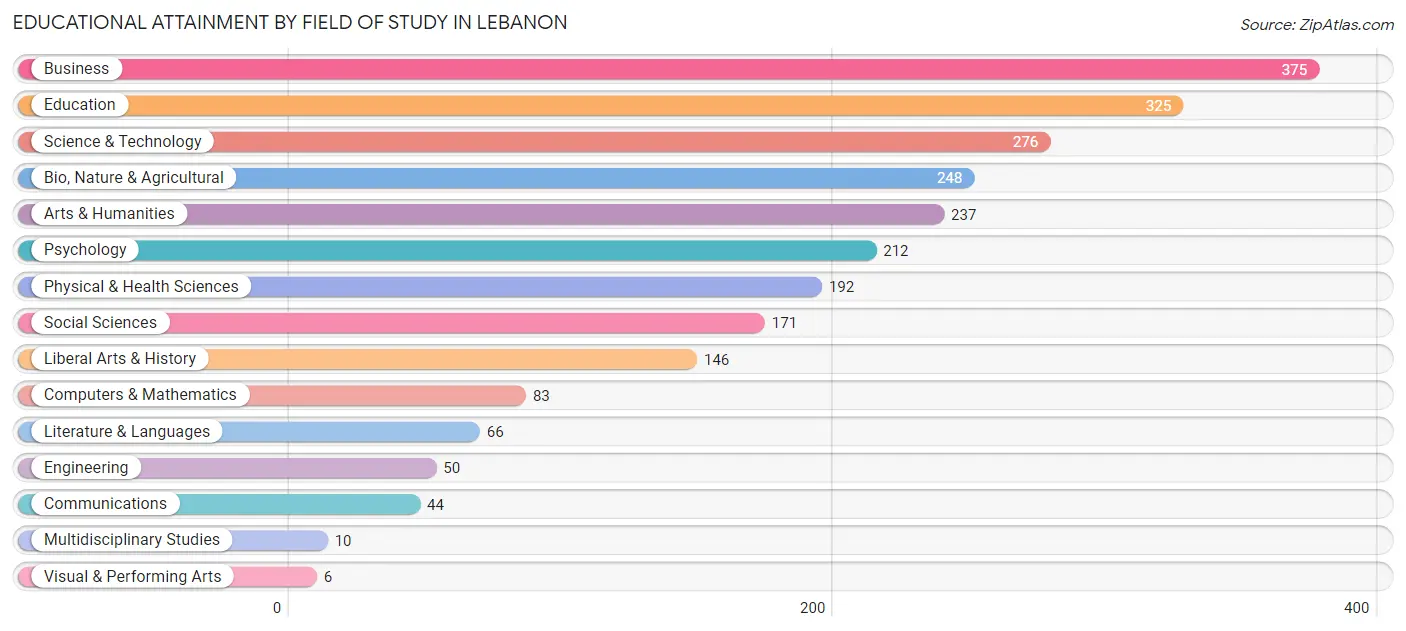
Educational Attainment by Field of Study in Lebanon
Business (375 | 15.4%), education (325 | 13.3%), science & technology (276 | 11.3%), bio, nature & agricultural (248 | 10.2%), and arts & humanities (237 | 9.7%) are the most common fields of study among 2,441 individuals in Lebanon who have obtained a bachelor's degree or higher.
| Field of Study | # Graduates | % Graduates |
| Computers & Mathematics | 83 | 3.4% |
| Bio, Nature & Agricultural | 248 | 10.2% |
| Physical & Health Sciences | 192 | 7.9% |
| Psychology | 212 | 8.7% |
| Social Sciences | 171 | 7.0% |
| Engineering | 50 | 2.1% |
| Multidisciplinary Studies | 10 | 0.4% |
| Science & Technology | 276 | 11.3% |
| Business | 375 | 15.4% |
| Education | 325 | 13.3% |
| Literature & Languages | 66 | 2.7% |
| Liberal Arts & History | 146 | 6.0% |
| Visual & Performing Arts | 6 | 0.3% |
| Communications | 44 | 1.8% |
| Arts & Humanities | 237 | 9.7% |
| Total | 2,441 | 100.0% |
Transportation & Commute in Lebanon
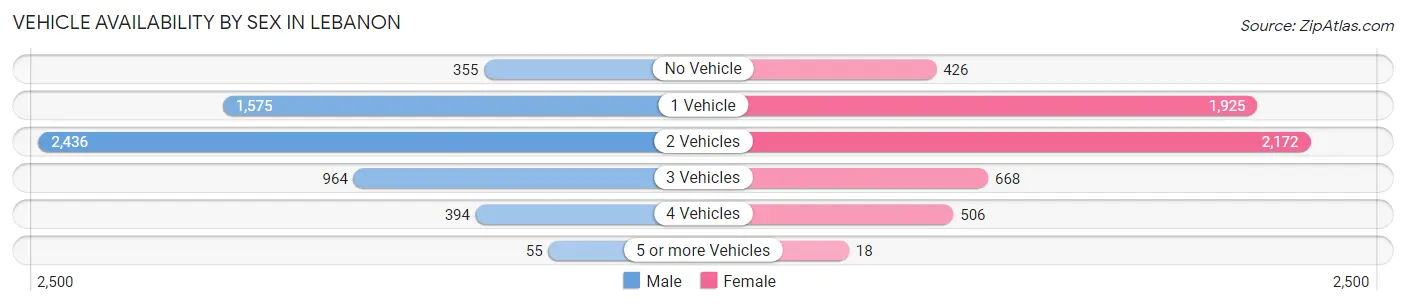
Vehicle Availability by Sex in Lebanon
The most prevalent vehicle ownership categories in Lebanon are males with 2 vehicles (2,436, accounting for 42.1%) and females with 2 vehicles (2,172, making up 42.6%).
| Vehicles Available | Male | Female |
| No Vehicle | 355 (6.1%) | 426 (7.4%) |
| 1 Vehicle | 1,575 (27.3%) | 1,925 (33.7%) |
| 2 Vehicles | 2,436 (42.1%) | 2,172 (38.0%) |
| 3 Vehicles | 964 (16.7%) | 668 (11.7%) |
| 4 Vehicles | 394 (6.8%) | 506 (8.8%) |
| 5 or more Vehicles | 55 (0.9%) | 18 (0.3%) |
| Total | 5,779 (100.0%) | 5,715 (100.0%) |
Commute Time in Lebanon
The most frequently occuring commute durations in Lebanon are 10 to 14 minutes (2,115 commuters, 18.9%), 15 to 19 minutes (1,996 commuters, 17.8%), and 5 to 9 minutes (1,874 commuters, 16.7%).
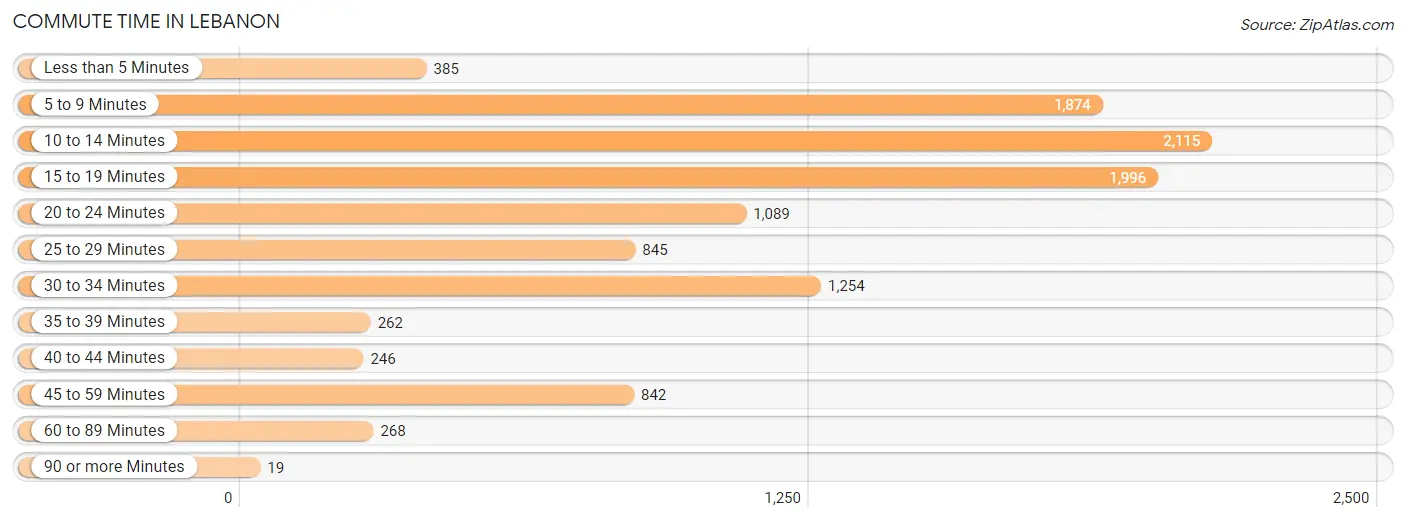
| Commute Time | # Commuters | % Commuters |
| Less than 5 Minutes | 385 | 3.4% |
| 5 to 9 Minutes | 1,874 | 16.7% |
| 10 to 14 Minutes | 2,115 | 18.9% |
| 15 to 19 Minutes | 1,996 | 17.8% |
| 20 to 24 Minutes | 1,089 | 9.7% |
| 25 to 29 Minutes | 845 | 7.5% |
| 30 to 34 Minutes | 1,254 | 11.2% |
| 35 to 39 Minutes | 262 | 2.3% |
| 40 to 44 Minutes | 246 | 2.2% |
| 45 to 59 Minutes | 842 | 7.5% |
| 60 to 89 Minutes | 268 | 2.4% |
| 90 or more Minutes | 19 | 0.2% |
Commute Time by Sex in Lebanon
The most common commute times in Lebanon are 15 to 19 minutes (1,148 commuters, 20.4%) for males and 10 to 14 minutes (1,190 commuters, 21.3%) for females.
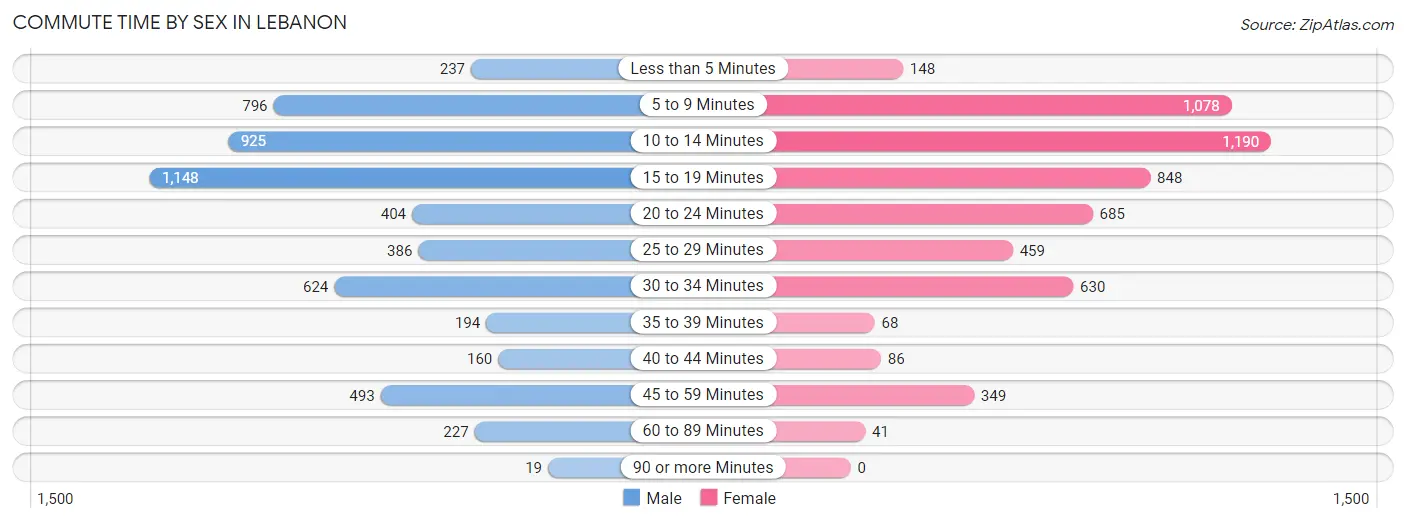
| Commute Time | Male | Female |
| Less than 5 Minutes | 237 (4.2%) | 148 (2.6%) |
| 5 to 9 Minutes | 796 (14.2%) | 1,078 (19.3%) |
| 10 to 14 Minutes | 925 (16.5%) | 1,190 (21.3%) |
| 15 to 19 Minutes | 1,148 (20.4%) | 848 (15.2%) |
| 20 to 24 Minutes | 404 (7.2%) | 685 (12.3%) |
| 25 to 29 Minutes | 386 (6.9%) | 459 (8.2%) |
| 30 to 34 Minutes | 624 (11.1%) | 630 (11.3%) |
| 35 to 39 Minutes | 194 (3.5%) | 68 (1.2%) |
| 40 to 44 Minutes | 160 (2.9%) | 86 (1.5%) |
| 45 to 59 Minutes | 493 (8.8%) | 349 (6.2%) |
| 60 to 89 Minutes | 227 (4.0%) | 41 (0.7%) |
| 90 or more Minutes | 19 (0.3%) | 0 (0.0%) |
Time of Departure to Work by Sex in Lebanon
The most frequent times of departure to work in Lebanon are 4:00 PM to 11:59 PM (730, 13.0%) for males and 7:30 AM to 7:59 AM (990, 17.7%) for females.
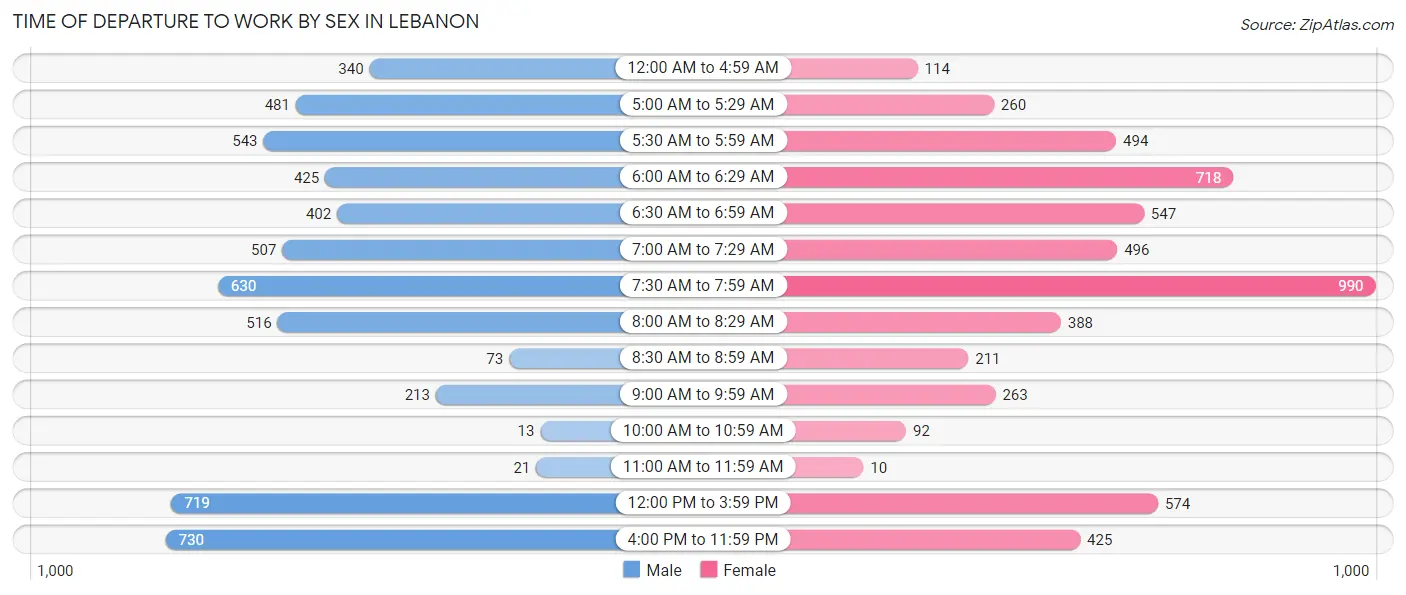
| Time of Departure | Male | Female |
| 12:00 AM to 4:59 AM | 340 (6.1%) | 114 (2.0%) |
| 5:00 AM to 5:29 AM | 481 (8.6%) | 260 (4.7%) |
| 5:30 AM to 5:59 AM | 543 (9.7%) | 494 (8.8%) |
| 6:00 AM to 6:29 AM | 425 (7.6%) | 718 (12.9%) |
| 6:30 AM to 6:59 AM | 402 (7.2%) | 547 (9.8%) |
| 7:00 AM to 7:29 AM | 507 (9.0%) | 496 (8.9%) |
| 7:30 AM to 7:59 AM | 630 (11.2%) | 990 (17.7%) |
| 8:00 AM to 8:29 AM | 516 (9.2%) | 388 (7.0%) |
| 8:30 AM to 8:59 AM | 73 (1.3%) | 211 (3.8%) |
| 9:00 AM to 9:59 AM | 213 (3.8%) | 263 (4.7%) |
| 10:00 AM to 10:59 AM | 13 (0.2%) | 92 (1.7%) |
| 11:00 AM to 11:59 AM | 21 (0.4%) | 10 (0.2%) |
| 12:00 PM to 3:59 PM | 719 (12.8%) | 574 (10.3%) |
| 4:00 PM to 11:59 PM | 730 (13.0%) | 425 (7.6%) |
| Total | 5,613 (100.0%) | 5,582 (100.0%) |
Housing Occupancy in Lebanon
Occupancy by Ownership in Lebanon
Of the total 10,594 dwellings in Lebanon, owner-occupied units account for 4,957 (46.8%), while renter-occupied units make up 5,637 (53.2%).
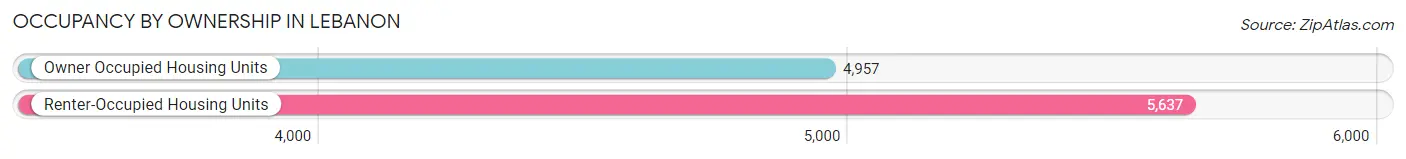
| Occupancy | # Housing Units | % Housing Units |
| Owner Occupied Housing Units | 4,957 | 46.8% |
| Renter-Occupied Housing Units | 5,637 | 53.2% |
| Total Occupied Housing Units | 10,594 | 100.0% |
Occupancy by Household Size in Lebanon
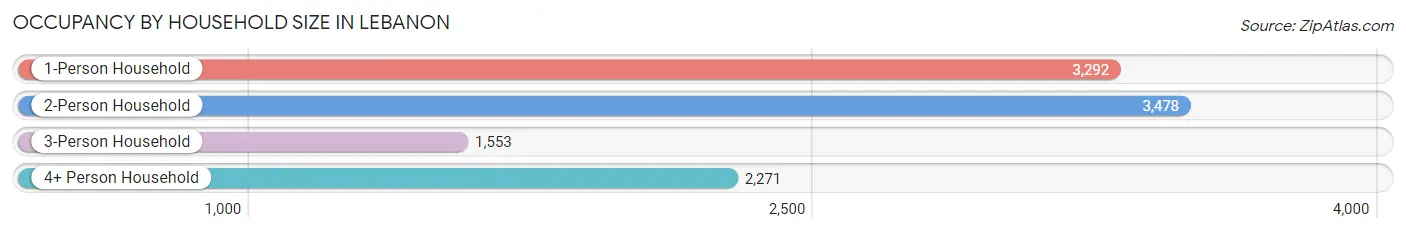
| Household Size | # Housing Units | % Housing Units |
| 1-Person Household | 3,292 | 31.1% |
| 2-Person Household | 3,478 | 32.8% |
| 3-Person Household | 1,553 | 14.7% |
| 4+ Person Household | 2,271 | 21.4% |
| Total Housing Units | 10,594 | 100.0% |
Occupancy by Ownership by Household Size in Lebanon
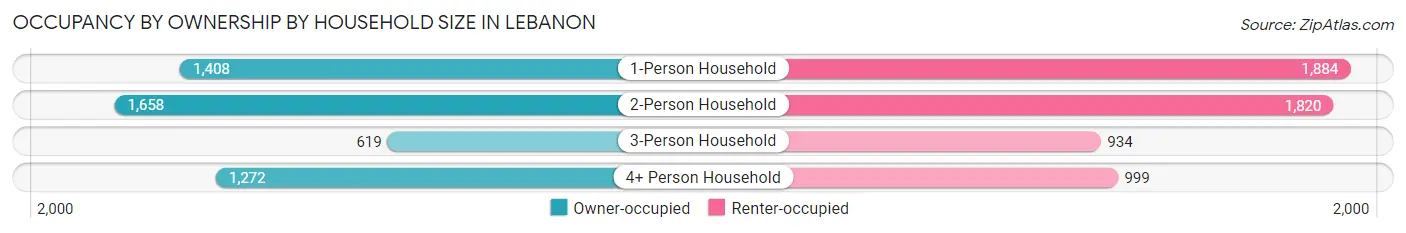
| Household Size | Owner-occupied | Renter-occupied |
| 1-Person Household | 1,408 (42.8%) | 1,884 (57.2%) |
| 2-Person Household | 1,658 (47.7%) | 1,820 (52.3%) |
| 3-Person Household | 619 (39.9%) | 934 (60.1%) |
| 4+ Person Household | 1,272 (56.0%) | 999 (44.0%) |
| Total Housing Units | 4,957 (46.8%) | 5,637 (53.2%) |
Occupancy by Educational Attainment in Lebanon
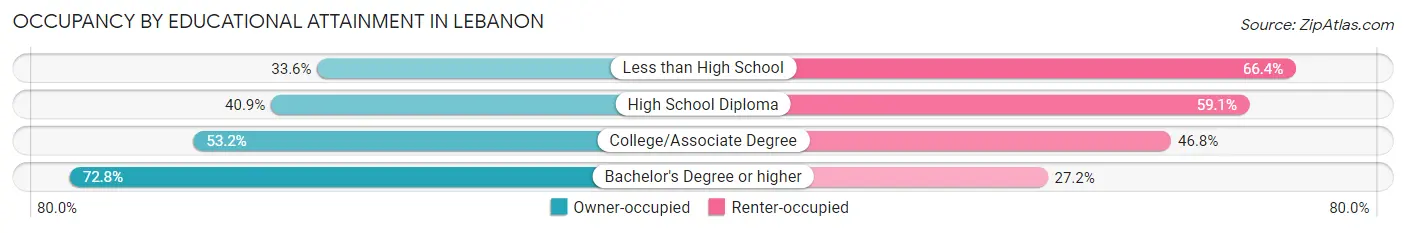
| Household Size | Owner-occupied | Renter-occupied |
| Less than High School | 537 (33.6%) | 1,063 (66.4%) |
| High School Diploma | 2,077 (40.9%) | 3,001 (59.1%) |
| College/Associate Degree | 1,381 (53.2%) | 1,214 (46.8%) |
| Bachelor's Degree or higher | 962 (72.8%) | 359 (27.2%) |
Occupancy by Age of Householder in Lebanon
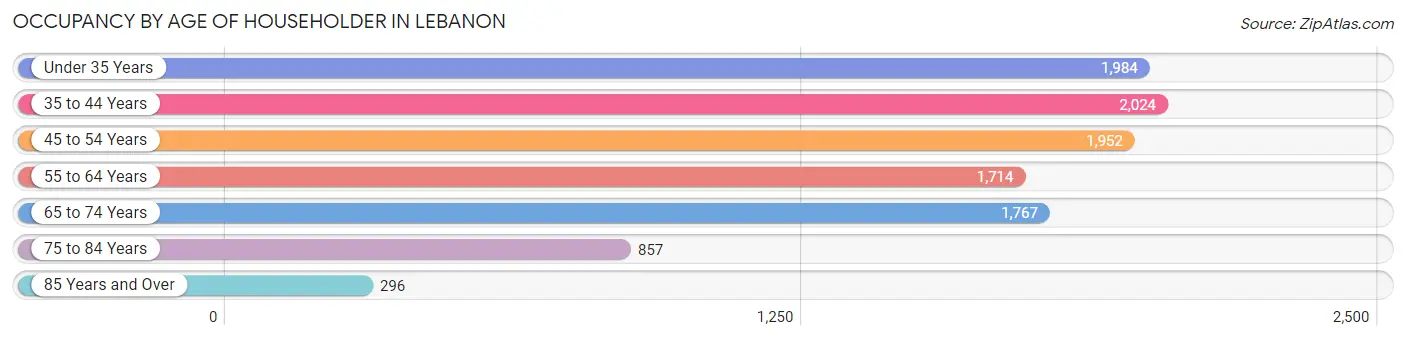
| Age Bracket | # Households | % Households |
| Under 35 Years | 1,984 | 18.7% |
| 35 to 44 Years | 2,024 | 19.1% |
| 45 to 54 Years | 1,952 | 18.4% |
| 55 to 64 Years | 1,714 | 16.2% |
| 65 to 74 Years | 1,767 | 16.7% |
| 75 to 84 Years | 857 | 8.1% |
| 85 Years and Over | 296 | 2.8% |
| Total | 10,594 | 100.0% |
Housing Finances in Lebanon
Median Income by Occupancy in Lebanon
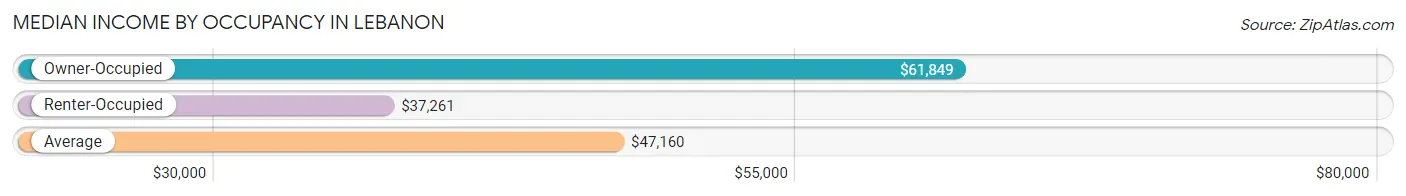
| Occupancy Type | # Households | Median Income |
| Owner-Occupied | 4,957 (46.8%) | $61,849 |
| Renter-Occupied | 5,637 (53.2%) | $37,261 |
| Average | 10,594 (100.0%) | $47,160 |
Occupancy by Householder Income Bracket in Lebanon
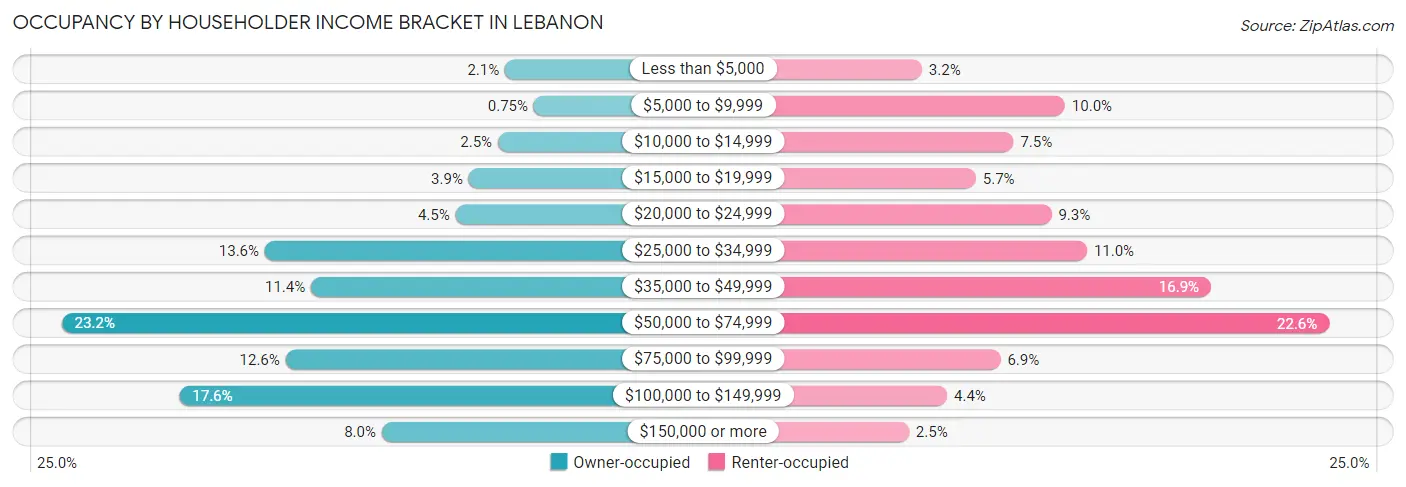
| Income Bracket | Owner-occupied | Renter-occupied |
| Less than $5,000 | 105 (2.1%) | 178 (3.2%) |
| $5,000 to $9,999 | 37 (0.7%) | 562 (10.0%) |
| $10,000 to $14,999 | 122 (2.5%) | 424 (7.5%) |
| $15,000 to $19,999 | 191 (3.8%) | 323 (5.7%) |
| $20,000 to $24,999 | 222 (4.5%) | 526 (9.3%) |
| $25,000 to $34,999 | 672 (13.6%) | 621 (11.0%) |
| $35,000 to $49,999 | 563 (11.4%) | 954 (16.9%) |
| $50,000 to $74,999 | 1,152 (23.2%) | 1,271 (22.6%) |
| $75,000 to $99,999 | 623 (12.6%) | 389 (6.9%) |
| $100,000 to $149,999 | 874 (17.6%) | 246 (4.4%) |
| $150,000 or more | 396 (8.0%) | 143 (2.5%) |
| Total | 4,957 (100.0%) | 5,637 (100.0%) |
Monthly Housing Cost Tiers in Lebanon
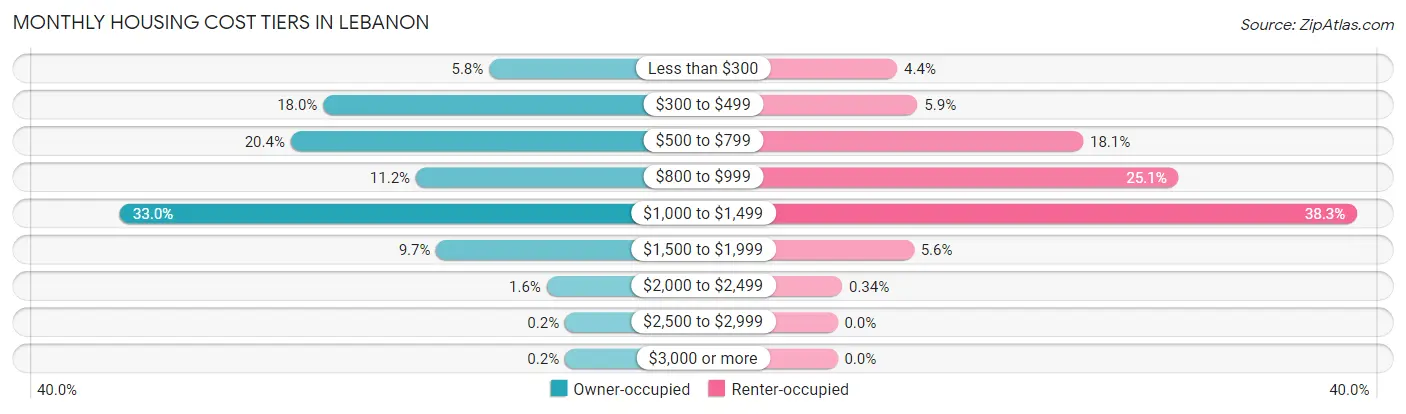
| Monthly Cost | Owner-occupied | Renter-occupied |
| Less than $300 | 287 (5.8%) | 248 (4.4%) |
| $300 to $499 | 893 (18.0%) | 332 (5.9%) |
| $500 to $799 | 1,011 (20.4%) | 1,020 (18.1%) |
| $800 to $999 | 554 (11.2%) | 1,416 (25.1%) |
| $1,000 to $1,499 | 1,635 (33.0%) | 2,157 (38.3%) |
| $1,500 to $1,999 | 480 (9.7%) | 317 (5.6%) |
| $2,000 to $2,499 | 77 (1.5%) | 19 (0.3%) |
| $2,500 to $2,999 | 10 (0.2%) | 0 (0.0%) |
| $3,000 or more | 10 (0.2%) | 0 (0.0%) |
| Total | 4,957 (100.0%) | 5,637 (100.0%) |
Physical Housing Characteristics in Lebanon
Housing Structures in Lebanon
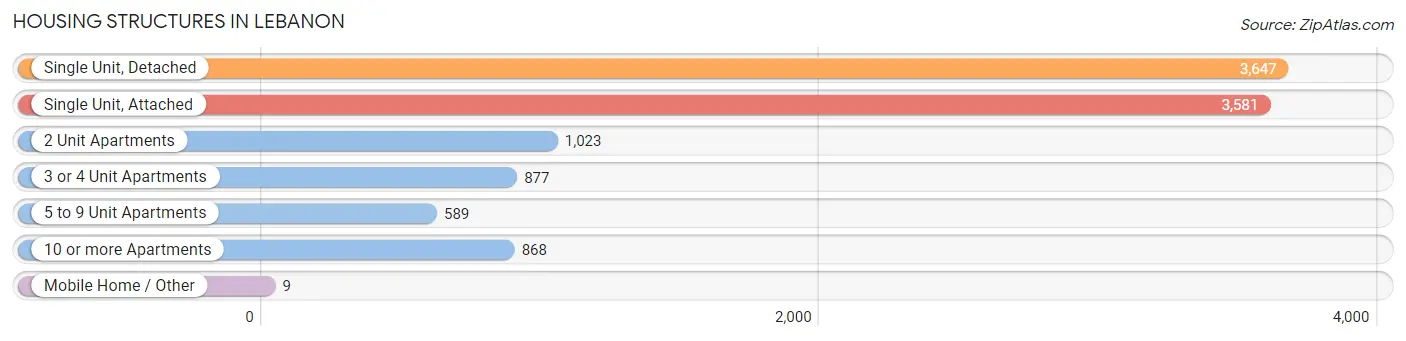
| Structure Type | # Housing Units | % Housing Units |
| Single Unit, Detached | 3,647 | 34.4% |
| Single Unit, Attached | 3,581 | 33.8% |
| 2 Unit Apartments | 1,023 | 9.7% |
| 3 or 4 Unit Apartments | 877 | 8.3% |
| 5 to 9 Unit Apartments | 589 | 5.6% |
| 10 or more Apartments | 868 | 8.2% |
| Mobile Home / Other | 9 | 0.1% |
| Total | 10,594 | 100.0% |
Housing Structures by Occupancy in Lebanon
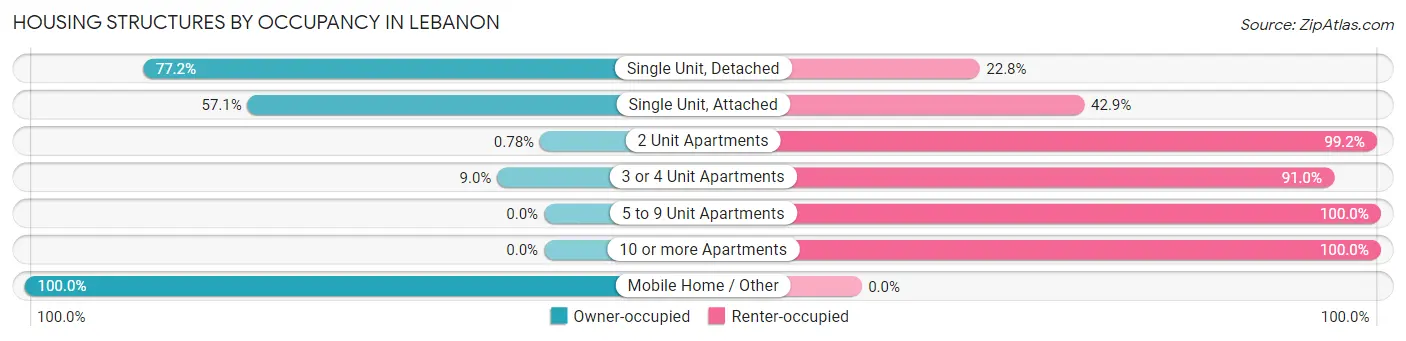
| Structure Type | Owner-occupied | Renter-occupied |
| Single Unit, Detached | 2,817 (77.2%) | 830 (22.8%) |
| Single Unit, Attached | 2,044 (57.1%) | 1,537 (42.9%) |
| 2 Unit Apartments | 8 (0.8%) | 1,015 (99.2%) |
| 3 or 4 Unit Apartments | 79 (9.0%) | 798 (91.0%) |
| 5 to 9 Unit Apartments | 0 (0.0%) | 589 (100.0%) |
| 10 or more Apartments | 0 (0.0%) | 868 (100.0%) |
| Mobile Home / Other | 9 (100.0%) | 0 (0.0%) |
| Total | 4,957 (46.8%) | 5,637 (53.2%) |
Housing Structures by Number of Rooms in Lebanon
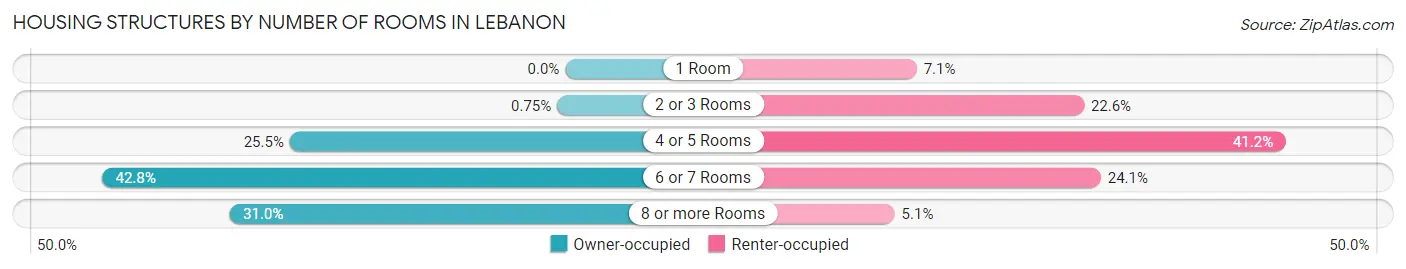
| Number of Rooms | Owner-occupied | Renter-occupied |
| 1 Room | 0 (0.0%) | 400 (7.1%) |
| 2 or 3 Rooms | 37 (0.7%) | 1,272 (22.6%) |
| 4 or 5 Rooms | 1,263 (25.5%) | 2,320 (41.2%) |
| 6 or 7 Rooms | 2,121 (42.8%) | 1,360 (24.1%) |
| 8 or more Rooms | 1,536 (31.0%) | 285 (5.1%) |
| Total | 4,957 (100.0%) | 5,637 (100.0%) |
Housing Structure by Heating Type in Lebanon
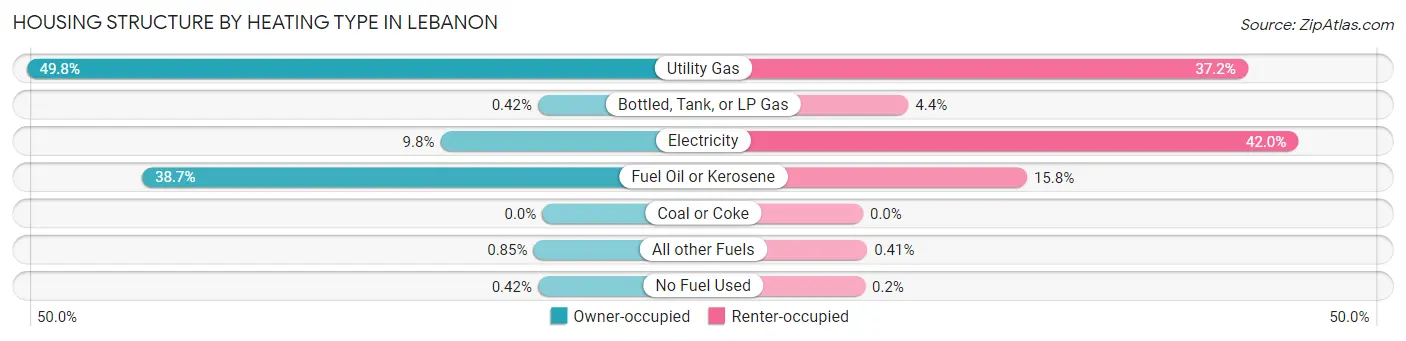
| Heating Type | Owner-occupied | Renter-occupied |
| Utility Gas | 2,469 (49.8%) | 2,094 (37.1%) |
| Bottled, Tank, or LP Gas | 21 (0.4%) | 247 (4.4%) |
| Electricity | 488 (9.8%) | 2,369 (42.0%) |
| Fuel Oil or Kerosene | 1,916 (38.7%) | 893 (15.8%) |
| Coal or Coke | 0 (0.0%) | 0 (0.0%) |
| All other Fuels | 42 (0.9%) | 23 (0.4%) |
| No Fuel Used | 21 (0.4%) | 11 (0.2%) |
| Total | 4,957 (100.0%) | 5,637 (100.0%) |
Household Vehicle Usage in Lebanon
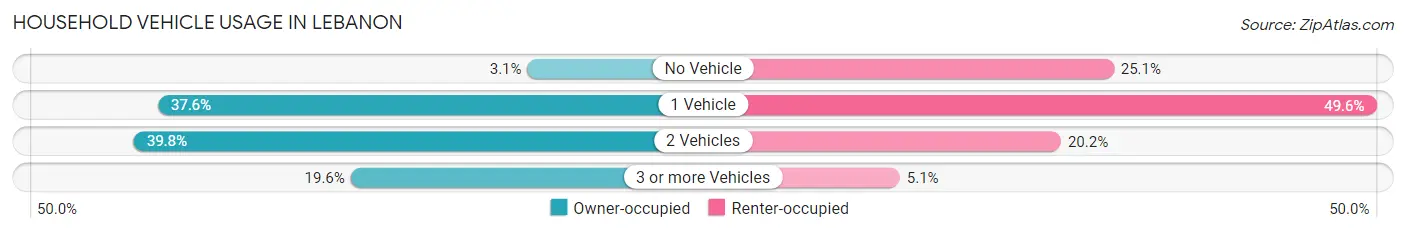
| Vehicles per Household | Owner-occupied | Renter-occupied |
| No Vehicle | 152 (3.1%) | 1,415 (25.1%) |
| 1 Vehicle | 1,862 (37.6%) | 2,796 (49.6%) |
| 2 Vehicles | 1,973 (39.8%) | 1,137 (20.2%) |
| 3 or more Vehicles | 970 (19.6%) | 289 (5.1%) |
| Total | 4,957 (100.0%) | 5,637 (100.0%) |
Real Estate & Mortgages in Lebanon
Real Estate and Mortgage Overview in Lebanon
| Characteristic | Without Mortgage | With Mortgage |
| Housing Units | 2,018 | 2,939 |
| Median Property Value | $124,200 | $126,600 |
| Median Household Income | $57,940 | $241 |
| Monthly Housing Costs | $489 | $0 |
| Real Estate Taxes | $2,011 | $65 |
Property Value by Mortgage Status in Lebanon
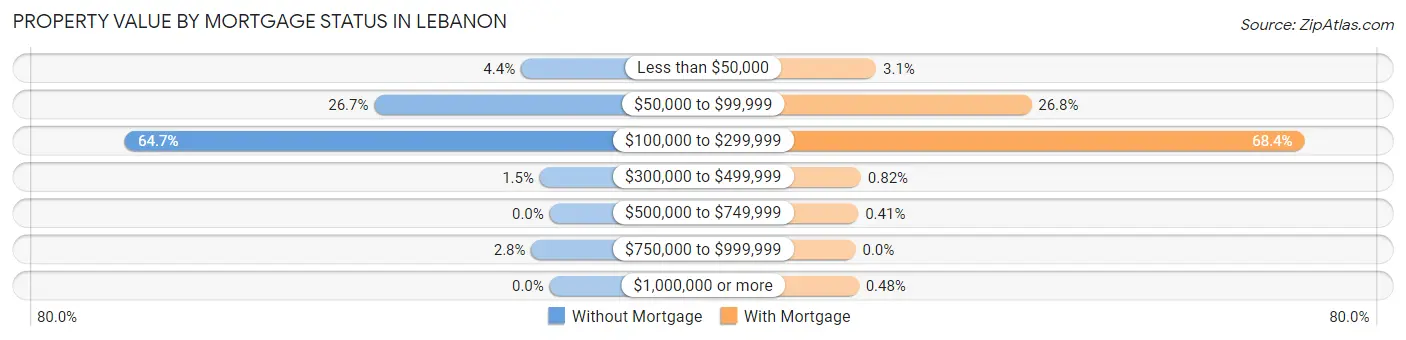
| Property Value | Without Mortgage | With Mortgage |
| Less than $50,000 | 88 (4.4%) | 92 (3.1%) |
| $50,000 to $99,999 | 539 (26.7%) | 787 (26.8%) |
| $100,000 to $299,999 | 1,305 (64.7%) | 2,010 (68.4%) |
| $300,000 to $499,999 | 30 (1.5%) | 24 (0.8%) |
| $500,000 to $749,999 | 0 (0.0%) | 12 (0.4%) |
| $750,000 to $999,999 | 56 (2.8%) | 0 (0.0%) |
| $1,000,000 or more | 0 (0.0%) | 14 (0.5%) |
| Total | 2,018 (100.0%) | 2,939 (100.0%) |
Household Income by Mortgage Status in Lebanon
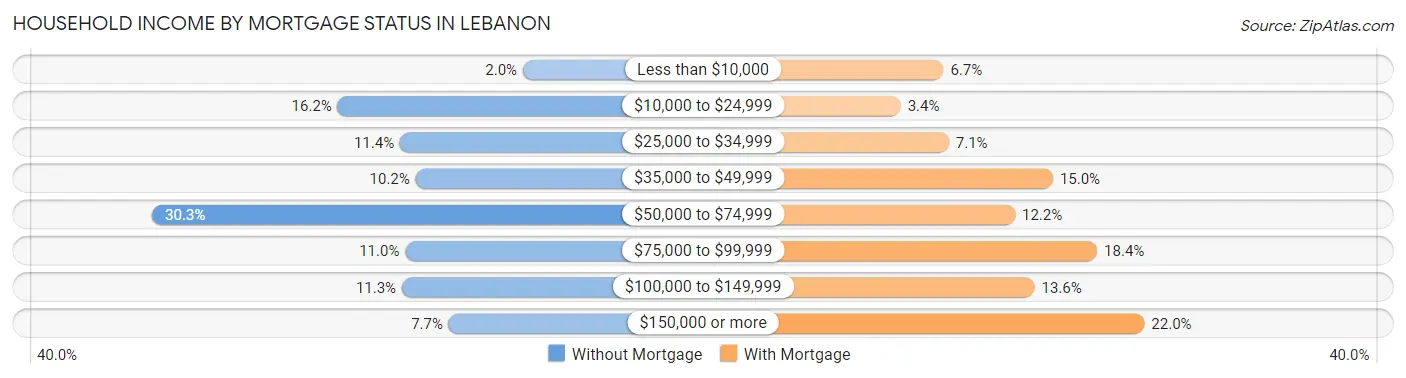
| Household Income | Without Mortgage | With Mortgage |
| Less than $10,000 | 41 (2.0%) | 197 (6.7%) |
| $10,000 to $24,999 | 326 (16.2%) | 101 (3.4%) |
| $25,000 to $34,999 | 230 (11.4%) | 209 (7.1%) |
| $35,000 to $49,999 | 206 (10.2%) | 442 (15.0%) |
| $50,000 to $74,999 | 611 (30.3%) | 357 (12.1%) |
| $75,000 to $99,999 | 222 (11.0%) | 541 (18.4%) |
| $100,000 to $149,999 | 227 (11.3%) | 401 (13.6%) |
| $150,000 or more | 155 (7.7%) | 647 (22.0%) |
| Total | 2,018 (100.0%) | 2,939 (100.0%) |
Property Value to Household Income Ratio in Lebanon
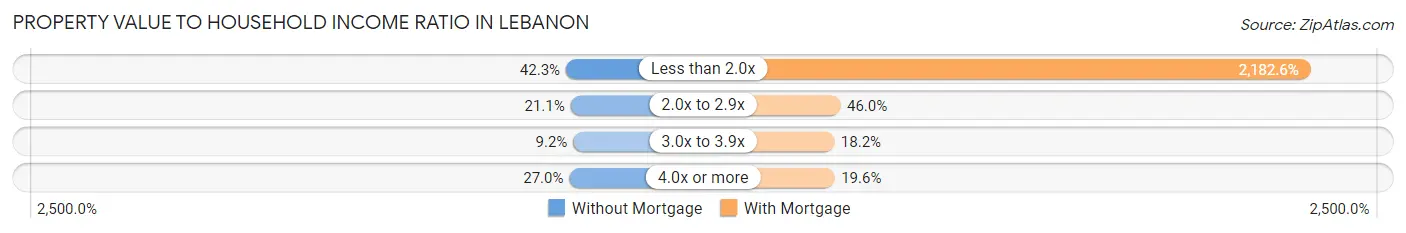
| Value-to-Income Ratio | Without Mortgage | With Mortgage |
| Less than 2.0x | 853 (42.3%) | 64,146 (2,182.6%) |
| 2.0x to 2.9x | 426 (21.1%) | 1,352 (46.0%) |
| 3.0x to 3.9x | 185 (9.2%) | 534 (18.2%) |
| 4.0x or more | 544 (27.0%) | 575 (19.6%) |
| Total | 2,018 (100.0%) | 2,939 (100.0%) |
Real Estate Taxes by Mortgage Status in Lebanon
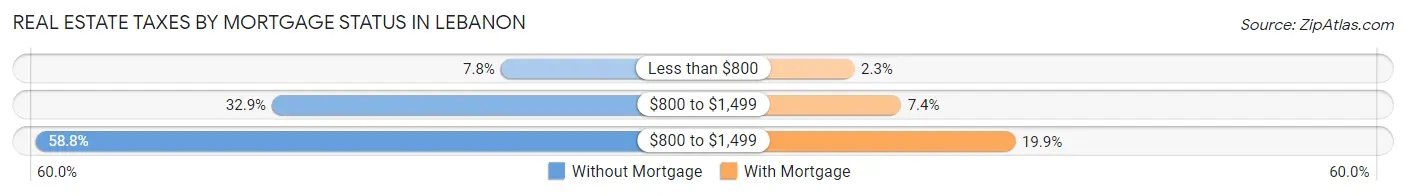
| Property Taxes | Without Mortgage | With Mortgage |
| Less than $800 | 158 (7.8%) | 68 (2.3%) |
| $800 to $1,499 | 664 (32.9%) | 218 (7.4%) |
| $800 to $1,499 | 1,187 (58.8%) | 586 (19.9%) |
| Total | 2,018 (100.0%) | 2,939 (100.0%) |
Health & Disability in Lebanon
Health Insurance Coverage by Age in Lebanon
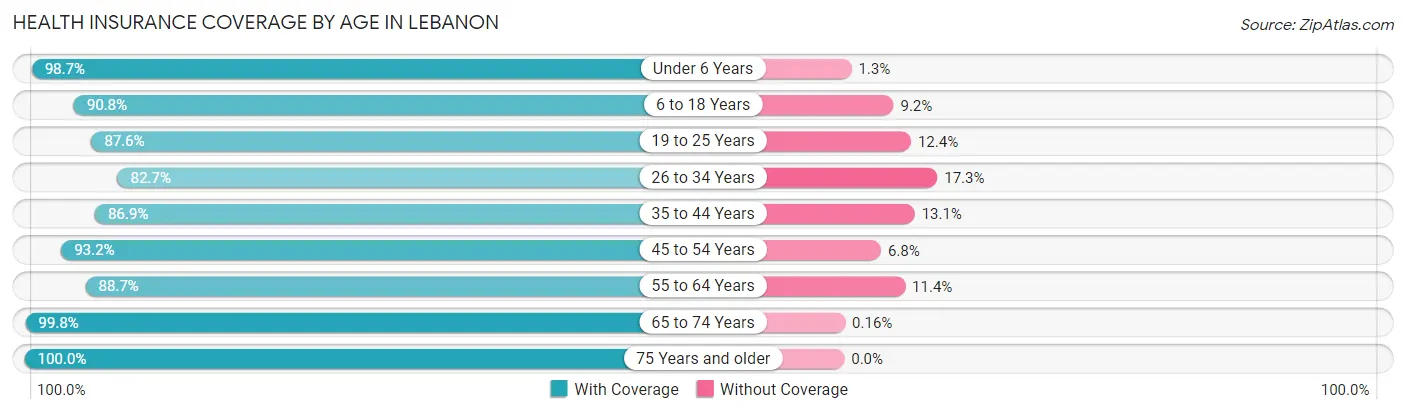
| Age Bracket | With Coverage | Without Coverage |
| Under 6 Years | 2,219 (98.7%) | 30 (1.3%) |
| 6 to 18 Years | 4,118 (90.8%) | 416 (9.2%) |
| 19 to 25 Years | 2,013 (87.6%) | 286 (12.4%) |
| 26 to 34 Years | 2,598 (82.7%) | 545 (17.3%) |
| 35 to 44 Years | 3,347 (86.9%) | 506 (13.1%) |
| 45 to 54 Years | 2,738 (93.2%) | 201 (6.8%) |
| 55 to 64 Years | 3,141 (88.6%) | 402 (11.4%) |
| 65 to 74 Years | 2,441 (99.8%) | 4 (0.2%) |
| 75 Years and older | 1,556 (100.0%) | 0 (0.0%) |
| Total | 24,171 (91.0%) | 2,390 (9.0%) |
Health Insurance Coverage by Citizenship Status in Lebanon
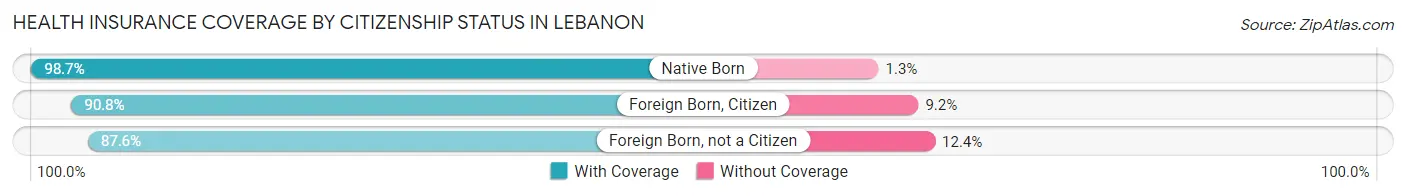
| Citizenship Status | With Coverage | Without Coverage |
| Native Born | 2,219 (98.7%) | 30 (1.3%) |
| Foreign Born, Citizen | 4,118 (90.8%) | 416 (9.2%) |
| Foreign Born, not a Citizen | 2,013 (87.6%) | 286 (12.4%) |
Health Insurance Coverage by Household Income in Lebanon
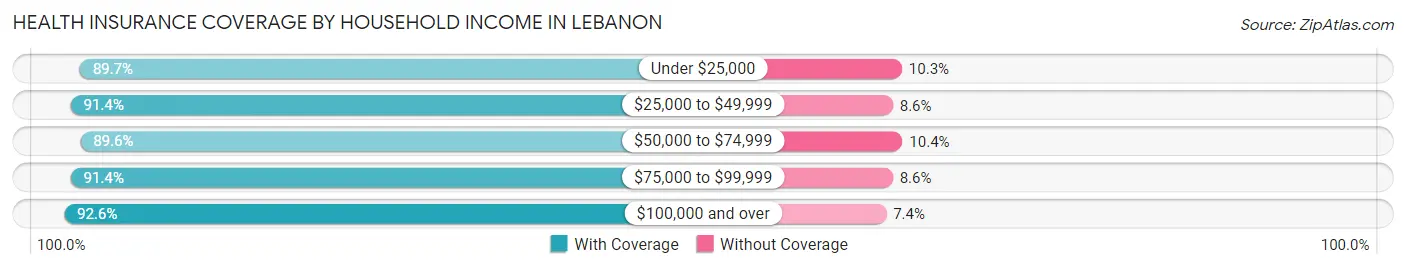
| Household Income | With Coverage | Without Coverage |
| Under $25,000 | 4,628 (89.7%) | 533 (10.3%) |
| $25,000 to $49,999 | 6,530 (91.4%) | 616 (8.6%) |
| $50,000 to $74,999 | 4,928 (89.6%) | 573 (10.4%) |
| $75,000 to $99,999 | 2,644 (91.4%) | 249 (8.6%) |
| $100,000 and over | 5,251 (92.6%) | 419 (7.4%) |
Public vs Private Health Insurance Coverage by Age in Lebanon
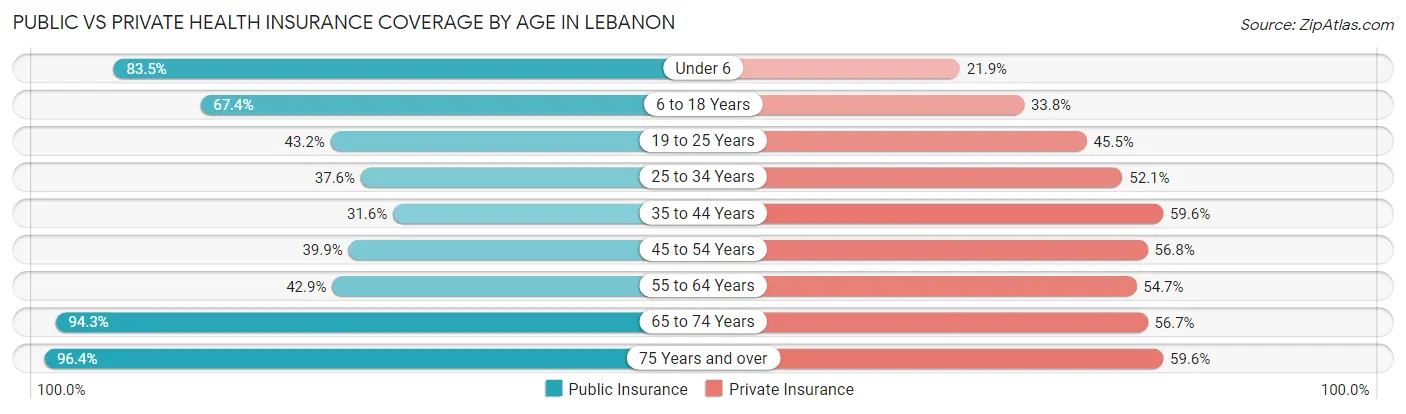
| Age Bracket | Public Insurance | Private Insurance |
| Under 6 | 1,878 (83.5%) | 493 (21.9%) |
| 6 to 18 Years | 3,055 (67.4%) | 1,533 (33.8%) |
| 19 to 25 Years | 993 (43.2%) | 1,045 (45.5%) |
| 25 to 34 Years | 1,181 (37.6%) | 1,637 (52.1%) |
| 35 to 44 Years | 1,218 (31.6%) | 2,297 (59.6%) |
| 45 to 54 Years | 1,172 (39.9%) | 1,668 (56.8%) |
| 55 to 64 Years | 1,520 (42.9%) | 1,937 (54.7%) |
| 65 to 74 Years | 2,305 (94.3%) | 1,387 (56.7%) |
| 75 Years and over | 1,500 (96.4%) | 928 (59.6%) |
| Total | 14,822 (55.8%) | 12,925 (48.7%) |
Disability Status by Sex by Age in Lebanon
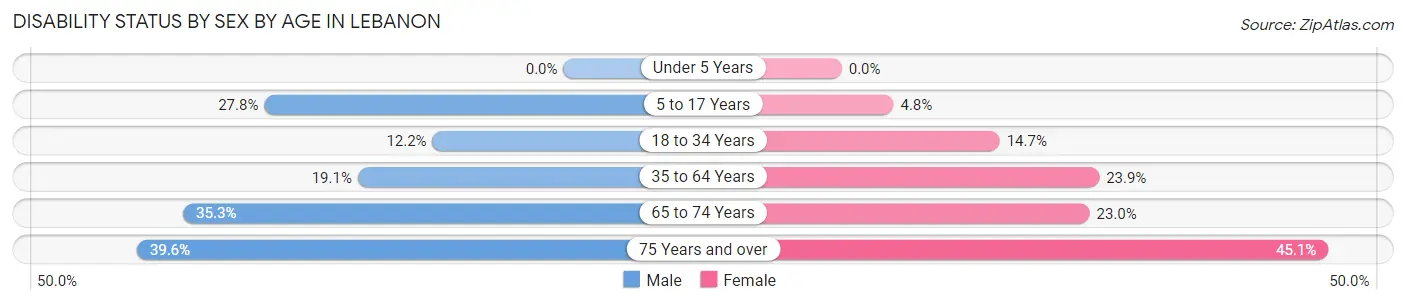
| Age Bracket | Male | Female |
| Under 5 Years | 0 (0.0%) | 0 (0.0%) |
| 5 to 17 Years | 636 (27.8%) | 103 (4.8%) |
| 18 to 34 Years | 360 (12.1%) | 422 (14.7%) |
| 35 to 64 Years | 984 (19.1%) | 1,237 (23.9%) |
| 65 to 74 Years | 381 (35.3%) | 314 (23.0%) |
| 75 Years and over | 245 (39.6%) | 423 (45.1%) |
Disability Class by Sex by Age in Lebanon
Disability Class: Hearing Difficulty
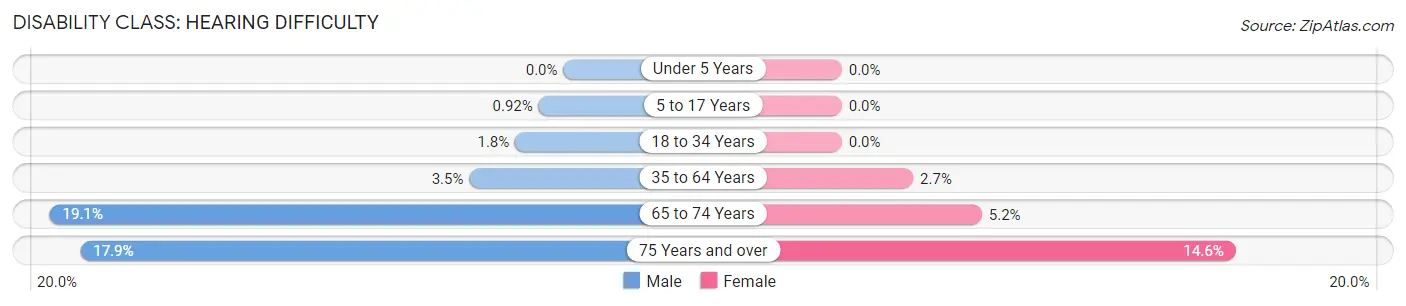
| Age Bracket | Male | Female |
| Under 5 Years | 0 (0.0%) | 0 (0.0%) |
| 5 to 17 Years | 21 (0.9%) | 0 (0.0%) |
| 18 to 34 Years | 53 (1.8%) | 0 (0.0%) |
| 35 to 64 Years | 180 (3.5%) | 137 (2.6%) |
| 65 to 74 Years | 206 (19.1%) | 71 (5.2%) |
| 75 Years and over | 111 (17.9%) | 137 (14.6%) |
Disability Class: Vision Difficulty
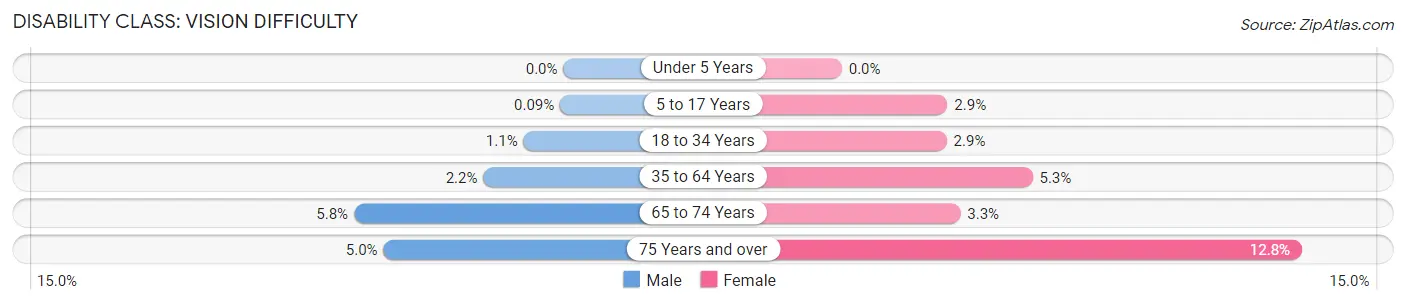
| Age Bracket | Male | Female |
| Under 5 Years | 0 (0.0%) | 0 (0.0%) |
| 5 to 17 Years | 2 (0.1%) | 63 (2.9%) |
| 18 to 34 Years | 33 (1.1%) | 84 (2.9%) |
| 35 to 64 Years | 115 (2.2%) | 275 (5.3%) |
| 65 to 74 Years | 63 (5.8%) | 45 (3.3%) |
| 75 Years and over | 31 (5.0%) | 120 (12.8%) |
Disability Class: Cognitive Difficulty
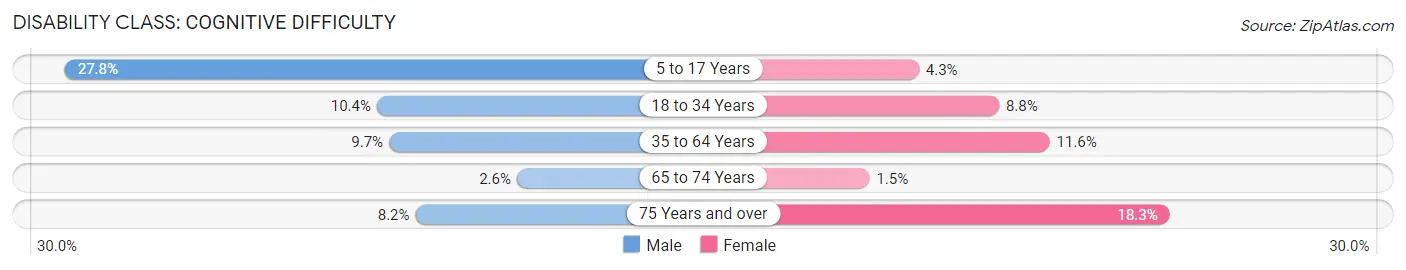
| Age Bracket | Male | Female |
| 5 to 17 Years | 636 (27.8%) | 92 (4.3%) |
| 18 to 34 Years | 308 (10.4%) | 252 (8.7%) |
| 35 to 64 Years | 501 (9.7%) | 599 (11.6%) |
| 65 to 74 Years | 28 (2.6%) | 21 (1.5%) |
| 75 Years and over | 51 (8.2%) | 171 (18.2%) |
Disability Class: Ambulatory Difficulty
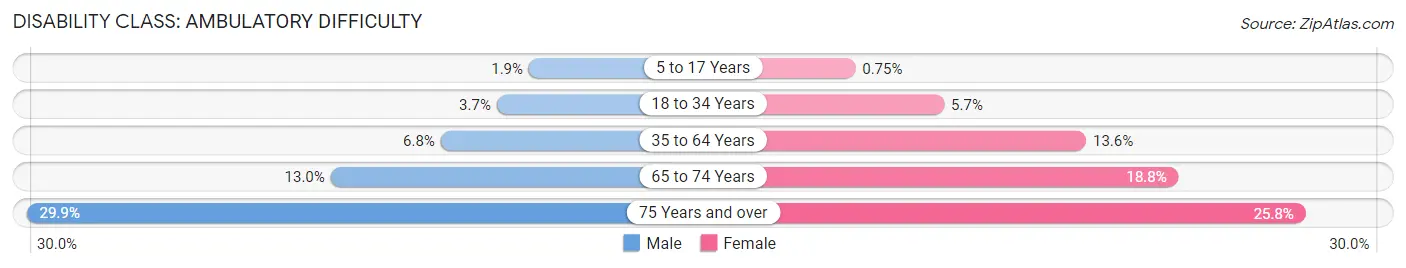
| Age Bracket | Male | Female |
| 5 to 17 Years | 44 (1.9%) | 16 (0.7%) |
| 18 to 34 Years | 110 (3.7%) | 164 (5.7%) |
| 35 to 64 Years | 352 (6.8%) | 704 (13.6%) |
| 65 to 74 Years | 140 (13.0%) | 256 (18.8%) |
| 75 Years and over | 185 (29.9%) | 242 (25.8%) |
Disability Class: Self-Care Difficulty
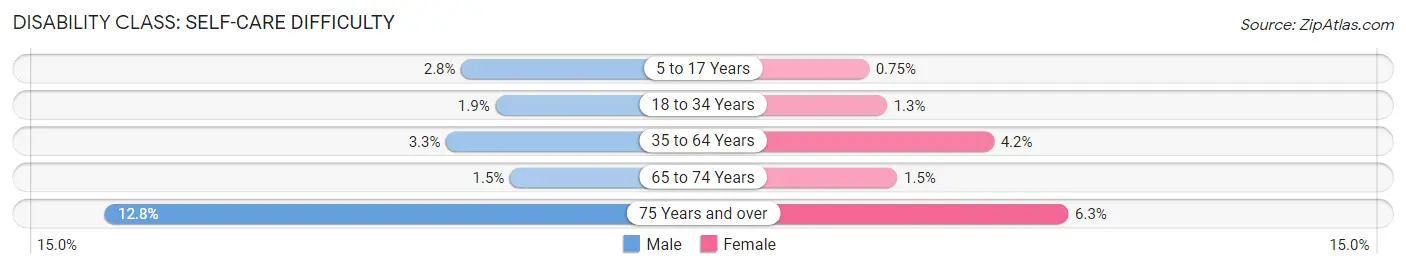
| Age Bracket | Male | Female |
| 5 to 17 Years | 65 (2.8%) | 16 (0.7%) |
| 18 to 34 Years | 56 (1.9%) | 36 (1.3%) |
| 35 to 64 Years | 168 (3.3%) | 219 (4.2%) |
| 65 to 74 Years | 16 (1.5%) | 21 (1.5%) |
| 75 Years and over | 79 (12.8%) | 59 (6.3%) |
Technology Access in Lebanon
Computing Device Access in Lebanon
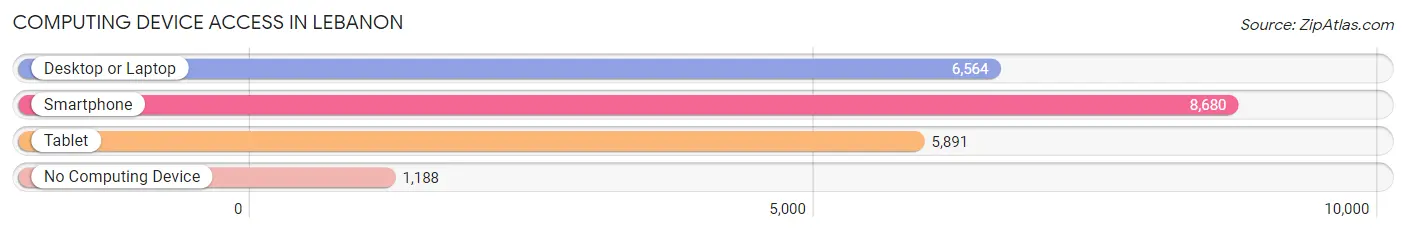
| Device Type | # Households | % Households |
| Desktop or Laptop | 6,564 | 62.0% |
| Smartphone | 8,680 | 81.9% |
| Tablet | 5,891 | 55.6% |
| No Computing Device | 1,188 | 11.2% |
| Total | 10,594 | 100.0% |
Internet Access in Lebanon
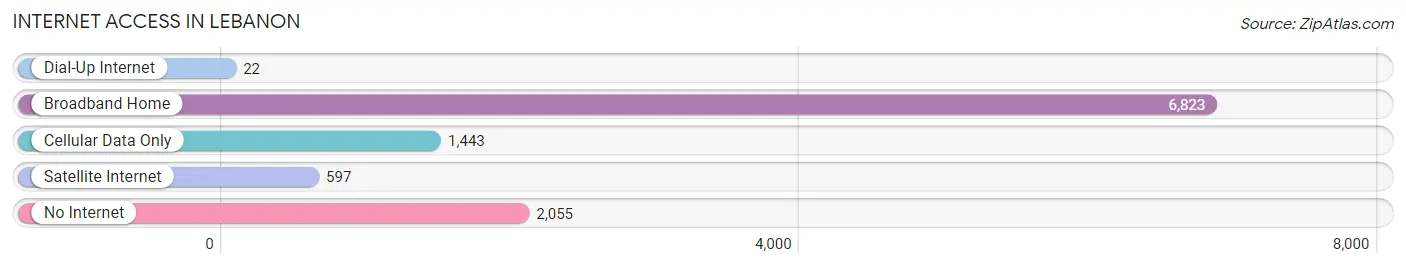
| Internet Type | # Households | % Households |
| Dial-Up Internet | 22 | 0.2% |
| Broadband Home | 6,823 | 64.4% |
| Cellular Data Only | 1,443 | 13.6% |
| Satellite Internet | 597 | 5.6% |
| No Internet | 2,055 | 19.4% |
| Total | 10,594 | 100.0% |
Lebanon Summary
Lebanon, Pennsylvania is a city located in Lebanon County, Pennsylvania, United States. It is the county seat of Lebanon County and is located in the heart of the Lebanon Valley, a region of rolling hills and rich farmland. The city is situated in the center of the county, along the Swatara Creek, and is home to a population of approximately 25,000 people.
History
The area that is now Lebanon, Pennsylvania was first settled in 1723 by a group of German immigrants led by Johann Thomas Schrack. The settlers named the area Schrackstown, after their leader, and the area quickly grew into a thriving agricultural community. In 1740, the area was officially incorporated as the Borough of Lebanon, and in 1885, it was reincorporated as a city.
Throughout its history, Lebanon has been an important center of commerce and industry. In the 19th century, the city was home to several large manufacturing companies, including the Lebanon Car Works, which produced railroad cars, and the Lebanon Valley Iron Works, which produced iron products. In the 20th century, the city was home to several large food processing companies, including the Hershey Chocolate Company and the Lebanon Bologna Company.
Geography
Lebanon is located in the center of Lebanon County, in the heart of the Lebanon Valley. The city is situated along the Swatara Creek, and is surrounded by rolling hills and rich farmland. The city is located approximately 25 miles east of Harrisburg, the state capital, and approximately 90 miles west of Philadelphia.
The climate in Lebanon is typical of the Mid-Atlantic region, with hot, humid summers and cold, snowy winters. The average annual temperature is around 50 degrees Fahrenheit, and the average annual precipitation is around 40 inches.
Economy
Lebanon’s economy is largely based on agriculture and manufacturing. The city is home to several large food processing companies, including the Hershey Chocolate Company and the Lebanon Bologna Company. The city is also home to several large manufacturing companies, including the Lebanon Car Works and the Lebanon Valley Iron Works.
In addition to these industries, Lebanon is home to several large retail stores, including Walmart, Target, and Lowe’s. The city is also home to several medical facilities, including the Good Samaritan Hospital and the Lebanon VA Medical Center.
Demographics
As of the 2010 census, the population of Lebanon was 25,477. The racial makeup of the city was 87.3% White, 8.2% African American, 0.5% Native American, 0.7% Asian, 0.1% Pacific Islander, and 2.2% from other races. The median household income was $37,837, and the median family income was $45,945.
The city is home to several religious denominations, including Roman Catholic, Lutheran, Methodist, and Presbyterian. The city is also home to several educational institutions, including Lebanon Valley College and the Lebanon County Career and Technology Center.
Common Questions
What is Per Capita Income in Lebanon?
Per Capita income in Lebanon is $24,306.
What is the Median Family Income in Lebanon?
Median Family Income in Lebanon is $47,454.
What is the Median Household income in Lebanon?
Median Household Income in Lebanon is $47,160.
What is Income or Wage Gap in Lebanon?
Income or Wage Gap in Lebanon is 25.0%.
Women in Lebanon earn 75.0 cents for every dollar earned by a man.
What is Family Income Deficit in Lebanon?
Family Income Deficit in Lebanon is $9,784.
Families that are below poverty line in Lebanon earn $9,784 less on average than the poverty threshold level.
What is Inequality or Gini Index in Lebanon?
Inequality or Gini Index in Lebanon is 0.44.
What is the Total Population of Lebanon?
Total Population of Lebanon is 26,679.
What is the Total Male Population of Lebanon?
Total Male Population of Lebanon is 13,193.
What is the Total Female Population of Lebanon?
Total Female Population of Lebanon is 13,486.
What is the Ratio of Males per 100 Females in Lebanon?
There are 97.83 Males per 100 Females in Lebanon.
What is the Ratio of Females per 100 Males in Lebanon?
There are 102.22 Females per 100 Males in Lebanon.
What is the Median Population Age in Lebanon?
Median Population Age in Lebanon is 38.5 Years.
What is the Average Family Size in Lebanon
Average Family Size in Lebanon is 3.2 People.
What is the Average Household Size in Lebanon
Average Household Size in Lebanon is 2.5 People.
How Large is the Labor Force in Lebanon?
There are 12,847 People in the Labor Forcein in Lebanon.
What is the Percentage of People in the Labor Force in Lebanon?
61.1% of People are in the Labor Force in Lebanon.
What is the Unemployment Rate in Lebanon?
Unemployment Rate in Lebanon is 10.0%.