Carlin, NV Map & Demographics
Carlin Map
Carlin Overview
$31,916
PER CAPITA INCOME
$95,652
AVG FAMILY INCOME
$68,207
AVG HOUSEHOLD INCOME
15.6%
WAGE / INCOME GAP [ % ]
84.4¢/ $1
WAGE / INCOME GAP [ $ ]
0.31
INEQUALITY / GINI INDEX
2,366
TOTAL POPULATION
1,198
MALE POPULATION
1,168
FEMALE POPULATION
102.57
MALES / 100 FEMALES
97.50
FEMALES / 100 MALES
36.3
MEDIAN AGE
2.9
AVG FAMILY SIZE
2.6
AVG HOUSEHOLD SIZE
1,248
LABOR FORCE [ PEOPLE ]
65.6%
PERCENT IN LABOR FORCE
5.0%
UNEMPLOYMENT RATE
Carlin Zip Codes
Carlin Area Codes
Income in Carlin
Income Overview in Carlin
Per Capita Income in Carlin is $31,916, while median incomes of families and households are $95,652 and $68,207 respectively.
| Characteristic | Number | Measure |
| Per Capita Income | 2,366 | $31,916 |
| Median Family Income | 544 | $95,652 |
| Mean Family Income | 544 | $93,986 |
| Median Household Income | 841 | $68,207 |
| Mean Household Income | 841 | $77,663 |
| Income Deficit | 544 | $0 |
| Wage / Income Gap (%) | 2,366 | 15.64% |
| Wage / Income Gap ($) | 2,366 | 84.36¢ per $1 |
| Gini / Inequality Index | 2,366 | 0.31 |
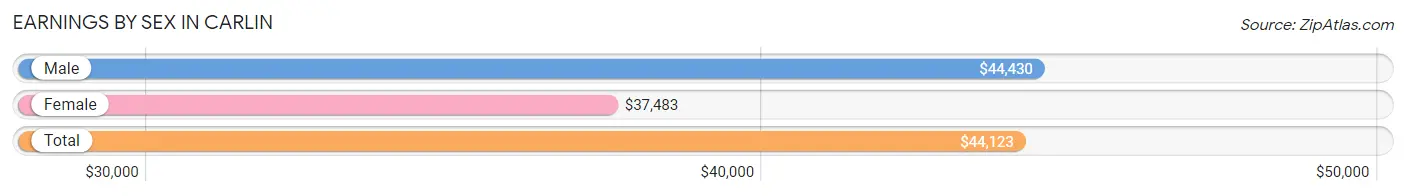
Earnings by Sex in Carlin
Average Earnings in Carlin are $44,123, $44,430 for men and $37,483 for women, a difference of 15.6%.
| Sex | Number | Average Earnings |
| Male | 780 (59.0%) | $44,430 |
| Female | 543 (41.0%) | $37,483 |
| Total | 1,323 (100.0%) | $44,123 |
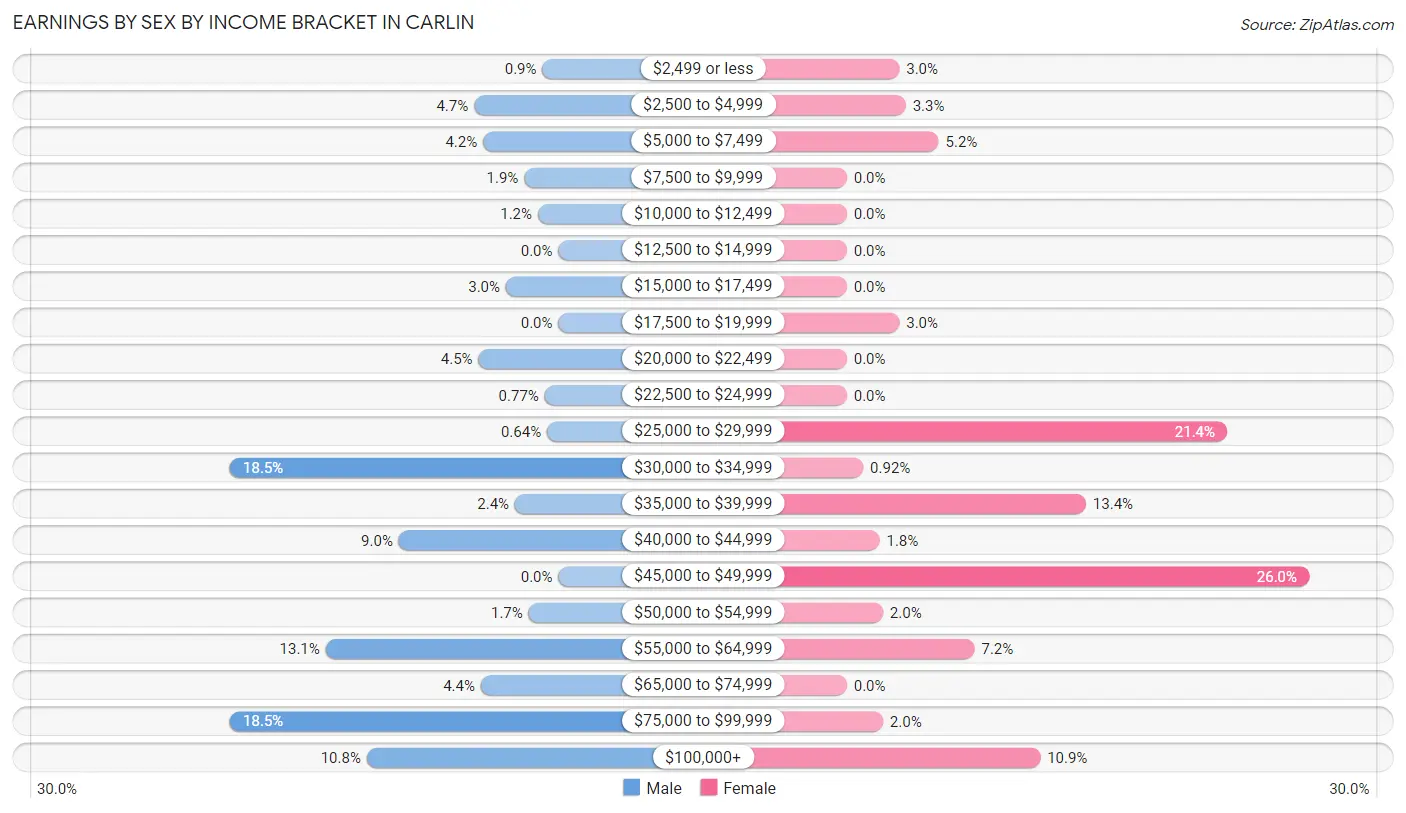
Earnings by Sex by Income Bracket in Carlin
The most common earnings brackets in Carlin are $30,000 to $34,999 for men (144 | 18.5%) and $45,000 to $49,999 for women (141 | 26.0%).
| Income | Male | Female |
| $2,499 or less | 7 (0.9%) | 16 (2.9%) |
| $2,500 to $4,999 | 37 (4.7%) | 18 (3.3%) |
| $5,000 to $7,499 | 33 (4.2%) | 28 (5.2%) |
| $7,500 to $9,999 | 15 (1.9%) | 0 (0.0%) |
| $10,000 to $12,499 | 9 (1.1%) | 0 (0.0%) |
| $12,500 to $14,999 | 0 (0.0%) | 0 (0.0%) |
| $15,000 to $17,499 | 23 (2.9%) | 0 (0.0%) |
| $17,500 to $19,999 | 0 (0.0%) | 16 (2.9%) |
| $20,000 to $22,499 | 35 (4.5%) | 0 (0.0%) |
| $22,500 to $24,999 | 6 (0.8%) | 0 (0.0%) |
| $25,000 to $29,999 | 5 (0.6%) | 116 (21.4%) |
| $30,000 to $34,999 | 144 (18.5%) | 5 (0.9%) |
| $35,000 to $39,999 | 19 (2.4%) | 73 (13.4%) |
| $40,000 to $44,999 | 70 (9.0%) | 10 (1.8%) |
| $45,000 to $49,999 | 0 (0.0%) | 141 (26.0%) |
| $50,000 to $54,999 | 13 (1.7%) | 11 (2.0%) |
| $55,000 to $64,999 | 102 (13.1%) | 39 (7.2%) |
| $65,000 to $74,999 | 34 (4.4%) | 0 (0.0%) |
| $75,000 to $99,999 | 144 (18.5%) | 11 (2.0%) |
| $100,000+ | 84 (10.8%) | 59 (10.9%) |
| Total | 780 (100.0%) | 543 (100.0%) |
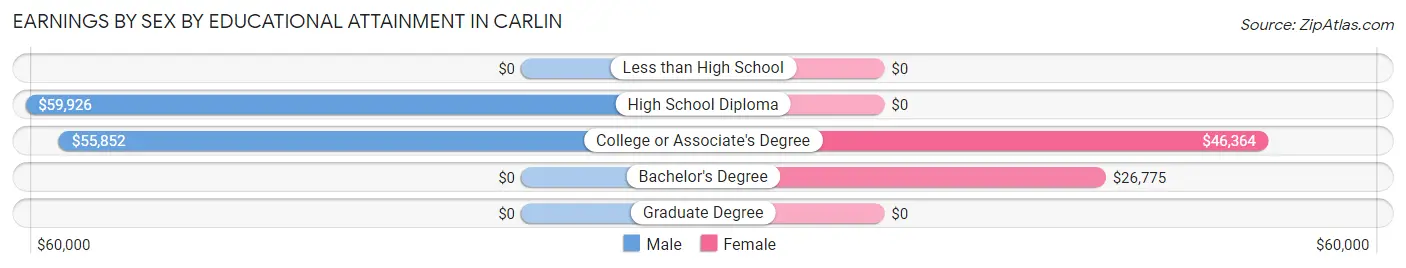
Earnings by Sex by Educational Attainment in Carlin
Average earnings in Carlin are $59,044 for men and $45,662 for women, a difference of 22.7%. Men with an educational attainment of high school diploma enjoy the highest average annual earnings of $59,926, while those with college or associate's degree education earn the least with $55,852. Women with an educational attainment of college or associate's degree earn the most with the average annual earnings of $46,364, while those with bachelor's degree education have the smallest earnings of $26,775.
| Educational Attainment | Male Income | Female Income |
| Less than High School | - | - |
| High School Diploma | $59,926 | $0 |
| College or Associate's Degree | $55,852 | $46,364 |
| Bachelor's Degree | - | - |
| Graduate Degree | - | - |
| Total | $59,044 | $45,662 |
Family Income in Carlin
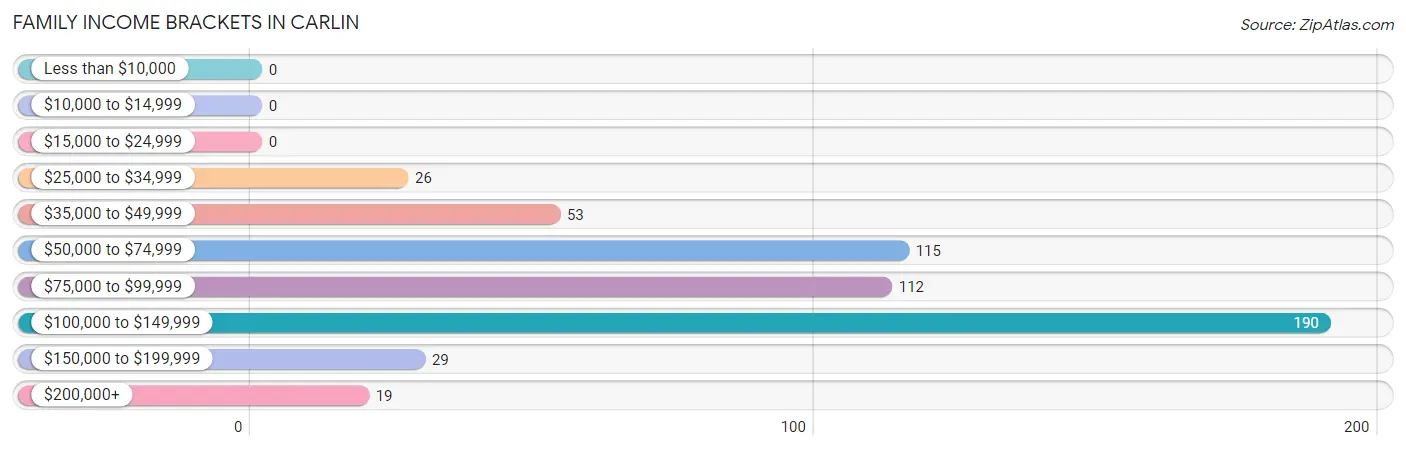
Family Income Brackets in Carlin
According to the Carlin family income data, there are 190 families falling into the $100,000 to $149,999 income range, which is the most common income bracket and makes up 34.9% of all families.
| Income Bracket | # Families | % Families |
| Less than $10,000 | 0 | 0.0% |
| $10,000 to $14,999 | 0 | 0.0% |
| $15,000 to $24,999 | 0 | 0.0% |
| $25,000 to $34,999 | 26 | 4.8% |
| $35,000 to $49,999 | 53 | 9.7% |
| $50,000 to $74,999 | 115 | 21.1% |
| $75,000 to $99,999 | 112 | 20.6% |
| $100,000 to $149,999 | 190 | 34.9% |
| $150,000 to $199,999 | 29 | 5.3% |
| $200,000+ | 19 | 3.5% |
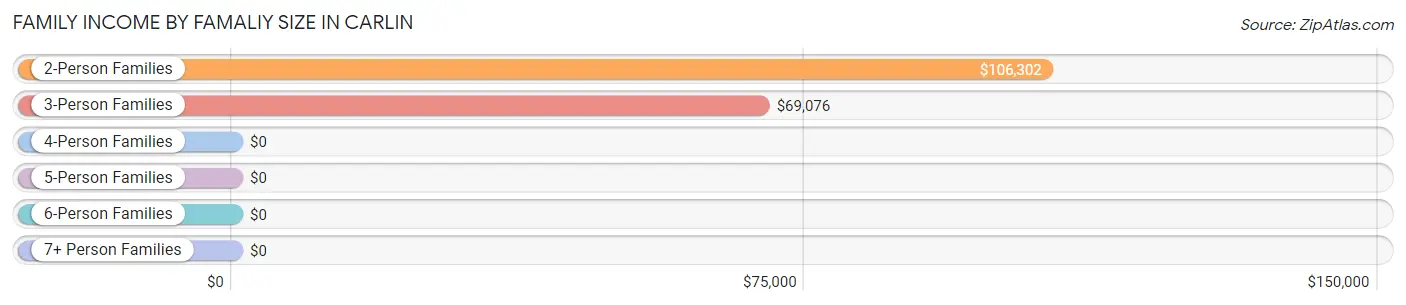
Family Income by Famaliy Size in Carlin
2-person families (275 | 50.5%) account for the highest median family income in Carlin with $106,302 per family, while 2-person families (275 | 50.5%) have the highest median income of $53,151 per family member.
| Income Bracket | # Families | Median Income |
| 2-Person Families | 275 (50.5%) | $106,302 |
| 3-Person Families | 149 (27.4%) | $69,076 |
| 4-Person Families | 101 (18.6%) | $0 |
| 5-Person Families | 0 (0.0%) | $0 |
| 6-Person Families | 0 (0.0%) | $0 |
| 7+ Person Families | 19 (3.5%) | $0 |
| Total | 544 (100.0%) | $95,652 |
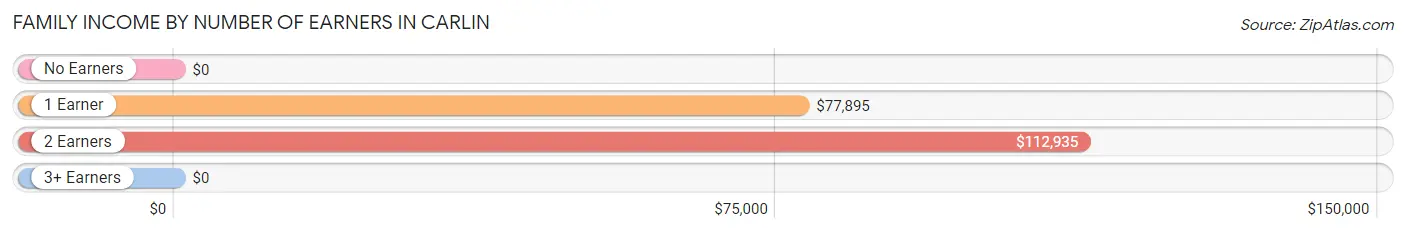
Family Income by Number of Earners in Carlin
| Number of Earners | # Families | Median Income |
| No Earners | 33 (6.1%) | $0 |
| 1 Earner | 234 (43.0%) | $77,895 |
| 2 Earners | 246 (45.2%) | $112,935 |
| 3+ Earners | 31 (5.7%) | $0 |
| Total | 544 (100.0%) | $95,652 |
Household Income in Carlin
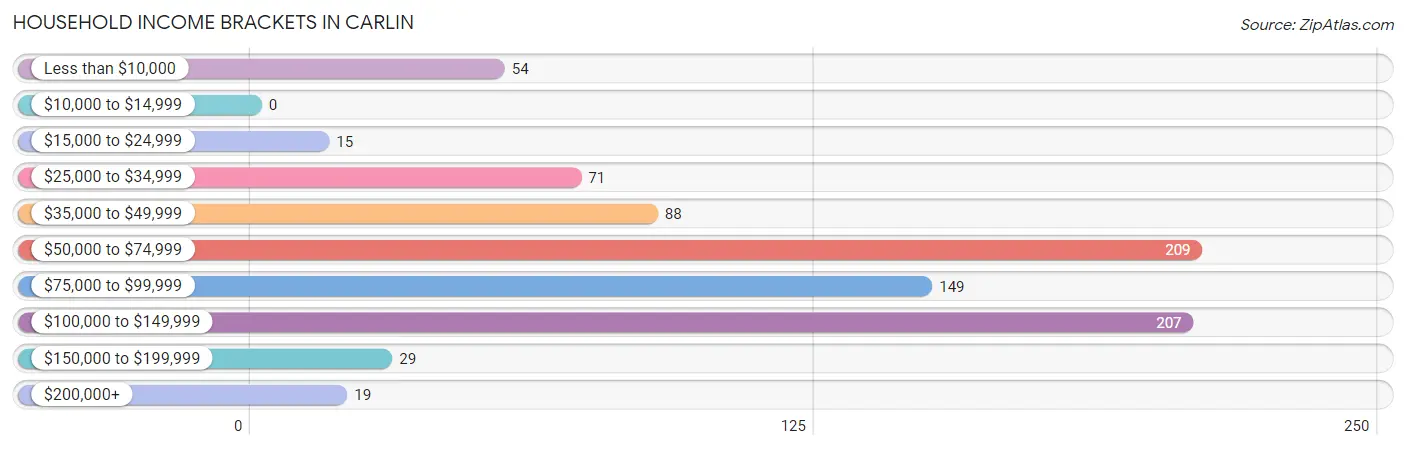
Household Income Brackets in Carlin
With 209 households falling in the category, the $50,000 to $74,999 income range is the most frequent in Carlin, accounting for 24.8% of all households.
| Income Bracket | # Households | % Households |
| Less than $10,000 | 54 | 6.4% |
| $10,000 to $14,999 | 0 | 0.0% |
| $15,000 to $24,999 | 15 | 1.8% |
| $25,000 to $34,999 | 71 | 8.4% |
| $35,000 to $49,999 | 88 | 10.5% |
| $50,000 to $74,999 | 209 | 24.9% |
| $75,000 to $99,999 | 149 | 17.7% |
| $100,000 to $149,999 | 207 | 24.6% |
| $150,000 to $199,999 | 29 | 3.4% |
| $200,000+ | 19 | 2.3% |
Household Income by Householder Age in Carlin
The median household income in Carlin is $68,207, with the highest median household income of $95,491 found in the 25 to 44 years age bracket for the primary householder. A total of 276 households (32.8%) fall into this category. Meanwhile, the 45 to 64 years age bracket for the primary householder has the lowest median household income of $0, with 270 households (32.1%) in this group.
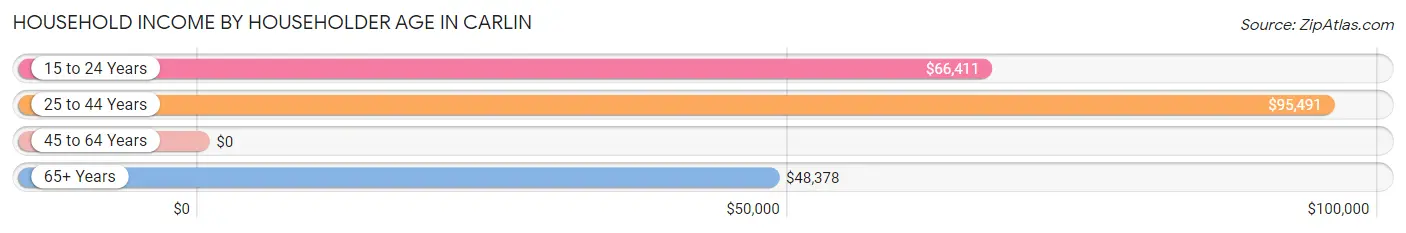
| Income Bracket | # Households | Median Income |
| 15 to 24 Years | 91 (10.8%) | $66,411 |
| 25 to 44 Years | 276 (32.8%) | $95,491 |
| 45 to 64 Years | 270 (32.1%) | $0 |
| 65+ Years | 204 (24.3%) | $48,378 |
| Total | 841 (100.0%) | $68,207 |
Poverty in Carlin
Income Below Poverty by Sex and Age in Carlin
With 6.3% poverty level for males and 5.4% for females among the residents of Carlin, 16 and 17 year old males and 65 to 74 year old females are the most vulnerable to poverty, with 2 males (100.0%) and 31 females (24.8%) in their respective age groups living below the poverty level.
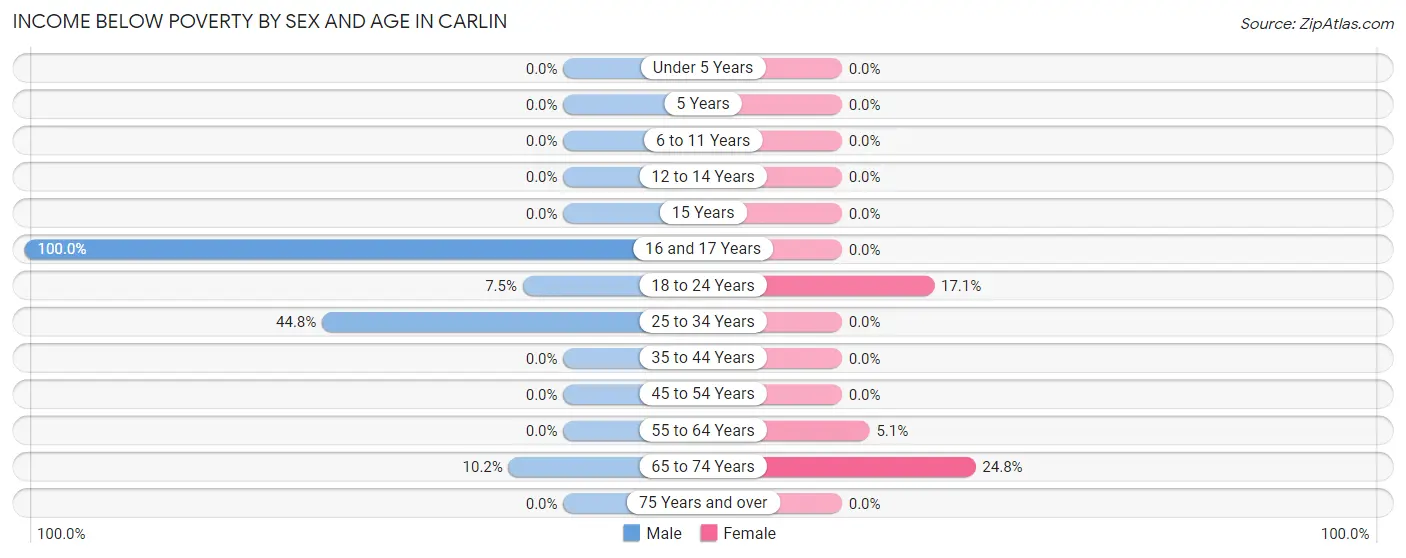
| Age Bracket | Male | Female |
| Under 5 Years | 0 (0.0%) | 0 (0.0%) |
| 5 Years | 0 (0.0%) | 0 (0.0%) |
| 6 to 11 Years | 0 (0.0%) | 0 (0.0%) |
| 12 to 14 Years | 0 (0.0%) | 0 (0.0%) |
| 15 Years | 0 (0.0%) | 0 (0.0%) |
| 16 and 17 Years | 2 (100.0%) | 0 (0.0%) |
| 18 to 24 Years | 17 (7.5%) | 19 (17.1%) |
| 25 to 34 Years | 30 (44.8%) | 0 (0.0%) |
| 35 to 44 Years | 0 (0.0%) | 0 (0.0%) |
| 45 to 54 Years | 0 (0.0%) | 0 (0.0%) |
| 55 to 64 Years | 0 (0.0%) | 10 (5.1%) |
| 65 to 74 Years | 13 (10.2%) | 31 (24.8%) |
| 75 Years and over | 0 (0.0%) | 0 (0.0%) |
| Total | 62 (6.3%) | 60 (5.4%) |
Income Above Poverty by Sex and Age in Carlin
According to the poverty statistics in Carlin, males aged under 5 years and females aged under 5 years are the age groups that are most secure financially, with 100.0% of males and 100.0% of females in these age groups living above the poverty line.
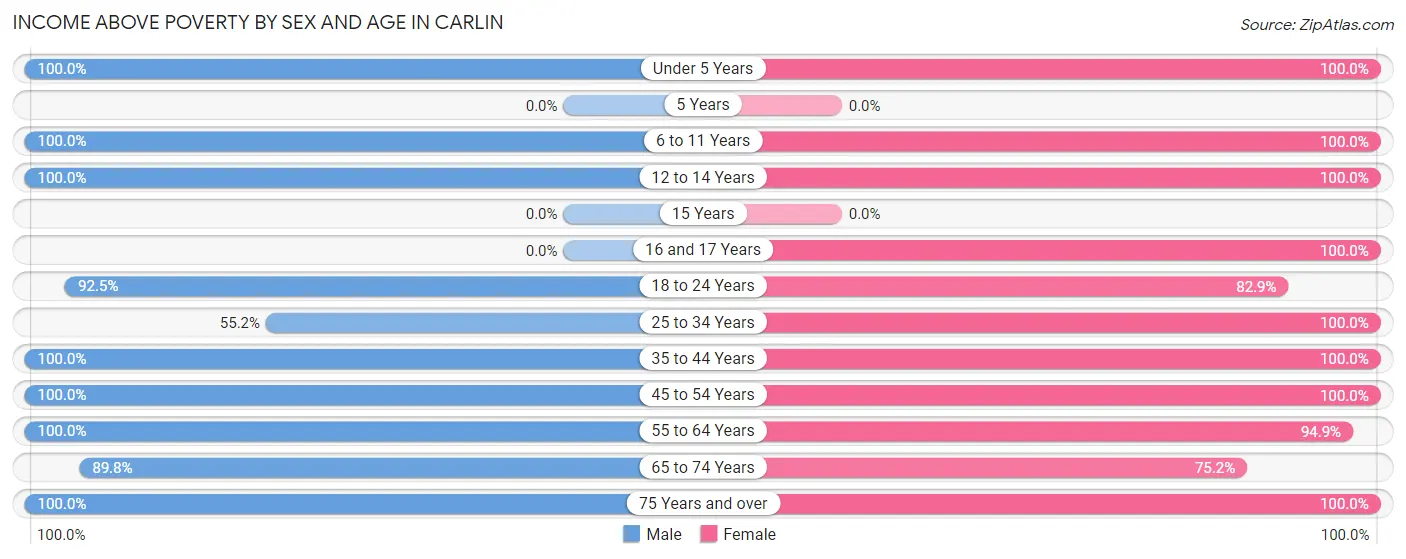
| Age Bracket | Male | Female |
| Under 5 Years | 62 (100.0%) | 27 (100.0%) |
| 5 Years | 0 (0.0%) | 0 (0.0%) |
| 6 to 11 Years | 83 (100.0%) | 84 (100.0%) |
| 12 to 14 Years | 22 (100.0%) | 54 (100.0%) |
| 15 Years | 0 (0.0%) | 0 (0.0%) |
| 16 and 17 Years | 0 (0.0%) | 45 (100.0%) |
| 18 to 24 Years | 209 (92.5%) | 92 (82.9%) |
| 25 to 34 Years | 37 (55.2%) | 177 (100.0%) |
| 35 to 44 Years | 118 (100.0%) | 178 (100.0%) |
| 45 to 54 Years | 190 (100.0%) | 88 (100.0%) |
| 55 to 64 Years | 73 (100.0%) | 185 (94.9%) |
| 65 to 74 Years | 115 (89.8%) | 94 (75.2%) |
| 75 Years and over | 20 (100.0%) | 27 (100.0%) |
| Total | 929 (93.7%) | 1,051 (94.6%) |
Income Below Poverty Among Married-Couple Families in Carlin
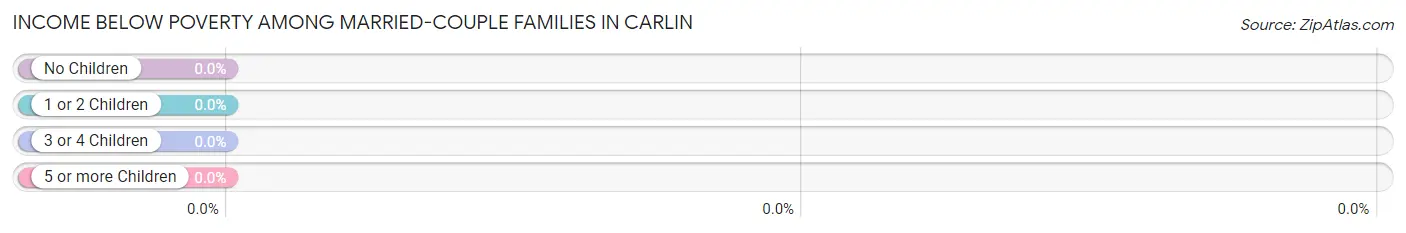
| Children | Above Poverty | Below Poverty |
| No Children | 271 (100.0%) | 0 (0.0%) |
| 1 or 2 Children | 174 (100.0%) | 0 (0.0%) |
| 3 or 4 Children | 0 (0.0%) | 0 (0.0%) |
| 5 or more Children | 19 (100.0%) | 0 (0.0%) |
| Total | 464 (100.0%) | 0 (0.0%) |
Income Below Poverty Among Single-Parent Households in Carlin
| Children | Single Father | Single Mother |
| No Children | 0 (0.0%) | 0 (0.0%) |
| 1 or 2 Children | 0 (0.0%) | 0 (0.0%) |
| 3 or 4 Children | 0 (0.0%) | 0 (0.0%) |
| 5 or more Children | 0 (0.0%) | 0 (0.0%) |
| Total | 0 (0.0%) | 0 (0.0%) |
Income Below Poverty Among Married-Couple vs Single-Parent Households in Carlin
| Children | Married-Couple Families | Single-Parent Households |
| No Children | 0 (0.0%) | 0 (0.0%) |
| 1 or 2 Children | 0 (0.0%) | 0 (0.0%) |
| 3 or 4 Children | 0 (0.0%) | 0 (0.0%) |
| 5 or more Children | 0 (0.0%) | 0 (0.0%) |
| Total | 0 (0.0%) | 0 (0.0%) |
Race in Carlin
The most populous races in Carlin are White / Caucasian (1,413 | 59.7%), Hispanic or Latino (670 | 28.3%), and Two or more Races (617 | 26.1%).
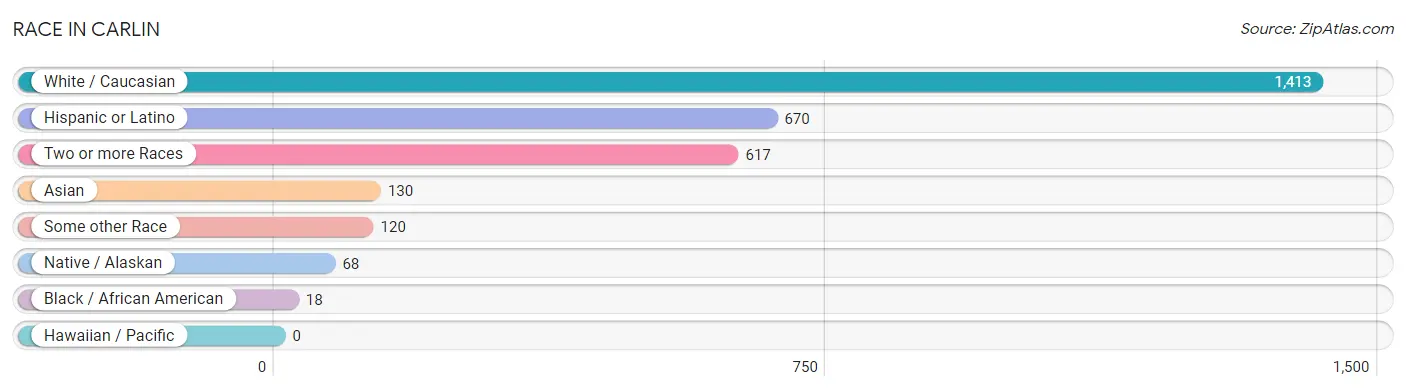
| Race | # Population | % Population |
| Asian | 130 | 5.5% |
| Black / African American | 18 | 0.8% |
| Hawaiian / Pacific | 0 | 0.0% |
| Hispanic or Latino | 670 | 28.3% |
| Native / Alaskan | 68 | 2.9% |
| White / Caucasian | 1,413 | 59.7% |
| Two or more Races | 617 | 26.1% |
| Some other Race | 120 | 5.1% |
| Total | 2,366 | 100.0% |
Ancestry in Carlin
The most populous ancestries reported in Carlin are Mexican (363 | 15.3%), European (267 | 11.3%), Irish (248 | 10.5%), English (243 | 10.3%), and Spanish (219 | 9.3%), together accounting for 56.6% of all Carlin residents.
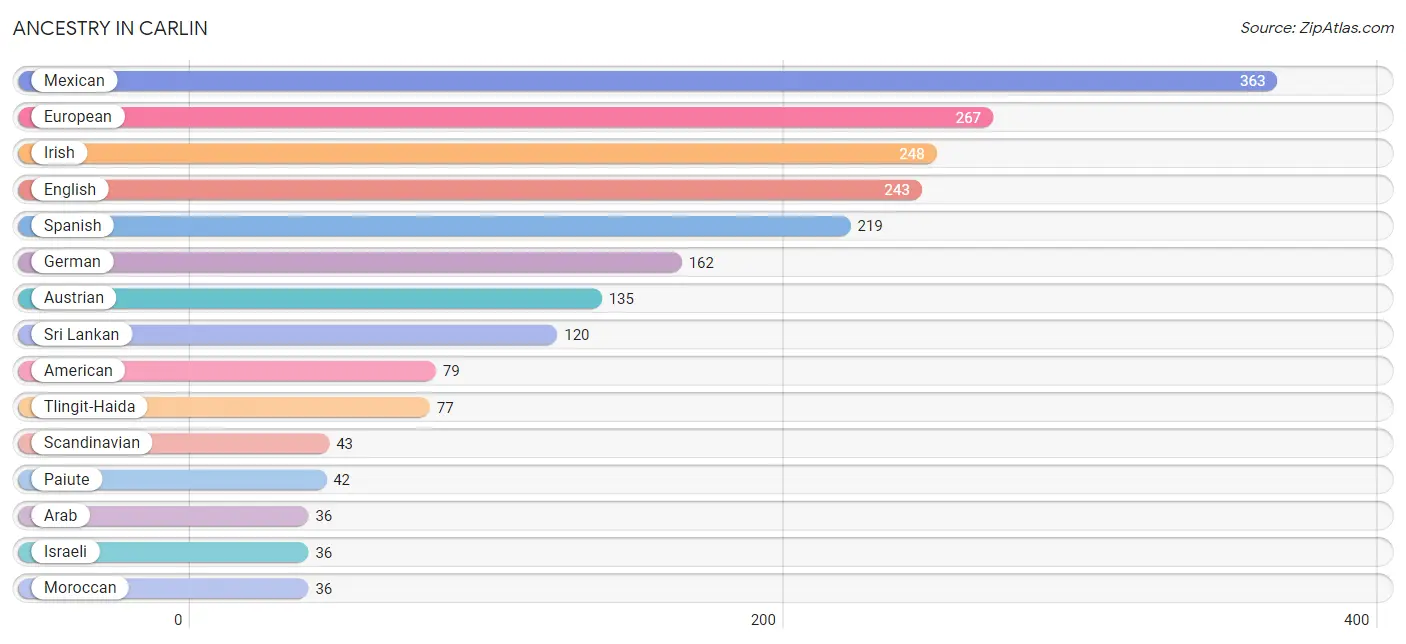
| Ancestry | # Population | % Population |
| African | 2 | 0.1% |
| American | 79 | 3.3% |
| Arab | 36 | 1.5% |
| Austrian | 135 | 5.7% |
| Bhutanese | 10 | 0.4% |
| Blackfeet | 11 | 0.5% |
| Canadian | 1 | 0.0% |
| Cherokee | 22 | 0.9% |
| Colombian | 3 | 0.1% |
| Czech | 15 | 0.6% |
| Danish | 11 | 0.5% |
| English | 243 | 10.3% |
| European | 267 | 11.3% |
| French | 21 | 0.9% |
| German | 162 | 6.9% |
| Hungarian | 11 | 0.5% |
| Irish | 248 | 10.5% |
| Iroquois | 3 | 0.1% |
| Israeli | 36 | 1.5% |
| Italian | 34 | 1.4% |
| Jamaican | 3 | 0.1% |
| Korean | 26 | 1.1% |
| Mexican | 363 | 15.3% |
| Moroccan | 36 | 1.5% |
| Norwegian | 35 | 1.5% |
| Paiute | 42 | 1.8% |
| Peruvian | 30 | 1.3% |
| Scandinavian | 43 | 1.8% |
| South American | 33 | 1.4% |
| Spanish | 219 | 9.3% |
| Sri Lankan | 120 | 5.1% |
| Subsaharan African | 2 | 0.1% |
| Swiss | 3 | 0.1% |
| Tlingit-Haida | 77 | 3.3% | View All 34 Rows |
Immigrants in Carlin
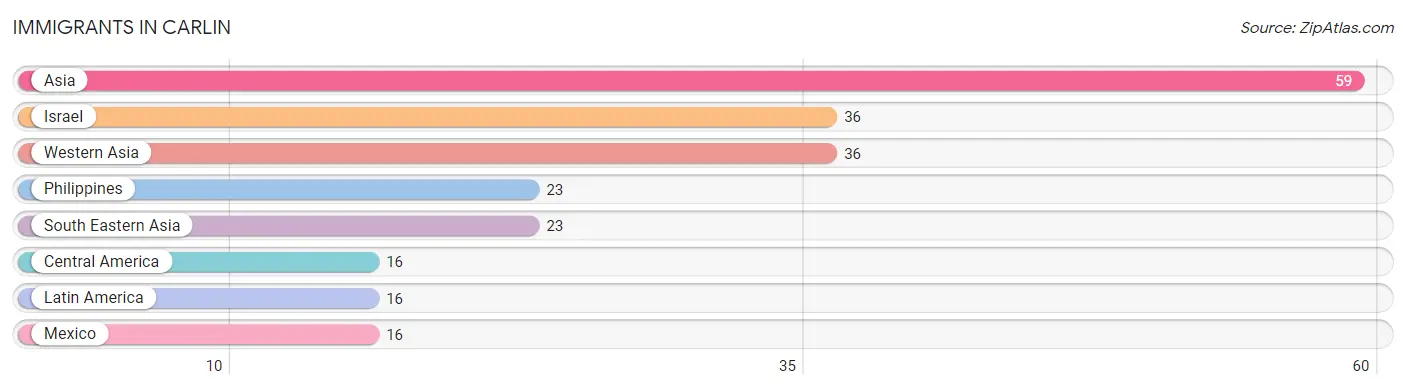
The most numerous immigrant groups reported in Carlin came from Asia (59 | 2.5%), Israel (36 | 1.5%), Western Asia (36 | 1.5%), Philippines (23 | 1.0%), and South Eastern Asia (23 | 1.0%), together accounting for 7.5% of all Carlin residents.
| Immigration Origin | # Population | % Population |
| Asia | 59 | 2.5% |
| Central America | 16 | 0.7% |
| Israel | 36 | 1.5% |
| Latin America | 16 | 0.7% |
| Mexico | 16 | 0.7% |
| Philippines | 23 | 1.0% |
| South Eastern Asia | 23 | 1.0% |
| Western Asia | 36 | 1.5% | View All 8 Rows |
Sex and Age in Carlin
Sex and Age in Carlin
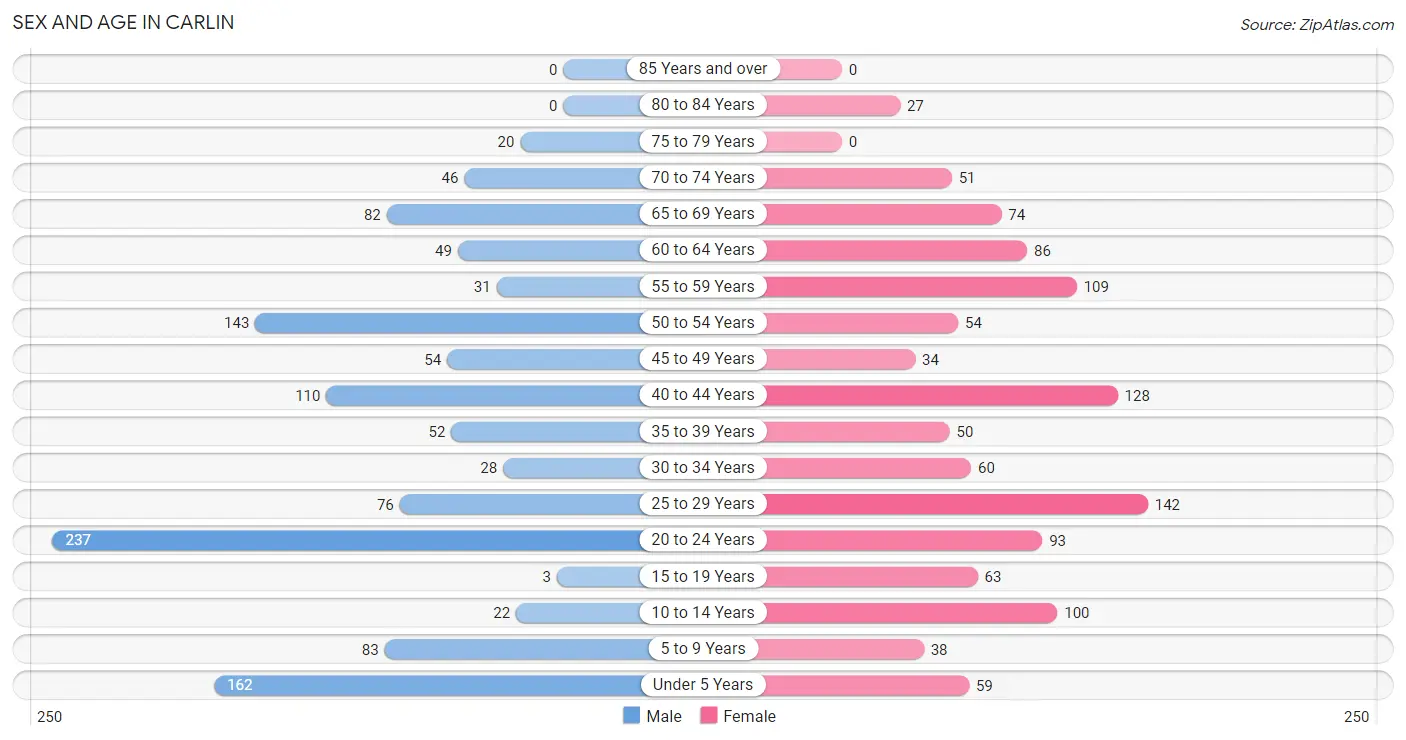
The most populous age groups in Carlin are 20 to 24 Years (237 | 19.8%) for men and 25 to 29 Years (142 | 12.2%) for women.
| Age Bracket | Male | Female |
| Under 5 Years | 162 (13.5%) | 59 (5.1%) |
| 5 to 9 Years | 83 (6.9%) | 38 (3.3%) |
| 10 to 14 Years | 22 (1.8%) | 100 (8.6%) |
| 15 to 19 Years | 3 (0.3%) | 63 (5.4%) |
| 20 to 24 Years | 237 (19.8%) | 93 (8.0%) |
| 25 to 29 Years | 76 (6.3%) | 142 (12.2%) |
| 30 to 34 Years | 28 (2.3%) | 60 (5.1%) |
| 35 to 39 Years | 52 (4.3%) | 50 (4.3%) |
| 40 to 44 Years | 110 (9.2%) | 128 (11.0%) |
| 45 to 49 Years | 54 (4.5%) | 34 (2.9%) |
| 50 to 54 Years | 143 (11.9%) | 54 (4.6%) |
| 55 to 59 Years | 31 (2.6%) | 109 (9.3%) |
| 60 to 64 Years | 49 (4.1%) | 86 (7.4%) |
| 65 to 69 Years | 82 (6.8%) | 74 (6.3%) |
| 70 to 74 Years | 46 (3.8%) | 51 (4.4%) |
| 75 to 79 Years | 20 (1.7%) | 0 (0.0%) |
| 80 to 84 Years | 0 (0.0%) | 27 (2.3%) |
| 85 Years and over | 0 (0.0%) | 0 (0.0%) |
| Total | 1,198 (100.0%) | 1,168 (100.0%) |
Families and Households in Carlin
Median Family Size in Carlin
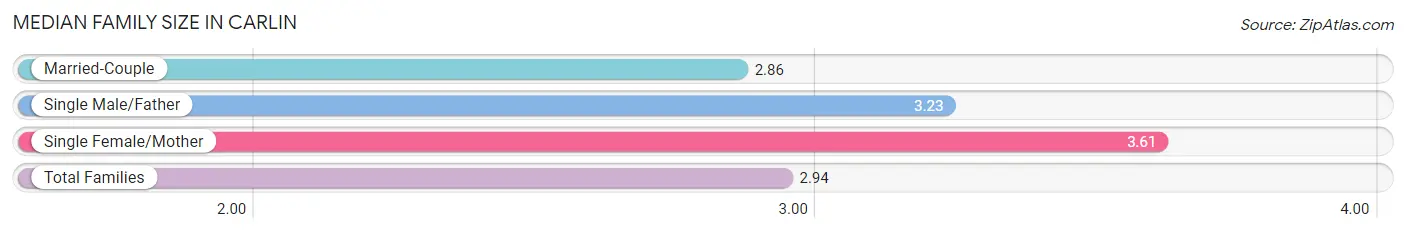
The median family size in Carlin is 2.94 persons per family, with single female/mother families (36 | 6.6%) accounting for the largest median family size of 3.61 persons per family. On the other hand, married-couple families (464 | 85.3%) represent the smallest median family size with 2.86 persons per family.
| Family Type | # Families | Family Size |
| Married-Couple | 464 (85.3%) | 2.86 |
| Single Male/Father | 44 (8.1%) | 3.23 |
| Single Female/Mother | 36 (6.6%) | 3.61 |
| Total Families | 544 (100.0%) | 2.94 |
Median Household Size in Carlin
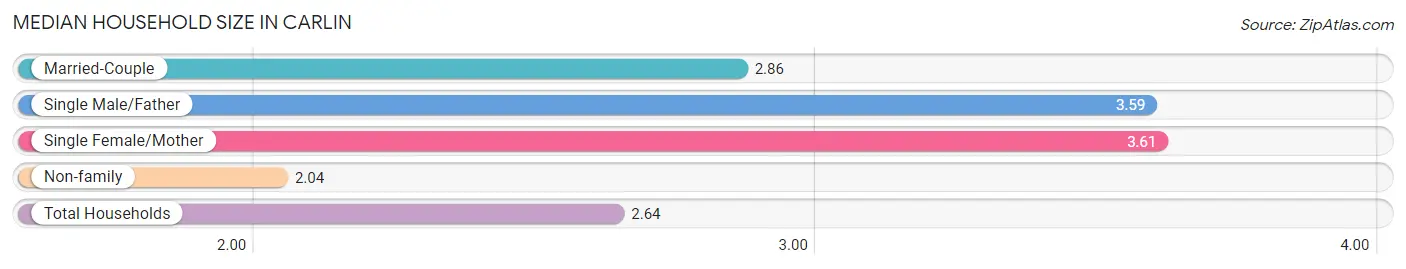
The median household size in Carlin is 2.64 persons per household, with single female/mother households (36 | 4.3%) accounting for the largest median household size of 3.61 persons per household. non-family households (297 | 35.3%) represent the smallest median household size with 2.04 persons per household.
| Household Type | # Households | Household Size |
| Married-Couple | 464 (55.2%) | 2.86 |
| Single Male/Father | 44 (5.2%) | 3.59 |
| Single Female/Mother | 36 (4.3%) | 3.61 |
| Non-family | 297 (35.3%) | 2.04 |
| Total Households | 841 (100.0%) | 2.64 |
Household Size by Marriage Status in Carlin
Out of a total of 841 households in Carlin, 544 (64.7%) are family households, while 297 (35.3%) are nonfamily households. The most numerous type of family households are 2-person households, comprising 262, and the most common type of nonfamily households are 1-person households, comprising 239.
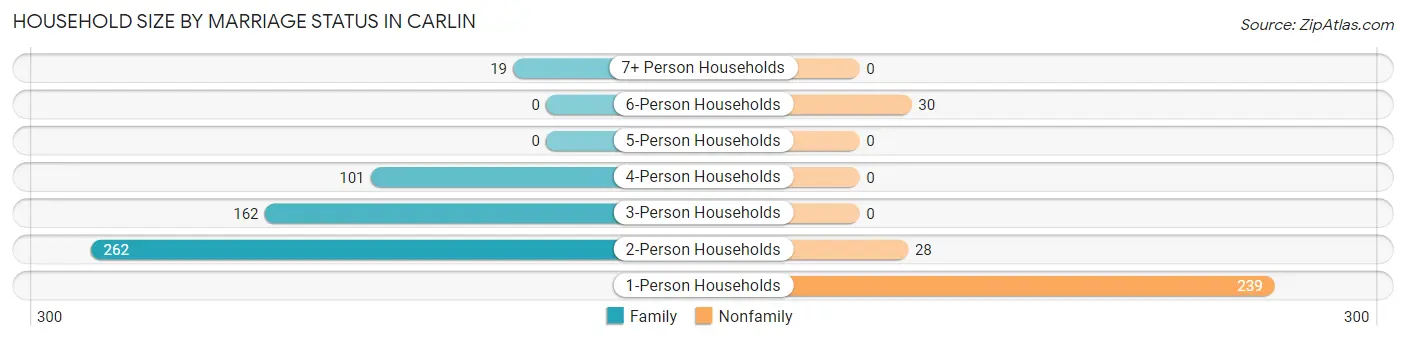
| Household Size | Family Households | Nonfamily Households |
| 1-Person Households | - | 239 (28.4%) |
| 2-Person Households | 262 (31.1%) | 28 (3.3%) |
| 3-Person Households | 162 (19.3%) | 0 (0.0%) |
| 4-Person Households | 101 (12.0%) | 0 (0.0%) |
| 5-Person Households | 0 (0.0%) | 0 (0.0%) |
| 6-Person Households | 0 (0.0%) | 30 (3.6%) |
| 7+ Person Households | 19 (2.3%) | 0 (0.0%) |
| Total | 544 (64.7%) | 297 (35.3%) |
Female Fertility in Carlin
Fertility by Age in Carlin
Average fertility rate in Carlin is 75.0 births per 1,000 women. Women in the age bracket of 20 to 34 years have the highest fertility rate with 153.0 births per 1,000 women. Women in the age bracket of 20 to 34 years acount for 100.0% of all women with births.
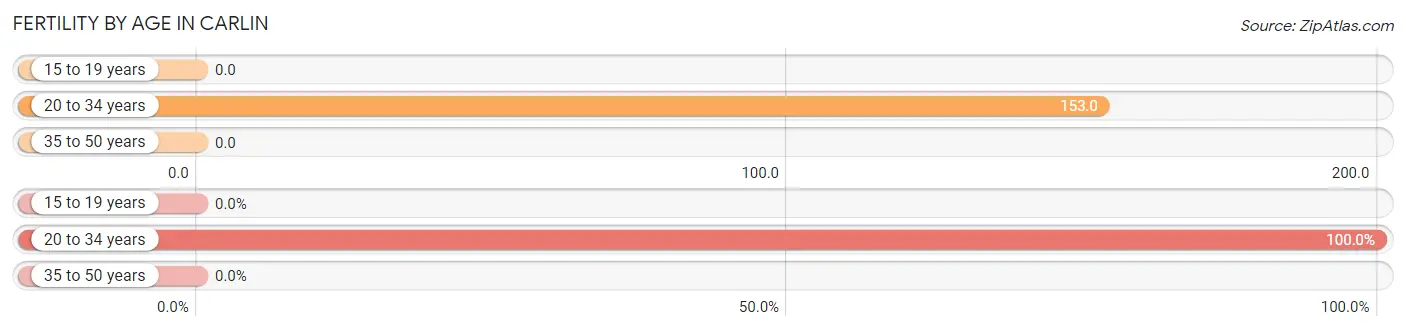
| Age Bracket | Women with Births | Births / 1,000 Women |
| 15 to 19 years | 0 (0.0%) | 0.0 |
| 20 to 34 years | 45 (100.0%) | 153.0 |
| 35 to 50 years | 0 (0.0%) | 0.0 |
| Total | 45 (100.0%) | 75.0 |
Fertility by Age by Marriage Status in Carlin
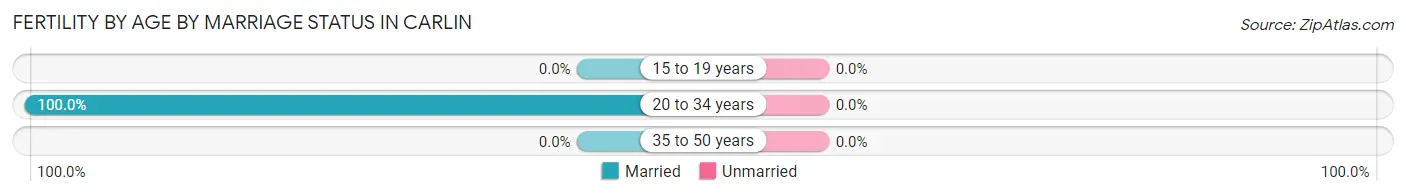
| Age Bracket | Married | Unmarried |
| 15 to 19 years | 0 (0.0%) | 0 (0.0%) |
| 20 to 34 years | 45 (100.0%) | 0 (0.0%) |
| 35 to 50 years | 0 (0.0%) | 0 (0.0%) |
| Total | 45 (100.0%) | 0 (0.0%) |
Fertility by Education in Carlin
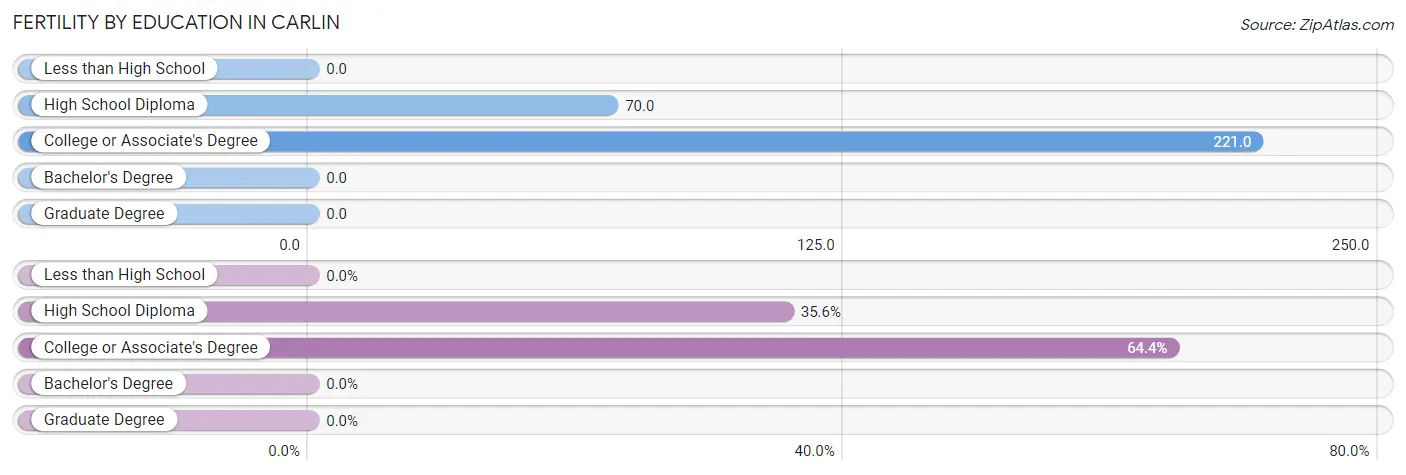
| Educational Attainment | Women with Births | Births / 1,000 Women |
| Less than High School | 0 (0.0%) | 0.0 |
| High School Diploma | 16 (35.6%) | 70.0 |
| College or Associate's Degree | 29 (64.4%) | 221.0 |
| Bachelor's Degree | 0 (0.0%) | 0.0 |
| Graduate Degree | 0 (0.0%) | 0.0 |
| Total | 45 (100.0%) | 75.0 |
Fertility by Education by Marriage Status in Carlin
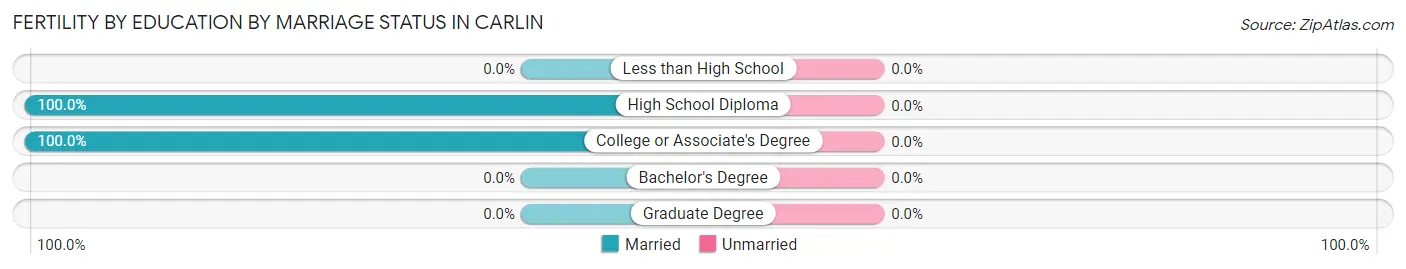
| Educational Attainment | Married | Unmarried |
| Less than High School | 0 (0.0%) | 0 (0.0%) |
| High School Diploma | 16 (100.0%) | 0 (0.0%) |
| College or Associate's Degree | 29 (100.0%) | 0 (0.0%) |
| Bachelor's Degree | 0 (0.0%) | 0 (0.0%) |
| Graduate Degree | 0 (0.0%) | 0 (0.0%) |
| Total | 45 (100.0%) | 0 (0.0%) |
Employment Characteristics in Carlin
Employment by Class of Employer in Carlin
Among the 1,135 employed individuals in Carlin, private company employees (811 | 71.5%), self-employed (not incorporated) (186 | 16.4%), and local government employees (65 | 5.7%) make up the most common classes of employment.
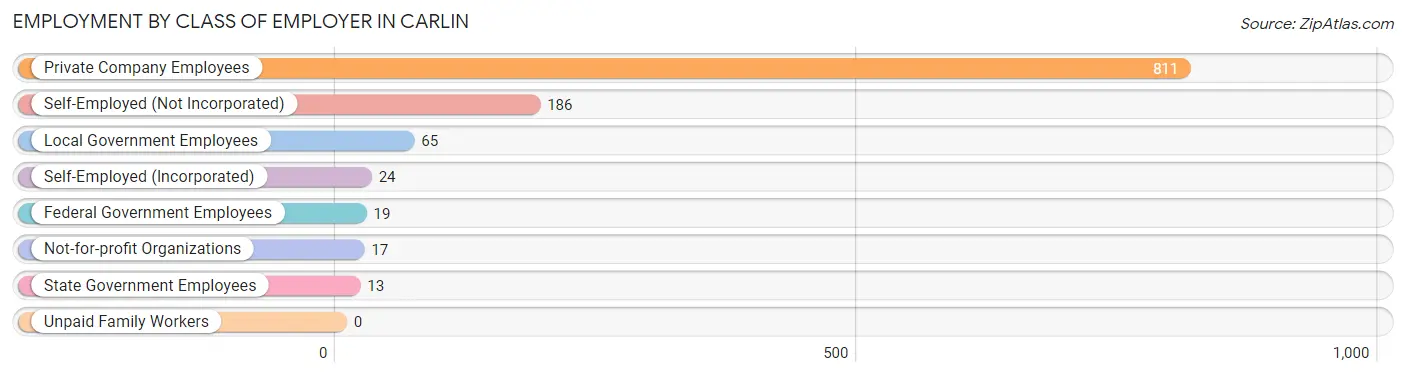
| Employer Class | # Employees | % Employees |
| Private Company Employees | 811 | 71.5% |
| Self-Employed (Incorporated) | 24 | 2.1% |
| Self-Employed (Not Incorporated) | 186 | 16.4% |
| Not-for-profit Organizations | 17 | 1.5% |
| Local Government Employees | 65 | 5.7% |
| State Government Employees | 13 | 1.1% |
| Federal Government Employees | 19 | 1.7% |
| Unpaid Family Workers | 0 | 0.0% |
| Total | 1,135 | 100.0% |
Employment Status by Age in Carlin
According to the labor force statistics for Carlin, out of the total population over 16 years of age (1,902), 65.6% or 1,248 individuals are in the labor force, with 5.0% or 62 of them unemployed. The age group with the highest labor force participation rate is 20 to 24 years, with 95.8% or 316 individuals in the labor force. Within the labor force, the 20 to 24 years age range has the highest percentage of unemployed individuals, with 13.6% or 43 of them being unemployed.
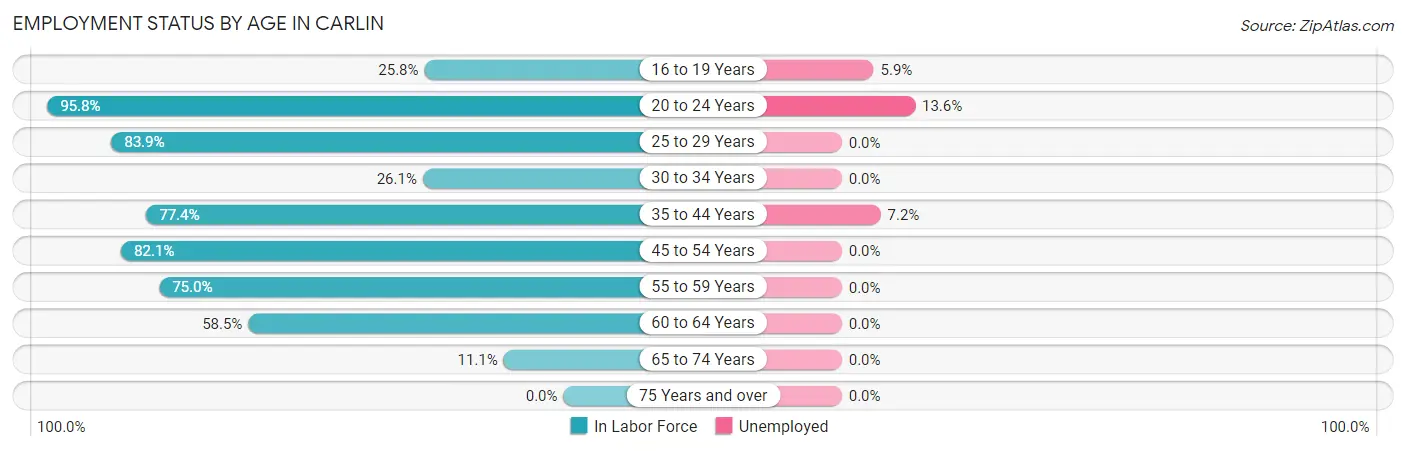
| Age Bracket | In Labor Force | Unemployed |
| 16 to 19 Years | 17 (25.8%) | 1 (5.9%) |
| 20 to 24 Years | 316 (95.8%) | 43 (13.6%) |
| 25 to 29 Years | 183 (83.9%) | 0 (0.0%) |
| 30 to 34 Years | 23 (26.1%) | 0 (0.0%) |
| 35 to 44 Years | 263 (77.4%) | 19 (7.2%) |
| 45 to 54 Years | 234 (82.1%) | 0 (0.0%) |
| 55 to 59 Years | 105 (75.0%) | 0 (0.0%) |
| 60 to 64 Years | 79 (58.5%) | 0 (0.0%) |
| 65 to 74 Years | 28 (11.1%) | 0 (0.0%) |
| 75 Years and over | 0 (0.0%) | 0 (0.0%) |
| Total | 1,248 (65.6%) | 62 (5.0%) |
Employment Status by Educational Attainment in Carlin
According to labor force statistics for Carlin, 73.5% of individuals (886) out of the total population between 25 and 64 years of age (1,206) are in the labor force, with 2.1% or 19 of them being unemployed. The group with the highest labor force participation rate are those with the educational attainment of bachelor's degree or higher, with 99.5% or 199 individuals in the labor force. Within the labor force, individuals with high school diploma education have the highest percentage of unemployment, with 7.1% or 19 of them being unemployed.
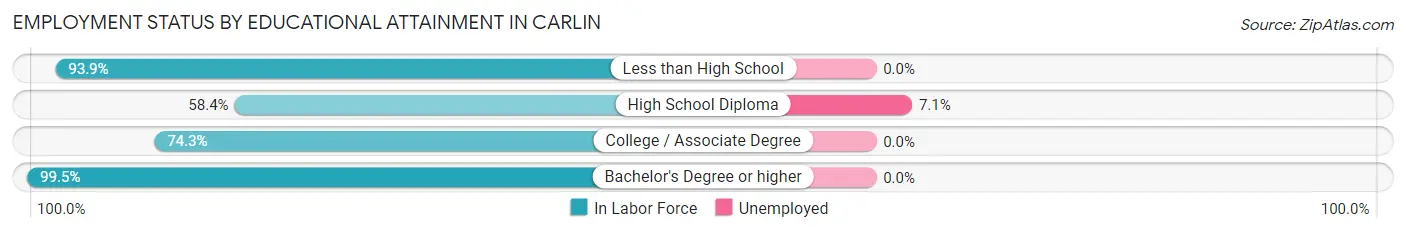
| Educational Attainment | In Labor Force | Unemployed |
| Less than High School | 62 (93.9%) | 0 (0.0%) |
| High School Diploma | 267 (58.4%) | 32 (7.1%) |
| College / Associate Degree | 359 (74.3%) | 0 (0.0%) |
| Bachelor's Degree or higher | 199 (99.5%) | 0 (0.0%) |
| Total | 886 (73.5%) | 25 (2.1%) |
Employment Occupations by Sex in Carlin
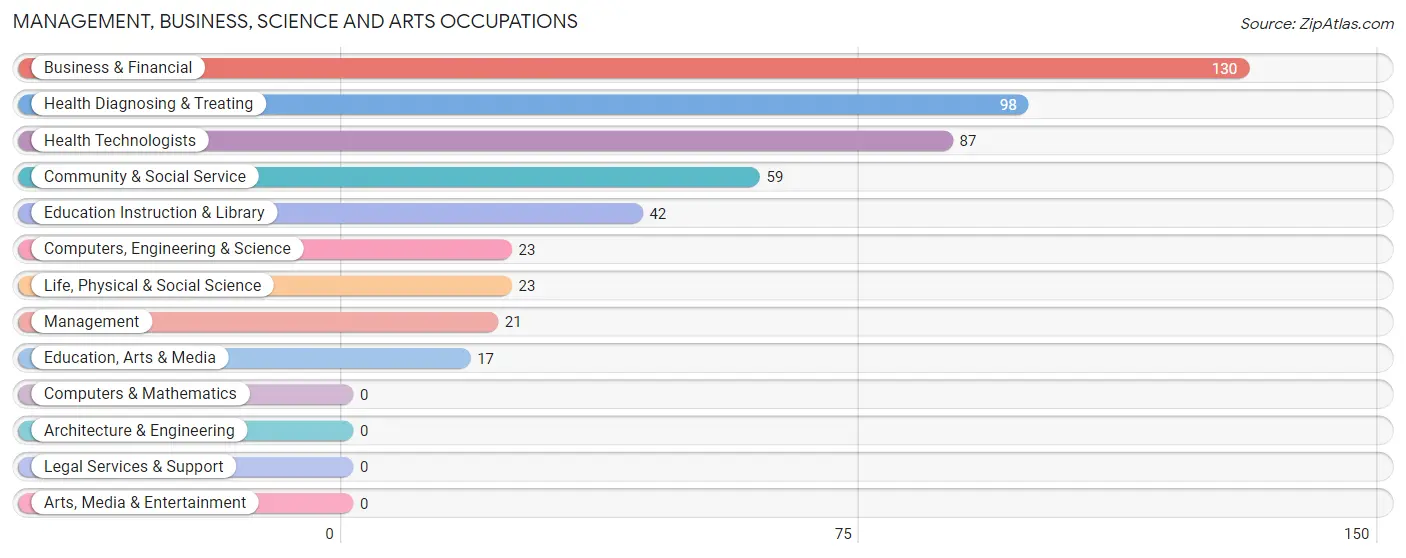
Management, Business, Science and Arts Occupations
The most common Management, Business, Science and Arts occupations in Carlin are Business & Financial (130 | 11.0%), Health Diagnosing & Treating (98 | 8.3%), Health Technologists (87 | 7.3%), Community & Social Service (59 | 5.0%), and Education Instruction & Library (42 | 3.5%).
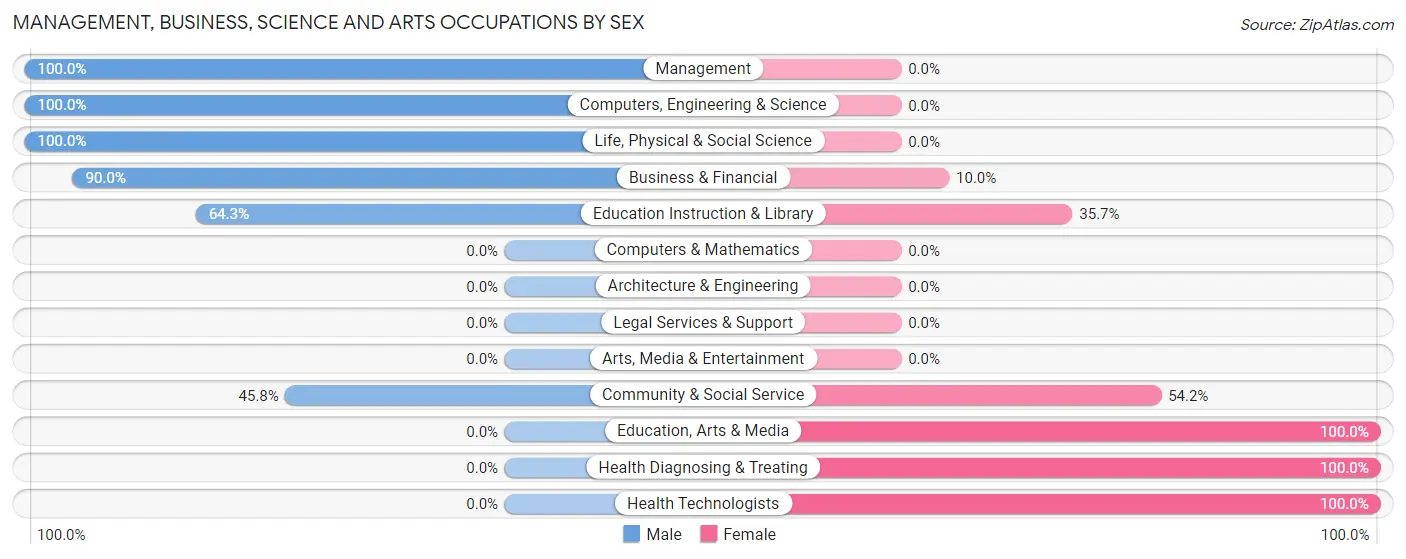
Management, Business, Science and Arts Occupations by Sex
Within the Management, Business, Science and Arts occupations in Carlin, the most male-oriented occupations are Management (100.0%), Computers, Engineering & Science (100.0%), and Life, Physical & Social Science (100.0%), while the most female-oriented occupations are Education, Arts & Media (100.0%), Health Diagnosing & Treating (100.0%), and Health Technologists (100.0%).
| Occupation | Male | Female |
| Management | 21 (100.0%) | 0 (0.0%) |
| Business & Financial | 117 (90.0%) | 13 (10.0%) |
| Computers, Engineering & Science | 23 (100.0%) | 0 (0.0%) |
| Computers & Mathematics | 0 (0.0%) | 0 (0.0%) |
| Architecture & Engineering | 0 (0.0%) | 0 (0.0%) |
| Life, Physical & Social Science | 23 (100.0%) | 0 (0.0%) |
| Community & Social Service | 27 (45.8%) | 32 (54.2%) |
| Education, Arts & Media | 0 (0.0%) | 17 (100.0%) |
| Legal Services & Support | 0 (0.0%) | 0 (0.0%) |
| Education Instruction & Library | 27 (64.3%) | 15 (35.7%) |
| Arts, Media & Entertainment | 0 (0.0%) | 0 (0.0%) |
| Health Diagnosing & Treating | 0 (0.0%) | 98 (100.0%) |
| Health Technologists | 0 (0.0%) | 87 (100.0%) |
| Total (Category) | 188 (56.8%) | 143 (43.2%) |
| Total (Overall) | 688 (58.1%) | 497 (41.9%) |
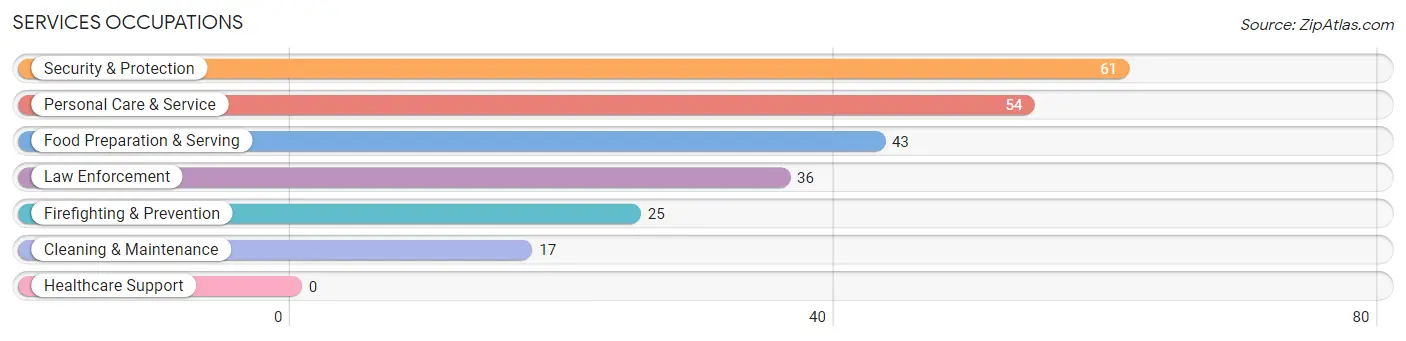
Services Occupations
The most common Services occupations in Carlin are Security & Protection (61 | 5.1%), Personal Care & Service (54 | 4.6%), Food Preparation & Serving (43 | 3.6%), Law Enforcement (36 | 3.0%), and Firefighting & Prevention (25 | 2.1%).
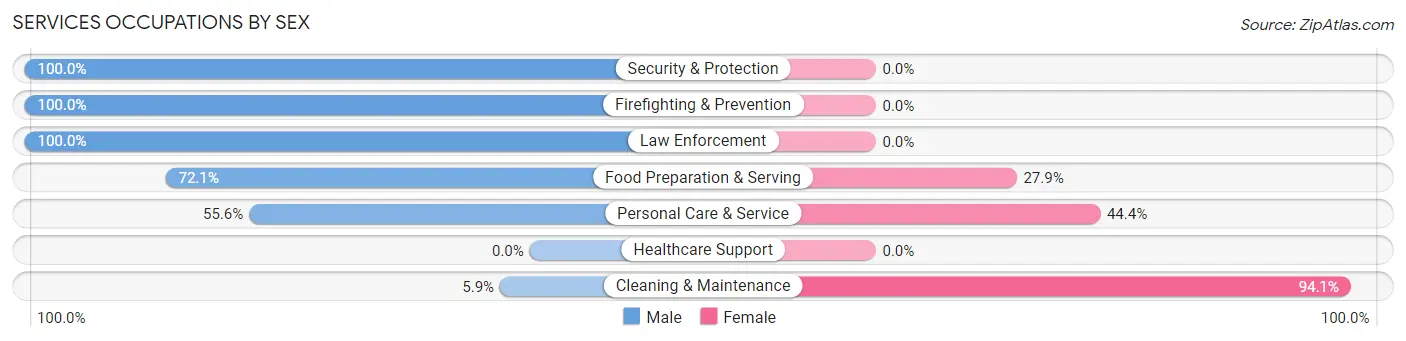
Services Occupations by Sex
Within the Services occupations in Carlin, the most male-oriented occupations are Security & Protection (100.0%), Firefighting & Prevention (100.0%), and Law Enforcement (100.0%), while the most female-oriented occupations are Cleaning & Maintenance (94.1%), Personal Care & Service (44.4%), and Food Preparation & Serving (27.9%).
| Occupation | Male | Female |
| Healthcare Support | 0 (0.0%) | 0 (0.0%) |
| Security & Protection | 61 (100.0%) | 0 (0.0%) |
| Firefighting & Prevention | 25 (100.0%) | 0 (0.0%) |
| Law Enforcement | 36 (100.0%) | 0 (0.0%) |
| Food Preparation & Serving | 31 (72.1%) | 12 (27.9%) |
| Cleaning & Maintenance | 1 (5.9%) | 16 (94.1%) |
| Personal Care & Service | 30 (55.6%) | 24 (44.4%) |
| Total (Category) | 123 (70.3%) | 52 (29.7%) |
| Total (Overall) | 688 (58.1%) | 497 (41.9%) |
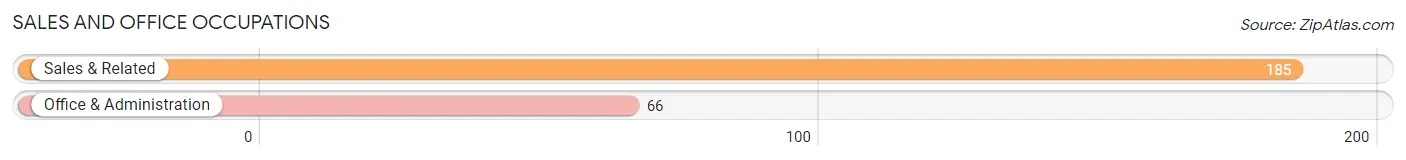
Sales and Office Occupations
The most common Sales and Office occupations in Carlin are Sales & Related (185 | 15.6%), and Office & Administration (66 | 5.6%).
Sales and Office Occupations by Sex
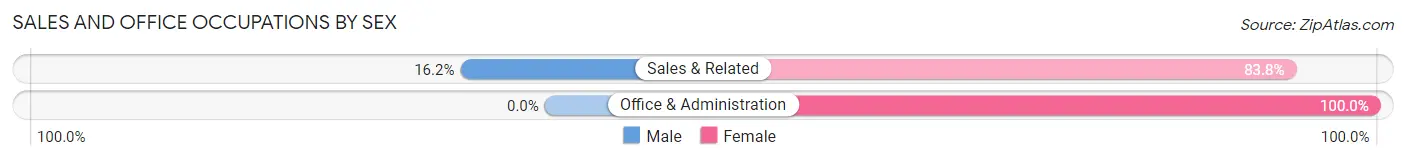
| Occupation | Male | Female |
| Sales & Related | 30 (16.2%) | 155 (83.8%) |
| Office & Administration | 0 (0.0%) | 66 (100.0%) |
| Total (Category) | 30 (11.9%) | 221 (88.0%) |
| Total (Overall) | 688 (58.1%) | 497 (41.9%) |
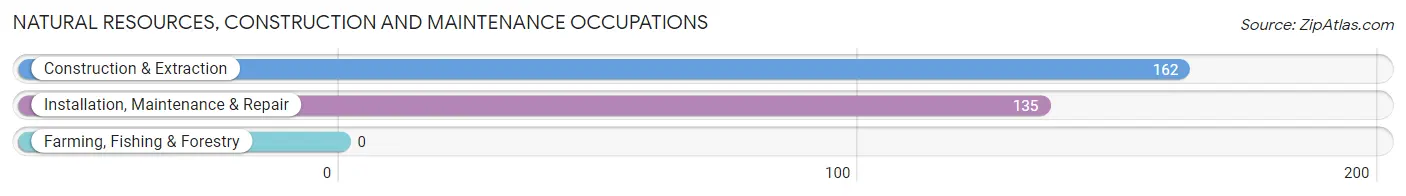
Natural Resources, Construction and Maintenance Occupations
The most common Natural Resources, Construction and Maintenance occupations in Carlin are Construction & Extraction (162 | 13.7%), and Installation, Maintenance & Repair (135 | 11.4%).
Natural Resources, Construction and Maintenance Occupations by Sex
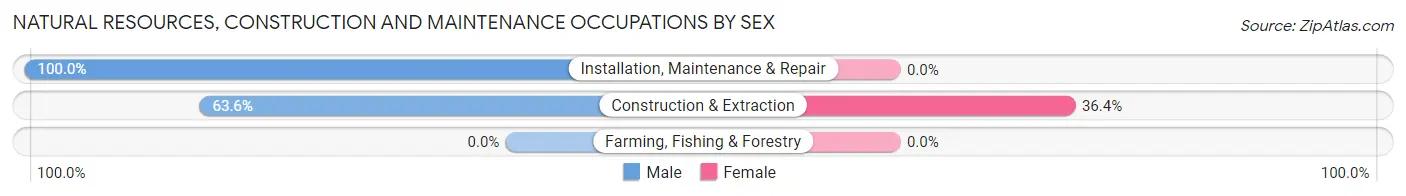
| Occupation | Male | Female |
| Farming, Fishing & Forestry | 0 (0.0%) | 0 (0.0%) |
| Construction & Extraction | 103 (63.6%) | 59 (36.4%) |
| Installation, Maintenance & Repair | 135 (100.0%) | 0 (0.0%) |
| Total (Category) | 238 (80.1%) | 59 (19.9%) |
| Total (Overall) | 688 (58.1%) | 497 (41.9%) |
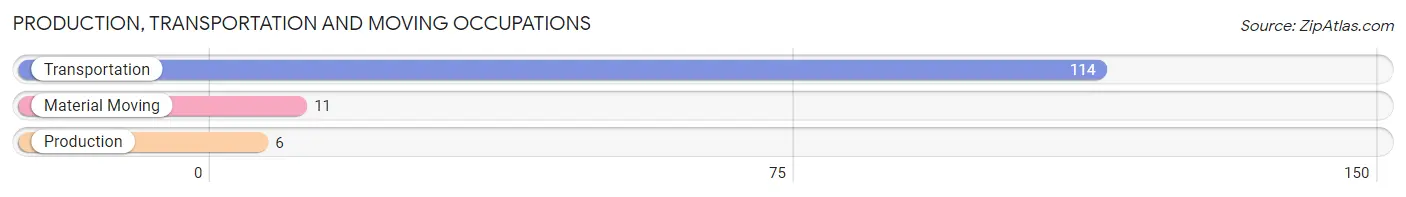
Production, Transportation and Moving Occupations
The most common Production, Transportation and Moving occupations in Carlin are Transportation (114 | 9.6%), Material Moving (11 | 0.9%), and Production (6 | 0.5%).
Production, Transportation and Moving Occupations by Sex
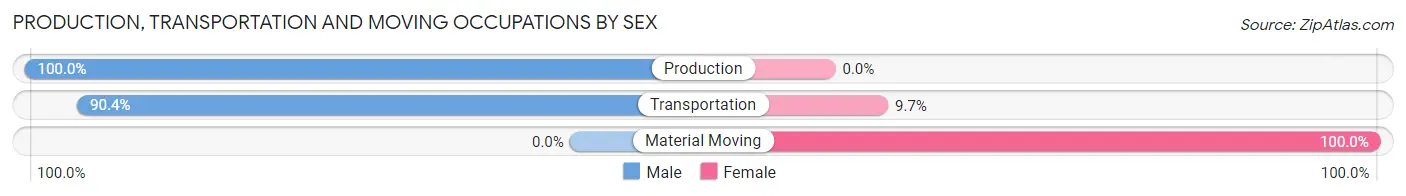
| Occupation | Male | Female |
| Production | 6 (100.0%) | 0 (0.0%) |
| Transportation | 103 (90.3%) | 11 (9.7%) |
| Material Moving | 0 (0.0%) | 11 (100.0%) |
| Total (Category) | 109 (83.2%) | 22 (16.8%) |
| Total (Overall) | 688 (58.1%) | 497 (41.9%) |
Employment Industries by Sex in Carlin
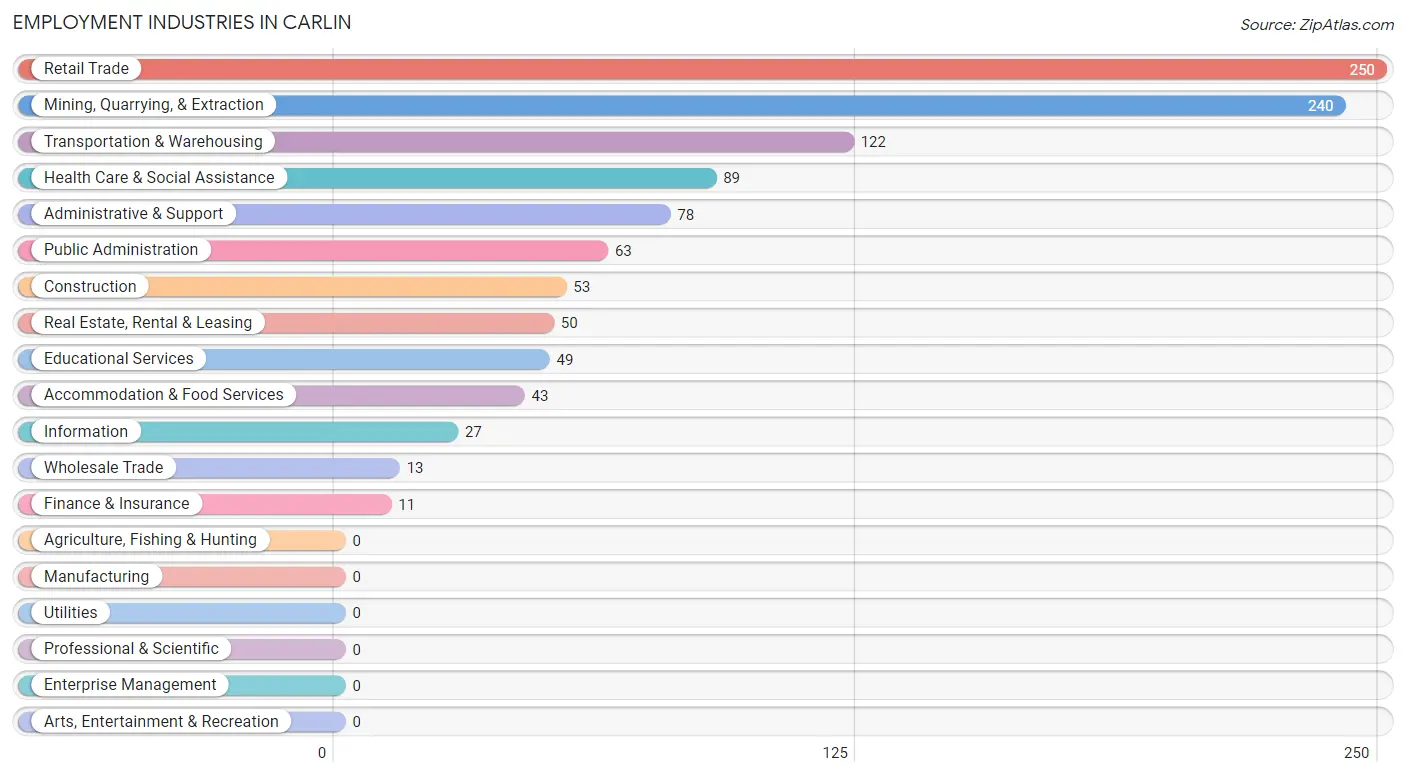
Employment Industries in Carlin
The major employment industries in Carlin include Retail Trade (250 | 21.1%), Mining, Quarrying, & Extraction (240 | 20.3%), Transportation & Warehousing (122 | 10.3%), Health Care & Social Assistance (89 | 7.5%), and Administrative & Support (78 | 6.6%).
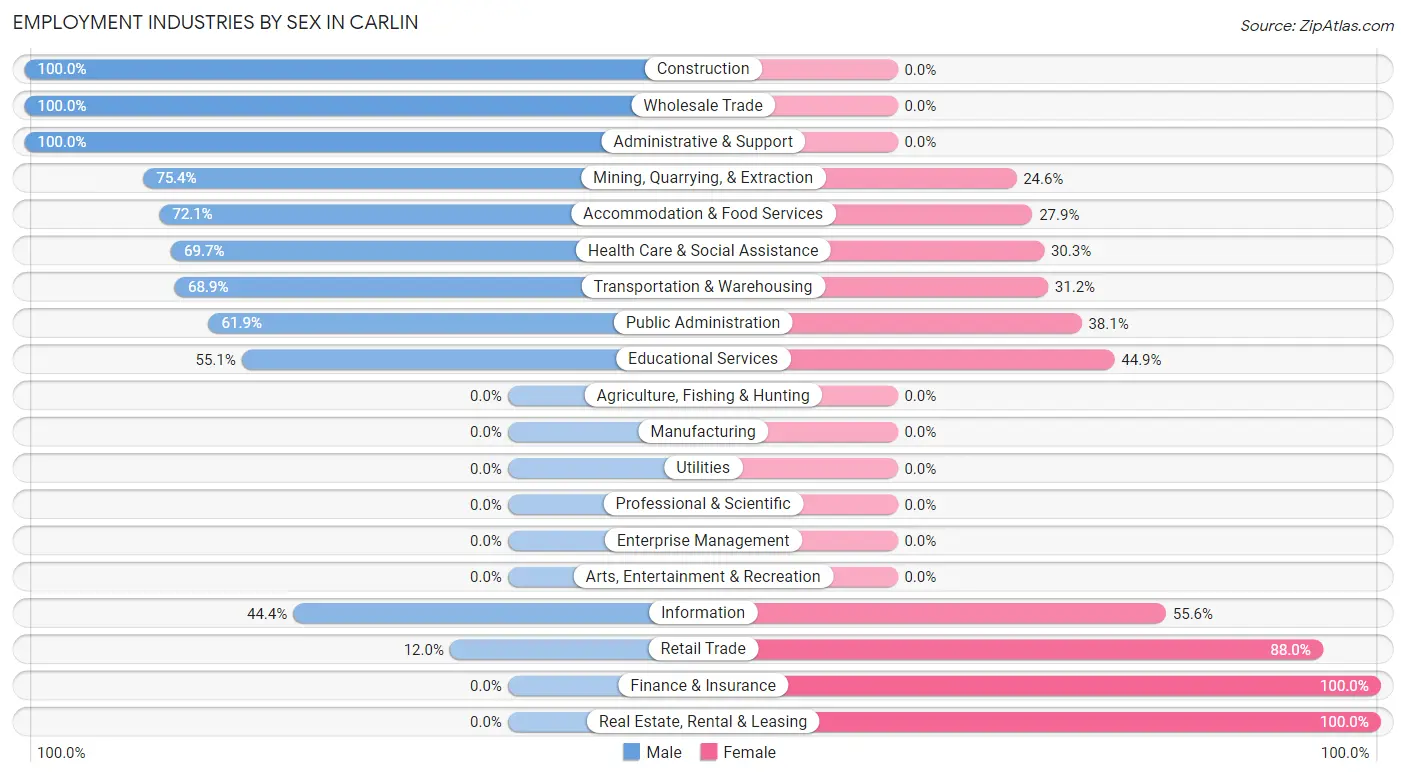
Employment Industries by Sex in Carlin
The Carlin industries that see more men than women are Construction (100.0%), Wholesale Trade (100.0%), and Administrative & Support (100.0%), whereas the industries that tend to have a higher number of women are Finance & Insurance (100.0%), Real Estate, Rental & Leasing (100.0%), and Retail Trade (88.0%).
| Industry | Male | Female |
| Agriculture, Fishing & Hunting | 0 (0.0%) | 0 (0.0%) |
| Mining, Quarrying, & Extraction | 181 (75.4%) | 59 (24.6%) |
| Construction | 53 (100.0%) | 0 (0.0%) |
| Manufacturing | 0 (0.0%) | 0 (0.0%) |
| Wholesale Trade | 13 (100.0%) | 0 (0.0%) |
| Retail Trade | 30 (12.0%) | 220 (88.0%) |
| Transportation & Warehousing | 84 (68.9%) | 38 (31.1%) |
| Utilities | 0 (0.0%) | 0 (0.0%) |
| Information | 12 (44.4%) | 15 (55.6%) |
| Finance & Insurance | 0 (0.0%) | 11 (100.0%) |
| Real Estate, Rental & Leasing | 0 (0.0%) | 50 (100.0%) |
| Professional & Scientific | 0 (0.0%) | 0 (0.0%) |
| Enterprise Management | 0 (0.0%) | 0 (0.0%) |
| Administrative & Support | 78 (100.0%) | 0 (0.0%) |
| Educational Services | 27 (55.1%) | 22 (44.9%) |
| Health Care & Social Assistance | 62 (69.7%) | 27 (30.3%) |
| Arts, Entertainment & Recreation | 0 (0.0%) | 0 (0.0%) |
| Accommodation & Food Services | 31 (72.1%) | 12 (27.9%) |
| Public Administration | 39 (61.9%) | 24 (38.1%) |
| Total | 688 (58.1%) | 497 (41.9%) |
Education in Carlin
School Enrollment in Carlin
The most common levels of schooling among the 432 students in Carlin are middle school (104 | 24.1%), elementary school (100 | 23.2%), and college / undergraduate (87 | 20.1%).
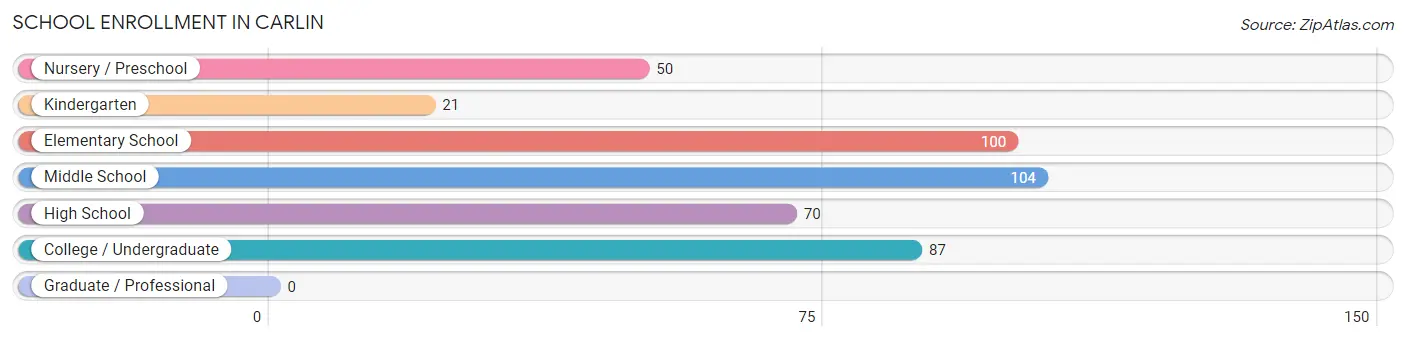
| School Level | # Students | % Students |
| Nursery / Preschool | 50 | 11.6% |
| Kindergarten | 21 | 4.9% |
| Elementary School | 100 | 23.2% |
| Middle School | 104 | 24.1% |
| High School | 70 | 16.2% |
| College / Undergraduate | 87 | 20.1% |
| Graduate / Professional | 0 | 0.0% |
| Total | 432 | 100.0% |
School Enrollment by Age by Funding Source in Carlin
Out of a total of 432 students who are enrolled in schools in Carlin, 87 (20.1%) attend a private institution, while the remaining 345 (79.9%) are enrolled in public schools. The age group of 3 to 4 year olds has the highest likelihood of being enrolled in private schools, with 50 (100.0% in the age bracket) enrolled. Conversely, the age group of 5 to 9 year old has the lowest likelihood of being enrolled in a private school, with 121 (100.0% in the age bracket) attending a public institution.
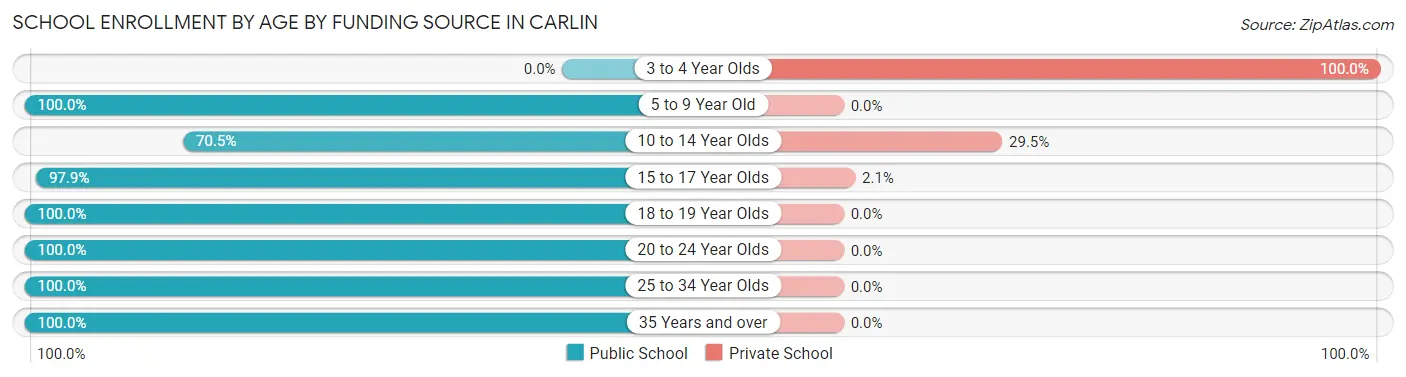
| Age Bracket | Public School | Private School |
| 3 to 4 Year Olds | 0 (0.0%) | 50 (100.0%) |
| 5 to 9 Year Old | 121 (100.0%) | 0 (0.0%) |
| 10 to 14 Year Olds | 86 (70.5%) | 36 (29.5%) |
| 15 to 17 Year Olds | 46 (97.9%) | 1 (2.1%) |
| 18 to 19 Year Olds | 2 (100.0%) | 0 (0.0%) |
| 20 to 24 Year Olds | 68 (100.0%) | 0 (0.0%) |
| 25 to 34 Year Olds | 19 (100.0%) | 0 (0.0%) |
| 35 Years and over | 3 (100.0%) | 0 (0.0%) |
| Total | 345 (79.9%) | 87 (20.1%) |
Educational Attainment by Field of Study in Carlin
Science & technology (87 | 41.4%), business (61 | 29.0%), computers & mathematics (36 | 17.1%), education (15 | 7.1%), and literature & languages (10 | 4.8%) are the most common fields of study among 210 individuals in Carlin who have obtained a bachelor's degree or higher.
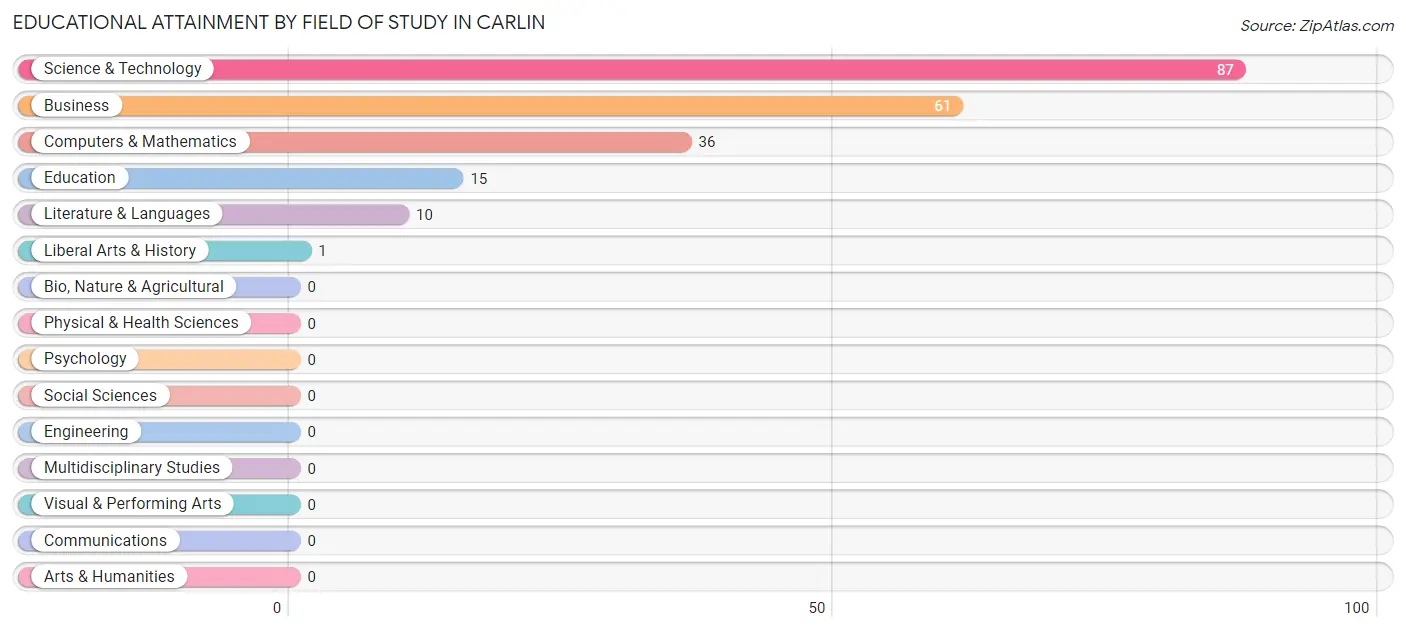
| Field of Study | # Graduates | % Graduates |
| Computers & Mathematics | 36 | 17.1% |
| Bio, Nature & Agricultural | 0 | 0.0% |
| Physical & Health Sciences | 0 | 0.0% |
| Psychology | 0 | 0.0% |
| Social Sciences | 0 | 0.0% |
| Engineering | 0 | 0.0% |
| Multidisciplinary Studies | 0 | 0.0% |
| Science & Technology | 87 | 41.4% |
| Business | 61 | 29.0% |
| Education | 15 | 7.1% |
| Literature & Languages | 10 | 4.8% |
| Liberal Arts & History | 1 | 0.5% |
| Visual & Performing Arts | 0 | 0.0% |
| Communications | 0 | 0.0% |
| Arts & Humanities | 0 | 0.0% |
| Total | 210 | 100.0% |
Transportation & Commute in Carlin
Vehicle Availability by Sex in Carlin
The most prevalent vehicle ownership categories in Carlin are males with 2 vehicles (375, accounting for 54.7%) and females with 2 vehicles (174, making up 84.3%).
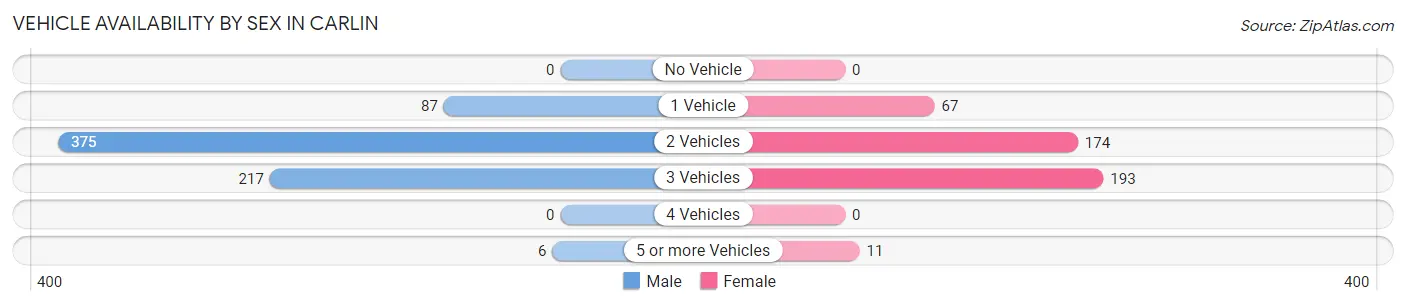
| Vehicles Available | Male | Female |
| No Vehicle | 0 (0.0%) | 0 (0.0%) |
| 1 Vehicle | 87 (12.7%) | 67 (15.1%) |
| 2 Vehicles | 375 (54.7%) | 174 (39.1%) |
| 3 Vehicles | 217 (31.7%) | 193 (43.4%) |
| 4 Vehicles | 0 (0.0%) | 0 (0.0%) |
| 5 or more Vehicles | 6 (0.9%) | 11 (2.5%) |
| Total | 685 (100.0%) | 445 (100.0%) |
Commute Time in Carlin
The most frequently occuring commute durations in Carlin are 5 to 9 minutes (269 commuters, 23.9%), 30 to 34 minutes (227 commuters, 20.2%), and 20 to 24 minutes (219 commuters, 19.5%).
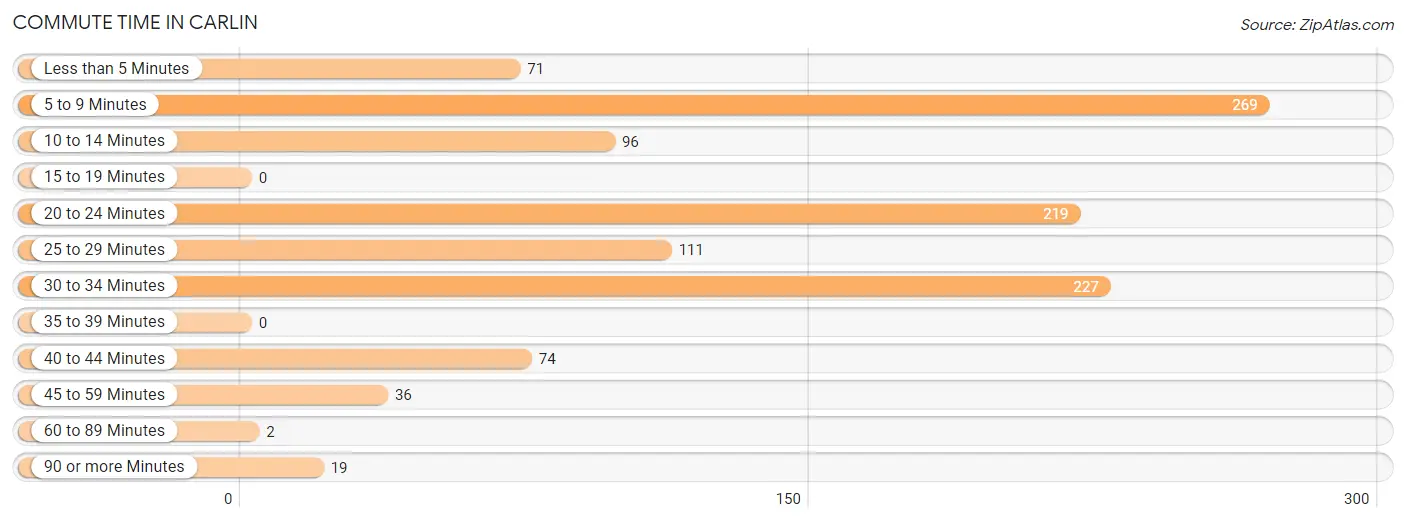
| Commute Time | # Commuters | % Commuters |
| Less than 5 Minutes | 71 | 6.3% |
| 5 to 9 Minutes | 269 | 23.9% |
| 10 to 14 Minutes | 96 | 8.5% |
| 15 to 19 Minutes | 0 | 0.0% |
| 20 to 24 Minutes | 219 | 19.5% |
| 25 to 29 Minutes | 111 | 9.9% |
| 30 to 34 Minutes | 227 | 20.2% |
| 35 to 39 Minutes | 0 | 0.0% |
| 40 to 44 Minutes | 74 | 6.6% |
| 45 to 59 Minutes | 36 | 3.2% |
| 60 to 89 Minutes | 2 | 0.2% |
| 90 or more Minutes | 19 | 1.7% |
Commute Time by Sex in Carlin
The most common commute times in Carlin are 20 to 24 minutes (159 commuters, 23.1%) for males and 5 to 9 minutes (116 commuters, 26.6%) for females.
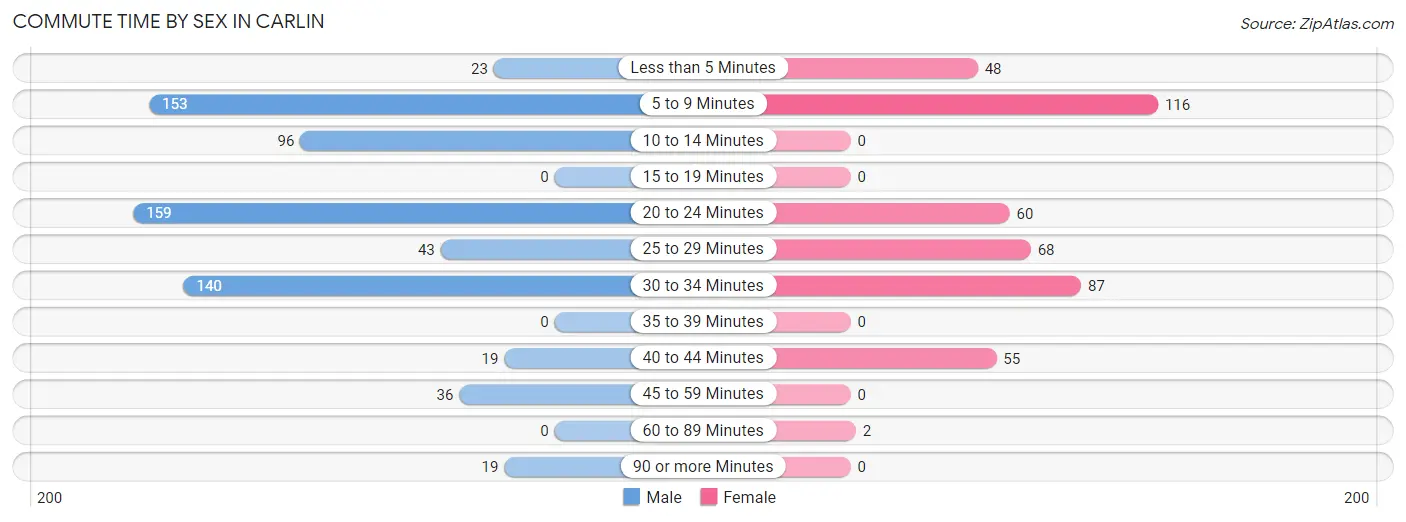
| Commute Time | Male | Female |
| Less than 5 Minutes | 23 (3.3%) | 48 (11.0%) |
| 5 to 9 Minutes | 153 (22.2%) | 116 (26.6%) |
| 10 to 14 Minutes | 96 (14.0%) | 0 (0.0%) |
| 15 to 19 Minutes | 0 (0.0%) | 0 (0.0%) |
| 20 to 24 Minutes | 159 (23.1%) | 60 (13.8%) |
| 25 to 29 Minutes | 43 (6.2%) | 68 (15.6%) |
| 30 to 34 Minutes | 140 (20.3%) | 87 (20.0%) |
| 35 to 39 Minutes | 0 (0.0%) | 0 (0.0%) |
| 40 to 44 Minutes | 19 (2.8%) | 55 (12.6%) |
| 45 to 59 Minutes | 36 (5.2%) | 0 (0.0%) |
| 60 to 89 Minutes | 0 (0.0%) | 2 (0.5%) |
| 90 or more Minutes | 19 (2.8%) | 0 (0.0%) |
Time of Departure to Work by Sex in Carlin
The most frequent times of departure to work in Carlin are 4:00 PM to 11:59 PM (144, 20.9%) for males and 10:00 AM to 10:59 AM (87, 20.0%) for females.
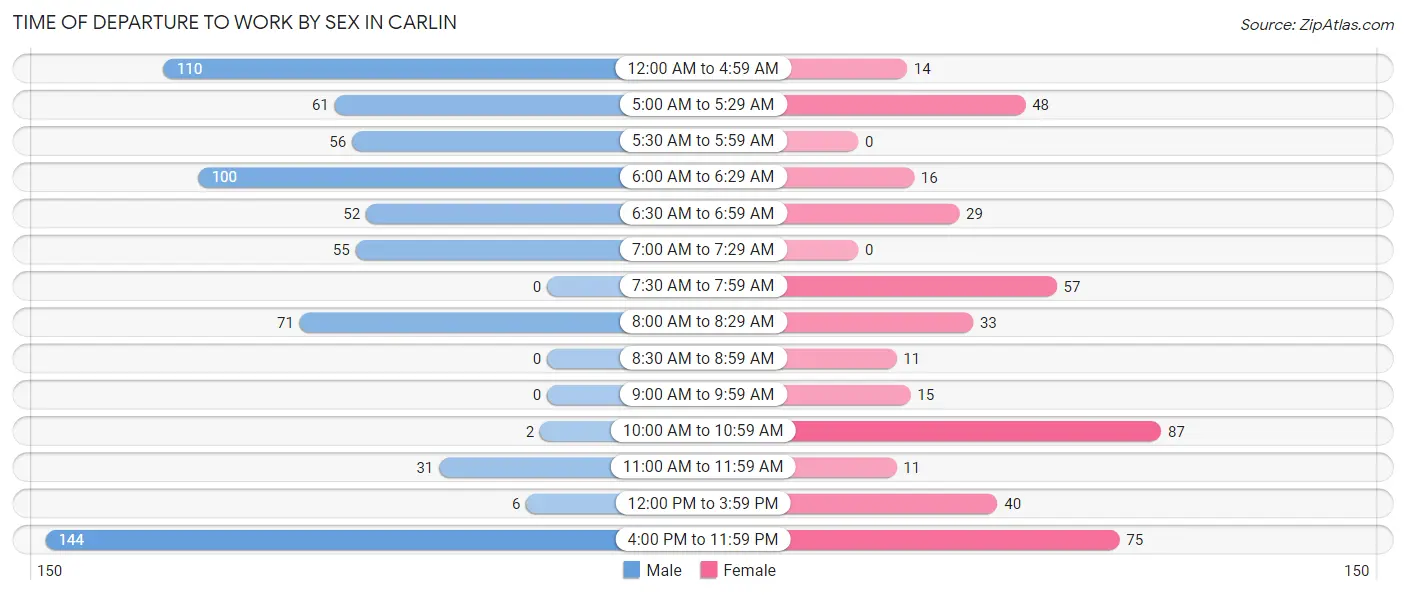
| Time of Departure | Male | Female |
| 12:00 AM to 4:59 AM | 110 (16.0%) | 14 (3.2%) |
| 5:00 AM to 5:29 AM | 61 (8.9%) | 48 (11.0%) |
| 5:30 AM to 5:59 AM | 56 (8.1%) | 0 (0.0%) |
| 6:00 AM to 6:29 AM | 100 (14.5%) | 16 (3.7%) |
| 6:30 AM to 6:59 AM | 52 (7.6%) | 29 (6.7%) |
| 7:00 AM to 7:29 AM | 55 (8.0%) | 0 (0.0%) |
| 7:30 AM to 7:59 AM | 0 (0.0%) | 57 (13.1%) |
| 8:00 AM to 8:29 AM | 71 (10.3%) | 33 (7.6%) |
| 8:30 AM to 8:59 AM | 0 (0.0%) | 11 (2.5%) |
| 9:00 AM to 9:59 AM | 0 (0.0%) | 15 (3.4%) |
| 10:00 AM to 10:59 AM | 2 (0.3%) | 87 (20.0%) |
| 11:00 AM to 11:59 AM | 31 (4.5%) | 11 (2.5%) |
| 12:00 PM to 3:59 PM | 6 (0.9%) | 40 (9.2%) |
| 4:00 PM to 11:59 PM | 144 (20.9%) | 75 (17.2%) |
| Total | 688 (100.0%) | 436 (100.0%) |
Housing Occupancy in Carlin
Occupancy by Ownership in Carlin
Of the total 841 dwellings in Carlin, owner-occupied units account for 491 (58.4%), while renter-occupied units make up 350 (41.6%).
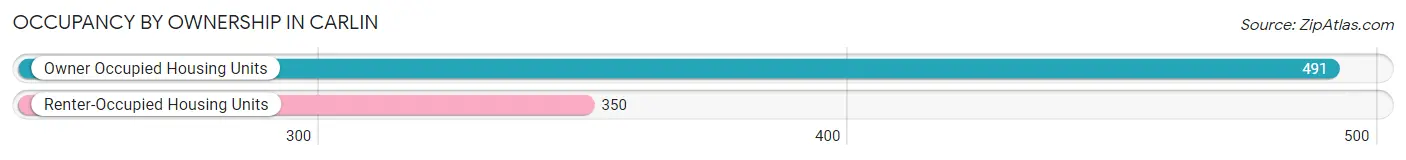
| Occupancy | # Housing Units | % Housing Units |
| Owner Occupied Housing Units | 491 | 58.4% |
| Renter-Occupied Housing Units | 350 | 41.6% |
| Total Occupied Housing Units | 841 | 100.0% |
Occupancy by Household Size in Carlin
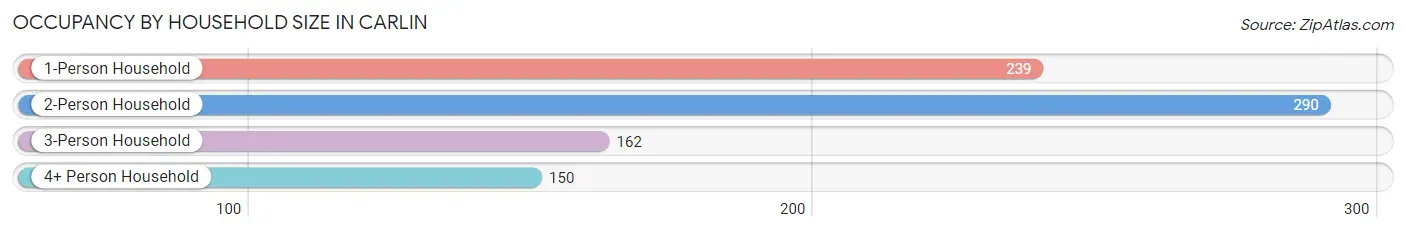
| Household Size | # Housing Units | % Housing Units |
| 1-Person Household | 239 | 28.4% |
| 2-Person Household | 290 | 34.5% |
| 3-Person Household | 162 | 19.3% |
| 4+ Person Household | 150 | 17.8% |
| Total Housing Units | 841 | 100.0% |
Occupancy by Ownership by Household Size in Carlin
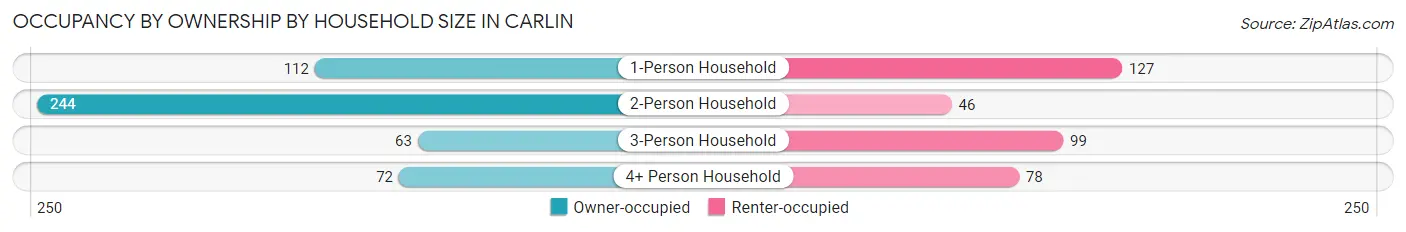
| Household Size | Owner-occupied | Renter-occupied |
| 1-Person Household | 112 (46.9%) | 127 (53.1%) |
| 2-Person Household | 244 (84.1%) | 46 (15.9%) |
| 3-Person Household | 63 (38.9%) | 99 (61.1%) |
| 4+ Person Household | 72 (48.0%) | 78 (52.0%) |
| Total Housing Units | 491 (58.4%) | 350 (41.6%) |
Occupancy by Educational Attainment in Carlin
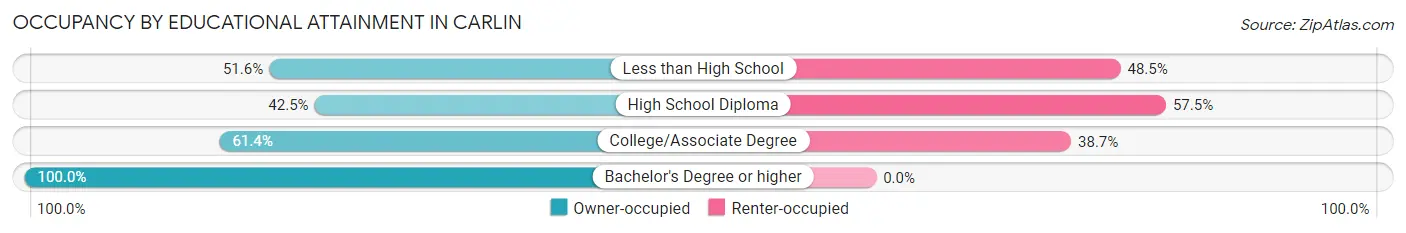
| Household Size | Owner-occupied | Renter-occupied |
| Less than High School | 50 (51.5%) | 47 (48.4%) |
| High School Diploma | 97 (42.5%) | 131 (57.5%) |
| College/Associate Degree | 273 (61.4%) | 172 (38.7%) |
| Bachelor's Degree or higher | 71 (100.0%) | 0 (0.0%) |
Occupancy by Age of Householder in Carlin
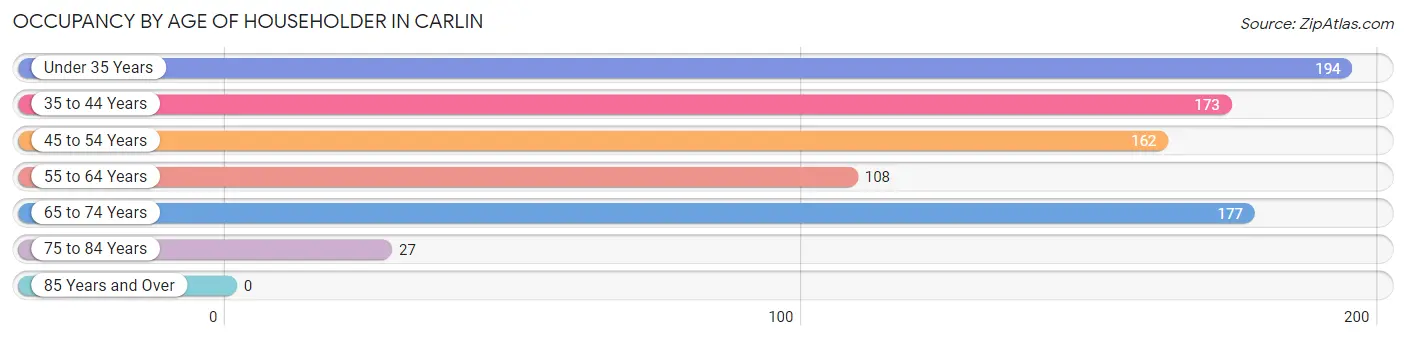
| Age Bracket | # Households | % Households |
| Under 35 Years | 194 | 23.1% |
| 35 to 44 Years | 173 | 20.6% |
| 45 to 54 Years | 162 | 19.3% |
| 55 to 64 Years | 108 | 12.8% |
| 65 to 74 Years | 177 | 21.0% |
| 75 to 84 Years | 27 | 3.2% |
| 85 Years and Over | 0 | 0.0% |
| Total | 841 | 100.0% |
Housing Finances in Carlin
Median Income by Occupancy in Carlin
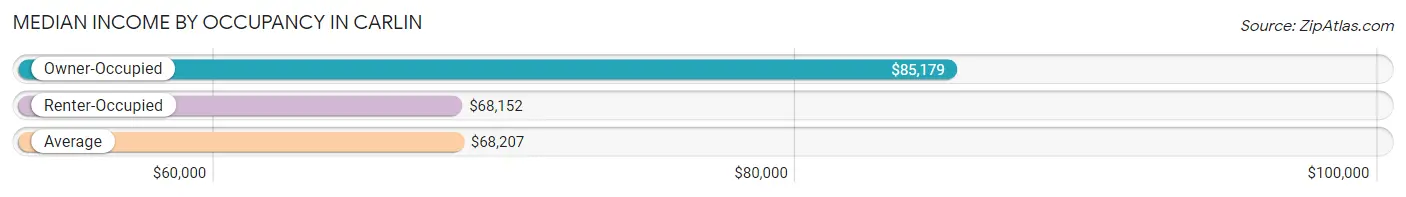
| Occupancy Type | # Households | Median Income |
| Owner-Occupied | 491 (58.4%) | $85,179 |
| Renter-Occupied | 350 (41.6%) | $68,152 |
| Average | 841 (100.0%) | $68,207 |
Occupancy by Householder Income Bracket in Carlin
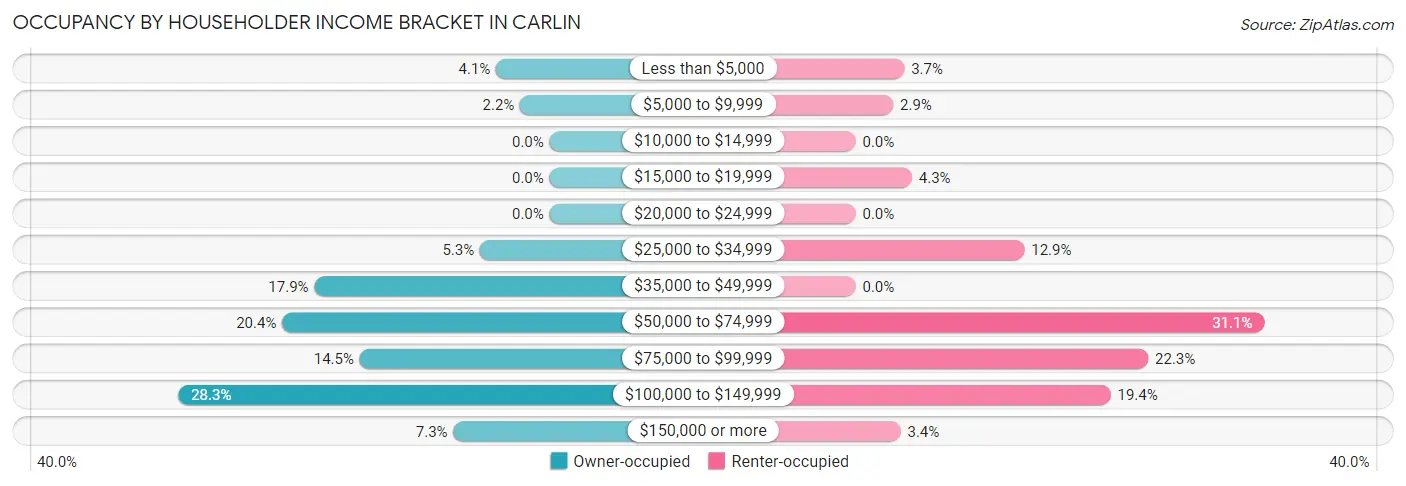
| Income Bracket | Owner-occupied | Renter-occupied |
| Less than $5,000 | 20 (4.1%) | 13 (3.7%) |
| $5,000 to $9,999 | 11 (2.2%) | 10 (2.9%) |
| $10,000 to $14,999 | 0 (0.0%) | 0 (0.0%) |
| $15,000 to $19,999 | 0 (0.0%) | 15 (4.3%) |
| $20,000 to $24,999 | 0 (0.0%) | 0 (0.0%) |
| $25,000 to $34,999 | 26 (5.3%) | 45 (12.9%) |
| $35,000 to $49,999 | 88 (17.9%) | 0 (0.0%) |
| $50,000 to $74,999 | 100 (20.4%) | 109 (31.1%) |
| $75,000 to $99,999 | 71 (14.5%) | 78 (22.3%) |
| $100,000 to $149,999 | 139 (28.3%) | 68 (19.4%) |
| $150,000 or more | 36 (7.3%) | 12 (3.4%) |
| Total | 491 (100.0%) | 350 (100.0%) |
Monthly Housing Cost Tiers in Carlin
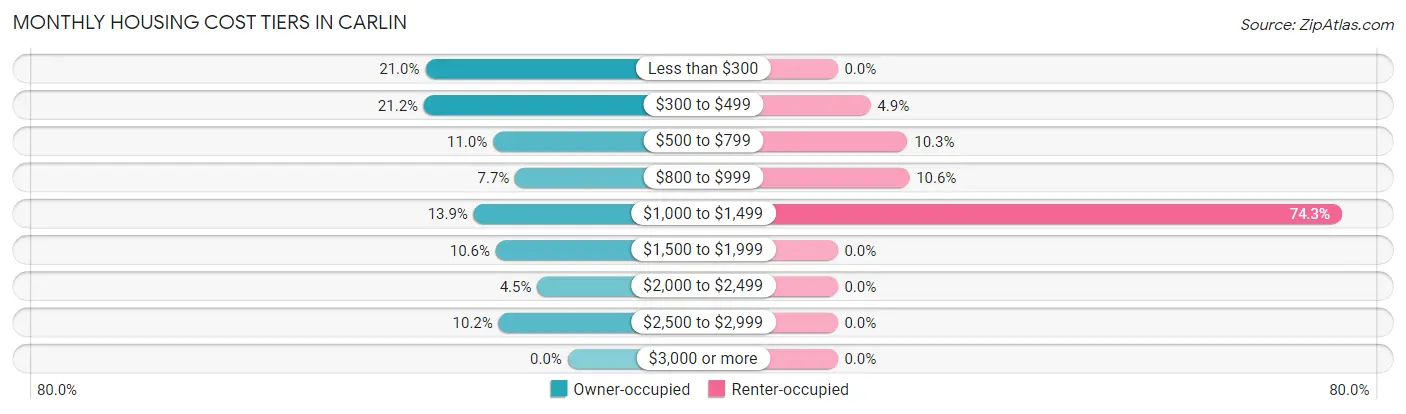
| Monthly Cost | Owner-occupied | Renter-occupied |
| Less than $300 | 103 (21.0%) | 0 (0.0%) |
| $300 to $499 | 104 (21.2%) | 17 (4.9%) |
| $500 to $799 | 54 (11.0%) | 36 (10.3%) |
| $800 to $999 | 38 (7.7%) | 37 (10.6%) |
| $1,000 to $1,499 | 68 (13.9%) | 260 (74.3%) |
| $1,500 to $1,999 | 52 (10.6%) | 0 (0.0%) |
| $2,000 to $2,499 | 22 (4.5%) | 0 (0.0%) |
| $2,500 to $2,999 | 50 (10.2%) | 0 (0.0%) |
| $3,000 or more | 0 (0.0%) | 0 (0.0%) |
| Total | 491 (100.0%) | 350 (100.0%) |
Physical Housing Characteristics in Carlin
Housing Structures in Carlin
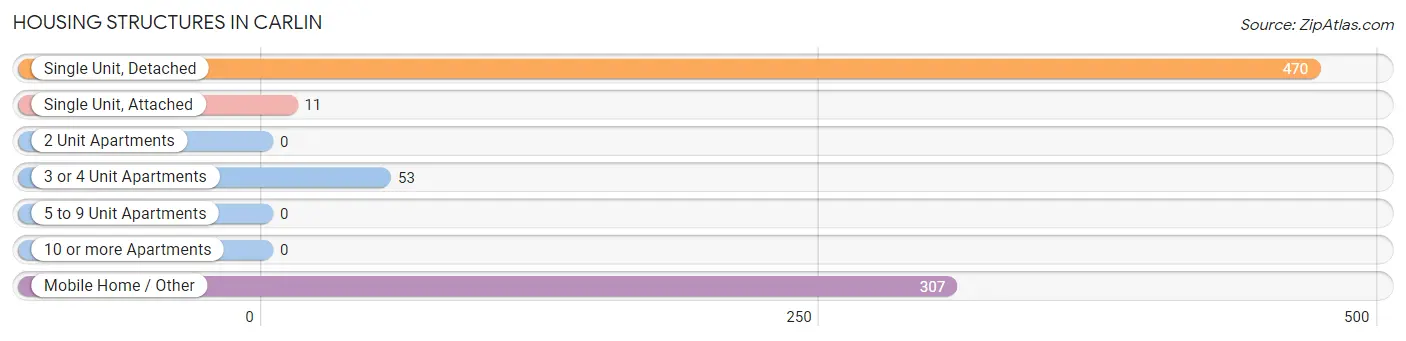
| Structure Type | # Housing Units | % Housing Units |
| Single Unit, Detached | 470 | 55.9% |
| Single Unit, Attached | 11 | 1.3% |
| 2 Unit Apartments | 0 | 0.0% |
| 3 or 4 Unit Apartments | 53 | 6.3% |
| 5 to 9 Unit Apartments | 0 | 0.0% |
| 10 or more Apartments | 0 | 0.0% |
| Mobile Home / Other | 307 | 36.5% |
| Total | 841 | 100.0% |
Housing Structures by Occupancy in Carlin
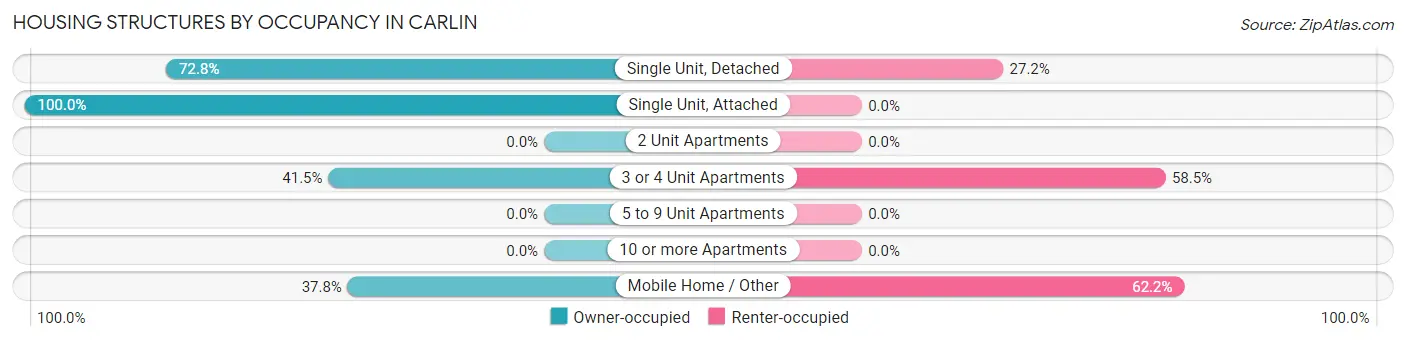
| Structure Type | Owner-occupied | Renter-occupied |
| Single Unit, Detached | 342 (72.8%) | 128 (27.2%) |
| Single Unit, Attached | 11 (100.0%) | 0 (0.0%) |
| 2 Unit Apartments | 0 (0.0%) | 0 (0.0%) |
| 3 or 4 Unit Apartments | 22 (41.5%) | 31 (58.5%) |
| 5 to 9 Unit Apartments | 0 (0.0%) | 0 (0.0%) |
| 10 or more Apartments | 0 (0.0%) | 0 (0.0%) |
| Mobile Home / Other | 116 (37.8%) | 191 (62.2%) |
| Total | 491 (58.4%) | 350 (41.6%) |
Housing Structures by Number of Rooms in Carlin
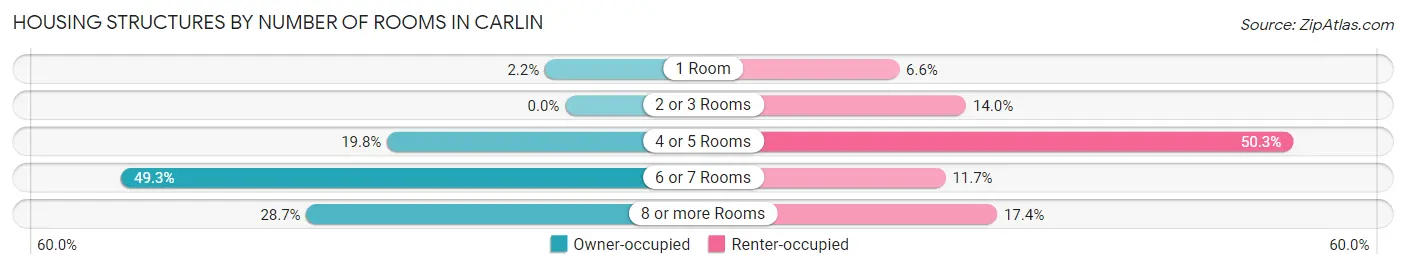
| Number of Rooms | Owner-occupied | Renter-occupied |
| 1 Room | 11 (2.2%) | 23 (6.6%) |
| 2 or 3 Rooms | 0 (0.0%) | 49 (14.0%) |
| 4 or 5 Rooms | 97 (19.8%) | 176 (50.3%) |
| 6 or 7 Rooms | 242 (49.3%) | 41 (11.7%) |
| 8 or more Rooms | 141 (28.7%) | 61 (17.4%) |
| Total | 491 (100.0%) | 350 (100.0%) |
Housing Structure by Heating Type in Carlin
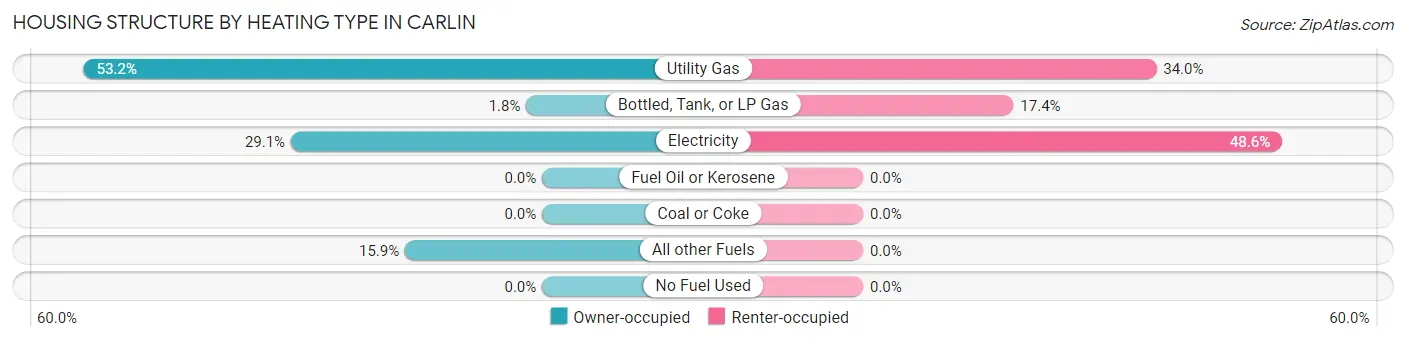
| Heating Type | Owner-occupied | Renter-occupied |
| Utility Gas | 261 (53.2%) | 119 (34.0%) |
| Bottled, Tank, or LP Gas | 9 (1.8%) | 61 (17.4%) |
| Electricity | 143 (29.1%) | 170 (48.6%) |
| Fuel Oil or Kerosene | 0 (0.0%) | 0 (0.0%) |
| Coal or Coke | 0 (0.0%) | 0 (0.0%) |
| All other Fuels | 78 (15.9%) | 0 (0.0%) |
| No Fuel Used | 0 (0.0%) | 0 (0.0%) |
| Total | 491 (100.0%) | 350 (100.0%) |
Household Vehicle Usage in Carlin
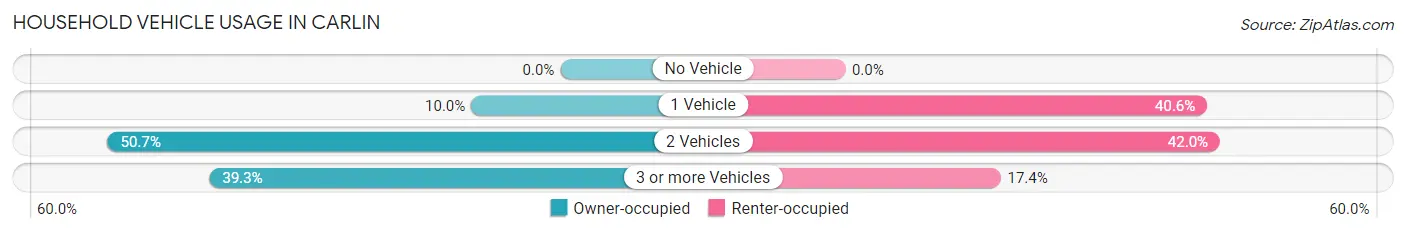
| Vehicles per Household | Owner-occupied | Renter-occupied |
| No Vehicle | 0 (0.0%) | 0 (0.0%) |
| 1 Vehicle | 49 (10.0%) | 142 (40.6%) |
| 2 Vehicles | 249 (50.7%) | 147 (42.0%) |
| 3 or more Vehicles | 193 (39.3%) | 61 (17.4%) |
| Total | 491 (100.0%) | 350 (100.0%) |
Real Estate & Mortgages in Carlin
Real Estate and Mortgage Overview in Carlin
| Characteristic | Without Mortgage | With Mortgage |
| Housing Units | 255 | 236 |
| Median Property Value | $173,900 | $256,700 |
| Median Household Income | $58,011 | $19 |
| Monthly Housing Costs | $424 | $0 |
| Real Estate Taxes | $834 | $0 |
Property Value by Mortgage Status in Carlin
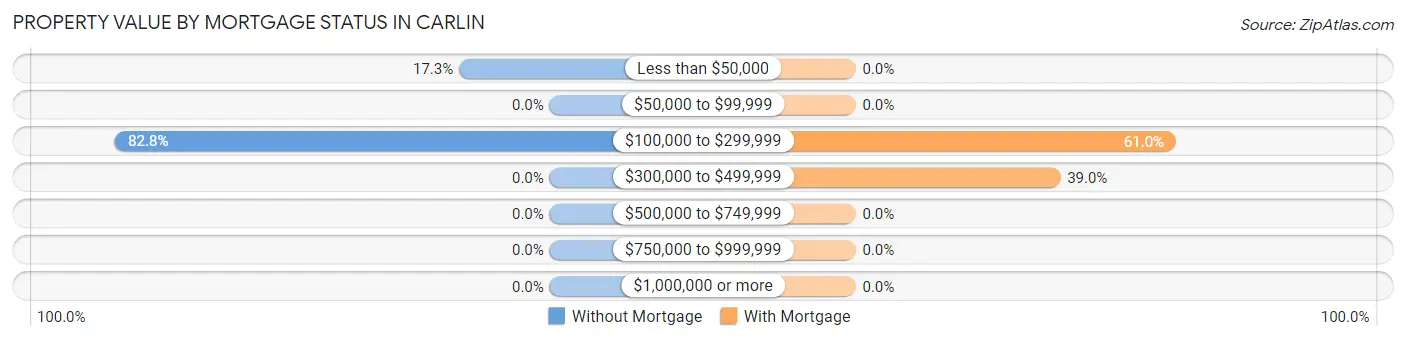
| Property Value | Without Mortgage | With Mortgage |
| Less than $50,000 | 44 (17.2%) | 0 (0.0%) |
| $50,000 to $99,999 | 0 (0.0%) | 0 (0.0%) |
| $100,000 to $299,999 | 211 (82.8%) | 144 (61.0%) |
| $300,000 to $499,999 | 0 (0.0%) | 92 (39.0%) |
| $500,000 to $749,999 | 0 (0.0%) | 0 (0.0%) |
| $750,000 to $999,999 | 0 (0.0%) | 0 (0.0%) |
| $1,000,000 or more | 0 (0.0%) | 0 (0.0%) |
| Total | 255 (100.0%) | 236 (100.0%) |
Household Income by Mortgage Status in Carlin
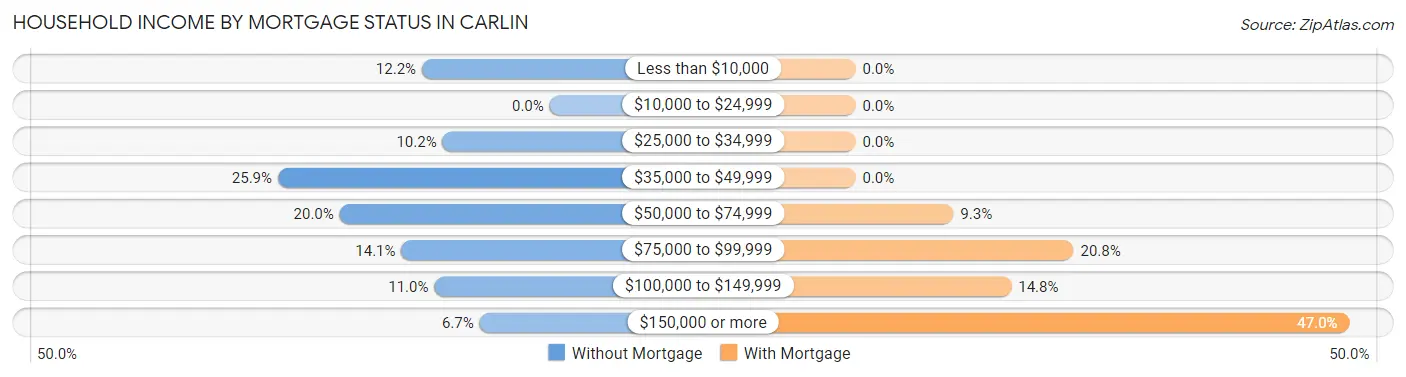
| Household Income | Without Mortgage | With Mortgage |
| Less than $10,000 | 31 (12.2%) | 0 (0.0%) |
| $10,000 to $24,999 | 0 (0.0%) | 0 (0.0%) |
| $25,000 to $34,999 | 26 (10.2%) | 0 (0.0%) |
| $35,000 to $49,999 | 66 (25.9%) | 0 (0.0%) |
| $50,000 to $74,999 | 51 (20.0%) | 22 (9.3%) |
| $75,000 to $99,999 | 36 (14.1%) | 49 (20.8%) |
| $100,000 to $149,999 | 28 (11.0%) | 35 (14.8%) |
| $150,000 or more | 17 (6.7%) | 111 (47.0%) |
| Total | 255 (100.0%) | 236 (100.0%) |
Property Value to Household Income Ratio in Carlin
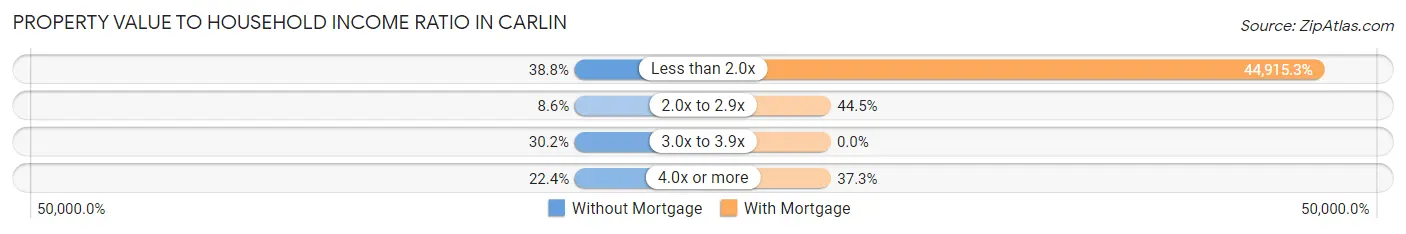
| Value-to-Income Ratio | Without Mortgage | With Mortgage |
| Less than 2.0x | 99 (38.8%) | 106,000 (44,915.2%) |
| 2.0x to 2.9x | 22 (8.6%) | 105 (44.5%) |
| 3.0x to 3.9x | 77 (30.2%) | 0 (0.0%) |
| 4.0x or more | 57 (22.4%) | 88 (37.3%) |
| Total | 255 (100.0%) | 236 (100.0%) |
Real Estate Taxes by Mortgage Status in Carlin
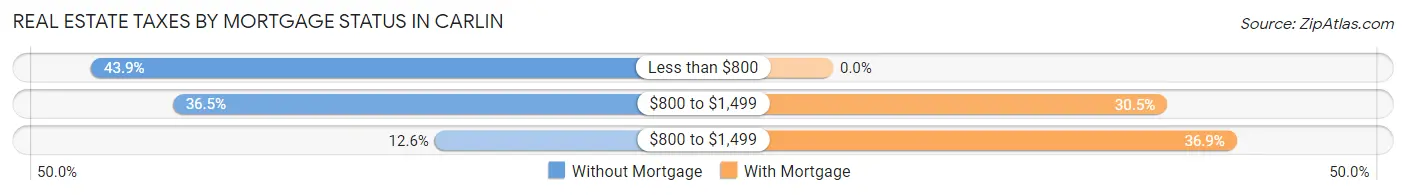
| Property Taxes | Without Mortgage | With Mortgage |
| Less than $800 | 112 (43.9%) | 0 (0.0%) |
| $800 to $1,499 | 93 (36.5%) | 72 (30.5%) |
| $800 to $1,499 | 32 (12.6%) | 87 (36.9%) |
| Total | 255 (100.0%) | 236 (100.0%) |
Health & Disability in Carlin
Health Insurance Coverage by Age in Carlin
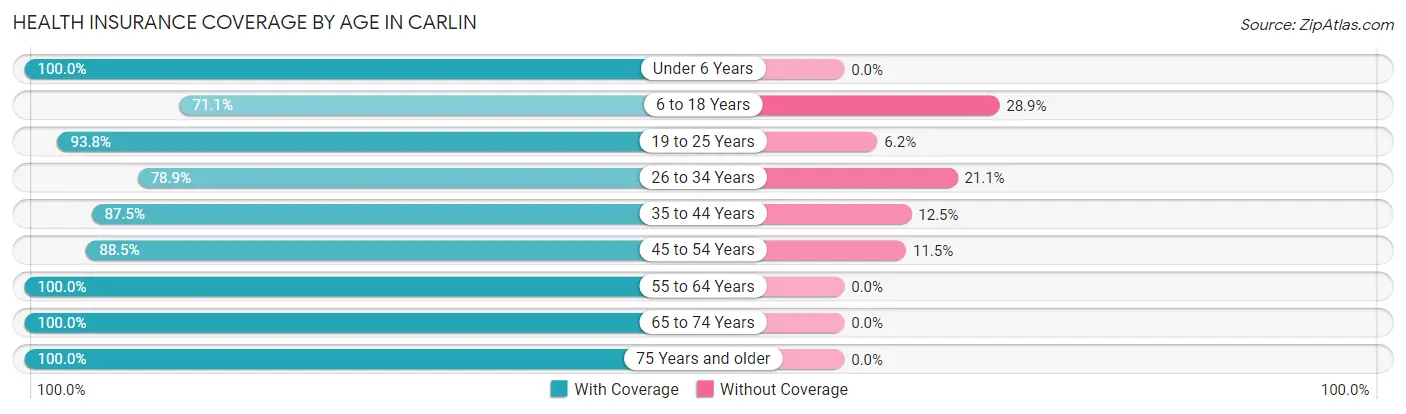
| Age Bracket | With Coverage | Without Coverage |
| Under 6 Years | 221 (100.0%) | 0 (0.0%) |
| 6 to 18 Years | 219 (71.1%) | 89 (28.9%) |
| 19 to 25 Years | 426 (93.8%) | 28 (6.2%) |
| 26 to 34 Years | 86 (78.9%) | 23 (21.1%) |
| 35 to 44 Years | 259 (87.5%) | 37 (12.5%) |
| 45 to 54 Years | 246 (88.5%) | 32 (11.5%) |
| 55 to 64 Years | 268 (100.0%) | 0 (0.0%) |
| 65 to 74 Years | 253 (100.0%) | 0 (0.0%) |
| 75 Years and older | 47 (100.0%) | 0 (0.0%) |
| Total | 2,025 (90.6%) | 209 (9.4%) |
Health Insurance Coverage by Citizenship Status in Carlin
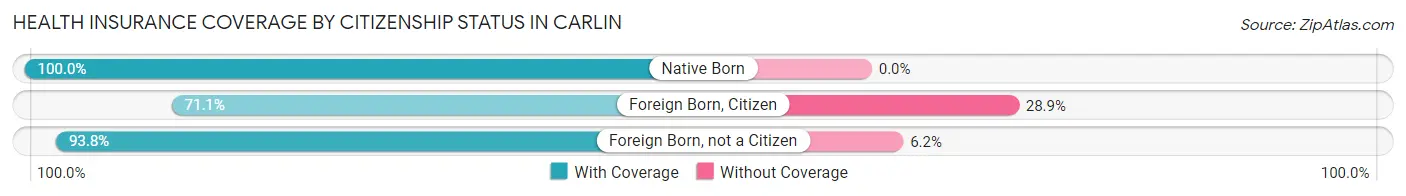
| Citizenship Status | With Coverage | Without Coverage |
| Native Born | 221 (100.0%) | 0 (0.0%) |
| Foreign Born, Citizen | 219 (71.1%) | 89 (28.9%) |
| Foreign Born, not a Citizen | 426 (93.8%) | 28 (6.2%) |
Health Insurance Coverage by Household Income in Carlin
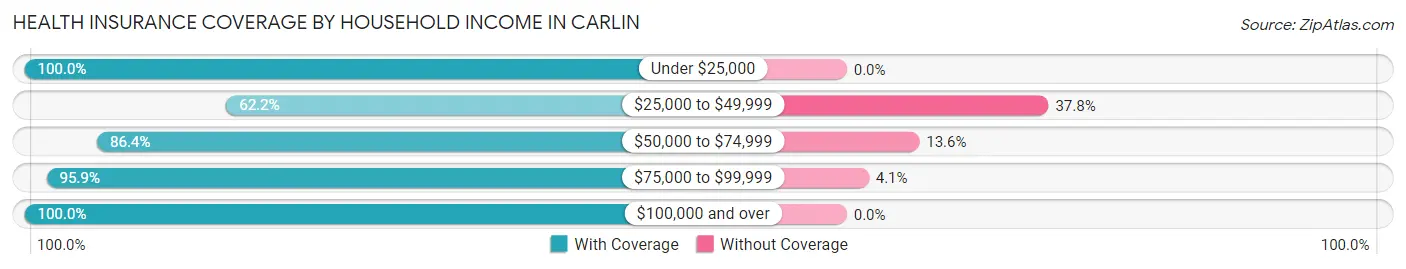
| Household Income | With Coverage | Without Coverage |
| Under $25,000 | 80 (100.0%) | 0 (0.0%) |
| $25,000 to $49,999 | 186 (62.2%) | 113 (37.8%) |
| $50,000 to $74,999 | 426 (86.4%) | 67 (13.6%) |
| $75,000 to $99,999 | 652 (95.9%) | 28 (4.1%) |
| $100,000 and over | 670 (100.0%) | 0 (0.0%) |
Public vs Private Health Insurance Coverage by Age in Carlin
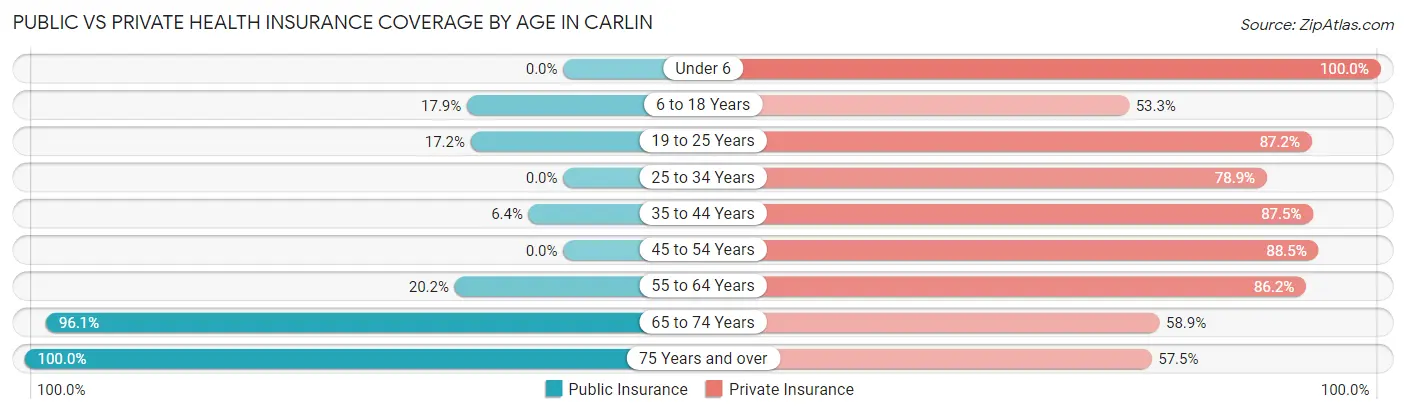
| Age Bracket | Public Insurance | Private Insurance |
| Under 6 | 0 (0.0%) | 221 (100.0%) |
| 6 to 18 Years | 55 (17.9%) | 164 (53.2%) |
| 19 to 25 Years | 78 (17.2%) | 396 (87.2%) |
| 25 to 34 Years | 0 (0.0%) | 86 (78.9%) |
| 35 to 44 Years | 19 (6.4%) | 259 (87.5%) |
| 45 to 54 Years | 0 (0.0%) | 246 (88.5%) |
| 55 to 64 Years | 54 (20.2%) | 231 (86.2%) |
| 65 to 74 Years | 243 (96.1%) | 149 (58.9%) |
| 75 Years and over | 47 (100.0%) | 27 (57.5%) |
| Total | 496 (22.2%) | 1,779 (79.6%) |
Disability Status by Sex by Age in Carlin
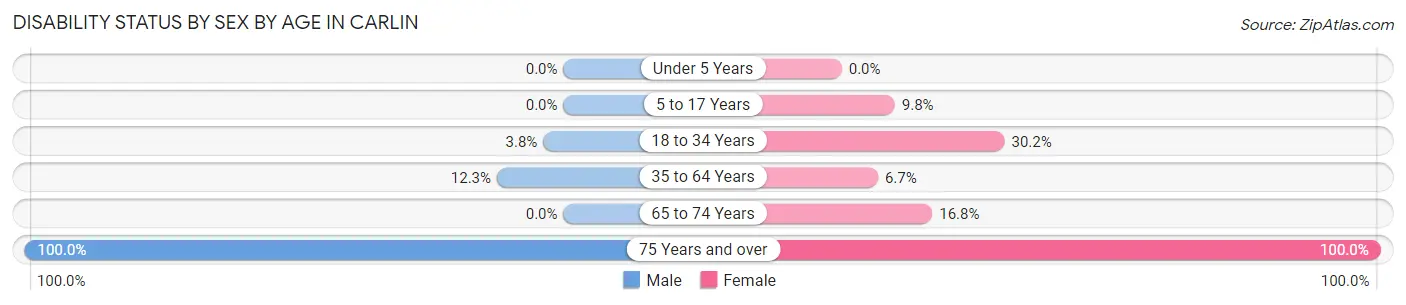
| Age Bracket | Male | Female |
| Under 5 Years | 0 (0.0%) | 0 (0.0%) |
| 5 to 17 Years | 0 (0.0%) | 18 (9.8%) |
| 18 to 34 Years | 11 (3.7%) | 87 (30.2%) |
| 35 to 64 Years | 47 (12.3%) | 31 (6.7%) |
| 65 to 74 Years | 0 (0.0%) | 21 (16.8%) |
| 75 Years and over | 20 (100.0%) | 27 (100.0%) |
Disability Class by Sex by Age in Carlin
Disability Class: Hearing Difficulty
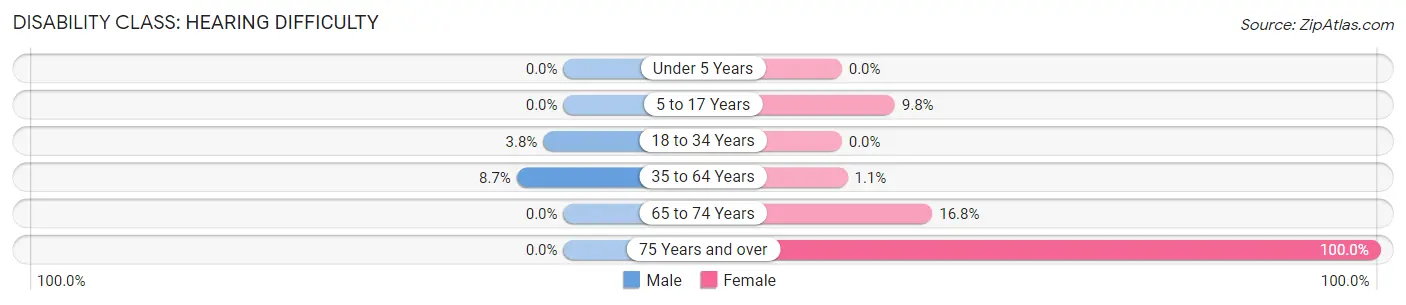
| Age Bracket | Male | Female |
| Under 5 Years | 0 (0.0%) | 0 (0.0%) |
| 5 to 17 Years | 0 (0.0%) | 18 (9.8%) |
| 18 to 34 Years | 11 (3.7%) | 0 (0.0%) |
| 35 to 64 Years | 33 (8.7%) | 5 (1.1%) |
| 65 to 74 Years | 0 (0.0%) | 21 (16.8%) |
| 75 Years and over | 0 (0.0%) | 27 (100.0%) |
Disability Class: Vision Difficulty
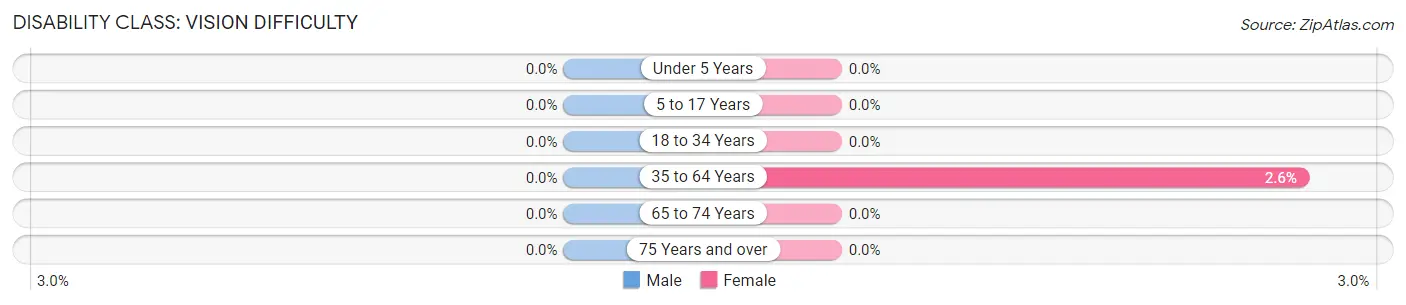
| Age Bracket | Male | Female |
| Under 5 Years | 0 (0.0%) | 0 (0.0%) |
| 5 to 17 Years | 0 (0.0%) | 0 (0.0%) |
| 18 to 34 Years | 0 (0.0%) | 0 (0.0%) |
| 35 to 64 Years | 0 (0.0%) | 12 (2.6%) |
| 65 to 74 Years | 0 (0.0%) | 0 (0.0%) |
| 75 Years and over | 0 (0.0%) | 0 (0.0%) |
Disability Class: Cognitive Difficulty
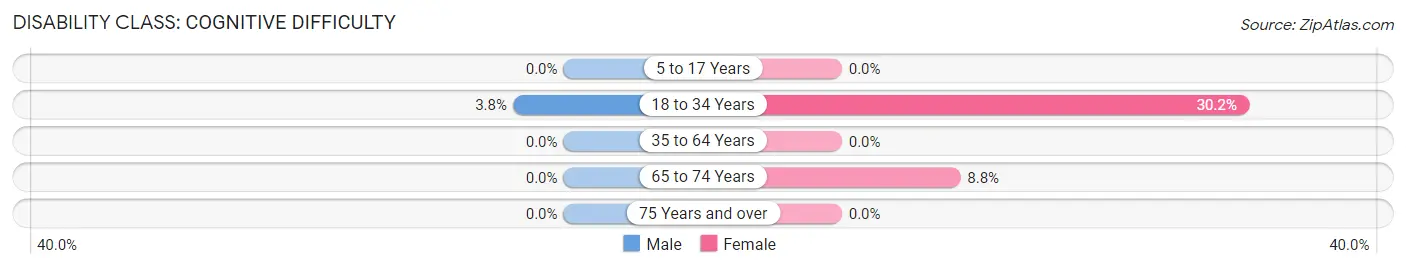
| Age Bracket | Male | Female |
| 5 to 17 Years | 0 (0.0%) | 0 (0.0%) |
| 18 to 34 Years | 11 (3.7%) | 87 (30.2%) |
| 35 to 64 Years | 0 (0.0%) | 0 (0.0%) |
| 65 to 74 Years | 0 (0.0%) | 11 (8.8%) |
| 75 Years and over | 0 (0.0%) | 0 (0.0%) |
Disability Class: Ambulatory Difficulty
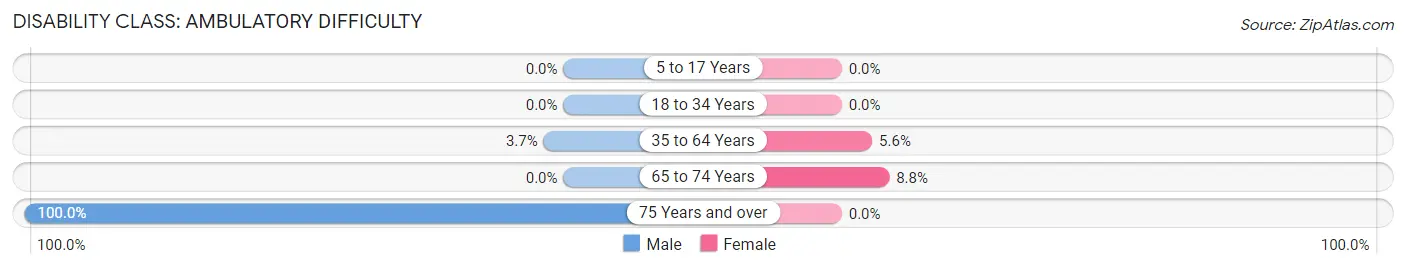
| Age Bracket | Male | Female |
| 5 to 17 Years | 0 (0.0%) | 0 (0.0%) |
| 18 to 34 Years | 0 (0.0%) | 0 (0.0%) |
| 35 to 64 Years | 14 (3.7%) | 26 (5.6%) |
| 65 to 74 Years | 0 (0.0%) | 11 (8.8%) |
| 75 Years and over | 20 (100.0%) | 0 (0.0%) |
Disability Class: Self-Care Difficulty
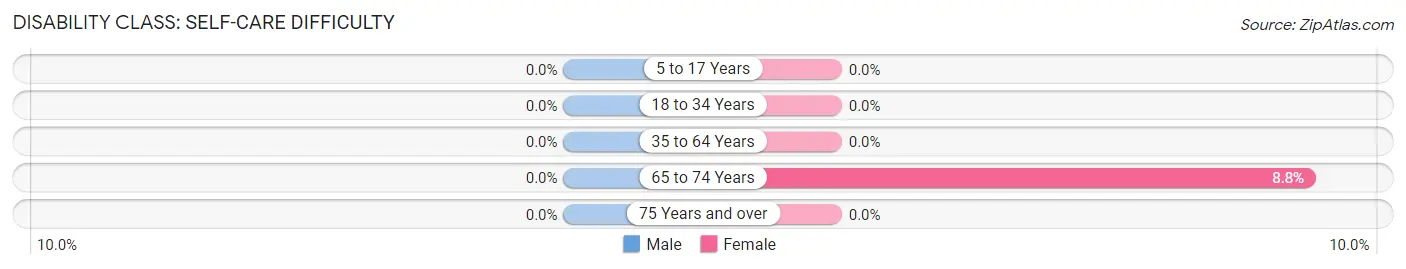
| Age Bracket | Male | Female |
| 5 to 17 Years | 0 (0.0%) | 0 (0.0%) |
| 18 to 34 Years | 0 (0.0%) | 0 (0.0%) |
| 35 to 64 Years | 0 (0.0%) | 0 (0.0%) |
| 65 to 74 Years | 0 (0.0%) | 11 (8.8%) |
| 75 Years and over | 0 (0.0%) | 0 (0.0%) |
Technology Access in Carlin
Computing Device Access in Carlin
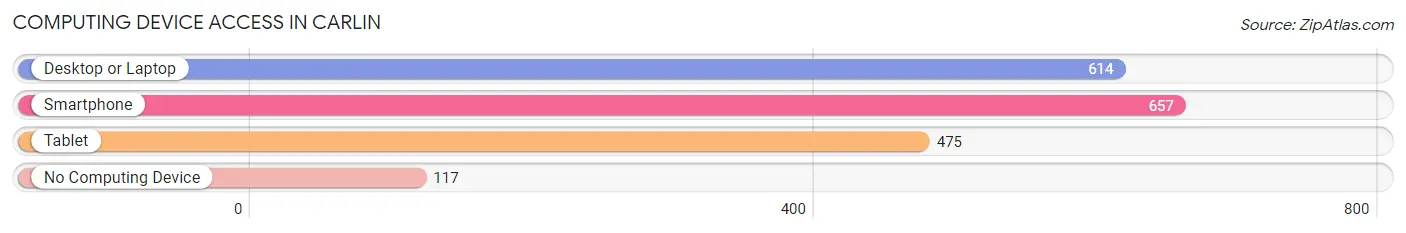
| Device Type | # Households | % Households |
| Desktop or Laptop | 614 | 73.0% |
| Smartphone | 657 | 78.1% |
| Tablet | 475 | 56.5% |
| No Computing Device | 117 | 13.9% |
| Total | 841 | 100.0% |
Internet Access in Carlin
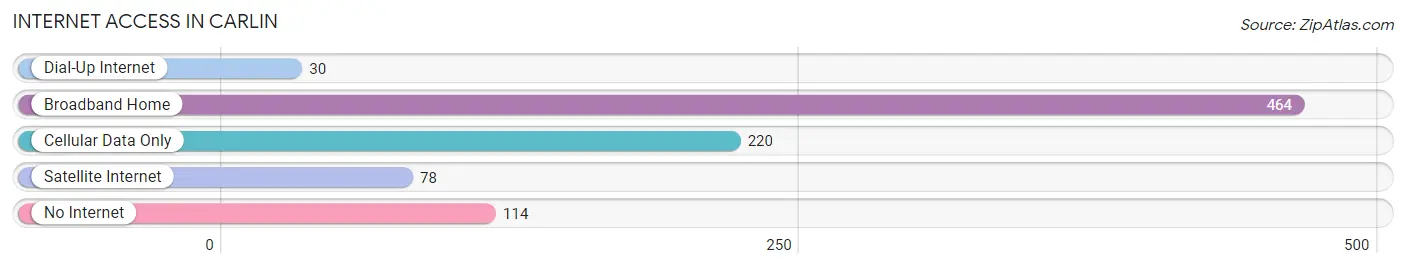
| Internet Type | # Households | % Households |
| Dial-Up Internet | 30 | 3.6% |
| Broadband Home | 464 | 55.2% |
| Cellular Data Only | 220 | 26.2% |
| Satellite Internet | 78 | 9.3% |
| No Internet | 114 | 13.6% |
| Total | 841 | 100.0% |
Carlin Summary
Carlin, Nevada is a small city located in Elko County, in the northeastern part of the state. It is situated along Interstate 80, about 25 miles west of Elko, the county seat. The city was founded in 1868 and incorporated in 1917. As of the 2010 census, the population of Carlin was 2,368.
History
The area around Carlin was first inhabited by the Northern Paiute people, who lived in the area for centuries before the arrival of European settlers. The first Europeans to settle in the area were miners, who arrived in the 1860s in search of gold. The town of Carlin was founded in 1868 and named after Civil War General William Passmore Carlin.
In the late 19th century, the town became a major hub for the Central Pacific Railroad, which ran through the area. The railroad brought in a large number of Chinese immigrants, who worked on the railroad and in the mines. The Chinese population of Carlin peaked in the early 20th century, but declined after the passage of the Chinese Exclusion Act in 1882.
In the early 20th century, Carlin became a major center for the mining industry. The town was home to several large gold mines, including the Carlin Gold Mine, which was the first large-scale open-pit gold mine in the United States. The mine was in operation from 1965 to 1994, and produced over 40 million ounces of gold.
Geography
Carlin is located in Elko County, in the northeastern part of Nevada. It is situated along Interstate 80, about 25 miles west of Elko, the county seat. The city is located in the Humboldt River Valley, at an elevation of 5,000 feet. The city covers an area of 4.2 square miles, and has a population density of 562 people per square mile.
The climate in Carlin is semi-arid, with hot summers and cold winters. The average annual temperature is 50 degrees Fahrenheit, and the average annual precipitation is 8.5 inches.
Economy
The economy of Carlin is largely based on mining and tourism. The city is home to several large gold mines, including the Carlin Gold Mine, which was the first large-scale open-pit gold mine in the United States. The mine was in operation from 1965 to 1994, and produced over 40 million ounces of gold.
The city is also a popular tourist destination, due to its proximity to the Ruby Mountains and the Humboldt National Forest. The city is home to several hotels and restaurants, as well as a casino.
Demographics
As of the 2010 census, the population of Carlin was 2,368. The racial makeup of the city was 91.3% White, 0.7% African American, 0.7% Native American, 0.3% Asian, 0.1% Pacific Islander, 4.3% from other races, and 2.6% from two or more races. Hispanic or Latino of any race were 11.2% of the population.
The median household income in Carlin was $45,938, and the median family income was $51,964. The per capita income in Carlin was $20,945. About 11.2% of families and 14.2% of the population were below the poverty line, including 17.2% of those under age 18 and 8.3% of those age 65 or over.
Common Questions
What is Per Capita Income in Carlin?
Per Capita income in Carlin is $31,916.
What is the Median Family Income in Carlin?
Median Family Income in Carlin is $95,652.
What is the Median Household income in Carlin?
Median Household Income in Carlin is $68,207.
What is Income or Wage Gap in Carlin?
Income or Wage Gap in Carlin is 15.6%.
Women in Carlin earn 84.4 cents for every dollar earned by a man.
What is Inequality or Gini Index in Carlin?
Inequality or Gini Index in Carlin is 0.31.
What is the Total Population of Carlin?
Total Population of Carlin is 2,366.
What is the Total Male Population of Carlin?
Total Male Population of Carlin is 1,198.
What is the Total Female Population of Carlin?
Total Female Population of Carlin is 1,168.
What is the Ratio of Males per 100 Females in Carlin?
There are 102.57 Males per 100 Females in Carlin.
What is the Ratio of Females per 100 Males in Carlin?
There are 97.50 Females per 100 Males in Carlin.
What is the Median Population Age in Carlin?
Median Population Age in Carlin is 36.3 Years.
What is the Average Family Size in Carlin
Average Family Size in Carlin is 2.9 People.
What is the Average Household Size in Carlin
Average Household Size in Carlin is 2.6 People.
How Large is the Labor Force in Carlin?
There are 1,248 People in the Labor Forcein in Carlin.
What is the Percentage of People in the Labor Force in Carlin?
65.6% of People are in the Labor Force in Carlin.
What is the Unemployment Rate in Carlin?
Unemployment Rate in Carlin is 5.0%.