Beverly Hills, CA Map & Demographics
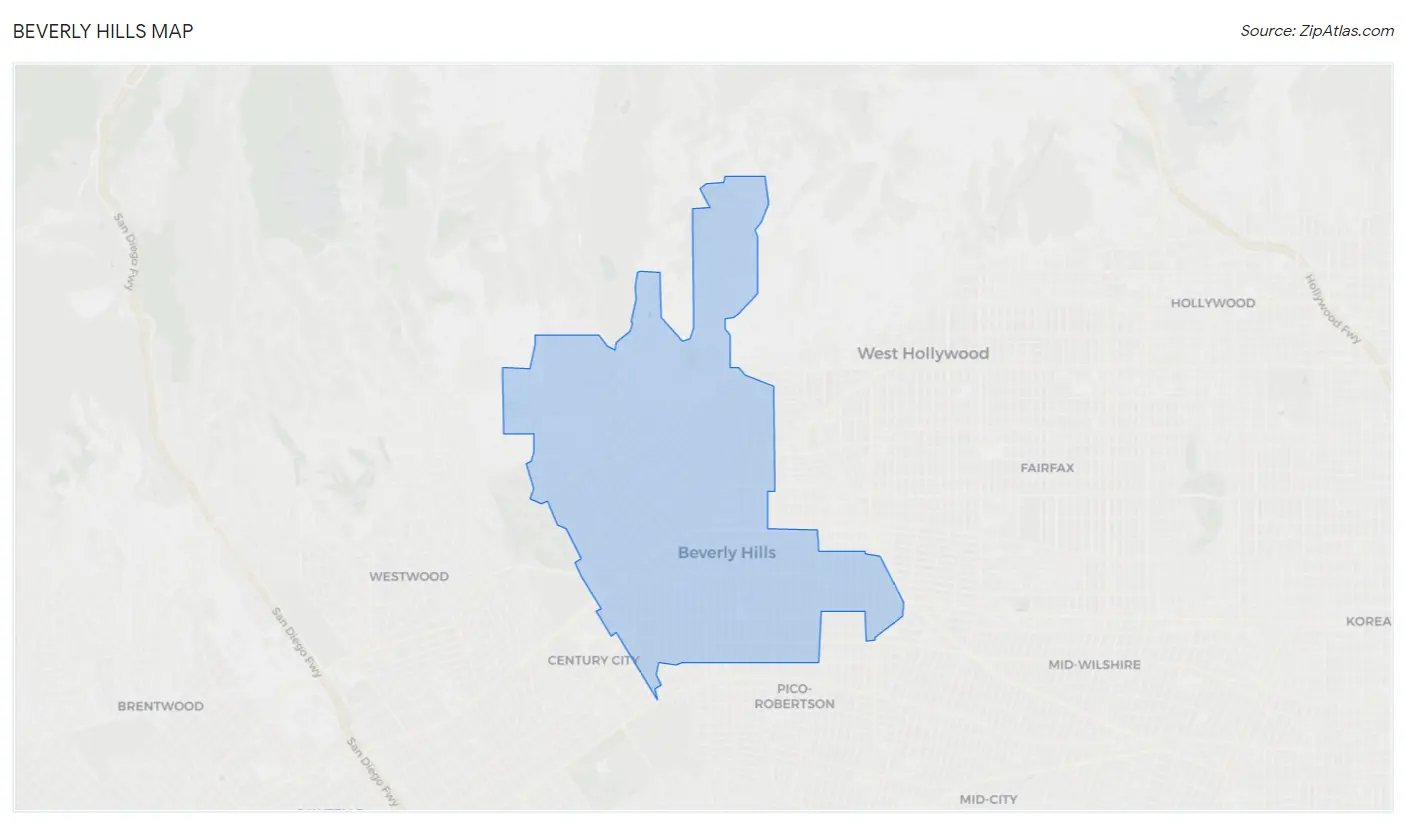
Beverly Hills Map
Beverly Hills Overview
$103,693
PER CAPITA INCOME
$181,600
AVG FAMILY INCOME
$116,771
AVG HOUSEHOLD INCOME
34.5%
WAGE / INCOME GAP [ % ]
65.5¢/ $1
WAGE / INCOME GAP [ $ ]
$13,128
FAMILY INCOME DEFICIT
0.61
INEQUALITY / GINI INDEX
32,406
TOTAL POPULATION
14,907
MALE POPULATION
17,499
FEMALE POPULATION
85.19
MALES / 100 FEMALES
117.39
FEMALES / 100 MALES
47.5
MEDIAN AGE
3.1
AVG FAMILY SIZE
2.3
AVG HOUSEHOLD SIZE
16,454
LABOR FORCE [ PEOPLE ]
58.7%
PERCENT IN LABOR FORCE
8.6%
UNEMPLOYMENT RATE
Income in Beverly Hills
Income Overview in Beverly Hills
Per Capita Income in Beverly Hills is $103,693, while median incomes of families and households are $181,600 and $116,771 respectively.
| Characteristic | Number | Measure |
| Per Capita Income | 32,406 | $103,693 |
| Median Family Income | 7,852 | $181,600 |
| Mean Family Income | 7,852 | $329,268 |
| Median Household Income | 14,338 | $116,771 |
| Mean Household Income | 14,338 | $231,793 |
| Income Deficit | 7,852 | $13,128 |
| Wage / Income Gap (%) | 32,406 | 34.45% |
| Wage / Income Gap ($) | 32,406 | 65.55¢ per $1 |
| Gini / Inequality Index | 32,406 | 0.61 |
Earnings by Sex in Beverly Hills
Average Earnings in Beverly Hills are $65,384, $81,755 for men and $53,587 for women, a difference of 34.4%.
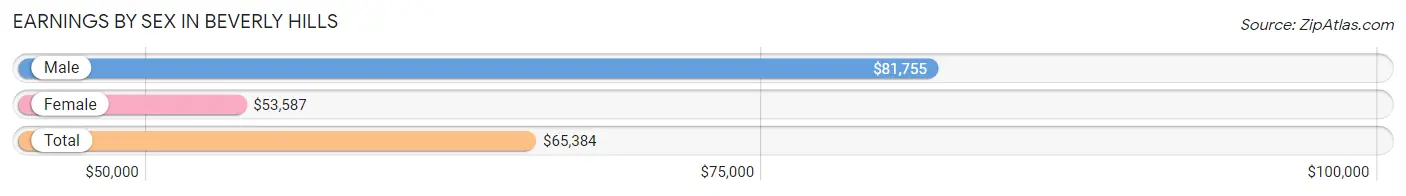
| Sex | Number | Average Earnings |
| Male | 8,852 (51.0%) | $81,755 |
| Female | 8,510 (49.0%) | $53,587 |
| Total | 17,362 (100.0%) | $65,384 |
Earnings by Sex by Income Bracket in Beverly Hills
The most common earnings brackets in Beverly Hills are $100,000+ for men (3,837 | 43.3%) and $100,000+ for women (2,297 | 27.0%).
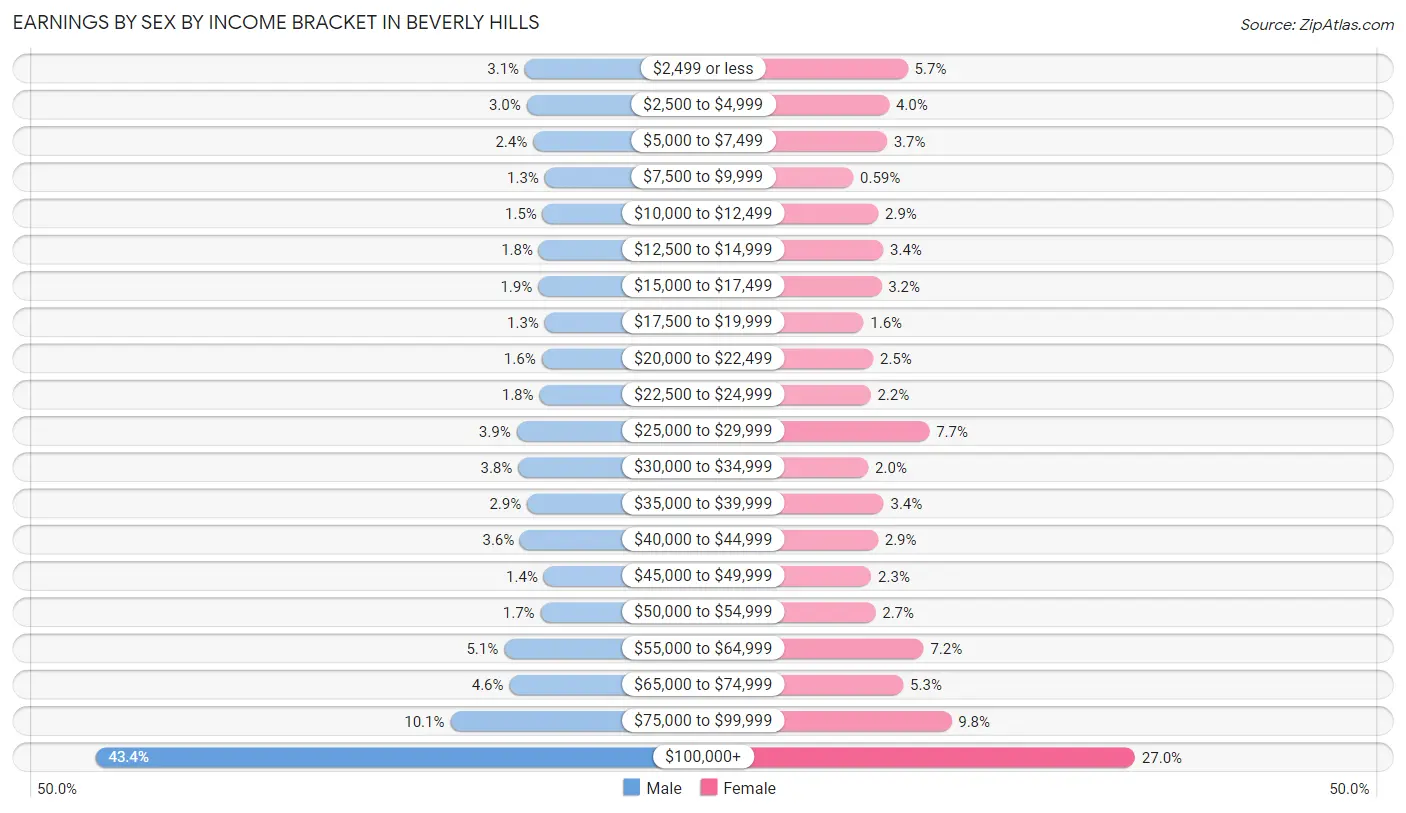
| Income | Male | Female |
| $2,499 or less | 277 (3.1%) | 485 (5.7%) |
| $2,500 to $4,999 | 264 (3.0%) | 336 (4.0%) |
| $5,000 to $7,499 | 210 (2.4%) | 318 (3.7%) |
| $7,500 to $9,999 | 113 (1.3%) | 50 (0.6%) |
| $10,000 to $12,499 | 130 (1.5%) | 249 (2.9%) |
| $12,500 to $14,999 | 162 (1.8%) | 289 (3.4%) |
| $15,000 to $17,499 | 168 (1.9%) | 275 (3.2%) |
| $17,500 to $19,999 | 113 (1.3%) | 132 (1.5%) |
| $20,000 to $22,499 | 140 (1.6%) | 209 (2.5%) |
| $22,500 to $24,999 | 158 (1.8%) | 189 (2.2%) |
| $25,000 to $29,999 | 347 (3.9%) | 657 (7.7%) |
| $30,000 to $34,999 | 334 (3.8%) | 170 (2.0%) |
| $35,000 to $39,999 | 259 (2.9%) | 293 (3.4%) |
| $40,000 to $44,999 | 317 (3.6%) | 247 (2.9%) |
| $45,000 to $49,999 | 121 (1.4%) | 194 (2.3%) |
| $50,000 to $54,999 | 149 (1.7%) | 227 (2.7%) |
| $55,000 to $64,999 | 451 (5.1%) | 611 (7.2%) |
| $65,000 to $74,999 | 406 (4.6%) | 449 (5.3%) |
| $75,000 to $99,999 | 896 (10.1%) | 833 (9.8%) |
| $100,000+ | 3,837 (43.3%) | 2,297 (27.0%) |
| Total | 8,852 (100.0%) | 8,510 (100.0%) |
Earnings by Sex by Educational Attainment in Beverly Hills
Average earnings in Beverly Hills are $87,500 for men and $56,910 for women, a difference of 35.0%. Men with an educational attainment of graduate degree enjoy the highest average annual earnings of $139,536, while those with less than high school education earn the least with $37,019. Women with an educational attainment of graduate degree earn the most with the average annual earnings of $80,417, while those with high school diploma education have the smallest earnings of $29,597.
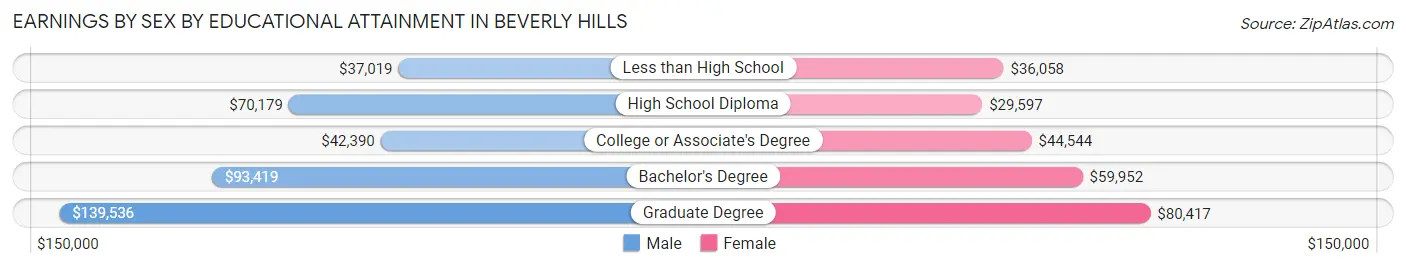
| Educational Attainment | Male Income | Female Income |
| Less than High School | $37,019 | $36,058 |
| High School Diploma | $70,179 | $29,597 |
| College or Associate's Degree | $42,390 | $44,544 |
| Bachelor's Degree | $93,419 | $59,952 |
| Graduate Degree | $139,536 | $80,417 |
| Total | $87,500 | $56,910 |
Family Income in Beverly Hills
Family Income Brackets in Beverly Hills
According to the Beverly Hills family income data, there are 3,596 families falling into the $200,000+ income range, which is the most common income bracket and makes up 45.8% of all families. Conversely, the $25,000 to $34,999 income bracket is the least frequent group with only 126 families (1.6%) belonging to this category.
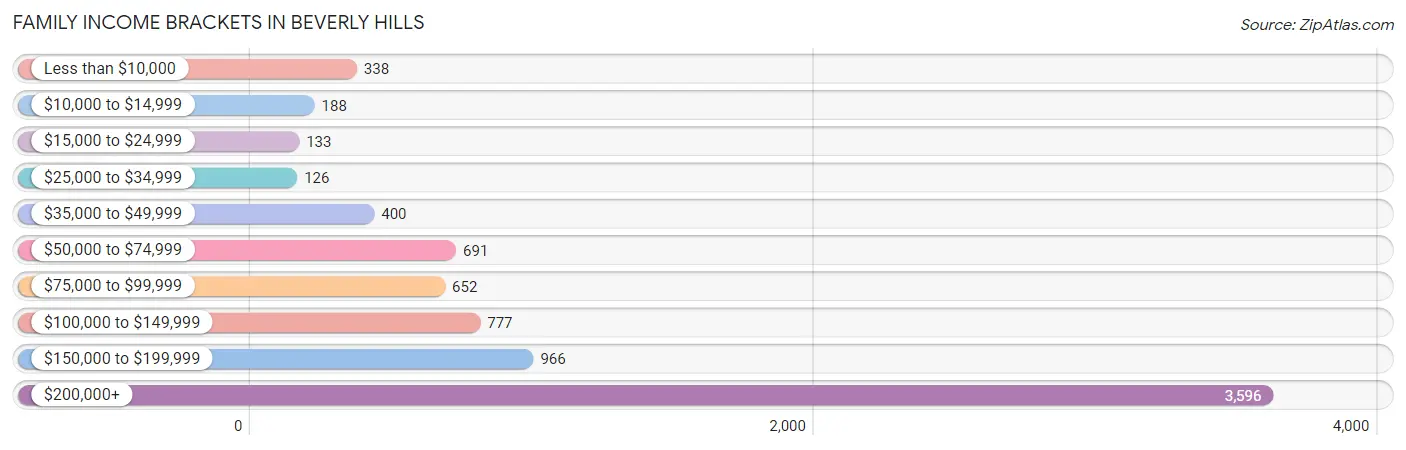
| Income Bracket | # Families | % Families |
| Less than $10,000 | 338 | 4.3% |
| $10,000 to $14,999 | 188 | 2.4% |
| $15,000 to $24,999 | 133 | 1.7% |
| $25,000 to $34,999 | 126 | 1.6% |
| $35,000 to $49,999 | 400 | 5.1% |
| $50,000 to $74,999 | 691 | 8.8% |
| $75,000 to $99,999 | 652 | 8.3% |
| $100,000 to $149,999 | 777 | 9.9% |
| $150,000 to $199,999 | 966 | 12.3% |
| $200,000+ | 3,596 | 45.8% |
Family Income by Famaliy Size in Beverly Hills
4-person families (1,377 | 17.5%) account for the highest median family income in Beverly Hills with $195,954 per family, while 2-person families (3,735 | 47.6%) have the highest median income of $92,820 per family member.
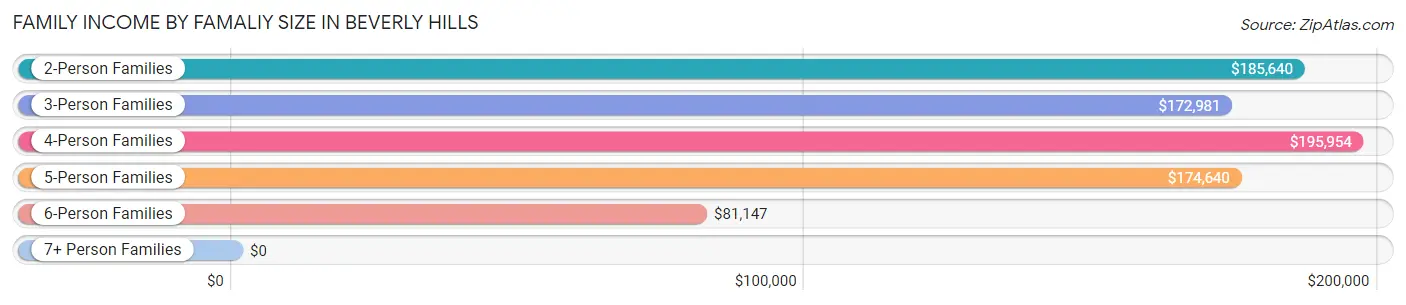
| Income Bracket | # Families | Median Income |
| 2-Person Families | 3,735 (47.6%) | $185,640 |
| 3-Person Families | 1,890 (24.1%) | $172,981 |
| 4-Person Families | 1,377 (17.5%) | $195,954 |
| 5-Person Families | 629 (8.0%) | $174,640 |
| 6-Person Families | 193 (2.5%) | $81,147 |
| 7+ Person Families | 28 (0.4%) | $0 |
| Total | 7,852 (100.0%) | $181,600 |
Family Income by Number of Earners in Beverly Hills
The median family income in Beverly Hills is $181,600, with families comprising 3+ earners (705) having the highest median family income of $226,950, while families with no earners (1,092) have the lowest median family income of $72,123, accounting for 9.0% and 13.9% of families, respectively.
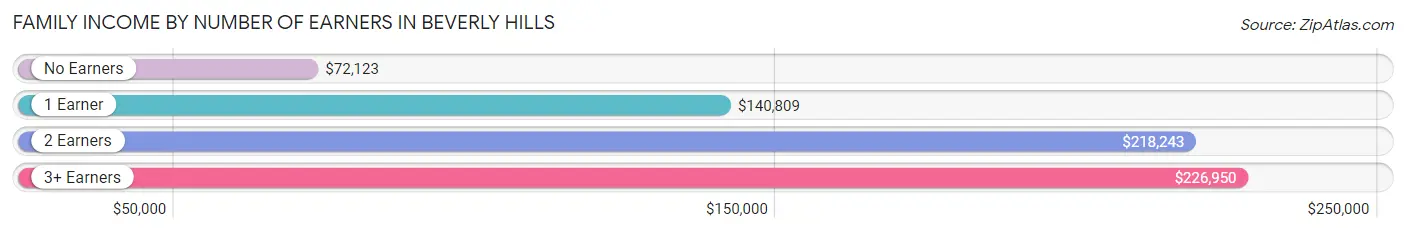
| Number of Earners | # Families | Median Income |
| No Earners | 1,092 (13.9%) | $72,123 |
| 1 Earner | 3,229 (41.1%) | $140,809 |
| 2 Earners | 2,826 (36.0%) | $218,243 |
| 3+ Earners | 705 (9.0%) | $226,950 |
| Total | 7,852 (100.0%) | $181,600 |
Household Income in Beverly Hills
Household Income Brackets in Beverly Hills
With 4,559 households falling in the category, the $200,000+ income range is the most frequent in Beverly Hills, accounting for 31.8% of all households. In contrast, only 502 households (3.5%) fall into the $15,000 to $24,999 income bracket, making it the least populous group.
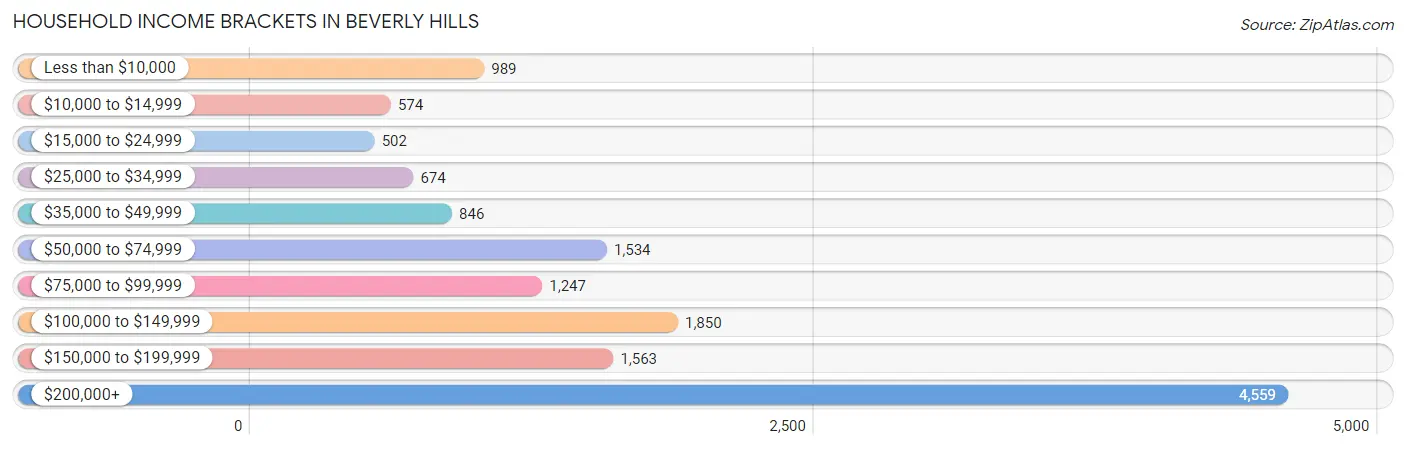
| Income Bracket | # Households | % Households |
| Less than $10,000 | 989 | 6.9% |
| $10,000 to $14,999 | 574 | 4.0% |
| $15,000 to $24,999 | 502 | 3.5% |
| $25,000 to $34,999 | 674 | 4.7% |
| $35,000 to $49,999 | 846 | 5.9% |
| $50,000 to $74,999 | 1,534 | 10.7% |
| $75,000 to $99,999 | 1,247 | 8.7% |
| $100,000 to $149,999 | 1,850 | 12.9% |
| $150,000 to $199,999 | 1,563 | 10.9% |
| $200,000+ | 4,559 | 31.8% |
Household Income by Householder Age in Beverly Hills
The median household income in Beverly Hills is $116,771, with the highest median household income of $160,843 found in the 45 to 64 years age bracket for the primary householder. A total of 5,111 households (35.6%) fall into this category. Meanwhile, the 15 to 24 years age bracket for the primary householder has the lowest median household income of $0, with 97 households (0.7%) in this group.
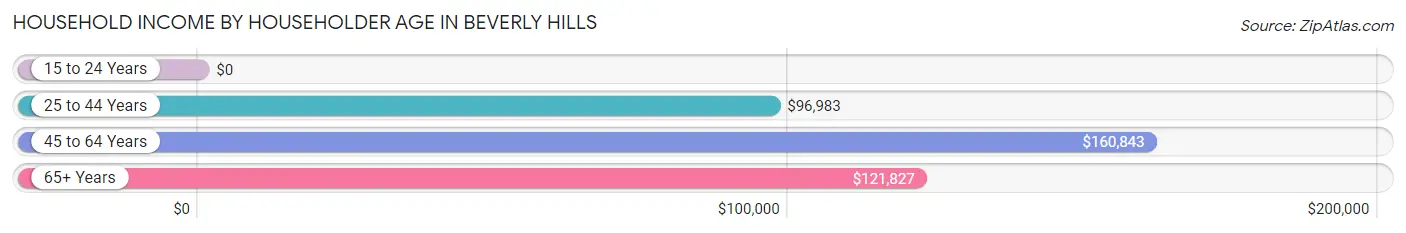
| Income Bracket | # Households | Median Income |
| 15 to 24 Years | 97 (0.7%) | $0 |
| 25 to 44 Years | 3,920 (27.3%) | $96,983 |
| 45 to 64 Years | 5,111 (35.6%) | $160,843 |
| 65+ Years | 5,210 (36.3%) | $121,827 |
| Total | 14,338 (100.0%) | $116,771 |
Poverty in Beverly Hills
Income Below Poverty by Sex and Age in Beverly Hills
With 9.3% poverty level for males and 10.9% for females among the residents of Beverly Hills, 16 and 17 year old males and 16 and 17 year old females are the most vulnerable to poverty, with 100 males (16.5%) and 143 females (20.7%) in their respective age groups living below the poverty level.
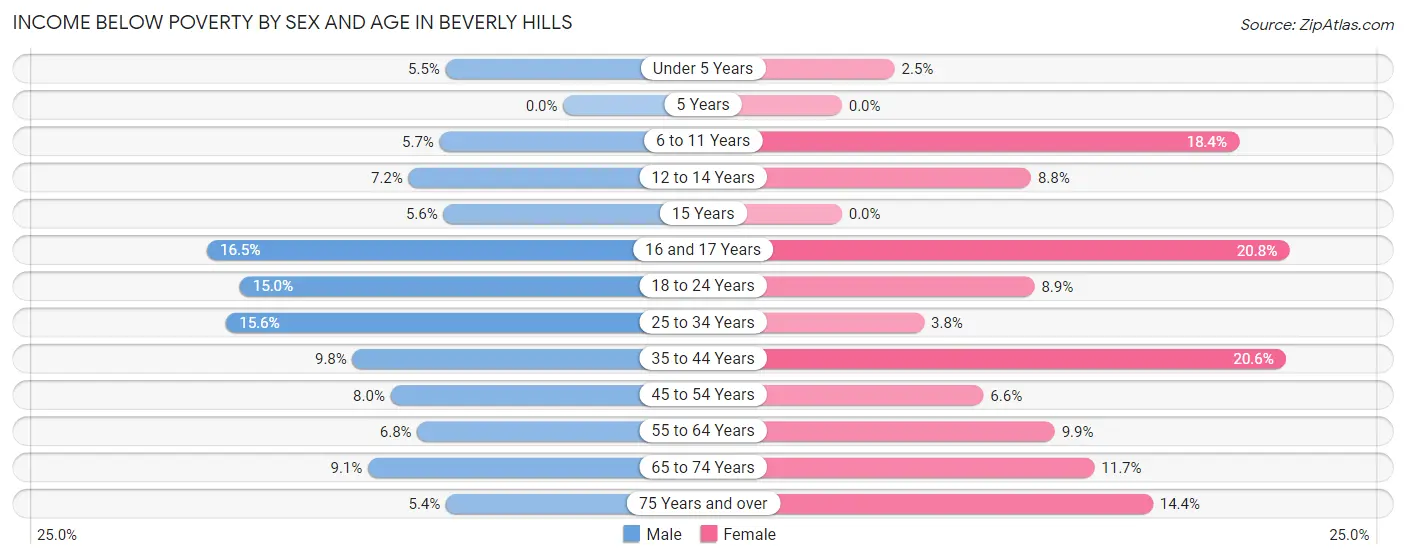
| Age Bracket | Male | Female |
| Under 5 Years | 25 (5.5%) | 10 (2.5%) |
| 5 Years | 0 (0.0%) | 0 (0.0%) |
| 6 to 11 Years | 41 (5.7%) | 138 (18.4%) |
| 12 to 14 Years | 52 (7.2%) | 75 (8.8%) |
| 15 Years | 11 (5.6%) | 0 (0.0%) |
| 16 and 17 Years | 100 (16.5%) | 143 (20.7%) |
| 18 to 24 Years | 149 (15.0%) | 80 (8.9%) |
| 25 to 34 Years | 263 (15.6%) | 85 (3.8%) |
| 35 to 44 Years | 185 (9.8%) | 404 (20.6%) |
| 45 to 54 Years | 152 (8.0%) | 191 (6.6%) |
| 55 to 64 Years | 147 (6.8%) | 224 (9.9%) |
| 65 to 74 Years | 170 (9.1%) | 241 (11.7%) |
| 75 Years and over | 91 (5.4%) | 317 (14.4%) |
| Total | 1,386 (9.3%) | 1,908 (10.9%) |
Income Above Poverty by Sex and Age in Beverly Hills
According to the poverty statistics in Beverly Hills, males aged 75 years and over and females aged 5 years are the age groups that are most secure financially, with 94.6% of males and 100.0% of females in these age groups living above the poverty line.
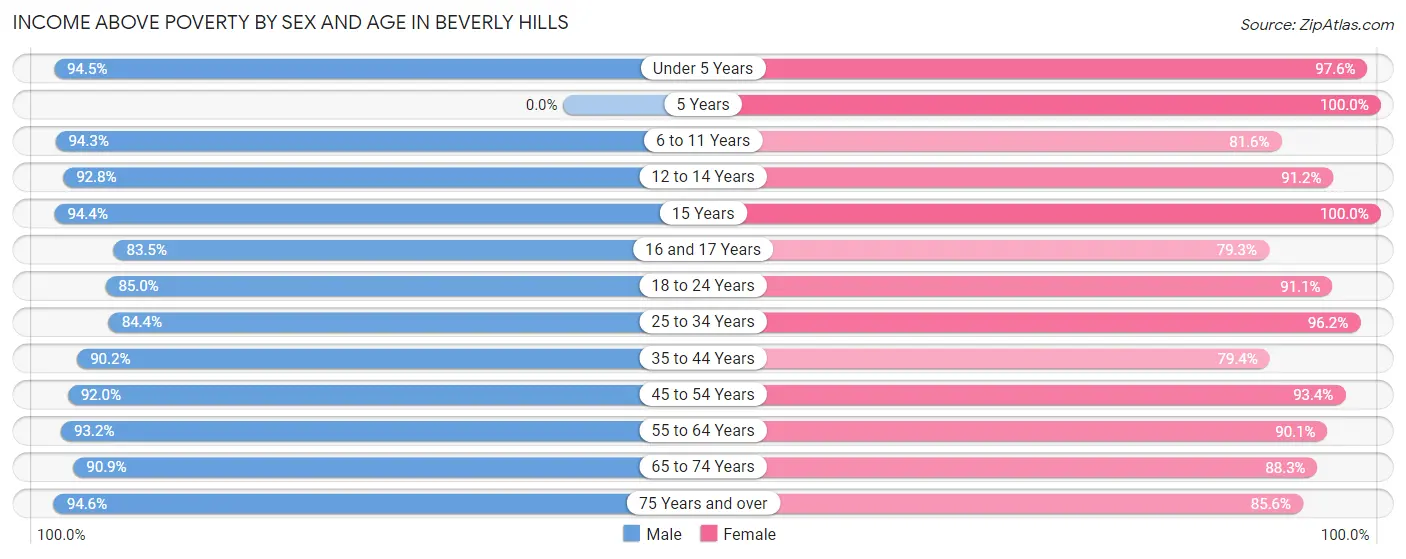
| Age Bracket | Male | Female |
| Under 5 Years | 433 (94.5%) | 398 (97.6%) |
| 5 Years | 0 (0.0%) | 136 (100.0%) |
| 6 to 11 Years | 673 (94.3%) | 611 (81.6%) |
| 12 to 14 Years | 672 (92.8%) | 779 (91.2%) |
| 15 Years | 187 (94.4%) | 134 (100.0%) |
| 16 and 17 Years | 505 (83.5%) | 546 (79.2%) |
| 18 to 24 Years | 844 (85.0%) | 815 (91.1%) |
| 25 to 34 Years | 1,419 (84.4%) | 2,140 (96.2%) |
| 35 to 44 Years | 1,707 (90.2%) | 1,558 (79.4%) |
| 45 to 54 Years | 1,746 (92.0%) | 2,715 (93.4%) |
| 55 to 64 Years | 2,024 (93.2%) | 2,043 (90.1%) |
| 65 to 74 Years | 1,707 (90.9%) | 1,816 (88.3%) |
| 75 Years and over | 1,582 (94.6%) | 1,880 (85.6%) |
| Total | 13,499 (90.7%) | 15,571 (89.1%) |
Income Below Poverty Among Married-Couple Families in Beverly Hills
The poverty statistics for married-couple families in Beverly Hills show that 6.1% or 392 of the total 6,374 families live below the poverty line. Families with 1 or 2 children have the highest poverty rate of 12.4%, comprising of 242 families. On the other hand, families with 5 or more children have the lowest poverty rate of 0.0%, which includes 0 families.
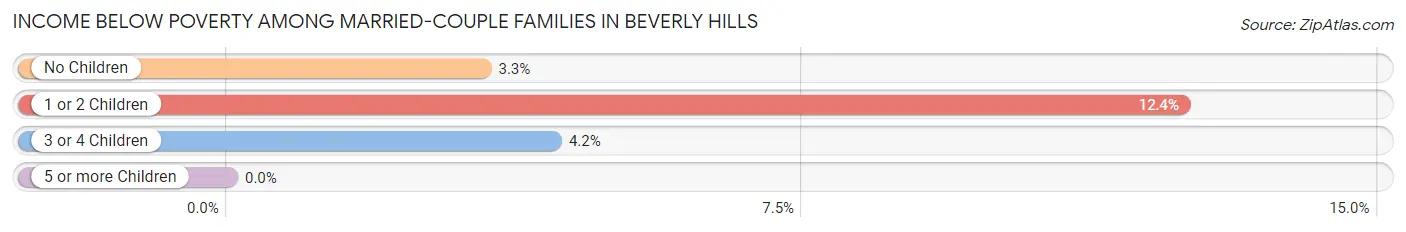
| Children | Above Poverty | Below Poverty |
| No Children | 3,882 (96.7%) | 133 (3.3%) |
| 1 or 2 Children | 1,704 (87.6%) | 242 (12.4%) |
| 3 or 4 Children | 385 (95.8%) | 17 (4.2%) |
| 5 or more Children | 11 (100.0%) | 0 (0.0%) |
| Total | 5,982 (93.9%) | 392 (6.1%) |
Income Below Poverty Among Single-Parent Households in Beverly Hills
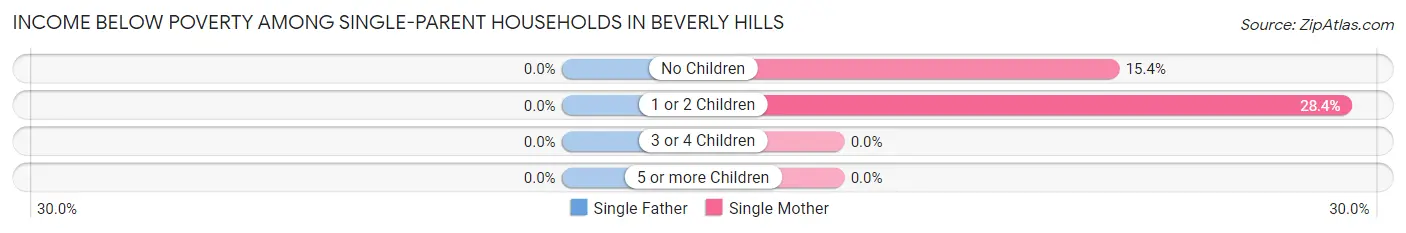
| Children | Single Father | Single Mother |
| No Children | 0 (0.0%) | 75 (15.4%) |
| 1 or 2 Children | 0 (0.0%) | 133 (28.4%) |
| 3 or 4 Children | 0 (0.0%) | 0 (0.0%) |
| 5 or more Children | 0 (0.0%) | 0 (0.0%) |
| Total | 0 (0.0%) | 208 (21.0%) |
Income Below Poverty Among Married-Couple vs Single-Parent Households in Beverly Hills
The poverty data for Beverly Hills shows that 392 of the married-couple family households (6.1%) and 208 of the single-parent households (14.1%) are living below the poverty level. Within the married-couple family households, those with 1 or 2 children have the highest poverty rate, with 242 households (12.4%) falling below the poverty line. Among the single-parent households, those with 1 or 2 children have the highest poverty rate, with 133 household (18.4%) living below poverty.
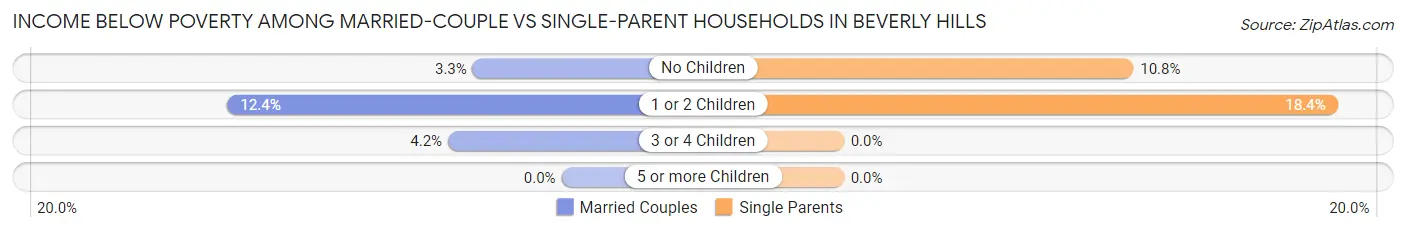
| Children | Married-Couple Families | Single-Parent Households |
| No Children | 133 (3.3%) | 75 (10.8%) |
| 1 or 2 Children | 242 (12.4%) | 133 (18.4%) |
| 3 or 4 Children | 17 (4.2%) | 0 (0.0%) |
| 5 or more Children | 0 (0.0%) | 0 (0.0%) |
| Total | 392 (6.1%) | 208 (14.1%) |
Race in Beverly Hills
The most populous races in Beverly Hills are White / Caucasian (24,647 | 76.1%), Asian (3,930 | 12.1%), and Hispanic or Latino (2,297 | 7.1%).
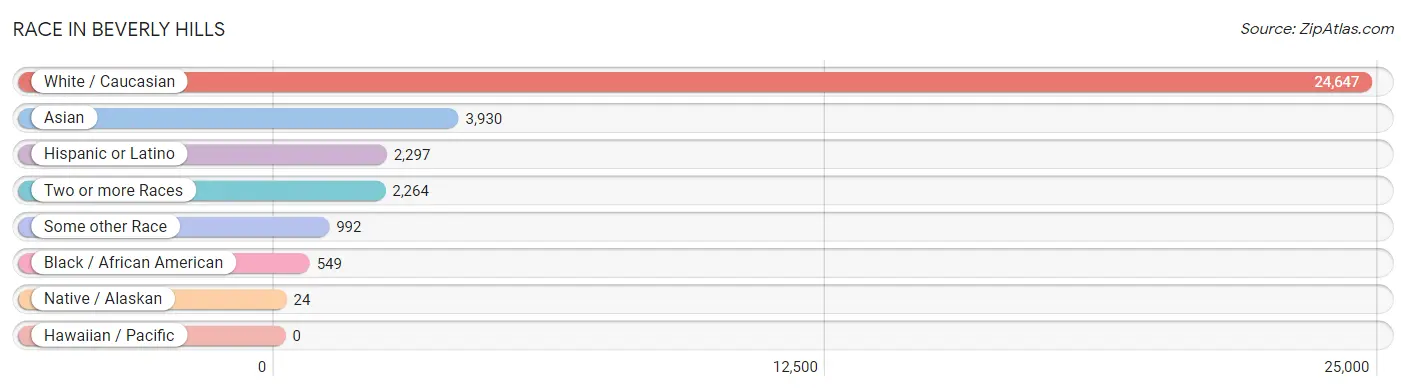
| Race | # Population | % Population |
| Asian | 3,930 | 12.1% |
| Black / African American | 549 | 1.7% |
| Hawaiian / Pacific | 0 | 0.0% |
| Hispanic or Latino | 2,297 | 7.1% |
| Native / Alaskan | 24 | 0.1% |
| White / Caucasian | 24,647 | 76.1% |
| Two or more Races | 2,264 | 7.0% |
| Some other Race | 992 | 3.1% |
| Total | 32,406 | 100.0% |
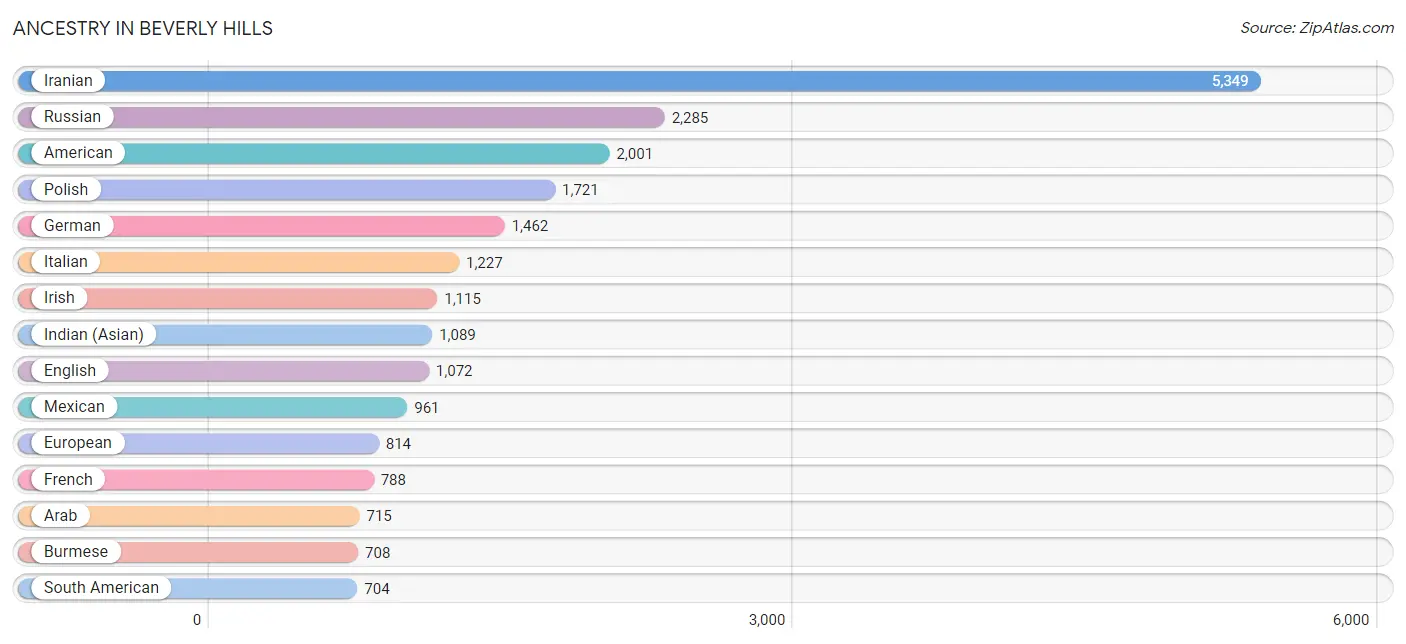
Ancestry in Beverly Hills
The most populous ancestries reported in Beverly Hills are Iranian (5,349 | 16.5%), Russian (2,285 | 7.0%), American (2,001 | 6.2%), Polish (1,721 | 5.3%), and German (1,462 | 4.5%), together accounting for 39.5% of all Beverly Hills residents.
| Ancestry | # Population | % Population |
| Afghan | 51 | 0.2% |
| African | 41 | 0.1% |
| American | 2,001 | 6.2% |
| Arab | 715 | 2.2% |
| Argentinean | 79 | 0.2% |
| Armenian | 162 | 0.5% |
| Australian | 83 | 0.3% |
| Austrian | 153 | 0.5% |
| Barbadian | 80 | 0.3% |
| Belgian | 28 | 0.1% |
| Belizean | 18 | 0.1% |
| Bhutanese | 527 | 1.6% |
| Bolivian | 11 | 0.0% |
| Brazilian | 7 | 0.0% |
| British | 178 | 0.5% |
| Bulgarian | 21 | 0.1% |
| Burmese | 708 | 2.2% |
| Canadian | 168 | 0.5% |
| Central American | 273 | 0.8% |
| Central American Indian | 17 | 0.1% |
| Cherokee | 89 | 0.3% |
| Choctaw | 8 | 0.0% |
| Colombian | 192 | 0.6% |
| Croatian | 104 | 0.3% |
| Cuban | 40 | 0.1% |
| Cypriot | 16 | 0.1% |
| Czech | 66 | 0.2% |
| Czechoslovakian | 23 | 0.1% |
| Danish | 132 | 0.4% |
| Dutch | 289 | 0.9% |
| Eastern European | 671 | 2.1% |
| Ecuadorian | 275 | 0.9% |
| English | 1,072 | 3.3% |
| European | 814 | 2.5% |
| Filipino | 42 | 0.1% |
| Finnish | 27 | 0.1% |
| French | 788 | 2.4% |
| French American Indian | 41 | 0.1% |
| French Canadian | 71 | 0.2% |
| German | 1,462 | 4.5% |
| Ghanaian | 1 | 0.0% |
| Greek | 62 | 0.2% |
| Guatemalan | 41 | 0.1% |
| Haitian | 11 | 0.0% |
| Honduran | 43 | 0.1% |
| Hungarian | 395 | 1.2% |
| Indian (Asian) | 1,089 | 3.4% |
| Iranian | 5,349 | 16.5% |
| Iraqi | 44 | 0.1% |
| Irish | 1,115 | 3.4% |
| Israeli | 527 | 1.6% |
| Italian | 1,227 | 3.8% |
| Jamaican | 38 | 0.1% |
| Korean | 483 | 1.5% |
| Laotian | 93 | 0.3% |
| Latvian | 22 | 0.1% |
| Lebanese | 83 | 0.3% |
| Lithuanian | 292 | 0.9% |
| Mexican | 961 | 3.0% |
| Moroccan | 52 | 0.2% |
| Nicaraguan | 7 | 0.0% |
| Northern European | 14 | 0.0% |
| Norwegian | 84 | 0.3% |
| Okinawan | 17 | 0.1% |
| Paiute | 16 | 0.1% |
| Pakistani | 202 | 0.6% |
| Palestinian | 43 | 0.1% |
| Peruvian | 52 | 0.2% |
| Polish | 1,721 | 5.3% |
| Portuguese | 59 | 0.2% |
| Puerto Rican | 98 | 0.3% |
| Romanian | 254 | 0.8% |
| Russian | 2,285 | 7.0% |
| Salvadoran | 171 | 0.5% |
| Samoan | 129 | 0.4% |
| Scandinavian | 16 | 0.1% |
| Scotch-Irish | 45 | 0.1% |
| Scottish | 222 | 0.7% |
| Slovak | 21 | 0.1% |
| South African | 32 | 0.1% |
| South American | 704 | 2.2% |
| Spaniard | 76 | 0.2% |
| Spanish | 48 | 0.2% |
| Sri Lankan | 53 | 0.2% |
| Subsaharan African | 75 | 0.2% |
| Swedish | 339 | 1.1% |
| Swiss | 32 | 0.1% |
| Syrian | 178 | 0.5% |
| Thai | 660 | 2.0% |
| Turkish | 188 | 0.6% |
| Ukrainian | 367 | 1.1% |
| Venezuelan | 95 | 0.3% |
| Vietnamese | 6 | 0.0% |
| Welsh | 17 | 0.1% |
| Yaqui | 6 | 0.0% |
| Yugoslavian | 33 | 0.1% | View All 96 Rows |
Immigrants in Beverly Hills
The most numerous immigrant groups reported in Beverly Hills came from Asia (8,142 | 25.1%), South Central Asia (5,204 | 16.1%), Iran (4,280 | 13.2%), Europe (2,058 | 6.4%), and Latin America (1,383 | 4.3%), together accounting for 65.0% of all Beverly Hills residents.
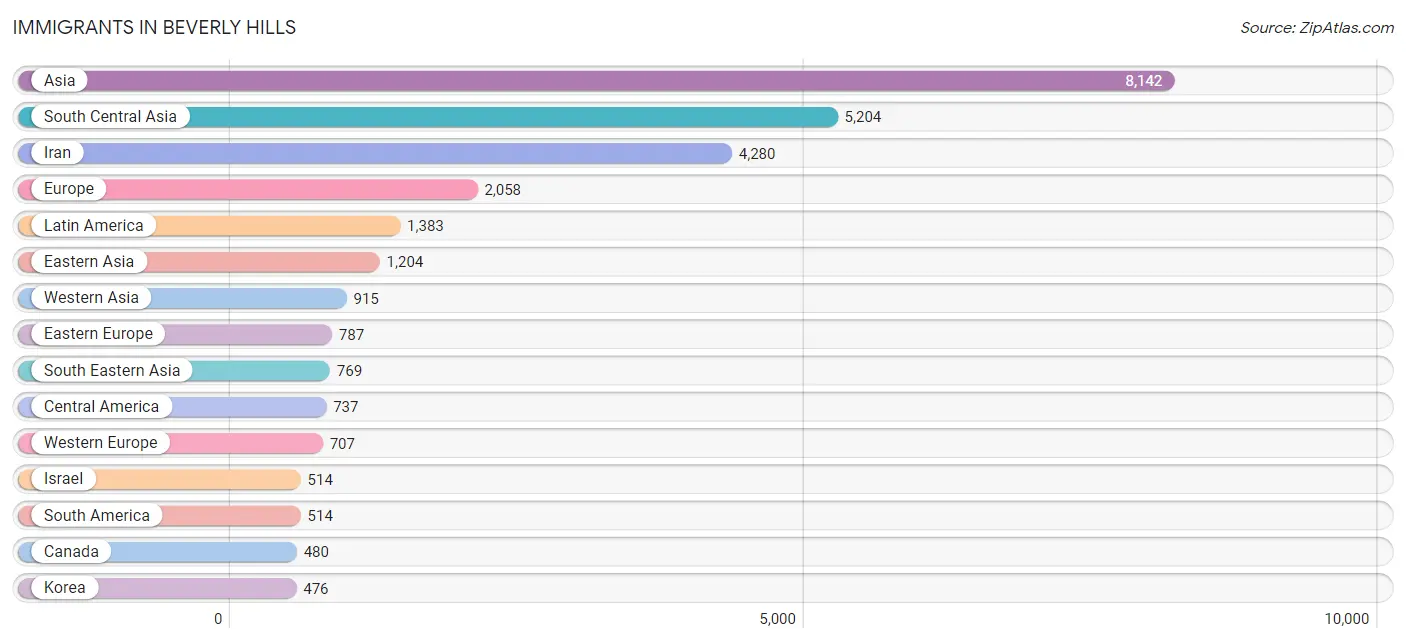
| Immigration Origin | # Population | % Population |
| Afghanistan | 211 | 0.6% |
| Africa | 162 | 0.5% |
| Argentina | 75 | 0.2% |
| Armenia | 9 | 0.0% |
| Asia | 8,142 | 25.1% |
| Australia | 8 | 0.0% |
| Austria | 108 | 0.3% |
| Bangladesh | 6 | 0.0% |
| Barbados | 80 | 0.3% |
| Belarus | 17 | 0.1% |
| Belgium | 28 | 0.1% |
| Belize | 18 | 0.1% |
| Bolivia | 11 | 0.0% |
| Brazil | 80 | 0.3% |
| Bulgaria | 12 | 0.0% |
| Canada | 480 | 1.5% |
| Caribbean | 132 | 0.4% |
| Central America | 737 | 2.3% |
| China | 434 | 1.3% |
| Colombia | 56 | 0.2% |
| Denmark | 65 | 0.2% |
| Eastern Africa | 38 | 0.1% |
| Eastern Asia | 1,204 | 3.7% |
| Eastern Europe | 787 | 2.4% |
| Ecuador | 171 | 0.5% |
| El Salvador | 129 | 0.4% |
| England | 177 | 0.5% |
| Europe | 2,058 | 6.4% |
| France | 364 | 1.1% |
| Germany | 177 | 0.5% |
| Guatemala | 41 | 0.1% |
| Guyana | 26 | 0.1% |
| Haiti | 39 | 0.1% |
| Honduras | 11 | 0.0% |
| Hong Kong | 42 | 0.1% |
| Hungary | 59 | 0.2% |
| India | 359 | 1.1% |
| Indonesia | 93 | 0.3% |
| Iran | 4,280 | 13.2% |
| Iraq | 54 | 0.2% |
| Ireland | 60 | 0.2% |
| Israel | 514 | 1.6% |
| Italy | 105 | 0.3% |
| Jamaica | 13 | 0.0% |
| Japan | 294 | 0.9% |
| Jordan | 17 | 0.1% |
| Kazakhstan | 49 | 0.2% |
| Kenya | 38 | 0.1% |
| Korea | 476 | 1.5% |
| Latin America | 1,383 | 4.3% |
| Latvia | 19 | 0.1% |
| Lebanon | 63 | 0.2% |
| Lithuania | 70 | 0.2% |
| Mexico | 475 | 1.5% |
| Moldova | 14 | 0.0% |
| Morocco | 29 | 0.1% |
| Netherlands | 30 | 0.1% |
| Nicaragua | 39 | 0.1% |
| Northern Africa | 97 | 0.3% |
| Northern Europe | 432 | 1.3% |
| Norway | 18 | 0.1% |
| Oceania | 8 | 0.0% |
| Pakistan | 280 | 0.9% |
| Philippines | 425 | 1.3% |
| Poland | 112 | 0.4% |
| Romania | 68 | 0.2% |
| Russia | 216 | 0.7% |
| South Africa | 26 | 0.1% |
| South America | 514 | 1.6% |
| South Central Asia | 5,204 | 16.1% |
| South Eastern Asia | 769 | 2.4% |
| Southern Europe | 132 | 0.4% |
| Spain | 27 | 0.1% |
| Sweden | 26 | 0.1% |
| Taiwan | 119 | 0.4% |
| Thailand | 202 | 0.6% |
| Turkey | 171 | 0.5% |
| Ukraine | 156 | 0.5% |
| Venezuela | 95 | 0.3% |
| Vietnam | 49 | 0.2% |
| Western Asia | 915 | 2.8% |
| Western Europe | 707 | 2.2% | View All 82 Rows |
Sex and Age in Beverly Hills
Sex and Age in Beverly Hills
The most populous age groups in Beverly Hills are 60 to 64 Years (1,386 | 9.3%) for men and 50 to 54 Years (1,726 | 9.9%) for women.
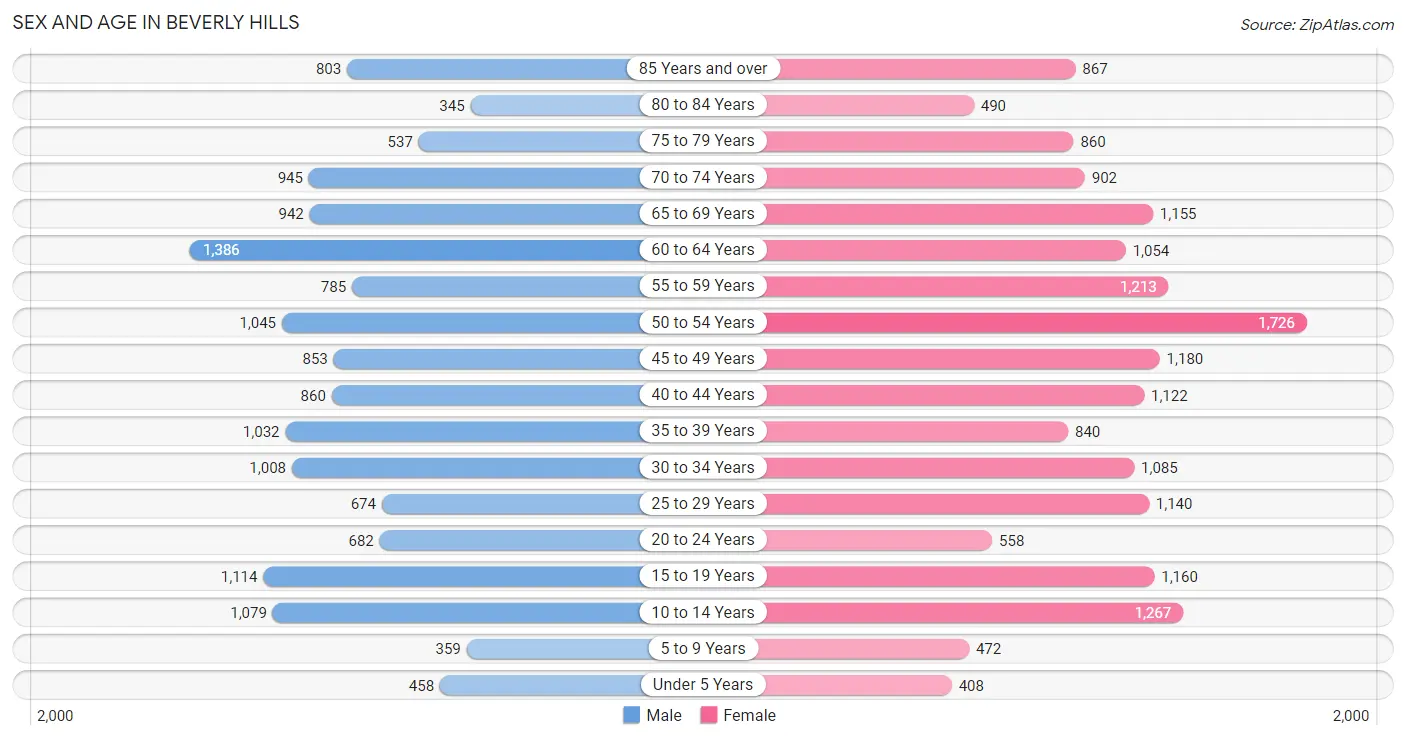
| Age Bracket | Male | Female |
| Under 5 Years | 458 (3.1%) | 408 (2.3%) |
| 5 to 9 Years | 359 (2.4%) | 472 (2.7%) |
| 10 to 14 Years | 1,079 (7.2%) | 1,267 (7.2%) |
| 15 to 19 Years | 1,114 (7.5%) | 1,160 (6.6%) |
| 20 to 24 Years | 682 (4.6%) | 558 (3.2%) |
| 25 to 29 Years | 674 (4.5%) | 1,140 (6.5%) |
| 30 to 34 Years | 1,008 (6.8%) | 1,085 (6.2%) |
| 35 to 39 Years | 1,032 (6.9%) | 840 (4.8%) |
| 40 to 44 Years | 860 (5.8%) | 1,122 (6.4%) |
| 45 to 49 Years | 853 (5.7%) | 1,180 (6.7%) |
| 50 to 54 Years | 1,045 (7.0%) | 1,726 (9.9%) |
| 55 to 59 Years | 785 (5.3%) | 1,213 (6.9%) |
| 60 to 64 Years | 1,386 (9.3%) | 1,054 (6.0%) |
| 65 to 69 Years | 942 (6.3%) | 1,155 (6.6%) |
| 70 to 74 Years | 945 (6.3%) | 902 (5.1%) |
| 75 to 79 Years | 537 (3.6%) | 860 (4.9%) |
| 80 to 84 Years | 345 (2.3%) | 490 (2.8%) |
| 85 Years and over | 803 (5.4%) | 867 (5.0%) |
| Total | 14,907 (100.0%) | 17,499 (100.0%) |
Families and Households in Beverly Hills
Median Family Size in Beverly Hills
The median family size in Beverly Hills is 3.07 persons per family, with married-couple families (6,374 | 81.2%) accounting for the largest median family size of 3.14 persons per family. On the other hand, single male/father families (490 | 6.2%) represent the smallest median family size with 2.62 persons per family.
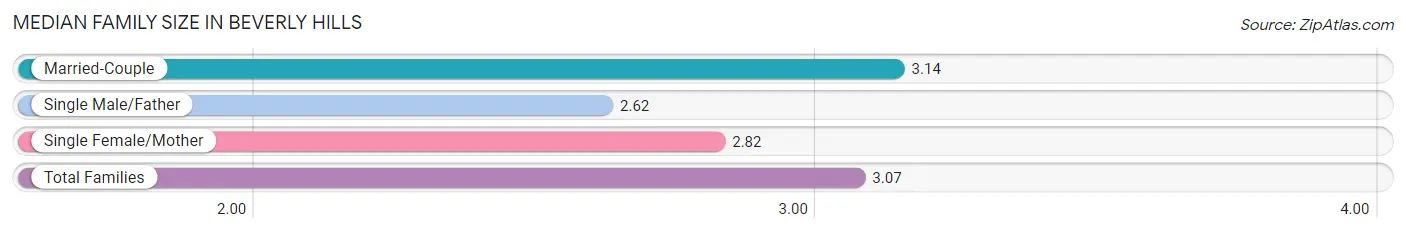
| Family Type | # Families | Family Size |
| Married-Couple | 6,374 (81.2%) | 3.14 |
| Single Male/Father | 490 (6.2%) | 2.62 |
| Single Female/Mother | 988 (12.6%) | 2.82 |
| Total Families | 7,852 (100.0%) | 3.07 |
Median Household Size in Beverly Hills
The median household size in Beverly Hills is 2.26 persons per household, with married-couple households (6,374 | 44.5%) accounting for the largest median household size of 3.18 persons per household. non-family households (6,486 | 45.2%) represent the smallest median household size with 1.19 persons per household.
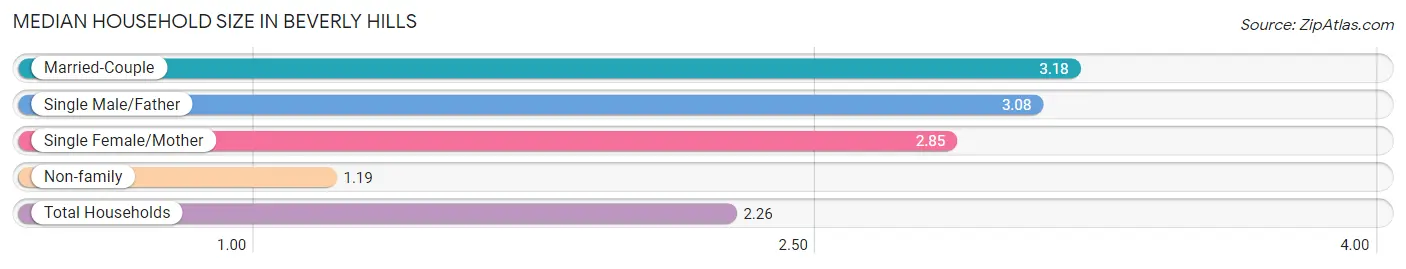
| Household Type | # Households | Household Size |
| Married-Couple | 6,374 (44.5%) | 3.18 |
| Single Male/Father | 490 (3.4%) | 3.08 |
| Single Female/Mother | 988 (6.9%) | 2.85 |
| Non-family | 6,486 (45.2%) | 1.19 |
| Total Households | 14,338 (100.0%) | 2.26 |
Household Size by Marriage Status in Beverly Hills
Out of a total of 14,338 households in Beverly Hills, 7,852 (54.8%) are family households, while 6,486 (45.2%) are nonfamily households. The most numerous type of family households are 2-person households, comprising 3,482, and the most common type of nonfamily households are 1-person households, comprising 5,576.
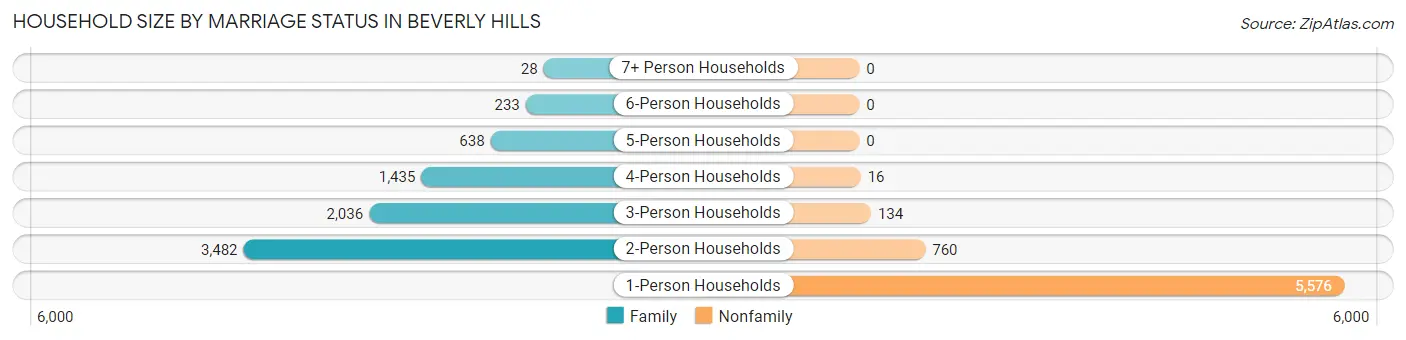
| Household Size | Family Households | Nonfamily Households |
| 1-Person Households | - | 5,576 (38.9%) |
| 2-Person Households | 3,482 (24.3%) | 760 (5.3%) |
| 3-Person Households | 2,036 (14.2%) | 134 (0.9%) |
| 4-Person Households | 1,435 (10.0%) | 16 (0.1%) |
| 5-Person Households | 638 (4.4%) | 0 (0.0%) |
| 6-Person Households | 233 (1.6%) | 0 (0.0%) |
| 7+ Person Households | 28 (0.2%) | 0 (0.0%) |
| Total | 7,852 (54.8%) | 6,486 (45.2%) |
Female Fertility in Beverly Hills
Fertility by Age in Beverly Hills
Average fertility rate in Beverly Hills is 38.0 births per 1,000 women. Women in the age bracket of 20 to 34 years have the highest fertility rate with 49.0 births per 1,000 women. Women in the age bracket of 20 to 34 years acount for 50.2% of all women with births.
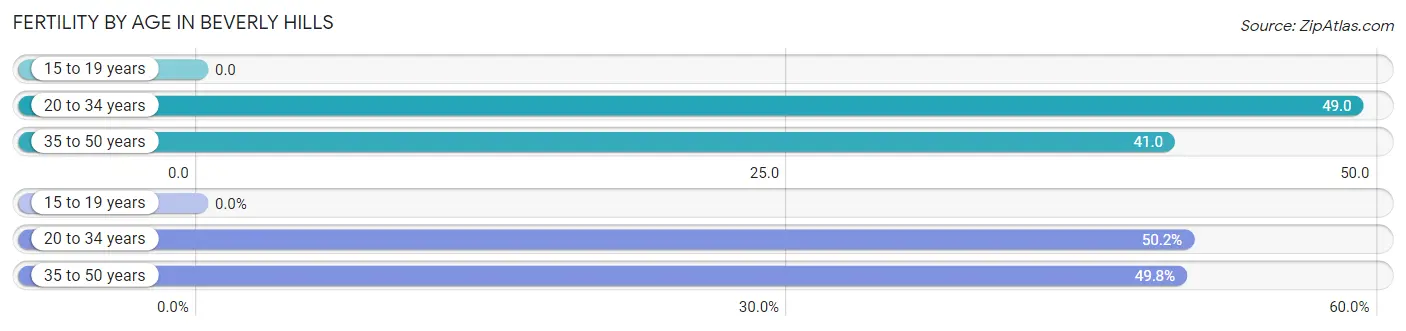
| Age Bracket | Women with Births | Births / 1,000 Women |
| 15 to 19 years | 0 (0.0%) | 0.0 |
| 20 to 34 years | 136 (50.2%) | 49.0 |
| 35 to 50 years | 135 (49.8%) | 41.0 |
| Total | 271 (100.0%) | 38.0 |
Fertility by Age by Marriage Status in Beverly Hills
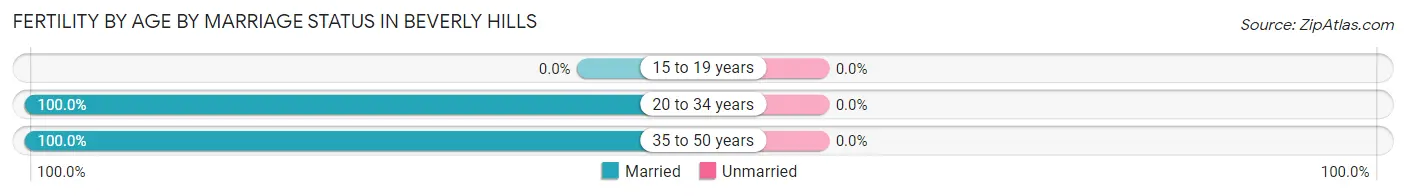
| Age Bracket | Married | Unmarried |
| 15 to 19 years | 0 (0.0%) | 0 (0.0%) |
| 20 to 34 years | 136 (100.0%) | 0 (0.0%) |
| 35 to 50 years | 135 (100.0%) | 0 (0.0%) |
| Total | 271 (100.0%) | 0 (0.0%) |
Fertility by Education in Beverly Hills
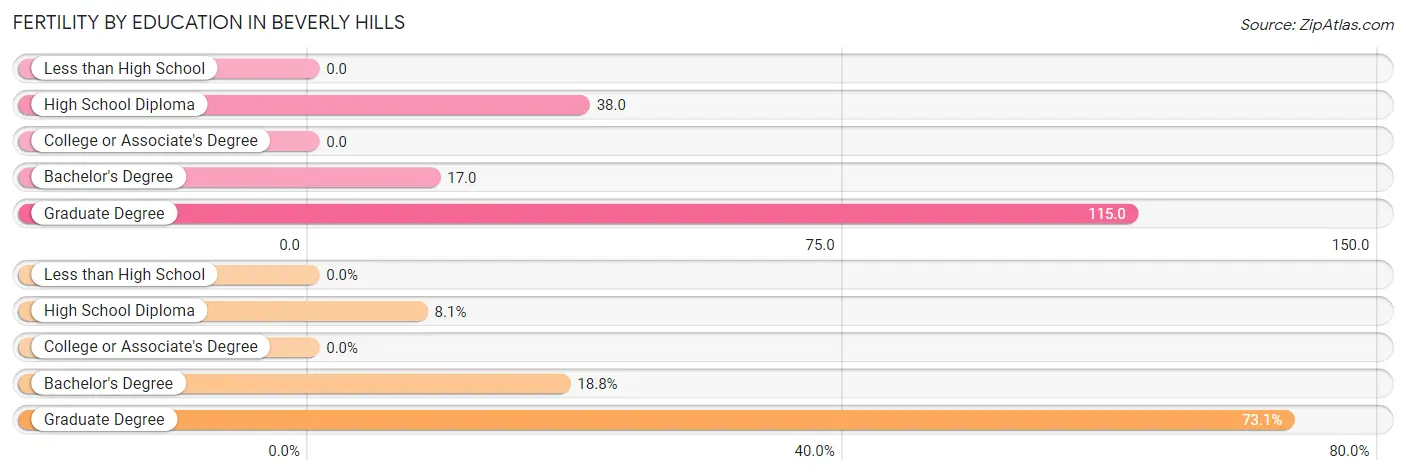
| Educational Attainment | Women with Births | Births / 1,000 Women |
| Less than High School | 0 (0.0%) | 0.0 |
| High School Diploma | 22 (8.1%) | 38.0 |
| College or Associate's Degree | 0 (0.0%) | 0.0 |
| Bachelor's Degree | 51 (18.8%) | 17.0 |
| Graduate Degree | 198 (73.1%) | 115.0 |
| Total | 271 (100.0%) | 38.0 |
Fertility by Education by Marriage Status in Beverly Hills
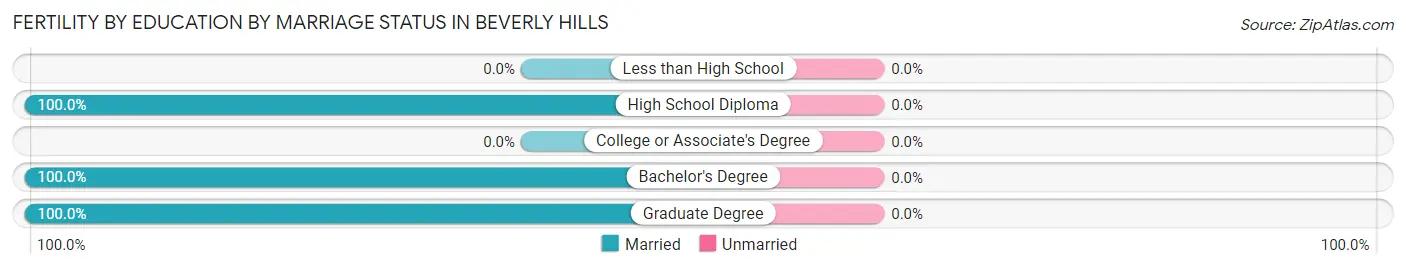
| Educational Attainment | Married | Unmarried |
| Less than High School | 0 (0.0%) | 0 (0.0%) |
| High School Diploma | 22 (100.0%) | 0 (0.0%) |
| College or Associate's Degree | 0 (0.0%) | 0 (0.0%) |
| Bachelor's Degree | 51 (100.0%) | 0 (0.0%) |
| Graduate Degree | 198 (100.0%) | 0 (0.0%) |
| Total | 271 (100.0%) | 0 (0.0%) |
Employment Characteristics in Beverly Hills
Employment by Class of Employer in Beverly Hills
Among the 14,723 employed individuals in Beverly Hills, private company employees (8,271 | 56.2%), self-employed (not incorporated) (2,338 | 15.9%), and self-employed (incorporated) (2,277 | 15.5%) make up the most common classes of employment.
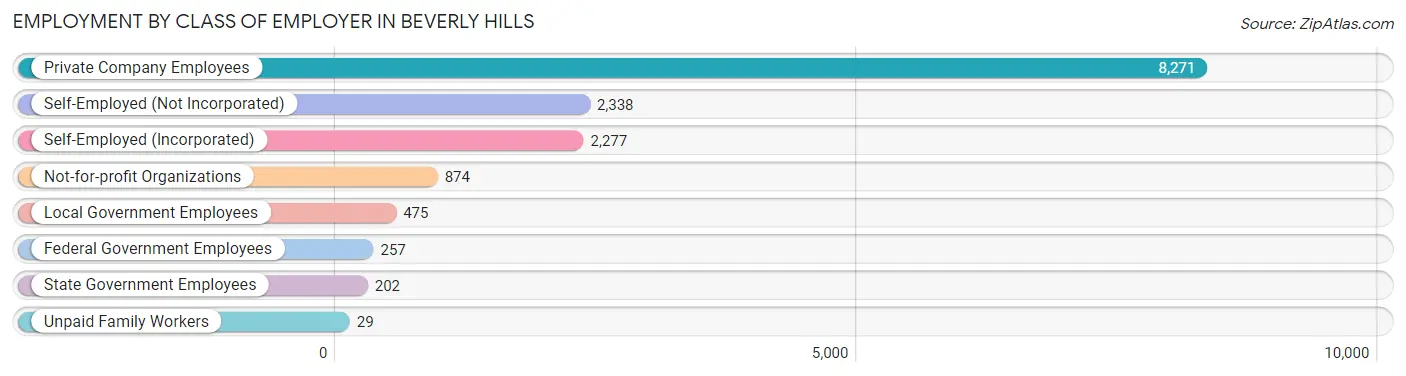
| Employer Class | # Employees | % Employees |
| Private Company Employees | 8,271 | 56.2% |
| Self-Employed (Incorporated) | 2,277 | 15.5% |
| Self-Employed (Not Incorporated) | 2,338 | 15.9% |
| Not-for-profit Organizations | 874 | 5.9% |
| Local Government Employees | 475 | 3.2% |
| State Government Employees | 202 | 1.4% |
| Federal Government Employees | 257 | 1.8% |
| Unpaid Family Workers | 29 | 0.2% |
| Total | 14,723 | 100.0% |
Employment Status by Age in Beverly Hills
According to the labor force statistics for Beverly Hills, out of the total population over 16 years of age (28,031), 58.7% or 16,454 individuals are in the labor force, with 8.6% or 1,415 of them unemployed. The age group with the highest labor force participation rate is 30 to 34 years, with 81.1% or 1,697 individuals in the labor force. Within the labor force, the 16 to 19 years age range has the highest percentage of unemployed individuals, with 45.0% or 9 of them being unemployed.
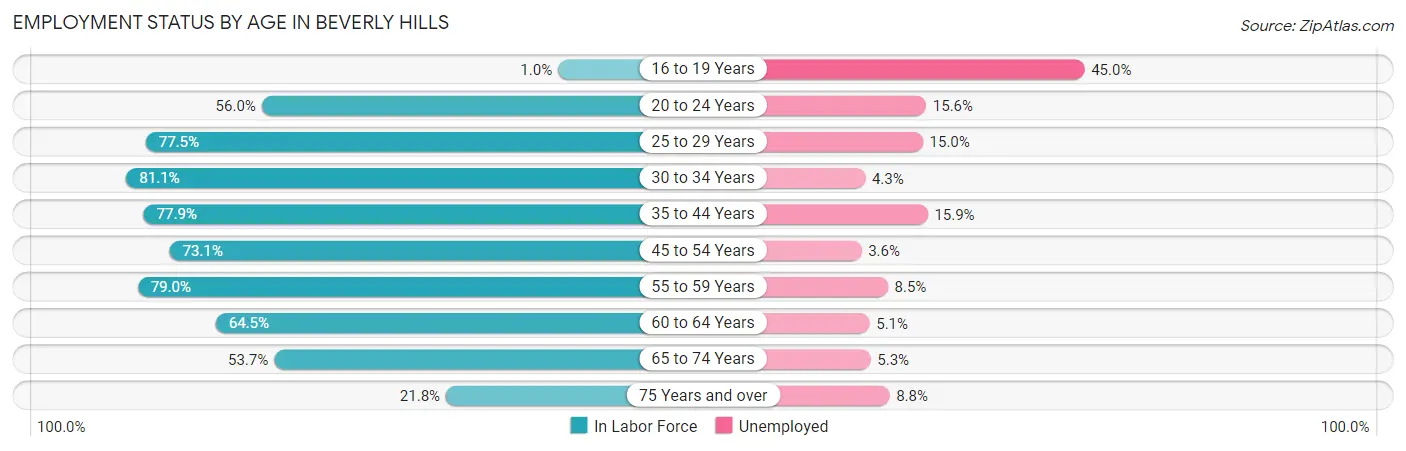
| Age Bracket | In Labor Force | Unemployed |
| 16 to 19 Years | 19 (1.0%) | 9 (45.0%) |
| 20 to 24 Years | 694 (56.0%) | 108 (15.6%) |
| 25 to 29 Years | 1,406 (77.5%) | 211 (15.0%) |
| 30 to 34 Years | 1,697 (81.1%) | 73 (4.3%) |
| 35 to 44 Years | 3,002 (77.9%) | 477 (15.9%) |
| 45 to 54 Years | 3,512 (73.1%) | 126 (3.6%) |
| 55 to 59 Years | 1,578 (79.0%) | 134 (8.5%) |
| 60 to 64 Years | 1,574 (64.5%) | 80 (5.1%) |
| 65 to 74 Years | 2,118 (53.7%) | 112 (5.3%) |
| 75 Years and over | 851 (21.8%) | 75 (8.8%) |
| Total | 16,454 (58.7%) | 1,415 (8.6%) |
Employment Status by Educational Attainment in Beverly Hills
According to labor force statistics for Beverly Hills, 75.1% of individuals (12,769) out of the total population between 25 and 64 years of age (17,003) are in the labor force, with 8.7% or 1,111 of them being unemployed. The group with the highest labor force participation rate are those with the educational attainment of bachelor's degree or higher, with 79.0% or 9,226 individuals in the labor force. Within the labor force, individuals with college / associate degree education have the highest percentage of unemployment, with 14.8% or 337 of them being unemployed.
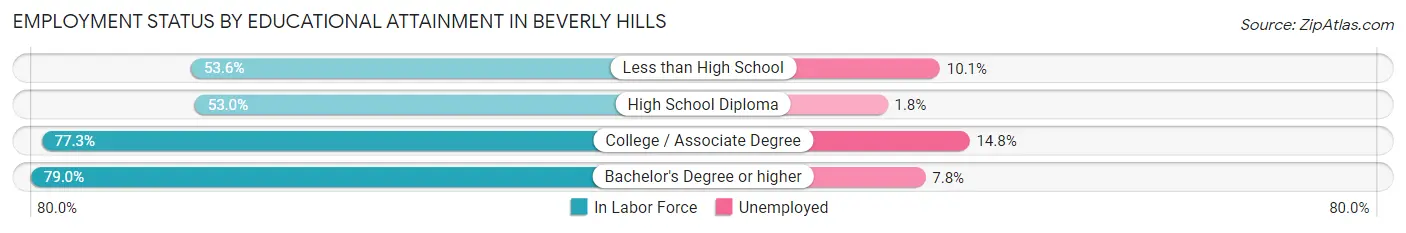
| Educational Attainment | In Labor Force | Unemployed |
| Less than High School | 268 (53.6%) | 50 (10.1%) |
| High School Diploma | 998 (53.0%) | 34 (1.8%) |
| College / Associate Degree | 2,274 (77.3%) | 435 (14.8%) |
| Bachelor's Degree or higher | 9,226 (79.0%) | 911 (7.8%) |
| Total | 12,769 (75.1%) | 1,479 (8.7%) |
Employment Occupations by Sex in Beverly Hills
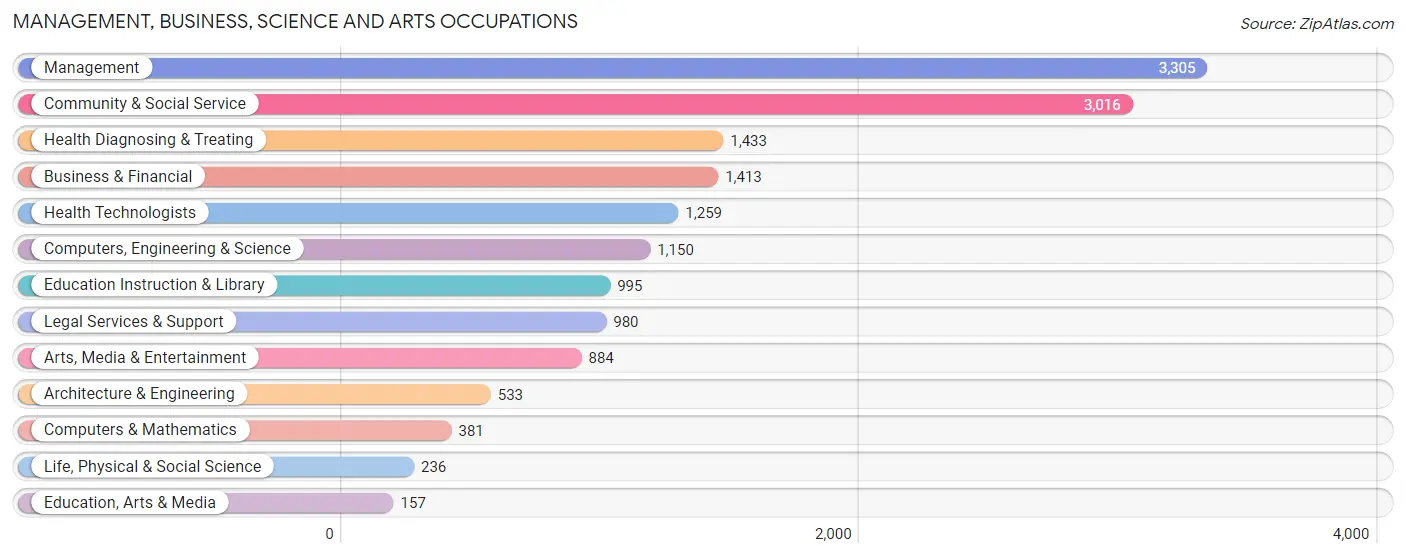
Management, Business, Science and Arts Occupations
The most common Management, Business, Science and Arts occupations in Beverly Hills are Management (3,305 | 22.0%), Community & Social Service (3,016 | 20.1%), Health Diagnosing & Treating (1,433 | 9.5%), Business & Financial (1,413 | 9.4%), and Health Technologists (1,259 | 8.4%).
Management, Business, Science and Arts Occupations by Sex
Within the Management, Business, Science and Arts occupations in Beverly Hills, the most male-oriented occupations are Architecture & Engineering (89.9%), Computers & Mathematics (85.3%), and Computers, Engineering & Science (81.9%), while the most female-oriented occupations are Education, Arts & Media (88.5%), Education Instruction & Library (67.9%), and Arts, Media & Entertainment (56.8%).
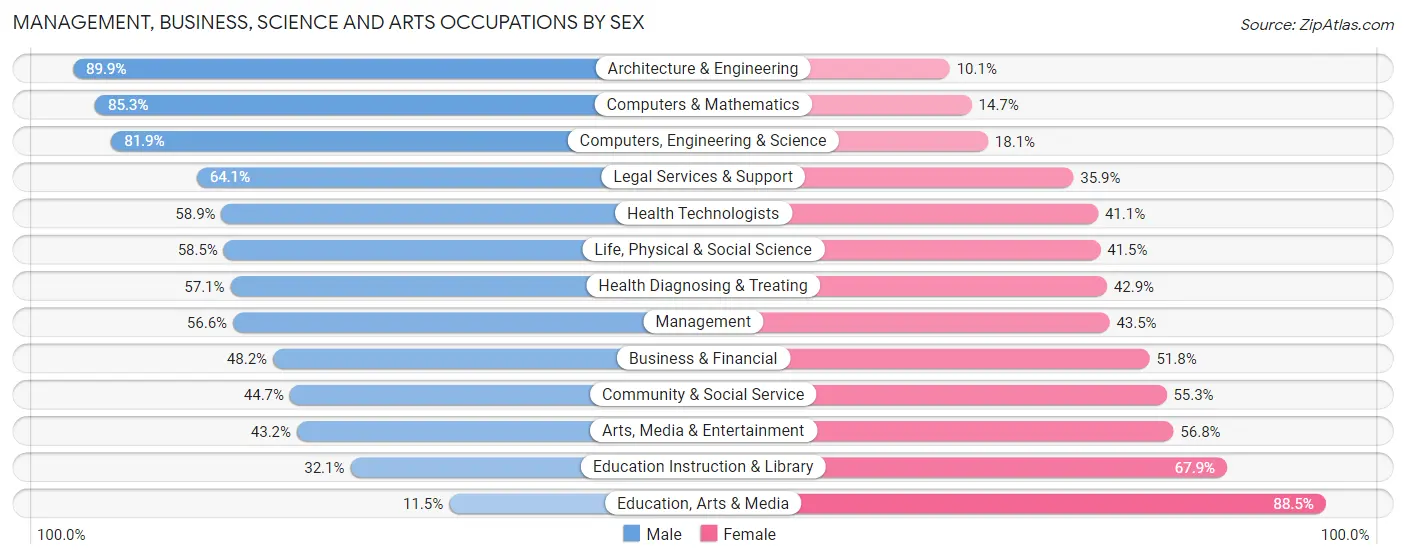
| Occupation | Male | Female |
| Management | 1,869 (56.6%) | 1,436 (43.4%) |
| Business & Financial | 681 (48.2%) | 732 (51.8%) |
| Computers, Engineering & Science | 942 (81.9%) | 208 (18.1%) |
| Computers & Mathematics | 325 (85.3%) | 56 (14.7%) |
| Architecture & Engineering | 479 (89.9%) | 54 (10.1%) |
| Life, Physical & Social Science | 138 (58.5%) | 98 (41.5%) |
| Community & Social Service | 1,347 (44.7%) | 1,669 (55.3%) |
| Education, Arts & Media | 18 (11.5%) | 139 (88.5%) |
| Legal Services & Support | 628 (64.1%) | 352 (35.9%) |
| Education Instruction & Library | 319 (32.1%) | 676 (67.9%) |
| Arts, Media & Entertainment | 382 (43.2%) | 502 (56.8%) |
| Health Diagnosing & Treating | 818 (57.1%) | 615 (42.9%) |
| Health Technologists | 742 (58.9%) | 517 (41.1%) |
| Total (Category) | 5,657 (54.8%) | 4,660 (45.2%) |
| Total (Overall) | 7,736 (51.5%) | 7,289 (48.5%) |
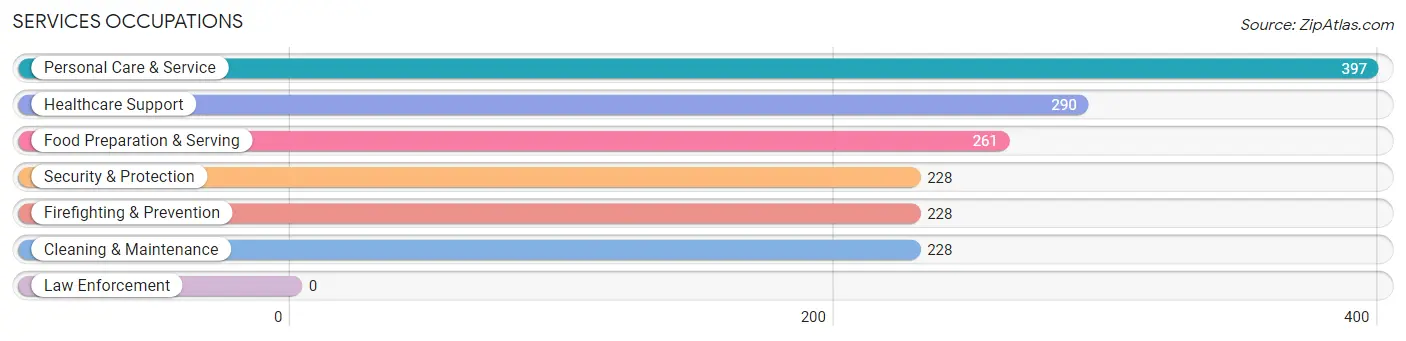
Services Occupations
The most common Services occupations in Beverly Hills are Personal Care & Service (397 | 2.6%), Healthcare Support (290 | 1.9%), Food Preparation & Serving (261 | 1.7%), Security & Protection (228 | 1.5%), and Firefighting & Prevention (228 | 1.5%).
Services Occupations by Sex
Within the Services occupations in Beverly Hills, the most male-oriented occupations are Security & Protection (95.6%), Firefighting & Prevention (95.6%), and Food Preparation & Serving (70.5%), while the most female-oriented occupations are Cleaning & Maintenance (92.1%), Healthcare Support (80.3%), and Personal Care & Service (70.5%).
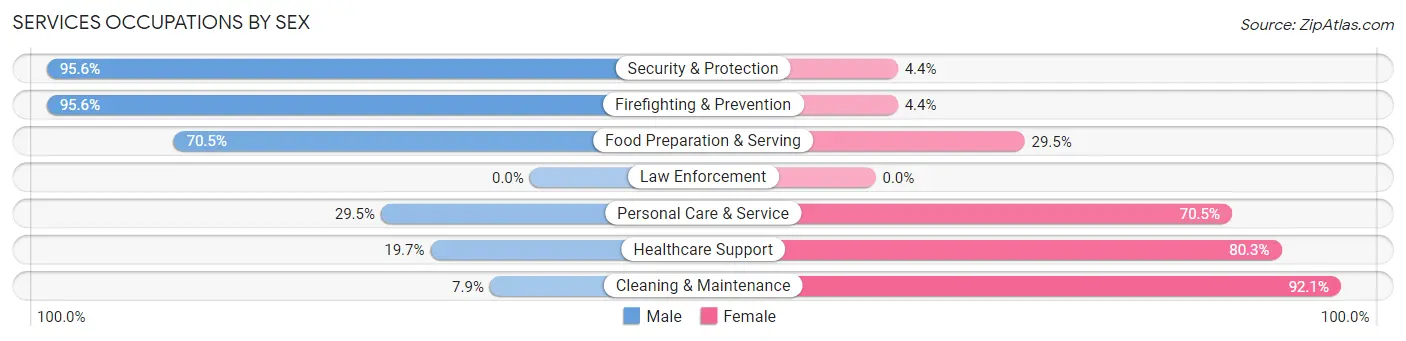
| Occupation | Male | Female |
| Healthcare Support | 57 (19.7%) | 233 (80.3%) |
| Security & Protection | 218 (95.6%) | 10 (4.4%) |
| Firefighting & Prevention | 218 (95.6%) | 10 (4.4%) |
| Law Enforcement | 0 (0.0%) | 0 (0.0%) |
| Food Preparation & Serving | 184 (70.5%) | 77 (29.5%) |
| Cleaning & Maintenance | 18 (7.9%) | 210 (92.1%) |
| Personal Care & Service | 117 (29.5%) | 280 (70.5%) |
| Total (Category) | 594 (42.3%) | 810 (57.7%) |
| Total (Overall) | 7,736 (51.5%) | 7,289 (48.5%) |
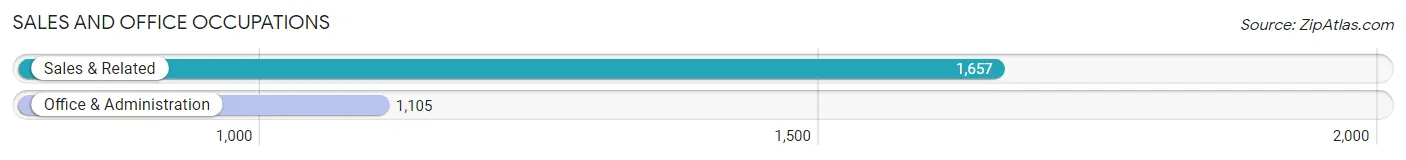
Sales and Office Occupations
The most common Sales and Office occupations in Beverly Hills are Sales & Related (1,657 | 11.0%), and Office & Administration (1,105 | 7.3%).
Sales and Office Occupations by Sex
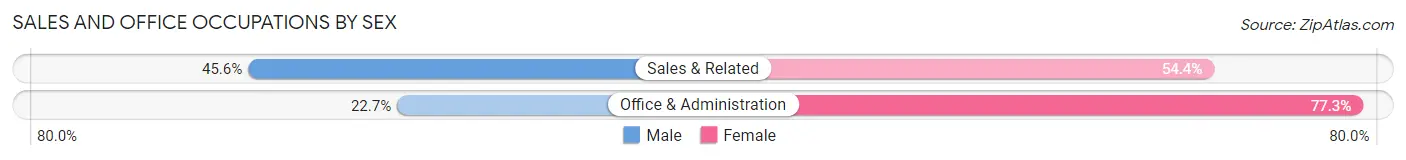
| Occupation | Male | Female |
| Sales & Related | 756 (45.6%) | 901 (54.4%) |
| Office & Administration | 251 (22.7%) | 854 (77.3%) |
| Total (Category) | 1,007 (36.5%) | 1,755 (63.5%) |
| Total (Overall) | 7,736 (51.5%) | 7,289 (48.5%) |
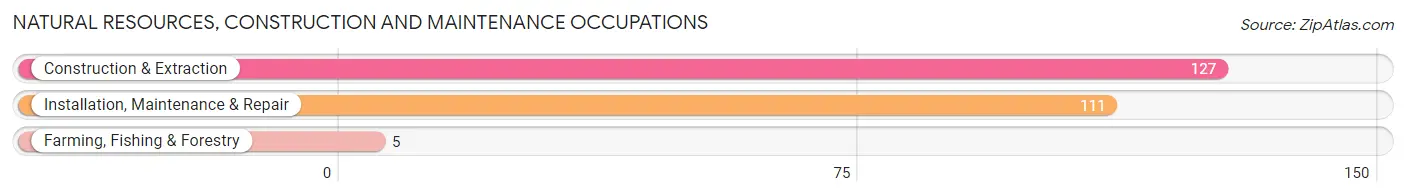
Natural Resources, Construction and Maintenance Occupations
The most common Natural Resources, Construction and Maintenance occupations in Beverly Hills are Construction & Extraction (127 | 0.9%), Installation, Maintenance & Repair (111 | 0.7%), and Farming, Fishing & Forestry (5 | 0.0%).
Natural Resources, Construction and Maintenance Occupations by Sex
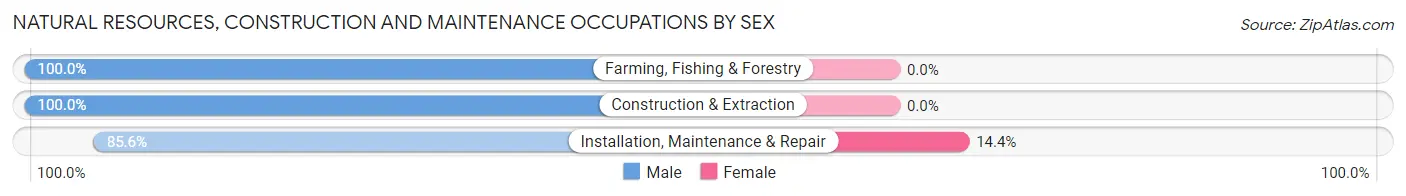
| Occupation | Male | Female |
| Farming, Fishing & Forestry | 5 (100.0%) | 0 (0.0%) |
| Construction & Extraction | 127 (100.0%) | 0 (0.0%) |
| Installation, Maintenance & Repair | 95 (85.6%) | 16 (14.4%) |
| Total (Category) | 227 (93.4%) | 16 (6.6%) |
| Total (Overall) | 7,736 (51.5%) | 7,289 (48.5%) |
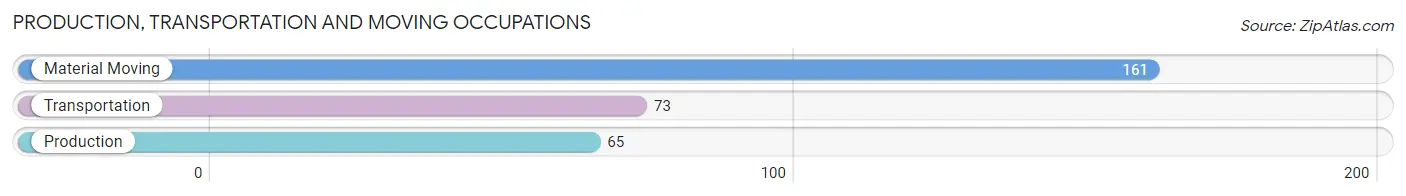
Production, Transportation and Moving Occupations
The most common Production, Transportation and Moving occupations in Beverly Hills are Material Moving (161 | 1.1%), Transportation (73 | 0.5%), and Production (65 | 0.4%).
Production, Transportation and Moving Occupations by Sex
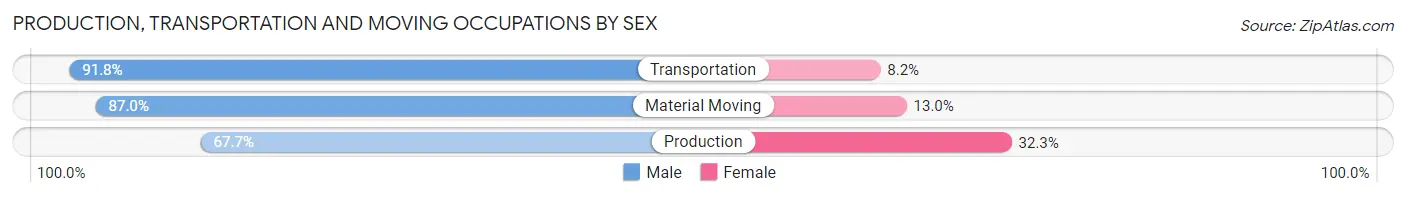
| Occupation | Male | Female |
| Production | 44 (67.7%) | 21 (32.3%) |
| Transportation | 67 (91.8%) | 6 (8.2%) |
| Material Moving | 140 (87.0%) | 21 (13.0%) |
| Total (Category) | 251 (84.0%) | 48 (16.1%) |
| Total (Overall) | 7,736 (51.5%) | 7,289 (48.5%) |
Employment Industries by Sex in Beverly Hills
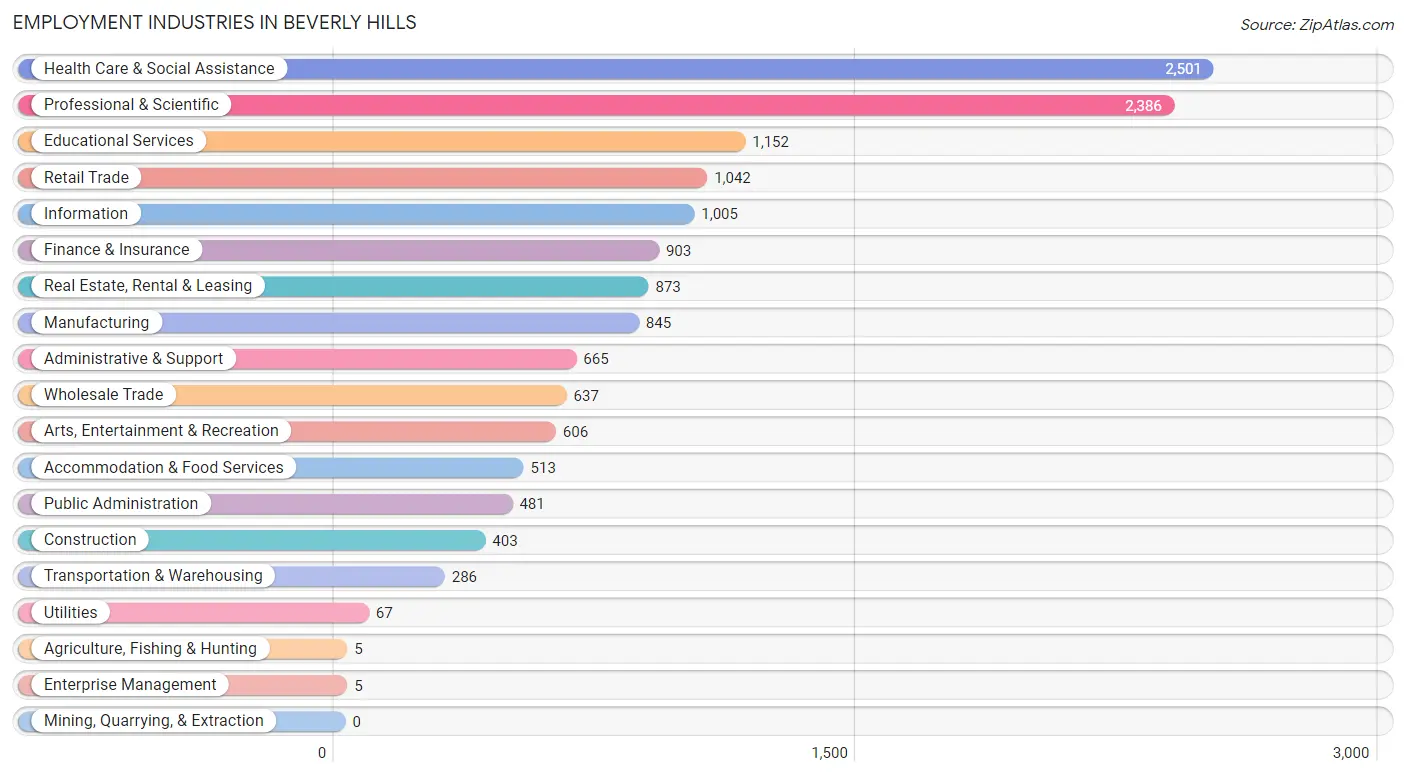
Employment Industries in Beverly Hills
The major employment industries in Beverly Hills include Health Care & Social Assistance (2,501 | 16.7%), Professional & Scientific (2,386 | 15.9%), Educational Services (1,152 | 7.7%), Retail Trade (1,042 | 6.9%), and Information (1,005 | 6.7%).
Employment Industries by Sex in Beverly Hills
The Beverly Hills industries that see more men than women are Agriculture, Fishing & Hunting (100.0%), Enterprise Management (100.0%), and Transportation & Warehousing (81.1%), whereas the industries that tend to have a higher number of women are Public Administration (71.5%), Educational Services (70.4%), and Health Care & Social Assistance (57.5%).
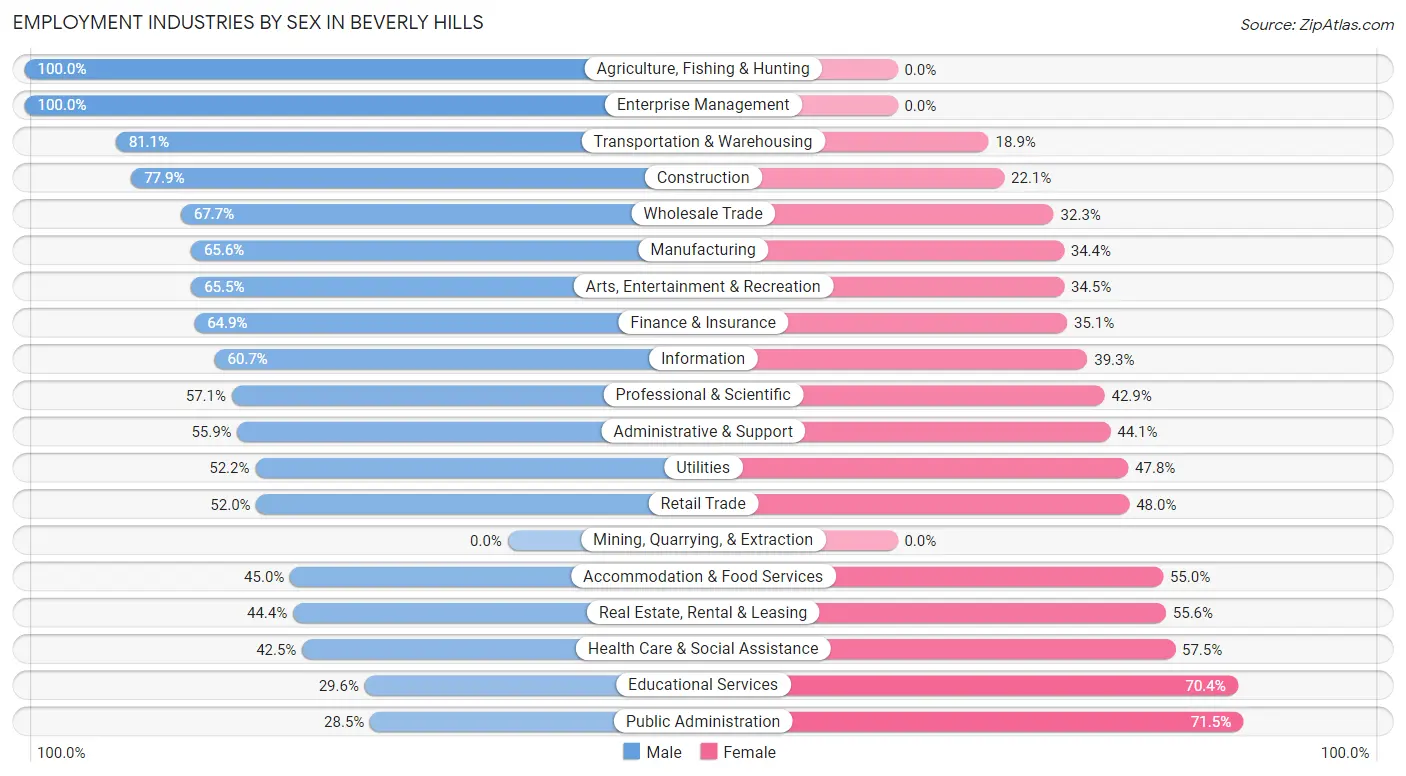
| Industry | Male | Female |
| Agriculture, Fishing & Hunting | 5 (100.0%) | 0 (0.0%) |
| Mining, Quarrying, & Extraction | 0 (0.0%) | 0 (0.0%) |
| Construction | 314 (77.9%) | 89 (22.1%) |
| Manufacturing | 554 (65.6%) | 291 (34.4%) |
| Wholesale Trade | 431 (67.7%) | 206 (32.3%) |
| Retail Trade | 542 (52.0%) | 500 (48.0%) |
| Transportation & Warehousing | 232 (81.1%) | 54 (18.9%) |
| Utilities | 35 (52.2%) | 32 (47.8%) |
| Information | 610 (60.7%) | 395 (39.3%) |
| Finance & Insurance | 586 (64.9%) | 317 (35.1%) |
| Real Estate, Rental & Leasing | 388 (44.4%) | 485 (55.6%) |
| Professional & Scientific | 1,363 (57.1%) | 1,023 (42.9%) |
| Enterprise Management | 5 (100.0%) | 0 (0.0%) |
| Administrative & Support | 372 (55.9%) | 293 (44.1%) |
| Educational Services | 341 (29.6%) | 811 (70.4%) |
| Health Care & Social Assistance | 1,064 (42.5%) | 1,437 (57.5%) |
| Arts, Entertainment & Recreation | 397 (65.5%) | 209 (34.5%) |
| Accommodation & Food Services | 231 (45.0%) | 282 (55.0%) |
| Public Administration | 137 (28.5%) | 344 (71.5%) |
| Total | 7,736 (51.5%) | 7,289 (48.5%) |
Education in Beverly Hills
School Enrollment in Beverly Hills
The most common levels of schooling among the 7,632 students in Beverly Hills are high school (2,037 | 26.7%), middle school (1,747 | 22.9%), and college / undergraduate (1,590 | 20.8%).
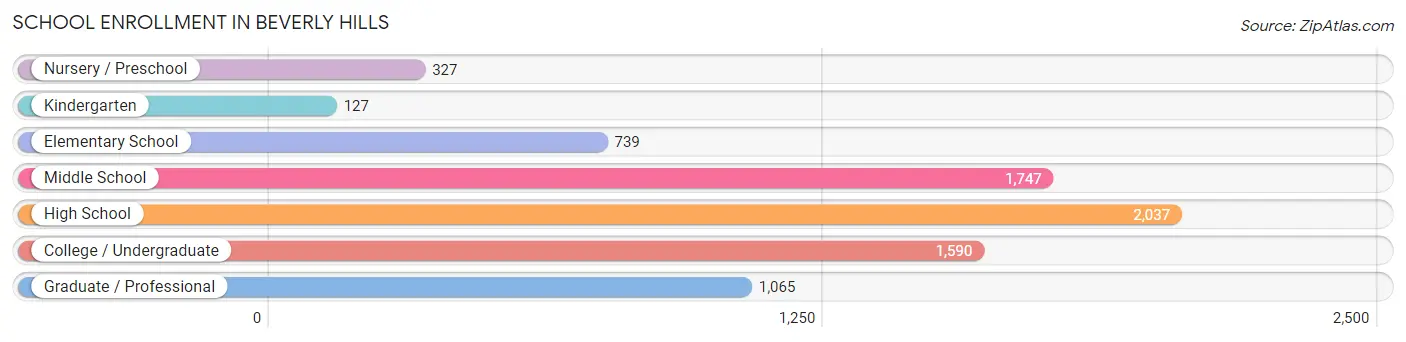
| School Level | # Students | % Students |
| Nursery / Preschool | 327 | 4.3% |
| Kindergarten | 127 | 1.7% |
| Elementary School | 739 | 9.7% |
| Middle School | 1,747 | 22.9% |
| High School | 2,037 | 26.7% |
| College / Undergraduate | 1,590 | 20.8% |
| Graduate / Professional | 1,065 | 14.0% |
| Total | 7,632 | 100.0% |
School Enrollment by Age by Funding Source in Beverly Hills
Out of a total of 7,632 students who are enrolled in schools in Beverly Hills, 2,564 (33.6%) attend a private institution, while the remaining 5,068 (66.4%) are enrolled in public schools. The age group of 3 to 4 year olds has the highest likelihood of being enrolled in private schools, with 213 (80.7% in the age bracket) enrolled. Conversely, the age group of 18 to 19 year olds has the lowest likelihood of being enrolled in a private school, with 595 (98.5% in the age bracket) attending a public institution.

| Age Bracket | Public School | Private School |
| 3 to 4 Year Olds | 51 (19.3%) | 213 (80.7%) |
| 5 to 9 Year Old | 596 (73.0%) | 220 (27.0%) |
| 10 to 14 Year Olds | 1,744 (74.3%) | 602 (25.7%) |
| 15 to 17 Year Olds | 1,037 (66.0%) | 533 (34.0%) |
| 18 to 19 Year Olds | 595 (98.5%) | 9 (1.5%) |
| 20 to 24 Year Olds | 448 (71.7%) | 177 (28.3%) |
| 25 to 34 Year Olds | 111 (36.3%) | 195 (63.7%) |
| 35 Years and over | 487 (44.2%) | 614 (55.8%) |
| Total | 5,068 (66.4%) | 2,564 (33.6%) |
Educational Attainment by Field of Study in Beverly Hills
Business (2,920 | 16.6%), social sciences (2,697 | 15.4%), engineering (1,323 | 7.5%), visual & performing arts (1,275 | 7.3%), and bio, nature & agricultural (1,267 | 7.2%) are the most common fields of study among 17,558 individuals in Beverly Hills who have obtained a bachelor's degree or higher.
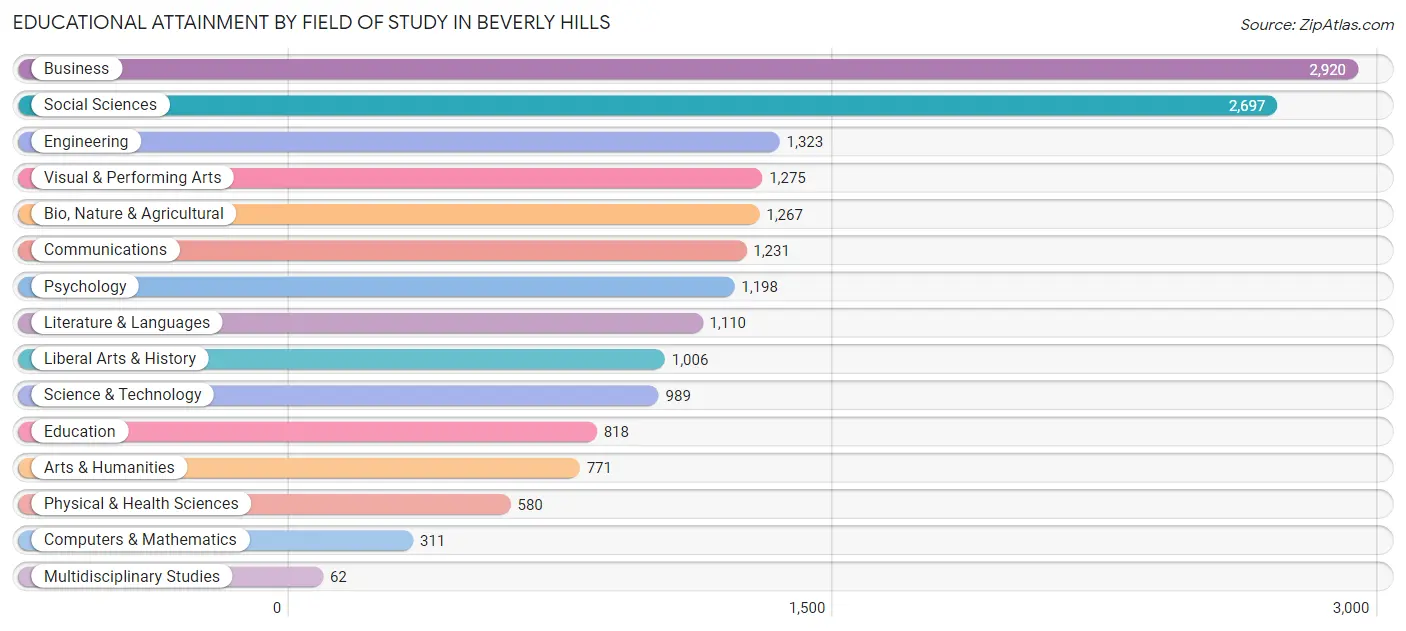
| Field of Study | # Graduates | % Graduates |
| Computers & Mathematics | 311 | 1.8% |
| Bio, Nature & Agricultural | 1,267 | 7.2% |
| Physical & Health Sciences | 580 | 3.3% |
| Psychology | 1,198 | 6.8% |
| Social Sciences | 2,697 | 15.4% |
| Engineering | 1,323 | 7.5% |
| Multidisciplinary Studies | 62 | 0.4% |
| Science & Technology | 989 | 5.6% |
| Business | 2,920 | 16.6% |
| Education | 818 | 4.7% |
| Literature & Languages | 1,110 | 6.3% |
| Liberal Arts & History | 1,006 | 5.7% |
| Visual & Performing Arts | 1,275 | 7.3% |
| Communications | 1,231 | 7.0% |
| Arts & Humanities | 771 | 4.4% |
| Total | 17,558 | 100.0% |
Transportation & Commute in Beverly Hills
Vehicle Availability by Sex in Beverly Hills
The most prevalent vehicle ownership categories in Beverly Hills are males with 2 vehicles (3,324, accounting for 43.3%) and females with 2 vehicles (2,681, making up 47.2%).
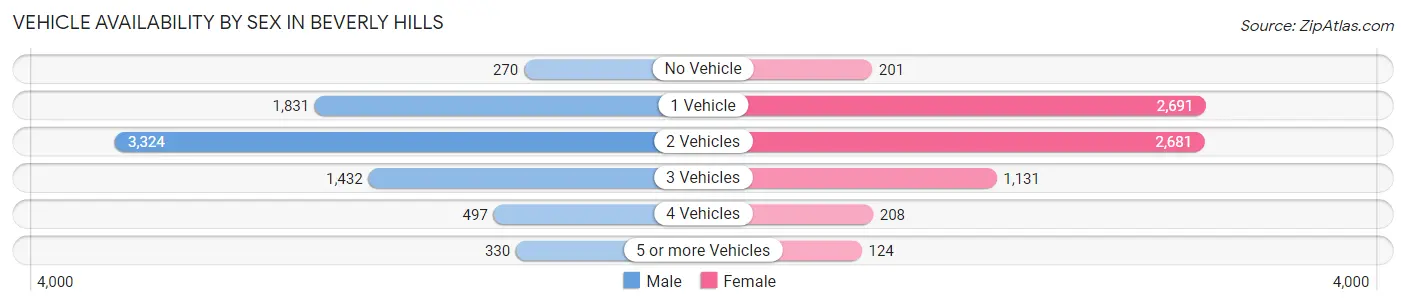
| Vehicles Available | Male | Female |
| No Vehicle | 270 (3.5%) | 201 (2.9%) |
| 1 Vehicle | 1,831 (23.8%) | 2,691 (38.3%) |
| 2 Vehicles | 3,324 (43.3%) | 2,681 (38.1%) |
| 3 Vehicles | 1,432 (18.6%) | 1,131 (16.1%) |
| 4 Vehicles | 497 (6.5%) | 208 (3.0%) |
| 5 or more Vehicles | 330 (4.3%) | 124 (1.8%) |
| Total | 7,684 (100.0%) | 7,036 (100.0%) |
Commute Time in Beverly Hills
The most frequently occuring commute durations in Beverly Hills are 20 to 24 minutes (1,674 commuters, 15.2%), 15 to 19 minutes (1,604 commuters, 14.6%), and 5 to 9 minutes (1,487 commuters, 13.5%).
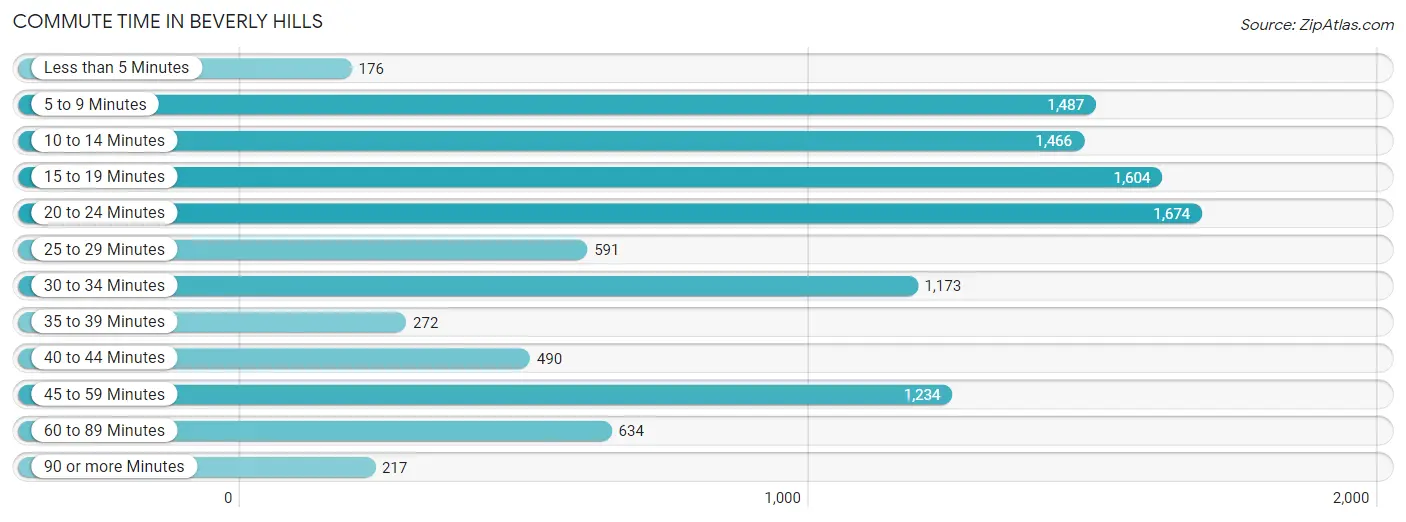
| Commute Time | # Commuters | % Commuters |
| Less than 5 Minutes | 176 | 1.6% |
| 5 to 9 Minutes | 1,487 | 13.5% |
| 10 to 14 Minutes | 1,466 | 13.3% |
| 15 to 19 Minutes | 1,604 | 14.6% |
| 20 to 24 Minutes | 1,674 | 15.2% |
| 25 to 29 Minutes | 591 | 5.4% |
| 30 to 34 Minutes | 1,173 | 10.6% |
| 35 to 39 Minutes | 272 | 2.5% |
| 40 to 44 Minutes | 490 | 4.4% |
| 45 to 59 Minutes | 1,234 | 11.2% |
| 60 to 89 Minutes | 634 | 5.8% |
| 90 or more Minutes | 217 | 2.0% |
Commute Time by Sex in Beverly Hills
The most common commute times in Beverly Hills are 20 to 24 minutes (907 commuters, 15.2%) for males and 15 to 19 minutes (789 commuters, 15.6%) for females.
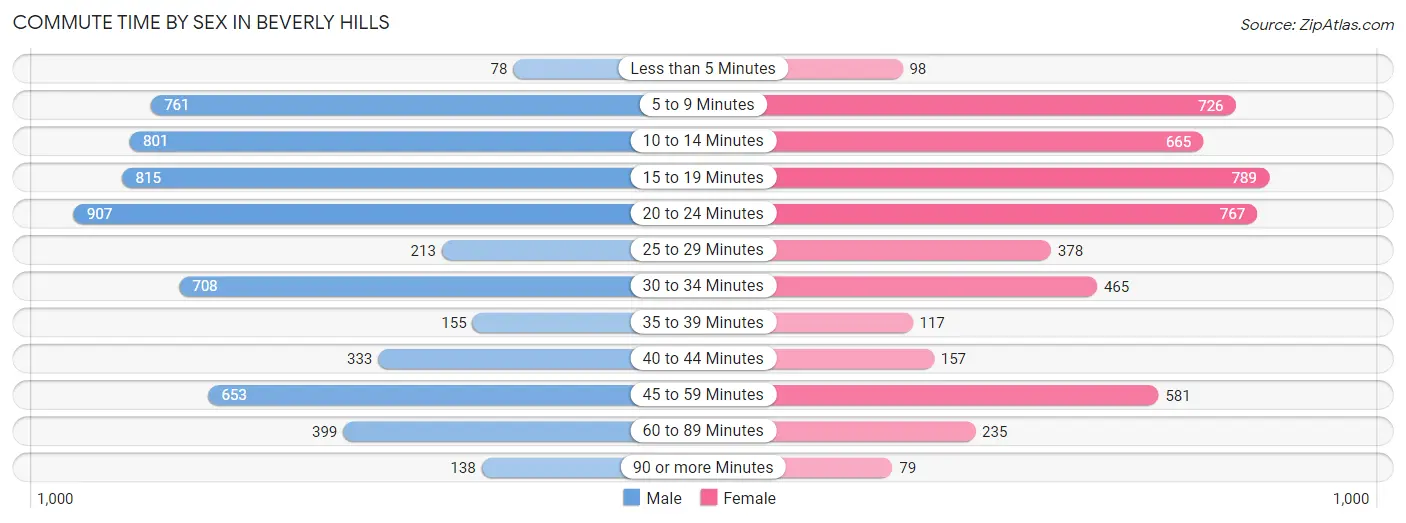
| Commute Time | Male | Female |
| Less than 5 Minutes | 78 (1.3%) | 98 (1.9%) |
| 5 to 9 Minutes | 761 (12.8%) | 726 (14.4%) |
| 10 to 14 Minutes | 801 (13.4%) | 665 (13.2%) |
| 15 to 19 Minutes | 815 (13.7%) | 789 (15.6%) |
| 20 to 24 Minutes | 907 (15.2%) | 767 (15.2%) |
| 25 to 29 Minutes | 213 (3.6%) | 378 (7.5%) |
| 30 to 34 Minutes | 708 (11.9%) | 465 (9.2%) |
| 35 to 39 Minutes | 155 (2.6%) | 117 (2.3%) |
| 40 to 44 Minutes | 333 (5.6%) | 157 (3.1%) |
| 45 to 59 Minutes | 653 (11.0%) | 581 (11.5%) |
| 60 to 89 Minutes | 399 (6.7%) | 235 (4.6%) |
| 90 or more Minutes | 138 (2.3%) | 79 (1.6%) |
Time of Departure to Work by Sex in Beverly Hills
The most frequent times of departure to work in Beverly Hills are 9:00 AM to 9:59 AM (1,253, 21.0%) for males and 9:00 AM to 9:59 AM (924, 18.3%) for females.
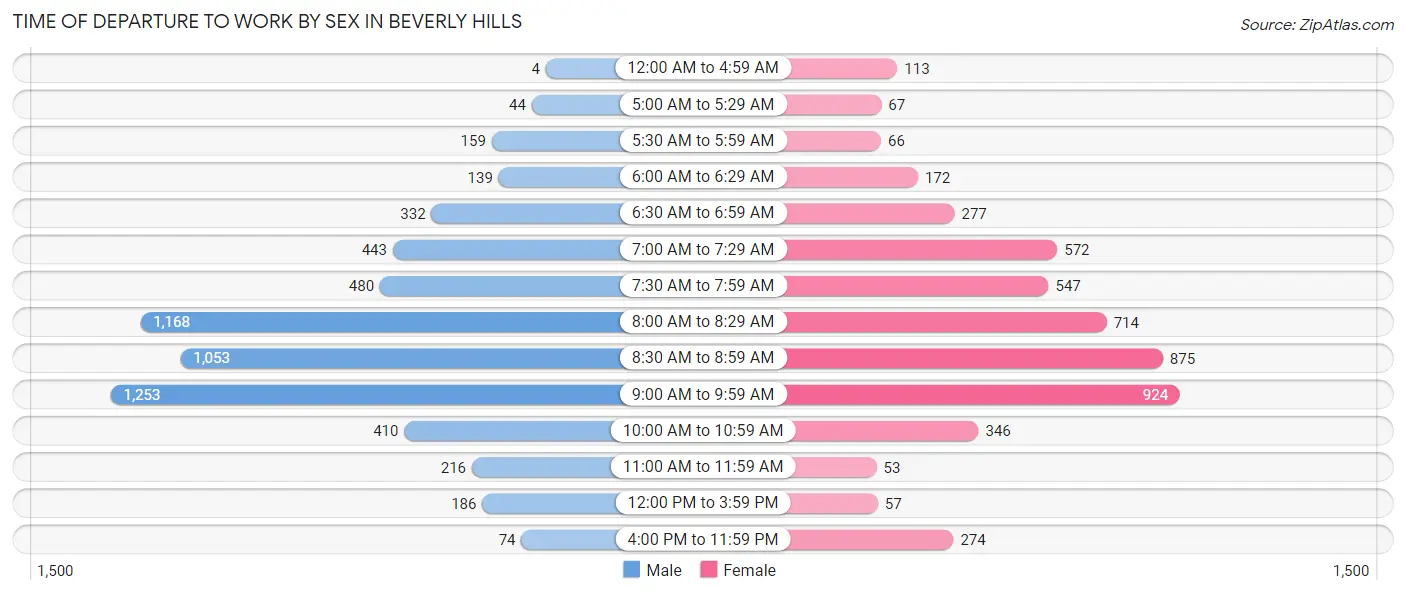
| Time of Departure | Male | Female |
| 12:00 AM to 4:59 AM | 4 (0.1%) | 113 (2.2%) |
| 5:00 AM to 5:29 AM | 44 (0.7%) | 67 (1.3%) |
| 5:30 AM to 5:59 AM | 159 (2.7%) | 66 (1.3%) |
| 6:00 AM to 6:29 AM | 139 (2.3%) | 172 (3.4%) |
| 6:30 AM to 6:59 AM | 332 (5.6%) | 277 (5.5%) |
| 7:00 AM to 7:29 AM | 443 (7.4%) | 572 (11.3%) |
| 7:30 AM to 7:59 AM | 480 (8.1%) | 547 (10.8%) |
| 8:00 AM to 8:29 AM | 1,168 (19.6%) | 714 (14.1%) |
| 8:30 AM to 8:59 AM | 1,053 (17.7%) | 875 (17.3%) |
| 9:00 AM to 9:59 AM | 1,253 (21.0%) | 924 (18.3%) |
| 10:00 AM to 10:59 AM | 410 (6.9%) | 346 (6.8%) |
| 11:00 AM to 11:59 AM | 216 (3.6%) | 53 (1.1%) |
| 12:00 PM to 3:59 PM | 186 (3.1%) | 57 (1.1%) |
| 4:00 PM to 11:59 PM | 74 (1.2%) | 274 (5.4%) |
| Total | 5,961 (100.0%) | 5,057 (100.0%) |
Housing Occupancy in Beverly Hills
Occupancy by Ownership in Beverly Hills
Of the total 14,338 dwellings in Beverly Hills, owner-occupied units account for 6,149 (42.9%), while renter-occupied units make up 8,189 (57.1%).
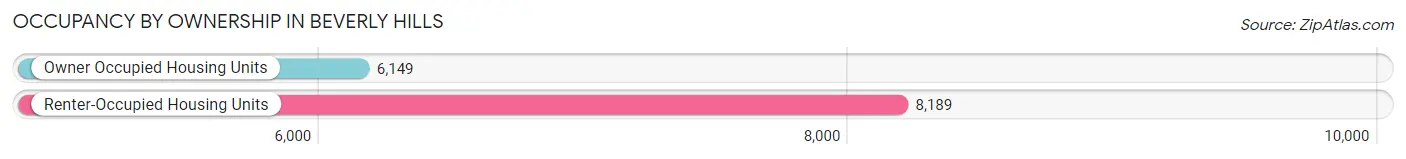
| Occupancy | # Housing Units | % Housing Units |
| Owner Occupied Housing Units | 6,149 | 42.9% |
| Renter-Occupied Housing Units | 8,189 | 57.1% |
| Total Occupied Housing Units | 14,338 | 100.0% |
Occupancy by Household Size in Beverly Hills
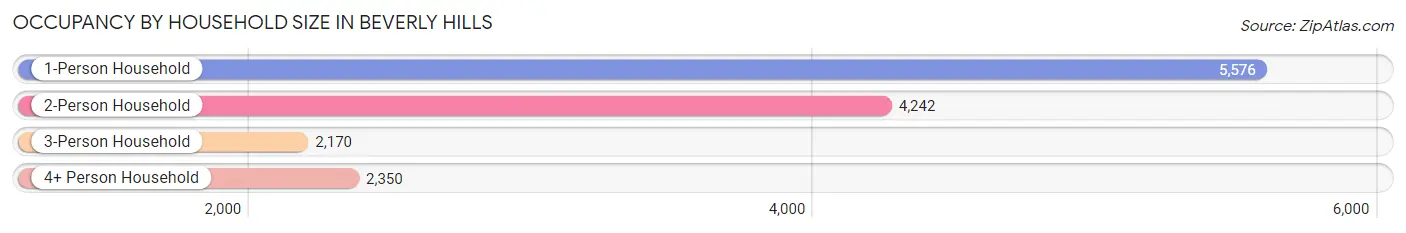
| Household Size | # Housing Units | % Housing Units |
| 1-Person Household | 5,576 | 38.9% |
| 2-Person Household | 4,242 | 29.6% |
| 3-Person Household | 2,170 | 15.1% |
| 4+ Person Household | 2,350 | 16.4% |
| Total Housing Units | 14,338 | 100.0% |
Occupancy by Ownership by Household Size in Beverly Hills
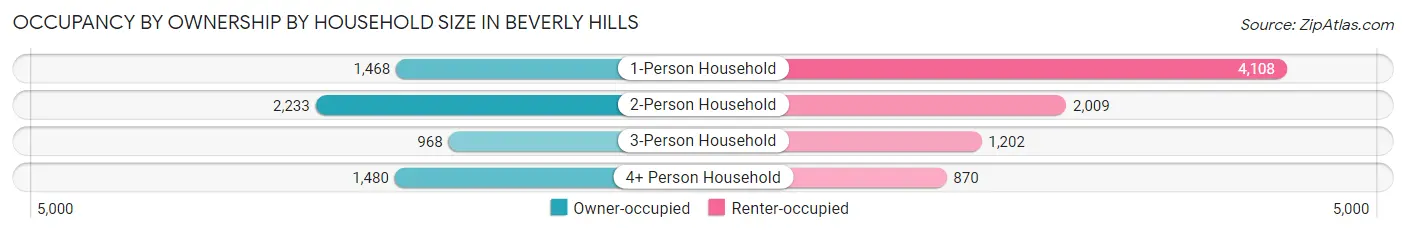
| Household Size | Owner-occupied | Renter-occupied |
| 1-Person Household | 1,468 (26.3%) | 4,108 (73.7%) |
| 2-Person Household | 2,233 (52.6%) | 2,009 (47.4%) |
| 3-Person Household | 968 (44.6%) | 1,202 (55.4%) |
| 4+ Person Household | 1,480 (63.0%) | 870 (37.0%) |
| Total Housing Units | 6,149 (42.9%) | 8,189 (57.1%) |
Occupancy by Educational Attainment in Beverly Hills
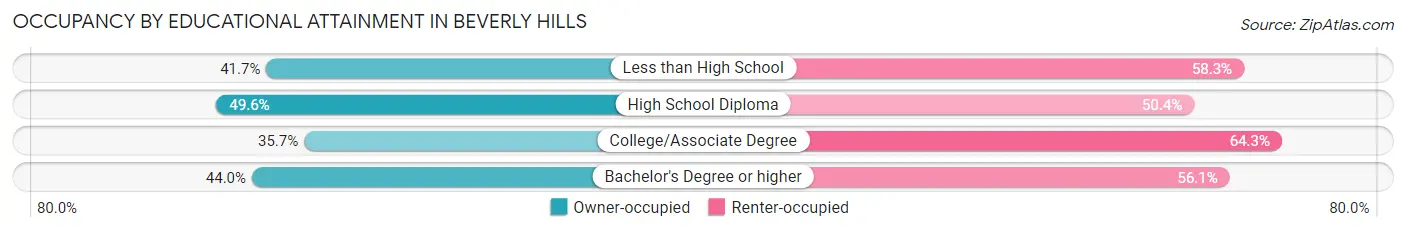
| Household Size | Owner-occupied | Renter-occupied |
| Less than High School | 170 (41.7%) | 238 (58.3%) |
| High School Diploma | 691 (49.6%) | 703 (50.4%) |
| College/Associate Degree | 955 (35.7%) | 1,722 (64.3%) |
| Bachelor's Degree or higher | 4,333 (44.0%) | 5,526 (56.0%) |
Occupancy by Age of Householder in Beverly Hills
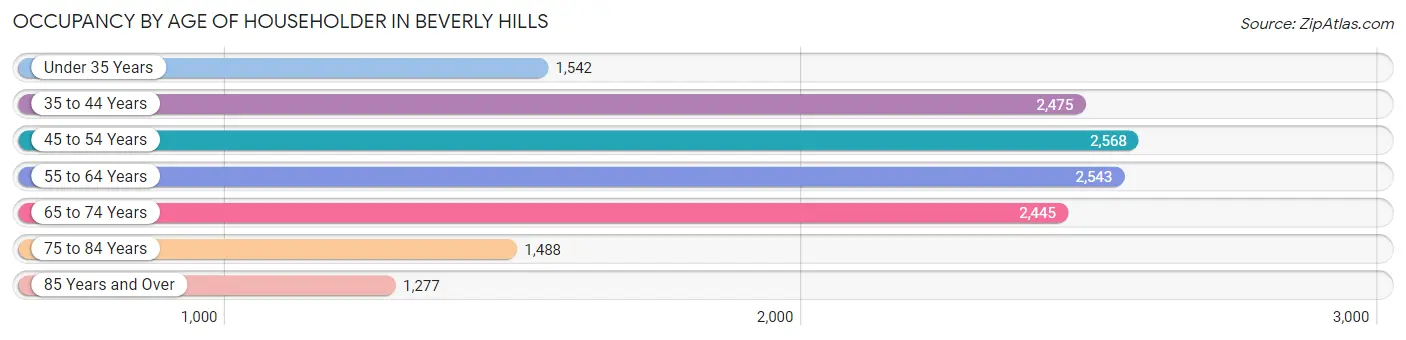
| Age Bracket | # Households | % Households |
| Under 35 Years | 1,542 | 10.7% |
| 35 to 44 Years | 2,475 | 17.3% |
| 45 to 54 Years | 2,568 | 17.9% |
| 55 to 64 Years | 2,543 | 17.7% |
| 65 to 74 Years | 2,445 | 17.1% |
| 75 to 84 Years | 1,488 | 10.4% |
| 85 Years and Over | 1,277 | 8.9% |
| Total | 14,338 | 100.0% |
Housing Finances in Beverly Hills
Median Income by Occupancy in Beverly Hills
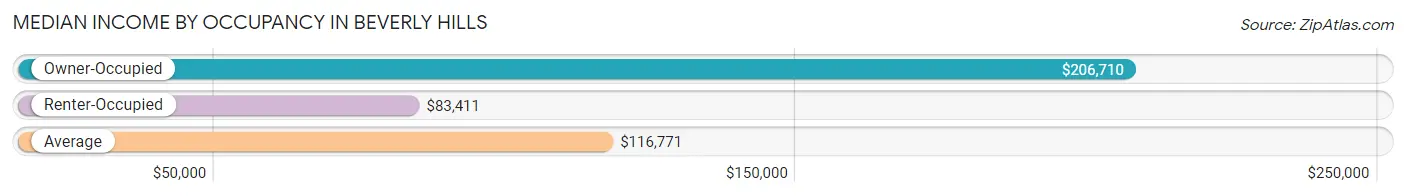
| Occupancy Type | # Households | Median Income |
| Owner-Occupied | 6,149 (42.9%) | $206,710 |
| Renter-Occupied | 8,189 (57.1%) | $83,411 |
| Average | 14,338 (100.0%) | $116,771 |
Occupancy by Householder Income Bracket in Beverly Hills
| Income Bracket | Owner-occupied | Renter-occupied |
| Less than $5,000 | 178 (2.9%) | 535 (6.5%) |
| $5,000 to $9,999 | 93 (1.5%) | 187 (2.3%) |
| $10,000 to $14,999 | 98 (1.6%) | 473 (5.8%) |
| $15,000 to $19,999 | 36 (0.6%) | 230 (2.8%) |
| $20,000 to $24,999 | 105 (1.7%) | 128 (1.6%) |
| $25,000 to $34,999 | 191 (3.1%) | 483 (5.9%) |
| $35,000 to $49,999 | 236 (3.8%) | 612 (7.5%) |
| $50,000 to $74,999 | 383 (6.2%) | 1,157 (14.1%) |
| $75,000 to $99,999 | 343 (5.6%) | 898 (11.0%) |
| $100,000 to $149,999 | 558 (9.1%) | 1,296 (15.8%) |
| $150,000 or more | 3,928 (63.9%) | 2,190 (26.7%) |
| Total | 6,149 (100.0%) | 8,189 (100.0%) |
Monthly Housing Cost Tiers in Beverly Hills
| Monthly Cost | Owner-occupied | Renter-occupied |
| Less than $300 | 36 (0.6%) | 184 (2.2%) |
| $300 to $499 | 16 (0.3%) | 81 (1.0%) |
| $500 to $799 | 154 (2.5%) | 34 (0.4%) |
| $800 to $999 | 100 (1.6%) | 132 (1.6%) |
| $1,000 to $1,499 | 571 (9.3%) | 468 (5.7%) |
| $1,500 to $1,999 | 351 (5.7%) | 899 (11.0%) |
| $2,000 to $2,499 | 293 (4.8%) | 1,801 (22.0%) |
| $2,500 to $2,999 | 368 (6.0%) | 1,111 (13.6%) |
| $3,000 or more | 4,260 (69.3%) | 3,265 (39.9%) |
| Total | 6,149 (100.0%) | 8,189 (100.0%) |
Physical Housing Characteristics in Beverly Hills
Housing Structures in Beverly Hills
| Structure Type | # Housing Units | % Housing Units |
| Single Unit, Detached | 5,572 | 38.9% |
| Single Unit, Attached | 286 | 2.0% |
| 2 Unit Apartments | 457 | 3.2% |
| 3 or 4 Unit Apartments | 785 | 5.5% |
| 5 to 9 Unit Apartments | 2,589 | 18.1% |
| 10 or more Apartments | 4,623 | 32.2% |
| Mobile Home / Other | 26 | 0.2% |
| Total | 14,338 | 100.0% |
Housing Structures by Occupancy in Beverly Hills
| Structure Type | Owner-occupied | Renter-occupied |
| Single Unit, Detached | 4,556 (81.8%) | 1,016 (18.2%) |
| Single Unit, Attached | 112 (39.2%) | 174 (60.8%) |
| 2 Unit Apartments | 72 (15.8%) | 385 (84.3%) |
| 3 or 4 Unit Apartments | 49 (6.2%) | 736 (93.8%) |
| 5 to 9 Unit Apartments | 228 (8.8%) | 2,361 (91.2%) |
| 10 or more Apartments | 1,106 (23.9%) | 3,517 (76.1%) |
| Mobile Home / Other | 26 (100.0%) | 0 (0.0%) |
| Total | 6,149 (42.9%) | 8,189 (57.1%) |
Housing Structures by Number of Rooms in Beverly Hills
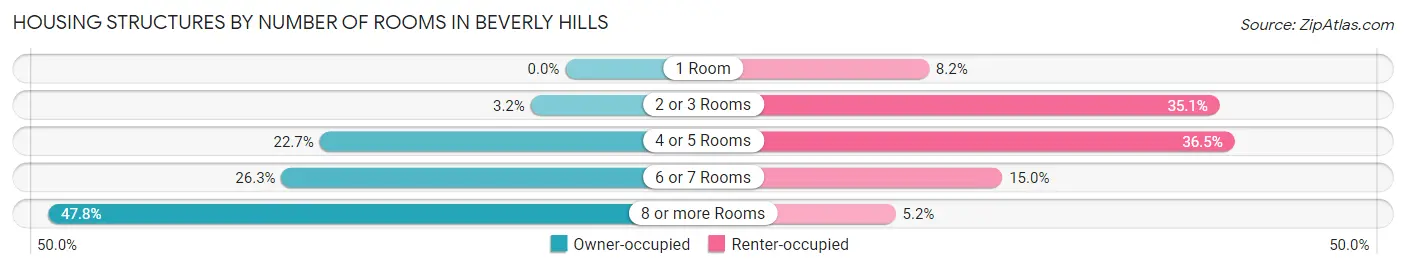
| Number of Rooms | Owner-occupied | Renter-occupied |
| 1 Room | 0 (0.0%) | 674 (8.2%) |
| 2 or 3 Rooms | 197 (3.2%) | 2,876 (35.1%) |
| 4 or 5 Rooms | 1,397 (22.7%) | 2,988 (36.5%) |
| 6 or 7 Rooms | 1,614 (26.3%) | 1,229 (15.0%) |
| 8 or more Rooms | 2,941 (47.8%) | 422 (5.1%) |
| Total | 6,149 (100.0%) | 8,189 (100.0%) |
Housing Structure by Heating Type in Beverly Hills
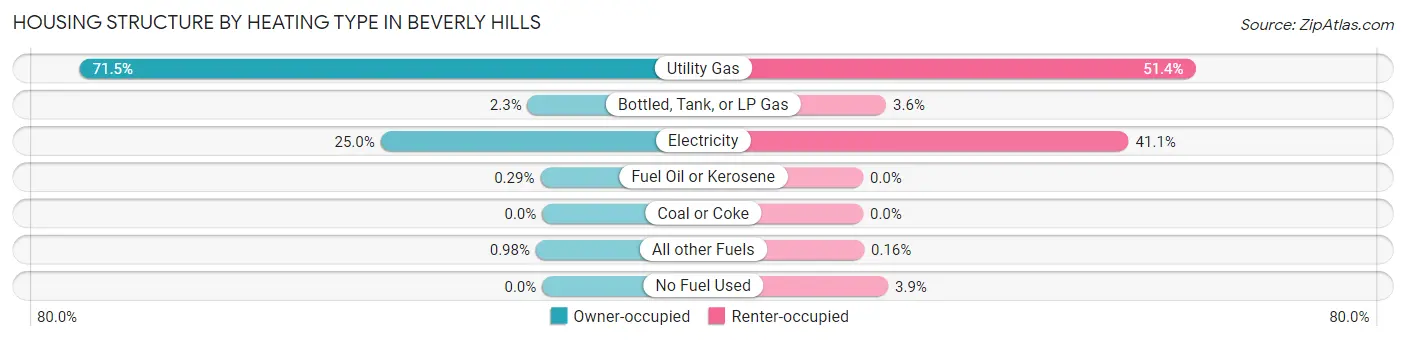
| Heating Type | Owner-occupied | Renter-occupied |
| Utility Gas | 4,396 (71.5%) | 4,205 (51.3%) |
| Bottled, Tank, or LP Gas | 139 (2.3%) | 292 (3.6%) |
| Electricity | 1,536 (25.0%) | 3,362 (41.1%) |
| Fuel Oil or Kerosene | 18 (0.3%) | 0 (0.0%) |
| Coal or Coke | 0 (0.0%) | 0 (0.0%) |
| All other Fuels | 60 (1.0%) | 13 (0.2%) |
| No Fuel Used | 0 (0.0%) | 317 (3.9%) |
| Total | 6,149 (100.0%) | 8,189 (100.0%) |
Household Vehicle Usage in Beverly Hills
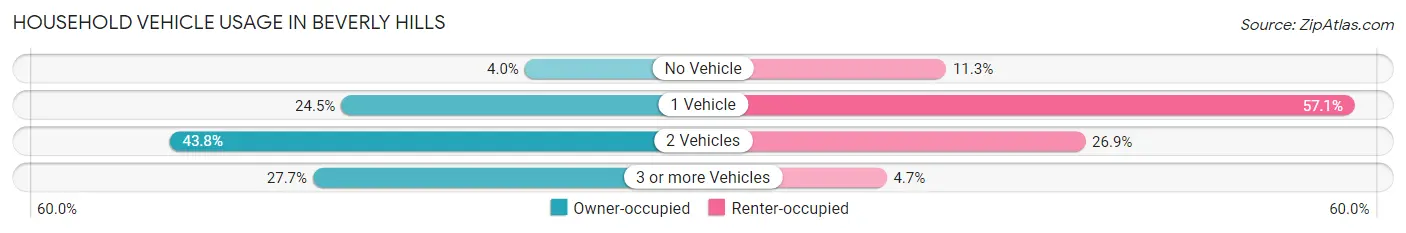
| Vehicles per Household | Owner-occupied | Renter-occupied |
| No Vehicle | 245 (4.0%) | 927 (11.3%) |
| 1 Vehicle | 1,509 (24.5%) | 4,677 (57.1%) |
| 2 Vehicles | 2,691 (43.8%) | 2,204 (26.9%) |
| 3 or more Vehicles | 1,704 (27.7%) | 381 (4.6%) |
| Total | 6,149 (100.0%) | 8,189 (100.0%) |
Real Estate & Mortgages in Beverly Hills
Real Estate and Mortgage Overview in Beverly Hills
| Characteristic | Without Mortgage | With Mortgage |
| Housing Units | 2,377 | 3,772 |
| Median Property Value | $2,000,001 | $2,000,001 |
| Median Household Income | $180,391 | $2,585 |
| Monthly Housing Costs | $1,501 | $3,280 |
| Real Estate Taxes | $10,001 | $35 |
Property Value by Mortgage Status in Beverly Hills
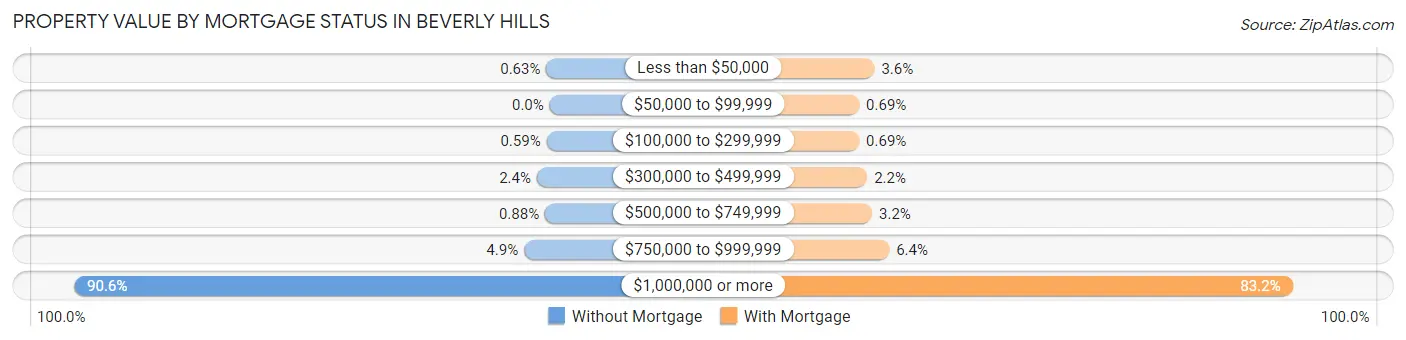
| Property Value | Without Mortgage | With Mortgage |
| Less than $50,000 | 15 (0.6%) | 136 (3.6%) |
| $50,000 to $99,999 | 0 (0.0%) | 26 (0.7%) |
| $100,000 to $299,999 | 14 (0.6%) | 26 (0.7%) |
| $300,000 to $499,999 | 58 (2.4%) | 84 (2.2%) |
| $500,000 to $749,999 | 21 (0.9%) | 119 (3.2%) |
| $750,000 to $999,999 | 116 (4.9%) | 242 (6.4%) |
| $1,000,000 or more | 2,153 (90.6%) | 3,139 (83.2%) |
| Total | 2,377 (100.0%) | 3,772 (100.0%) |
Household Income by Mortgage Status in Beverly Hills
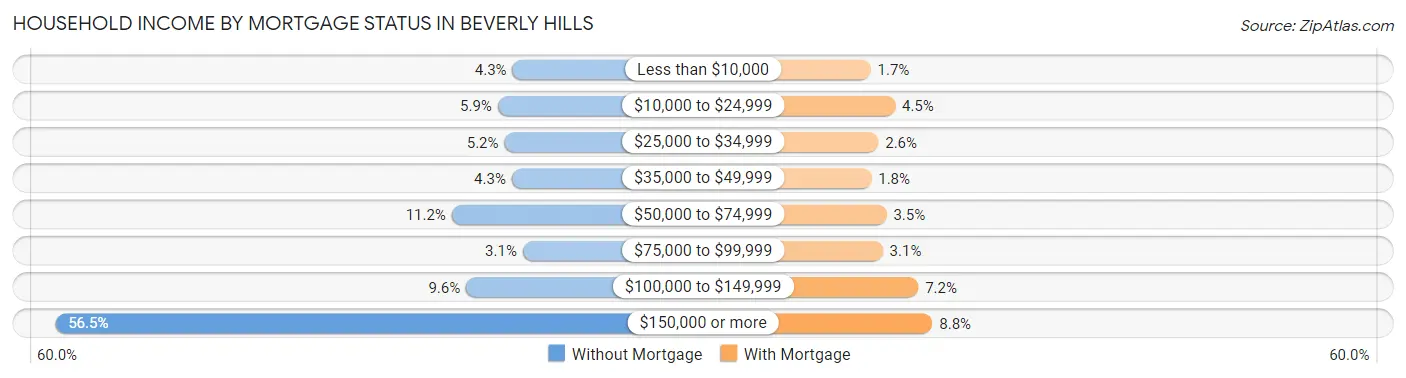
| Household Income | Without Mortgage | With Mortgage |
| Less than $10,000 | 101 (4.3%) | 65 (1.7%) |
| $10,000 to $24,999 | 141 (5.9%) | 170 (4.5%) |
| $25,000 to $34,999 | 123 (5.2%) | 98 (2.6%) |
| $35,000 to $49,999 | 103 (4.3%) | 68 (1.8%) |
| $50,000 to $74,999 | 266 (11.2%) | 133 (3.5%) |
| $75,000 to $99,999 | 73 (3.1%) | 117 (3.1%) |
| $100,000 to $149,999 | 227 (9.6%) | 270 (7.2%) |
| $150,000 or more | 1,343 (56.5%) | 331 (8.8%) |
| Total | 2,377 (100.0%) | 3,772 (100.0%) |
Property Value to Household Income Ratio in Beverly Hills
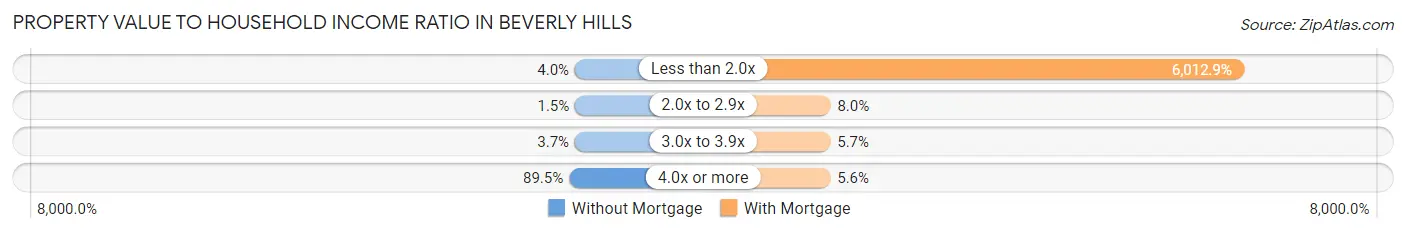
| Value-to-Income Ratio | Without Mortgage | With Mortgage |
| Less than 2.0x | 96 (4.0%) | 226,806 (6,012.9%) |
| 2.0x to 2.9x | 36 (1.5%) | 300 (8.0%) |
| 3.0x to 3.9x | 88 (3.7%) | 213 (5.7%) |
| 4.0x or more | 2,128 (89.5%) | 211 (5.6%) |
| Total | 2,377 (100.0%) | 3,772 (100.0%) |
Real Estate Taxes by Mortgage Status in Beverly Hills
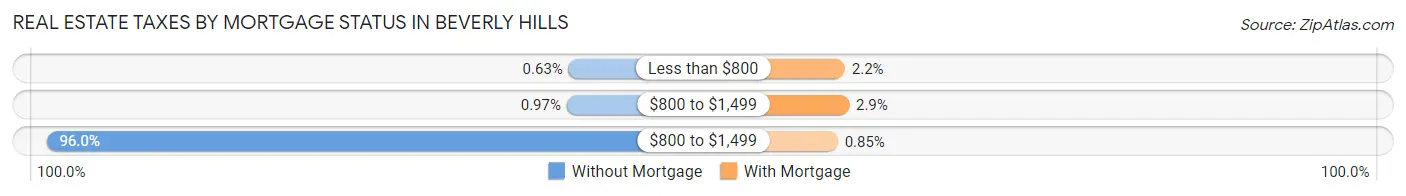
| Property Taxes | Without Mortgage | With Mortgage |
| Less than $800 | 15 (0.6%) | 81 (2.1%) |
| $800 to $1,499 | 23 (1.0%) | 110 (2.9%) |
| $800 to $1,499 | 2,282 (96.0%) | 32 (0.9%) |
| Total | 2,377 (100.0%) | 3,772 (100.0%) |
Health & Disability in Beverly Hills
Health Insurance Coverage by Age in Beverly Hills
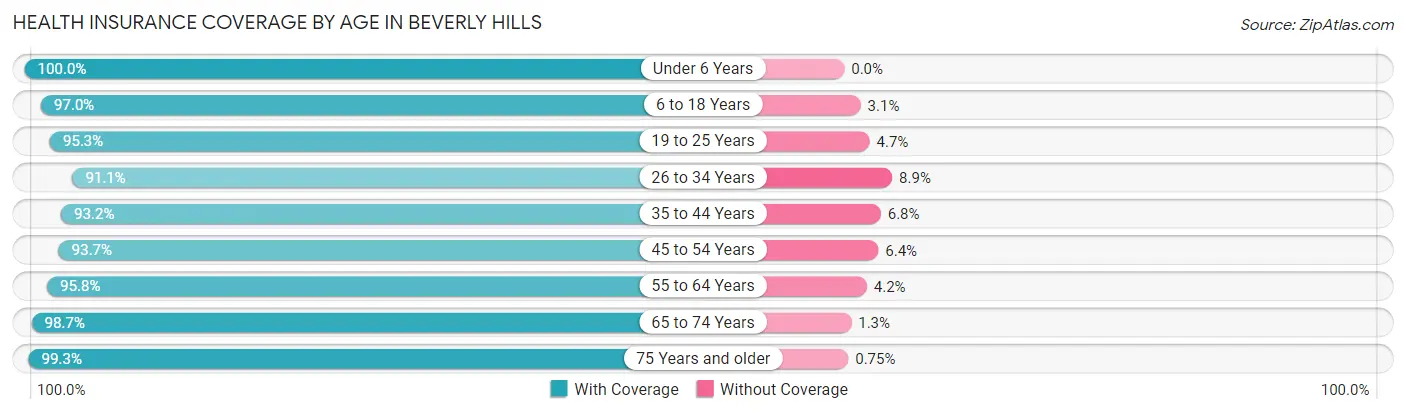
| Age Bracket | With Coverage | Without Coverage |
| Under 6 Years | 1,002 (100.0%) | 0 (0.0%) |
| 6 to 18 Years | 4,707 (97.0%) | 148 (3.0%) |
| 19 to 25 Years | 2,039 (95.3%) | 101 (4.7%) |
| 26 to 34 Years | 3,142 (91.1%) | 308 (8.9%) |
| 35 to 44 Years | 3,592 (93.2%) | 262 (6.8%) |
| 45 to 54 Years | 4,499 (93.6%) | 305 (6.4%) |
| 55 to 64 Years | 4,251 (95.8%) | 187 (4.2%) |
| 65 to 74 Years | 3,883 (98.7%) | 51 (1.3%) |
| 75 Years and older | 3,841 (99.3%) | 29 (0.7%) |
| Total | 30,956 (95.7%) | 1,391 (4.3%) |
Health Insurance Coverage by Citizenship Status in Beverly Hills
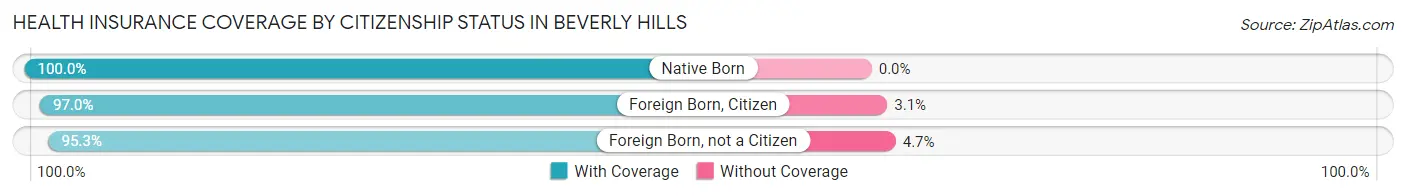
| Citizenship Status | With Coverage | Without Coverage |
| Native Born | 1,002 (100.0%) | 0 (0.0%) |
| Foreign Born, Citizen | 4,707 (97.0%) | 148 (3.0%) |
| Foreign Born, not a Citizen | 2,039 (95.3%) | 101 (4.7%) |
Health Insurance Coverage by Household Income in Beverly Hills
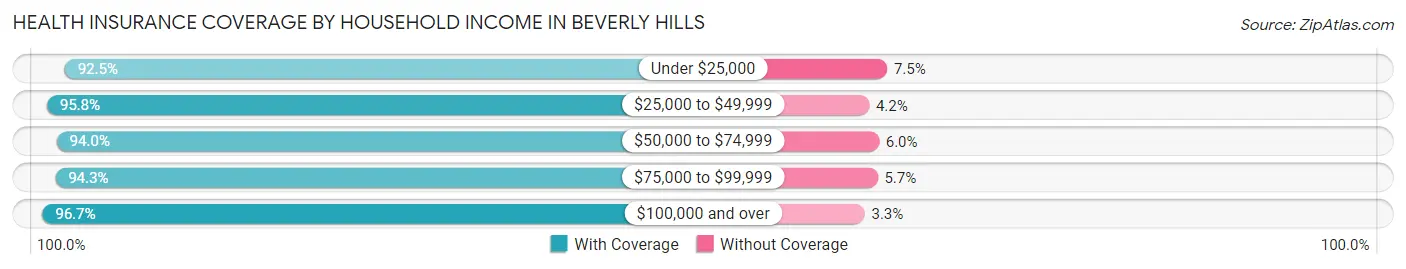
| Household Income | With Coverage | Without Coverage |
| Under $25,000 | 3,087 (92.5%) | 251 (7.5%) |
| $25,000 to $49,999 | 2,697 (95.8%) | 117 (4.2%) |
| $50,000 to $74,999 | 2,747 (94.0%) | 175 (6.0%) |
| $75,000 to $99,999 | 2,860 (94.3%) | 174 (5.7%) |
| $100,000 and over | 19,558 (96.7%) | 672 (3.3%) |
Public vs Private Health Insurance Coverage by Age in Beverly Hills
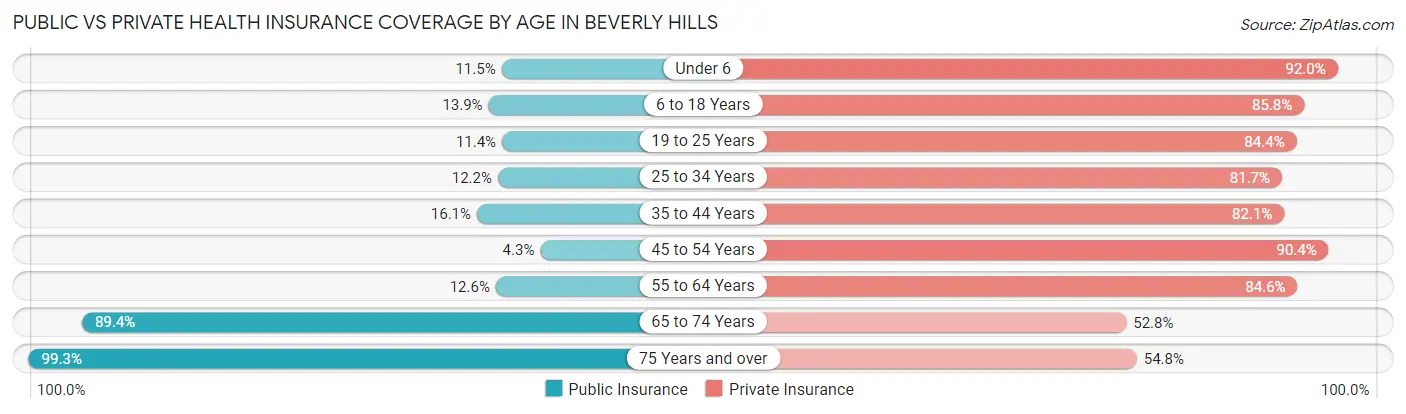
| Age Bracket | Public Insurance | Private Insurance |
| Under 6 | 115 (11.5%) | 922 (92.0%) |
| 6 to 18 Years | 675 (13.9%) | 4,165 (85.8%) |
| 19 to 25 Years | 244 (11.4%) | 1,806 (84.4%) |
| 25 to 34 Years | 420 (12.2%) | 2,818 (81.7%) |
| 35 to 44 Years | 619 (16.1%) | 3,164 (82.1%) |
| 45 to 54 Years | 206 (4.3%) | 4,341 (90.4%) |
| 55 to 64 Years | 557 (12.6%) | 3,753 (84.6%) |
| 65 to 74 Years | 3,515 (89.3%) | 2,077 (52.8%) |
| 75 Years and over | 3,841 (99.3%) | 2,119 (54.7%) |
| Total | 10,192 (31.5%) | 25,165 (77.8%) |
Disability Status by Sex by Age in Beverly Hills
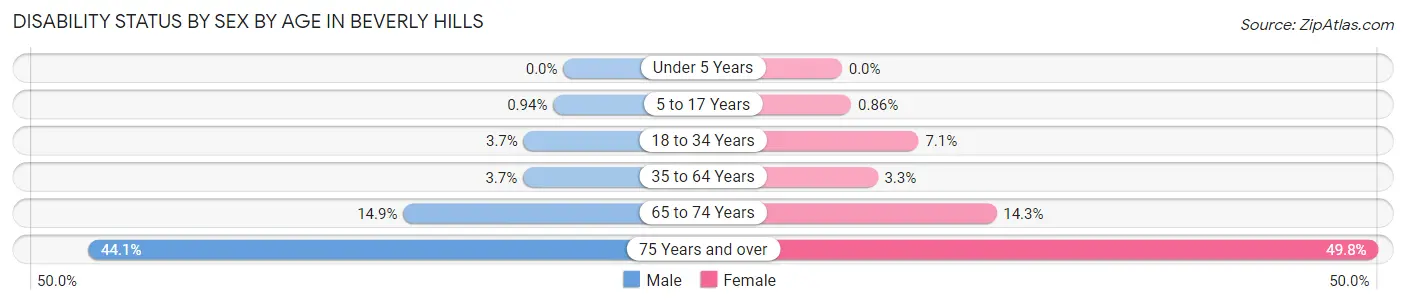
| Age Bracket | Male | Female |
| Under 5 Years | 0 (0.0%) | 0 (0.0%) |
| 5 to 17 Years | 21 (0.9%) | 22 (0.9%) |
| 18 to 34 Years | 98 (3.7%) | 222 (7.1%) |
| 35 to 64 Years | 223 (3.7%) | 236 (3.3%) |
| 65 to 74 Years | 279 (14.9%) | 295 (14.3%) |
| 75 Years and over | 738 (44.1%) | 1,094 (49.8%) |
Disability Class by Sex by Age in Beverly Hills
Disability Class: Hearing Difficulty
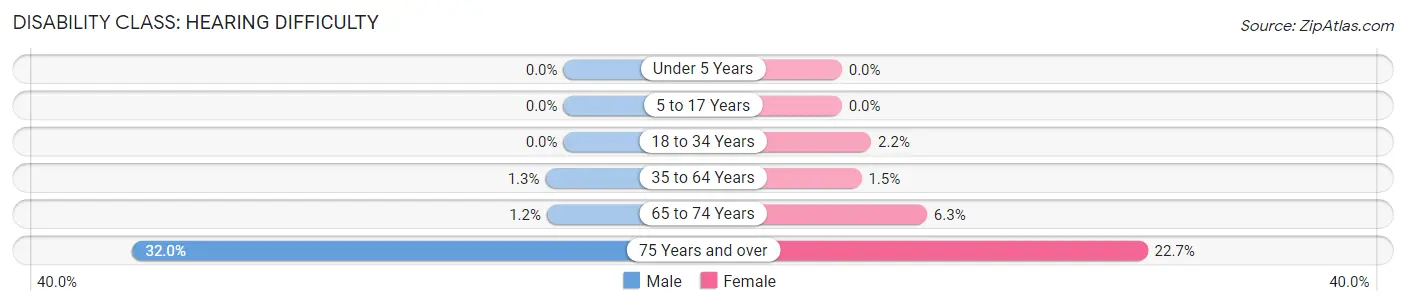
| Age Bracket | Male | Female |
| Under 5 Years | 0 (0.0%) | 0 (0.0%) |
| 5 to 17 Years | 0 (0.0%) | 0 (0.0%) |
| 18 to 34 Years | 0 (0.0%) | 68 (2.2%) |
| 35 to 64 Years | 80 (1.3%) | 104 (1.5%) |
| 65 to 74 Years | 23 (1.2%) | 130 (6.3%) |
| 75 Years and over | 535 (32.0%) | 499 (22.7%) |
Disability Class: Vision Difficulty
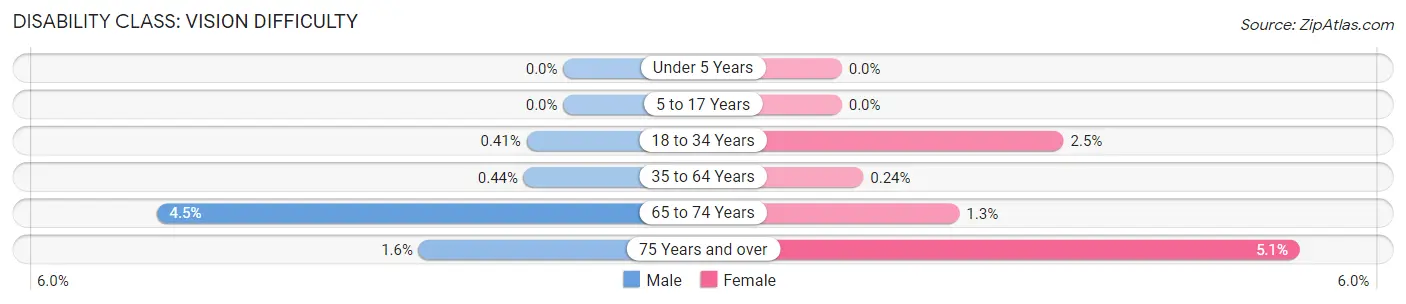
| Age Bracket | Male | Female |
| Under 5 Years | 0 (0.0%) | 0 (0.0%) |
| 5 to 17 Years | 0 (0.0%) | 0 (0.0%) |
| 18 to 34 Years | 11 (0.4%) | 77 (2.5%) |
| 35 to 64 Years | 26 (0.4%) | 17 (0.2%) |
| 65 to 74 Years | 85 (4.5%) | 27 (1.3%) |
| 75 Years and over | 27 (1.6%) | 112 (5.1%) |
Disability Class: Cognitive Difficulty
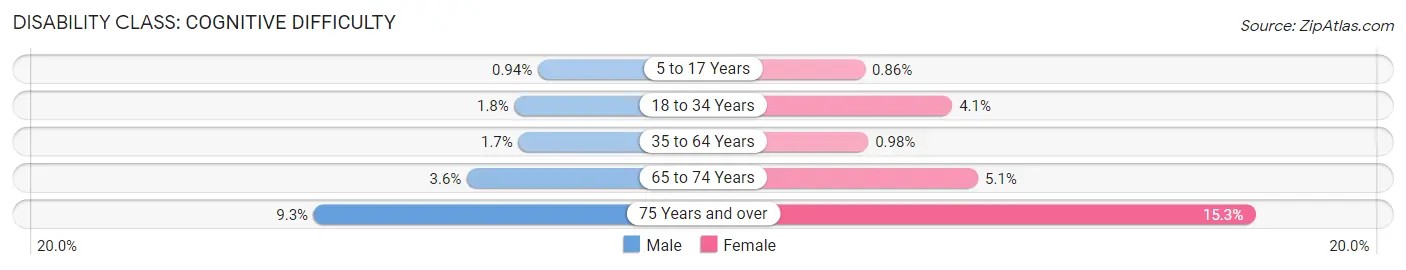
| Age Bracket | Male | Female |
| 5 to 17 Years | 21 (0.9%) | 22 (0.9%) |
| 18 to 34 Years | 48 (1.8%) | 128 (4.1%) |
| 35 to 64 Years | 99 (1.7%) | 70 (1.0%) |
| 65 to 74 Years | 67 (3.6%) | 104 (5.1%) |
| 75 Years and over | 155 (9.3%) | 337 (15.3%) |
Disability Class: Ambulatory Difficulty
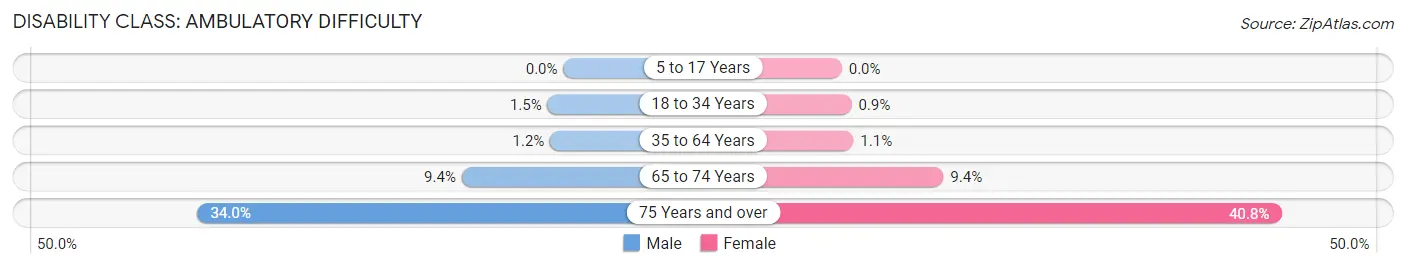
| Age Bracket | Male | Female |
| 5 to 17 Years | 0 (0.0%) | 0 (0.0%) |
| 18 to 34 Years | 39 (1.5%) | 28 (0.9%) |
| 35 to 64 Years | 73 (1.2%) | 77 (1.1%) |
| 65 to 74 Years | 177 (9.4%) | 194 (9.4%) |
| 75 Years and over | 568 (34.0%) | 896 (40.8%) |
Disability Class: Self-Care Difficulty
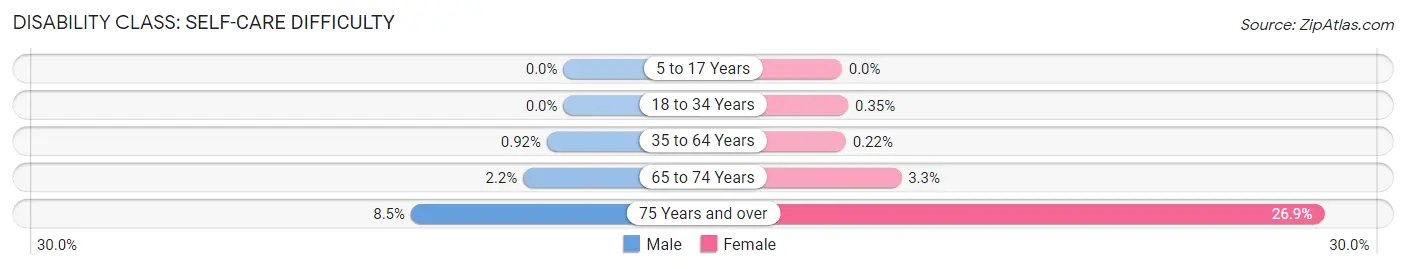
| Age Bracket | Male | Female |
| 5 to 17 Years | 0 (0.0%) | 0 (0.0%) |
| 18 to 34 Years | 0 (0.0%) | 11 (0.4%) |
| 35 to 64 Years | 55 (0.9%) | 16 (0.2%) |
| 65 to 74 Years | 42 (2.2%) | 68 (3.3%) |
| 75 Years and over | 142 (8.5%) | 590 (26.9%) |
Technology Access in Beverly Hills
Computing Device Access in Beverly Hills
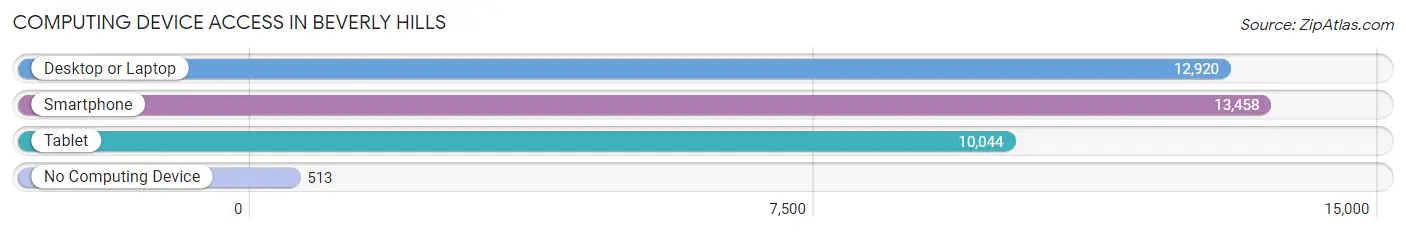
| Device Type | # Households | % Households |
| Desktop or Laptop | 12,920 | 90.1% |
| Smartphone | 13,458 | 93.9% |
| Tablet | 10,044 | 70.1% |
| No Computing Device | 513 | 3.6% |
| Total | 14,338 | 100.0% |
Internet Access in Beverly Hills
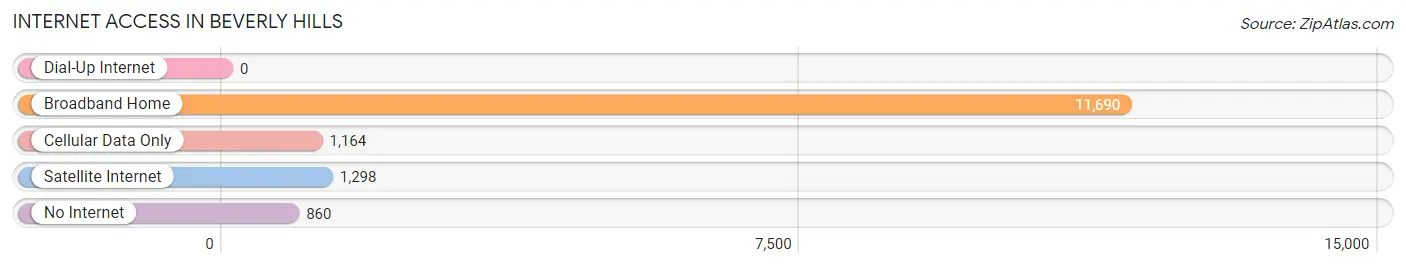
| Internet Type | # Households | % Households |
| Dial-Up Internet | 0 | 0.0% |
| Broadband Home | 11,690 | 81.5% |
| Cellular Data Only | 1,164 | 8.1% |
| Satellite Internet | 1,298 | 9.0% |
| No Internet | 860 | 6.0% |
| Total | 14,338 | 100.0% |
Beverly Hills Summary
Beverly Hills is a city located in Los Angeles County, California, United States. It is surrounded by the cities of Los Angeles and West Hollywood. As of the 2010 census, the city had a population of 34,109. It is home to many celebrities, luxury hotels, and upscale shopping.
Geography
Beverly Hills is located in the foothills of the Santa Monica Mountains, and is bordered by the cities of Los Angeles and West Hollywood. It is approximately 8 square miles in size, and is located at the intersection of Wilshire Boulevard and Santa Monica Boulevard. The city is divided into four distinct neighborhoods: North Beverly Hills, South Beverly Hills, West Beverly Hills, and East Beverly Hills.
The city is known for its hilly terrain, with many of its streets winding through the hills. The highest point in the city is Mount Beverly, which rises to an elevation of 1,210 feet. The city is also home to several parks, including Will Rogers State Historic Park, Beverly Gardens Park, and La Cienega Park.
Climate
Beverly Hills has a Mediterranean climate, with warm, dry summers and mild, wet winters. The average high temperature in the summer is around 85°F, and the average low temperature in the winter is around 55°F. The city receives an average of 15 inches of rain per year.
Demographics
As of the 2010 census, the population of Beverly Hills was 34,109. The racial makeup of the city was 79.2% White, 8.3% Asian, 6.2% African American, 0.3% Native American, 0.1% Pacific Islander, and 5.9% from other races. The median household income was $104,735, and the median family income was $118,945.
Economy
Beverly Hills is home to many luxury hotels, upscale shopping, and fine dining. The city is also home to many celebrities, and is a popular tourist destination. The city is home to many corporate headquarters, including the headquarters of the Academy of Motion Picture Arts and Sciences, the Academy of Television Arts and Sciences, and the Beverly Hills Chamber of Commerce.
The city is also home to many high-end retailers, including Gucci, Prada, and Louis Vuitton. The city is also home to many art galleries, museums, and theaters.
Conclusion
Beverly Hills is a city located in Los Angeles County, California, United States. It is known for its hilly terrain, luxury hotels, and upscale shopping. As of the 2010 census, the population of Beverly Hills was 34,109. The city is home to many celebrities, corporate headquarters, and high-end retailers. The city has a Mediterranean climate, with warm, dry summers and mild, wet winters. The economy of Beverly Hills is largely based on tourism, luxury retail, and corporate headquarters.
Common Questions
What is Per Capita Income in Beverly Hills?
Per Capita income in Beverly Hills is $103,693.
What is the Median Family Income in Beverly Hills?
Median Family Income in Beverly Hills is $181,600.
What is the Median Household income in Beverly Hills?
Median Household Income in Beverly Hills is $116,771.
What is Income or Wage Gap in Beverly Hills?
Income or Wage Gap in Beverly Hills is 34.5%.
Women in Beverly Hills earn 65.5 cents for every dollar earned by a man.
What is Family Income Deficit in Beverly Hills?
Family Income Deficit in Beverly Hills is $13,128.
Families that are below poverty line in Beverly Hills earn $13,128 less on average than the poverty threshold level.
What is Inequality or Gini Index in Beverly Hills?
Inequality or Gini Index in Beverly Hills is 0.61.
What is the Total Population of Beverly Hills?
Total Population of Beverly Hills is 32,406.
What is the Total Male Population of Beverly Hills?
Total Male Population of Beverly Hills is 14,907.
What is the Total Female Population of Beverly Hills?
Total Female Population of Beverly Hills is 17,499.
What is the Ratio of Males per 100 Females in Beverly Hills?
There are 85.19 Males per 100 Females in Beverly Hills.
What is the Ratio of Females per 100 Males in Beverly Hills?
There are 117.39 Females per 100 Males in Beverly Hills.
What is the Median Population Age in Beverly Hills?
Median Population Age in Beverly Hills is 47.5 Years.
What is the Average Family Size in Beverly Hills
Average Family Size in Beverly Hills is 3.1 People.
What is the Average Household Size in Beverly Hills
Average Household Size in Beverly Hills is 2.3 People.
How Large is the Labor Force in Beverly Hills?
There are 16,454 People in the Labor Forcein in Beverly Hills.
What is the Percentage of People in the Labor Force in Beverly Hills?
58.7% of People are in the Labor Force in Beverly Hills.
What is the Unemployment Rate in Beverly Hills?
Unemployment Rate in Beverly Hills is 8.6%.