Orangeburg, NY Map & Demographics
Orangeburg Map
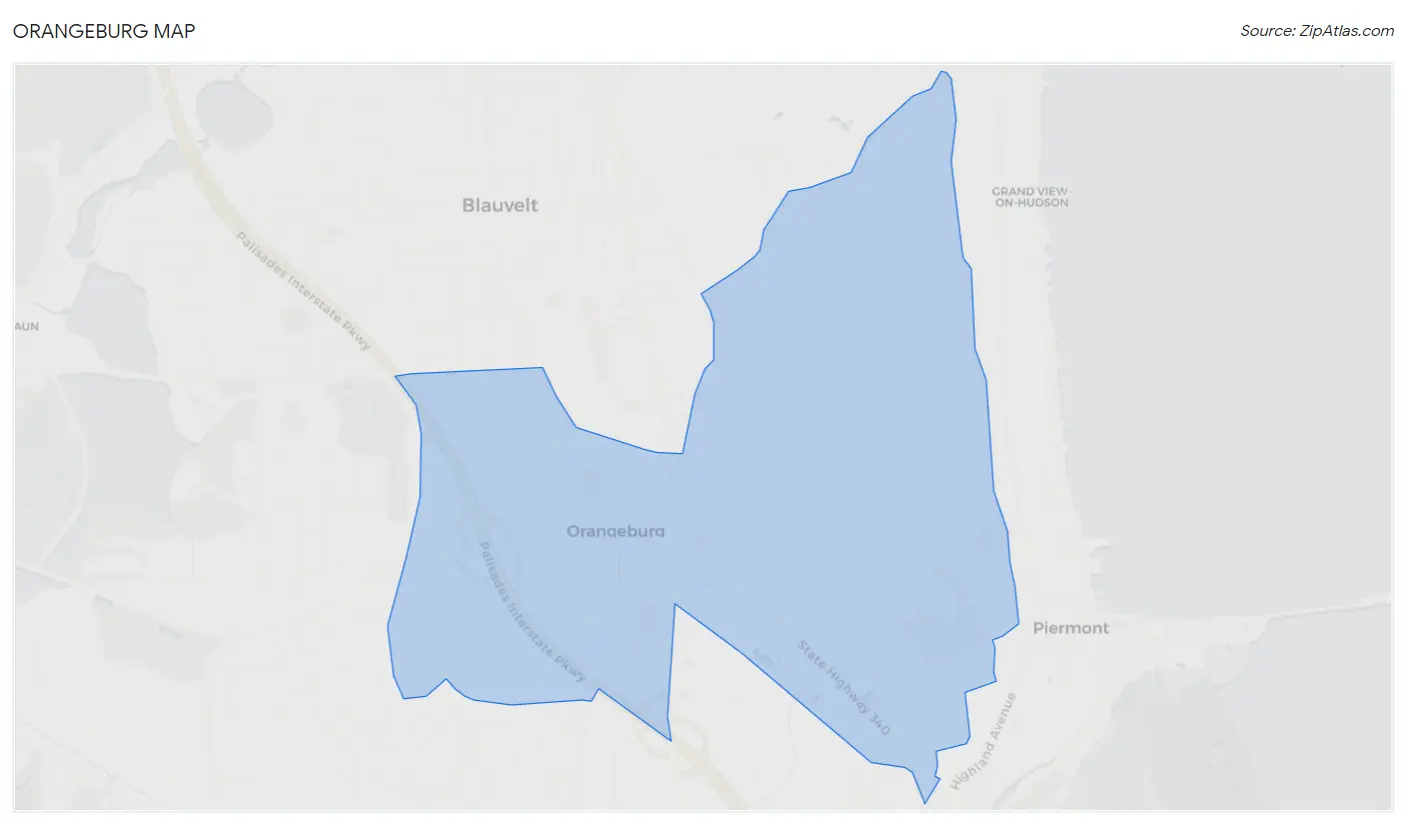
Orangeburg Overview
$47,317
PER CAPITA INCOME
$197,885
AVG FAMILY INCOME
$108,125
AVG HOUSEHOLD INCOME
0.46
INEQUALITY / GINI INDEX
4,745
TOTAL POPULATION
2,125
MALE POPULATION
2,620
FEMALE POPULATION
81.11
MALES / 100 FEMALES
123.29
FEMALES / 100 MALES
44.1
MEDIAN AGE
3.2
AVG FAMILY SIZE
2.5
AVG HOUSEHOLD SIZE
2,180
LABOR FORCE [ PEOPLE ]
52.7%
PERCENT IN LABOR FORCE
6.0%
UNEMPLOYMENT RATE
Orangeburg Zip Codes
Orangeburg Area Codes
Income in Orangeburg
Income Overview in Orangeburg
Per Capita Income in Orangeburg is $47,317, while median incomes of families and households are $197,885 and $108,125 respectively.
| Characteristic | Number | Measure |
| Per Capita Income | 4,745 | $47,317 |
| Median Family Income | 1,028 | $197,885 |
| Mean Family Income | 1,028 | $186,061 |
| Median Household Income | 1,532 | $108,125 |
| Mean Household Income | 1,532 | $137,601 |
| Income Deficit | 1,028 | $0 |
| Wage / Income Gap (%) | 4,745 | 0.00% |
| Wage / Income Gap ($) | 4,745 | 100.00¢ per $1 |
| Gini / Inequality Index | 4,745 | 0.46 |
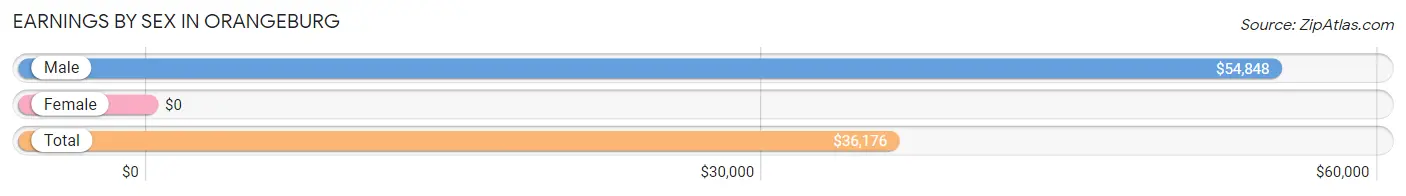
Earnings by Sex in Orangeburg
| Sex | Number | Average Earnings |
| Male | 1,175 (47.2%) | $54,848 |
| Female | 1,315 (52.8%) | $0 |
| Total | 2,490 (100.0%) | $36,176 |
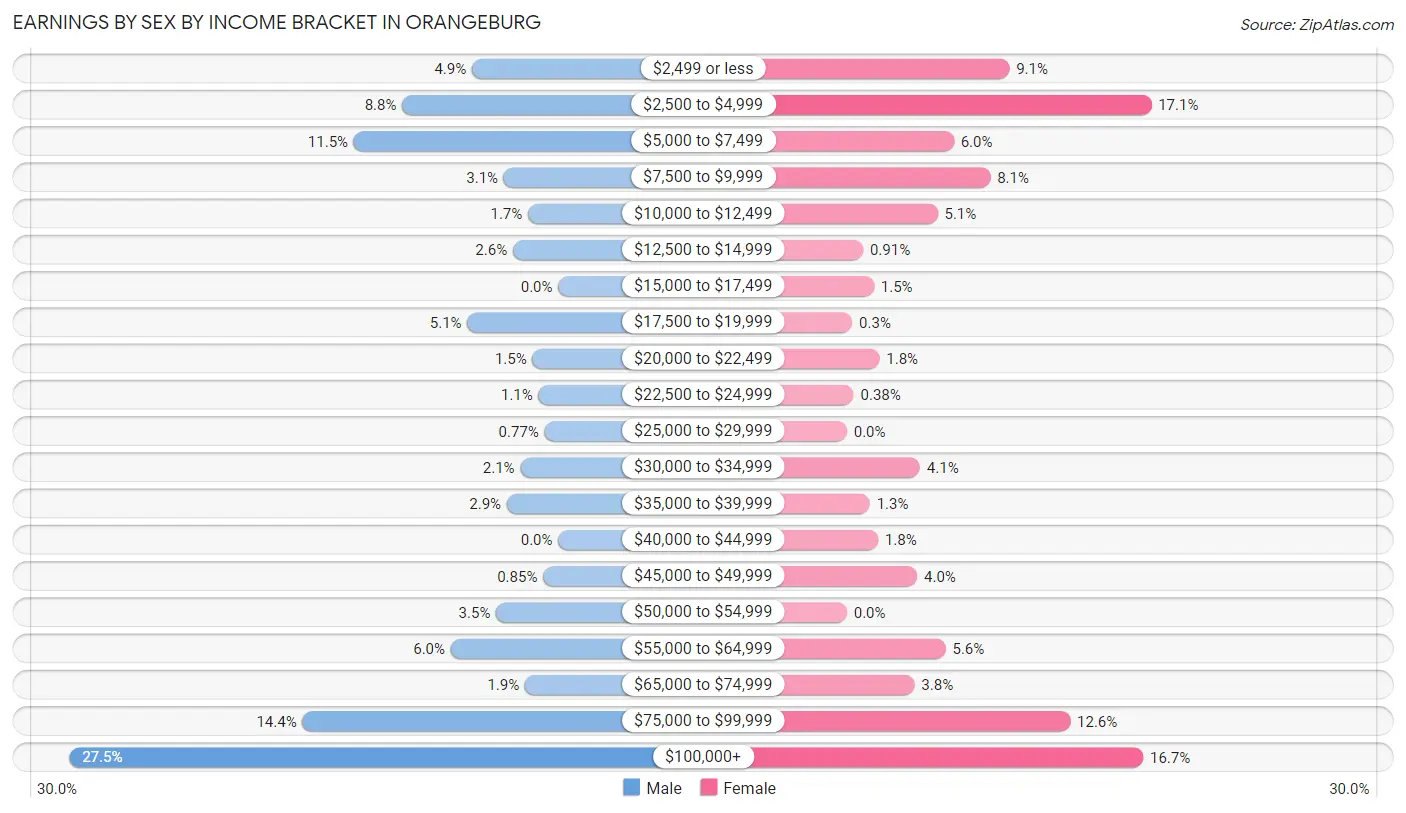
Earnings by Sex by Income Bracket in Orangeburg
The most common earnings brackets in Orangeburg are $100,000+ for men (323 | 27.5%) and $2,500 to $4,999 for women (225 | 17.1%).
| Income | Male | Female |
| $2,499 or less | 57 (4.9%) | 120 (9.1%) |
| $2,500 to $4,999 | 103 (8.8%) | 225 (17.1%) |
| $5,000 to $7,499 | 135 (11.5%) | 79 (6.0%) |
| $7,500 to $9,999 | 36 (3.1%) | 106 (8.1%) |
| $10,000 to $12,499 | 20 (1.7%) | 67 (5.1%) |
| $12,500 to $14,999 | 30 (2.5%) | 12 (0.9%) |
| $15,000 to $17,499 | 0 (0.0%) | 20 (1.5%) |
| $17,500 to $19,999 | 60 (5.1%) | 4 (0.3%) |
| $20,000 to $22,499 | 17 (1.5%) | 24 (1.8%) |
| $22,500 to $24,999 | 13 (1.1%) | 5 (0.4%) |
| $25,000 to $29,999 | 9 (0.8%) | 0 (0.0%) |
| $30,000 to $34,999 | 25 (2.1%) | 54 (4.1%) |
| $35,000 to $39,999 | 34 (2.9%) | 17 (1.3%) |
| $40,000 to $44,999 | 0 (0.0%) | 23 (1.8%) |
| $45,000 to $49,999 | 10 (0.9%) | 52 (4.0%) |
| $50,000 to $54,999 | 41 (3.5%) | 0 (0.0%) |
| $55,000 to $64,999 | 71 (6.0%) | 73 (5.6%) |
| $65,000 to $74,999 | 22 (1.9%) | 50 (3.8%) |
| $75,000 to $99,999 | 169 (14.4%) | 165 (12.6%) |
| $100,000+ | 323 (27.5%) | 219 (16.7%) |
| Total | 1,175 (100.0%) | 1,315 (100.0%) |
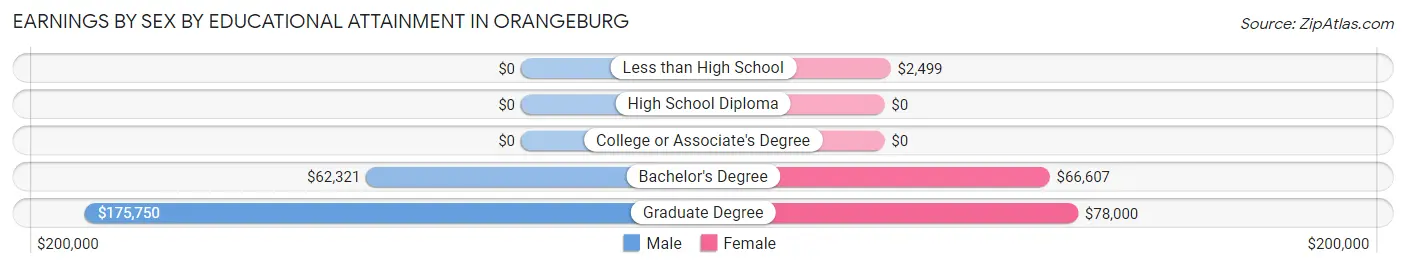
Earnings by Sex by Educational Attainment in Orangeburg
Average earnings in Orangeburg are $83,082 for men and $59,432 for women, a difference of 28.5%. Men with an educational attainment of graduate degree enjoy the highest average annual earnings of $175,750, while those with bachelor's degree education earn the least with $62,321. Women with an educational attainment of graduate degree earn the most with the average annual earnings of $78,000, while those with less than high school education have the smallest earnings of $2,499.
| Educational Attainment | Male Income | Female Income |
| Less than High School | - | - |
| High School Diploma | - | - |
| College or Associate's Degree | - | - |
| Bachelor's Degree | $62,321 | $66,607 |
| Graduate Degree | $175,750 | $78,000 |
| Total | $83,082 | $59,432 |
Family Income in Orangeburg
Family Income Brackets in Orangeburg
According to the Orangeburg family income data, there are 503 families falling into the $200,000+ income range, which is the most common income bracket and makes up 48.9% of all families.
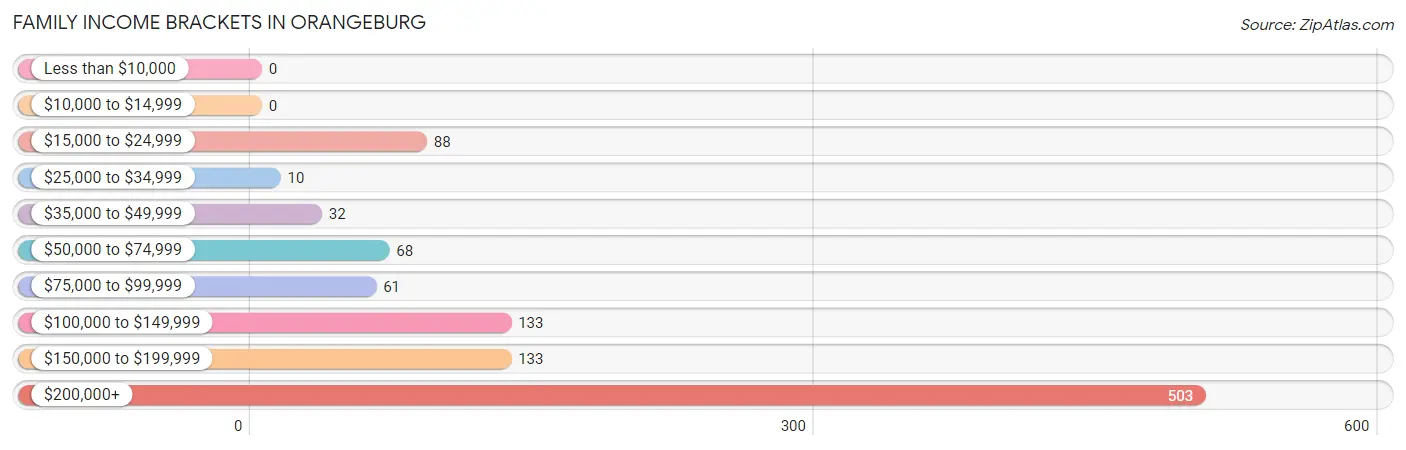
| Income Bracket | # Families | % Families |
| Less than $10,000 | 0 | 0.0% |
| $10,000 to $14,999 | 0 | 0.0% |
| $15,000 to $24,999 | 88 | 8.6% |
| $25,000 to $34,999 | 10 | 1.0% |
| $35,000 to $49,999 | 32 | 3.1% |
| $50,000 to $74,999 | 68 | 6.6% |
| $75,000 to $99,999 | 61 | 5.9% |
| $100,000 to $149,999 | 133 | 12.9% |
| $150,000 to $199,999 | 133 | 12.9% |
| $200,000+ | 503 | 48.9% |
Family Income by Famaliy Size in Orangeburg
5-person families (58 | 5.6%) account for the highest median family income in Orangeburg with $250,001 per family, while 2-person families (336 | 32.7%) have the highest median income of $65,312 per family member.
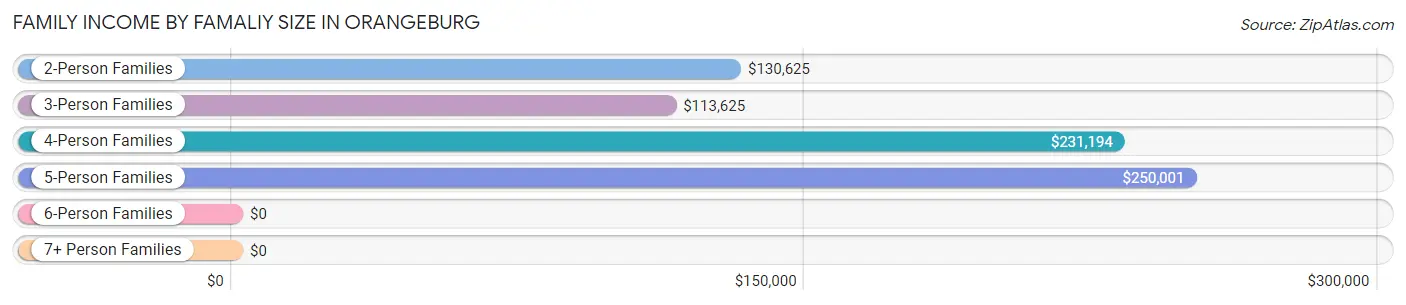
| Income Bracket | # Families | Median Income |
| 2-Person Families | 336 (32.7%) | $130,625 |
| 3-Person Families | 285 (27.7%) | $113,625 |
| 4-Person Families | 337 (32.8%) | $231,194 |
| 5-Person Families | 58 (5.6%) | $250,001 |
| 6-Person Families | 6 (0.6%) | $0 |
| 7+ Person Families | 6 (0.6%) | $0 |
| Total | 1,028 (100.0%) | $197,885 |
Family Income by Number of Earners in Orangeburg
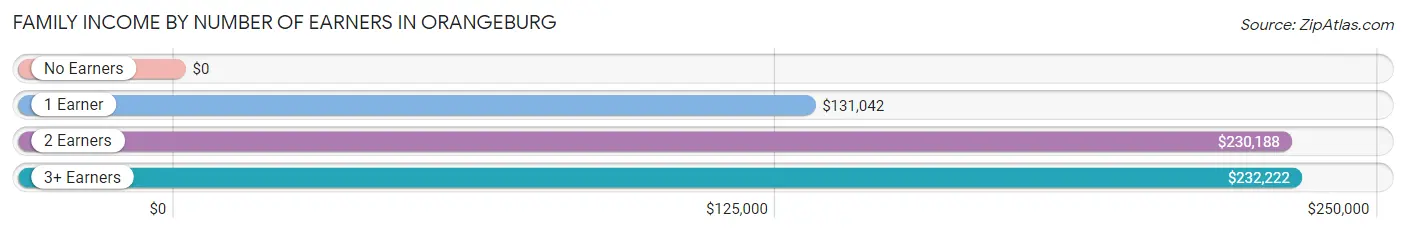
| Number of Earners | # Families | Median Income |
| No Earners | 175 (17.0%) | $0 |
| 1 Earner | 274 (26.7%) | $131,042 |
| 2 Earners | 429 (41.7%) | $230,188 |
| 3+ Earners | 150 (14.6%) | $232,222 |
| Total | 1,028 (100.0%) | $197,885 |
Household Income in Orangeburg
Household Income Brackets in Orangeburg
With 519 households falling in the category, the $200,000+ income range is the most frequent in Orangeburg, accounting for 33.9% of all households. In contrast, only 32 households (2.1%) fall into the $10,000 to $14,999 income bracket, making it the least populous group.
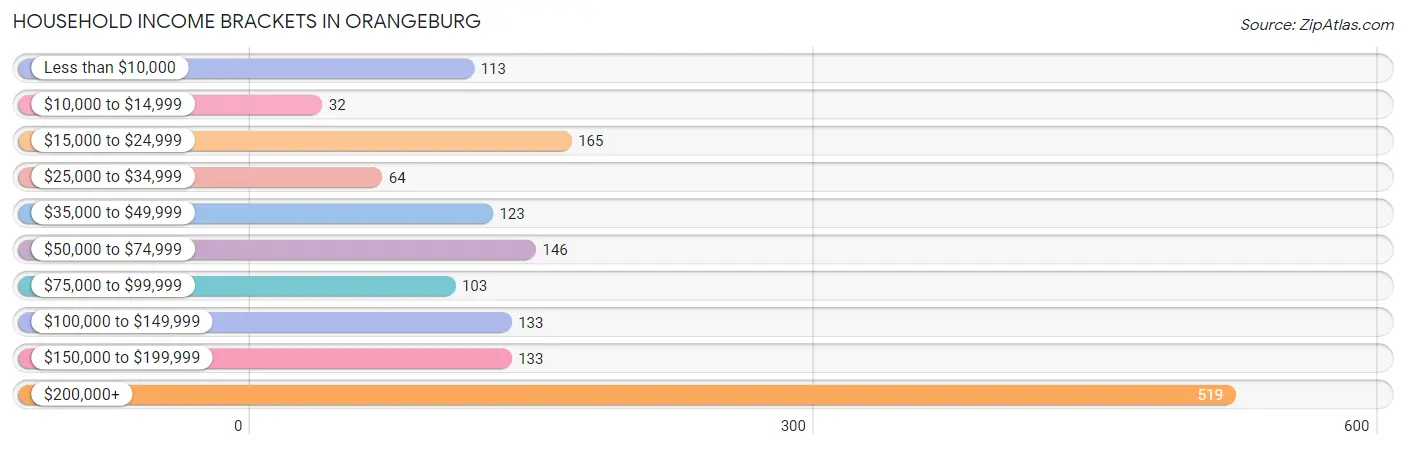
| Income Bracket | # Households | % Households |
| Less than $10,000 | 113 | 7.4% |
| $10,000 to $14,999 | 32 | 2.1% |
| $15,000 to $24,999 | 165 | 10.8% |
| $25,000 to $34,999 | 64 | 4.2% |
| $35,000 to $49,999 | 123 | 8.0% |
| $50,000 to $74,999 | 146 | 9.5% |
| $75,000 to $99,999 | 103 | 6.7% |
| $100,000 to $149,999 | 133 | 8.7% |
| $150,000 to $199,999 | 133 | 8.7% |
| $200,000+ | 519 | 33.9% |
Household Income by Householder Age in Orangeburg
The median household income in Orangeburg is $108,125, with the highest median household income of $223,438 found in the 25 to 44 years age bracket for the primary householder. A total of 353 households (23.0%) fall into this category. Meanwhile, the 15 to 24 years age bracket for the primary householder has the lowest median household income of $0, with 9 households (0.6%) in this group.
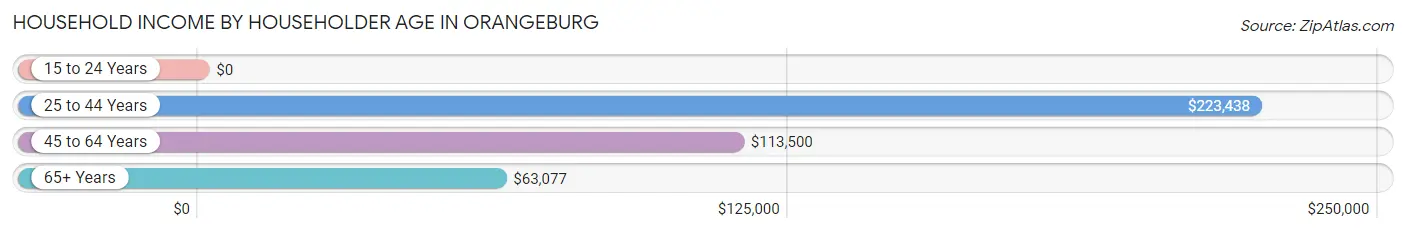
| Income Bracket | # Households | Median Income |
| 15 to 24 Years | 9 (0.6%) | $0 |
| 25 to 44 Years | 353 (23.0%) | $223,438 |
| 45 to 64 Years | 460 (30.0%) | $113,500 |
| 65+ Years | 710 (46.3%) | $63,077 |
| Total | 1,532 (100.0%) | $108,125 |
Poverty in Orangeburg
Income Below Poverty by Sex and Age in Orangeburg
With 9.1% poverty level for males and 14.3% for females among the residents of Orangeburg, 25 to 34 year old males and 75 year old and over females are the most vulnerable to poverty, with 71 males (33.8%) and 202 females (36.7%) in their respective age groups living below the poverty level.
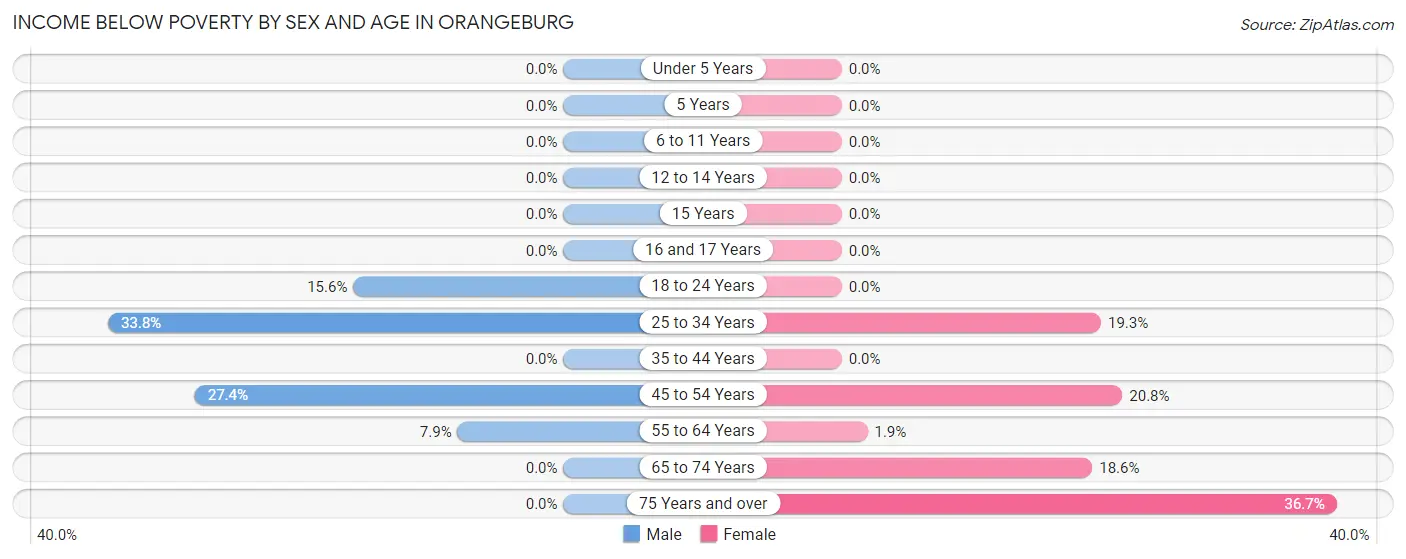
| Age Bracket | Male | Female |
| Under 5 Years | 0 (0.0%) | 0 (0.0%) |
| 5 Years | 0 (0.0%) | 0 (0.0%) |
| 6 to 11 Years | 0 (0.0%) | 0 (0.0%) |
| 12 to 14 Years | 0 (0.0%) | 0 (0.0%) |
| 15 Years | 0 (0.0%) | 0 (0.0%) |
| 16 and 17 Years | 0 (0.0%) | 0 (0.0%) |
| 18 to 24 Years | 17 (15.6%) | 0 (0.0%) |
| 25 to 34 Years | 71 (33.8%) | 41 (19.3%) |
| 35 to 44 Years | 0 (0.0%) | 0 (0.0%) |
| 45 to 54 Years | 58 (27.4%) | 40 (20.8%) |
| 55 to 64 Years | 18 (7.9%) | 5 (1.9%) |
| 65 to 74 Years | 0 (0.0%) | 40 (18.6%) |
| 75 Years and over | 0 (0.0%) | 202 (36.7%) |
| Total | 164 (9.1%) | 328 (14.3%) |
Income Above Poverty by Sex and Age in Orangeburg
According to the poverty statistics in Orangeburg, males aged under 5 years and females aged under 5 years are the age groups that are most secure financially, with 100.0% of males and 100.0% of females in these age groups living above the poverty line.
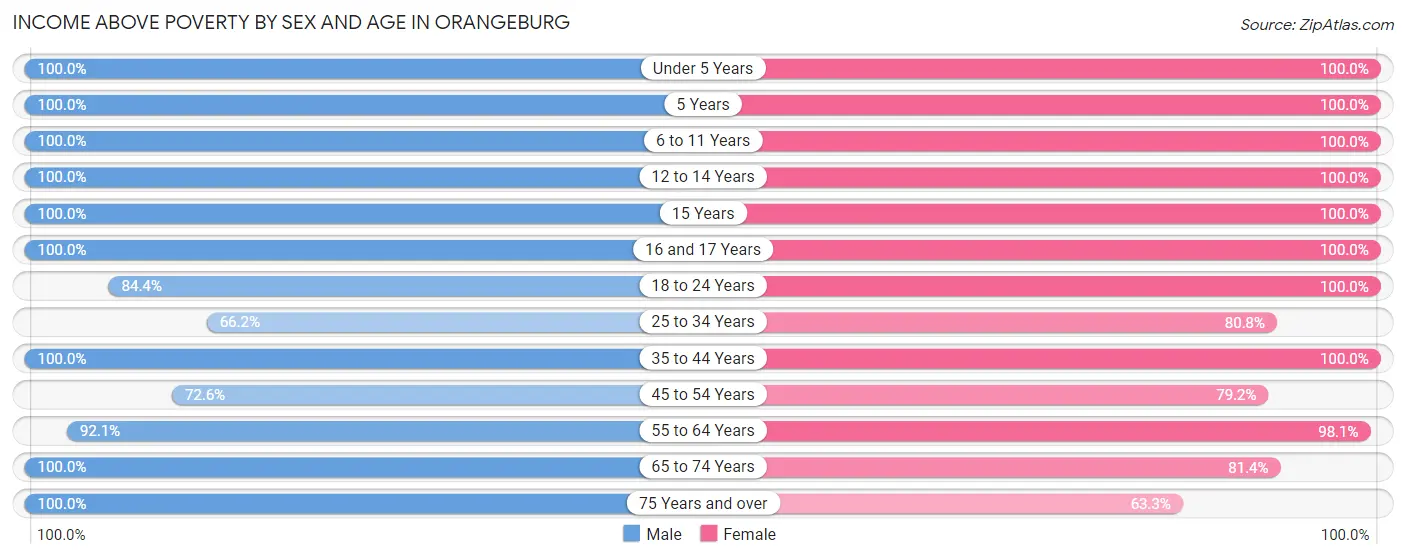
| Age Bracket | Male | Female |
| Under 5 Years | 31 (100.0%) | 109 (100.0%) |
| 5 Years | 48 (100.0%) | 80 (100.0%) |
| 6 to 11 Years | 104 (100.0%) | 164 (100.0%) |
| 12 to 14 Years | 12 (100.0%) | 36 (100.0%) |
| 15 Years | 10 (100.0%) | 5 (100.0%) |
| 16 and 17 Years | 68 (100.0%) | 59 (100.0%) |
| 18 to 24 Years | 92 (84.4%) | 127 (100.0%) |
| 25 to 34 Years | 139 (66.2%) | 172 (80.7%) |
| 35 to 44 Years | 295 (100.0%) | 284 (100.0%) |
| 45 to 54 Years | 154 (72.6%) | 152 (79.2%) |
| 55 to 64 Years | 211 (92.1%) | 257 (98.1%) |
| 65 to 74 Years | 216 (100.0%) | 175 (81.4%) |
| 75 Years and over | 258 (100.0%) | 348 (63.3%) |
| Total | 1,638 (90.9%) | 1,968 (85.7%) |
Income Below Poverty Among Married-Couple Families in Orangeburg
The poverty statistics for married-couple families in Orangeburg show that 4.9% or 46 of the total 947 families live below the poverty line. Families with no children have the highest poverty rate of 8.5%, comprising of 46 families. On the other hand, families with 1 or 2 children have the lowest poverty rate of 0.0%, which includes 0 families.
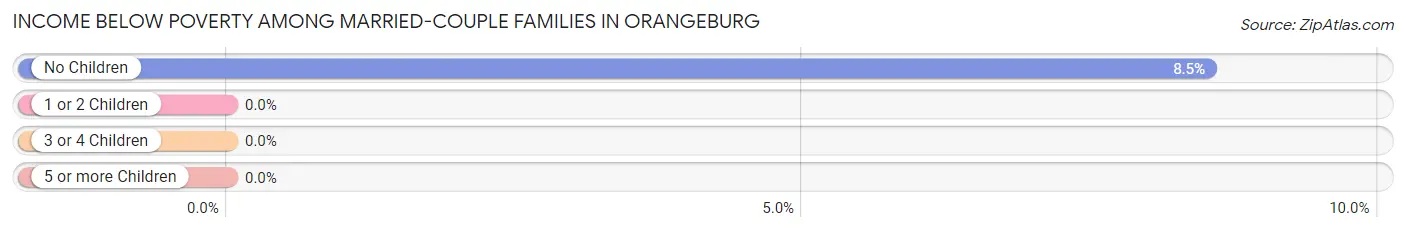
| Children | Above Poverty | Below Poverty |
| No Children | 494 (91.5%) | 46 (8.5%) |
| 1 or 2 Children | 395 (100.0%) | 0 (0.0%) |
| 3 or 4 Children | 12 (100.0%) | 0 (0.0%) |
| 5 or more Children | 0 (0.0%) | 0 (0.0%) |
| Total | 901 (95.1%) | 46 (4.9%) |
Income Below Poverty Among Single-Parent Households in Orangeburg
| Children | Single Father | Single Mother |
| No Children | 0 (0.0%) | 0 (0.0%) |
| 1 or 2 Children | 0 (0.0%) | 0 (0.0%) |
| 3 or 4 Children | 0 (0.0%) | 0 (0.0%) |
| 5 or more Children | 0 (0.0%) | 0 (0.0%) |
| Total | 0 (0.0%) | 0 (0.0%) |
Income Below Poverty Among Married-Couple vs Single-Parent Households in Orangeburg
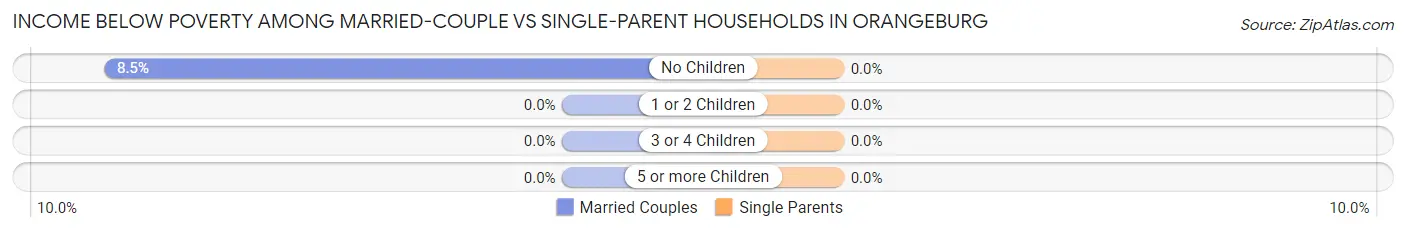
| Children | Married-Couple Families | Single-Parent Households |
| No Children | 46 (8.5%) | 0 (0.0%) |
| 1 or 2 Children | 0 (0.0%) | 0 (0.0%) |
| 3 or 4 Children | 0 (0.0%) | 0 (0.0%) |
| 5 or more Children | 0 (0.0%) | 0 (0.0%) |
| Total | 46 (4.9%) | 0 (0.0%) |
Race in Orangeburg
The most populous races in Orangeburg are White / Caucasian (3,091 | 65.1%), Hispanic or Latino (721 | 15.2%), and Asian (620 | 13.1%).
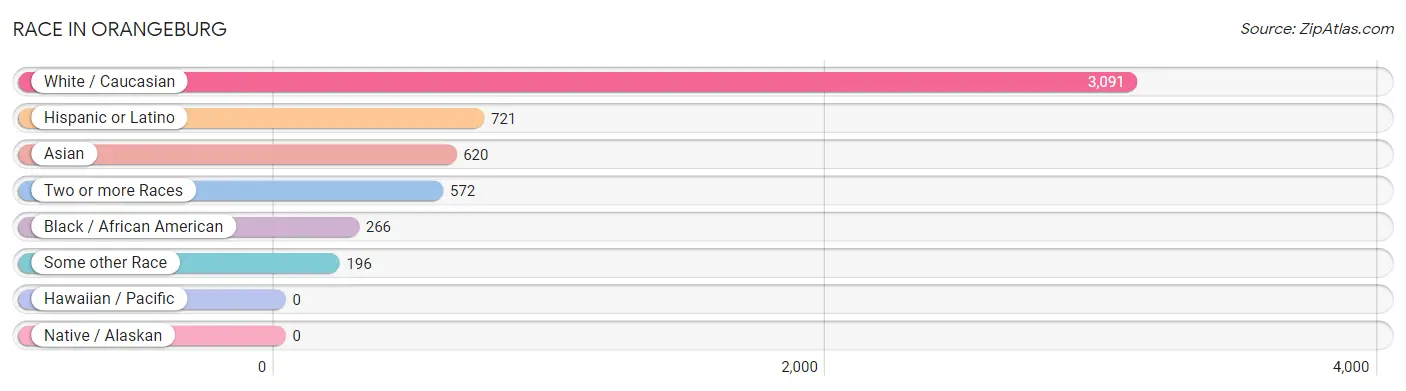
| Race | # Population | % Population |
| Asian | 620 | 13.1% |
| Black / African American | 266 | 5.6% |
| Hawaiian / Pacific | 0 | 0.0% |
| Hispanic or Latino | 721 | 15.2% |
| Native / Alaskan | 0 | 0.0% |
| White / Caucasian | 3,091 | 65.1% |
| Two or more Races | 572 | 12.0% |
| Some other Race | 196 | 4.1% |
| Total | 4,745 | 100.0% |
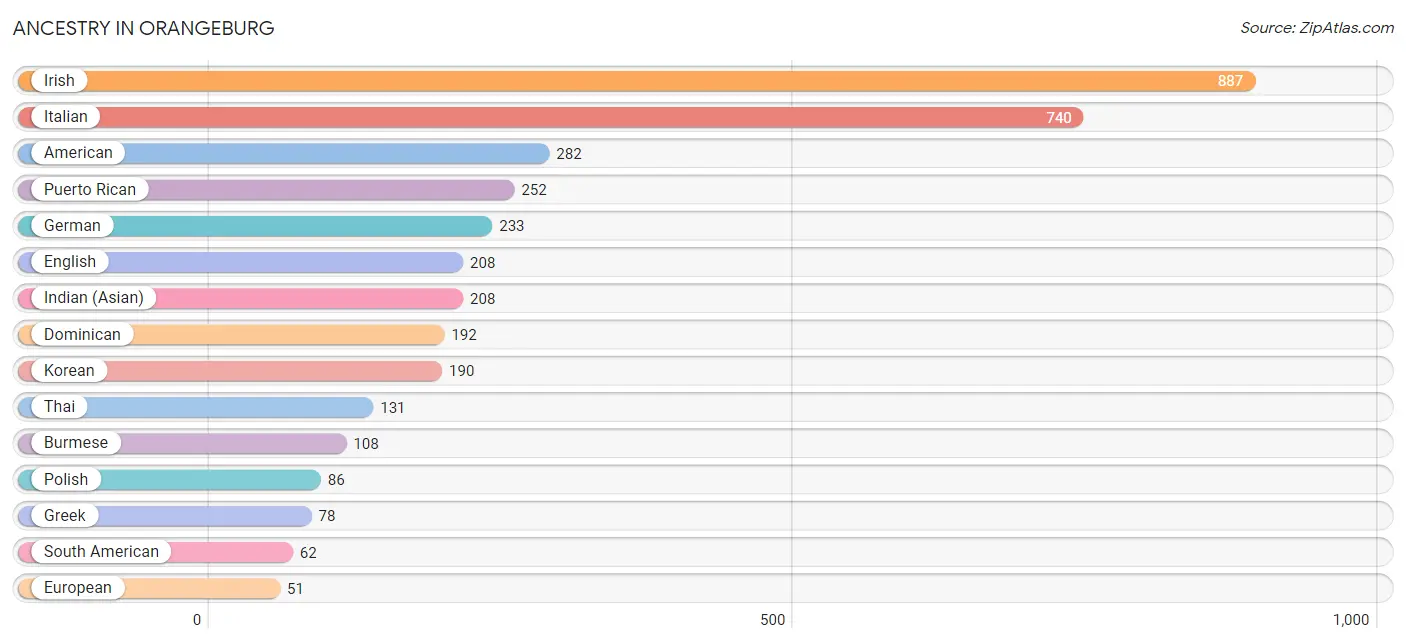
Ancestry in Orangeburg
The most populous ancestries reported in Orangeburg are Irish (887 | 18.7%), Italian (740 | 15.6%), American (282 | 5.9%), Puerto Rican (252 | 5.3%), and German (233 | 4.9%), together accounting for 50.4% of all Orangeburg residents.
| Ancestry | # Population | % Population |
| African | 17 | 0.4% |
| American | 282 | 5.9% |
| Armenian | 30 | 0.6% |
| Bahamian | 4 | 0.1% |
| Basque | 25 | 0.5% |
| Brazilian | 1 | 0.0% |
| Burmese | 108 | 2.3% |
| Central American | 39 | 0.8% |
| Colombian | 22 | 0.5% |
| Costa Rican | 21 | 0.4% |
| Croatian | 6 | 0.1% |
| Czechoslovakian | 11 | 0.2% |
| Dominican | 192 | 4.1% |
| Eastern European | 41 | 0.9% |
| Ecuadorian | 21 | 0.4% |
| English | 208 | 4.4% |
| Estonian | 10 | 0.2% |
| European | 51 | 1.1% |
| French | 50 | 1.1% |
| French Canadian | 31 | 0.6% |
| German | 233 | 4.9% |
| Ghanaian | 8 | 0.2% |
| Greek | 78 | 1.6% |
| Guyanese | 4 | 0.1% |
| Haitian | 17 | 0.4% |
| Indian (Asian) | 208 | 4.4% |
| Irish | 887 | 18.7% |
| Italian | 740 | 15.6% |
| Jamaican | 42 | 0.9% |
| Korean | 190 | 4.0% |
| Lithuanian | 6 | 0.1% |
| Mexican | 27 | 0.6% |
| Native Hawaiian | 4 | 0.1% |
| Nigerian | 6 | 0.1% |
| Northern European | 12 | 0.3% |
| Norwegian | 23 | 0.5% |
| Peruvian | 19 | 0.4% |
| Polish | 86 | 1.8% |
| Puerto Rican | 252 | 5.3% |
| Russian | 14 | 0.3% |
| Salvadoran | 18 | 0.4% |
| Scotch-Irish | 34 | 0.7% |
| Scottish | 34 | 0.7% |
| Slovak | 3 | 0.1% |
| South American | 62 | 1.3% |
| Spaniard | 26 | 0.5% |
| Subsaharan African | 23 | 0.5% |
| Swedish | 8 | 0.2% |
| Thai | 131 | 2.8% |
| Trinidadian and Tobagonian | 4 | 0.1% |
| Ukrainian | 40 | 0.8% |
| West Indian | 5 | 0.1% |
| Yugoslavian | 11 | 0.2% | View All 53 Rows |
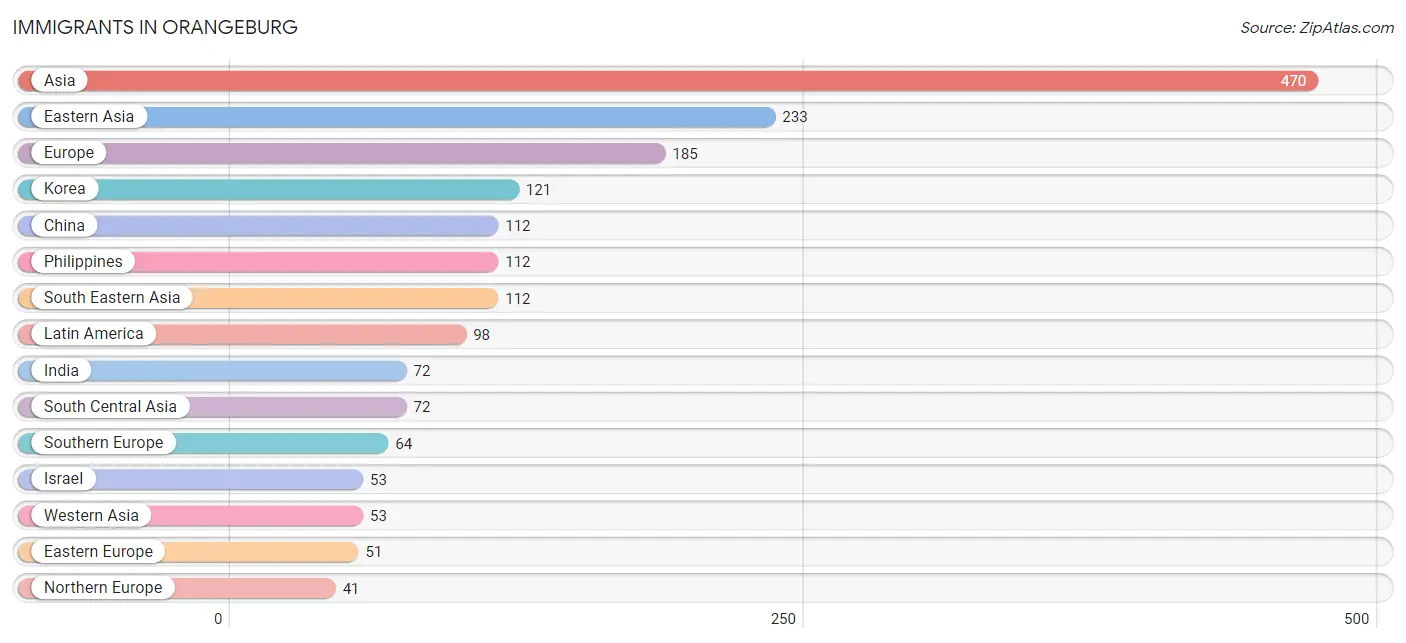
Immigrants in Orangeburg
The most numerous immigrant groups reported in Orangeburg came from Asia (470 | 9.9%), Eastern Asia (233 | 4.9%), Europe (185 | 3.9%), Korea (121 | 2.5%), and China (112 | 2.4%), together accounting for 23.6% of all Orangeburg residents.
| Immigration Origin | # Population | % Population |
| Africa | 17 | 0.4% |
| Asia | 470 | 9.9% |
| Australia | 4 | 0.1% |
| Belarus | 3 | 0.1% |
| Bosnia and Herzegovina | 11 | 0.2% |
| Caribbean | 18 | 0.4% |
| Central America | 39 | 0.8% |
| China | 112 | 2.4% |
| Costa Rica | 21 | 0.4% |
| Dominican Republic | 12 | 0.3% |
| Eastern Africa | 9 | 0.2% |
| Eastern Asia | 233 | 4.9% |
| Eastern Europe | 51 | 1.1% |
| Ecuador | 17 | 0.4% |
| El Salvador | 7 | 0.2% |
| Europe | 185 | 3.9% |
| France | 18 | 0.4% |
| Germany | 11 | 0.2% |
| Ghana | 8 | 0.2% |
| Greece | 7 | 0.2% |
| Guyana | 4 | 0.1% |
| Hong Kong | 34 | 0.7% |
| India | 72 | 1.5% |
| Ireland | 32 | 0.7% |
| Israel | 53 | 1.1% |
| Italy | 30 | 0.6% |
| Jamaica | 6 | 0.1% |
| Korea | 121 | 2.5% |
| Latin America | 98 | 2.1% |
| Lithuania | 6 | 0.1% |
| Mexico | 11 | 0.2% |
| Northern Europe | 41 | 0.9% |
| Oceania | 9 | 0.2% |
| Peru | 20 | 0.4% |
| Philippines | 112 | 2.4% |
| Poland | 31 | 0.6% |
| South America | 41 | 0.9% |
| South Central Asia | 72 | 1.5% |
| South Eastern Asia | 112 | 2.4% |
| Southern Europe | 64 | 1.3% |
| Spain | 27 | 0.6% |
| Western Africa | 8 | 0.2% |
| Western Asia | 53 | 1.1% |
| Western Europe | 29 | 0.6% | View All 44 Rows |
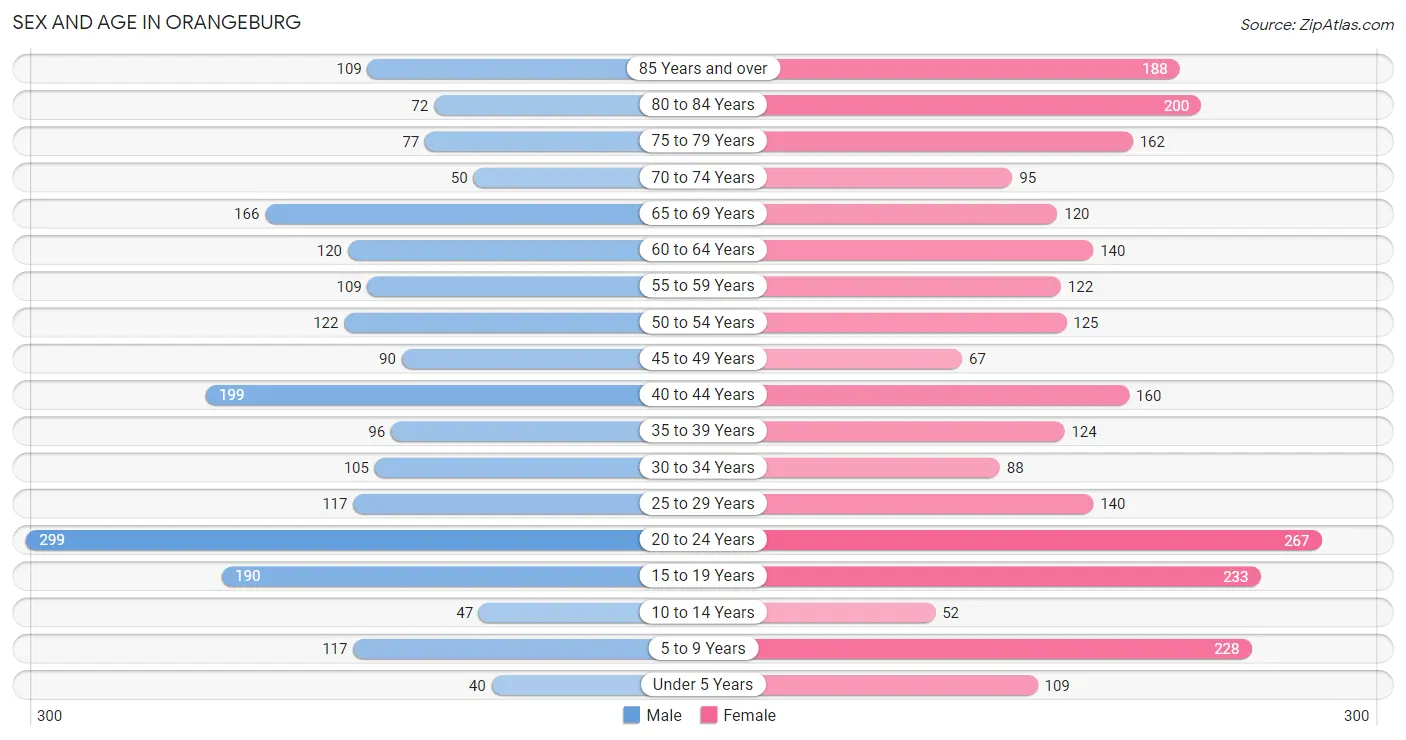
Sex and Age in Orangeburg
Sex and Age in Orangeburg
The most populous age groups in Orangeburg are 20 to 24 Years (299 | 14.1%) for men and 20 to 24 Years (267 | 10.2%) for women.
| Age Bracket | Male | Female |
| Under 5 Years | 40 (1.9%) | 109 (4.2%) |
| 5 to 9 Years | 117 (5.5%) | 228 (8.7%) |
| 10 to 14 Years | 47 (2.2%) | 52 (2.0%) |
| 15 to 19 Years | 190 (8.9%) | 233 (8.9%) |
| 20 to 24 Years | 299 (14.1%) | 267 (10.2%) |
| 25 to 29 Years | 117 (5.5%) | 140 (5.3%) |
| 30 to 34 Years | 105 (4.9%) | 88 (3.4%) |
| 35 to 39 Years | 96 (4.5%) | 124 (4.7%) |
| 40 to 44 Years | 199 (9.4%) | 160 (6.1%) |
| 45 to 49 Years | 90 (4.2%) | 67 (2.6%) |
| 50 to 54 Years | 122 (5.7%) | 125 (4.8%) |
| 55 to 59 Years | 109 (5.1%) | 122 (4.7%) |
| 60 to 64 Years | 120 (5.7%) | 140 (5.3%) |
| 65 to 69 Years | 166 (7.8%) | 120 (4.6%) |
| 70 to 74 Years | 50 (2.4%) | 95 (3.6%) |
| 75 to 79 Years | 77 (3.6%) | 162 (6.2%) |
| 80 to 84 Years | 72 (3.4%) | 200 (7.6%) |
| 85 Years and over | 109 (5.1%) | 188 (7.2%) |
| Total | 2,125 (100.0%) | 2,620 (100.0%) |
Families and Households in Orangeburg
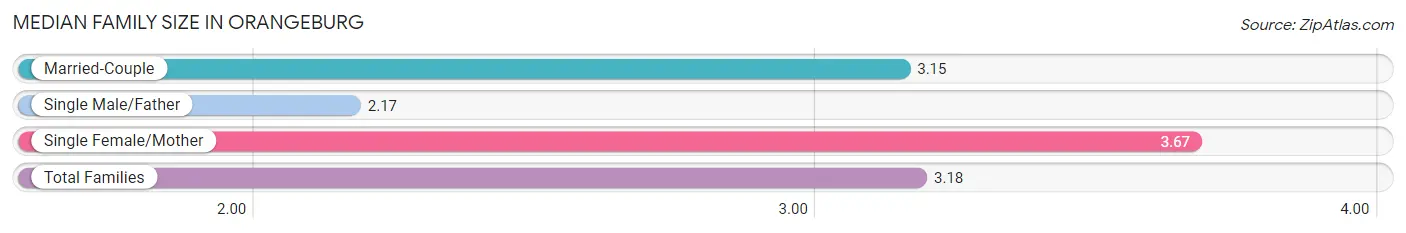
Median Family Size in Orangeburg
The median family size in Orangeburg is 3.18 persons per family, with single female/mother families (75 | 7.3%) accounting for the largest median family size of 3.67 persons per family. On the other hand, single male/father families (6 | 0.6%) represent the smallest median family size with 2.17 persons per family.
| Family Type | # Families | Family Size |
| Married-Couple | 947 (92.1%) | 3.15 |
| Single Male/Father | 6 (0.6%) | 2.17 |
| Single Female/Mother | 75 (7.3%) | 3.67 |
| Total Families | 1,028 (100.0%) | 3.18 |
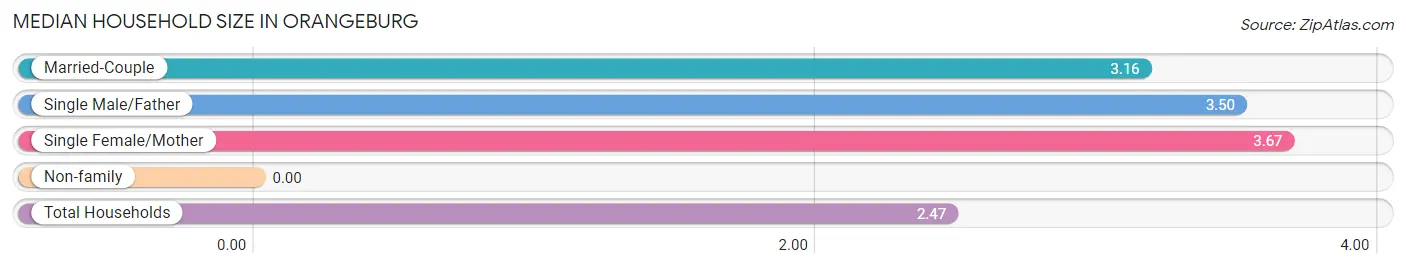
Median Household Size in Orangeburg
| Household Type | # Households | Household Size |
| Married-Couple | 947 (61.8%) | 3.16 |
| Single Male/Father | 6 (0.4%) | 3.50 |
| Single Female/Mother | 75 (4.9%) | 3.67 |
| Non-family | 504 (32.9%) | - |
| Total Households | 1,532 (100.0%) | 2.47 |
Household Size by Marriage Status in Orangeburg
Out of a total of 1,532 households in Orangeburg, 1,028 (67.1%) are family households, while 504 (32.9%) are nonfamily households. The most numerous type of family households are 2-person households, comprising 330, and the most common type of nonfamily households are 1-person households, comprising 504.
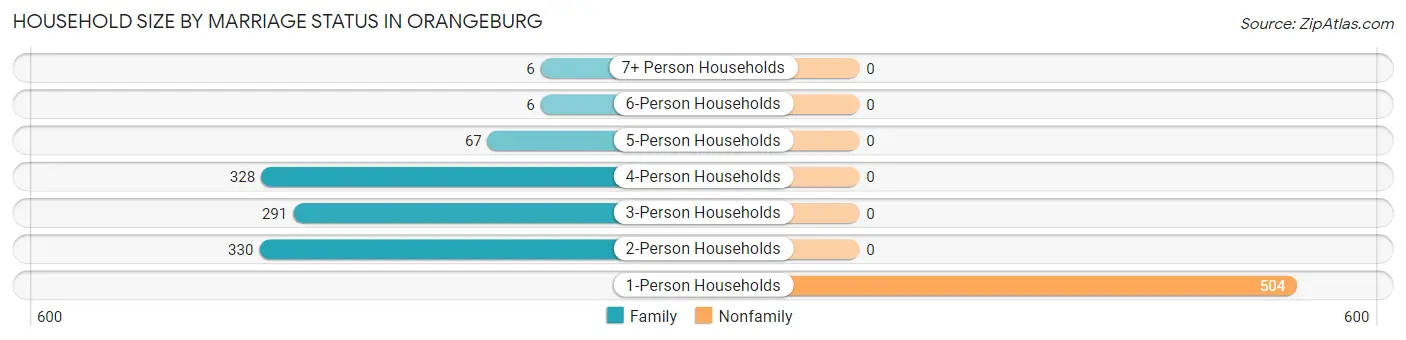
| Household Size | Family Households | Nonfamily Households |
| 1-Person Households | - | 504 (32.9%) |
| 2-Person Households | 330 (21.5%) | 0 (0.0%) |
| 3-Person Households | 291 (19.0%) | 0 (0.0%) |
| 4-Person Households | 328 (21.4%) | 0 (0.0%) |
| 5-Person Households | 67 (4.4%) | 0 (0.0%) |
| 6-Person Households | 6 (0.4%) | 0 (0.0%) |
| 7+ Person Households | 6 (0.4%) | 0 (0.0%) |
| Total | 1,028 (67.1%) | 504 (32.9%) |
Female Fertility in Orangeburg
Fertility by Age in Orangeburg
Average fertility rate in Orangeburg is 48.0 births per 1,000 women. Women in the age bracket of 35 to 50 years have the highest fertility rate with 67.0 births per 1,000 women. Women in the age bracket of 20 to 34 years acount for 53.8% of all women with births.
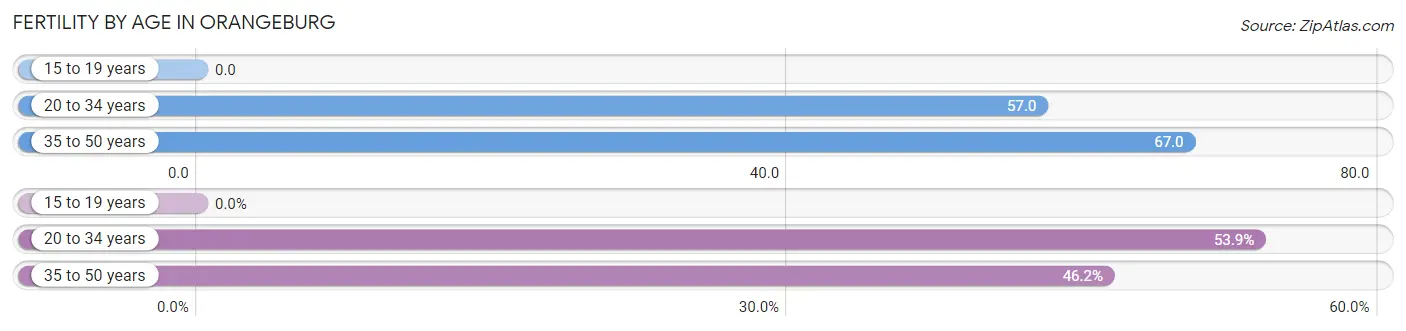
| Age Bracket | Women with Births | Births / 1,000 Women |
| 15 to 19 years | 0 (0.0%) | 0.0 |
| 20 to 34 years | 28 (53.8%) | 57.0 |
| 35 to 50 years | 24 (46.2%) | 67.0 |
| Total | 52 (100.0%) | 48.0 |
Fertility by Age by Marriage Status in Orangeburg
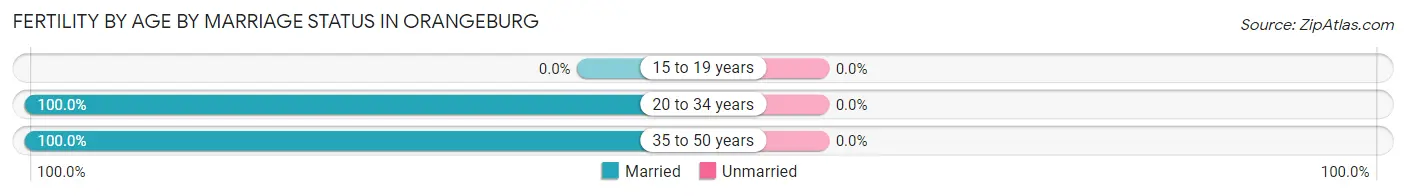
| Age Bracket | Married | Unmarried |
| 15 to 19 years | 0 (0.0%) | 0 (0.0%) |
| 20 to 34 years | 28 (100.0%) | 0 (0.0%) |
| 35 to 50 years | 24 (100.0%) | 0 (0.0%) |
| Total | 52 (100.0%) | 0 (0.0%) |
Fertility by Education in Orangeburg
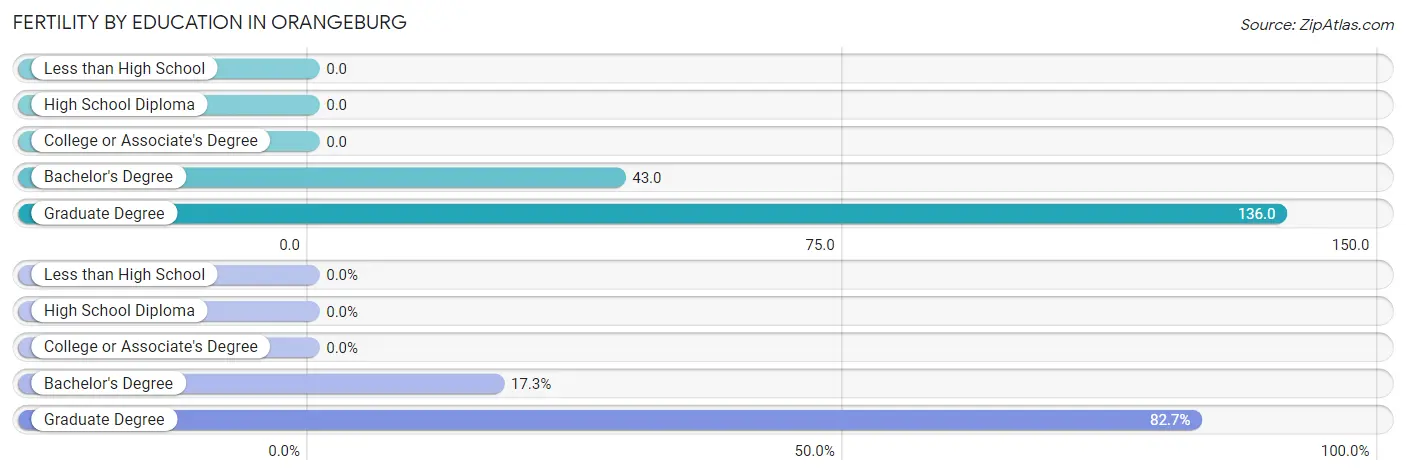
| Educational Attainment | Women with Births | Births / 1,000 Women |
| Less than High School | 0 (0.0%) | 0.0 |
| High School Diploma | 0 (0.0%) | 0.0 |
| College or Associate's Degree | 0 (0.0%) | 0.0 |
| Bachelor's Degree | 9 (17.3%) | 43.0 |
| Graduate Degree | 43 (82.7%) | 136.0 |
| Total | 52 (100.0%) | 48.0 |
Fertility by Education by Marriage Status in Orangeburg
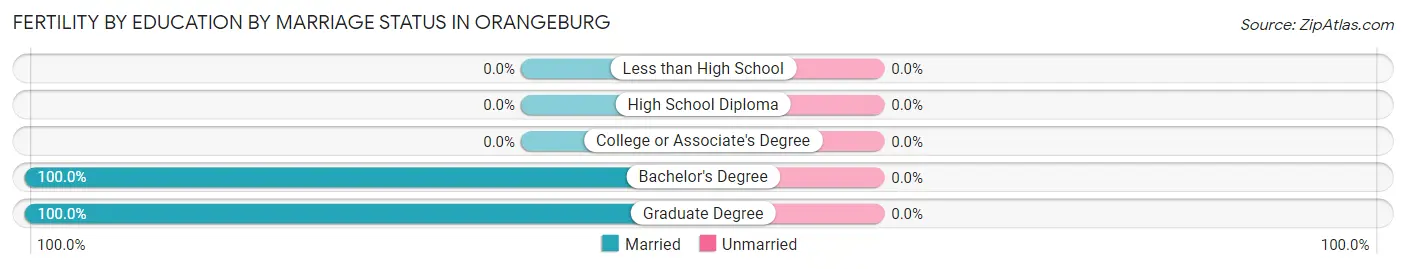
| Educational Attainment | Married | Unmarried |
| Less than High School | 0 (0.0%) | 0 (0.0%) |
| High School Diploma | 0 (0.0%) | 0 (0.0%) |
| College or Associate's Degree | 0 (0.0%) | 0 (0.0%) |
| Bachelor's Degree | 9 (100.0%) | 0 (0.0%) |
| Graduate Degree | 43 (100.0%) | 0 (0.0%) |
| Total | 52 (100.0%) | 0 (0.0%) |
Employment Characteristics in Orangeburg
Employment by Class of Employer in Orangeburg
Among the 1,977 employed individuals in Orangeburg, private company employees (1,308 | 66.2%), not-for-profit organizations (244 | 12.3%), and local government employees (186 | 9.4%) make up the most common classes of employment.
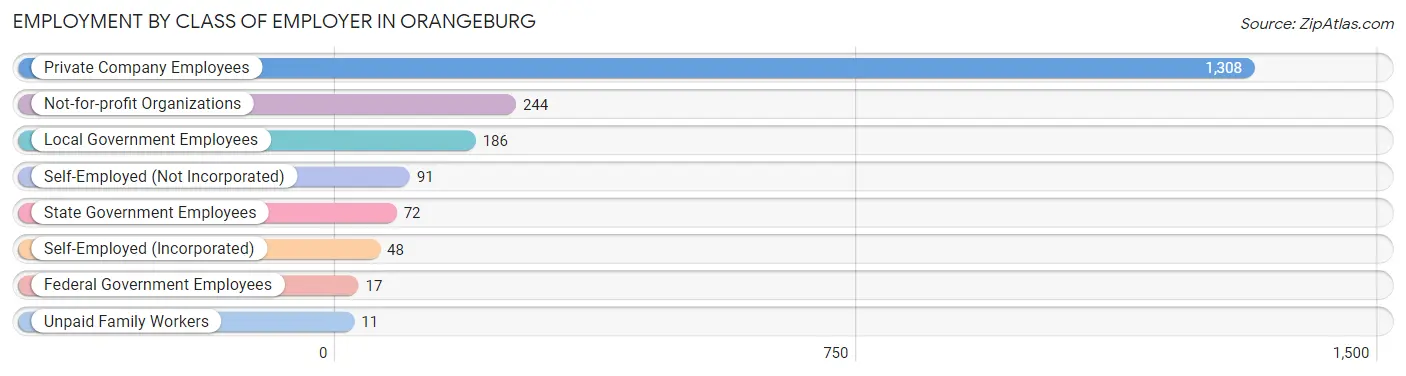
| Employer Class | # Employees | % Employees |
| Private Company Employees | 1,308 | 66.2% |
| Self-Employed (Incorporated) | 48 | 2.4% |
| Self-Employed (Not Incorporated) | 91 | 4.6% |
| Not-for-profit Organizations | 244 | 12.3% |
| Local Government Employees | 186 | 9.4% |
| State Government Employees | 72 | 3.6% |
| Federal Government Employees | 17 | 0.9% |
| Unpaid Family Workers | 11 | 0.6% |
| Total | 1,977 | 100.0% |
Employment Status by Age in Orangeburg
According to the labor force statistics for Orangeburg, out of the total population over 16 years of age (4,137), 52.7% or 2,180 individuals are in the labor force, with 6.0% or 131 of them unemployed. The age group with the highest labor force participation rate is 55 to 59 years, with 86.6% or 200 individuals in the labor force. Within the labor force, the 20 to 24 years age range has the highest percentage of unemployed individuals, with 11.4% or 40 of them being unemployed.
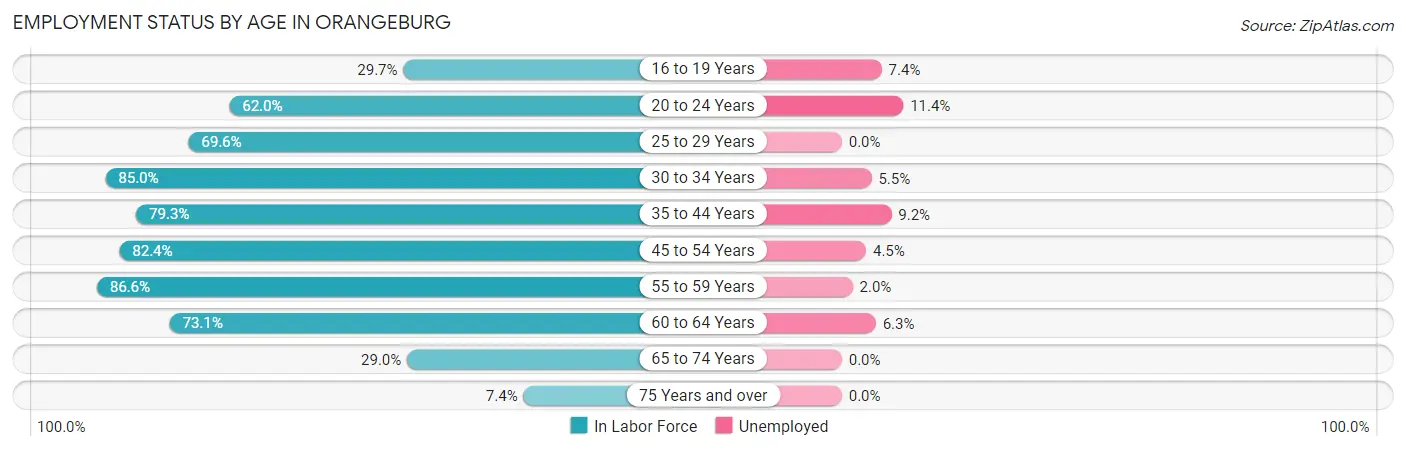
| Age Bracket | In Labor Force | Unemployed |
| 16 to 19 Years | 121 (29.7%) | 9 (7.4%) |
| 20 to 24 Years | 351 (62.0%) | 40 (11.4%) |
| 25 to 29 Years | 179 (69.6%) | 0 (0.0%) |
| 30 to 34 Years | 164 (85.0%) | 9 (5.5%) |
| 35 to 44 Years | 459 (79.3%) | 42 (9.2%) |
| 45 to 54 Years | 333 (82.4%) | 15 (4.5%) |
| 55 to 59 Years | 200 (86.6%) | 4 (2.0%) |
| 60 to 64 Years | 190 (73.1%) | 12 (6.3%) |
| 65 to 74 Years | 125 (29.0%) | 0 (0.0%) |
| 75 Years and over | 60 (7.4%) | 0 (0.0%) |
| Total | 2,180 (52.7%) | 131 (6.0%) |
Employment Status by Educational Attainment in Orangeburg
According to labor force statistics for Orangeburg, 79.3% of individuals (1,526) out of the total population between 25 and 64 years of age (1,924) are in the labor force, with 5.4% or 82 of them being unemployed. The group with the highest labor force participation rate are those with the educational attainment of college / associate degree, with 88.6% or 364 individuals in the labor force. Within the labor force, individuals with less than high school education have the highest percentage of unemployment, with 41.7% or 15 of them being unemployed.
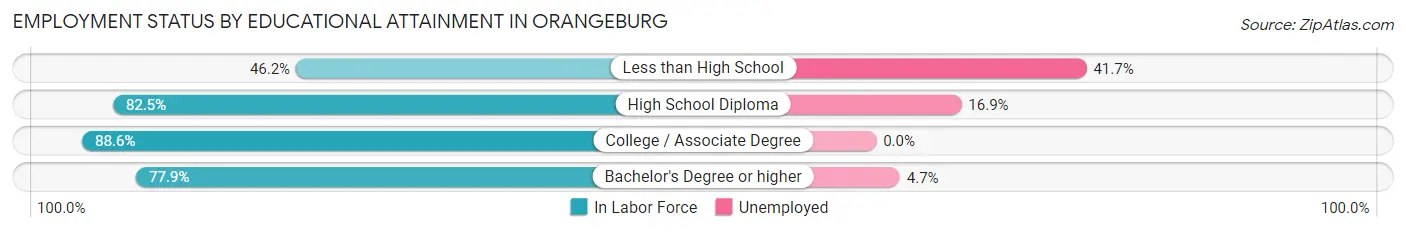
| Educational Attainment | In Labor Force | Unemployed |
| Less than High School | 36 (46.2%) | 33 (41.7%) |
| High School Diploma | 118 (82.5%) | 24 (16.9%) |
| College / Associate Degree | 364 (88.6%) | 0 (0.0%) |
| Bachelor's Degree or higher | 1,006 (77.9%) | 61 (4.7%) |
| Total | 1,526 (79.3%) | 104 (5.4%) |
Employment Occupations by Sex in Orangeburg
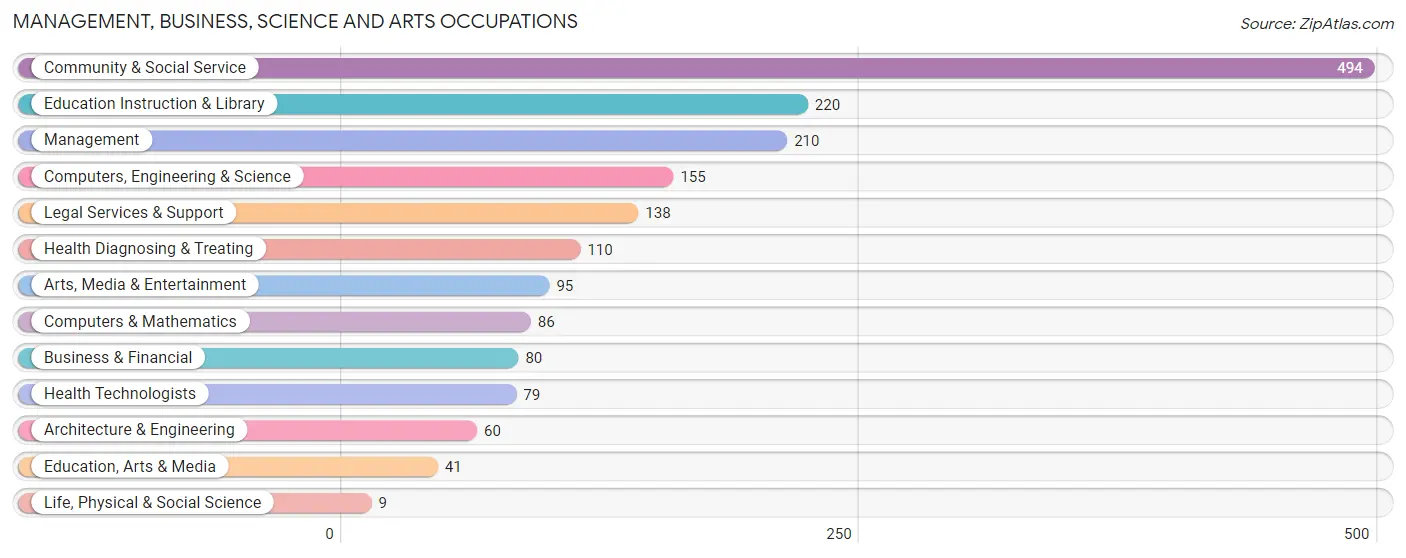
Management, Business, Science and Arts Occupations
The most common Management, Business, Science and Arts occupations in Orangeburg are Community & Social Service (494 | 24.1%), Education Instruction & Library (220 | 10.7%), Management (210 | 10.2%), Computers, Engineering & Science (155 | 7.6%), and Legal Services & Support (138 | 6.7%).
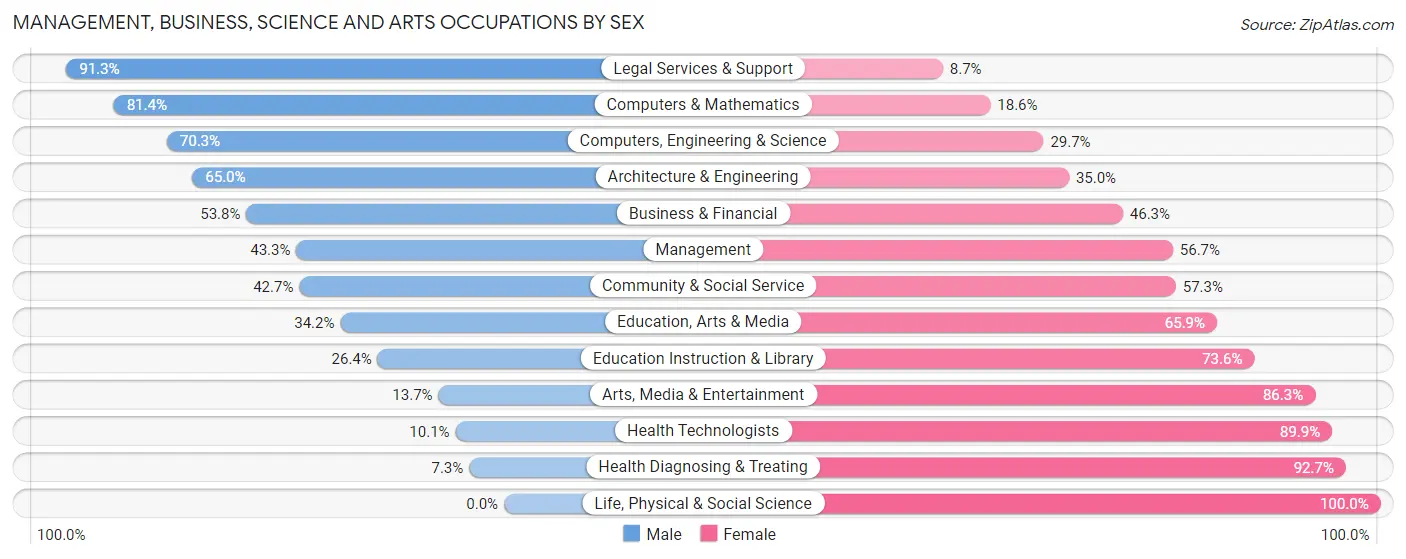
Management, Business, Science and Arts Occupations by Sex
Within the Management, Business, Science and Arts occupations in Orangeburg, the most male-oriented occupations are Legal Services & Support (91.3%), Computers & Mathematics (81.4%), and Computers, Engineering & Science (70.3%), while the most female-oriented occupations are Life, Physical & Social Science (100.0%), Health Diagnosing & Treating (92.7%), and Health Technologists (89.9%).
| Occupation | Male | Female |
| Management | 91 (43.3%) | 119 (56.7%) |
| Business & Financial | 43 (53.7%) | 37 (46.3%) |
| Computers, Engineering & Science | 109 (70.3%) | 46 (29.7%) |
| Computers & Mathematics | 70 (81.4%) | 16 (18.6%) |
| Architecture & Engineering | 39 (65.0%) | 21 (35.0%) |
| Life, Physical & Social Science | 0 (0.0%) | 9 (100.0%) |
| Community & Social Service | 211 (42.7%) | 283 (57.3%) |
| Education, Arts & Media | 14 (34.2%) | 27 (65.8%) |
| Legal Services & Support | 126 (91.3%) | 12 (8.7%) |
| Education Instruction & Library | 58 (26.4%) | 162 (73.6%) |
| Arts, Media & Entertainment | 13 (13.7%) | 82 (86.3%) |
| Health Diagnosing & Treating | 8 (7.3%) | 102 (92.7%) |
| Health Technologists | 8 (10.1%) | 71 (89.9%) |
| Total (Category) | 462 (44.0%) | 587 (56.0%) |
| Total (Overall) | 977 (47.6%) | 1,074 (52.4%) |
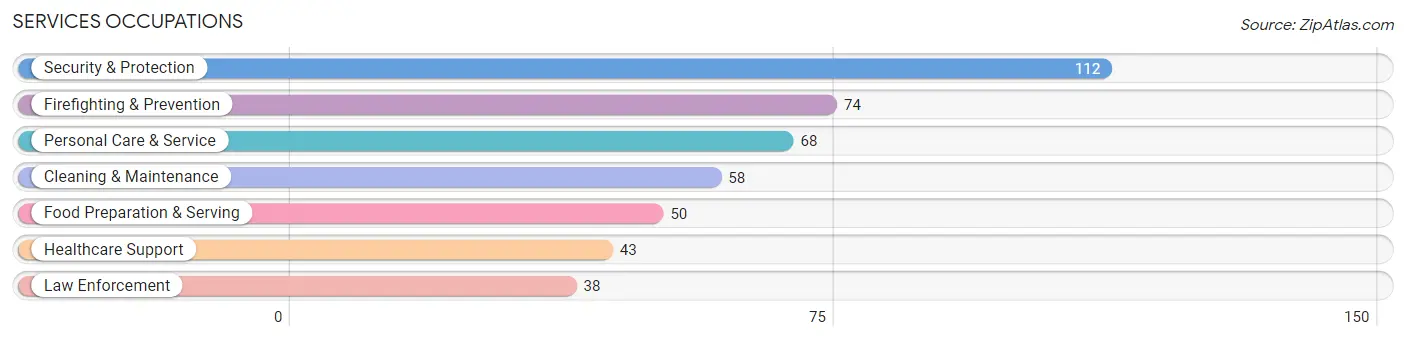
Services Occupations
The most common Services occupations in Orangeburg are Security & Protection (112 | 5.5%), Firefighting & Prevention (74 | 3.6%), Personal Care & Service (68 | 3.3%), Cleaning & Maintenance (58 | 2.8%), and Food Preparation & Serving (50 | 2.4%).
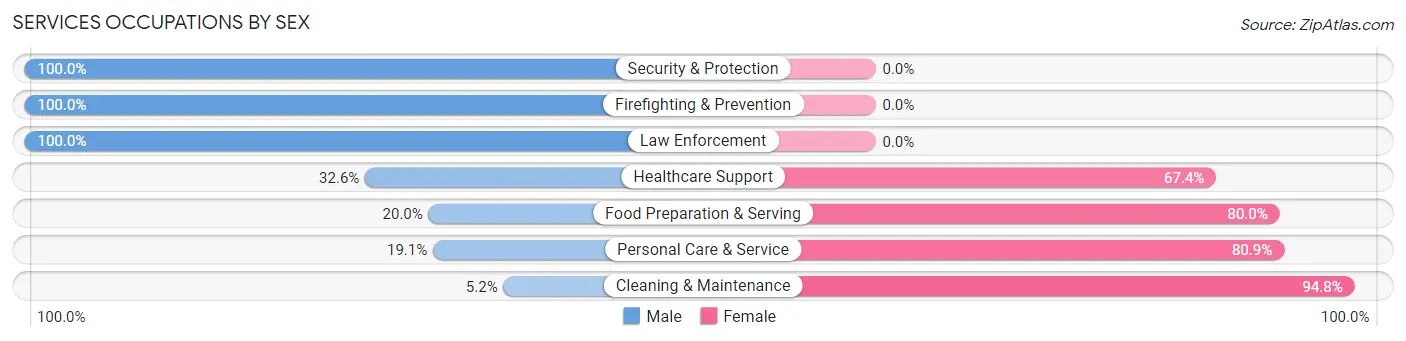
Services Occupations by Sex
Within the Services occupations in Orangeburg, the most male-oriented occupations are Security & Protection (100.0%), Firefighting & Prevention (100.0%), and Law Enforcement (100.0%), while the most female-oriented occupations are Cleaning & Maintenance (94.8%), Personal Care & Service (80.9%), and Food Preparation & Serving (80.0%).
| Occupation | Male | Female |
| Healthcare Support | 14 (32.6%) | 29 (67.4%) |
| Security & Protection | 112 (100.0%) | 0 (0.0%) |
| Firefighting & Prevention | 74 (100.0%) | 0 (0.0%) |
| Law Enforcement | 38 (100.0%) | 0 (0.0%) |
| Food Preparation & Serving | 10 (20.0%) | 40 (80.0%) |
| Cleaning & Maintenance | 3 (5.2%) | 55 (94.8%) |
| Personal Care & Service | 13 (19.1%) | 55 (80.9%) |
| Total (Category) | 152 (45.9%) | 179 (54.1%) |
| Total (Overall) | 977 (47.6%) | 1,074 (52.4%) |
Sales and Office Occupations
The most common Sales and Office occupations in Orangeburg are Office & Administration (277 | 13.5%), and Sales & Related (189 | 9.2%).

Sales and Office Occupations by Sex
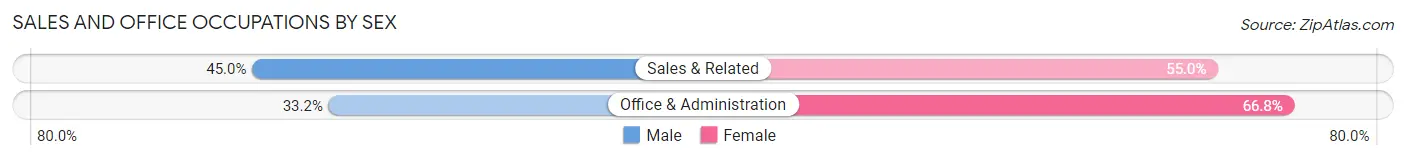
| Occupation | Male | Female |
| Sales & Related | 85 (45.0%) | 104 (55.0%) |
| Office & Administration | 92 (33.2%) | 185 (66.8%) |
| Total (Category) | 177 (38.0%) | 289 (62.0%) |
| Total (Overall) | 977 (47.6%) | 1,074 (52.4%) |
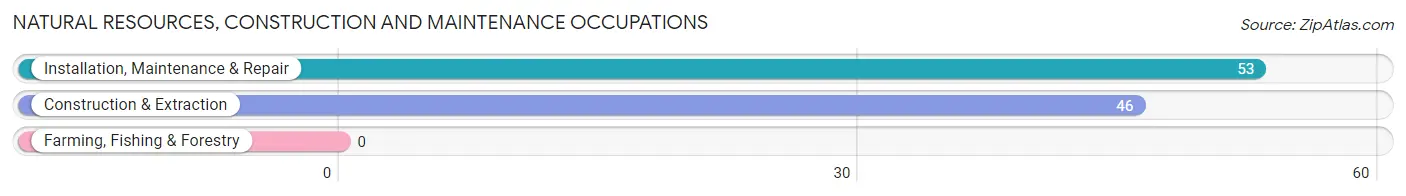
Natural Resources, Construction and Maintenance Occupations
The most common Natural Resources, Construction and Maintenance occupations in Orangeburg are Installation, Maintenance & Repair (53 | 2.6%), and Construction & Extraction (46 | 2.2%).
Natural Resources, Construction and Maintenance Occupations by Sex
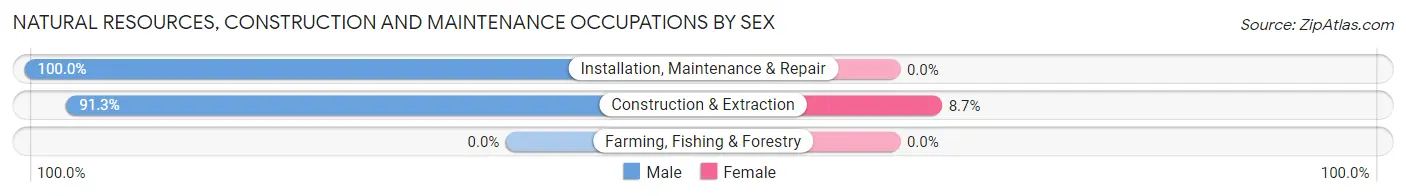
| Occupation | Male | Female |
| Farming, Fishing & Forestry | 0 (0.0%) | 0 (0.0%) |
| Construction & Extraction | 42 (91.3%) | 4 (8.7%) |
| Installation, Maintenance & Repair | 53 (100.0%) | 0 (0.0%) |
| Total (Category) | 95 (96.0%) | 4 (4.0%) |
| Total (Overall) | 977 (47.6%) | 1,074 (52.4%) |
Production, Transportation and Moving Occupations
The most common Production, Transportation and Moving occupations in Orangeburg are Production (51 | 2.5%), Material Moving (45 | 2.2%), and Transportation (10 | 0.5%).
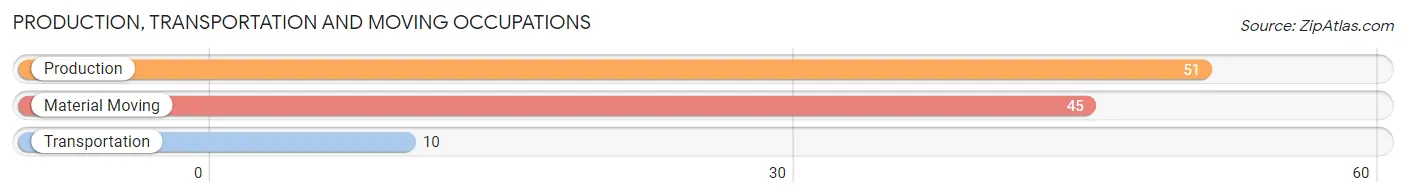
Production, Transportation and Moving Occupations by Sex
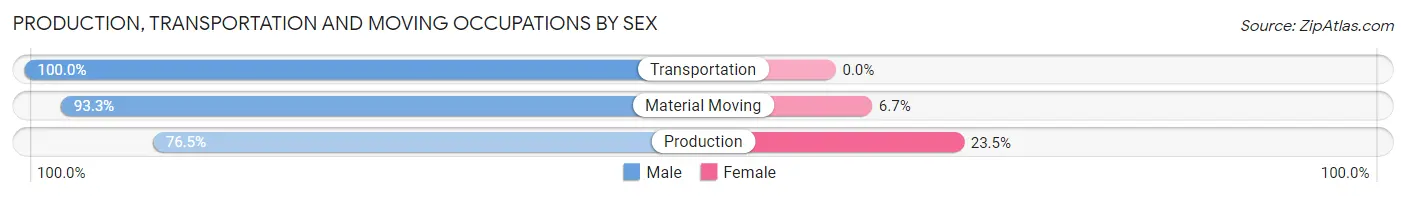
| Occupation | Male | Female |
| Production | 39 (76.5%) | 12 (23.5%) |
| Transportation | 10 (100.0%) | 0 (0.0%) |
| Material Moving | 42 (93.3%) | 3 (6.7%) |
| Total (Category) | 91 (85.9%) | 15 (14.1%) |
| Total (Overall) | 977 (47.6%) | 1,074 (52.4%) |
Employment Industries by Sex in Orangeburg
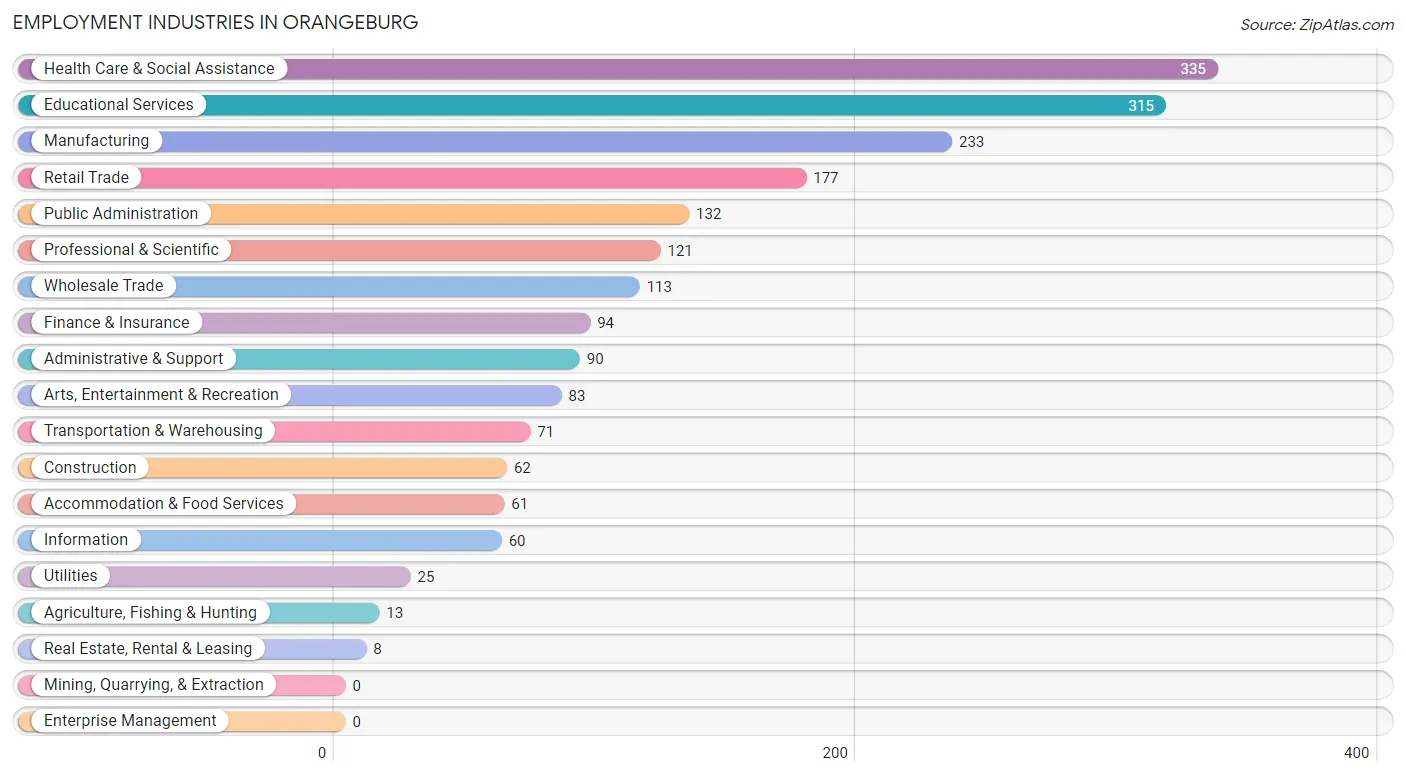
Employment Industries in Orangeburg
The major employment industries in Orangeburg include Health Care & Social Assistance (335 | 16.3%), Educational Services (315 | 15.4%), Manufacturing (233 | 11.4%), Retail Trade (177 | 8.6%), and Public Administration (132 | 6.4%).
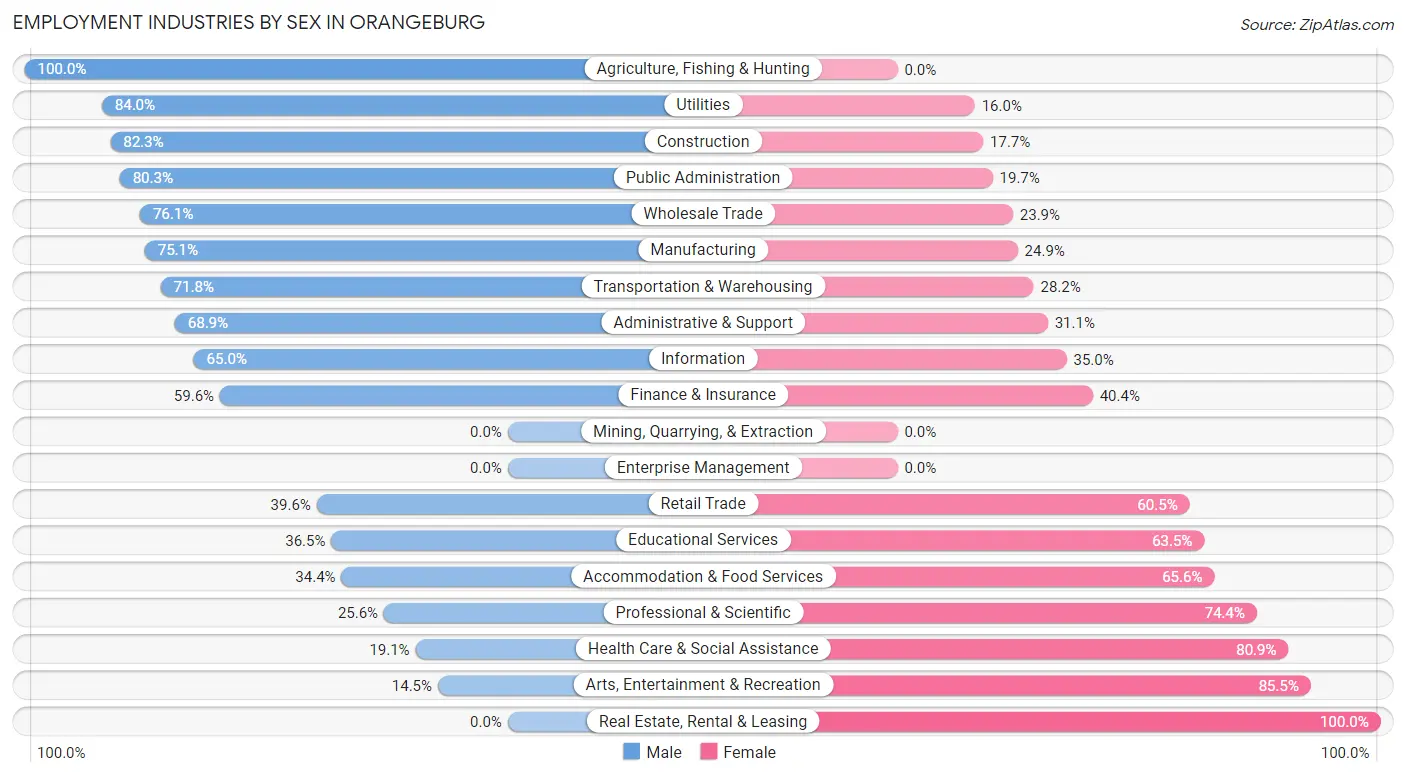
Employment Industries by Sex in Orangeburg
The Orangeburg industries that see more men than women are Agriculture, Fishing & Hunting (100.0%), Utilities (84.0%), and Construction (82.3%), whereas the industries that tend to have a higher number of women are Real Estate, Rental & Leasing (100.0%), Arts, Entertainment & Recreation (85.5%), and Health Care & Social Assistance (80.9%).
| Industry | Male | Female |
| Agriculture, Fishing & Hunting | 13 (100.0%) | 0 (0.0%) |
| Mining, Quarrying, & Extraction | 0 (0.0%) | 0 (0.0%) |
| Construction | 51 (82.3%) | 11 (17.7%) |
| Manufacturing | 175 (75.1%) | 58 (24.9%) |
| Wholesale Trade | 86 (76.1%) | 27 (23.9%) |
| Retail Trade | 70 (39.6%) | 107 (60.5%) |
| Transportation & Warehousing | 51 (71.8%) | 20 (28.2%) |
| Utilities | 21 (84.0%) | 4 (16.0%) |
| Information | 39 (65.0%) | 21 (35.0%) |
| Finance & Insurance | 56 (59.6%) | 38 (40.4%) |
| Real Estate, Rental & Leasing | 0 (0.0%) | 8 (100.0%) |
| Professional & Scientific | 31 (25.6%) | 90 (74.4%) |
| Enterprise Management | 0 (0.0%) | 0 (0.0%) |
| Administrative & Support | 62 (68.9%) | 28 (31.1%) |
| Educational Services | 115 (36.5%) | 200 (63.5%) |
| Health Care & Social Assistance | 64 (19.1%) | 271 (80.9%) |
| Arts, Entertainment & Recreation | 12 (14.5%) | 71 (85.5%) |
| Accommodation & Food Services | 21 (34.4%) | 40 (65.6%) |
| Public Administration | 106 (80.3%) | 26 (19.7%) |
| Total | 977 (47.6%) | 1,074 (52.4%) |
Education in Orangeburg
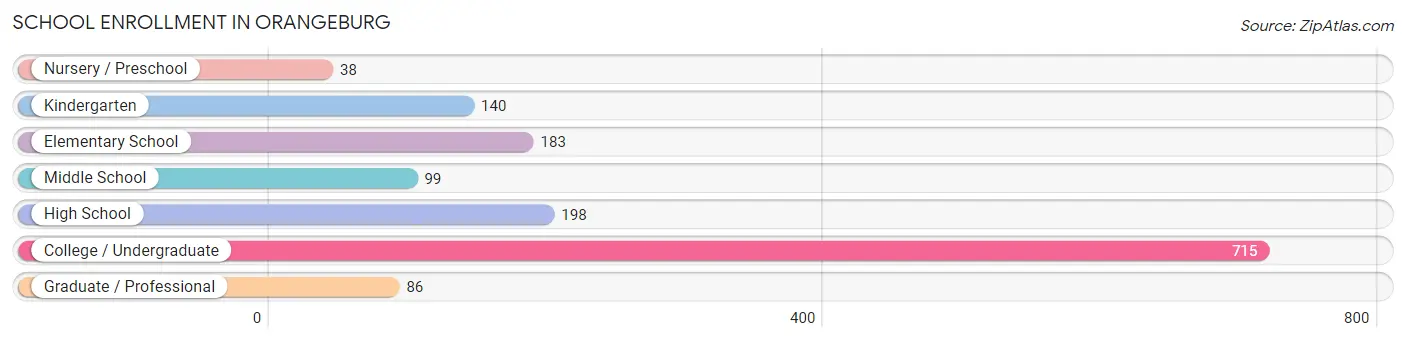
School Enrollment in Orangeburg
The most common levels of schooling among the 1,459 students in Orangeburg are college / undergraduate (715 | 49.0%), high school (198 | 13.6%), and elementary school (183 | 12.5%).
| School Level | # Students | % Students |
| Nursery / Preschool | 38 | 2.6% |
| Kindergarten | 140 | 9.6% |
| Elementary School | 183 | 12.5% |
| Middle School | 99 | 6.8% |
| High School | 198 | 13.6% |
| College / Undergraduate | 715 | 49.0% |
| Graduate / Professional | 86 | 5.9% |
| Total | 1,459 | 100.0% |
School Enrollment by Age by Funding Source in Orangeburg
Out of a total of 1,459 students who are enrolled in schools in Orangeburg, 712 (48.8%) attend a private institution, while the remaining 747 (51.2%) are enrolled in public schools. The age group of 20 to 24 year olds has the highest likelihood of being enrolled in private schools, with 416 (83.0% in the age bracket) enrolled. Conversely, the age group of 15 to 17 year olds has the lowest likelihood of being enrolled in a private school, with 136 (95.8% in the age bracket) attending a public institution.
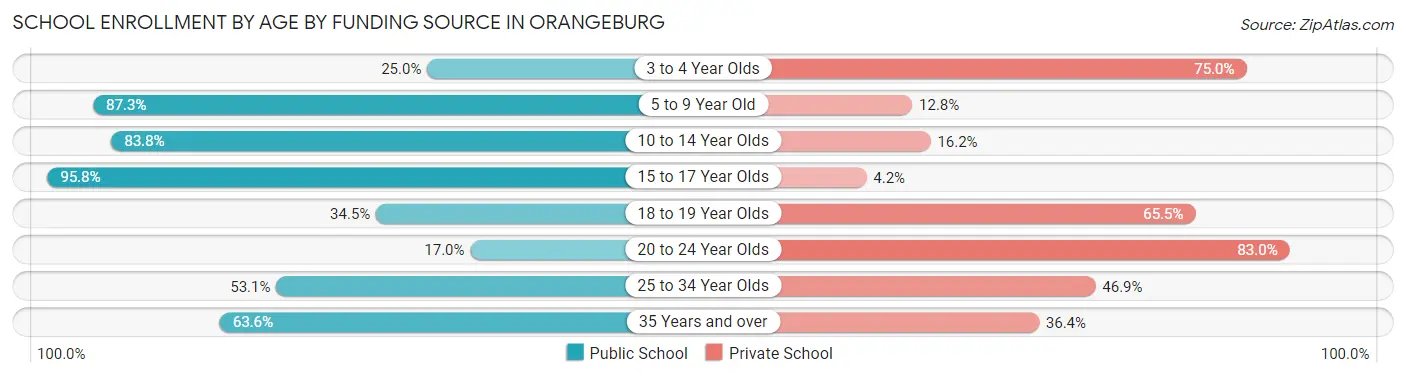
| Age Bracket | Public School | Private School |
| 3 to 4 Year Olds | 4 (25.0%) | 12 (75.0%) |
| 5 to 9 Year Old | 301 (87.3%) | 44 (12.8%) |
| 10 to 14 Year Olds | 83 (83.8%) | 16 (16.2%) |
| 15 to 17 Year Olds | 136 (95.8%) | 6 (4.2%) |
| 18 to 19 Year Olds | 97 (34.5%) | 184 (65.5%) |
| 20 to 24 Year Olds | 85 (17.0%) | 416 (83.0%) |
| 25 to 34 Year Olds | 34 (53.1%) | 30 (46.9%) |
| 35 Years and over | 7 (63.6%) | 4 (36.4%) |
| Total | 747 (51.2%) | 712 (48.8%) |
Educational Attainment by Field of Study in Orangeburg
Business (350 | 17.3%), education (340 | 16.8%), science & technology (273 | 13.5%), communications (182 | 9.0%), and liberal arts & history (134 | 6.6%) are the most common fields of study among 2,024 individuals in Orangeburg who have obtained a bachelor's degree or higher.
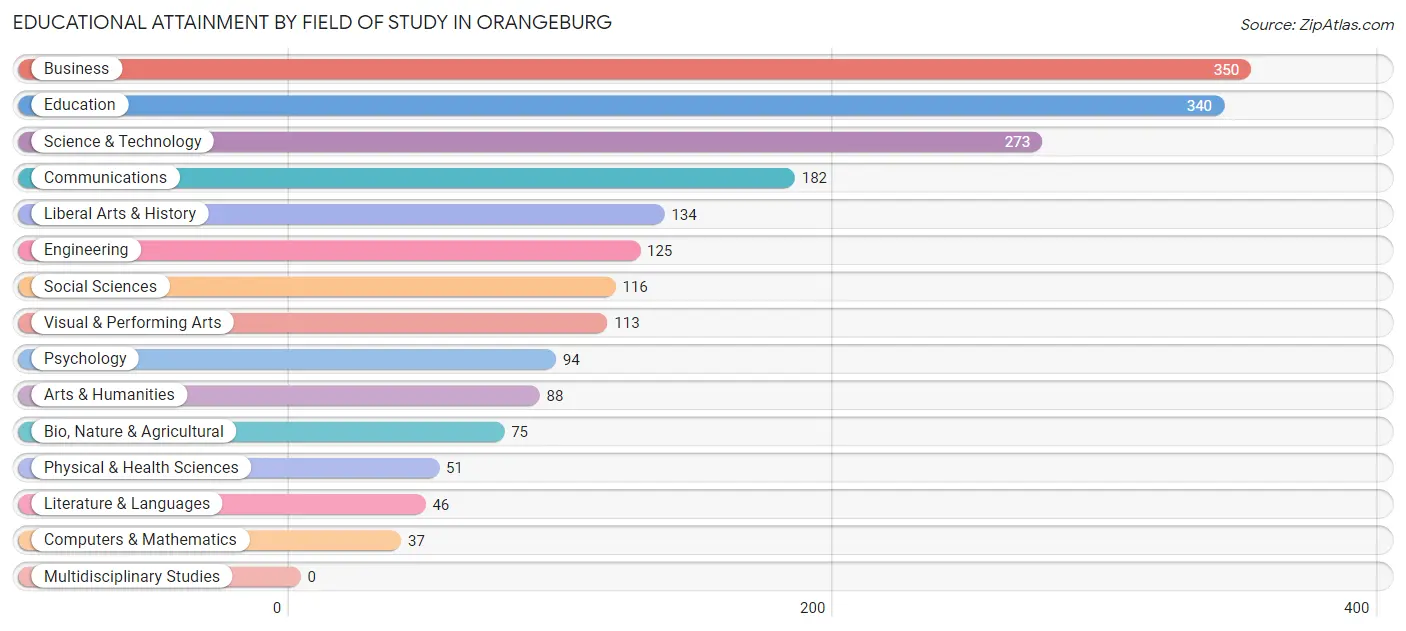
| Field of Study | # Graduates | % Graduates |
| Computers & Mathematics | 37 | 1.8% |
| Bio, Nature & Agricultural | 75 | 3.7% |
| Physical & Health Sciences | 51 | 2.5% |
| Psychology | 94 | 4.6% |
| Social Sciences | 116 | 5.7% |
| Engineering | 125 | 6.2% |
| Multidisciplinary Studies | 0 | 0.0% |
| Science & Technology | 273 | 13.5% |
| Business | 350 | 17.3% |
| Education | 340 | 16.8% |
| Literature & Languages | 46 | 2.3% |
| Liberal Arts & History | 134 | 6.6% |
| Visual & Performing Arts | 113 | 5.6% |
| Communications | 182 | 9.0% |
| Arts & Humanities | 88 | 4.3% |
| Total | 2,024 | 100.0% |
Transportation & Commute in Orangeburg
Vehicle Availability by Sex in Orangeburg
The most prevalent vehicle ownership categories in Orangeburg are males with 2 vehicles (464, accounting for 56.3%) and females with 2 vehicles (385, making up 59.7%).
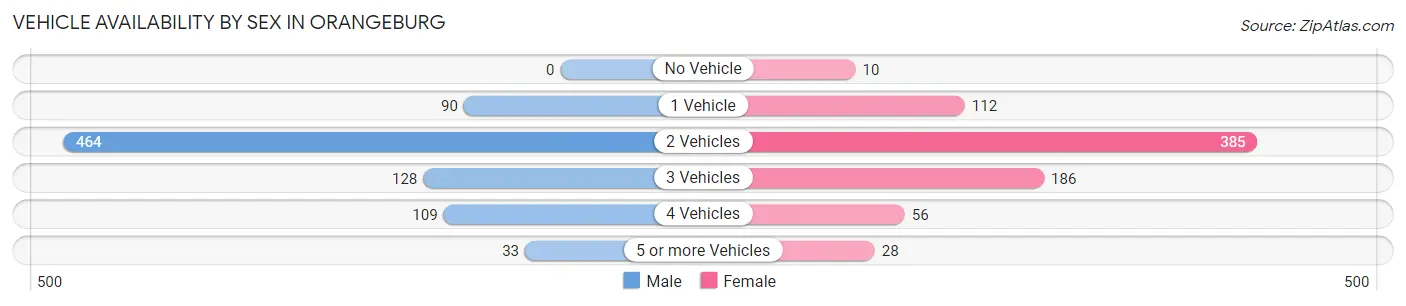
| Vehicles Available | Male | Female |
| No Vehicle | 0 (0.0%) | 10 (1.3%) |
| 1 Vehicle | 90 (10.9%) | 112 (14.4%) |
| 2 Vehicles | 464 (56.3%) | 385 (49.5%) |
| 3 Vehicles | 128 (15.5%) | 186 (23.9%) |
| 4 Vehicles | 109 (13.2%) | 56 (7.2%) |
| 5 or more Vehicles | 33 (4.0%) | 28 (3.6%) |
| Total | 824 (100.0%) | 777 (100.0%) |
Commute Time in Orangeburg
The most frequently occuring commute durations in Orangeburg are 60 to 89 minutes (310 commuters, 18.2%), 15 to 19 minutes (272 commuters, 16.0%), and 5 to 9 minutes (209 commuters, 12.3%).
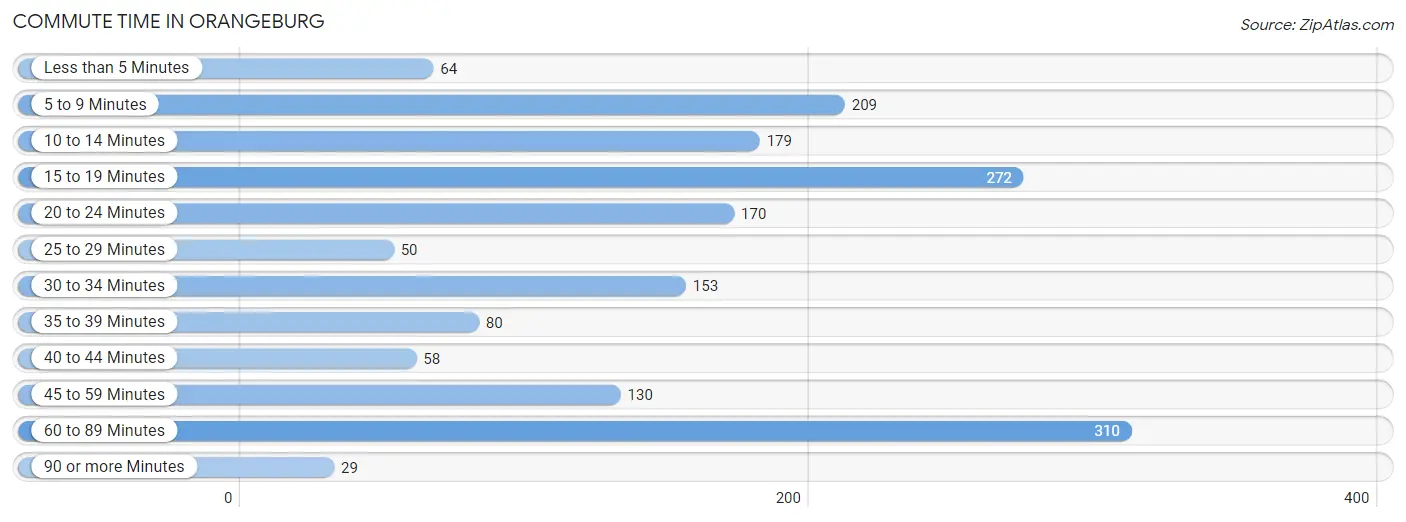
| Commute Time | # Commuters | % Commuters |
| Less than 5 Minutes | 64 | 3.8% |
| 5 to 9 Minutes | 209 | 12.3% |
| 10 to 14 Minutes | 179 | 10.5% |
| 15 to 19 Minutes | 272 | 16.0% |
| 20 to 24 Minutes | 170 | 10.0% |
| 25 to 29 Minutes | 50 | 2.9% |
| 30 to 34 Minutes | 153 | 9.0% |
| 35 to 39 Minutes | 80 | 4.7% |
| 40 to 44 Minutes | 58 | 3.4% |
| 45 to 59 Minutes | 130 | 7.6% |
| 60 to 89 Minutes | 310 | 18.2% |
| 90 or more Minutes | 29 | 1.7% |
Commute Time by Sex in Orangeburg
The most common commute times in Orangeburg are 60 to 89 minutes (179 commuters, 24.2%) for males and 15 to 19 minutes (154 commuters, 16.0%) for females.
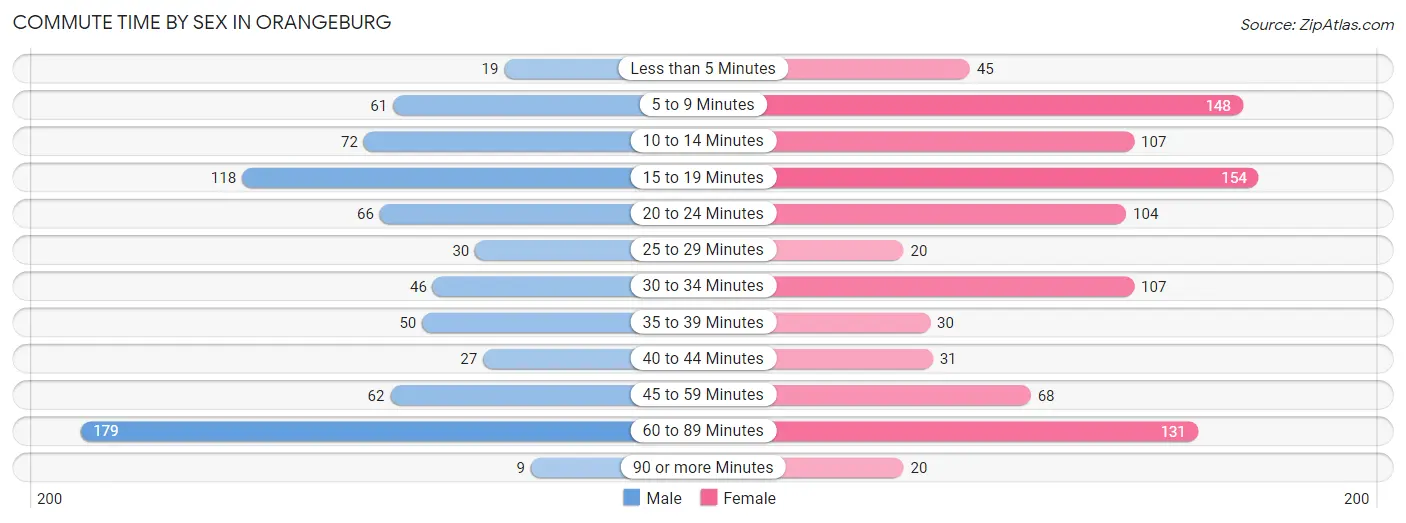
| Commute Time | Male | Female |
| Less than 5 Minutes | 19 (2.6%) | 45 (4.7%) |
| 5 to 9 Minutes | 61 (8.3%) | 148 (15.3%) |
| 10 to 14 Minutes | 72 (9.7%) | 107 (11.1%) |
| 15 to 19 Minutes | 118 (16.0%) | 154 (16.0%) |
| 20 to 24 Minutes | 66 (8.9%) | 104 (10.8%) |
| 25 to 29 Minutes | 30 (4.1%) | 20 (2.1%) |
| 30 to 34 Minutes | 46 (6.2%) | 107 (11.1%) |
| 35 to 39 Minutes | 50 (6.8%) | 30 (3.1%) |
| 40 to 44 Minutes | 27 (3.6%) | 31 (3.2%) |
| 45 to 59 Minutes | 62 (8.4%) | 68 (7.0%) |
| 60 to 89 Minutes | 179 (24.2%) | 131 (13.6%) |
| 90 or more Minutes | 9 (1.2%) | 20 (2.1%) |
Time of Departure to Work by Sex in Orangeburg
The most frequent times of departure to work in Orangeburg are 7:00 AM to 7:29 AM (162, 21.9%) for males and 8:00 AM to 8:29 AM (168, 17.4%) for females.
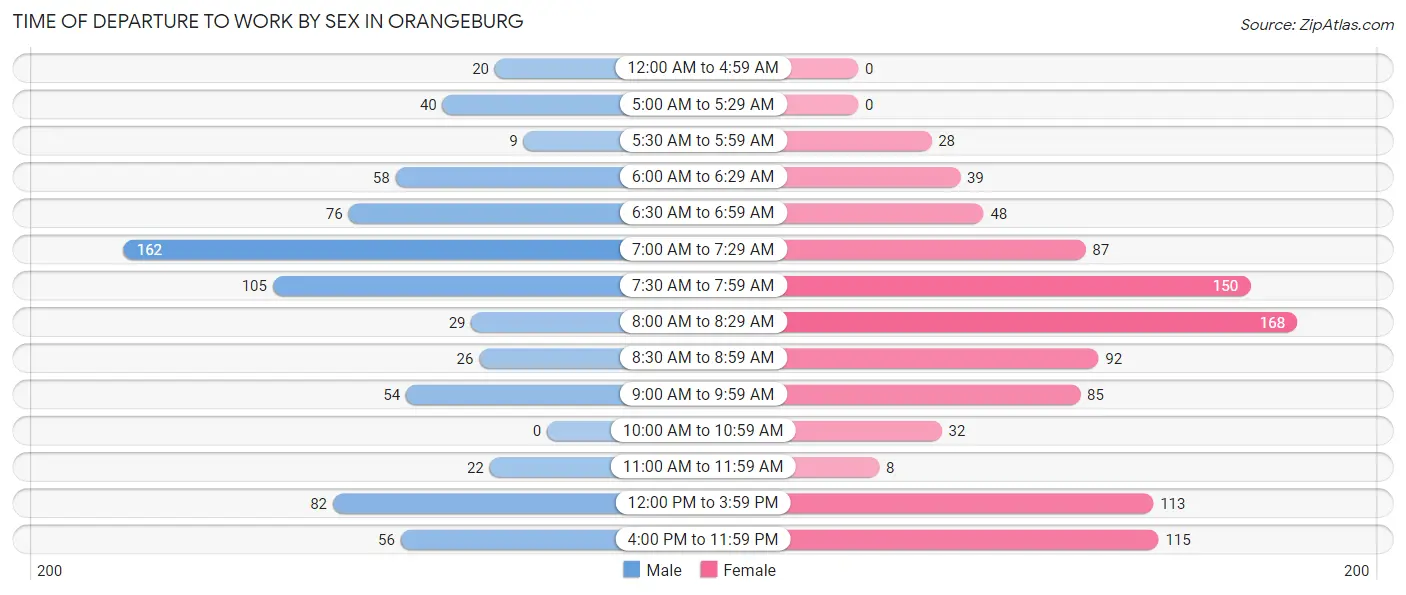
| Time of Departure | Male | Female |
| 12:00 AM to 4:59 AM | 20 (2.7%) | 0 (0.0%) |
| 5:00 AM to 5:29 AM | 40 (5.4%) | 0 (0.0%) |
| 5:30 AM to 5:59 AM | 9 (1.2%) | 28 (2.9%) |
| 6:00 AM to 6:29 AM | 58 (7.9%) | 39 (4.0%) |
| 6:30 AM to 6:59 AM | 76 (10.3%) | 48 (5.0%) |
| 7:00 AM to 7:29 AM | 162 (21.9%) | 87 (9.0%) |
| 7:30 AM to 7:59 AM | 105 (14.2%) | 150 (15.5%) |
| 8:00 AM to 8:29 AM | 29 (3.9%) | 168 (17.4%) |
| 8:30 AM to 8:59 AM | 26 (3.5%) | 92 (9.5%) |
| 9:00 AM to 9:59 AM | 54 (7.3%) | 85 (8.8%) |
| 10:00 AM to 10:59 AM | 0 (0.0%) | 32 (3.3%) |
| 11:00 AM to 11:59 AM | 22 (3.0%) | 8 (0.8%) |
| 12:00 PM to 3:59 PM | 82 (11.1%) | 113 (11.7%) |
| 4:00 PM to 11:59 PM | 56 (7.6%) | 115 (11.9%) |
| Total | 739 (100.0%) | 965 (100.0%) |
Housing Occupancy in Orangeburg
Occupancy by Ownership in Orangeburg
Of the total 1,532 dwellings in Orangeburg, owner-occupied units account for 1,209 (78.9%), while renter-occupied units make up 323 (21.1%).
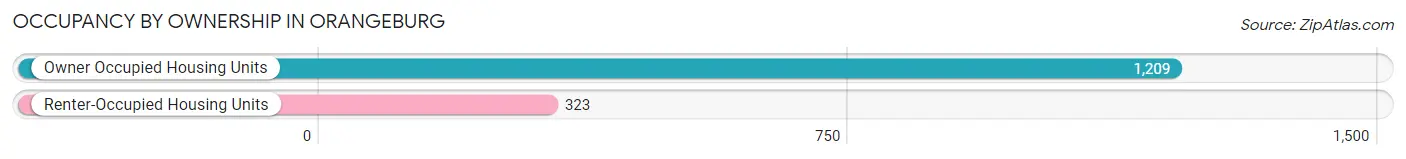
| Occupancy | # Housing Units | % Housing Units |
| Owner Occupied Housing Units | 1,209 | 78.9% |
| Renter-Occupied Housing Units | 323 | 21.1% |
| Total Occupied Housing Units | 1,532 | 100.0% |
Occupancy by Household Size in Orangeburg
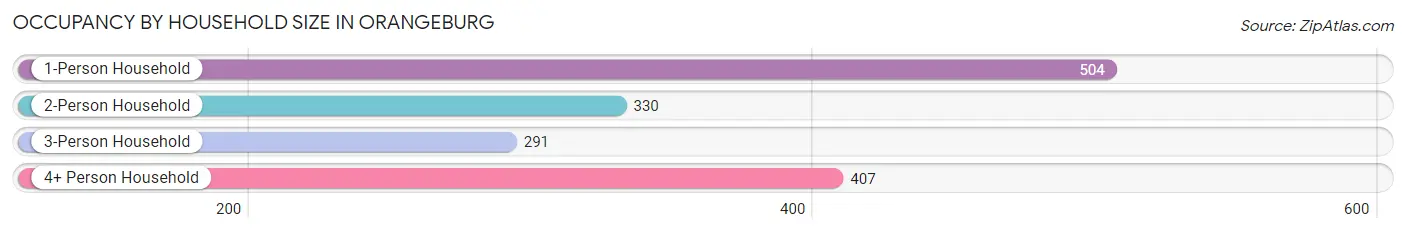
| Household Size | # Housing Units | % Housing Units |
| 1-Person Household | 504 | 32.9% |
| 2-Person Household | 330 | 21.5% |
| 3-Person Household | 291 | 19.0% |
| 4+ Person Household | 407 | 26.6% |
| Total Housing Units | 1,532 | 100.0% |
Occupancy by Ownership by Household Size in Orangeburg
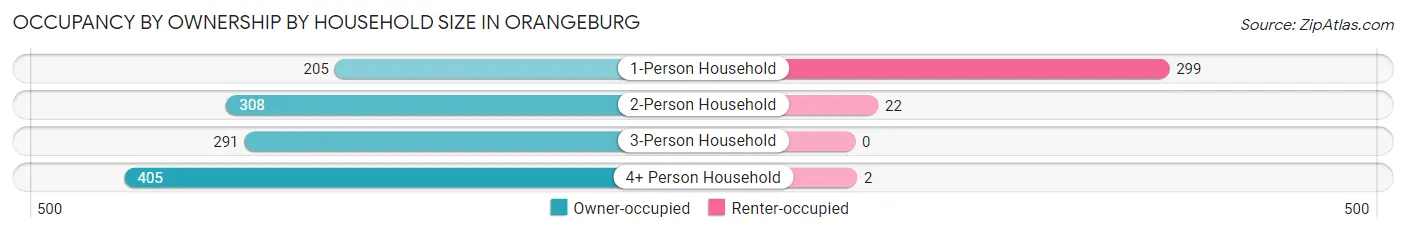
| Household Size | Owner-occupied | Renter-occupied |
| 1-Person Household | 205 (40.7%) | 299 (59.3%) |
| 2-Person Household | 308 (93.3%) | 22 (6.7%) |
| 3-Person Household | 291 (100.0%) | 0 (0.0%) |
| 4+ Person Household | 405 (99.5%) | 2 (0.5%) |
| Total Housing Units | 1,209 (78.9%) | 323 (21.1%) |
Occupancy by Educational Attainment in Orangeburg
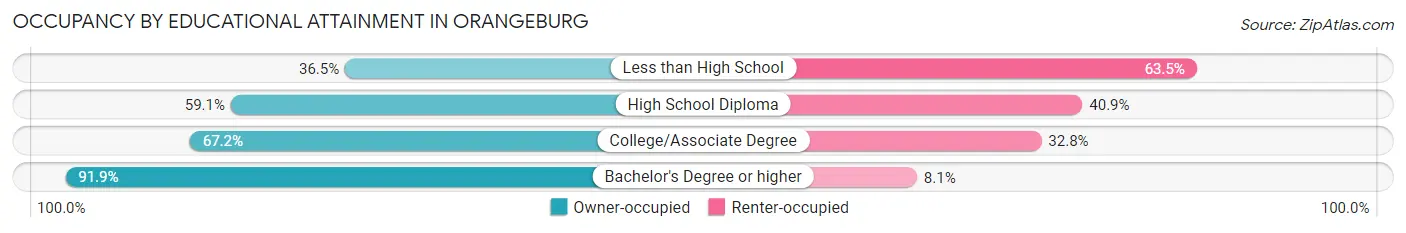
| Household Size | Owner-occupied | Renter-occupied |
| Less than High School | 35 (36.5%) | 61 (63.5%) |
| High School Diploma | 107 (59.1%) | 74 (40.9%) |
| College/Associate Degree | 236 (67.2%) | 115 (32.8%) |
| Bachelor's Degree or higher | 831 (91.9%) | 73 (8.1%) |
Occupancy by Age of Householder in Orangeburg
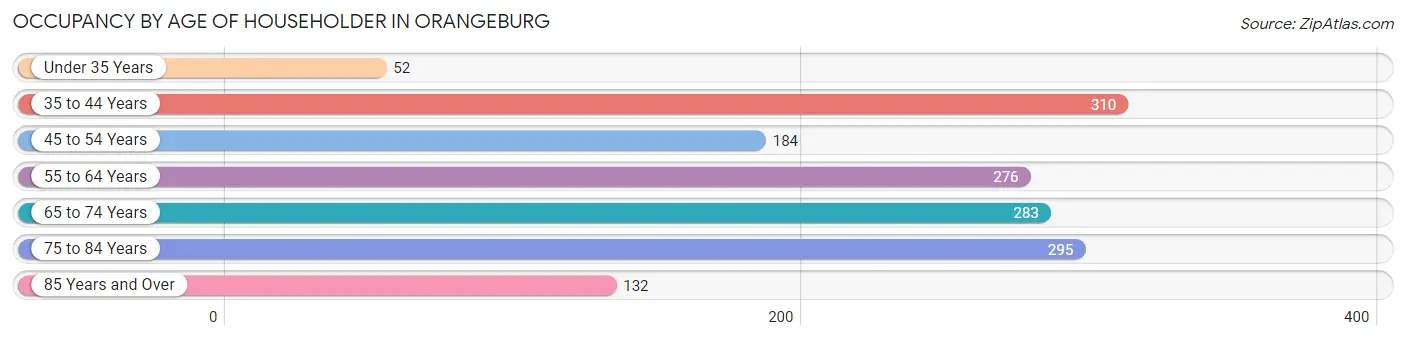
| Age Bracket | # Households | % Households |
| Under 35 Years | 52 | 3.4% |
| 35 to 44 Years | 310 | 20.2% |
| 45 to 54 Years | 184 | 12.0% |
| 55 to 64 Years | 276 | 18.0% |
| 65 to 74 Years | 283 | 18.5% |
| 75 to 84 Years | 295 | 19.3% |
| 85 Years and Over | 132 | 8.6% |
| Total | 1,532 | 100.0% |
Housing Finances in Orangeburg
Median Income by Occupancy in Orangeburg
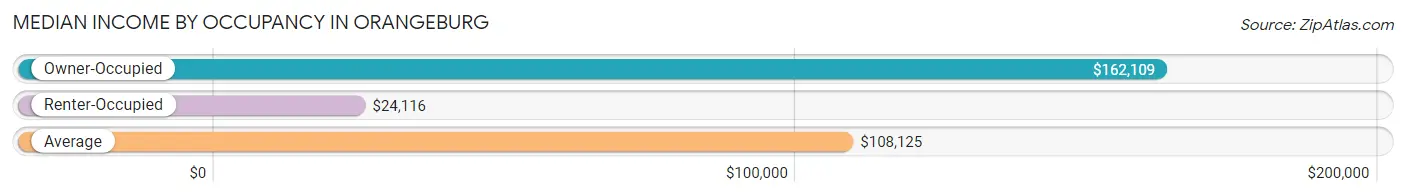
| Occupancy Type | # Households | Median Income |
| Owner-Occupied | 1,209 (78.9%) | $162,109 |
| Renter-Occupied | 323 (21.1%) | $24,116 |
| Average | 1,532 (100.0%) | $108,125 |
Occupancy by Householder Income Bracket in Orangeburg
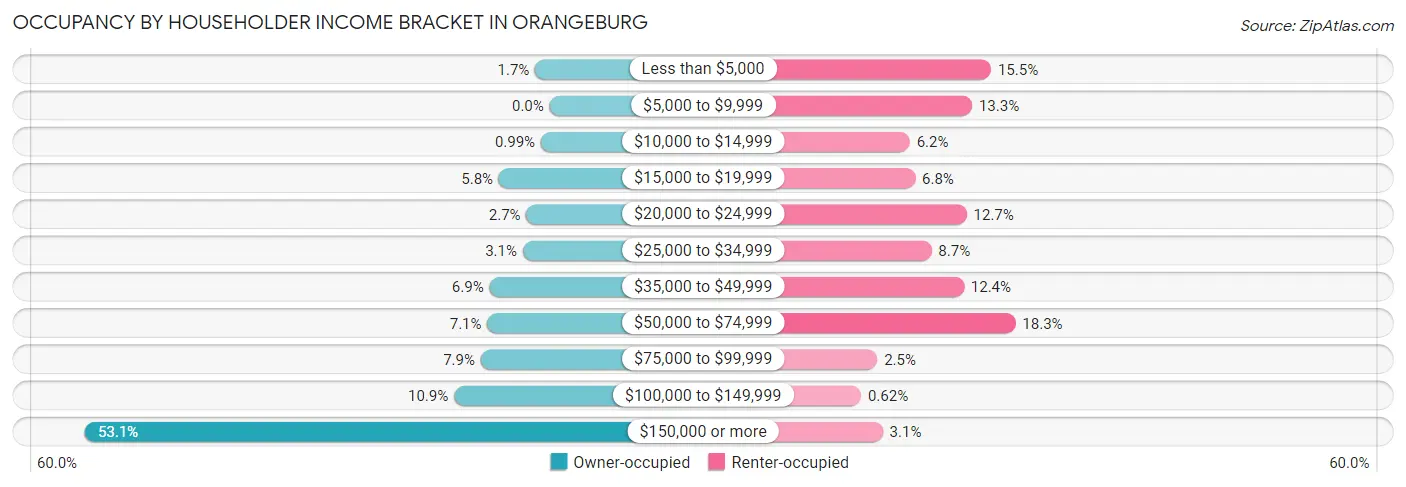
| Income Bracket | Owner-occupied | Renter-occupied |
| Less than $5,000 | 20 (1.7%) | 50 (15.5%) |
| $5,000 to $9,999 | 0 (0.0%) | 43 (13.3%) |
| $10,000 to $14,999 | 12 (1.0%) | 20 (6.2%) |
| $15,000 to $19,999 | 70 (5.8%) | 22 (6.8%) |
| $20,000 to $24,999 | 32 (2.6%) | 41 (12.7%) |
| $25,000 to $34,999 | 37 (3.1%) | 28 (8.7%) |
| $35,000 to $49,999 | 83 (6.9%) | 40 (12.4%) |
| $50,000 to $74,999 | 86 (7.1%) | 59 (18.3%) |
| $75,000 to $99,999 | 95 (7.9%) | 8 (2.5%) |
| $100,000 to $149,999 | 132 (10.9%) | 2 (0.6%) |
| $150,000 or more | 642 (53.1%) | 10 (3.1%) |
| Total | 1,209 (100.0%) | 323 (100.0%) |
Monthly Housing Cost Tiers in Orangeburg
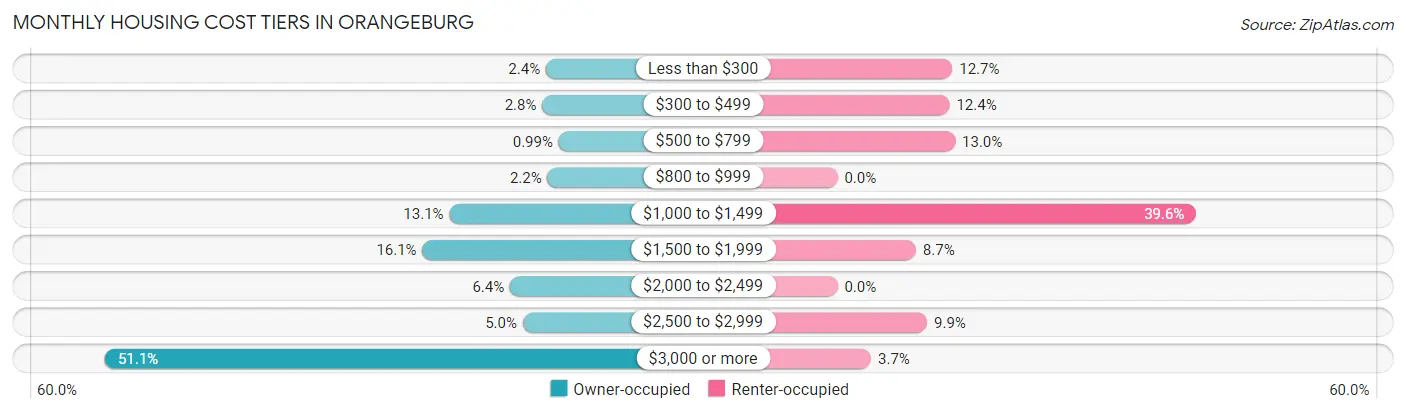
| Monthly Cost | Owner-occupied | Renter-occupied |
| Less than $300 | 29 (2.4%) | 41 (12.7%) |
| $300 to $499 | 34 (2.8%) | 40 (12.4%) |
| $500 to $799 | 12 (1.0%) | 42 (13.0%) |
| $800 to $999 | 27 (2.2%) | 0 (0.0%) |
| $1,000 to $1,499 | 158 (13.1%) | 128 (39.6%) |
| $1,500 to $1,999 | 194 (16.1%) | 28 (8.7%) |
| $2,000 to $2,499 | 77 (6.4%) | 0 (0.0%) |
| $2,500 to $2,999 | 60 (5.0%) | 32 (9.9%) |
| $3,000 or more | 618 (51.1%) | 12 (3.7%) |
| Total | 1,209 (100.0%) | 323 (100.0%) |
Physical Housing Characteristics in Orangeburg
Housing Structures in Orangeburg
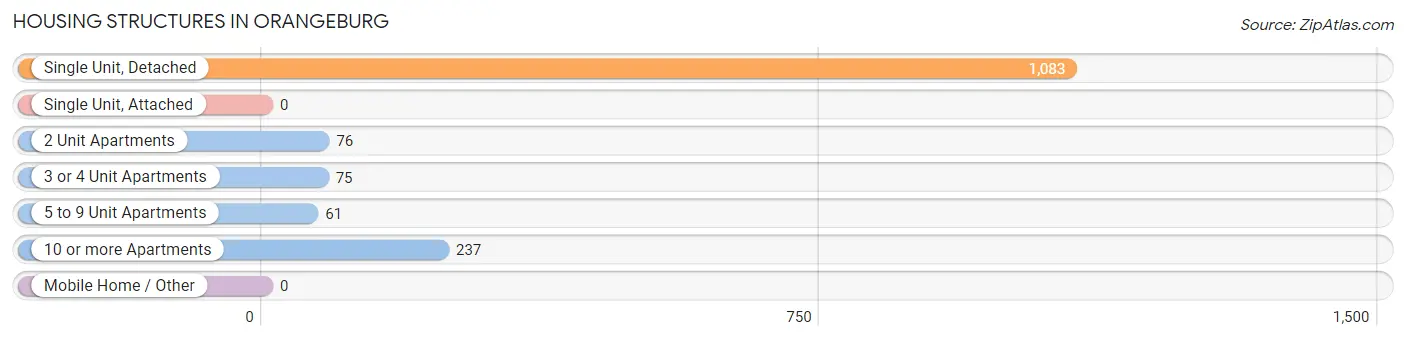
| Structure Type | # Housing Units | % Housing Units |
| Single Unit, Detached | 1,083 | 70.7% |
| Single Unit, Attached | 0 | 0.0% |
| 2 Unit Apartments | 76 | 5.0% |
| 3 or 4 Unit Apartments | 75 | 4.9% |
| 5 to 9 Unit Apartments | 61 | 4.0% |
| 10 or more Apartments | 237 | 15.5% |
| Mobile Home / Other | 0 | 0.0% |
| Total | 1,532 | 100.0% |
Housing Structures by Occupancy in Orangeburg
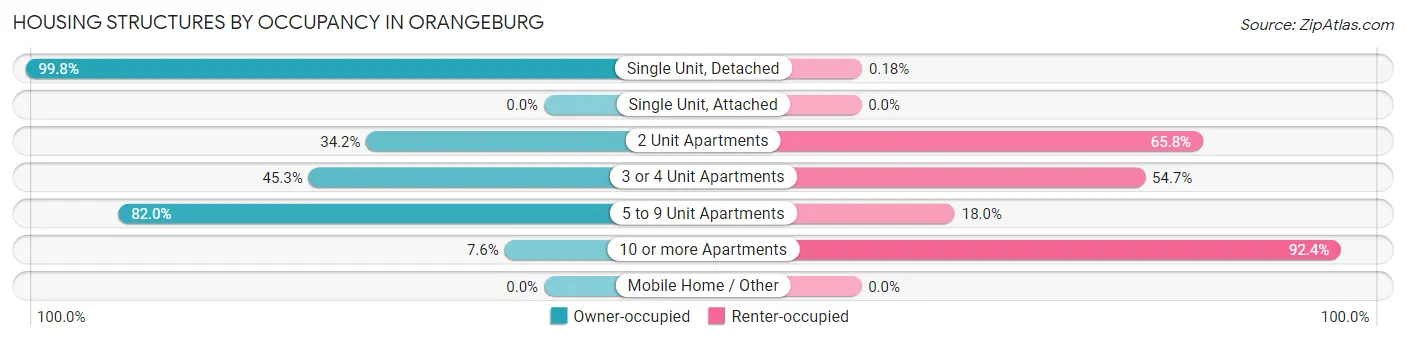
| Structure Type | Owner-occupied | Renter-occupied |
| Single Unit, Detached | 1,081 (99.8%) | 2 (0.2%) |
| Single Unit, Attached | 0 (0.0%) | 0 (0.0%) |
| 2 Unit Apartments | 26 (34.2%) | 50 (65.8%) |
| 3 or 4 Unit Apartments | 34 (45.3%) | 41 (54.7%) |
| 5 to 9 Unit Apartments | 50 (82.0%) | 11 (18.0%) |
| 10 or more Apartments | 18 (7.6%) | 219 (92.4%) |
| Mobile Home / Other | 0 (0.0%) | 0 (0.0%) |
| Total | 1,209 (78.9%) | 323 (21.1%) |
Housing Structures by Number of Rooms in Orangeburg
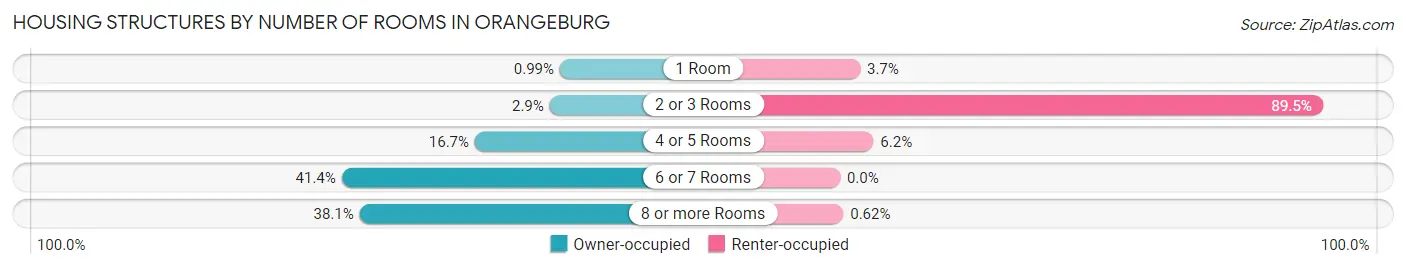
| Number of Rooms | Owner-occupied | Renter-occupied |
| 1 Room | 12 (1.0%) | 12 (3.7%) |
| 2 or 3 Rooms | 35 (2.9%) | 289 (89.5%) |
| 4 or 5 Rooms | 202 (16.7%) | 20 (6.2%) |
| 6 or 7 Rooms | 500 (41.4%) | 0 (0.0%) |
| 8 or more Rooms | 460 (38.1%) | 2 (0.6%) |
| Total | 1,209 (100.0%) | 323 (100.0%) |
Housing Structure by Heating Type in Orangeburg
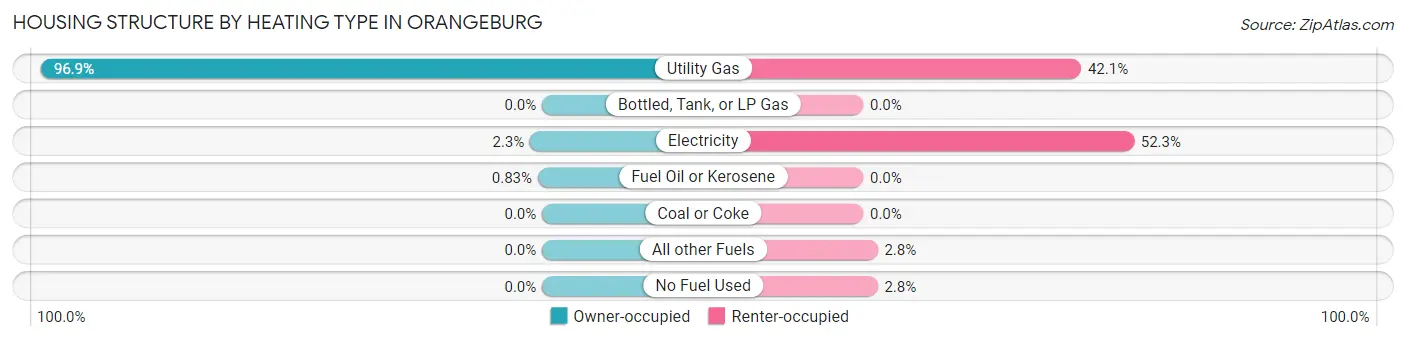
| Heating Type | Owner-occupied | Renter-occupied |
| Utility Gas | 1,171 (96.9%) | 136 (42.1%) |
| Bottled, Tank, or LP Gas | 0 (0.0%) | 0 (0.0%) |
| Electricity | 28 (2.3%) | 169 (52.3%) |
| Fuel Oil or Kerosene | 10 (0.8%) | 0 (0.0%) |
| Coal or Coke | 0 (0.0%) | 0 (0.0%) |
| All other Fuels | 0 (0.0%) | 9 (2.8%) |
| No Fuel Used | 0 (0.0%) | 9 (2.8%) |
| Total | 1,209 (100.0%) | 323 (100.0%) |
Household Vehicle Usage in Orangeburg
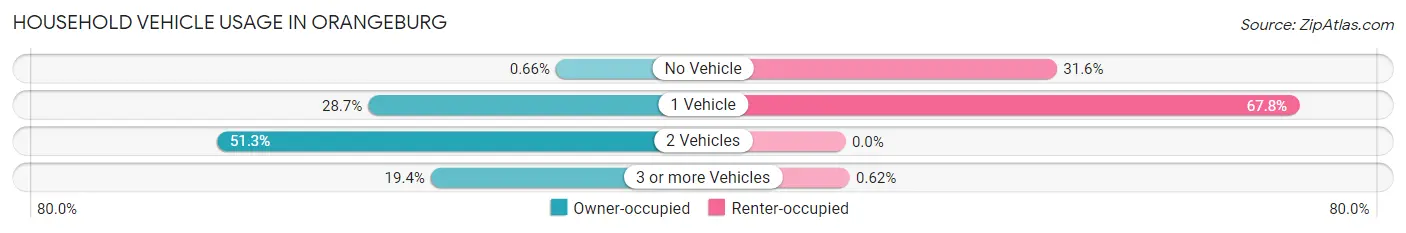
| Vehicles per Household | Owner-occupied | Renter-occupied |
| No Vehicle | 8 (0.7%) | 102 (31.6%) |
| 1 Vehicle | 347 (28.7%) | 219 (67.8%) |
| 2 Vehicles | 620 (51.3%) | 0 (0.0%) |
| 3 or more Vehicles | 234 (19.4%) | 2 (0.6%) |
| Total | 1,209 (100.0%) | 323 (100.0%) |
Real Estate & Mortgages in Orangeburg
Real Estate and Mortgage Overview in Orangeburg
| Characteristic | Without Mortgage | With Mortgage |
| Housing Units | 438 | 771 |
| Median Property Value | $531,400 | $633,400 |
| Median Household Income | $110,313 | $458 |
| Monthly Housing Costs | $1,445 | $618 |
| Real Estate Taxes | $10,001 | $0 |
Property Value by Mortgage Status in Orangeburg
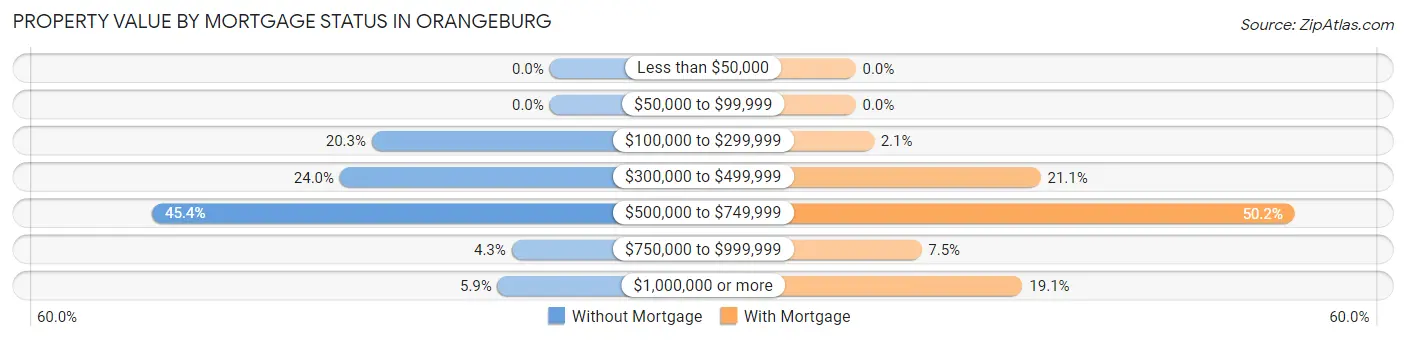
| Property Value | Without Mortgage | With Mortgage |
| Less than $50,000 | 0 (0.0%) | 0 (0.0%) |
| $50,000 to $99,999 | 0 (0.0%) | 0 (0.0%) |
| $100,000 to $299,999 | 89 (20.3%) | 16 (2.1%) |
| $300,000 to $499,999 | 105 (24.0%) | 163 (21.1%) |
| $500,000 to $749,999 | 199 (45.4%) | 387 (50.2%) |
| $750,000 to $999,999 | 19 (4.3%) | 58 (7.5%) |
| $1,000,000 or more | 26 (5.9%) | 147 (19.1%) |
| Total | 438 (100.0%) | 771 (100.0%) |
Household Income by Mortgage Status in Orangeburg
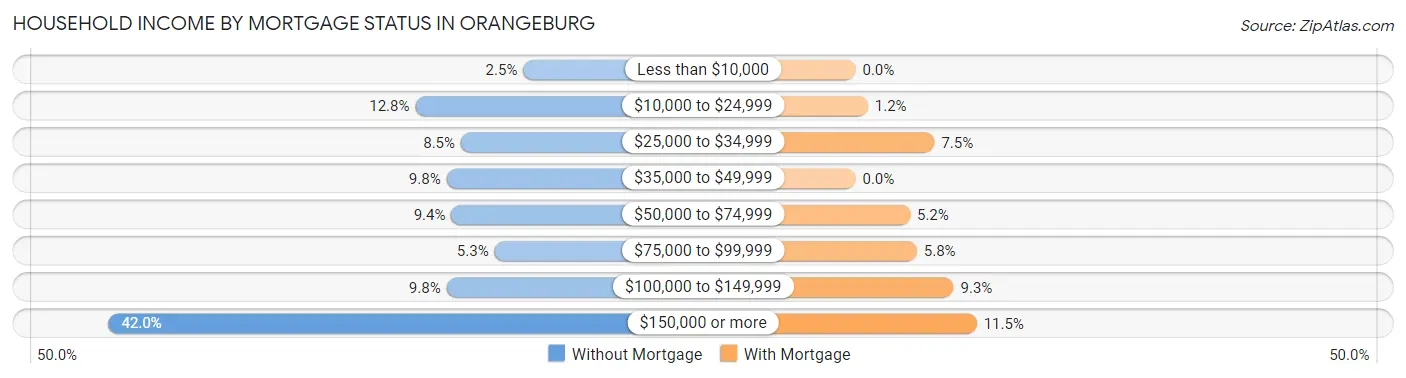
| Household Income | Without Mortgage | With Mortgage |
| Less than $10,000 | 11 (2.5%) | 0 (0.0%) |
| $10,000 to $24,999 | 56 (12.8%) | 9 (1.2%) |
| $25,000 to $34,999 | 37 (8.5%) | 58 (7.5%) |
| $35,000 to $49,999 | 43 (9.8%) | 0 (0.0%) |
| $50,000 to $74,999 | 41 (9.4%) | 40 (5.2%) |
| $75,000 to $99,999 | 23 (5.2%) | 45 (5.8%) |
| $100,000 to $149,999 | 43 (9.8%) | 72 (9.3%) |
| $150,000 or more | 184 (42.0%) | 89 (11.5%) |
| Total | 438 (100.0%) | 771 (100.0%) |
Property Value to Household Income Ratio in Orangeburg
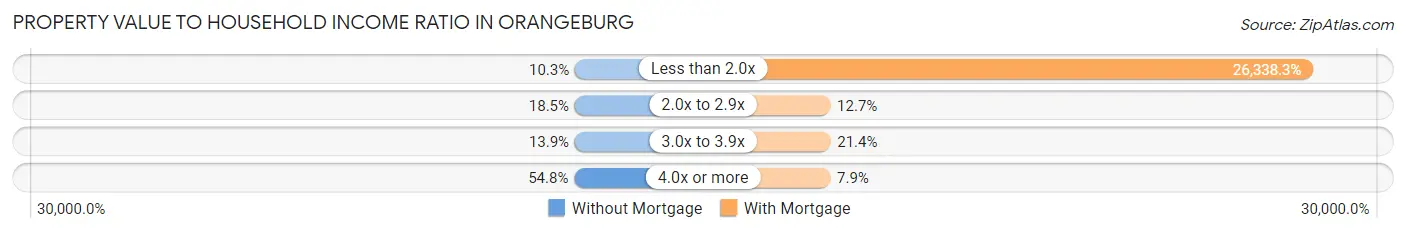
| Value-to-Income Ratio | Without Mortgage | With Mortgage |
| Less than 2.0x | 45 (10.3%) | 203,068 (26,338.3%) |
| 2.0x to 2.9x | 81 (18.5%) | 98 (12.7%) |
| 3.0x to 3.9x | 61 (13.9%) | 165 (21.4%) |
| 4.0x or more | 240 (54.8%) | 61 (7.9%) |
| Total | 438 (100.0%) | 771 (100.0%) |
Real Estate Taxes by Mortgage Status in Orangeburg
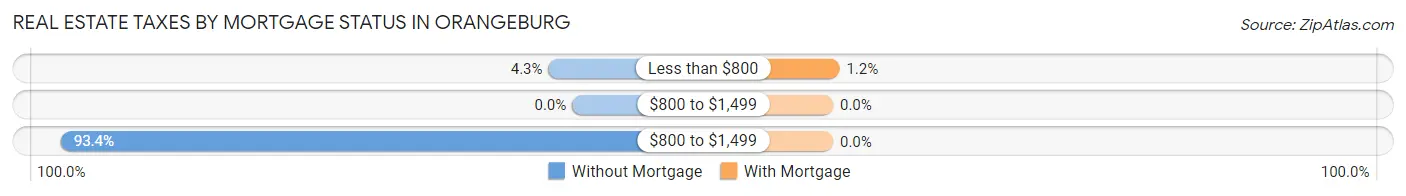
| Property Taxes | Without Mortgage | With Mortgage |
| Less than $800 | 19 (4.3%) | 9 (1.2%) |
| $800 to $1,499 | 0 (0.0%) | 0 (0.0%) |
| $800 to $1,499 | 409 (93.4%) | 0 (0.0%) |
| Total | 438 (100.0%) | 771 (100.0%) |
Health & Disability in Orangeburg
Health Insurance Coverage by Age in Orangeburg
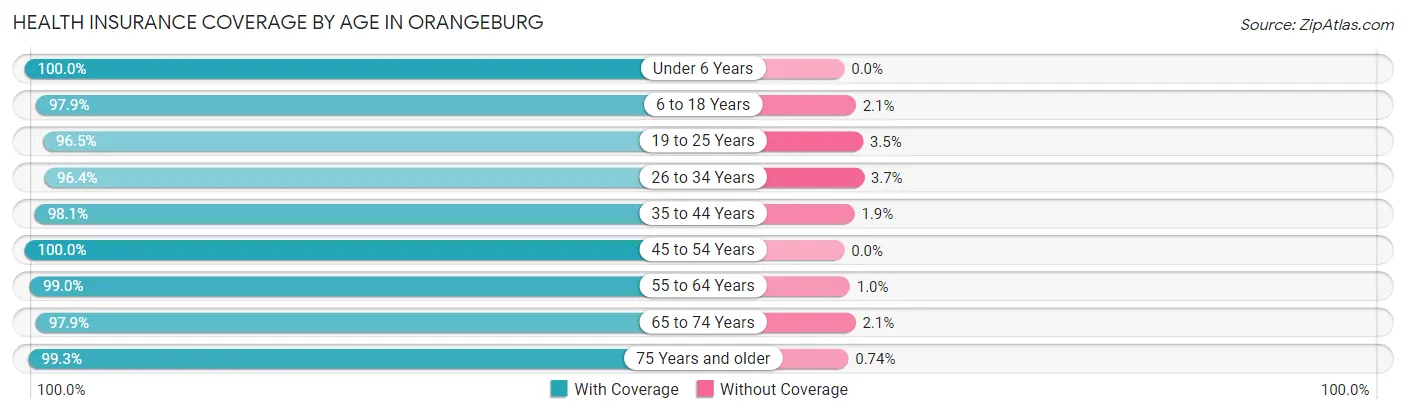
| Age Bracket | With Coverage | Without Coverage |
| Under 6 Years | 277 (100.0%) | 0 (0.0%) |
| 6 to 18 Years | 551 (97.9%) | 12 (2.1%) |
| 19 to 25 Years | 780 (96.5%) | 28 (3.5%) |
| 26 to 34 Years | 370 (96.4%) | 14 (3.6%) |
| 35 to 44 Years | 568 (98.1%) | 11 (1.9%) |
| 45 to 54 Years | 404 (100.0%) | 0 (0.0%) |
| 55 to 64 Years | 486 (99.0%) | 5 (1.0%) |
| 65 to 74 Years | 422 (97.9%) | 9 (2.1%) |
| 75 Years and older | 802 (99.3%) | 6 (0.7%) |
| Total | 4,660 (98.2%) | 85 (1.8%) |
Health Insurance Coverage by Citizenship Status in Orangeburg
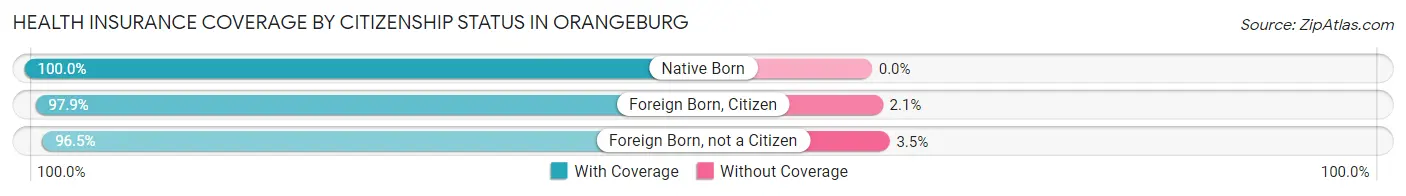
| Citizenship Status | With Coverage | Without Coverage |
| Native Born | 277 (100.0%) | 0 (0.0%) |
| Foreign Born, Citizen | 551 (97.9%) | 12 (2.1%) |
| Foreign Born, not a Citizen | 780 (96.5%) | 28 (3.5%) |
Health Insurance Coverage by Household Income in Orangeburg
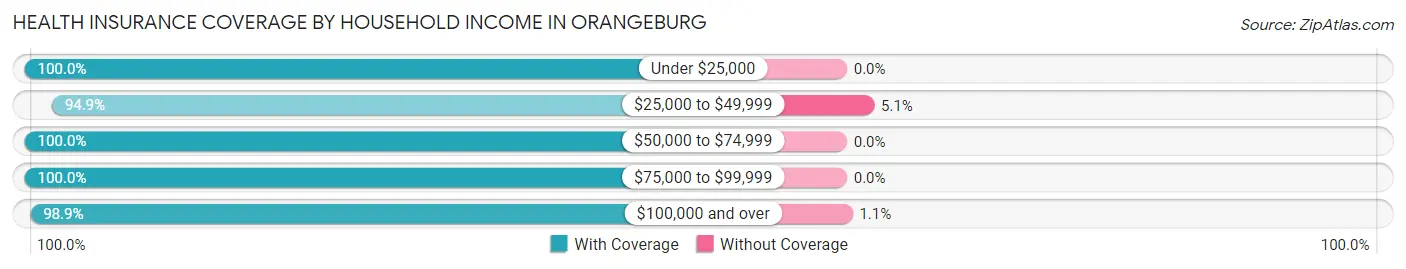
| Household Income | With Coverage | Without Coverage |
| Under $25,000 | 426 (100.0%) | 0 (0.0%) |
| $25,000 to $49,999 | 260 (94.9%) | 14 (5.1%) |
| $50,000 to $74,999 | 256 (100.0%) | 0 (0.0%) |
| $75,000 to $99,999 | 204 (100.0%) | 0 (0.0%) |
| $100,000 and over | 2,603 (98.9%) | 28 (1.1%) |
Public vs Private Health Insurance Coverage by Age in Orangeburg
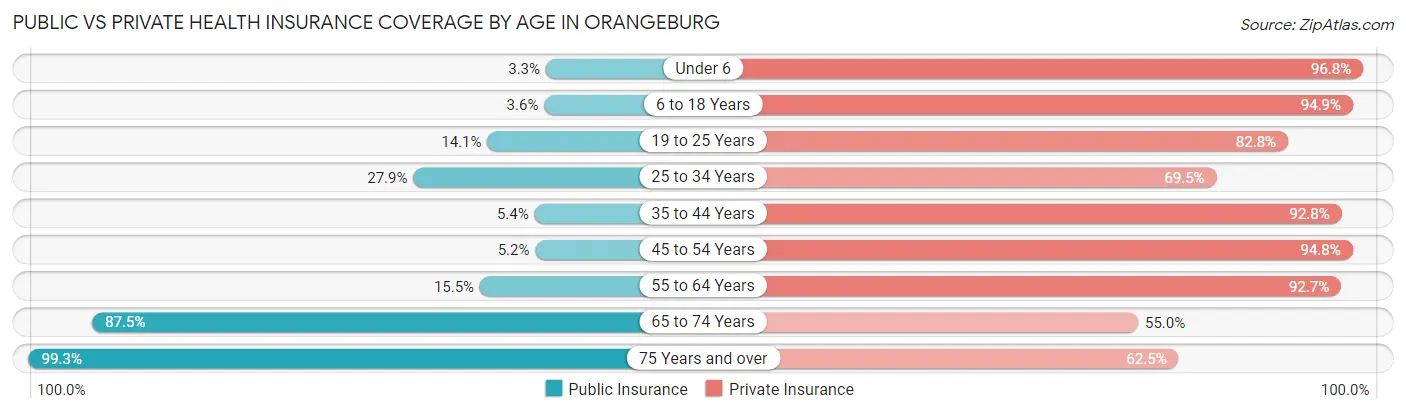
| Age Bracket | Public Insurance | Private Insurance |
| Under 6 | 9 (3.3%) | 268 (96.8%) |
| 6 to 18 Years | 20 (3.5%) | 534 (94.9%) |
| 19 to 25 Years | 114 (14.1%) | 669 (82.8%) |
| 25 to 34 Years | 107 (27.9%) | 267 (69.5%) |
| 35 to 44 Years | 31 (5.3%) | 537 (92.7%) |
| 45 to 54 Years | 21 (5.2%) | 383 (94.8%) |
| 55 to 64 Years | 76 (15.5%) | 455 (92.7%) |
| 65 to 74 Years | 377 (87.5%) | 237 (55.0%) |
| 75 Years and over | 802 (99.3%) | 505 (62.5%) |
| Total | 1,557 (32.8%) | 3,855 (81.2%) |
Disability Status by Sex by Age in Orangeburg
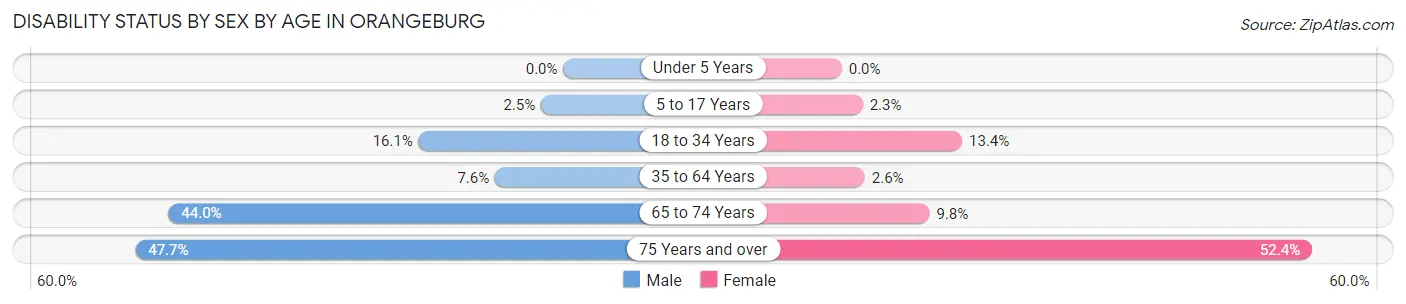
| Age Bracket | Male | Female |
| Under 5 Years | 0 (0.0%) | 0 (0.0%) |
| 5 to 17 Years | 6 (2.5%) | 8 (2.3%) |
| 18 to 34 Years | 102 (16.1%) | 89 (13.4%) |
| 35 to 64 Years | 56 (7.6%) | 19 (2.6%) |
| 65 to 74 Years | 95 (44.0%) | 21 (9.8%) |
| 75 Years and over | 123 (47.7%) | 288 (52.4%) |
Disability Class by Sex by Age in Orangeburg
Disability Class: Hearing Difficulty
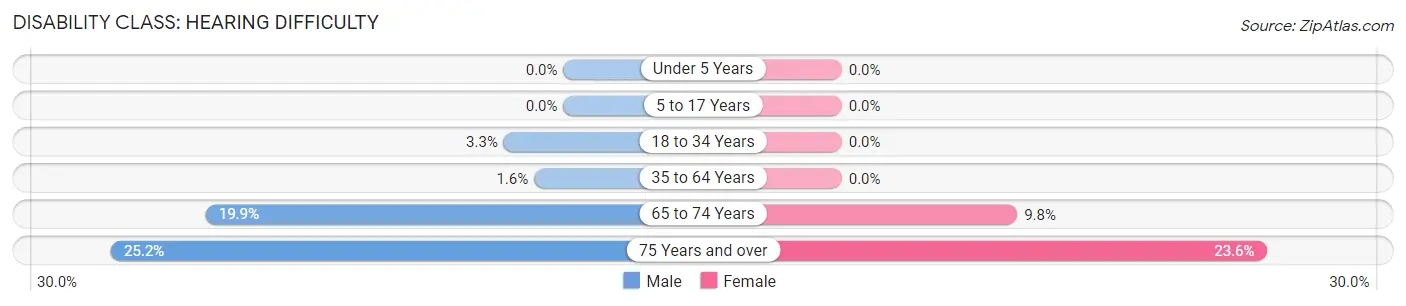
| Age Bracket | Male | Female |
| Under 5 Years | 0 (0.0%) | 0 (0.0%) |
| 5 to 17 Years | 0 (0.0%) | 0 (0.0%) |
| 18 to 34 Years | 21 (3.3%) | 0 (0.0%) |
| 35 to 64 Years | 12 (1.6%) | 0 (0.0%) |
| 65 to 74 Years | 43 (19.9%) | 21 (9.8%) |
| 75 Years and over | 65 (25.2%) | 130 (23.6%) |
Disability Class: Vision Difficulty
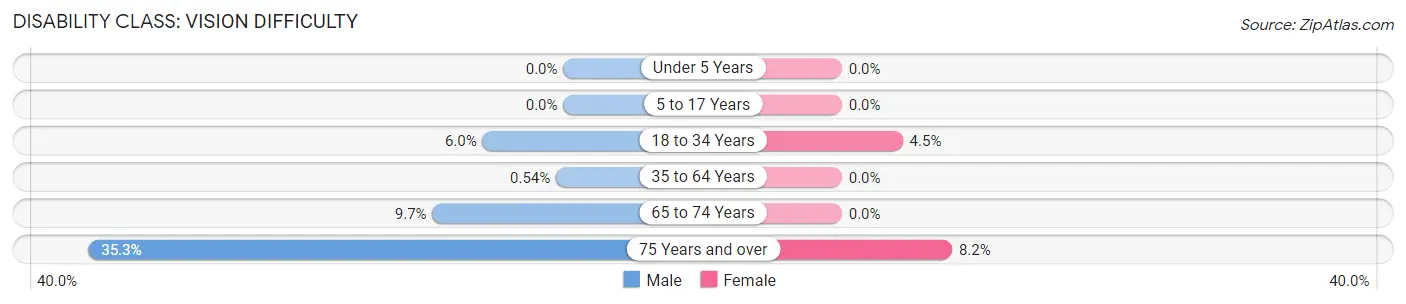
| Age Bracket | Male | Female |
| Under 5 Years | 0 (0.0%) | 0 (0.0%) |
| 5 to 17 Years | 0 (0.0%) | 0 (0.0%) |
| 18 to 34 Years | 38 (6.0%) | 30 (4.5%) |
| 35 to 64 Years | 4 (0.5%) | 0 (0.0%) |
| 65 to 74 Years | 21 (9.7%) | 0 (0.0%) |
| 75 Years and over | 91 (35.3%) | 45 (8.2%) |
Disability Class: Cognitive Difficulty
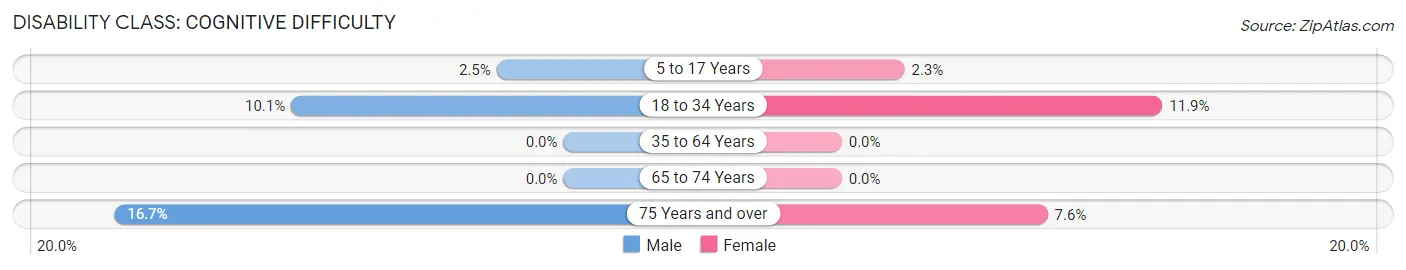
| Age Bracket | Male | Female |
| 5 to 17 Years | 6 (2.5%) | 8 (2.3%) |
| 18 to 34 Years | 64 (10.1%) | 79 (11.9%) |
| 35 to 64 Years | 0 (0.0%) | 0 (0.0%) |
| 65 to 74 Years | 0 (0.0%) | 0 (0.0%) |
| 75 Years and over | 43 (16.7%) | 42 (7.6%) |
Disability Class: Ambulatory Difficulty
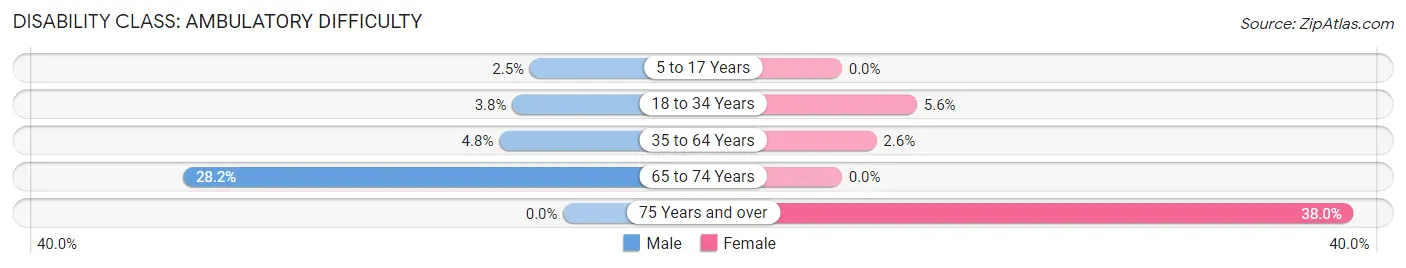
| Age Bracket | Male | Female |
| 5 to 17 Years | 6 (2.5%) | 0 (0.0%) |
| 18 to 34 Years | 24 (3.8%) | 37 (5.6%) |
| 35 to 64 Years | 35 (4.8%) | 19 (2.6%) |
| 65 to 74 Years | 61 (28.2%) | 0 (0.0%) |
| 75 Years and over | 0 (0.0%) | 209 (38.0%) |
Disability Class: Self-Care Difficulty
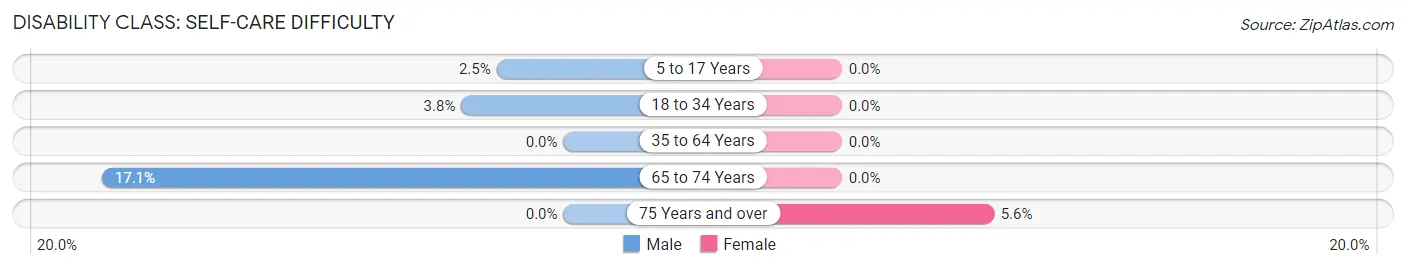
| Age Bracket | Male | Female |
| 5 to 17 Years | 6 (2.5%) | 0 (0.0%) |
| 18 to 34 Years | 24 (3.8%) | 0 (0.0%) |
| 35 to 64 Years | 0 (0.0%) | 0 (0.0%) |
| 65 to 74 Years | 37 (17.1%) | 0 (0.0%) |
| 75 Years and over | 0 (0.0%) | 31 (5.6%) |
Technology Access in Orangeburg
Computing Device Access in Orangeburg
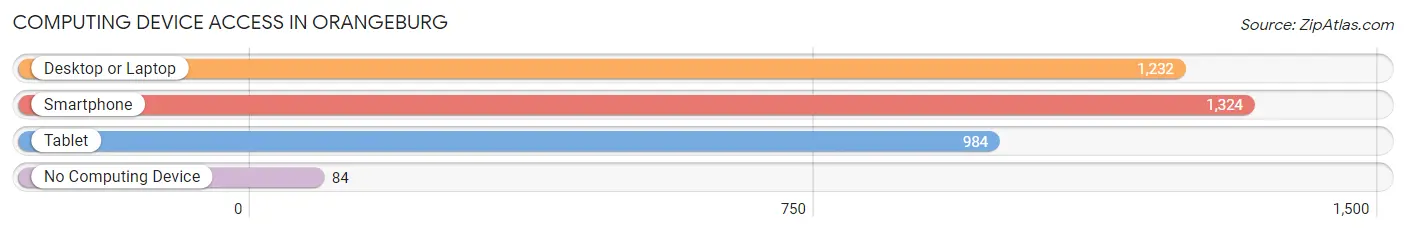
| Device Type | # Households | % Households |
| Desktop or Laptop | 1,232 | 80.4% |
| Smartphone | 1,324 | 86.4% |
| Tablet | 984 | 64.2% |
| No Computing Device | 84 | 5.5% |
| Total | 1,532 | 100.0% |
Internet Access in Orangeburg
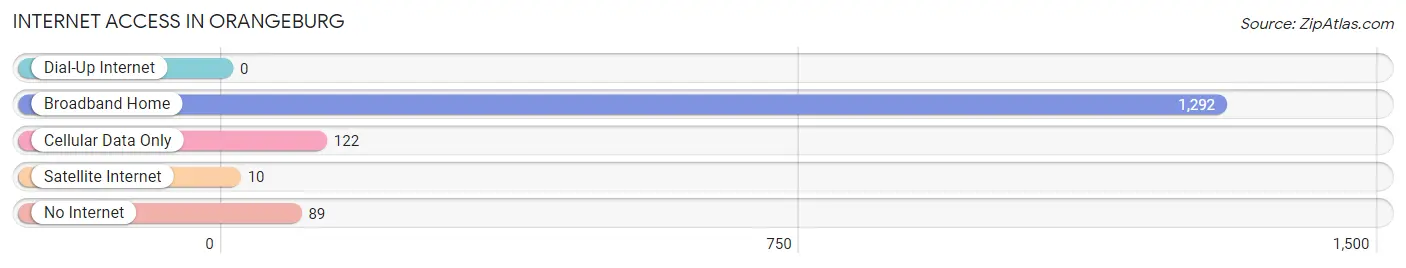
| Internet Type | # Households | % Households |
| Dial-Up Internet | 0 | 0.0% |
| Broadband Home | 1,292 | 84.3% |
| Cellular Data Only | 122 | 8.0% |
| Satellite Internet | 10 | 0.6% |
| No Internet | 89 | 5.8% |
| Total | 1,532 | 100.0% |
Orangeburg Summary
History
Orangeburg is a hamlet located in the town of Orangetown in Rockland County, New York. It is located about 20 miles north of New York City. The hamlet was first settled in the late 17th century by Dutch settlers. The hamlet was originally known as Blauveltville, named after the Blauvelt family who were among the first settlers. The hamlet was later renamed Orangeburg in 1806 after the Orangeburg Patent, which was a large land grant given to the Blauvelt family by the British Crown.
The hamlet of Orangeburg was an important stop on the Erie Railroad, which ran through the area in the mid-19th century. The railroad brought many new people to the area, and the hamlet grew rapidly. By the late 19th century, Orangeburg had become a popular summer resort destination for wealthy New Yorkers. The hamlet was home to several large hotels, including the Orangeburg Hotel, which was built in 1891.
The hamlet of Orangeburg was also home to several large factories in the late 19th and early 20th centuries. These factories included a paper mill, a brickyard, and a tannery. The factories provided employment for many of the residents of Orangeburg.
Geography
Orangeburg is located in the town of Orangetown in Rockland County, New York. It is located about 20 miles north of New York City. The hamlet is situated on the western bank of the Hudson River. The hamlet is bordered by the hamlets of Blauvelt to the north, Pearl River to the east, and Tappan to the south.
The terrain of Orangeburg is mostly flat, with some rolling hills. The hamlet is located in the Ramapo Mountains, which are part of the Appalachian Mountains. The hamlet is located in a temperate climate, with hot summers and cold winters.
Economy
The economy of Orangeburg is largely based on the service industry. The hamlet is home to several restaurants, bars, and other businesses that cater to tourists and locals alike. The hamlet is also home to several retail stores, including a grocery store, a hardware store, and a pharmacy.
Orangeburg is also home to several manufacturing companies. These companies produce a variety of products, including paper products, plastics, and chemicals. The hamlet is also home to several construction companies, which provide employment for many of the residents of Orangeburg.
Demographics
As of the 2010 census, the population of Orangeburg was 8,945. The population is largely white (83.3%), with smaller percentages of African American (7.2%), Asian (4.2%), and Hispanic (3.7%) residents. The median household income in Orangeburg is $77,845, which is higher than the national average.
The majority of the population of Orangeburg is employed in the service industry (37.2%), followed by manufacturing (17.2%), retail (14.2%), and construction (10.2%). The unemployment rate in Orangeburg is 4.2%, which is lower than the national average.
Conclusion
Orangeburg is a hamlet located in the town of Orangetown in Rockland County, New York. It is located about 20 miles north of New York City. The hamlet was first settled in the late 17th century by Dutch settlers and was later renamed Orangeburg in 1806 after the Orangeburg Patent. The hamlet was an important stop on the Erie Railroad in the mid-19th century and became a popular summer resort destination for wealthy New Yorkers. The hamlet is home to several restaurants, bars, and other businesses that cater to tourists and locals alike. The population of Orangeburg is largely white, with smaller percentages of African American, Asian, and Hispanic residents. The majority of the population is employed in the service industry, followed by manufacturing, retail, and construction. The median household income in Orangeburg is $77,845, which is higher than the national average.
Common Questions
What is Per Capita Income in Orangeburg?
Per Capita income in Orangeburg is $47,317.
What is the Median Family Income in Orangeburg?
Median Family Income in Orangeburg is $197,885.
What is the Median Household income in Orangeburg?
Median Household Income in Orangeburg is $108,125.
What is Inequality or Gini Index in Orangeburg?
Inequality or Gini Index in Orangeburg is 0.46.
What is the Total Population of Orangeburg?
Total Population of Orangeburg is 4,745.
What is the Total Male Population of Orangeburg?
Total Male Population of Orangeburg is 2,125.
What is the Total Female Population of Orangeburg?
Total Female Population of Orangeburg is 2,620.
What is the Ratio of Males per 100 Females in Orangeburg?
There are 81.11 Males per 100 Females in Orangeburg.
What is the Ratio of Females per 100 Males in Orangeburg?
There are 123.29 Females per 100 Males in Orangeburg.
What is the Median Population Age in Orangeburg?
Median Population Age in Orangeburg is 44.1 Years.
What is the Average Family Size in Orangeburg
Average Family Size in Orangeburg is 3.2 People.
What is the Average Household Size in Orangeburg
Average Household Size in Orangeburg is 2.5 People.
How Large is the Labor Force in Orangeburg?
There are 2,180 People in the Labor Forcein in Orangeburg.
What is the Percentage of People in the Labor Force in Orangeburg?
52.7% of People are in the Labor Force in Orangeburg.
What is the Unemployment Rate in Orangeburg?
Unemployment Rate in Orangeburg is 6.0%.