Wilcox, PA Map & Demographics
Wilcox Map
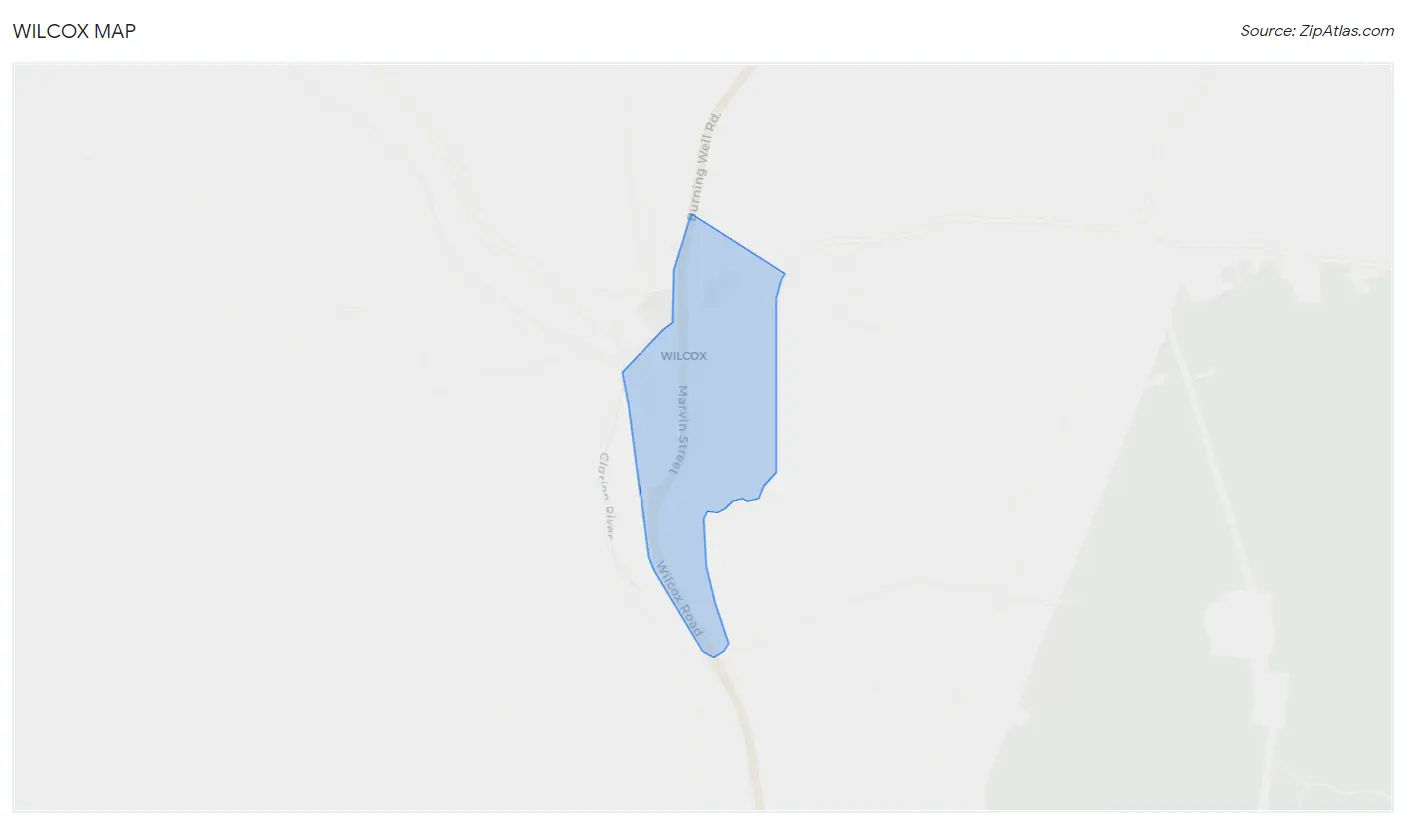
Wilcox Overview
$20,915
PER CAPITA INCOME
$54,236
AVG FAMILY INCOME
$48,750
AVG HOUSEHOLD INCOME
5.6%
WAGE / INCOME GAP [ % ]
94.4¢/ $1
WAGE / INCOME GAP [ $ ]
0.34
INEQUALITY / GINI INDEX
404
TOTAL POPULATION
234
MALE POPULATION
170
FEMALE POPULATION
137.65
MALES / 100 FEMALES
72.65
FEMALES / 100 MALES
40.1
MEDIAN AGE
4.1
AVG FAMILY SIZE
2.8
AVG HOUSEHOLD SIZE
197
LABOR FORCE [ PEOPLE ]
59.5%
PERCENT IN LABOR FORCE
7.1%
UNEMPLOYMENT RATE
Wilcox Zip Codes
Wilcox Area Codes
Income in Wilcox
Income Overview in Wilcox
Per Capita Income in Wilcox is $20,915, while median incomes of families and households are $54,236 and $48,750 respectively.
| Characteristic | Number | Measure |
| Per Capita Income | 404 | $20,915 |
| Median Family Income | 75 | $54,236 |
| Mean Family Income | 75 | $58,809 |
| Median Household Income | 145 | $48,750 |
| Mean Household Income | 145 | $51,454 |
| Income Deficit | 75 | $0 |
| Wage / Income Gap (%) | 404 | 5.56% |
| Wage / Income Gap ($) | 404 | 94.44¢ per $1 |
| Gini / Inequality Index | 404 | 0.34 |
Earnings by Sex in Wilcox
Average Earnings in Wilcox are $26,696, $26,803 for men and $25,313 for women, a difference of 5.6%.
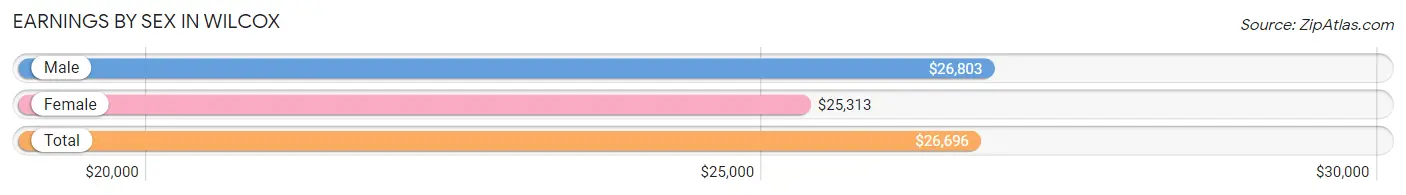
| Sex | Number | Average Earnings |
| Male | 127 (63.5%) | $26,803 |
| Female | 73 (36.5%) | $25,313 |
| Total | 200 (100.0%) | $26,696 |
Earnings by Sex by Income Bracket in Wilcox
The most common earnings brackets in Wilcox are $25,000 to $29,999 for men (60 | 47.2%) and $55,000 to $64,999 for women (19 | 26.0%).
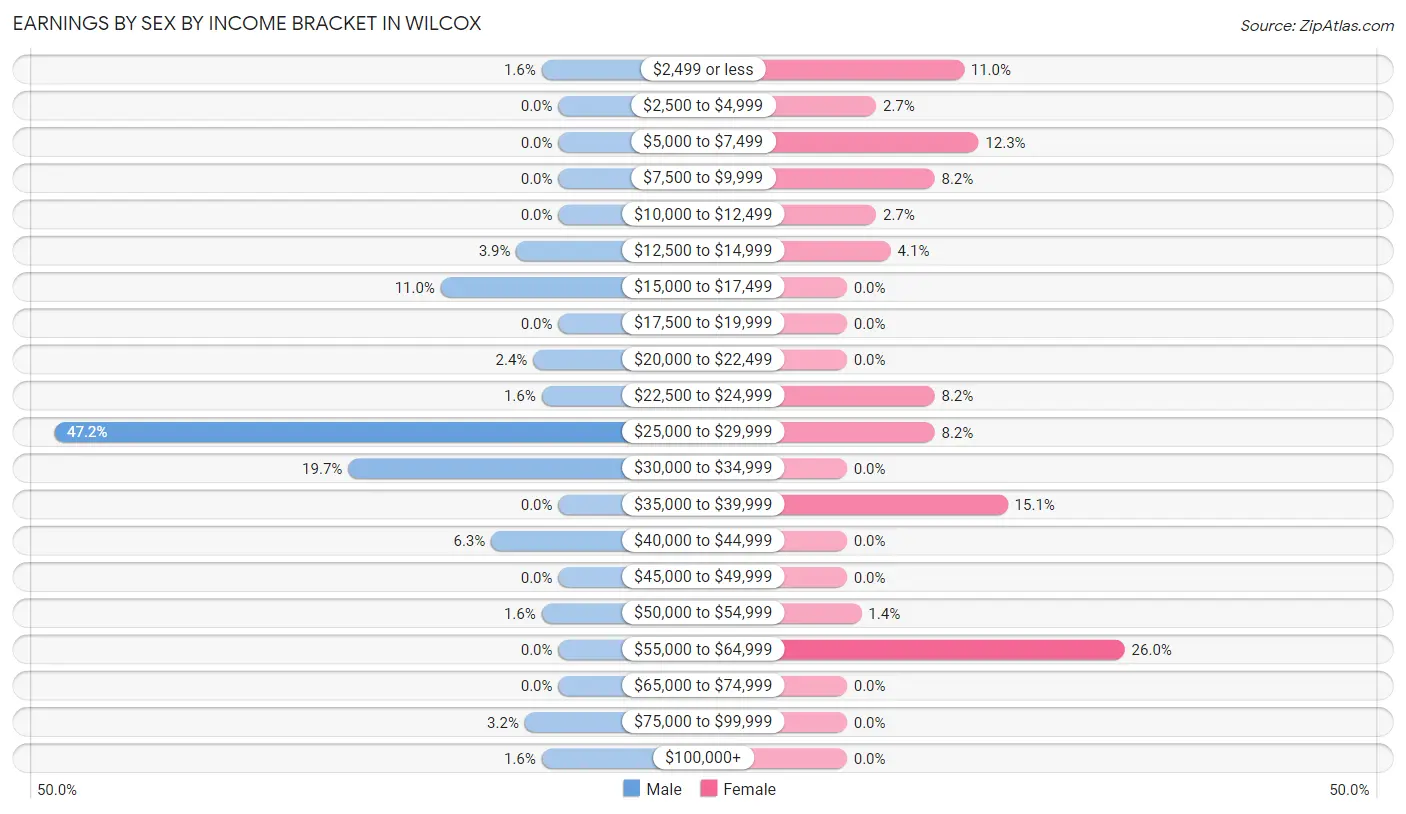
| Income | Male | Female |
| $2,499 or less | 2 (1.6%) | 8 (11.0%) |
| $2,500 to $4,999 | 0 (0.0%) | 2 (2.7%) |
| $5,000 to $7,499 | 0 (0.0%) | 9 (12.3%) |
| $7,500 to $9,999 | 0 (0.0%) | 6 (8.2%) |
| $10,000 to $12,499 | 0 (0.0%) | 2 (2.7%) |
| $12,500 to $14,999 | 5 (3.9%) | 3 (4.1%) |
| $15,000 to $17,499 | 14 (11.0%) | 0 (0.0%) |
| $17,500 to $19,999 | 0 (0.0%) | 0 (0.0%) |
| $20,000 to $22,499 | 3 (2.4%) | 0 (0.0%) |
| $22,500 to $24,999 | 2 (1.6%) | 6 (8.2%) |
| $25,000 to $29,999 | 60 (47.2%) | 6 (8.2%) |
| $30,000 to $34,999 | 25 (19.7%) | 0 (0.0%) |
| $35,000 to $39,999 | 0 (0.0%) | 11 (15.1%) |
| $40,000 to $44,999 | 8 (6.3%) | 0 (0.0%) |
| $45,000 to $49,999 | 0 (0.0%) | 0 (0.0%) |
| $50,000 to $54,999 | 2 (1.6%) | 1 (1.4%) |
| $55,000 to $64,999 | 0 (0.0%) | 19 (26.0%) |
| $65,000 to $74,999 | 0 (0.0%) | 0 (0.0%) |
| $75,000 to $99,999 | 4 (3.2%) | 0 (0.0%) |
| $100,000+ | 2 (1.6%) | 0 (0.0%) |
| Total | 127 (100.0%) | 73 (100.0%) |
Earnings by Sex by Educational Attainment in Wilcox
Average earnings in Wilcox are $26,563 for men and $24,792 for women, a difference of 6.7%. Men with an educational attainment of high school diploma enjoy the highest average annual earnings of $26,154, while those with high school diploma education earn the least with $26,154. Women with an educational attainment of graduate degree earn the most with the average annual earnings of $56,964, while those with graduate degree education have the smallest earnings of $56,964.
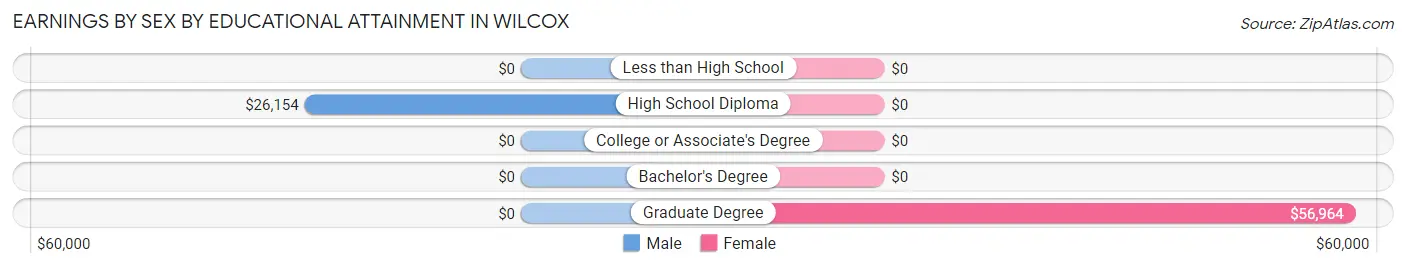
| Educational Attainment | Male Income | Female Income |
| Less than High School | - | - |
| High School Diploma | $26,154 | $0 |
| College or Associate's Degree | - | - |
| Bachelor's Degree | - | - |
| Graduate Degree | - | - |
| Total | $26,563 | $24,792 |
Family Income in Wilcox
Family Income Brackets in Wilcox
According to the Wilcox family income data, there are 40 families falling into the $50,000 to $74,999 income range, which is the most common income bracket and makes up 53.3% of all families.
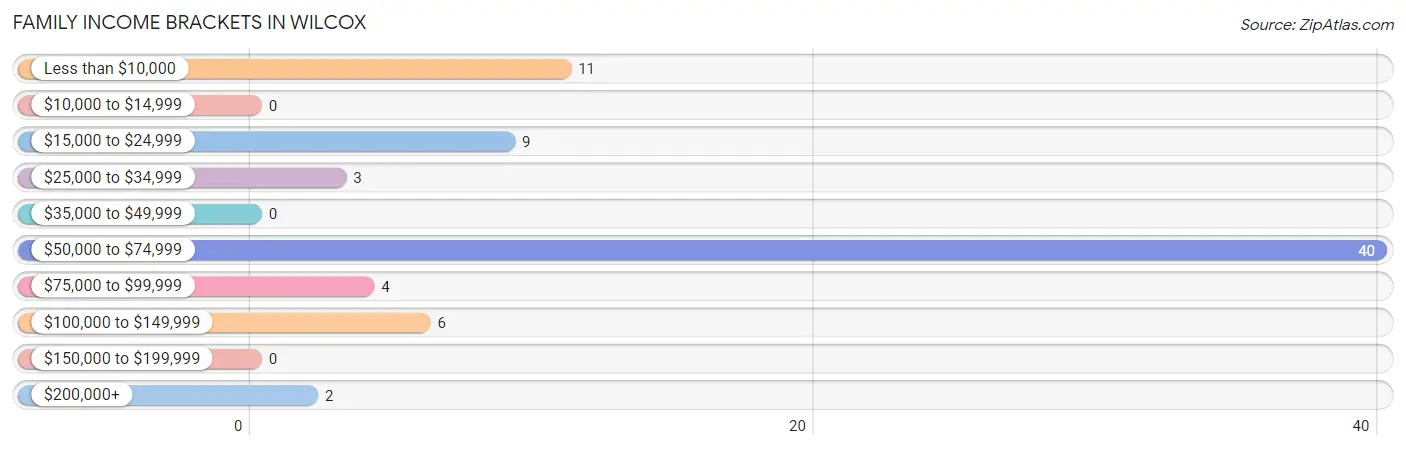
| Income Bracket | # Families | % Families |
| Less than $10,000 | 11 | 14.7% |
| $10,000 to $14,999 | 0 | 0.0% |
| $15,000 to $24,999 | 9 | 12.0% |
| $25,000 to $34,999 | 3 | 4.0% |
| $35,000 to $49,999 | 0 | 0.0% |
| $50,000 to $74,999 | 40 | 53.3% |
| $75,000 to $99,999 | 4 | 5.3% |
| $100,000 to $149,999 | 6 | 8.0% |
| $150,000 to $199,999 | 0 | 0.0% |
| $200,000+ | 2 | 2.7% |
Family Income by Famaliy Size in Wilcox
4-person families (13 | 17.3%) account for the highest median family income in Wilcox with $73,393 per family, while 2-person families (23 | 30.7%) have the highest median income of $26,938 per family member.
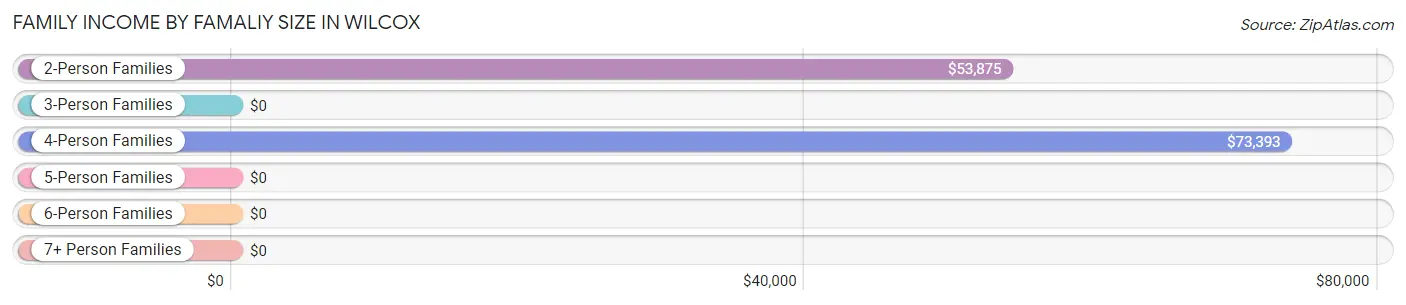
| Income Bracket | # Families | Median Income |
| 2-Person Families | 23 (30.7%) | $53,875 |
| 3-Person Families | 29 (38.7%) | $0 |
| 4-Person Families | 13 (17.3%) | $73,393 |
| 5-Person Families | 8 (10.7%) | $0 |
| 6-Person Families | 0 (0.0%) | $0 |
| 7+ Person Families | 2 (2.7%) | $0 |
| Total | 75 (100.0%) | $54,236 |
Family Income by Number of Earners in Wilcox
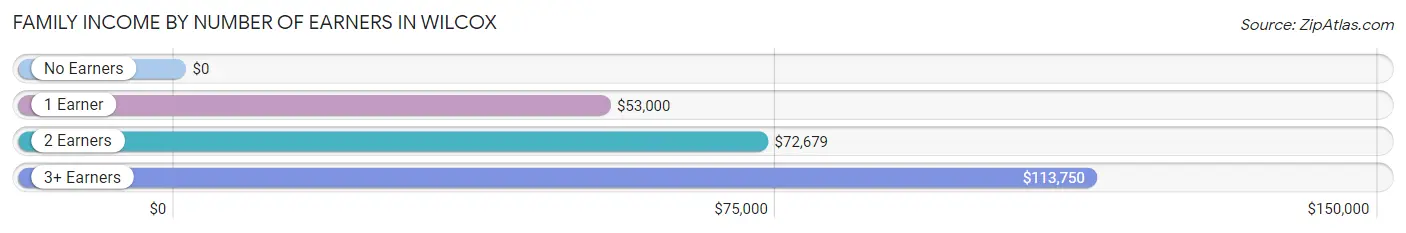
| Number of Earners | # Families | Median Income |
| No Earners | 11 (14.7%) | $0 |
| 1 Earner | 38 (50.7%) | $53,000 |
| 2 Earners | 17 (22.7%) | $72,679 |
| 3+ Earners | 9 (12.0%) | $113,750 |
| Total | 75 (100.0%) | $54,236 |
Household Income in Wilcox
Household Income Brackets in Wilcox
With 50 households falling in the category, the $50,000 to $74,999 income range is the most frequent in Wilcox, accounting for 34.5% of all households.
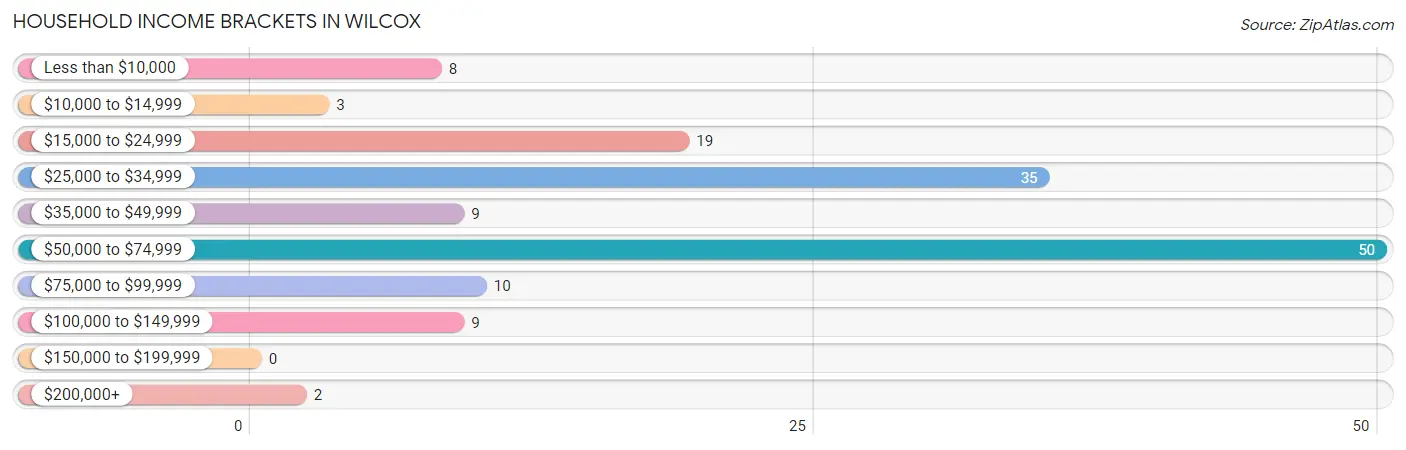
| Income Bracket | # Households | % Households |
| Less than $10,000 | 8 | 5.5% |
| $10,000 to $14,999 | 3 | 2.1% |
| $15,000 to $24,999 | 19 | 13.1% |
| $25,000 to $34,999 | 35 | 24.1% |
| $35,000 to $49,999 | 9 | 6.2% |
| $50,000 to $74,999 | 50 | 34.5% |
| $75,000 to $99,999 | 10 | 6.9% |
| $100,000 to $149,999 | 9 | 6.2% |
| $150,000 to $199,999 | 0 | 0.0% |
| $200,000+ | 2 | 1.4% |
Household Income by Householder Age in Wilcox
The median household income in Wilcox is $48,750, with the highest median household income of $72,833 found in the 25 to 44 years age bracket for the primary householder. A total of 34 households (23.4%) fall into this category. Meanwhile, the 15 to 24 years age bracket for the primary householder has the lowest median household income of $0, with 16 households (11.0%) in this group.
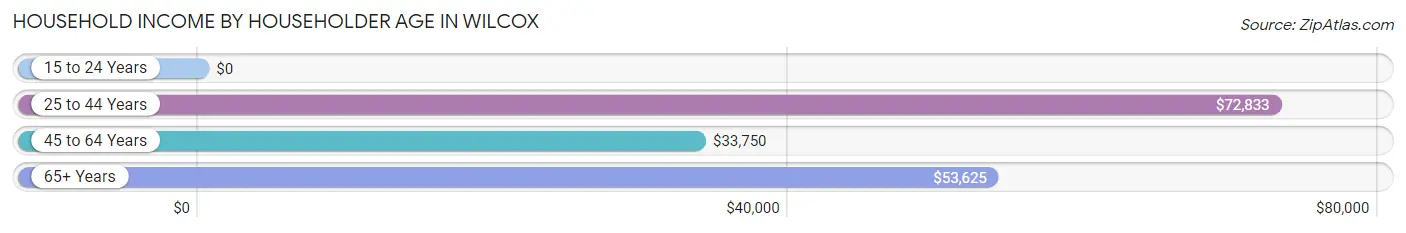
| Income Bracket | # Households | Median Income |
| 15 to 24 Years | 16 (11.0%) | $0 |
| 25 to 44 Years | 34 (23.4%) | $72,833 |
| 45 to 64 Years | 50 (34.5%) | $33,750 |
| 65+ Years | 45 (31.0%) | $53,625 |
| Total | 145 (100.0%) | $48,750 |
Poverty in Wilcox
Income Below Poverty by Sex and Age in Wilcox
With 9.8% poverty level for males and 44.1% for females among the residents of Wilcox, 12 to 14 year old males and under 5 year old females are the most vulnerable to poverty, with 6 males (100.0%) and 3 females (100.0%) in their respective age groups living below the poverty level.
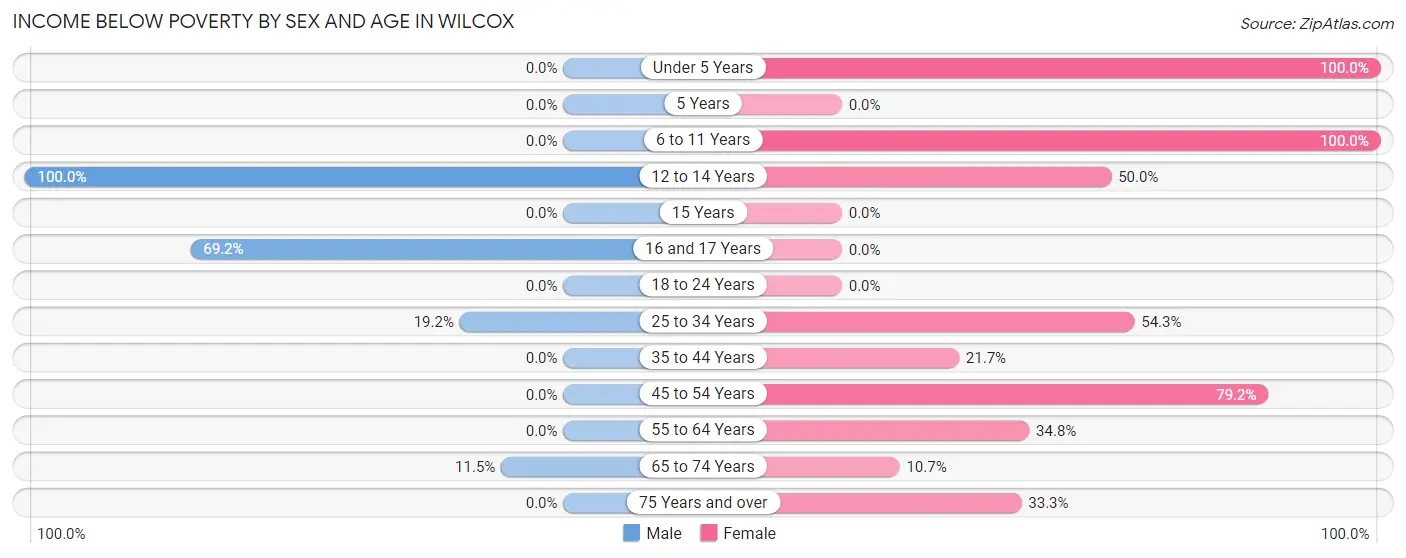
| Age Bracket | Male | Female |
| Under 5 Years | 0 (0.0%) | 3 (100.0%) |
| 5 Years | 0 (0.0%) | 0 (0.0%) |
| 6 to 11 Years | 0 (0.0%) | 11 (100.0%) |
| 12 to 14 Years | 6 (100.0%) | 4 (50.0%) |
| 15 Years | 0 (0.0%) | 0 (0.0%) |
| 16 and 17 Years | 9 (69.2%) | 0 (0.0%) |
| 18 to 24 Years | 0 (0.0%) | 0 (0.0%) |
| 25 to 34 Years | 5 (19.2%) | 19 (54.3%) |
| 35 to 44 Years | 0 (0.0%) | 5 (21.7%) |
| 45 to 54 Years | 0 (0.0%) | 19 (79.2%) |
| 55 to 64 Years | 0 (0.0%) | 8 (34.8%) |
| 65 to 74 Years | 3 (11.5%) | 3 (10.7%) |
| 75 Years and over | 0 (0.0%) | 3 (33.3%) |
| Total | 23 (9.8%) | 75 (44.1%) |
Income Above Poverty by Sex and Age in Wilcox
According to the poverty statistics in Wilcox, males aged under 5 years and females aged 18 to 24 years are the age groups that are most secure financially, with 100.0% of males and 100.0% of females in these age groups living above the poverty line.
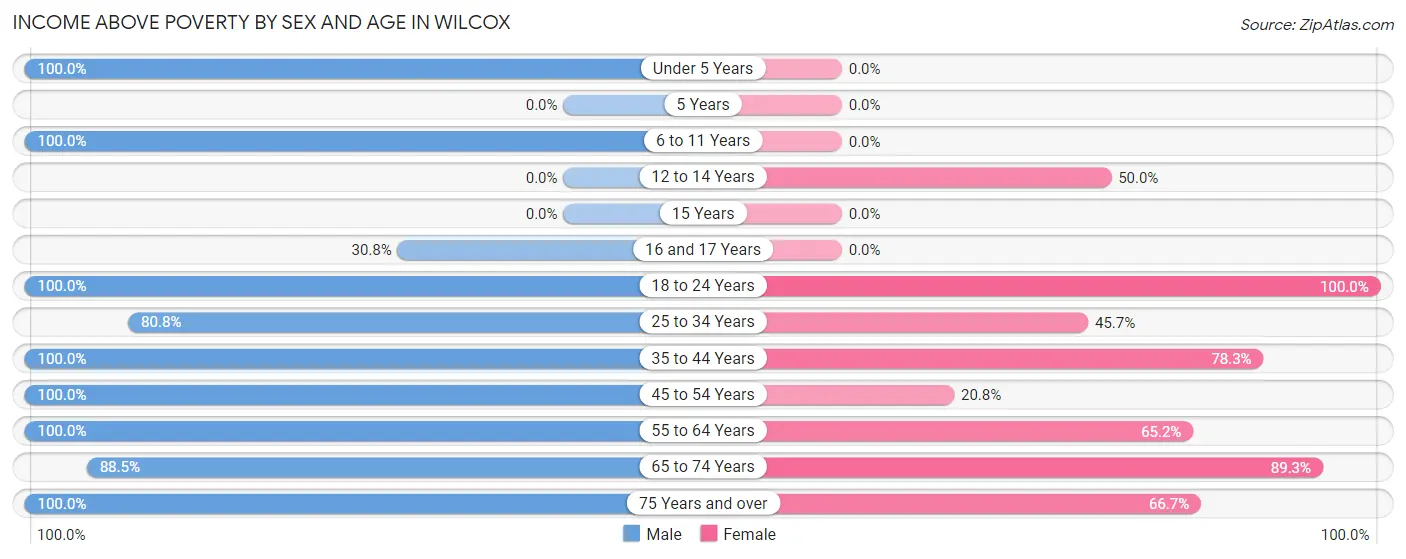
| Age Bracket | Male | Female |
| Under 5 Years | 37 (100.0%) | 0 (0.0%) |
| 5 Years | 0 (0.0%) | 0 (0.0%) |
| 6 to 11 Years | 8 (100.0%) | 0 (0.0%) |
| 12 to 14 Years | 0 (0.0%) | 4 (50.0%) |
| 15 Years | 0 (0.0%) | 0 (0.0%) |
| 16 and 17 Years | 4 (30.8%) | 0 (0.0%) |
| 18 to 24 Years | 12 (100.0%) | 6 (100.0%) |
| 25 to 34 Years | 21 (80.8%) | 16 (45.7%) |
| 35 to 44 Years | 66 (100.0%) | 18 (78.3%) |
| 45 to 54 Years | 2 (100.0%) | 5 (20.8%) |
| 55 to 64 Years | 36 (100.0%) | 15 (65.2%) |
| 65 to 74 Years | 23 (88.5%) | 25 (89.3%) |
| 75 Years and over | 2 (100.0%) | 6 (66.7%) |
| Total | 211 (90.2%) | 95 (55.9%) |
Income Below Poverty Among Married-Couple Families in Wilcox
The poverty statistics for married-couple families in Wilcox show that 7.9% or 3 of the total 38 families live below the poverty line. Families with no children have the highest poverty rate of 13.0%, comprising of 3 families. On the other hand, families with 1 or 2 children have the lowest poverty rate of 0.0%, which includes 0 families.
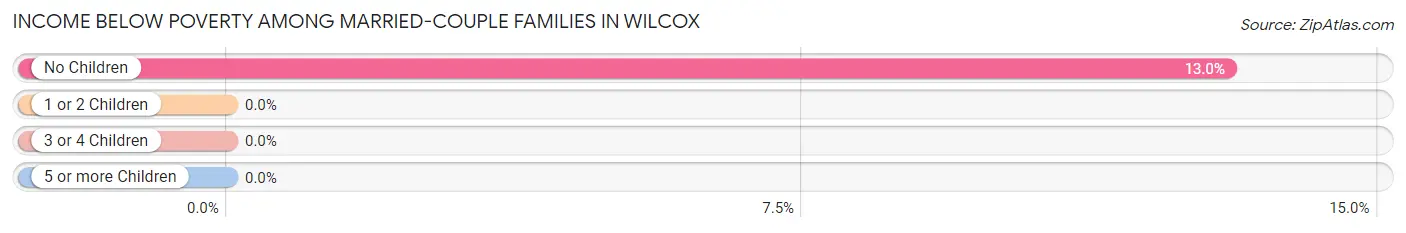
| Children | Above Poverty | Below Poverty |
| No Children | 20 (87.0%) | 3 (13.0%) |
| 1 or 2 Children | 15 (100.0%) | 0 (0.0%) |
| 3 or 4 Children | 0 (0.0%) | 0 (0.0%) |
| 5 or more Children | 0 (0.0%) | 0 (0.0%) |
| Total | 35 (92.1%) | 3 (7.9%) |
Income Below Poverty Among Single-Parent Households in Wilcox
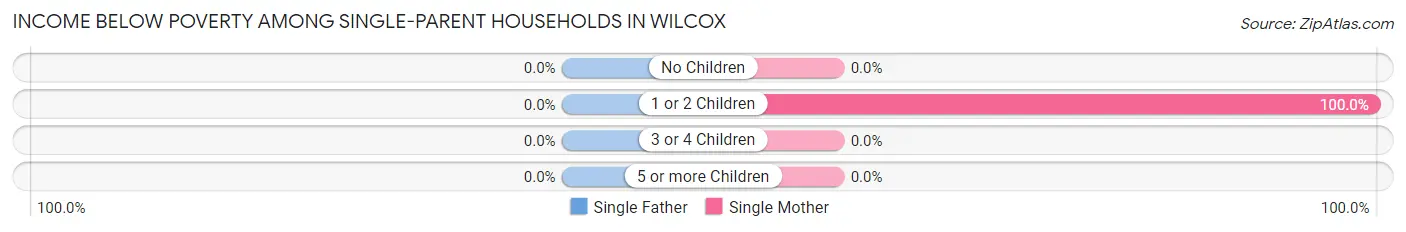
| Children | Single Father | Single Mother |
| No Children | 0 (0.0%) | 0 (0.0%) |
| 1 or 2 Children | 0 (0.0%) | 17 (100.0%) |
| 3 or 4 Children | 0 (0.0%) | 0 (0.0%) |
| 5 or more Children | 0 (0.0%) | 0 (0.0%) |
| Total | 0 (0.0%) | 17 (50.0%) |
Income Below Poverty Among Married-Couple vs Single-Parent Households in Wilcox
The poverty data for Wilcox shows that 3 of the married-couple family households (7.9%) and 17 of the single-parent households (46.0%) are living below the poverty level. Within the married-couple family households, those with no children have the highest poverty rate, with 3 households (13.0%) falling below the poverty line. Among the single-parent households, those with 1 or 2 children have the highest poverty rate, with 17 household (100.0%) living below poverty.
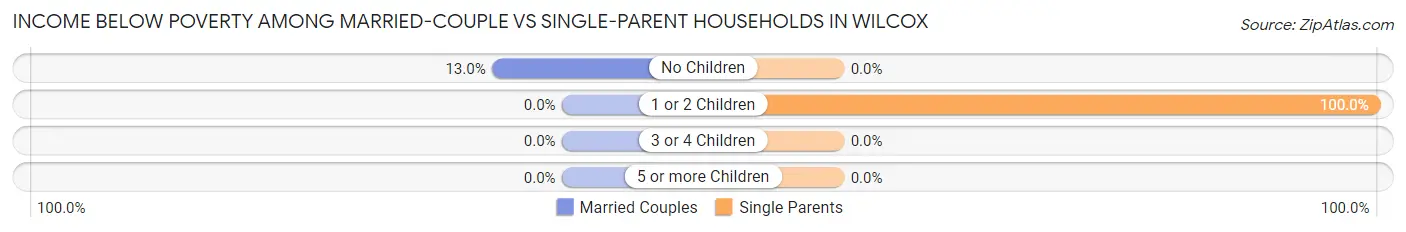
| Children | Married-Couple Families | Single-Parent Households |
| No Children | 3 (13.0%) | 0 (0.0%) |
| 1 or 2 Children | 0 (0.0%) | 17 (100.0%) |
| 3 or 4 Children | 0 (0.0%) | 0 (0.0%) |
| 5 or more Children | 0 (0.0%) | 0 (0.0%) |
| Total | 3 (7.9%) | 17 (46.0%) |
Race in Wilcox
The most populous races in Wilcox are , and White / Caucasian (404 | 100.0%).
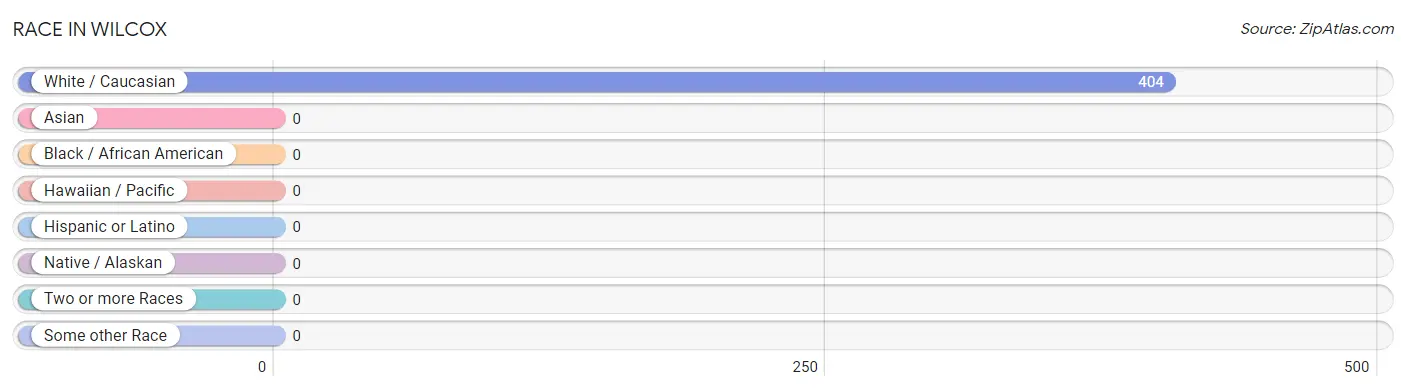
| Race | # Population | % Population |
| Asian | 0 | 0.0% |
| Black / African American | 0 | 0.0% |
| Hawaiian / Pacific | 0 | 0.0% |
| Hispanic or Latino | 0 | 0.0% |
| Native / Alaskan | 0 | 0.0% |
| White / Caucasian | 404 | 100.0% |
| Two or more Races | 0 | 0.0% |
| Some other Race | 0 | 0.0% |
| Total | 404 | 100.0% |
Ancestry in Wilcox
The most populous ancestries reported in Wilcox are German (183 | 45.3%), Irish (92 | 22.8%), Polish (55 | 13.6%), Italian (42 | 10.4%), and Yugoslavian (42 | 10.4%), together accounting for 102.5% of all Wilcox residents.
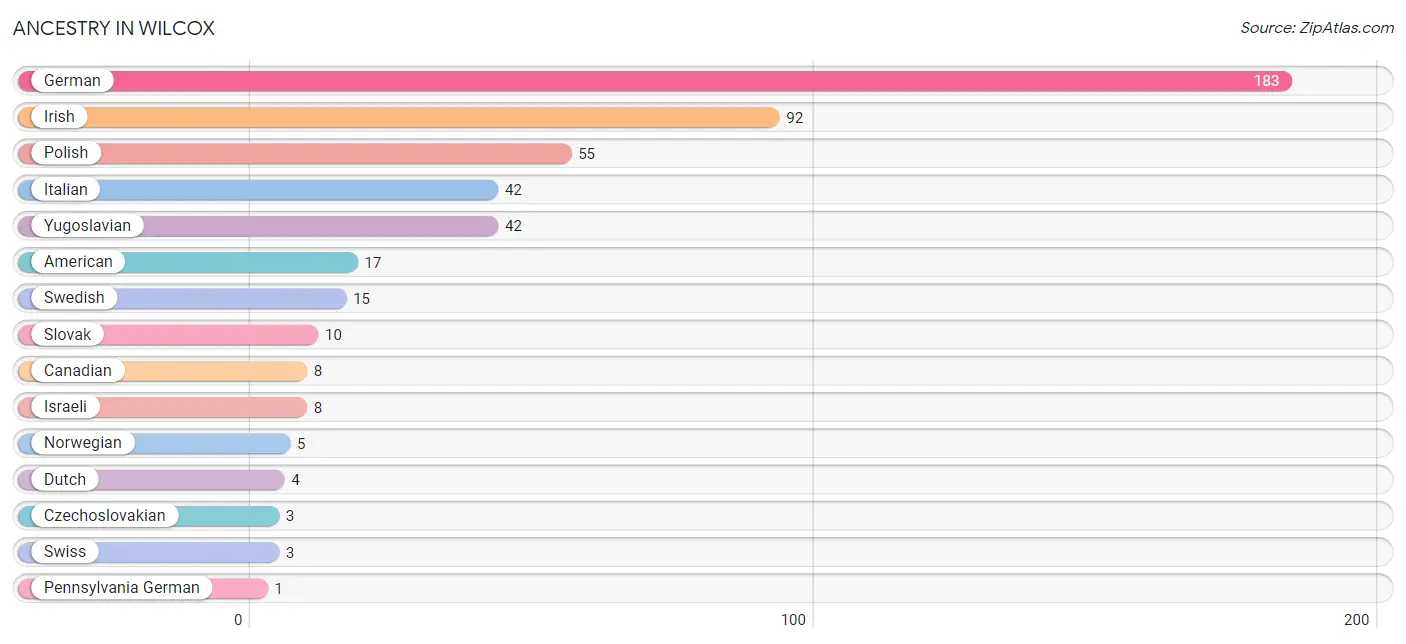
| Ancestry | # Population | % Population |
| American | 17 | 4.2% |
| Canadian | 8 | 2.0% |
| Czechoslovakian | 3 | 0.7% |
| Dutch | 4 | 1.0% |
| German | 183 | 45.3% |
| Irish | 92 | 22.8% |
| Israeli | 8 | 2.0% |
| Italian | 42 | 10.4% |
| Norwegian | 5 | 1.2% |
| Pennsylvania German | 1 | 0.3% |
| Polish | 55 | 13.6% |
| Slovak | 10 | 2.5% |
| Swedish | 15 | 3.7% |
| Swiss | 3 | 0.7% |
| Yugoslavian | 42 | 10.4% | View All 15 Rows |
Immigrants in Wilcox
The most numerous immigrant groups reported in Wilcox came from Asia (8 | 2.0%), Israel (8 | 2.0%), and Western Asia (8 | 2.0%), together accounting for 5.9% of all Wilcox residents.
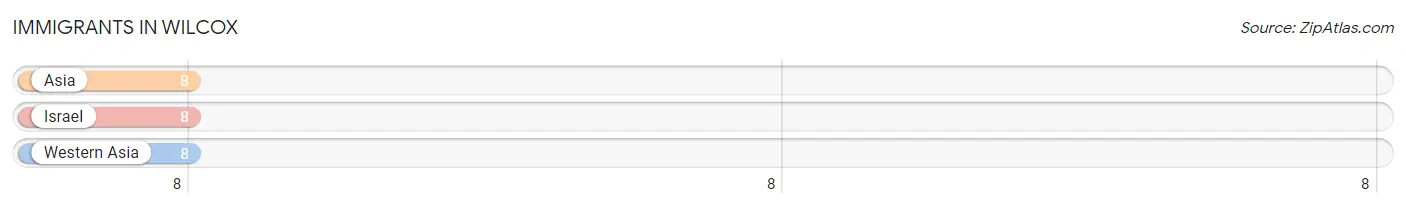
| Immigration Origin | # Population | % Population |
| Asia | 8 | 2.0% |
| Israel | 8 | 2.0% |
| Western Asia | 8 | 2.0% | View All 3 Rows |
Sex and Age in Wilcox
Sex and Age in Wilcox
The most populous age groups in Wilcox are 40 to 44 Years (48 | 20.5%) for men and 25 to 29 Years (24 | 14.1%) for women.
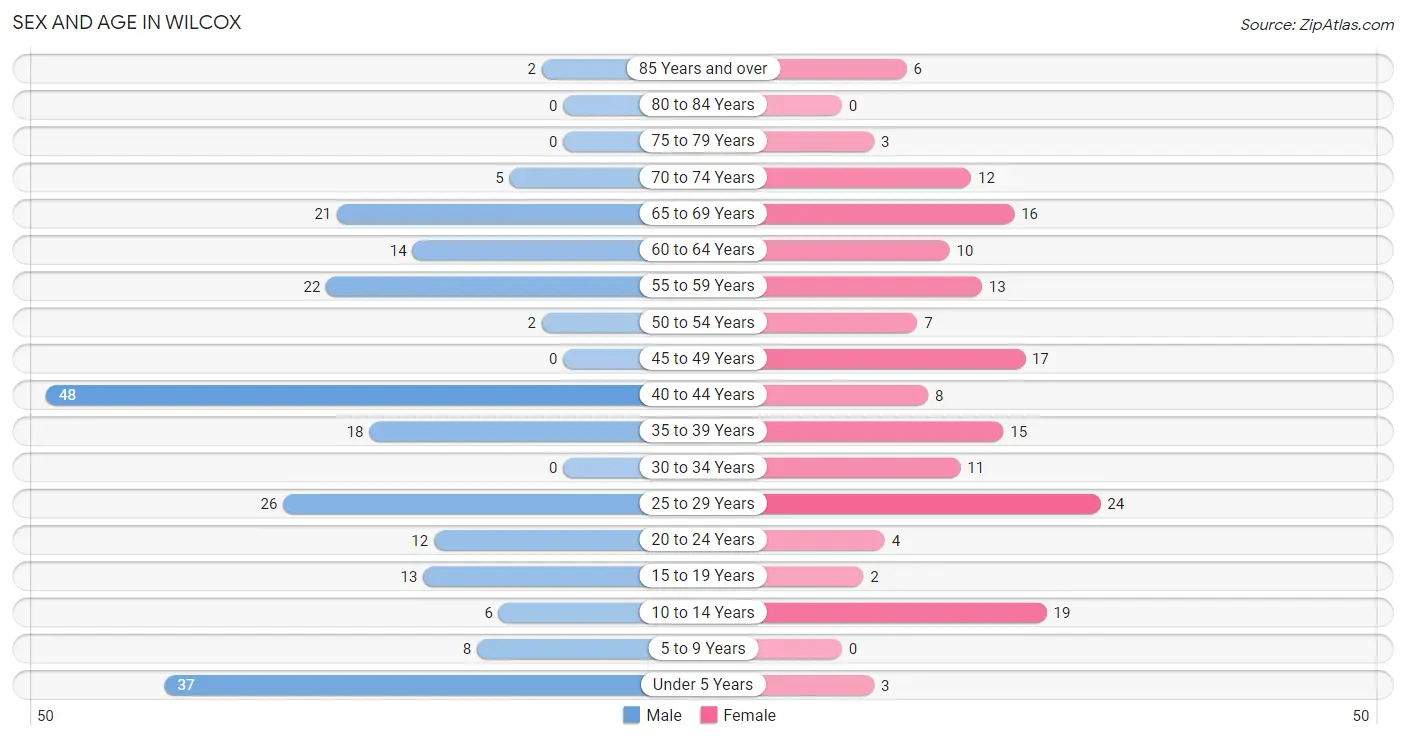
| Age Bracket | Male | Female |
| Under 5 Years | 37 (15.8%) | 3 (1.8%) |
| 5 to 9 Years | 8 (3.4%) | 0 (0.0%) |
| 10 to 14 Years | 6 (2.6%) | 19 (11.2%) |
| 15 to 19 Years | 13 (5.6%) | 2 (1.2%) |
| 20 to 24 Years | 12 (5.1%) | 4 (2.4%) |
| 25 to 29 Years | 26 (11.1%) | 24 (14.1%) |
| 30 to 34 Years | 0 (0.0%) | 11 (6.5%) |
| 35 to 39 Years | 18 (7.7%) | 15 (8.8%) |
| 40 to 44 Years | 48 (20.5%) | 8 (4.7%) |
| 45 to 49 Years | 0 (0.0%) | 17 (10.0%) |
| 50 to 54 Years | 2 (0.9%) | 7 (4.1%) |
| 55 to 59 Years | 22 (9.4%) | 13 (7.6%) |
| 60 to 64 Years | 14 (6.0%) | 10 (5.9%) |
| 65 to 69 Years | 21 (9.0%) | 16 (9.4%) |
| 70 to 74 Years | 5 (2.1%) | 12 (7.1%) |
| 75 to 79 Years | 0 (0.0%) | 3 (1.8%) |
| 80 to 84 Years | 0 (0.0%) | 0 (0.0%) |
| 85 Years and over | 2 (0.9%) | 6 (3.5%) |
| Total | 234 (100.0%) | 170 (100.0%) |
Families and Households in Wilcox
Median Family Size in Wilcox
The median family size in Wilcox is 4.07 persons per family, with single female/mother families (34 | 45.3%) accounting for the largest median family size of 4.35 persons per family. On the other hand, single male/father families (3 | 4.0%) represent the smallest median family size with 2.67 persons per family.
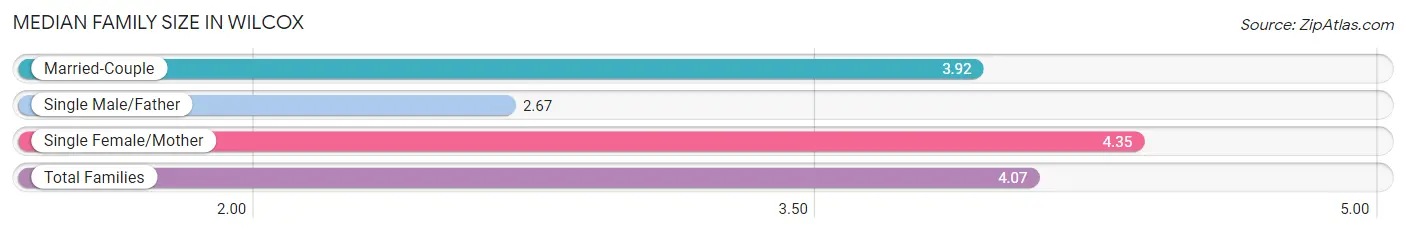
| Family Type | # Families | Family Size |
| Married-Couple | 38 (50.7%) | 3.92 |
| Single Male/Father | 3 (4.0%) | 2.67 |
| Single Female/Mother | 34 (45.3%) | 4.35 |
| Total Families | 75 (100.0%) | 4.07 |
Median Household Size in Wilcox
The median household size in Wilcox is 2.79 persons per household, with single female/mother households (34 | 23.4%) accounting for the largest median household size of 4.53 persons per household. non-family households (70 | 48.3%) represent the smallest median household size with 1.27 persons per household.
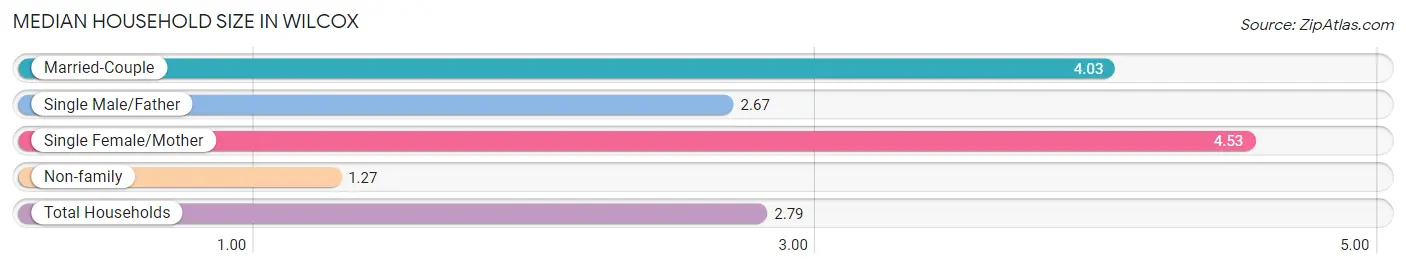
| Household Type | # Households | Household Size |
| Married-Couple | 38 (26.2%) | 4.03 |
| Single Male/Father | 3 (2.1%) | 2.67 |
| Single Female/Mother | 34 (23.4%) | 4.53 |
| Non-family | 70 (48.3%) | 1.27 |
| Total Households | 145 (100.0%) | 2.79 |
Household Size by Marriage Status in Wilcox
Out of a total of 145 households in Wilcox, 75 (51.7%) are family households, while 70 (48.3%) are nonfamily households. The most numerous type of family households are 3-person households, comprising 29, and the most common type of nonfamily households are 1-person households, comprising 59.
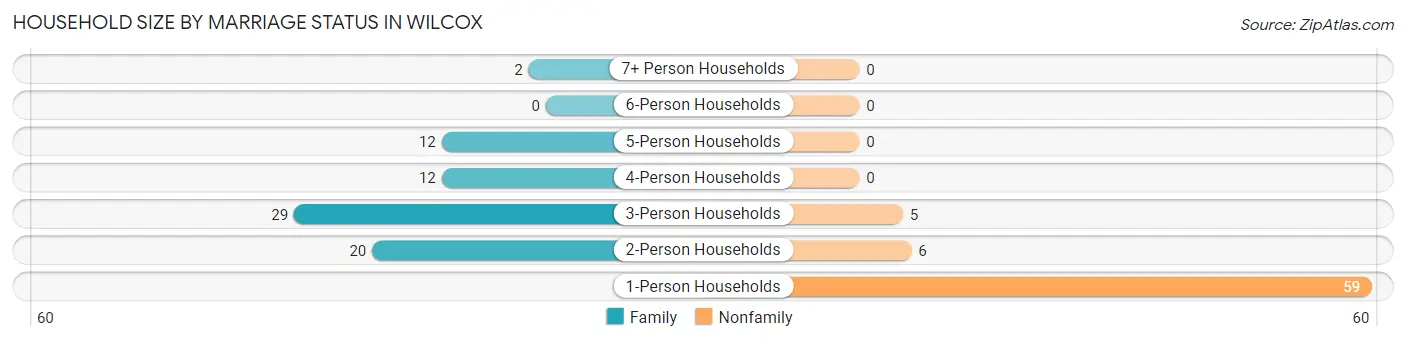
| Household Size | Family Households | Nonfamily Households |
| 1-Person Households | - | 59 (40.7%) |
| 2-Person Households | 20 (13.8%) | 6 (4.1%) |
| 3-Person Households | 29 (20.0%) | 5 (3.5%) |
| 4-Person Households | 12 (8.3%) | 0 (0.0%) |
| 5-Person Households | 12 (8.3%) | 0 (0.0%) |
| 6-Person Households | 0 (0.0%) | 0 (0.0%) |
| 7+ Person Households | 2 (1.4%) | 0 (0.0%) |
| Total | 75 (51.7%) | 70 (48.3%) |
Female Fertility in Wilcox
Fertility by Age in Wilcox
Average fertility rate in Wilcox is 272.0 births per 1,000 women. Women in the age bracket of 35 to 50 years have the highest fertility rate with 375.0 births per 1,000 women. Women in the age bracket of 35 to 50 years acount for 68.2% of all women with births.
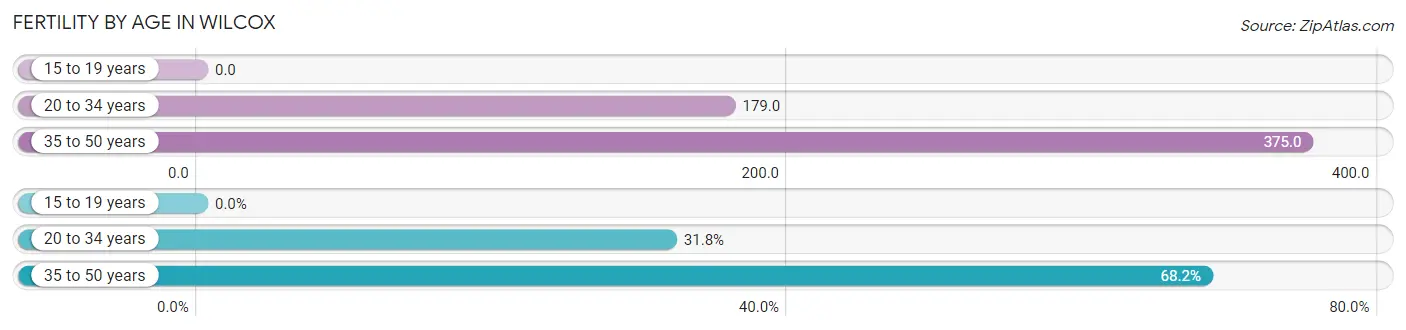
| Age Bracket | Women with Births | Births / 1,000 Women |
| 15 to 19 years | 0 (0.0%) | 0.0 |
| 20 to 34 years | 7 (31.8%) | 179.0 |
| 35 to 50 years | 15 (68.2%) | 375.0 |
| Total | 22 (100.0%) | 272.0 |
Fertility by Age by Marriage Status in Wilcox
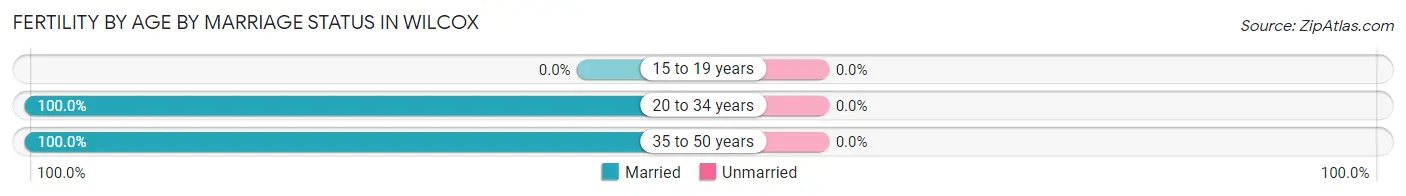
| Age Bracket | Married | Unmarried |
| 15 to 19 years | 0 (0.0%) | 0 (0.0%) |
| 20 to 34 years | 7 (100.0%) | 0 (0.0%) |
| 35 to 50 years | 15 (100.0%) | 0 (0.0%) |
| Total | 22 (100.0%) | 0 (0.0%) |
Fertility by Education in Wilcox
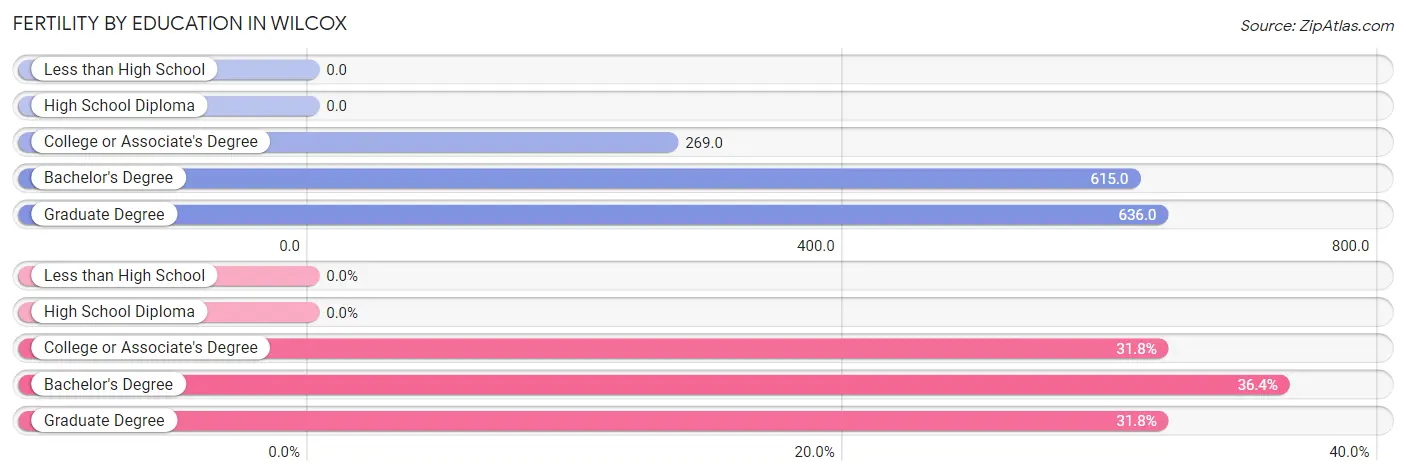
| Educational Attainment | Women with Births | Births / 1,000 Women |
| Less than High School | 0 (0.0%) | 0.0 |
| High School Diploma | 0 (0.0%) | 0.0 |
| College or Associate's Degree | 7 (31.8%) | 269.0 |
| Bachelor's Degree | 8 (36.4%) | 615.0 |
| Graduate Degree | 7 (31.8%) | 636.0 |
| Total | 22 (100.0%) | 272.0 |
Fertility by Education by Marriage Status in Wilcox
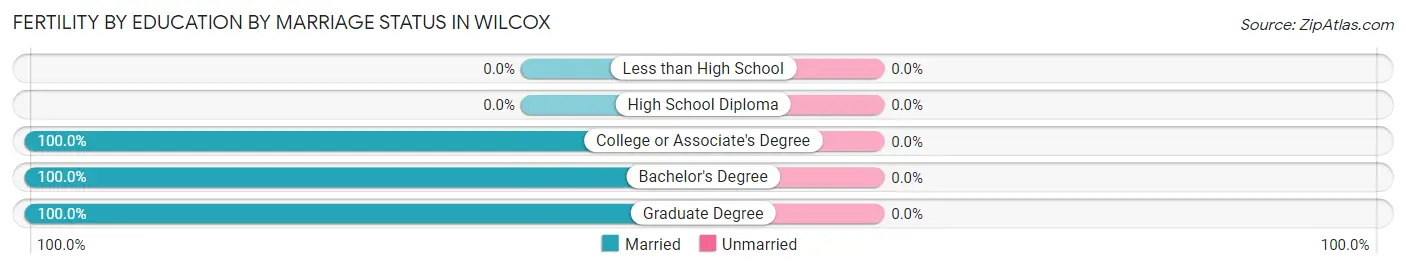
| Educational Attainment | Married | Unmarried |
| Less than High School | 0 (0.0%) | 0 (0.0%) |
| High School Diploma | 0 (0.0%) | 0 (0.0%) |
| College or Associate's Degree | 7 (100.0%) | 0 (0.0%) |
| Bachelor's Degree | 8 (100.0%) | 0 (0.0%) |
| Graduate Degree | 7 (100.0%) | 0 (0.0%) |
| Total | 22 (100.0%) | 0 (0.0%) |
Employment Characteristics in Wilcox
Employment by Class of Employer in Wilcox
Among the 183 employed individuals in Wilcox, private company employees (137 | 74.9%), not-for-profit organizations (12 | 6.6%), and local government employees (9 | 4.9%) make up the most common classes of employment.
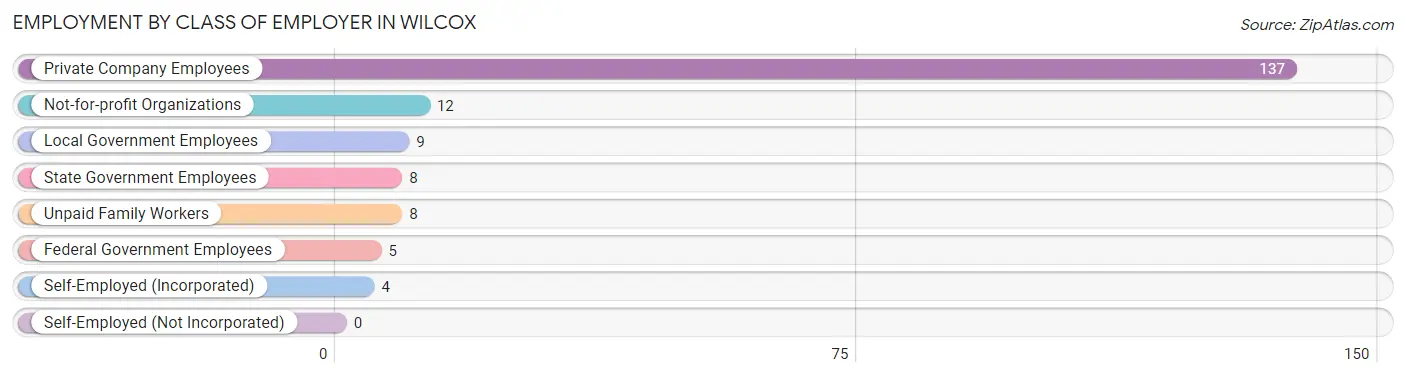
| Employer Class | # Employees | % Employees |
| Private Company Employees | 137 | 74.9% |
| Self-Employed (Incorporated) | 4 | 2.2% |
| Self-Employed (Not Incorporated) | 0 | 0.0% |
| Not-for-profit Organizations | 12 | 6.6% |
| Local Government Employees | 9 | 4.9% |
| State Government Employees | 8 | 4.4% |
| Federal Government Employees | 5 | 2.7% |
| Unpaid Family Workers | 8 | 4.4% |
| Total | 183 | 100.0% |
Employment Status by Age in Wilcox
According to the labor force statistics for Wilcox, out of the total population over 16 years of age (331), 59.5% or 197 individuals are in the labor force, with 7.1% or 14 of them unemployed. The age group with the highest labor force participation rate is 20 to 24 years, with 100.0% or 16 individuals in the labor force. Within the labor force, the 35 to 44 years age range has the highest percentage of unemployed individuals, with 16.3% or 14 of them being unemployed.
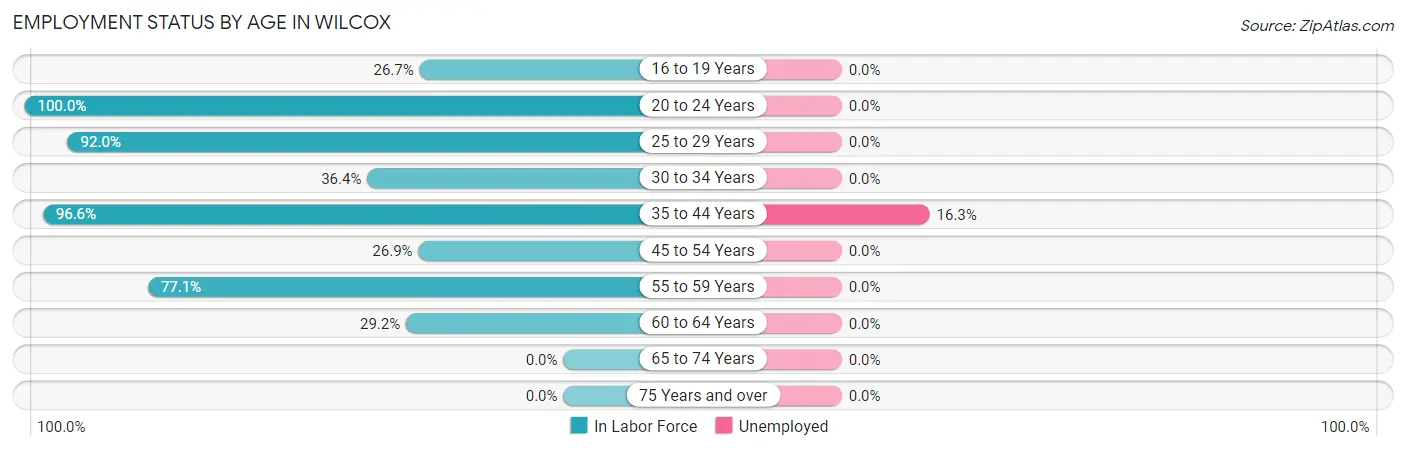
| Age Bracket | In Labor Force | Unemployed |
| 16 to 19 Years | 4 (26.7%) | 0 (0.0%) |
| 20 to 24 Years | 16 (100.0%) | 0 (0.0%) |
| 25 to 29 Years | 46 (92.0%) | 0 (0.0%) |
| 30 to 34 Years | 4 (36.4%) | 0 (0.0%) |
| 35 to 44 Years | 86 (96.6%) | 14 (16.3%) |
| 45 to 54 Years | 7 (26.9%) | 0 (0.0%) |
| 55 to 59 Years | 27 (77.1%) | 0 (0.0%) |
| 60 to 64 Years | 7 (29.2%) | 0 (0.0%) |
| 65 to 74 Years | 0 (0.0%) | 0 (0.0%) |
| 75 Years and over | 0 (0.0%) | 0 (0.0%) |
| Total | 197 (59.5%) | 14 (7.1%) |
Employment Status by Educational Attainment in Wilcox
According to labor force statistics for Wilcox, 75.3% of individuals (177) out of the total population between 25 and 64 years of age (235) are in the labor force, with 7.9% or 14 of them being unemployed. The group with the highest labor force participation rate are those with the educational attainment of high school diploma, with 83.0% or 117 individuals in the labor force. Within the labor force, individuals with high school diploma education have the highest percentage of unemployment, with 12.0% or 14 of them being unemployed.
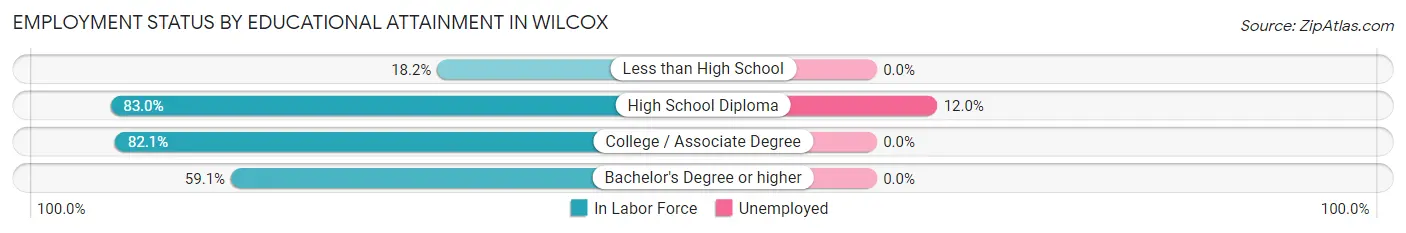
| Educational Attainment | In Labor Force | Unemployed |
| Less than High School | 2 (18.2%) | 0 (0.0%) |
| High School Diploma | 117 (83.0%) | 17 (12.0%) |
| College / Associate Degree | 32 (82.1%) | 0 (0.0%) |
| Bachelor's Degree or higher | 26 (59.1%) | 0 (0.0%) |
| Total | 177 (75.3%) | 19 (7.9%) |
Employment Occupations by Sex in Wilcox
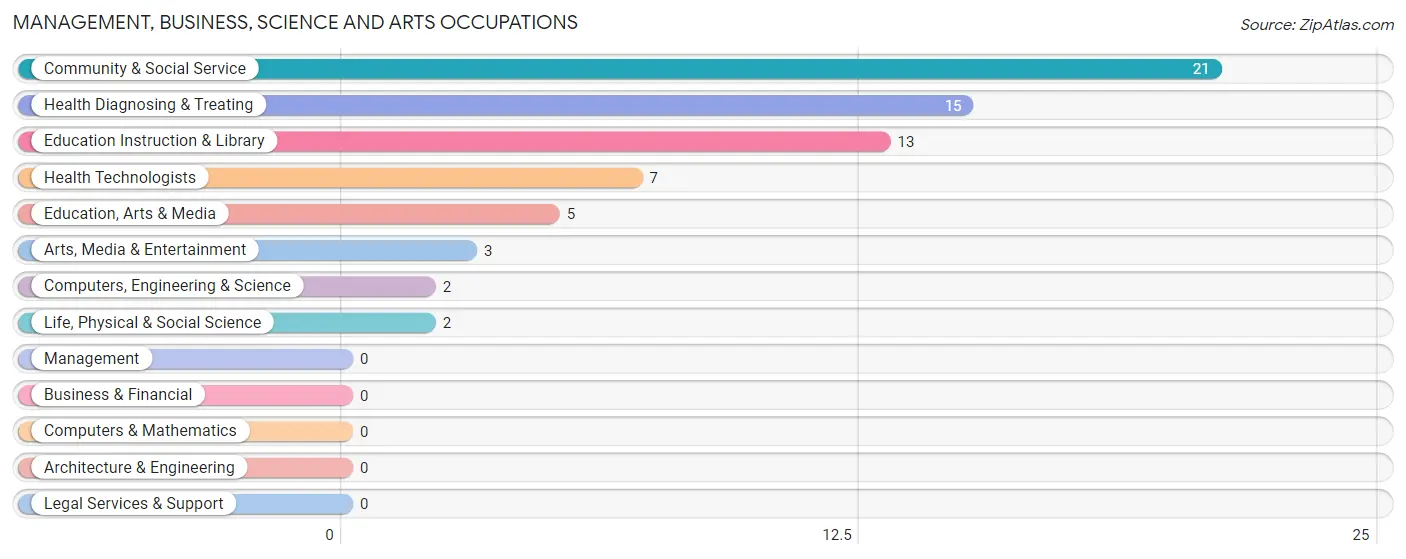
Management, Business, Science and Arts Occupations
The most common Management, Business, Science and Arts occupations in Wilcox are Community & Social Service (21 | 11.5%), Health Diagnosing & Treating (15 | 8.2%), Education Instruction & Library (13 | 7.1%), Health Technologists (7 | 3.8%), and Education, Arts & Media (5 | 2.7%).
Management, Business, Science and Arts Occupations by Sex
Within the Management, Business, Science and Arts occupations in Wilcox, the most male-oriented occupations are Arts, Media & Entertainment (100.0%), and Community & Social Service (14.3%), while the most female-oriented occupations are Computers, Engineering & Science (100.0%), Life, Physical & Social Science (100.0%), and Education, Arts & Media (100.0%).
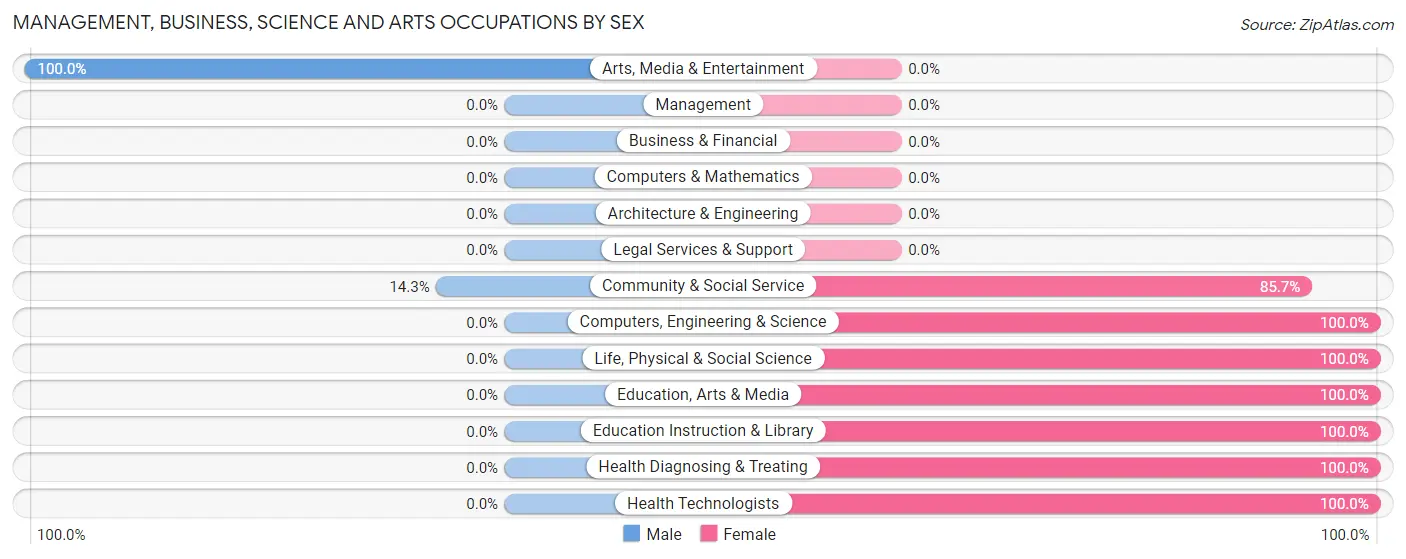
| Occupation | Male | Female |
| Management | 0 (0.0%) | 0 (0.0%) |
| Business & Financial | 0 (0.0%) | 0 (0.0%) |
| Computers, Engineering & Science | 0 (0.0%) | 2 (100.0%) |
| Computers & Mathematics | 0 (0.0%) | 0 (0.0%) |
| Architecture & Engineering | 0 (0.0%) | 0 (0.0%) |
| Life, Physical & Social Science | 0 (0.0%) | 2 (100.0%) |
| Community & Social Service | 3 (14.3%) | 18 (85.7%) |
| Education, Arts & Media | 0 (0.0%) | 5 (100.0%) |
| Legal Services & Support | 0 (0.0%) | 0 (0.0%) |
| Education Instruction & Library | 0 (0.0%) | 13 (100.0%) |
| Arts, Media & Entertainment | 3 (100.0%) | 0 (0.0%) |
| Health Diagnosing & Treating | 0 (0.0%) | 15 (100.0%) |
| Health Technologists | 0 (0.0%) | 7 (100.0%) |
| Total (Category) | 3 (7.9%) | 35 (92.1%) |
| Total (Overall) | 113 (61.8%) | 70 (38.3%) |
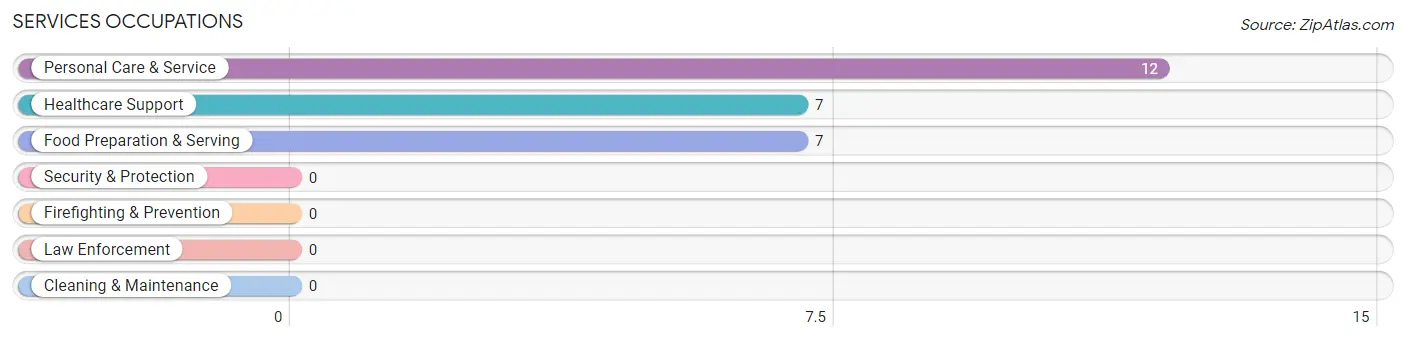
Services Occupations
The most common Services occupations in Wilcox are Personal Care & Service (12 | 6.6%), Healthcare Support (7 | 3.8%), and Food Preparation & Serving (7 | 3.8%).
Services Occupations by Sex
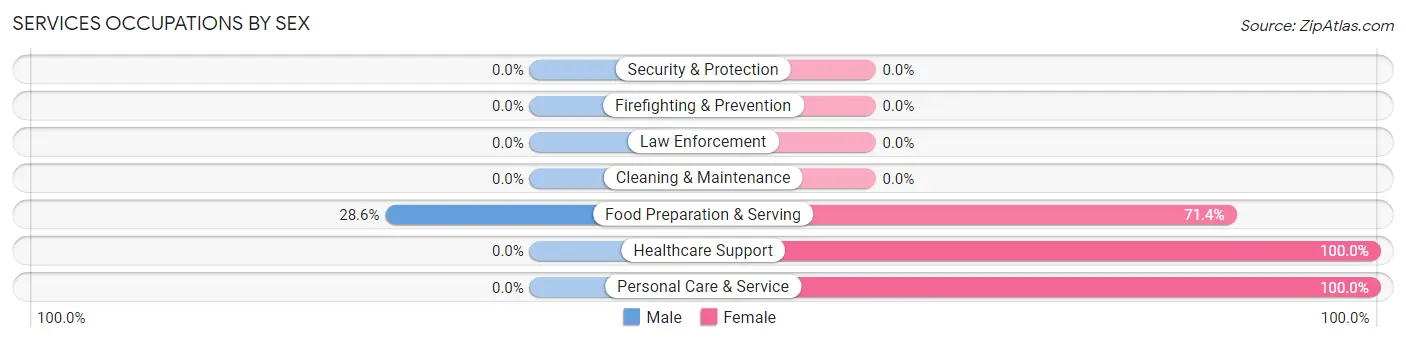
| Occupation | Male | Female |
| Healthcare Support | 0 (0.0%) | 7 (100.0%) |
| Security & Protection | 0 (0.0%) | 0 (0.0%) |
| Firefighting & Prevention | 0 (0.0%) | 0 (0.0%) |
| Law Enforcement | 0 (0.0%) | 0 (0.0%) |
| Food Preparation & Serving | 2 (28.6%) | 5 (71.4%) |
| Cleaning & Maintenance | 0 (0.0%) | 0 (0.0%) |
| Personal Care & Service | 0 (0.0%) | 12 (100.0%) |
| Total (Category) | 2 (7.7%) | 24 (92.3%) |
| Total (Overall) | 113 (61.8%) | 70 (38.3%) |
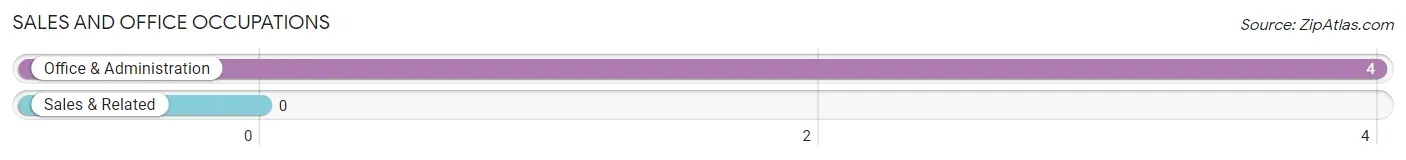
Sales and Office Occupations
The most common Sales and Office occupations in Wilcox are , and Office & Administration (4 | 2.2%).
Sales and Office Occupations by Sex
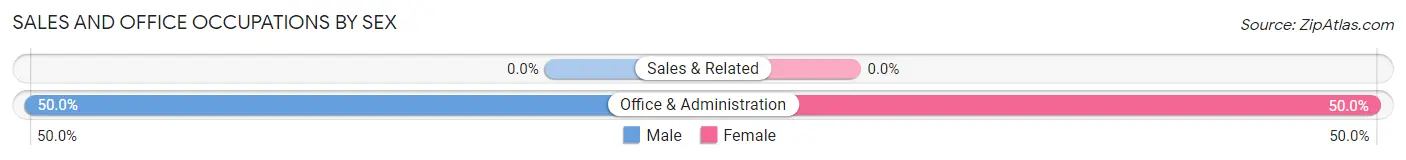
| Occupation | Male | Female |
| Sales & Related | 0 (0.0%) | 0 (0.0%) |
| Office & Administration | 2 (50.0%) | 2 (50.0%) |
| Total (Category) | 2 (50.0%) | 2 (50.0%) |
| Total (Overall) | 113 (61.8%) | 70 (38.3%) |
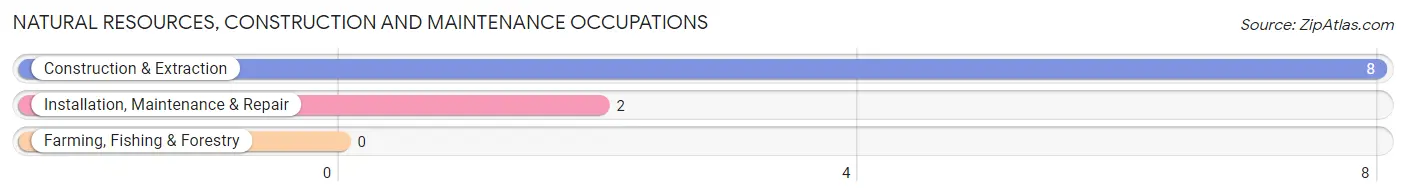
Natural Resources, Construction and Maintenance Occupations
The most common Natural Resources, Construction and Maintenance occupations in Wilcox are Construction & Extraction (8 | 4.4%), and Installation, Maintenance & Repair (2 | 1.1%).
Natural Resources, Construction and Maintenance Occupations by Sex
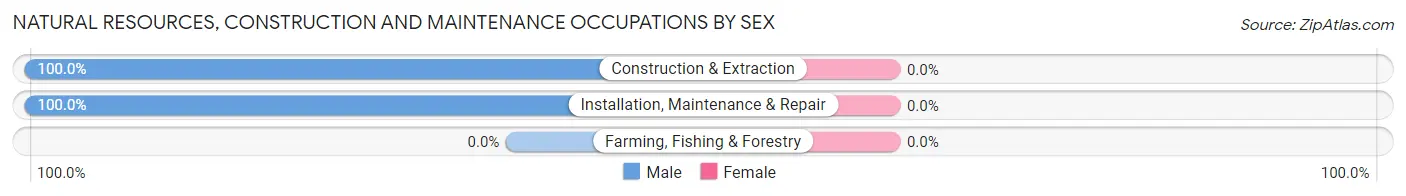
| Occupation | Male | Female |
| Farming, Fishing & Forestry | 0 (0.0%) | 0 (0.0%) |
| Construction & Extraction | 8 (100.0%) | 0 (0.0%) |
| Installation, Maintenance & Repair | 2 (100.0%) | 0 (0.0%) |
| Total (Category) | 10 (100.0%) | 0 (0.0%) |
| Total (Overall) | 113 (61.8%) | 70 (38.3%) |
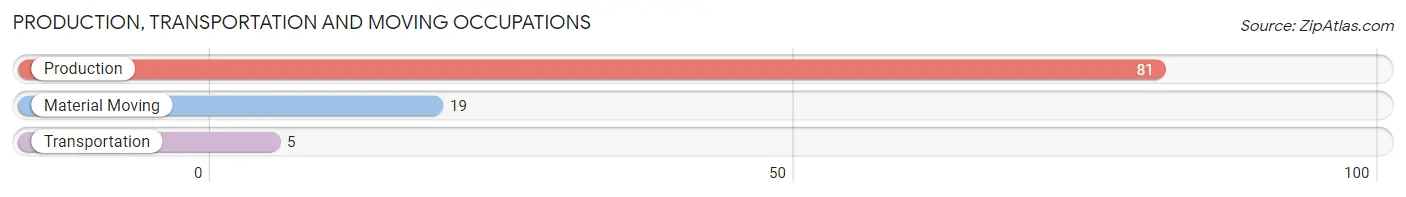
Production, Transportation and Moving Occupations
The most common Production, Transportation and Moving occupations in Wilcox are Production (81 | 44.3%), Material Moving (19 | 10.4%), and Transportation (5 | 2.7%).
Production, Transportation and Moving Occupations by Sex
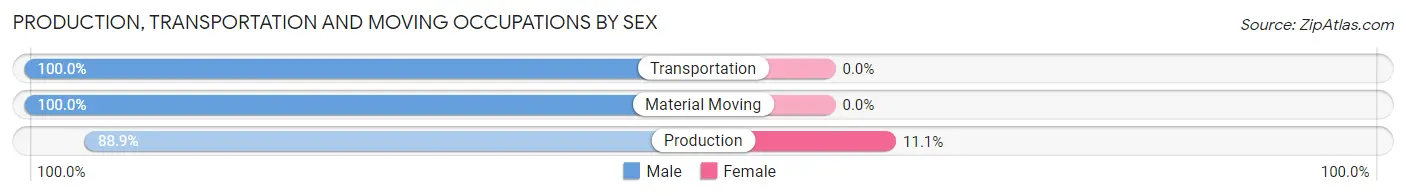
| Occupation | Male | Female |
| Production | 72 (88.9%) | 9 (11.1%) |
| Transportation | 5 (100.0%) | 0 (0.0%) |
| Material Moving | 19 (100.0%) | 0 (0.0%) |
| Total (Category) | 96 (91.4%) | 9 (8.6%) |
| Total (Overall) | 113 (61.8%) | 70 (38.3%) |
Employment Industries by Sex in Wilcox
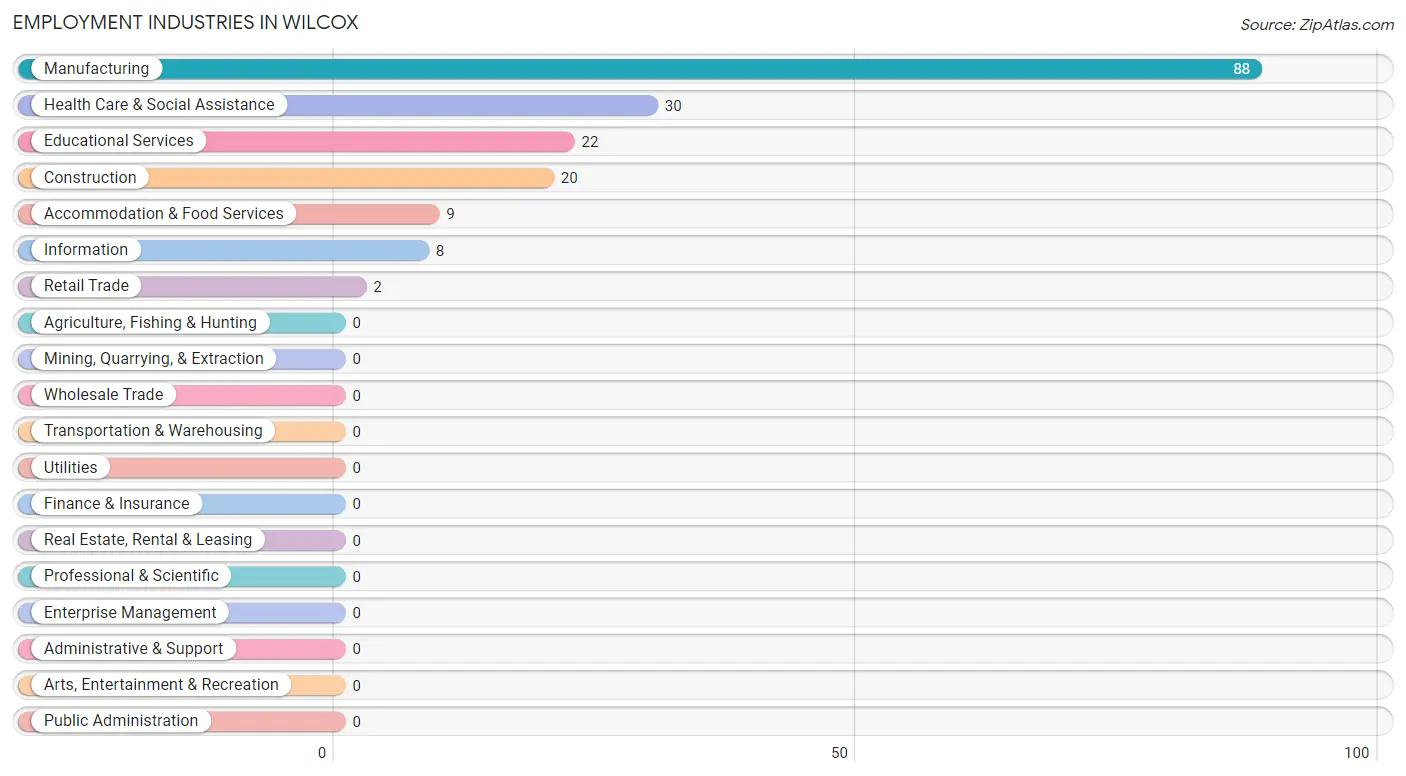
Employment Industries in Wilcox
The major employment industries in Wilcox include Manufacturing (88 | 48.1%), Health Care & Social Assistance (30 | 16.4%), Educational Services (22 | 12.0%), Construction (20 | 10.9%), and Accommodation & Food Services (9 | 4.9%).
Employment Industries by Sex in Wilcox
The Wilcox industries that see more men than women are Construction (100.0%), Retail Trade (100.0%), and Information (100.0%), whereas the industries that tend to have a higher number of women are Educational Services (100.0%), Health Care & Social Assistance (93.3%), and Accommodation & Food Services (77.8%).
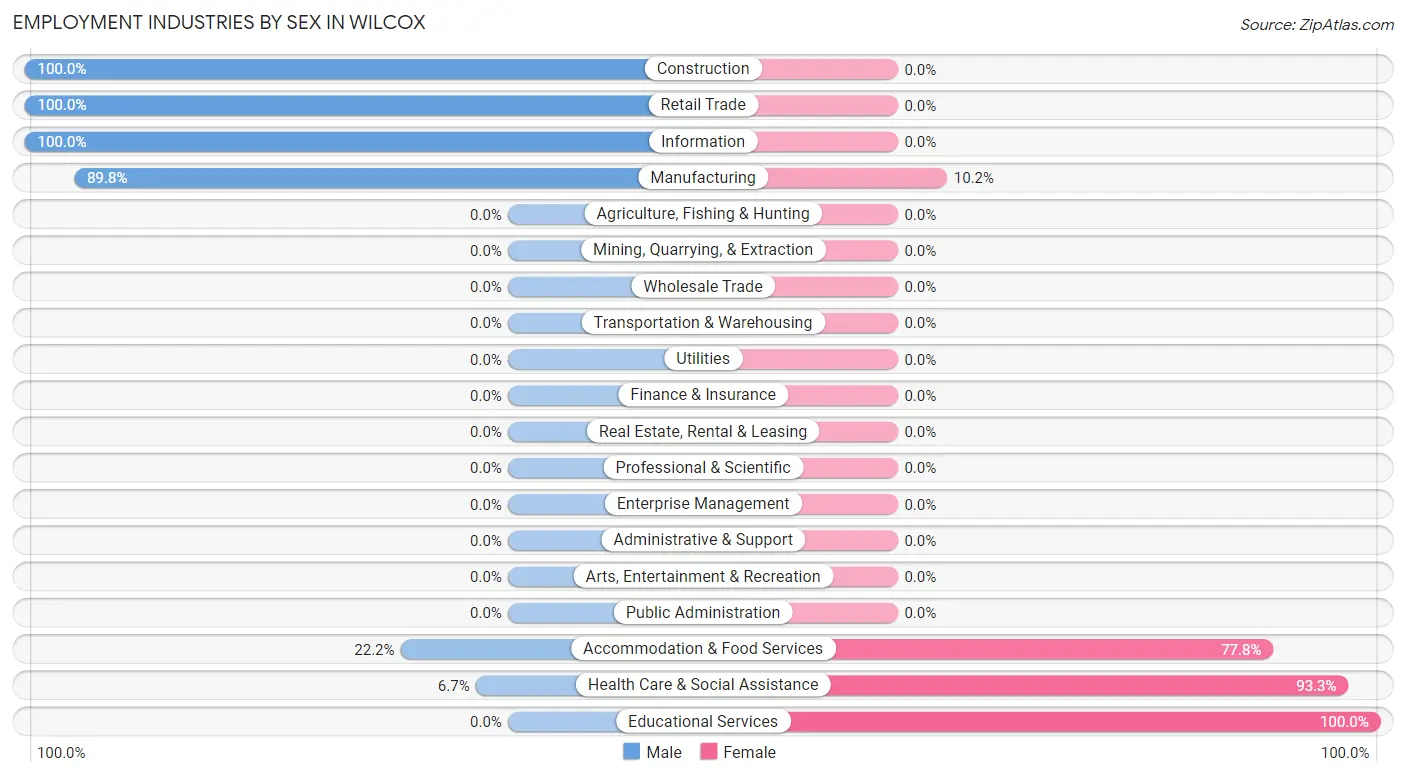
| Industry | Male | Female |
| Agriculture, Fishing & Hunting | 0 (0.0%) | 0 (0.0%) |
| Mining, Quarrying, & Extraction | 0 (0.0%) | 0 (0.0%) |
| Construction | 20 (100.0%) | 0 (0.0%) |
| Manufacturing | 79 (89.8%) | 9 (10.2%) |
| Wholesale Trade | 0 (0.0%) | 0 (0.0%) |
| Retail Trade | 2 (100.0%) | 0 (0.0%) |
| Transportation & Warehousing | 0 (0.0%) | 0 (0.0%) |
| Utilities | 0 (0.0%) | 0 (0.0%) |
| Information | 8 (100.0%) | 0 (0.0%) |
| Finance & Insurance | 0 (0.0%) | 0 (0.0%) |
| Real Estate, Rental & Leasing | 0 (0.0%) | 0 (0.0%) |
| Professional & Scientific | 0 (0.0%) | 0 (0.0%) |
| Enterprise Management | 0 (0.0%) | 0 (0.0%) |
| Administrative & Support | 0 (0.0%) | 0 (0.0%) |
| Educational Services | 0 (0.0%) | 22 (100.0%) |
| Health Care & Social Assistance | 2 (6.7%) | 28 (93.3%) |
| Arts, Entertainment & Recreation | 0 (0.0%) | 0 (0.0%) |
| Accommodation & Food Services | 2 (22.2%) | 7 (77.8%) |
| Public Administration | 0 (0.0%) | 0 (0.0%) |
| Total | 113 (61.8%) | 70 (38.3%) |
Education in Wilcox
School Enrollment in Wilcox
The most common levels of schooling among the 59 students in Wilcox are elementary school (19 | 32.2%), high school (15 | 25.4%), and middle school (12 | 20.3%).
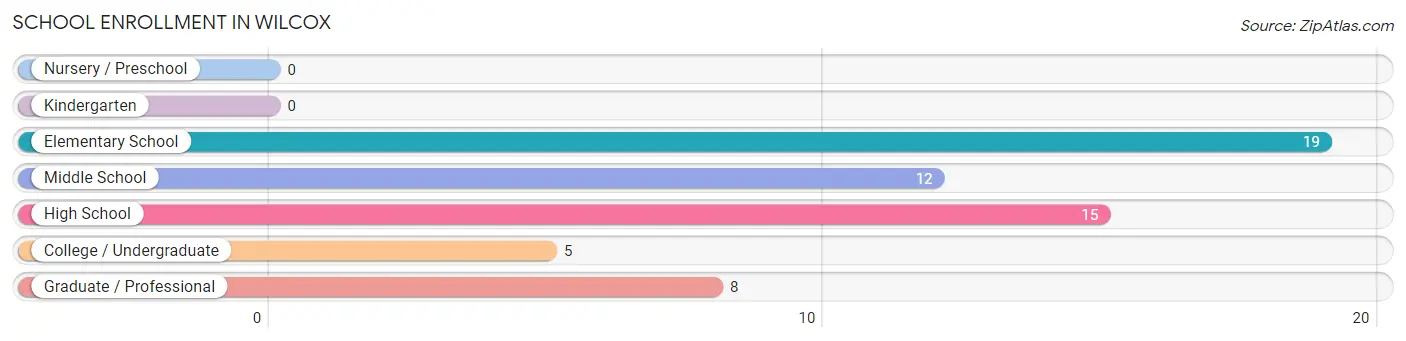
| School Level | # Students | % Students |
| Nursery / Preschool | 0 | 0.0% |
| Kindergarten | 0 | 0.0% |
| Elementary School | 19 | 32.2% |
| Middle School | 12 | 20.3% |
| High School | 15 | 25.4% |
| College / Undergraduate | 5 | 8.5% |
| Graduate / Professional | 8 | 13.6% |
| Total | 59 | 100.0% |
School Enrollment by Age by Funding Source in Wilcox
Out of a total of 59 students who are enrolled in schools in Wilcox, 12 (20.3%) attend a private institution, while the remaining 47 (79.7%) are enrolled in public schools. The age group of 18 to 19 year olds has the highest likelihood of being enrolled in private schools, with 2 (100.0% in the age bracket) enrolled. Conversely, the age group of 5 to 9 year old has the lowest likelihood of being enrolled in a private school, with 8 (100.0% in the age bracket) attending a public institution.
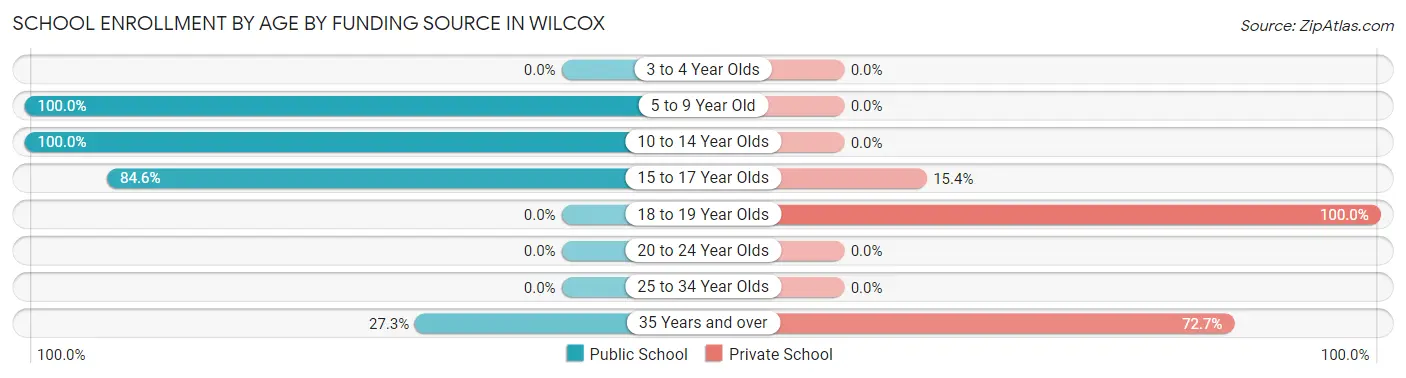
| Age Bracket | Public School | Private School |
| 3 to 4 Year Olds | 0 (0.0%) | 0 (0.0%) |
| 5 to 9 Year Old | 8 (100.0%) | 0 (0.0%) |
| 10 to 14 Year Olds | 25 (100.0%) | 0 (0.0%) |
| 15 to 17 Year Olds | 11 (84.6%) | 2 (15.4%) |
| 18 to 19 Year Olds | 0 (0.0%) | 2 (100.0%) |
| 20 to 24 Year Olds | 0 (0.0%) | 0 (0.0%) |
| 25 to 34 Year Olds | 0 (0.0%) | 0 (0.0%) |
| 35 Years and over | 3 (27.3%) | 8 (72.7%) |
| Total | 47 (79.7%) | 12 (20.3%) |
Educational Attainment by Field of Study in Wilcox
Business (24 | 51.1%), education (9 | 19.2%), science & technology (7 | 14.9%), literature & languages (3 | 6.4%), and bio, nature & agricultural (2 | 4.3%) are the most common fields of study among 47 individuals in Wilcox who have obtained a bachelor's degree or higher.
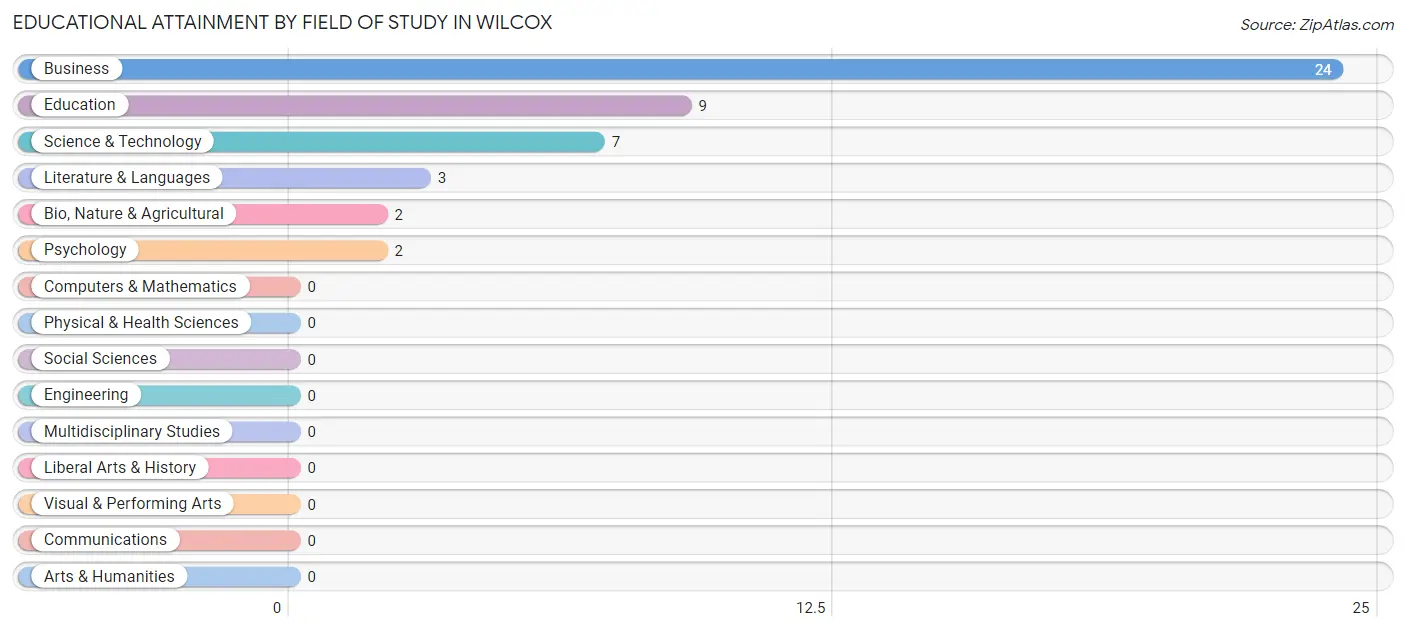
| Field of Study | # Graduates | % Graduates |
| Computers & Mathematics | 0 | 0.0% |
| Bio, Nature & Agricultural | 2 | 4.3% |
| Physical & Health Sciences | 0 | 0.0% |
| Psychology | 2 | 4.3% |
| Social Sciences | 0 | 0.0% |
| Engineering | 0 | 0.0% |
| Multidisciplinary Studies | 0 | 0.0% |
| Science & Technology | 7 | 14.9% |
| Business | 24 | 51.1% |
| Education | 9 | 19.2% |
| Literature & Languages | 3 | 6.4% |
| Liberal Arts & History | 0 | 0.0% |
| Visual & Performing Arts | 0 | 0.0% |
| Communications | 0 | 0.0% |
| Arts & Humanities | 0 | 0.0% |
| Total | 47 | 100.0% |
Transportation & Commute in Wilcox
Vehicle Availability by Sex in Wilcox
The most prevalent vehicle ownership categories in Wilcox are males with 1 vehicle (72, accounting for 63.7%) and females with 1 vehicle (6, making up 102.9%).
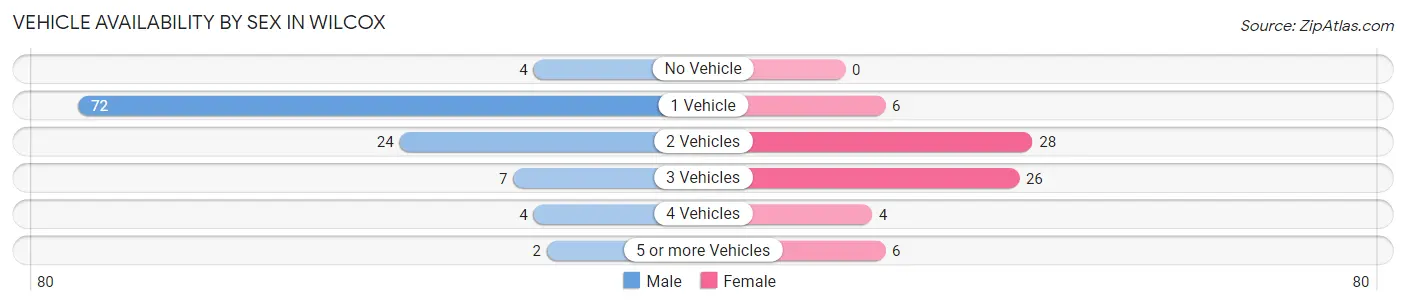
| Vehicles Available | Male | Female |
| No Vehicle | 4 (3.5%) | 0 (0.0%) |
| 1 Vehicle | 72 (63.7%) | 6 (8.6%) |
| 2 Vehicles | 24 (21.2%) | 28 (40.0%) |
| 3 Vehicles | 7 (6.2%) | 26 (37.1%) |
| 4 Vehicles | 4 (3.5%) | 4 (5.7%) |
| 5 or more Vehicles | 2 (1.8%) | 6 (8.6%) |
| Total | 113 (100.0%) | 70 (100.0%) |
Commute Time in Wilcox
The most frequently occuring commute durations in Wilcox are 5 to 9 minutes (61 commuters, 34.9%), 30 to 34 minutes (34 commuters, 19.4%), and 10 to 14 minutes (33 commuters, 18.9%).
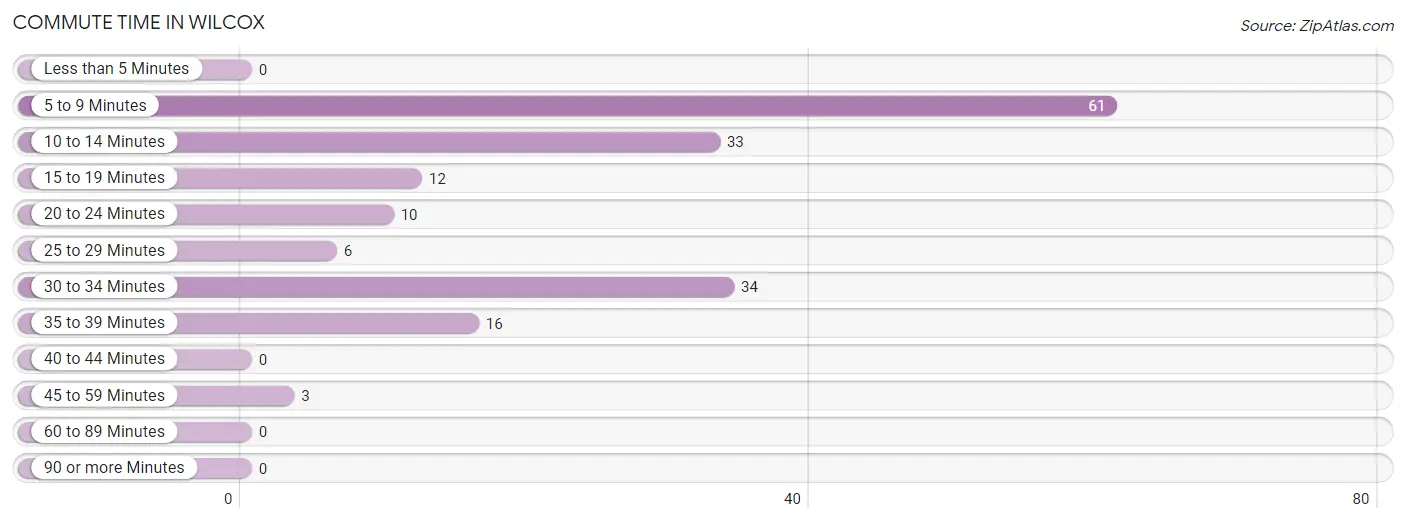
| Commute Time | # Commuters | % Commuters |
| Less than 5 Minutes | 0 | 0.0% |
| 5 to 9 Minutes | 61 | 34.9% |
| 10 to 14 Minutes | 33 | 18.9% |
| 15 to 19 Minutes | 12 | 6.9% |
| 20 to 24 Minutes | 10 | 5.7% |
| 25 to 29 Minutes | 6 | 3.4% |
| 30 to 34 Minutes | 34 | 19.4% |
| 35 to 39 Minutes | 16 | 9.1% |
| 40 to 44 Minutes | 0 | 0.0% |
| 45 to 59 Minutes | 3 | 1.7% |
| 60 to 89 Minutes | 0 | 0.0% |
| 90 or more Minutes | 0 | 0.0% |
Commute Time by Sex in Wilcox
The most common commute times in Wilcox are 5 to 9 minutes (46 commuters, 40.7%) for males and 10 to 14 minutes (21 commuters, 33.9%) for females.
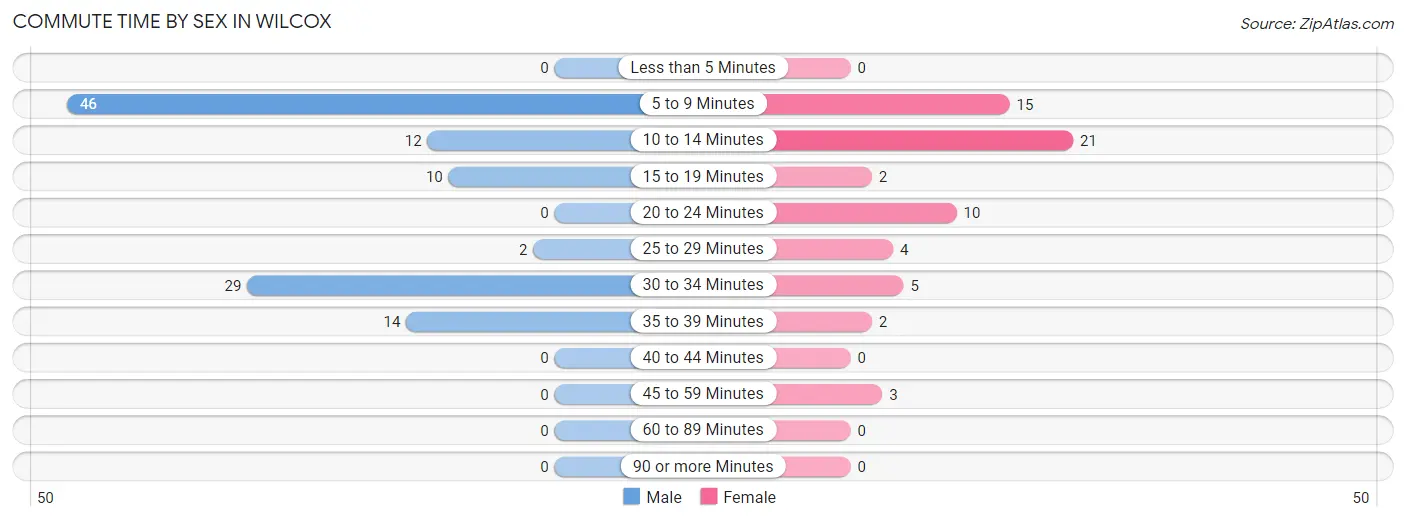
| Commute Time | Male | Female |
| Less than 5 Minutes | 0 (0.0%) | 0 (0.0%) |
| 5 to 9 Minutes | 46 (40.7%) | 15 (24.2%) |
| 10 to 14 Minutes | 12 (10.6%) | 21 (33.9%) |
| 15 to 19 Minutes | 10 (8.8%) | 2 (3.2%) |
| 20 to 24 Minutes | 0 (0.0%) | 10 (16.1%) |
| 25 to 29 Minutes | 2 (1.8%) | 4 (6.5%) |
| 30 to 34 Minutes | 29 (25.7%) | 5 (8.1%) |
| 35 to 39 Minutes | 14 (12.4%) | 2 (3.2%) |
| 40 to 44 Minutes | 0 (0.0%) | 0 (0.0%) |
| 45 to 59 Minutes | 0 (0.0%) | 3 (4.8%) |
| 60 to 89 Minutes | 0 (0.0%) | 0 (0.0%) |
| 90 or more Minutes | 0 (0.0%) | 0 (0.0%) |
Time of Departure to Work by Sex in Wilcox
The most frequent times of departure to work in Wilcox are 12:00 PM to 3:59 PM (76, 67.3%) for males and 12:00 PM to 3:59 PM (15, 24.2%) for females.
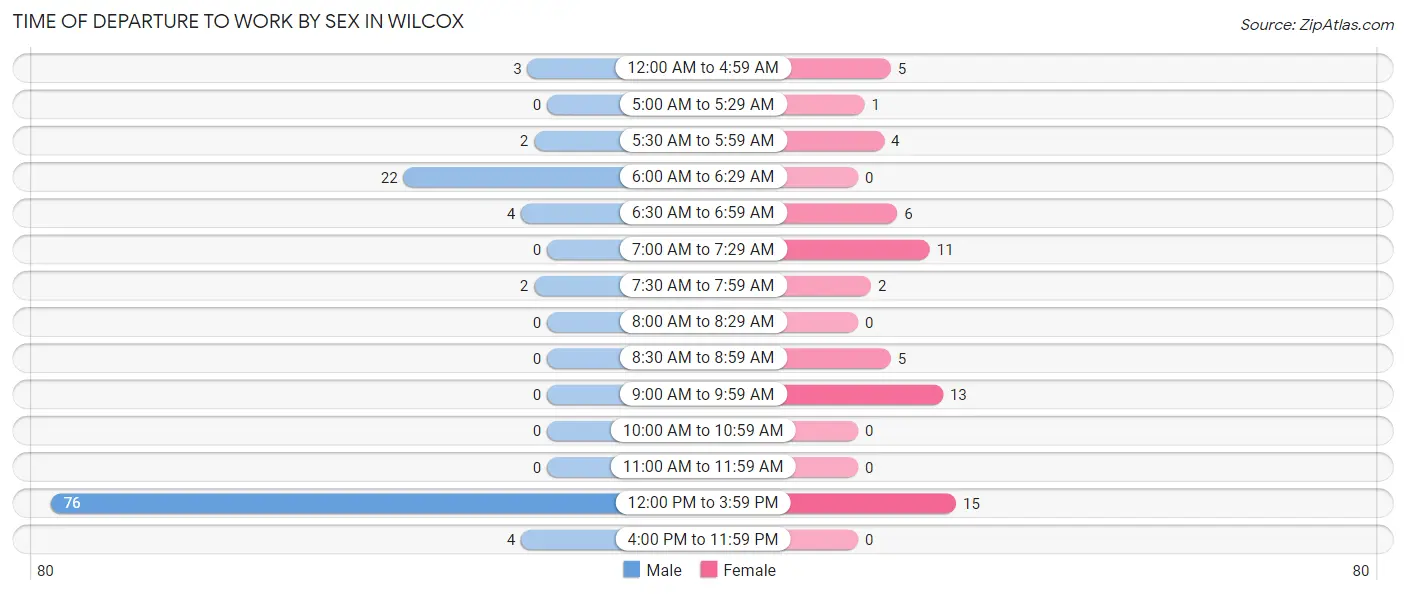
| Time of Departure | Male | Female |
| 12:00 AM to 4:59 AM | 3 (2.6%) | 5 (8.1%) |
| 5:00 AM to 5:29 AM | 0 (0.0%) | 1 (1.6%) |
| 5:30 AM to 5:59 AM | 2 (1.8%) | 4 (6.5%) |
| 6:00 AM to 6:29 AM | 22 (19.5%) | 0 (0.0%) |
| 6:30 AM to 6:59 AM | 4 (3.5%) | 6 (9.7%) |
| 7:00 AM to 7:29 AM | 0 (0.0%) | 11 (17.7%) |
| 7:30 AM to 7:59 AM | 2 (1.8%) | 2 (3.2%) |
| 8:00 AM to 8:29 AM | 0 (0.0%) | 0 (0.0%) |
| 8:30 AM to 8:59 AM | 0 (0.0%) | 5 (8.1%) |
| 9:00 AM to 9:59 AM | 0 (0.0%) | 13 (21.0%) |
| 10:00 AM to 10:59 AM | 0 (0.0%) | 0 (0.0%) |
| 11:00 AM to 11:59 AM | 0 (0.0%) | 0 (0.0%) |
| 12:00 PM to 3:59 PM | 76 (67.3%) | 15 (24.2%) |
| 4:00 PM to 11:59 PM | 4 (3.5%) | 0 (0.0%) |
| Total | 113 (100.0%) | 62 (100.0%) |
Housing Occupancy in Wilcox
Occupancy by Ownership in Wilcox
Of the total 145 dwellings in Wilcox, owner-occupied units account for 124 (85.5%), while renter-occupied units make up 21 (14.5%).
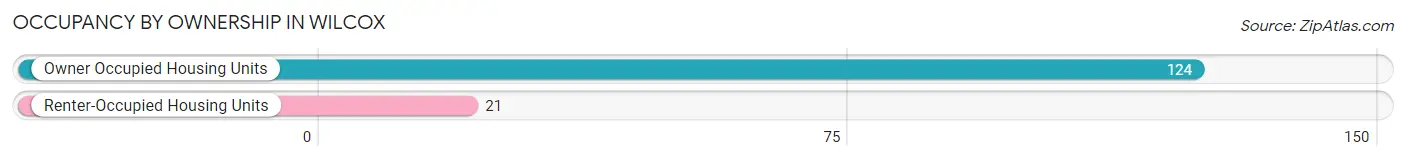
| Occupancy | # Housing Units | % Housing Units |
| Owner Occupied Housing Units | 124 | 85.5% |
| Renter-Occupied Housing Units | 21 | 14.5% |
| Total Occupied Housing Units | 145 | 100.0% |
Occupancy by Household Size in Wilcox
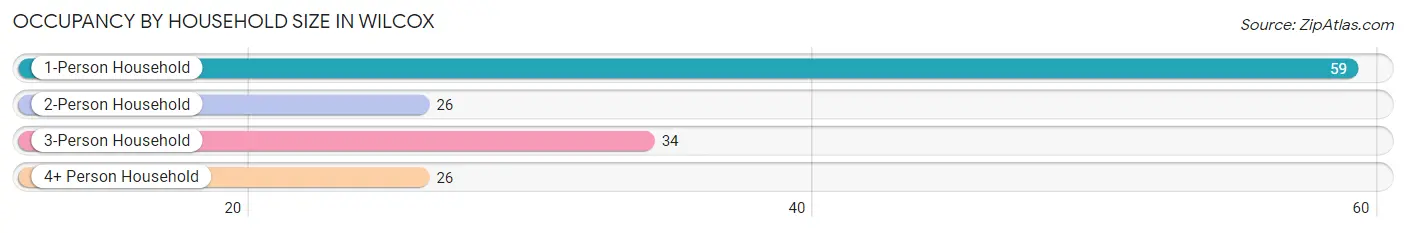
| Household Size | # Housing Units | % Housing Units |
| 1-Person Household | 59 | 40.7% |
| 2-Person Household | 26 | 17.9% |
| 3-Person Household | 34 | 23.4% |
| 4+ Person Household | 26 | 17.9% |
| Total Housing Units | 145 | 100.0% |
Occupancy by Ownership by Household Size in Wilcox
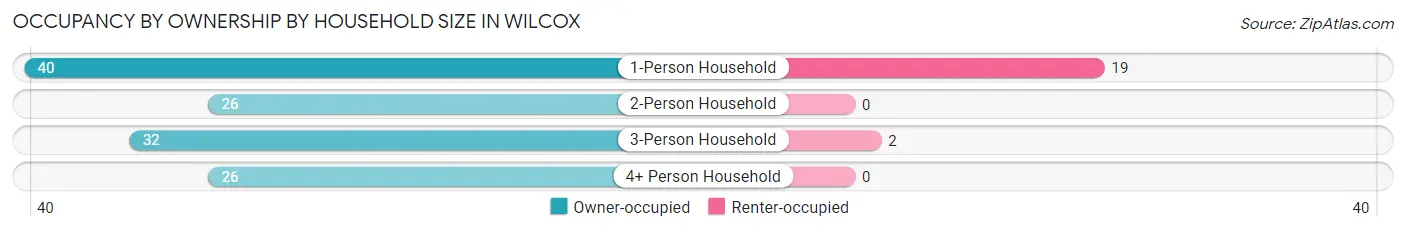
| Household Size | Owner-occupied | Renter-occupied |
| 1-Person Household | 40 (67.8%) | 19 (32.2%) |
| 2-Person Household | 26 (100.0%) | 0 (0.0%) |
| 3-Person Household | 32 (94.1%) | 2 (5.9%) |
| 4+ Person Household | 26 (100.0%) | 0 (0.0%) |
| Total Housing Units | 124 (85.5%) | 21 (14.5%) |
Occupancy by Educational Attainment in Wilcox
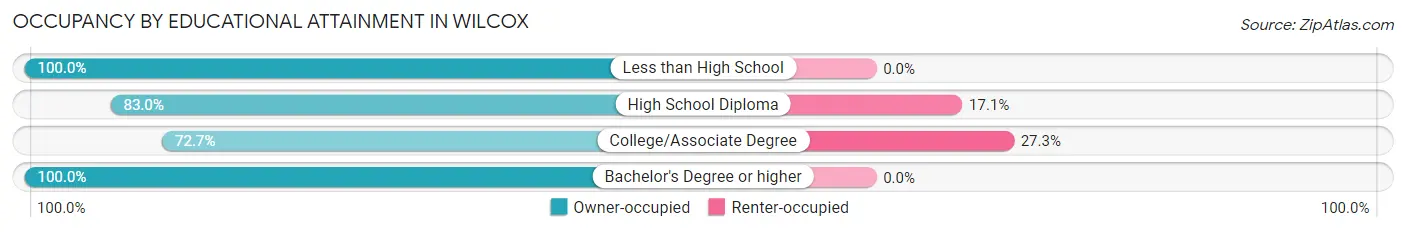
| Household Size | Owner-occupied | Renter-occupied |
| Less than High School | 5 (100.0%) | 0 (0.0%) |
| High School Diploma | 73 (83.0%) | 15 (17.1%) |
| College/Associate Degree | 16 (72.7%) | 6 (27.3%) |
| Bachelor's Degree or higher | 30 (100.0%) | 0 (0.0%) |
Occupancy by Age of Householder in Wilcox
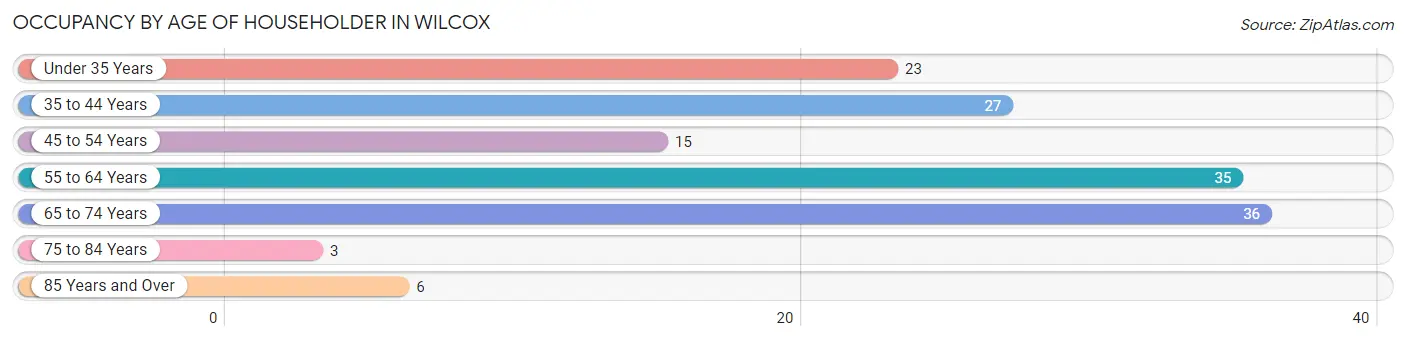
| Age Bracket | # Households | % Households |
| Under 35 Years | 23 | 15.9% |
| 35 to 44 Years | 27 | 18.6% |
| 45 to 54 Years | 15 | 10.3% |
| 55 to 64 Years | 35 | 24.1% |
| 65 to 74 Years | 36 | 24.8% |
| 75 to 84 Years | 3 | 2.1% |
| 85 Years and Over | 6 | 4.1% |
| Total | 145 | 100.0% |
Housing Finances in Wilcox
Median Income by Occupancy in Wilcox
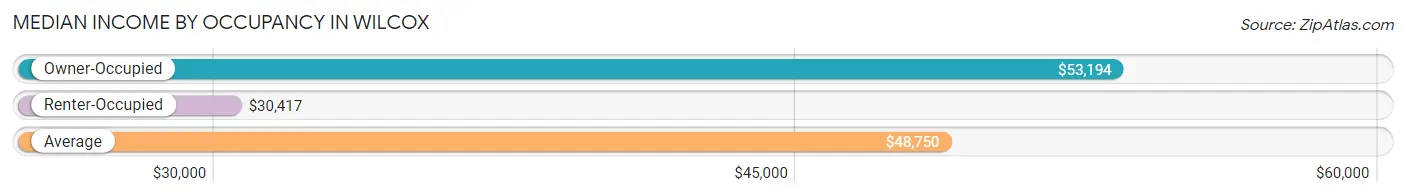
| Occupancy Type | # Households | Median Income |
| Owner-Occupied | 124 (85.5%) | $53,194 |
| Renter-Occupied | 21 (14.5%) | $30,417 |
| Average | 145 (100.0%) | $48,750 |
Occupancy by Householder Income Bracket in Wilcox
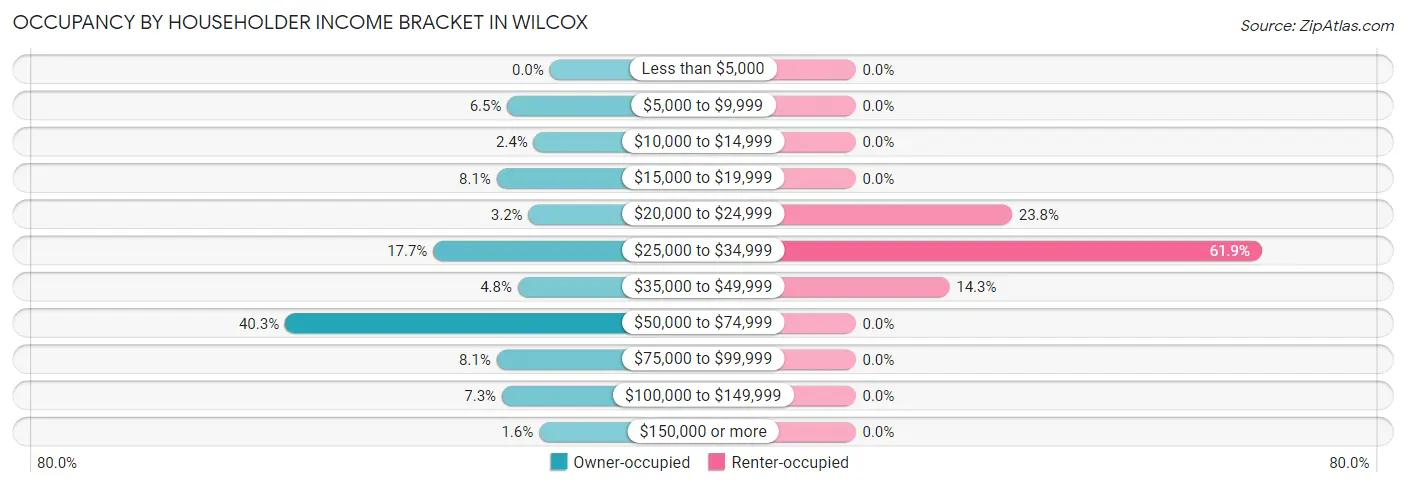
| Income Bracket | Owner-occupied | Renter-occupied |
| Less than $5,000 | 0 (0.0%) | 0 (0.0%) |
| $5,000 to $9,999 | 8 (6.5%) | 0 (0.0%) |
| $10,000 to $14,999 | 3 (2.4%) | 0 (0.0%) |
| $15,000 to $19,999 | 10 (8.1%) | 0 (0.0%) |
| $20,000 to $24,999 | 4 (3.2%) | 5 (23.8%) |
| $25,000 to $34,999 | 22 (17.7%) | 13 (61.9%) |
| $35,000 to $49,999 | 6 (4.8%) | 3 (14.3%) |
| $50,000 to $74,999 | 50 (40.3%) | 0 (0.0%) |
| $75,000 to $99,999 | 10 (8.1%) | 0 (0.0%) |
| $100,000 to $149,999 | 9 (7.3%) | 0 (0.0%) |
| $150,000 or more | 2 (1.6%) | 0 (0.0%) |
| Total | 124 (100.0%) | 21 (100.0%) |
Monthly Housing Cost Tiers in Wilcox
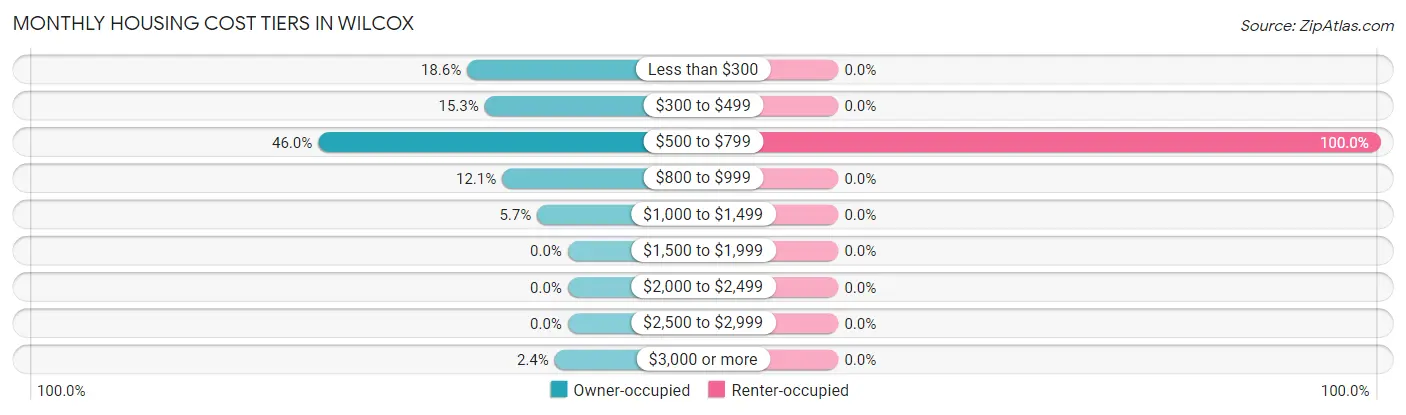
| Monthly Cost | Owner-occupied | Renter-occupied |
| Less than $300 | 23 (18.5%) | 0 (0.0%) |
| $300 to $499 | 19 (15.3%) | 0 (0.0%) |
| $500 to $799 | 57 (46.0%) | 21 (100.0%) |
| $800 to $999 | 15 (12.1%) | 0 (0.0%) |
| $1,000 to $1,499 | 7 (5.7%) | 0 (0.0%) |
| $1,500 to $1,999 | 0 (0.0%) | 0 (0.0%) |
| $2,000 to $2,499 | 0 (0.0%) | 0 (0.0%) |
| $2,500 to $2,999 | 0 (0.0%) | 0 (0.0%) |
| $3,000 or more | 3 (2.4%) | 0 (0.0%) |
| Total | 124 (100.0%) | 21 (100.0%) |
Physical Housing Characteristics in Wilcox
Housing Structures in Wilcox
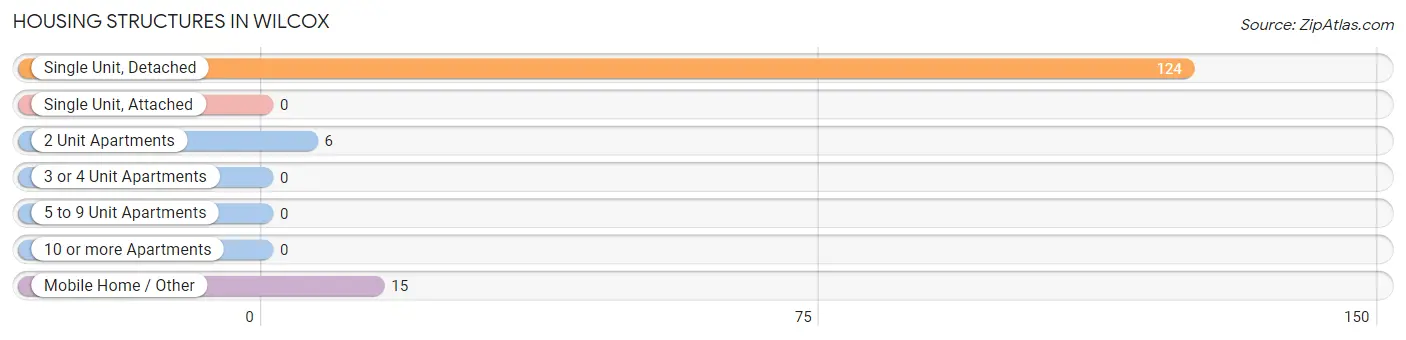
| Structure Type | # Housing Units | % Housing Units |
| Single Unit, Detached | 124 | 85.5% |
| Single Unit, Attached | 0 | 0.0% |
| 2 Unit Apartments | 6 | 4.1% |
| 3 or 4 Unit Apartments | 0 | 0.0% |
| 5 to 9 Unit Apartments | 0 | 0.0% |
| 10 or more Apartments | 0 | 0.0% |
| Mobile Home / Other | 15 | 10.3% |
| Total | 145 | 100.0% |
Housing Structures by Occupancy in Wilcox
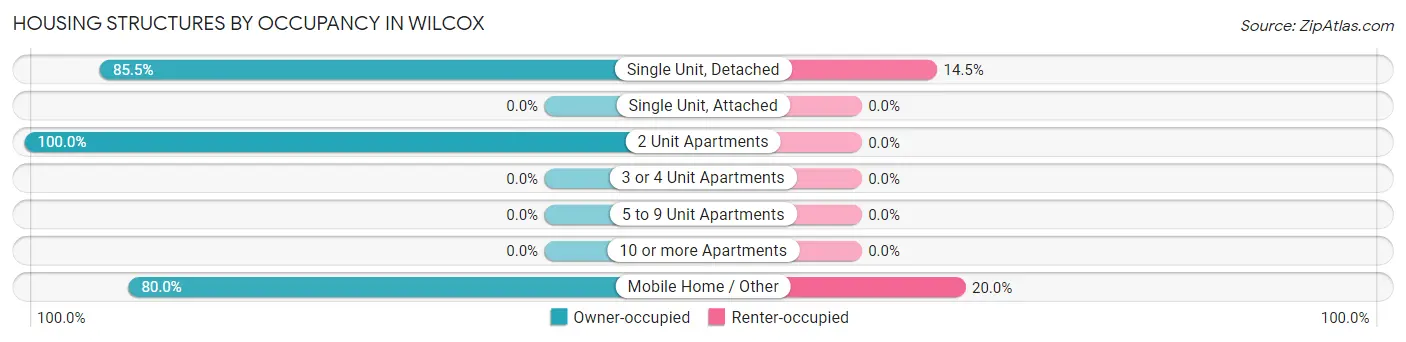
| Structure Type | Owner-occupied | Renter-occupied |
| Single Unit, Detached | 106 (85.5%) | 18 (14.5%) |
| Single Unit, Attached | 0 (0.0%) | 0 (0.0%) |
| 2 Unit Apartments | 6 (100.0%) | 0 (0.0%) |
| 3 or 4 Unit Apartments | 0 (0.0%) | 0 (0.0%) |
| 5 to 9 Unit Apartments | 0 (0.0%) | 0 (0.0%) |
| 10 or more Apartments | 0 (0.0%) | 0 (0.0%) |
| Mobile Home / Other | 12 (80.0%) | 3 (20.0%) |
| Total | 124 (85.5%) | 21 (14.5%) |
Housing Structures by Number of Rooms in Wilcox
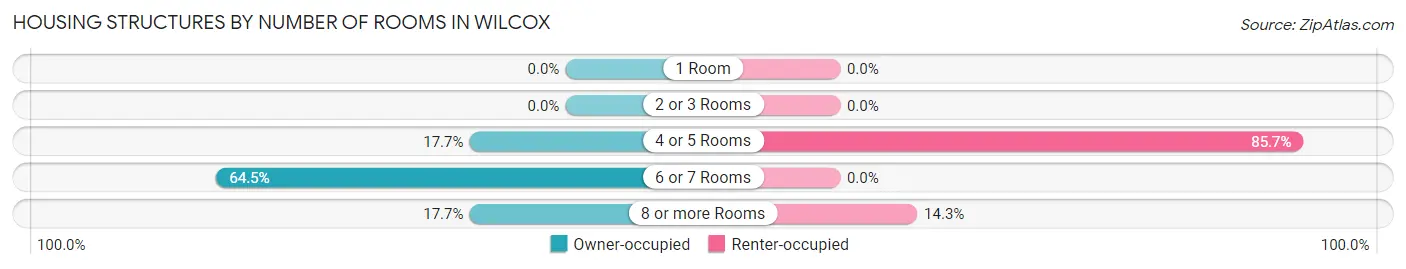
| Number of Rooms | Owner-occupied | Renter-occupied |
| 1 Room | 0 (0.0%) | 0 (0.0%) |
| 2 or 3 Rooms | 0 (0.0%) | 0 (0.0%) |
| 4 or 5 Rooms | 22 (17.7%) | 18 (85.7%) |
| 6 or 7 Rooms | 80 (64.5%) | 0 (0.0%) |
| 8 or more Rooms | 22 (17.7%) | 3 (14.3%) |
| Total | 124 (100.0%) | 21 (100.0%) |
Housing Structure by Heating Type in Wilcox
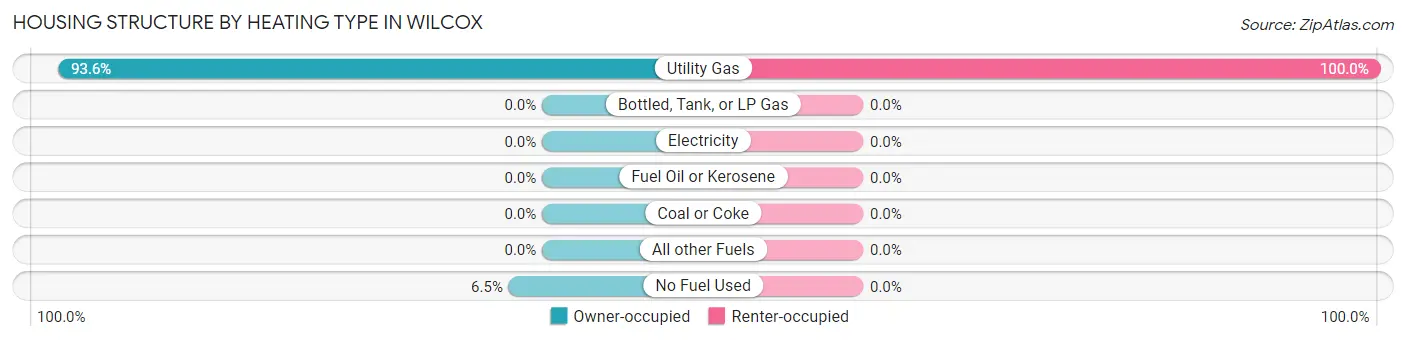
| Heating Type | Owner-occupied | Renter-occupied |
| Utility Gas | 116 (93.5%) | 21 (100.0%) |
| Bottled, Tank, or LP Gas | 0 (0.0%) | 0 (0.0%) |
| Electricity | 0 (0.0%) | 0 (0.0%) |
| Fuel Oil or Kerosene | 0 (0.0%) | 0 (0.0%) |
| Coal or Coke | 0 (0.0%) | 0 (0.0%) |
| All other Fuels | 0 (0.0%) | 0 (0.0%) |
| No Fuel Used | 8 (6.5%) | 0 (0.0%) |
| Total | 124 (100.0%) | 21 (100.0%) |
Household Vehicle Usage in Wilcox
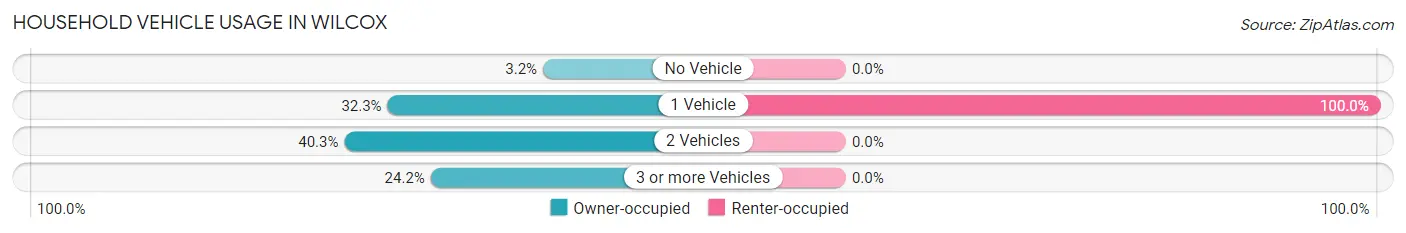
| Vehicles per Household | Owner-occupied | Renter-occupied |
| No Vehicle | 4 (3.2%) | 0 (0.0%) |
| 1 Vehicle | 40 (32.3%) | 21 (100.0%) |
| 2 Vehicles | 50 (40.3%) | 0 (0.0%) |
| 3 or more Vehicles | 30 (24.2%) | 0 (0.0%) |
| Total | 124 (100.0%) | 21 (100.0%) |
Real Estate & Mortgages in Wilcox
Real Estate and Mortgage Overview in Wilcox
| Characteristic | Without Mortgage | With Mortgage |
| Housing Units | 77 | 47 |
| Median Property Value | $50,200 | $54,800 |
| Median Household Income | $34,063 | $0 |
| Monthly Housing Costs | $456 | $3 |
| Real Estate Taxes | $1,258 | $0 |
Property Value by Mortgage Status in Wilcox
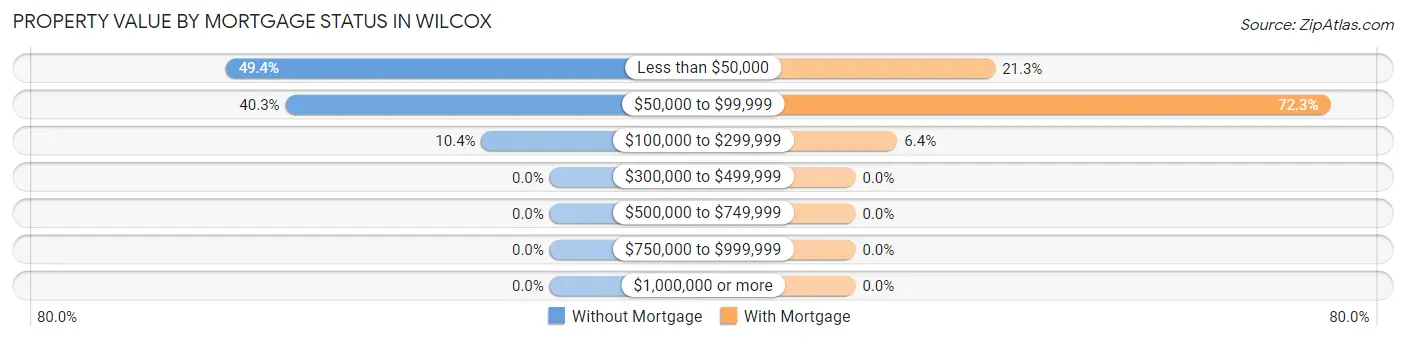
| Property Value | Without Mortgage | With Mortgage |
| Less than $50,000 | 38 (49.3%) | 10 (21.3%) |
| $50,000 to $99,999 | 31 (40.3%) | 34 (72.3%) |
| $100,000 to $299,999 | 8 (10.4%) | 3 (6.4%) |
| $300,000 to $499,999 | 0 (0.0%) | 0 (0.0%) |
| $500,000 to $749,999 | 0 (0.0%) | 0 (0.0%) |
| $750,000 to $999,999 | 0 (0.0%) | 0 (0.0%) |
| $1,000,000 or more | 0 (0.0%) | 0 (0.0%) |
| Total | 77 (100.0%) | 47 (100.0%) |
Household Income by Mortgage Status in Wilcox
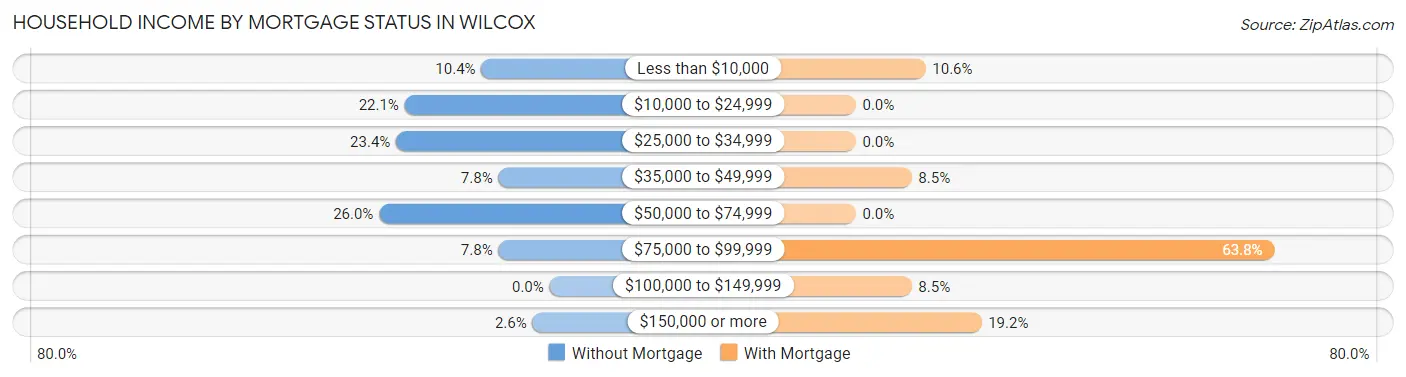
| Household Income | Without Mortgage | With Mortgage |
| Less than $10,000 | 8 (10.4%) | 5 (10.6%) |
| $10,000 to $24,999 | 17 (22.1%) | 0 (0.0%) |
| $25,000 to $34,999 | 18 (23.4%) | 0 (0.0%) |
| $35,000 to $49,999 | 6 (7.8%) | 4 (8.5%) |
| $50,000 to $74,999 | 20 (26.0%) | 0 (0.0%) |
| $75,000 to $99,999 | 6 (7.8%) | 30 (63.8%) |
| $100,000 to $149,999 | 0 (0.0%) | 4 (8.5%) |
| $150,000 or more | 2 (2.6%) | 9 (19.2%) |
| Total | 77 (100.0%) | 47 (100.0%) |
Property Value to Household Income Ratio in Wilcox
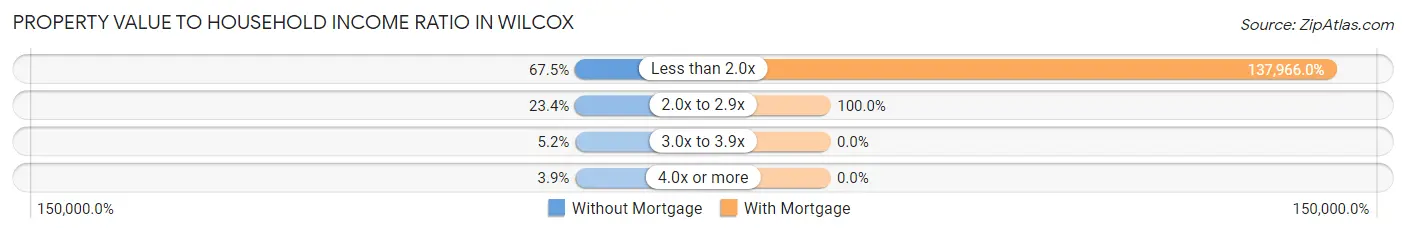
| Value-to-Income Ratio | Without Mortgage | With Mortgage |
| Less than 2.0x | 52 (67.5%) | 64,844 (137,966.0%) |
| 2.0x to 2.9x | 18 (23.4%) | 47 (100.0%) |
| 3.0x to 3.9x | 4 (5.2%) | 0 (0.0%) |
| 4.0x or more | 3 (3.9%) | 0 (0.0%) |
| Total | 77 (100.0%) | 47 (100.0%) |
Real Estate Taxes by Mortgage Status in Wilcox
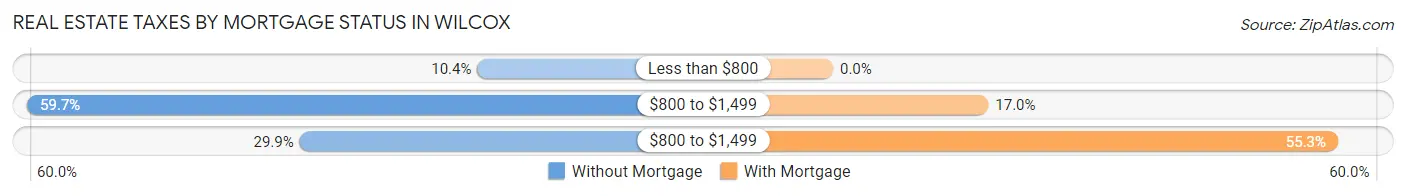
| Property Taxes | Without Mortgage | With Mortgage |
| Less than $800 | 8 (10.4%) | 0 (0.0%) |
| $800 to $1,499 | 46 (59.7%) | 8 (17.0%) |
| $800 to $1,499 | 23 (29.9%) | 26 (55.3%) |
| Total | 77 (100.0%) | 47 (100.0%) |
Health & Disability in Wilcox
Health Insurance Coverage by Age in Wilcox
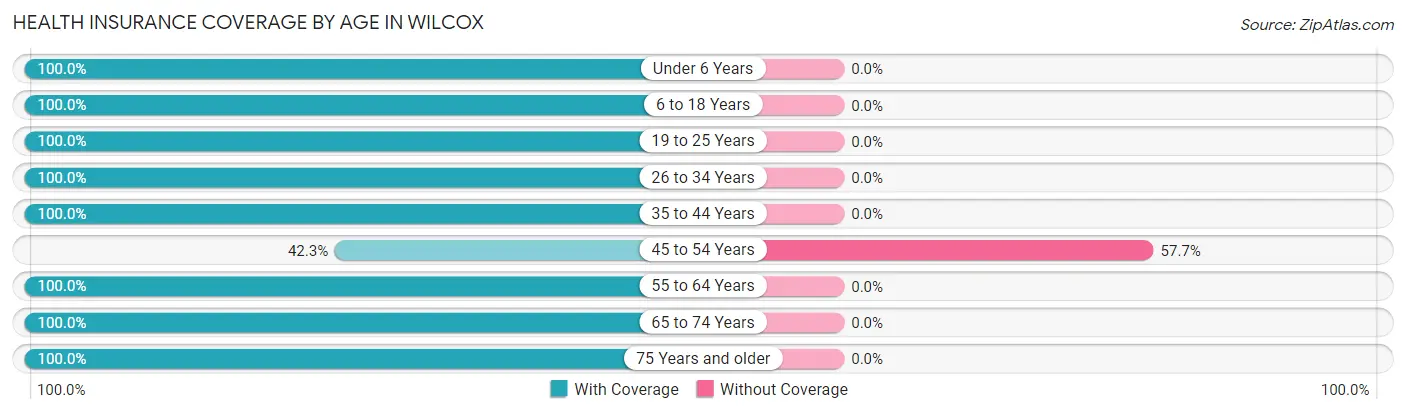
| Age Bracket | With Coverage | Without Coverage |
| Under 6 Years | 40 (100.0%) | 0 (0.0%) |
| 6 to 18 Years | 46 (100.0%) | 0 (0.0%) |
| 19 to 25 Years | 24 (100.0%) | 0 (0.0%) |
| 26 to 34 Years | 55 (100.0%) | 0 (0.0%) |
| 35 to 44 Years | 89 (100.0%) | 0 (0.0%) |
| 45 to 54 Years | 11 (42.3%) | 15 (57.7%) |
| 55 to 64 Years | 59 (100.0%) | 0 (0.0%) |
| 65 to 74 Years | 54 (100.0%) | 0 (0.0%) |
| 75 Years and older | 11 (100.0%) | 0 (0.0%) |
| Total | 389 (96.3%) | 15 (3.7%) |
Health Insurance Coverage by Citizenship Status in Wilcox
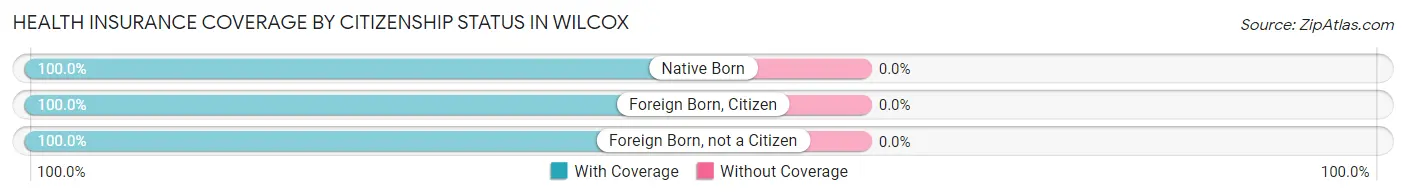
| Citizenship Status | With Coverage | Without Coverage |
| Native Born | 40 (100.0%) | 0 (0.0%) |
| Foreign Born, Citizen | 46 (100.0%) | 0 (0.0%) |
| Foreign Born, not a Citizen | 24 (100.0%) | 0 (0.0%) |
Health Insurance Coverage by Household Income in Wilcox
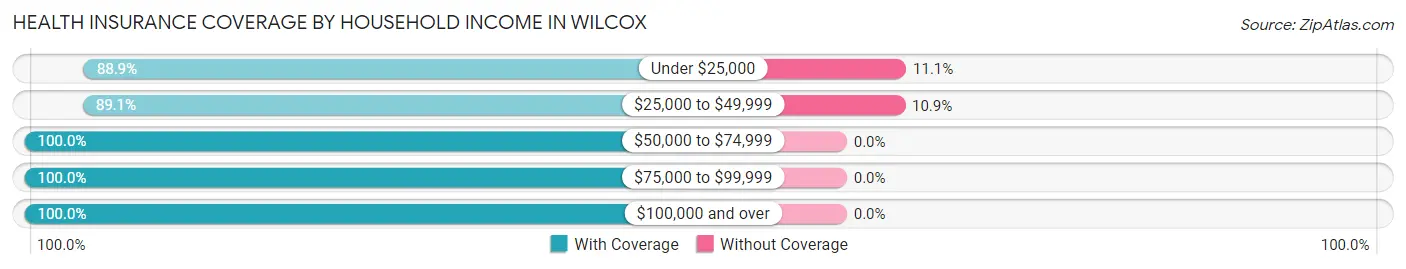
| Household Income | With Coverage | Without Coverage |
| Under $25,000 | 72 (88.9%) | 9 (11.1%) |
| $25,000 to $49,999 | 49 (89.1%) | 6 (10.9%) |
| $50,000 to $74,999 | 214 (100.0%) | 0 (0.0%) |
| $75,000 to $99,999 | 26 (100.0%) | 0 (0.0%) |
| $100,000 and over | 28 (100.0%) | 0 (0.0%) |
Public vs Private Health Insurance Coverage by Age in Wilcox
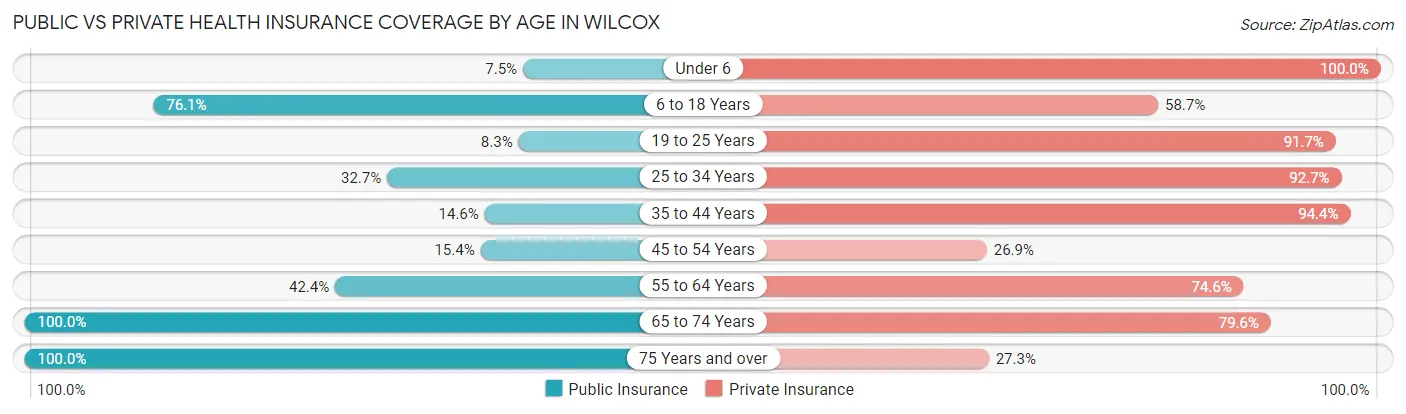
| Age Bracket | Public Insurance | Private Insurance |
| Under 6 | 3 (7.5%) | 40 (100.0%) |
| 6 to 18 Years | 35 (76.1%) | 27 (58.7%) |
| 19 to 25 Years | 2 (8.3%) | 22 (91.7%) |
| 25 to 34 Years | 18 (32.7%) | 51 (92.7%) |
| 35 to 44 Years | 13 (14.6%) | 84 (94.4%) |
| 45 to 54 Years | 4 (15.4%) | 7 (26.9%) |
| 55 to 64 Years | 25 (42.4%) | 44 (74.6%) |
| 65 to 74 Years | 54 (100.0%) | 43 (79.6%) |
| 75 Years and over | 11 (100.0%) | 3 (27.3%) |
| Total | 165 (40.8%) | 321 (79.5%) |
Disability Status by Sex by Age in Wilcox
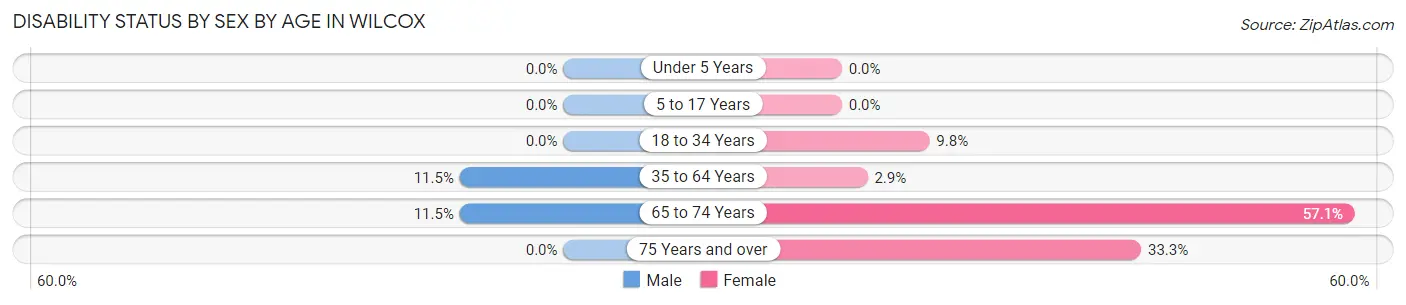
| Age Bracket | Male | Female |
| Under 5 Years | 0 (0.0%) | 0 (0.0%) |
| 5 to 17 Years | 0 (0.0%) | 0 (0.0%) |
| 18 to 34 Years | 0 (0.0%) | 4 (9.8%) |
| 35 to 64 Years | 12 (11.5%) | 2 (2.9%) |
| 65 to 74 Years | 3 (11.5%) | 16 (57.1%) |
| 75 Years and over | 0 (0.0%) | 3 (33.3%) |
Disability Class by Sex by Age in Wilcox
Disability Class: Hearing Difficulty
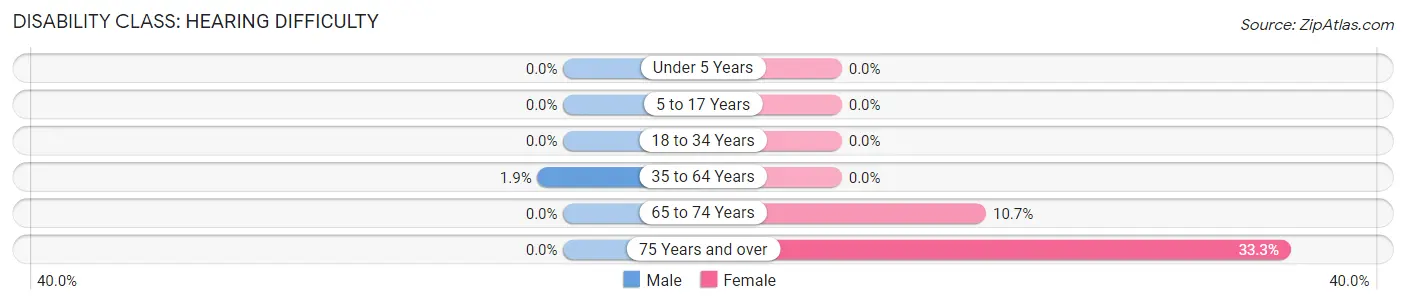
| Age Bracket | Male | Female |
| Under 5 Years | 0 (0.0%) | 0 (0.0%) |
| 5 to 17 Years | 0 (0.0%) | 0 (0.0%) |
| 18 to 34 Years | 0 (0.0%) | 0 (0.0%) |
| 35 to 64 Years | 2 (1.9%) | 0 (0.0%) |
| 65 to 74 Years | 0 (0.0%) | 3 (10.7%) |
| 75 Years and over | 0 (0.0%) | 3 (33.3%) |
Disability Class: Vision Difficulty
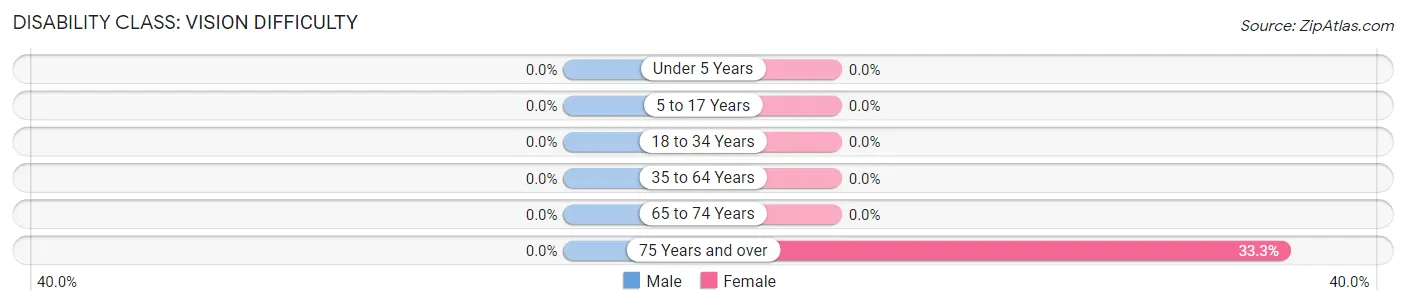
| Age Bracket | Male | Female |
| Under 5 Years | 0 (0.0%) | 0 (0.0%) |
| 5 to 17 Years | 0 (0.0%) | 0 (0.0%) |
| 18 to 34 Years | 0 (0.0%) | 0 (0.0%) |
| 35 to 64 Years | 0 (0.0%) | 0 (0.0%) |
| 65 to 74 Years | 0 (0.0%) | 0 (0.0%) |
| 75 Years and over | 0 (0.0%) | 3 (33.3%) |
Disability Class: Cognitive Difficulty
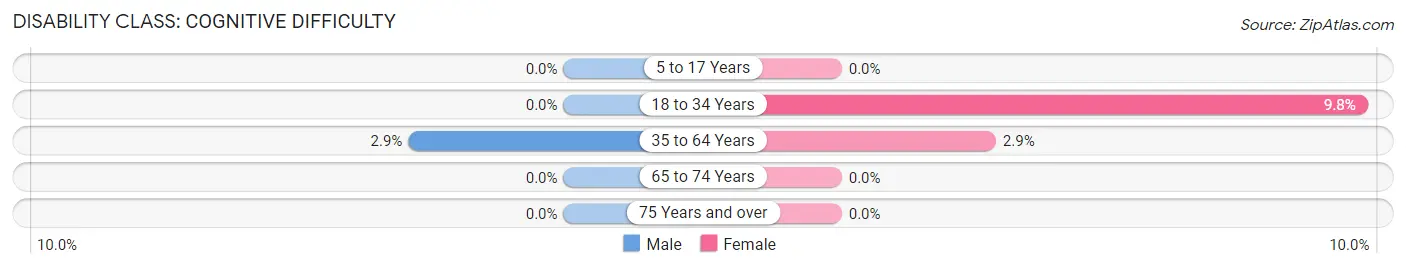
| Age Bracket | Male | Female |
| 5 to 17 Years | 0 (0.0%) | 0 (0.0%) |
| 18 to 34 Years | 0 (0.0%) | 4 (9.8%) |
| 35 to 64 Years | 3 (2.9%) | 2 (2.9%) |
| 65 to 74 Years | 0 (0.0%) | 0 (0.0%) |
| 75 Years and over | 0 (0.0%) | 0 (0.0%) |
Disability Class: Ambulatory Difficulty
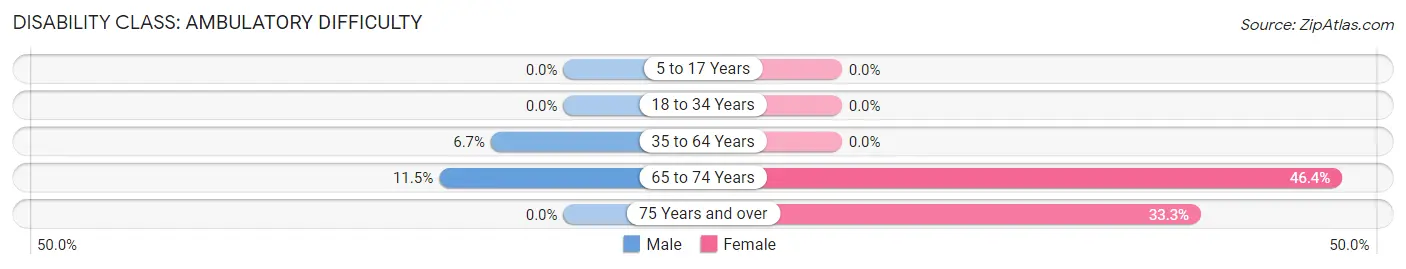
| Age Bracket | Male | Female |
| 5 to 17 Years | 0 (0.0%) | 0 (0.0%) |
| 18 to 34 Years | 0 (0.0%) | 0 (0.0%) |
| 35 to 64 Years | 7 (6.7%) | 0 (0.0%) |
| 65 to 74 Years | 3 (11.5%) | 13 (46.4%) |
| 75 Years and over | 0 (0.0%) | 3 (33.3%) |
Disability Class: Self-Care Difficulty
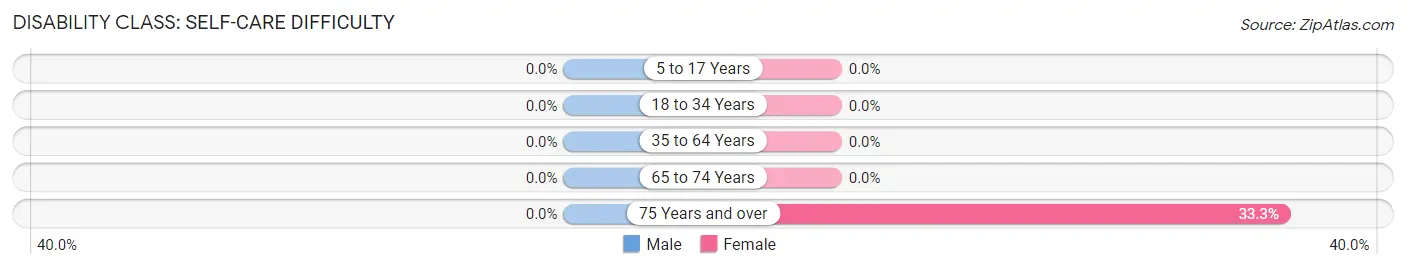
| Age Bracket | Male | Female |
| 5 to 17 Years | 0 (0.0%) | 0 (0.0%) |
| 18 to 34 Years | 0 (0.0%) | 0 (0.0%) |
| 35 to 64 Years | 0 (0.0%) | 0 (0.0%) |
| 65 to 74 Years | 0 (0.0%) | 0 (0.0%) |
| 75 Years and over | 0 (0.0%) | 3 (33.3%) |
Technology Access in Wilcox
Computing Device Access in Wilcox
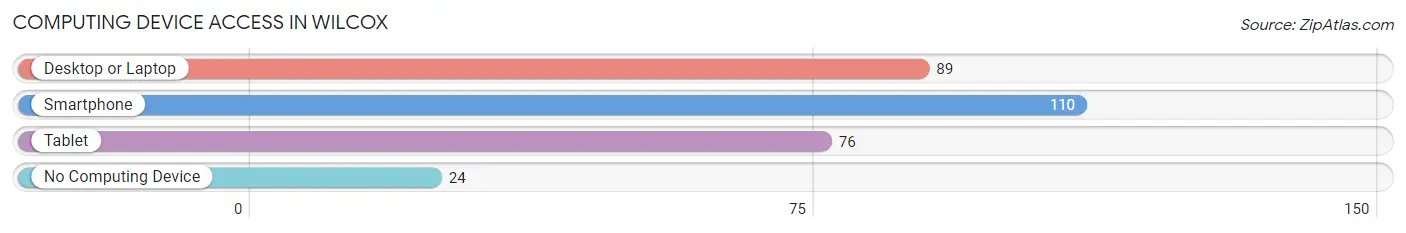
| Device Type | # Households | % Households |
| Desktop or Laptop | 89 | 61.4% |
| Smartphone | 110 | 75.9% |
| Tablet | 76 | 52.4% |
| No Computing Device | 24 | 16.6% |
| Total | 145 | 100.0% |
Internet Access in Wilcox
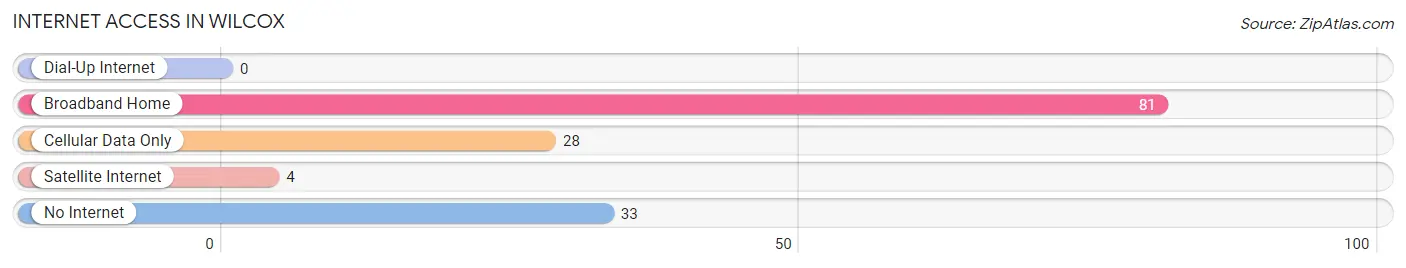
| Internet Type | # Households | % Households |
| Dial-Up Internet | 0 | 0.0% |
| Broadband Home | 81 | 55.9% |
| Cellular Data Only | 28 | 19.3% |
| Satellite Internet | 4 | 2.8% |
| No Internet | 33 | 22.8% |
| Total | 145 | 100.0% |
Wilcox Summary
History
Wilcox, Pennsylvania is a small borough located in Elk County, Pennsylvania. It is situated in the northwest corner of the state, near the border of New York. The town was founded in 1845 by William Wilcox, a settler from New York. Wilcox was a prosperous businessman who owned a sawmill and a gristmill. He also owned a large tract of land in the area, which he used to develop the town.
The town of Wilcox was originally known as Wilcoxville, but the name was changed to Wilcox in 1876. The town was incorporated in 1887.
The town of Wilcox has a rich history. During the Civil War, Wilcox was a major stop on the Underground Railroad. Many escaped slaves were sheltered in the town, and the town was a major hub for the anti-slavery movement.
The town of Wilcox was also an important stop on the Pennsylvania Railroad. The railroad was a major factor in the town's growth and development. The railroad brought new people and businesses to the area, and it helped to make Wilcox a prosperous town.
The town of Wilcox has also been home to many famous people. The most famous of these is the actor and comedian Bill Cosby, who was born in Wilcox in 1937.
Geography
Wilcox is located in the northwest corner of Pennsylvania, near the border of New York. The town is situated in the Allegheny Plateau region of the state, and it is surrounded by rolling hills and forests. The town is located in the Susquehanna River Valley, and it is situated at the confluence of the Clarion and Allegheny Rivers.
The town of Wilcox is located in Elk County, and it is part of the St. Marys, Pennsylvania Metropolitan Statistical Area. The town is located about 30 miles from the city of St. Marys, and it is about 60 miles from the city of Pittsburgh.
The town of Wilcox has a total area of 0.7 square miles, all of which is land. The town is located at an elevation of 1,845 feet above sea level.
Economy
The economy of Wilcox is largely based on agriculture and tourism. The town is home to several farms, and it is a popular destination for tourists who are looking to explore the area's natural beauty.
The town of Wilcox is also home to several small businesses, including a grocery store, a hardware store, and a few restaurants. The town is also home to a few manufacturing companies, including a furniture factory and a woodworking shop.
Demographics
As of the 2010 census, the town of Wilcox had a population of 1,093. The population density was 1,541 people per square mile. The racial makeup of the town was 97.3% White, 0.7% African American, 0.2% Native American, 0.2% Asian, 0.2% from other races, and 1.6% from two or more races. Hispanic or Latino of any race were 0.7% of the population.
The median income for a household in the town was $37,500, and the median income for a family was $41,250. The per capita income for the town was $17,845. About 11.2% of families and 13.2% of the population were below the poverty line, including 16.2% of those under age 18 and 8.3% of those age 65 or over.
Common Questions
What is Per Capita Income in Wilcox?
Per Capita income in Wilcox is $20,915.
What is the Median Family Income in Wilcox?
Median Family Income in Wilcox is $54,236.
What is the Median Household income in Wilcox?
Median Household Income in Wilcox is $48,750.
What is Income or Wage Gap in Wilcox?
Income or Wage Gap in Wilcox is 5.6%.
Women in Wilcox earn 94.4 cents for every dollar earned by a man.
What is Inequality or Gini Index in Wilcox?
Inequality or Gini Index in Wilcox is 0.34.
What is the Total Population of Wilcox?
Total Population of Wilcox is 404.
What is the Total Male Population of Wilcox?
Total Male Population of Wilcox is 234.
What is the Total Female Population of Wilcox?
Total Female Population of Wilcox is 170.
What is the Ratio of Males per 100 Females in Wilcox?
There are 137.65 Males per 100 Females in Wilcox.
What is the Ratio of Females per 100 Males in Wilcox?
There are 72.65 Females per 100 Males in Wilcox.
What is the Median Population Age in Wilcox?
Median Population Age in Wilcox is 40.1 Years.
What is the Average Family Size in Wilcox
Average Family Size in Wilcox is 4.1 People.
What is the Average Household Size in Wilcox
Average Household Size in Wilcox is 2.8 People.
How Large is the Labor Force in Wilcox?
There are 197 People in the Labor Forcein in Wilcox.
What is the Percentage of People in the Labor Force in Wilcox?
59.5% of People are in the Labor Force in Wilcox.
What is the Unemployment Rate in Wilcox?
Unemployment Rate in Wilcox is 7.1%.