West Ocean City, MD Map & Demographics
West Ocean City Map
West Ocean City Overview
$64,548
PER CAPITA INCOME
$113,221
AVG FAMILY INCOME
$87,828
AVG HOUSEHOLD INCOME
30.7%
WAGE / INCOME GAP [ % ]
69.3¢/ $1
WAGE / INCOME GAP [ $ ]
0.54
INEQUALITY / GINI INDEX
5,246
TOTAL POPULATION
2,699
MALE POPULATION
2,547
FEMALE POPULATION
105.97
MALES / 100 FEMALES
94.37
FEMALES / 100 MALES
46.3
MEDIAN AGE
2.9
AVG FAMILY SIZE
2.3
AVG HOUSEHOLD SIZE
2,985
LABOR FORCE [ PEOPLE ]
70.2%
PERCENT IN LABOR FORCE
10.0%
UNEMPLOYMENT RATE
Income in West Ocean City
Income Overview in West Ocean City
Per Capita Income in West Ocean City is $64,548, while median incomes of families and households are $113,221 and $87,828 respectively.
| Characteristic | Number | Measure |
| Per Capita Income | 5,246 | $64,548 |
| Median Family Income | 1,333 | $113,221 |
| Mean Family Income | 1,333 | $156,702 |
| Median Household Income | 2,266 | $87,828 |
| Mean Household Income | 2,266 | $149,856 |
| Income Deficit | 1,333 | $0 |
| Wage / Income Gap (%) | 5,246 | 30.70% |
| Wage / Income Gap ($) | 5,246 | 69.30¢ per $1 |
| Gini / Inequality Index | 5,246 | 0.54 |
Earnings by Sex in West Ocean City
Average Earnings in West Ocean City are $41,717, $51,461 for men and $35,660 for women, a difference of 30.7%.
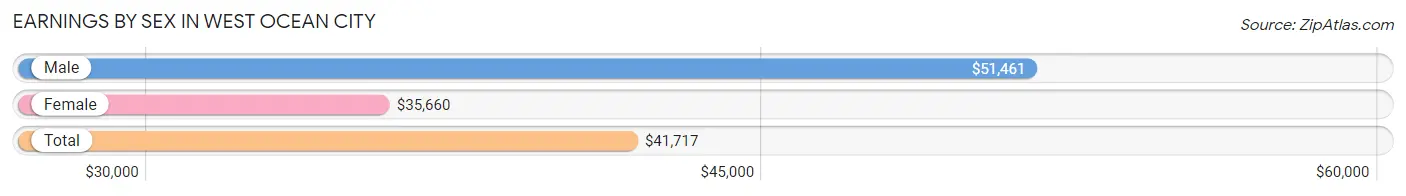
| Sex | Number | Average Earnings |
| Male | 1,693 (54.3%) | $51,461 |
| Female | 1,426 (45.7%) | $35,660 |
| Total | 3,119 (100.0%) | $41,717 |
Earnings by Sex by Income Bracket in West Ocean City
The most common earnings brackets in West Ocean City are $100,000+ for men (306 | 18.1%) and $30,000 to $34,999 for women (212 | 14.9%).
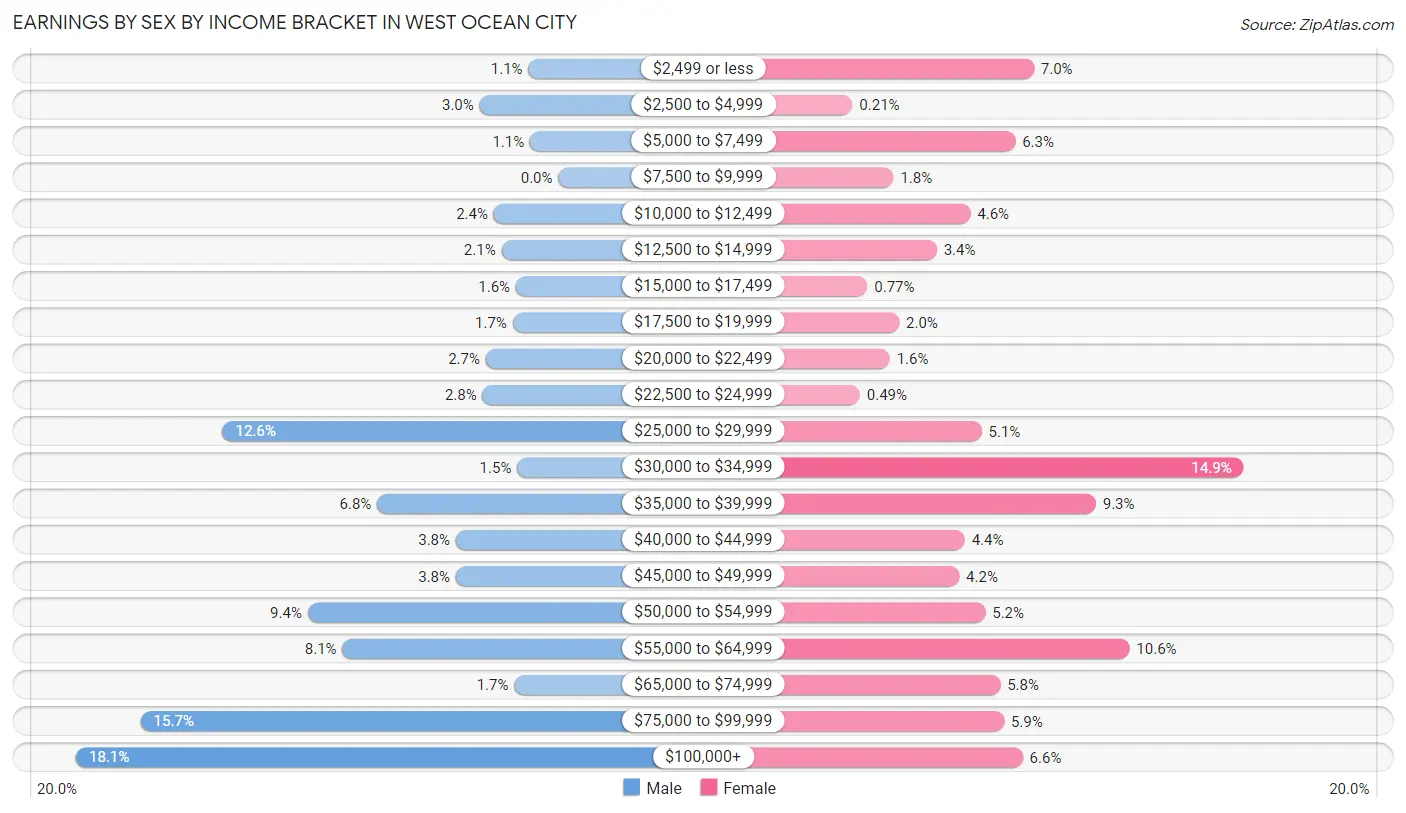
| Income | Male | Female |
| $2,499 or less | 19 (1.1%) | 100 (7.0%) |
| $2,500 to $4,999 | 50 (2.9%) | 3 (0.2%) |
| $5,000 to $7,499 | 18 (1.1%) | 90 (6.3%) |
| $7,500 to $9,999 | 0 (0.0%) | 25 (1.8%) |
| $10,000 to $12,499 | 41 (2.4%) | 66 (4.6%) |
| $12,500 to $14,999 | 36 (2.1%) | 48 (3.4%) |
| $15,000 to $17,499 | 27 (1.6%) | 11 (0.8%) |
| $17,500 to $19,999 | 29 (1.7%) | 28 (2.0%) |
| $20,000 to $22,499 | 46 (2.7%) | 23 (1.6%) |
| $22,500 to $24,999 | 48 (2.8%) | 7 (0.5%) |
| $25,000 to $29,999 | 213 (12.6%) | 72 (5.1%) |
| $30,000 to $34,999 | 26 (1.5%) | 212 (14.9%) |
| $35,000 to $39,999 | 115 (6.8%) | 133 (9.3%) |
| $40,000 to $44,999 | 65 (3.8%) | 63 (4.4%) |
| $45,000 to $49,999 | 65 (3.8%) | 60 (4.2%) |
| $50,000 to $54,999 | 159 (9.4%) | 74 (5.2%) |
| $55,000 to $64,999 | 137 (8.1%) | 151 (10.6%) |
| $65,000 to $74,999 | 28 (1.7%) | 82 (5.8%) |
| $75,000 to $99,999 | 265 (15.7%) | 84 (5.9%) |
| $100,000+ | 306 (18.1%) | 94 (6.6%) |
| Total | 1,693 (100.0%) | 1,426 (100.0%) |
Earnings by Sex by Educational Attainment in West Ocean City
Average earnings in West Ocean City are $53,536 for men and $36,321 for women, a difference of 32.2%. Men with an educational attainment of bachelor's degree enjoy the highest average annual earnings of $79,167, while those with high school diploma education earn the least with $28,589. Women with an educational attainment of bachelor's degree earn the most with the average annual earnings of $56,272, while those with high school diploma education have the smallest earnings of $30,625.
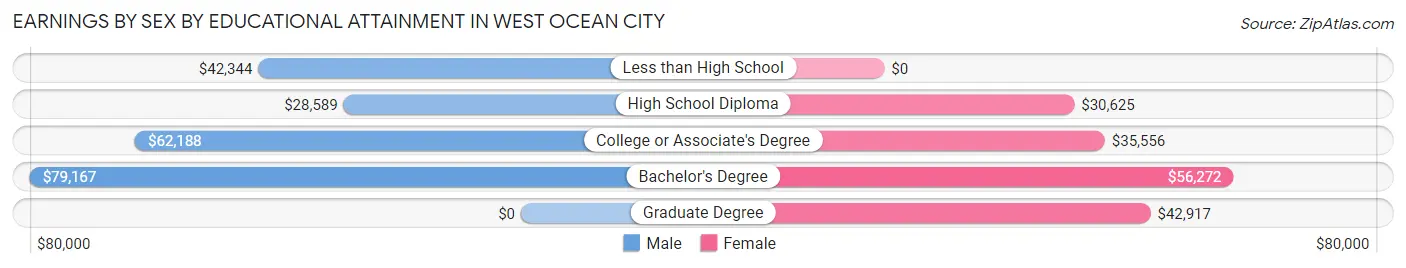
| Educational Attainment | Male Income | Female Income |
| Less than High School | $42,344 | $0 |
| High School Diploma | $28,589 | $30,625 |
| College or Associate's Degree | $62,188 | $35,556 |
| Bachelor's Degree | $79,167 | $56,272 |
| Graduate Degree | - | - |
| Total | $53,536 | $36,321 |
Family Income in West Ocean City
Family Income Brackets in West Ocean City
According to the West Ocean City family income data, there are 341 families falling into the $100,000 to $149,999 income range, which is the most common income bracket and makes up 25.6% of all families. Conversely, the less than $10,000 income bracket is the least frequent group with only 7 families (0.5%) belonging to this category.
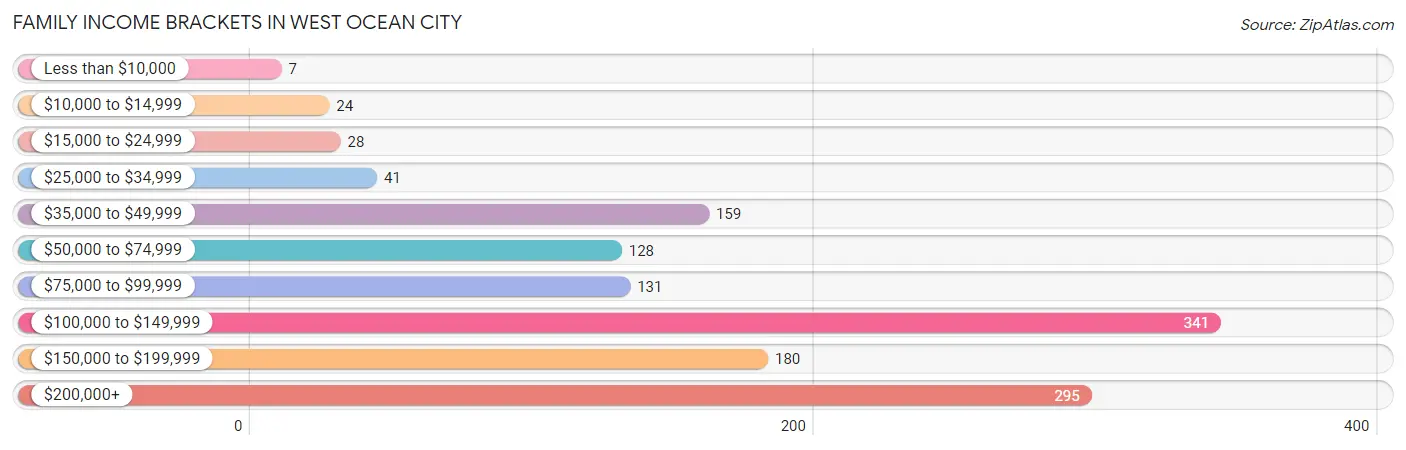
| Income Bracket | # Families | % Families |
| Less than $10,000 | 7 | 0.5% |
| $10,000 to $14,999 | 24 | 1.8% |
| $15,000 to $24,999 | 28 | 2.1% |
| $25,000 to $34,999 | 41 | 3.1% |
| $35,000 to $49,999 | 159 | 11.9% |
| $50,000 to $74,999 | 128 | 9.6% |
| $75,000 to $99,999 | 131 | 9.8% |
| $100,000 to $149,999 | 341 | 25.6% |
| $150,000 to $199,999 | 180 | 13.5% |
| $200,000+ | 295 | 22.1% |
Family Income by Famaliy Size in West Ocean City
3-person families (361 | 27.1%) account for the highest median family income in West Ocean City with $153,828 per family, while 3-person families (361 | 27.1%) have the highest median income of $51,276 per family member.
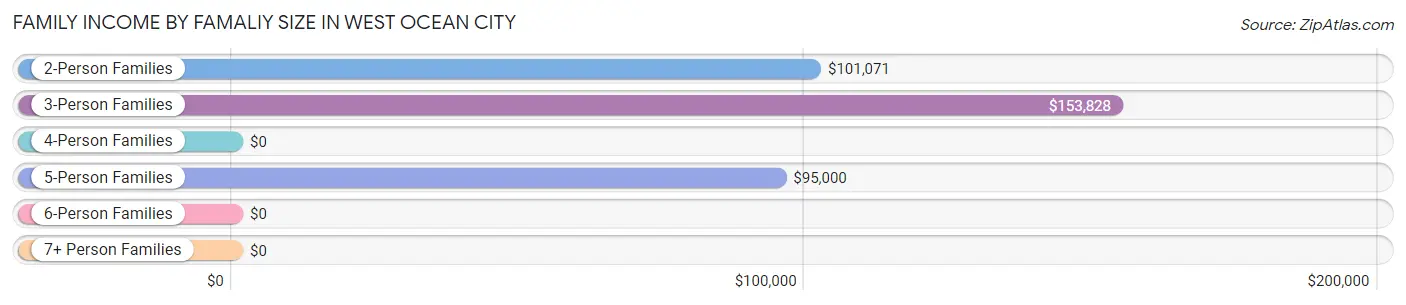
| Income Bracket | # Families | Median Income |
| 2-Person Families | 670 (50.3%) | $101,071 |
| 3-Person Families | 361 (27.1%) | $153,828 |
| 4-Person Families | 150 (11.3%) | $0 |
| 5-Person Families | 134 (10.1%) | $95,000 |
| 6-Person Families | 0 (0.0%) | $0 |
| 7+ Person Families | 18 (1.3%) | $0 |
| Total | 1,333 (100.0%) | $113,221 |
Family Income by Number of Earners in West Ocean City
The median family income in West Ocean City is $113,221, with families comprising 2 earners (599) having the highest median family income of $140,156, while families with 1 earner (414) have the lowest median family income of $49,833, accounting for 44.9% and 31.1% of families, respectively.
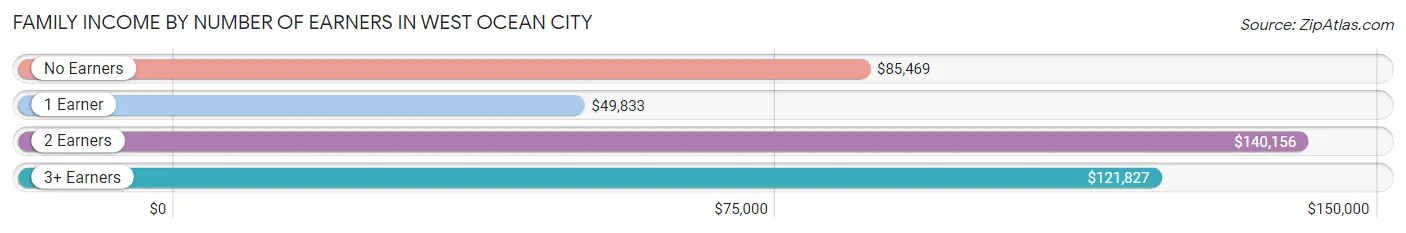
| Number of Earners | # Families | Median Income |
| No Earners | 149 (11.2%) | $85,469 |
| 1 Earner | 414 (31.1%) | $49,833 |
| 2 Earners | 599 (44.9%) | $140,156 |
| 3+ Earners | 171 (12.8%) | $121,827 |
| Total | 1,333 (100.0%) | $113,221 |
Household Income in West Ocean City
Household Income Brackets in West Ocean City
With 442 households falling in the category, the $200,000+ income range is the most frequent in West Ocean City, accounting for 19.5% of all households. In contrast, only 14 households (0.6%) fall into the less than $10,000 income bracket, making it the least populous group.
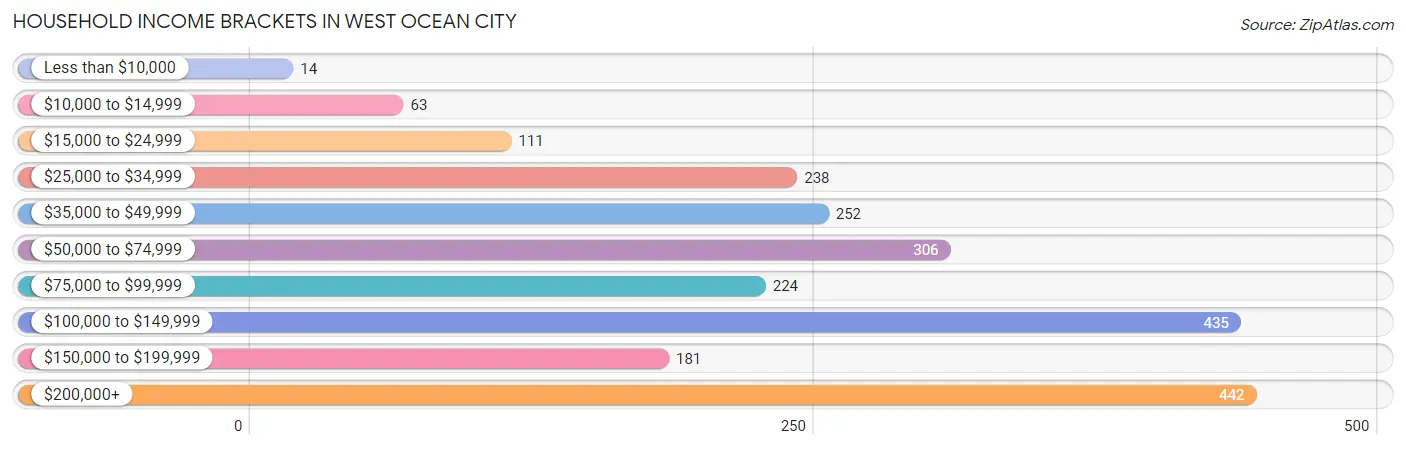
| Income Bracket | # Households | % Households |
| Less than $10,000 | 14 | 0.6% |
| $10,000 to $14,999 | 63 | 2.8% |
| $15,000 to $24,999 | 111 | 4.9% |
| $25,000 to $34,999 | 238 | 10.5% |
| $35,000 to $49,999 | 252 | 11.1% |
| $50,000 to $74,999 | 306 | 13.5% |
| $75,000 to $99,999 | 224 | 9.9% |
| $100,000 to $149,999 | 435 | 19.2% |
| $150,000 to $199,999 | 181 | 8.0% |
| $200,000+ | 442 | 19.5% |
Household Income by Householder Age in West Ocean City
The median household income in West Ocean City is $87,828, with the highest median household income of $105,469 found in the 25 to 44 years age bracket for the primary householder. A total of 613 households (27.1%) fall into this category. Meanwhile, the 15 to 24 years age bracket for the primary householder has the lowest median household income of $0, with 28 households (1.2%) in this group.
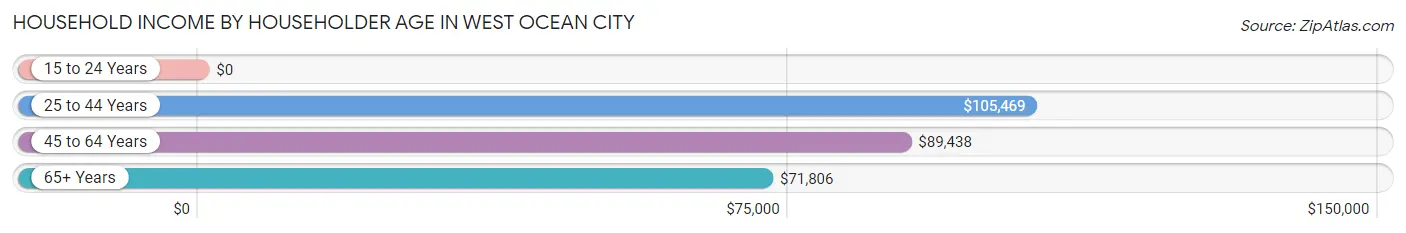
| Income Bracket | # Households | Median Income |
| 15 to 24 Years | 28 (1.2%) | $0 |
| 25 to 44 Years | 613 (27.1%) | $105,469 |
| 45 to 64 Years | 878 (38.8%) | $89,438 |
| 65+ Years | 747 (33.0%) | $71,806 |
| Total | 2,266 (100.0%) | $87,828 |
Poverty in West Ocean City
Income Below Poverty by Sex and Age in West Ocean City
With 10.7% poverty level for males and 8.6% for females among the residents of West Ocean City, 5 year old males and under 5 year old females are the most vulnerable to poverty, with 14 males (63.6%) and 35 females (32.7%) in their respective age groups living below the poverty level.
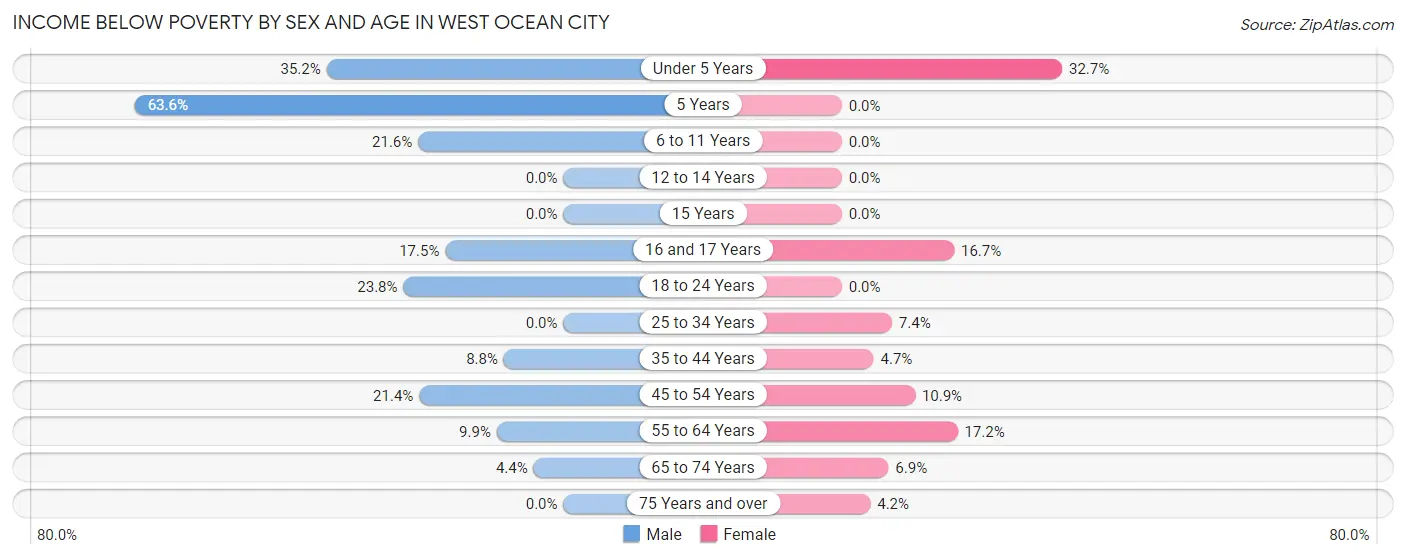
| Age Bracket | Male | Female |
| Under 5 Years | 45 (35.2%) | 35 (32.7%) |
| 5 Years | 14 (63.6%) | 0 (0.0%) |
| 6 to 11 Years | 22 (21.6%) | 0 (0.0%) |
| 12 to 14 Years | 0 (0.0%) | 0 (0.0%) |
| 15 Years | 0 (0.0%) | 0 (0.0%) |
| 16 and 17 Years | 10 (17.5%) | 7 (16.7%) |
| 18 to 24 Years | 24 (23.8%) | 0 (0.0%) |
| 25 to 34 Years | 0 (0.0%) | 18 (7.4%) |
| 35 to 44 Years | 26 (8.8%) | 17 (4.7%) |
| 45 to 54 Years | 85 (21.4%) | 33 (10.9%) |
| 55 to 64 Years | 52 (9.9%) | 78 (17.2%) |
| 65 to 74 Years | 12 (4.4%) | 24 (6.9%) |
| 75 Years and over | 0 (0.0%) | 8 (4.2%) |
| Total | 290 (10.7%) | 220 (8.6%) |
Income Above Poverty by Sex and Age in West Ocean City
According to the poverty statistics in West Ocean City, males aged 12 to 14 years and females aged 5 years are the age groups that are most secure financially, with 100.0% of males and 100.0% of females in these age groups living above the poverty line.
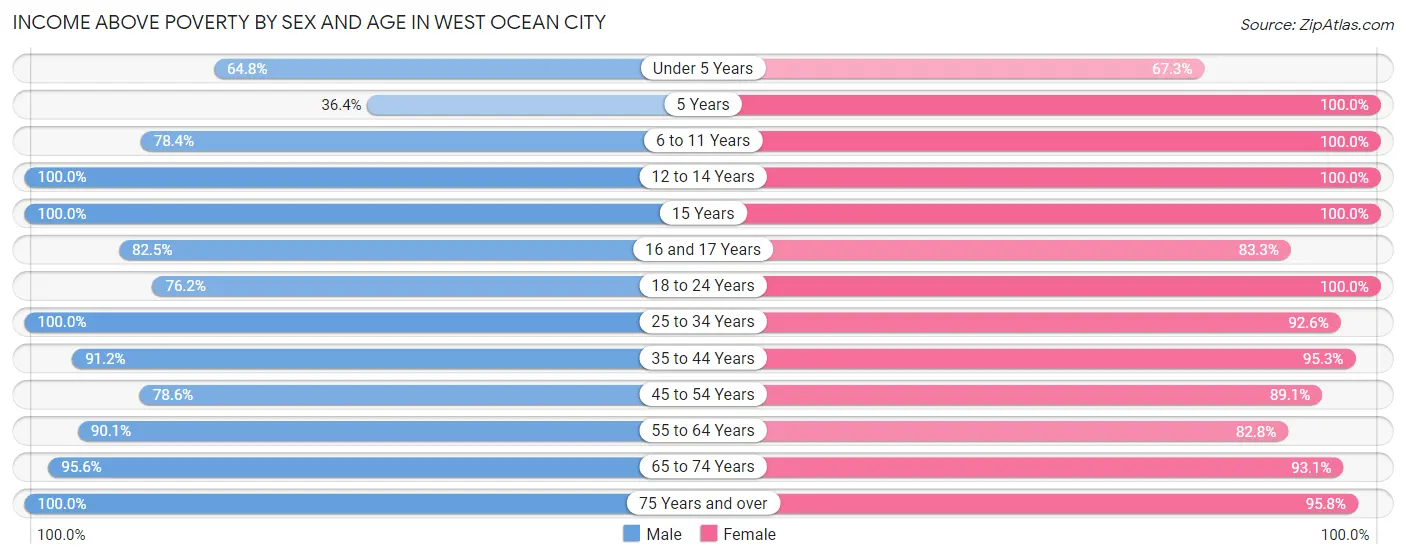
| Age Bracket | Male | Female |
| Under 5 Years | 83 (64.8%) | 72 (67.3%) |
| 5 Years | 8 (36.4%) | 38 (100.0%) |
| 6 to 11 Years | 80 (78.4%) | 146 (100.0%) |
| 12 to 14 Years | 175 (100.0%) | 174 (100.0%) |
| 15 Years | 41 (100.0%) | 61 (100.0%) |
| 16 and 17 Years | 47 (82.5%) | 35 (83.3%) |
| 18 to 24 Years | 77 (76.2%) | 80 (100.0%) |
| 25 to 34 Years | 341 (100.0%) | 224 (92.6%) |
| 35 to 44 Years | 268 (91.2%) | 343 (95.3%) |
| 45 to 54 Years | 312 (78.6%) | 271 (89.1%) |
| 55 to 64 Years | 474 (90.1%) | 376 (82.8%) |
| 65 to 74 Years | 259 (95.6%) | 323 (93.1%) |
| 75 Years and over | 244 (100.0%) | 181 (95.8%) |
| Total | 2,409 (89.3%) | 2,324 (91.3%) |
Income Below Poverty Among Married-Couple Families in West Ocean City
The poverty statistics for married-couple families in West Ocean City show that 5.8% or 59 of the total 1,016 families live below the poverty line. Families with 1 or 2 children have the highest poverty rate of 21.5%, comprising of 52 families. On the other hand, families with 3 or 4 children have the lowest poverty rate of 0.0%, which includes 0 families.
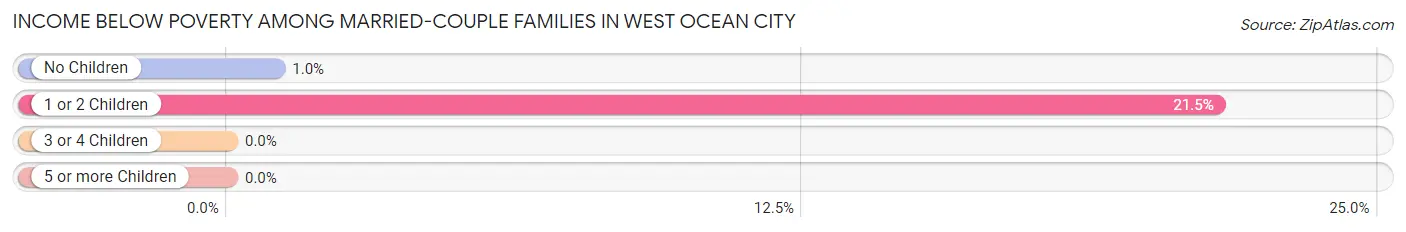
| Children | Above Poverty | Below Poverty |
| No Children | 673 (99.0%) | 7 (1.0%) |
| 1 or 2 Children | 190 (78.5%) | 52 (21.5%) |
| 3 or 4 Children | 76 (100.0%) | 0 (0.0%) |
| 5 or more Children | 18 (100.0%) | 0 (0.0%) |
| Total | 957 (94.2%) | 59 (5.8%) |
Income Below Poverty Among Single-Parent Households in West Ocean City
According to the poverty data in West Ocean City, 2.7% or 4 single-father households and 3.6% or 6 single-mother households are living below the poverty line. Among single-father households, those with 1 or 2 children have the highest poverty rate, with 4 households (3.6%) experiencing poverty. Likewise, among single-mother households, those with 3 or 4 children have the highest poverty rate, with 6 households (100.0%) falling below the poverty line.
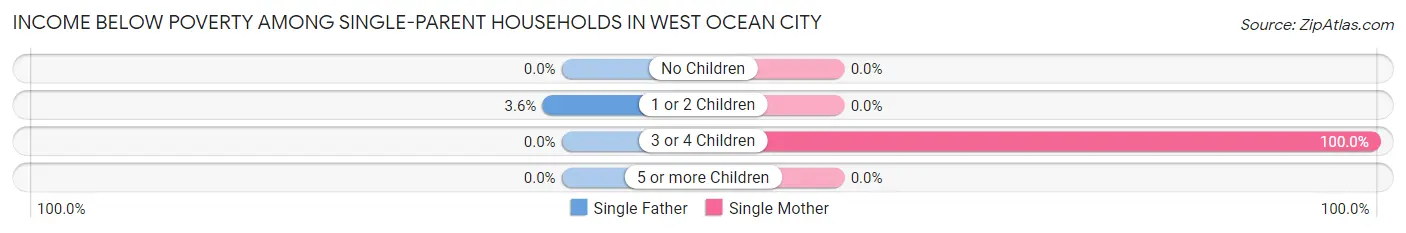
| Children | Single Father | Single Mother |
| No Children | 0 (0.0%) | 0 (0.0%) |
| 1 or 2 Children | 4 (3.6%) | 0 (0.0%) |
| 3 or 4 Children | 0 (0.0%) | 6 (100.0%) |
| 5 or more Children | 0 (0.0%) | 0 (0.0%) |
| Total | 4 (2.7%) | 6 (3.6%) |
Income Below Poverty Among Married-Couple vs Single-Parent Households in West Ocean City
The poverty data for West Ocean City shows that 59 of the married-couple family households (5.8%) and 10 of the single-parent households (3.2%) are living below the poverty level. Within the married-couple family households, those with 1 or 2 children have the highest poverty rate, with 52 households (21.5%) falling below the poverty line. Among the single-parent households, those with 3 or 4 children have the highest poverty rate, with 6 household (100.0%) living below poverty.
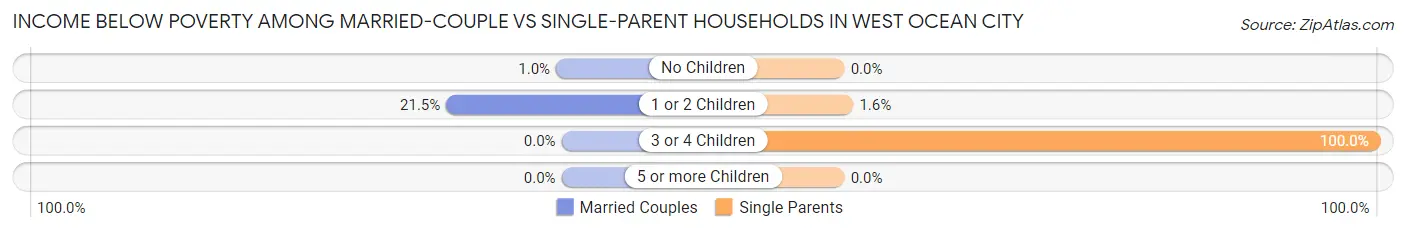
| Children | Married-Couple Families | Single-Parent Households |
| No Children | 7 (1.0%) | 0 (0.0%) |
| 1 or 2 Children | 52 (21.5%) | 4 (1.6%) |
| 3 or 4 Children | 0 (0.0%) | 6 (100.0%) |
| 5 or more Children | 0 (0.0%) | 0 (0.0%) |
| Total | 59 (5.8%) | 10 (3.2%) |
Race in West Ocean City
The most populous races in West Ocean City are White / Caucasian (4,515 | 86.1%), Black / African American (330 | 6.3%), and Two or more Races (283 | 5.4%).
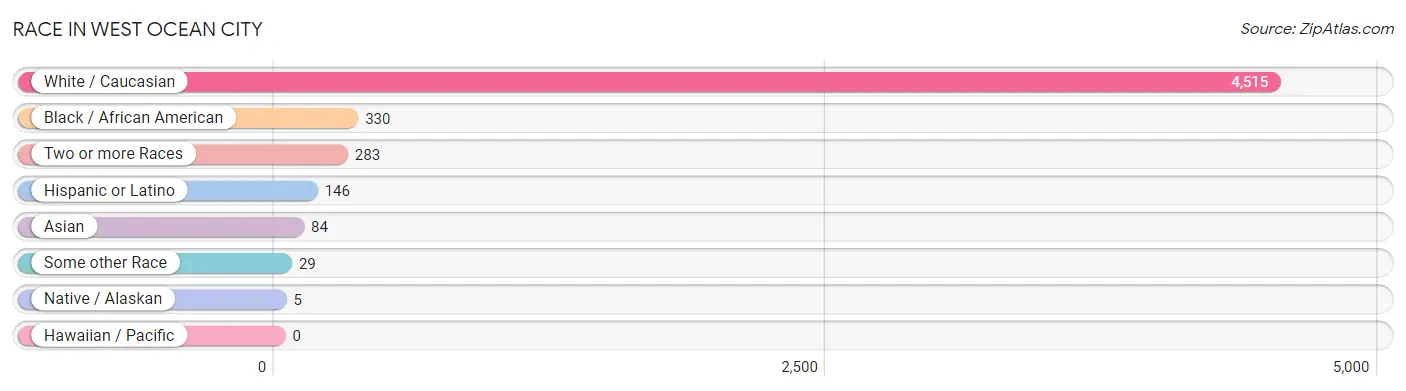
| Race | # Population | % Population |
| Asian | 84 | 1.6% |
| Black / African American | 330 | 6.3% |
| Hawaiian / Pacific | 0 | 0.0% |
| Hispanic or Latino | 146 | 2.8% |
| Native / Alaskan | 5 | 0.1% |
| White / Caucasian | 4,515 | 86.1% |
| Two or more Races | 283 | 5.4% |
| Some other Race | 29 | 0.5% |
| Total | 5,246 | 100.0% |
Ancestry in West Ocean City
The most populous ancestries reported in West Ocean City are Irish (1,417 | 27.0%), German (1,148 | 21.9%), English (959 | 18.3%), Italian (558 | 10.6%), and Polish (268 | 5.1%), together accounting for 82.9% of all West Ocean City residents.
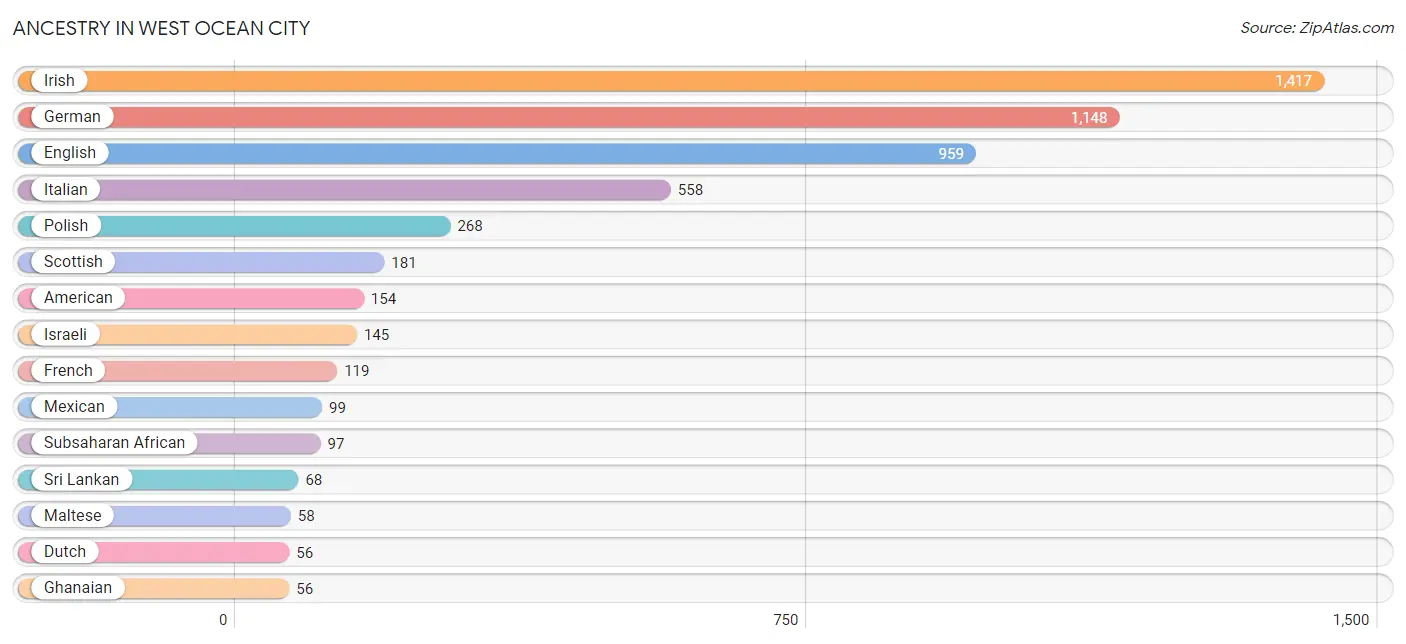
| Ancestry | # Population | % Population |
| African | 26 | 0.5% |
| American | 154 | 2.9% |
| Belgian | 8 | 0.2% |
| Cape Verdean | 15 | 0.3% |
| Central American | 1 | 0.0% |
| Costa Rican | 1 | 0.0% |
| Czech | 26 | 0.5% |
| Czechoslovakian | 5 | 0.1% |
| Dutch | 56 | 1.1% |
| Eastern European | 6 | 0.1% |
| English | 959 | 18.3% |
| French | 119 | 2.3% |
| French Canadian | 13 | 0.3% |
| German | 1,148 | 21.9% |
| Ghanaian | 56 | 1.1% |
| Greek | 31 | 0.6% |
| Hungarian | 46 | 0.9% |
| Indian (Asian) | 15 | 0.3% |
| Irish | 1,417 | 27.0% |
| Israeli | 145 | 2.8% |
| Italian | 558 | 10.6% |
| Korean | 1 | 0.0% |
| Latvian | 11 | 0.2% |
| Lithuanian | 42 | 0.8% |
| Maltese | 58 | 1.1% |
| Mexican | 99 | 1.9% |
| Northern European | 5 | 0.1% |
| Norwegian | 31 | 0.6% |
| Pennsylvania German | 28 | 0.5% |
| Polish | 268 | 5.1% |
| Puerto Rican | 23 | 0.4% |
| Romanian | 18 | 0.3% |
| Russian | 18 | 0.3% |
| Scotch-Irish | 33 | 0.6% |
| Scottish | 181 | 3.5% |
| Sioux | 4 | 0.1% |
| Slavic | 8 | 0.2% |
| Slovak | 22 | 0.4% |
| Spanish | 23 | 0.4% |
| Sri Lankan | 68 | 1.3% |
| Subsaharan African | 97 | 1.8% |
| Swedish | 19 | 0.4% |
| Turkish | 51 | 1.0% |
| Ukrainian | 7 | 0.1% |
| Welsh | 12 | 0.2% | View All 45 Rows |
Immigrants in West Ocean City
The most numerous immigrant groups reported in West Ocean City came from Asia (184 | 3.5%), Western Asia (147 | 2.8%), Israel (112 | 2.1%), South Eastern Asia (37 | 0.7%), and Vietnam (36 | 0.7%), together accounting for 9.8% of all West Ocean City residents.
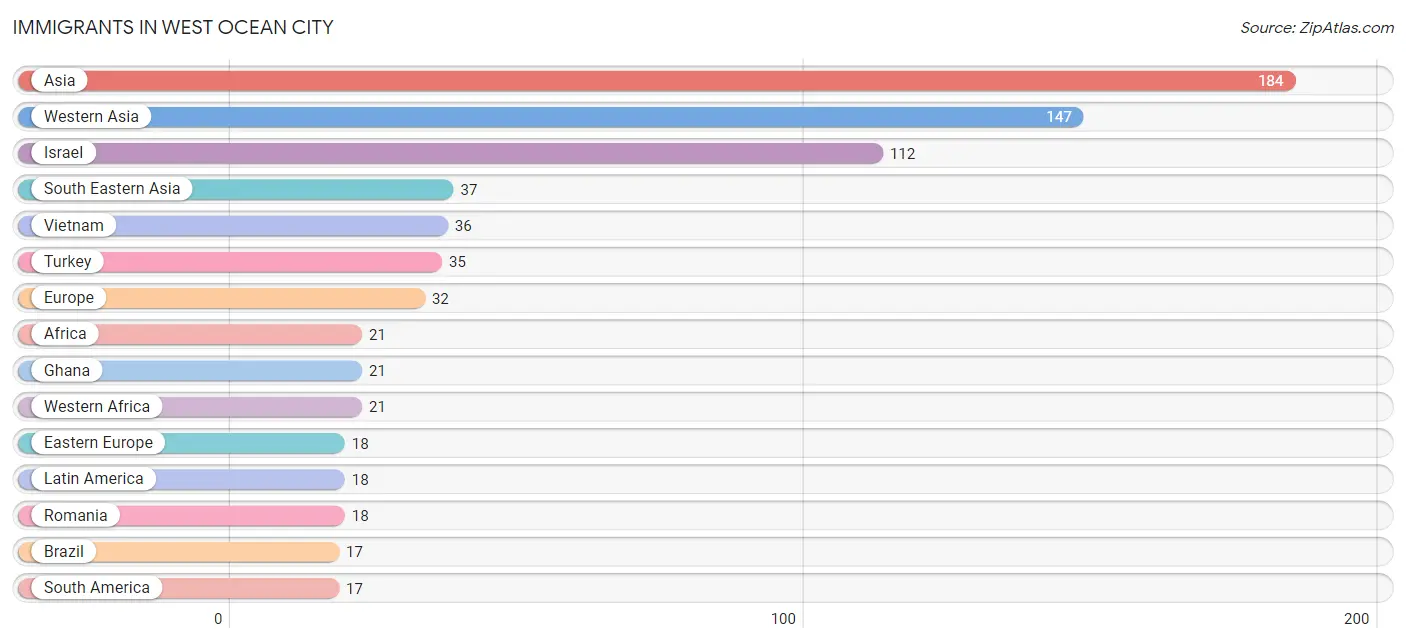
| Immigration Origin | # Population | % Population |
| Africa | 21 | 0.4% |
| Asia | 184 | 3.5% |
| Brazil | 17 | 0.3% |
| Central America | 1 | 0.0% |
| Costa Rica | 1 | 0.0% |
| Eastern Europe | 18 | 0.3% |
| Europe | 32 | 0.6% |
| Ghana | 21 | 0.4% |
| Ireland | 14 | 0.3% |
| Israel | 112 | 2.1% |
| Latin America | 18 | 0.3% |
| Northern Europe | 14 | 0.3% |
| Philippines | 1 | 0.0% |
| Romania | 18 | 0.3% |
| South America | 17 | 0.3% |
| South Eastern Asia | 37 | 0.7% |
| Turkey | 35 | 0.7% |
| Vietnam | 36 | 0.7% |
| Western Africa | 21 | 0.4% |
| Western Asia | 147 | 2.8% | View All 20 Rows |
Sex and Age in West Ocean City
Sex and Age in West Ocean City
The most populous age groups in West Ocean City are 60 to 64 Years (316 | 11.7%) for men and 55 to 59 Years (309 | 12.1%) for women.
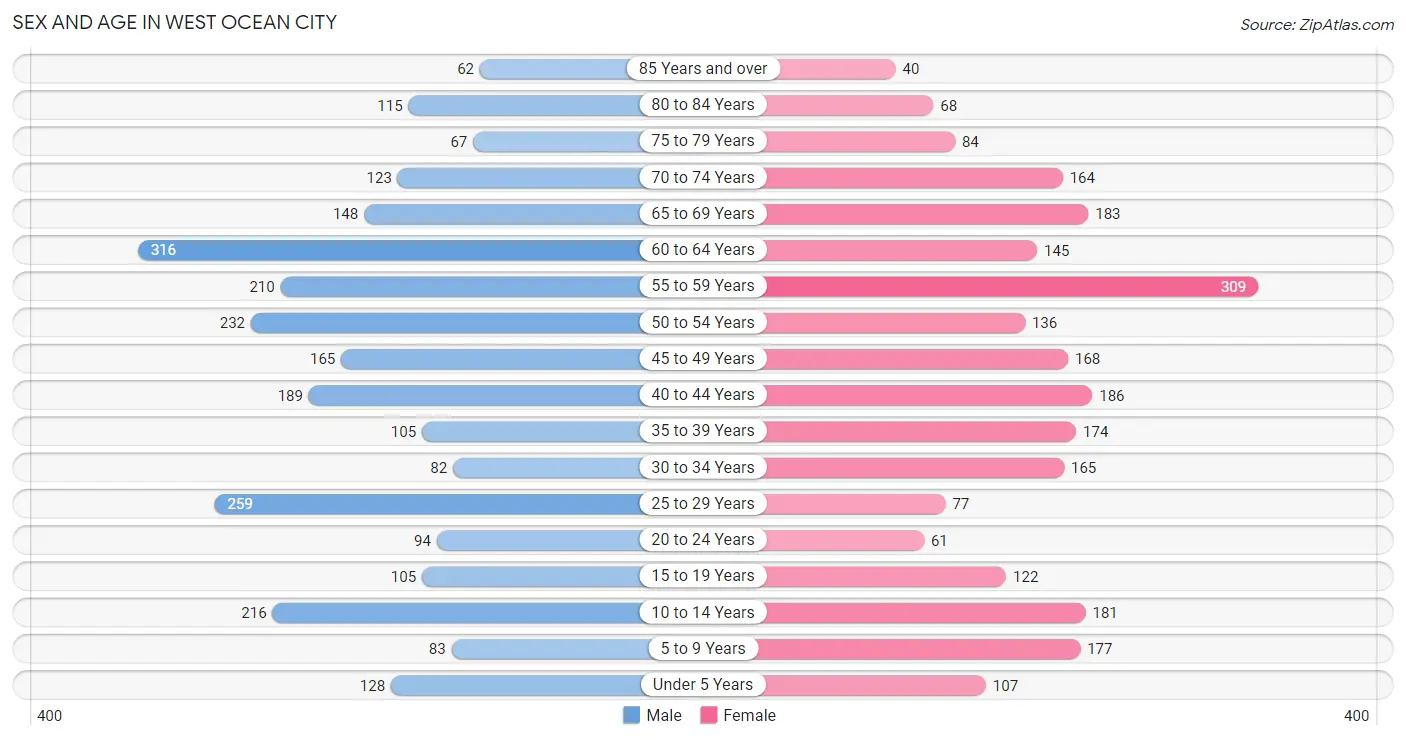
| Age Bracket | Male | Female |
| Under 5 Years | 128 (4.7%) | 107 (4.2%) |
| 5 to 9 Years | 83 (3.1%) | 177 (7.0%) |
| 10 to 14 Years | 216 (8.0%) | 181 (7.1%) |
| 15 to 19 Years | 105 (3.9%) | 122 (4.8%) |
| 20 to 24 Years | 94 (3.5%) | 61 (2.4%) |
| 25 to 29 Years | 259 (9.6%) | 77 (3.0%) |
| 30 to 34 Years | 82 (3.0%) | 165 (6.5%) |
| 35 to 39 Years | 105 (3.9%) | 174 (6.8%) |
| 40 to 44 Years | 189 (7.0%) | 186 (7.3%) |
| 45 to 49 Years | 165 (6.1%) | 168 (6.6%) |
| 50 to 54 Years | 232 (8.6%) | 136 (5.3%) |
| 55 to 59 Years | 210 (7.8%) | 309 (12.1%) |
| 60 to 64 Years | 316 (11.7%) | 145 (5.7%) |
| 65 to 69 Years | 148 (5.5%) | 183 (7.2%) |
| 70 to 74 Years | 123 (4.6%) | 164 (6.4%) |
| 75 to 79 Years | 67 (2.5%) | 84 (3.3%) |
| 80 to 84 Years | 115 (4.3%) | 68 (2.7%) |
| 85 Years and over | 62 (2.3%) | 40 (1.6%) |
| Total | 2,699 (100.0%) | 2,547 (100.0%) |
Families and Households in West Ocean City
Median Family Size in West Ocean City
The median family size in West Ocean City is 2.88 persons per family, with single male/father families (149 | 11.2%) accounting for the largest median family size of 3.6 persons per family. On the other hand, married-couple families (1,016 | 76.2%) represent the smallest median family size with 2.79 persons per family.
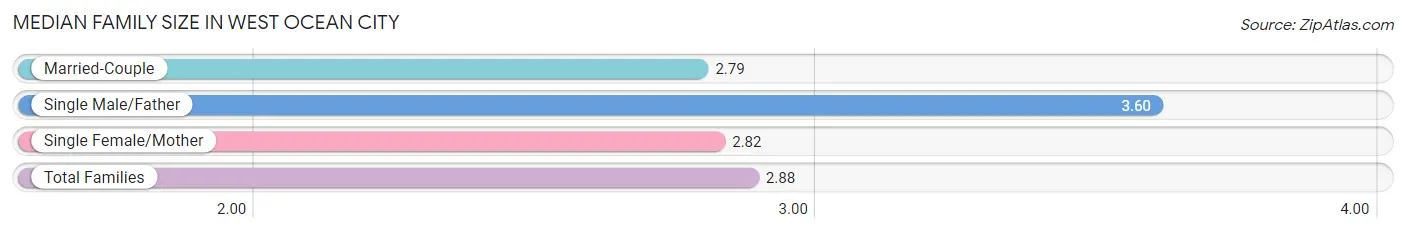
| Family Type | # Families | Family Size |
| Married-Couple | 1,016 (76.2%) | 2.79 |
| Single Male/Father | 149 (11.2%) | 3.60 |
| Single Female/Mother | 168 (12.6%) | 2.82 |
| Total Families | 1,333 (100.0%) | 2.88 |
Median Household Size in West Ocean City
The median household size in West Ocean City is 2.31 persons per household, with single male/father households (149 | 6.6%) accounting for the largest median household size of 3.87 persons per household. non-family households (933 | 41.2%) represent the smallest median household size with 1.39 persons per household.
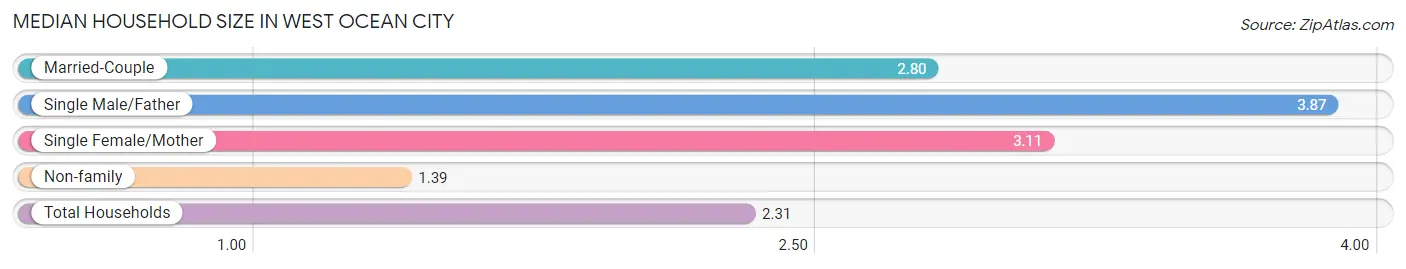
| Household Type | # Households | Household Size |
| Married-Couple | 1,016 (44.8%) | 2.80 |
| Single Male/Father | 149 (6.6%) | 3.87 |
| Single Female/Mother | 168 (7.4%) | 3.11 |
| Non-family | 933 (41.2%) | 1.39 |
| Total Households | 2,266 (100.0%) | 2.31 |
Household Size by Marriage Status in West Ocean City
Out of a total of 2,266 households in West Ocean City, 1,333 (58.8%) are family households, while 933 (41.2%) are nonfamily households. The most numerous type of family households are 2-person households, comprising 670, and the most common type of nonfamily households are 1-person households, comprising 624.
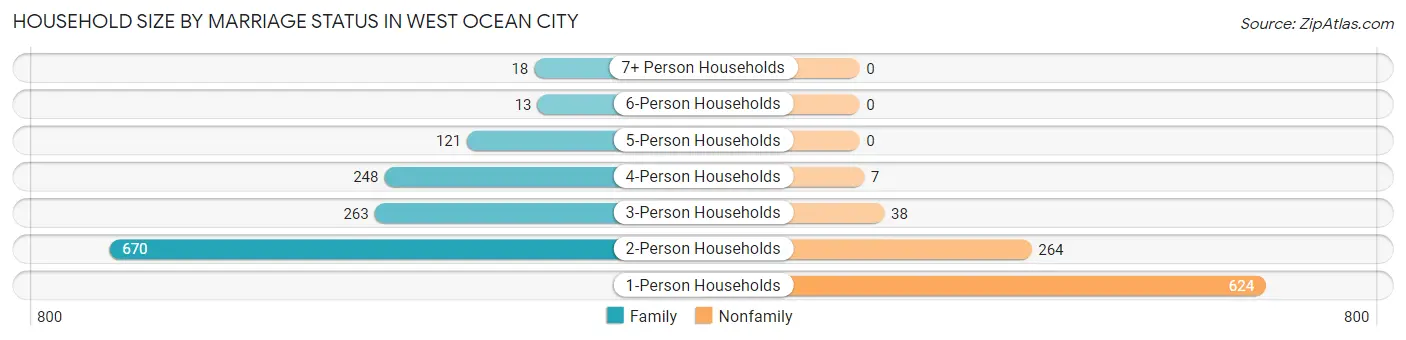
| Household Size | Family Households | Nonfamily Households |
| 1-Person Households | - | 624 (27.5%) |
| 2-Person Households | 670 (29.6%) | 264 (11.7%) |
| 3-Person Households | 263 (11.6%) | 38 (1.7%) |
| 4-Person Households | 248 (10.9%) | 7 (0.3%) |
| 5-Person Households | 121 (5.3%) | 0 (0.0%) |
| 6-Person Households | 13 (0.6%) | 0 (0.0%) |
| 7+ Person Households | 18 (0.8%) | 0 (0.0%) |
| Total | 1,333 (58.8%) | 933 (41.2%) |
Female Fertility in West Ocean City
Fertility by Age in West Ocean City
Average fertility rate in West Ocean City is 66.0 births per 1,000 women. Women in the age bracket of 20 to 34 years have the highest fertility rate with 168.0 births per 1,000 women. Women in the age bracket of 20 to 34 years acount for 80.9% of all women with births.
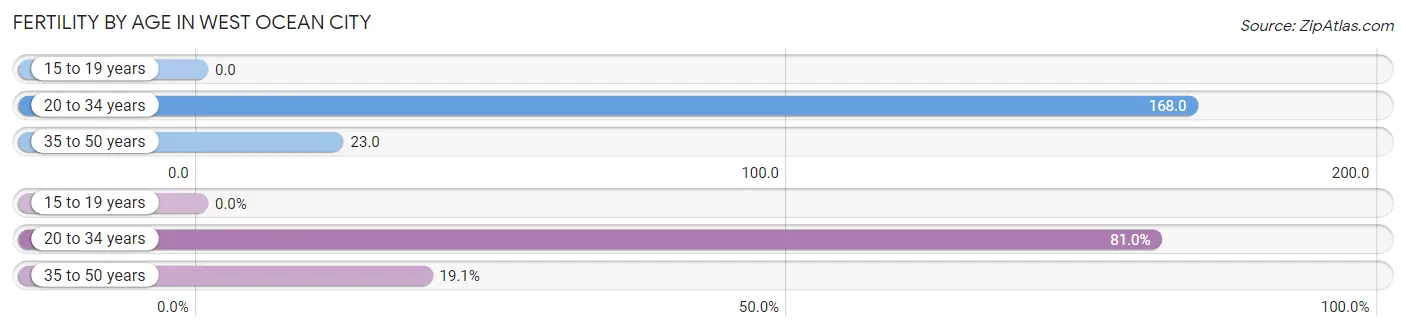
| Age Bracket | Women with Births | Births / 1,000 Women |
| 15 to 19 years | 0 (0.0%) | 0.0 |
| 20 to 34 years | 51 (80.9%) | 168.0 |
| 35 to 50 years | 12 (19.1%) | 23.0 |
| Total | 63 (100.0%) | 66.0 |
Fertility by Age by Marriage Status in West Ocean City
69.8% of women with births (63) in West Ocean City are married. The highest percentage of unmarried women with births falls into 20 to 34 years age bracket with 37.2% of them unmarried at the time of birth, while the lowest percentage of unmarried women with births belong to 35 to 50 years age bracket with 0.0% of them unmarried.
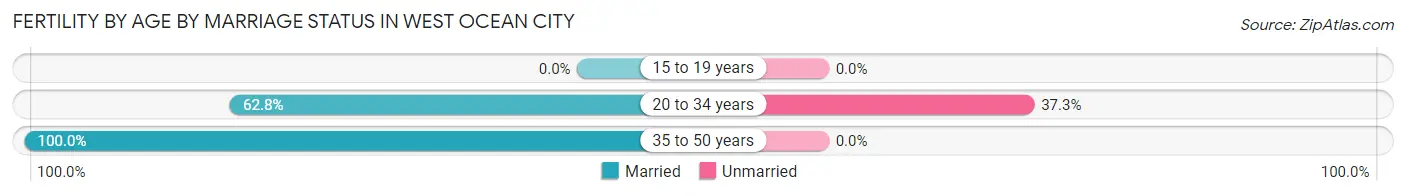
| Age Bracket | Married | Unmarried |
| 15 to 19 years | 0 (0.0%) | 0 (0.0%) |
| 20 to 34 years | 32 (62.7%) | 19 (37.2%) |
| 35 to 50 years | 12 (100.0%) | 0 (0.0%) |
| Total | 44 (69.8%) | 19 (30.2%) |
Fertility by Education in West Ocean City
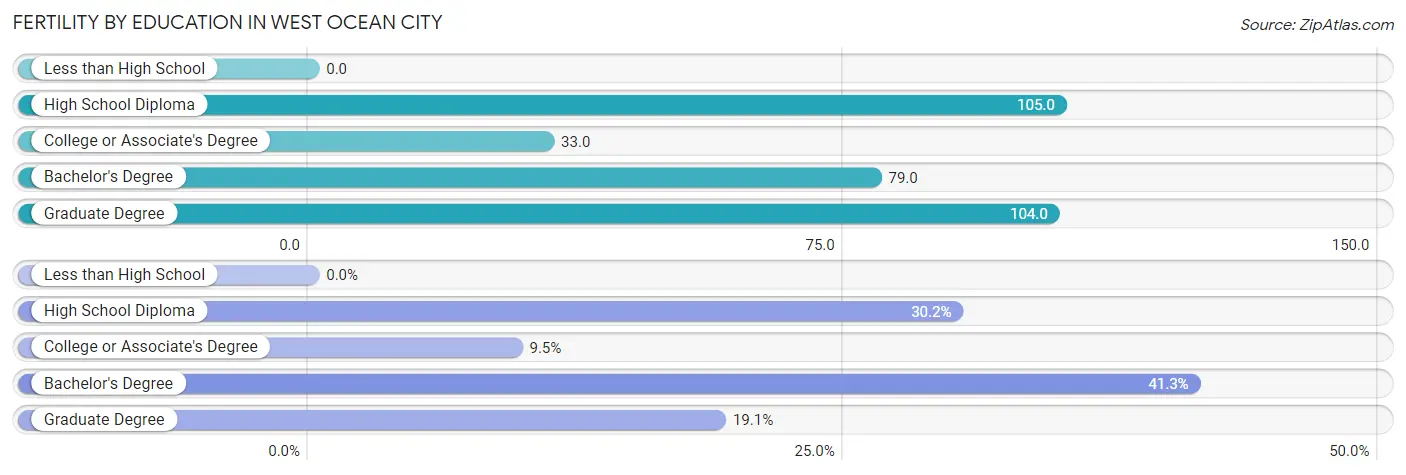
| Educational Attainment | Women with Births | Births / 1,000 Women |
| Less than High School | 0 (0.0%) | 0.0 |
| High School Diploma | 19 (30.2%) | 105.0 |
| College or Associate's Degree | 6 (9.5%) | 33.0 |
| Bachelor's Degree | 26 (41.3%) | 79.0 |
| Graduate Degree | 12 (19.1%) | 104.0 |
| Total | 63 (100.0%) | 66.0 |
Fertility by Education by Marriage Status in West Ocean City
30.2% of women with births in West Ocean City are unmarried. Women with the educational attainment of college or associate's degree are most likely to be married with 100.0% of them married at childbirth, while women with the educational attainment of high school diploma are least likely to be married with 100.0% of them unmarried at childbirth.
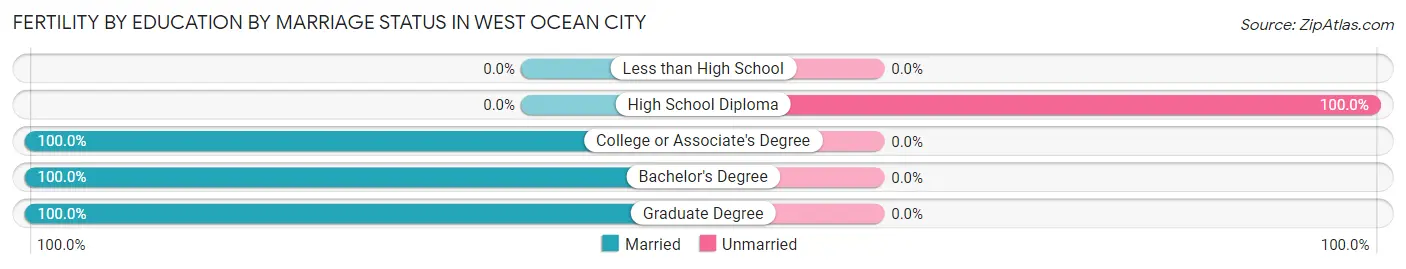
| Educational Attainment | Married | Unmarried |
| Less than High School | 0 (0.0%) | 0 (0.0%) |
| High School Diploma | 0 (0.0%) | 19 (100.0%) |
| College or Associate's Degree | 6 (100.0%) | 0 (0.0%) |
| Bachelor's Degree | 26 (100.0%) | 0 (0.0%) |
| Graduate Degree | 12 (100.0%) | 0 (0.0%) |
| Total | 44 (69.8%) | 19 (30.2%) |
Employment Characteristics in West Ocean City
Employment by Class of Employer in West Ocean City
Among the 2,643 employed individuals in West Ocean City, private company employees (1,521 | 57.6%), local government employees (274 | 10.4%), and self-employed (incorporated) (264 | 10.0%) make up the most common classes of employment.
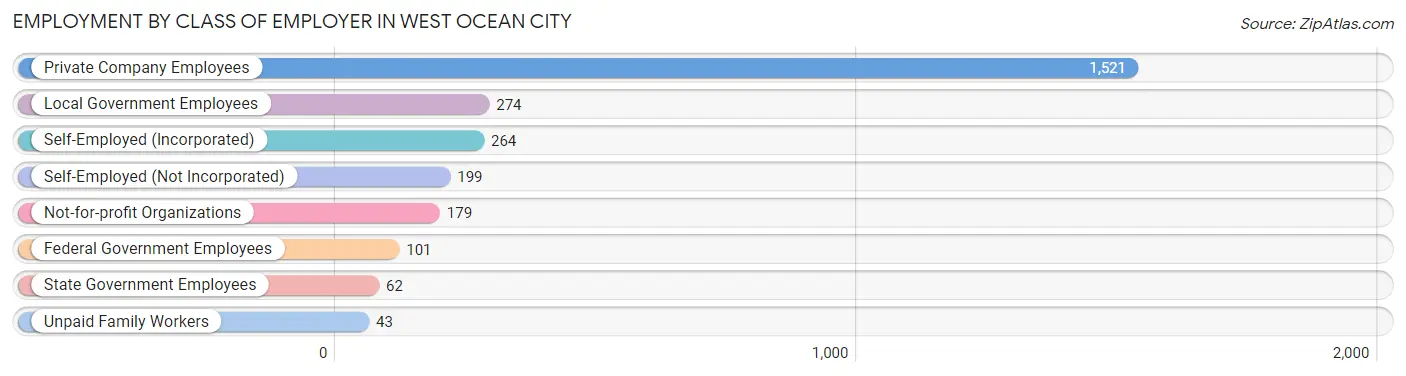
| Employer Class | # Employees | % Employees |
| Private Company Employees | 1,521 | 57.6% |
| Self-Employed (Incorporated) | 264 | 10.0% |
| Self-Employed (Not Incorporated) | 199 | 7.5% |
| Not-for-profit Organizations | 179 | 6.8% |
| Local Government Employees | 274 | 10.4% |
| State Government Employees | 62 | 2.4% |
| Federal Government Employees | 101 | 3.8% |
| Unpaid Family Workers | 43 | 1.6% |
| Total | 2,643 | 100.0% |
Employment Status by Age in West Ocean City
According to the labor force statistics for West Ocean City, out of the total population over 16 years of age (4,252), 70.2% or 2,985 individuals are in the labor force, with 10.0% or 298 of them unemployed. The age group with the highest labor force participation rate is 30 to 34 years, with 96.8% or 239 individuals in the labor force. Within the labor force, the 55 to 59 years age range has the highest percentage of unemployed individuals, with 20.1% or 80 of them being unemployed.
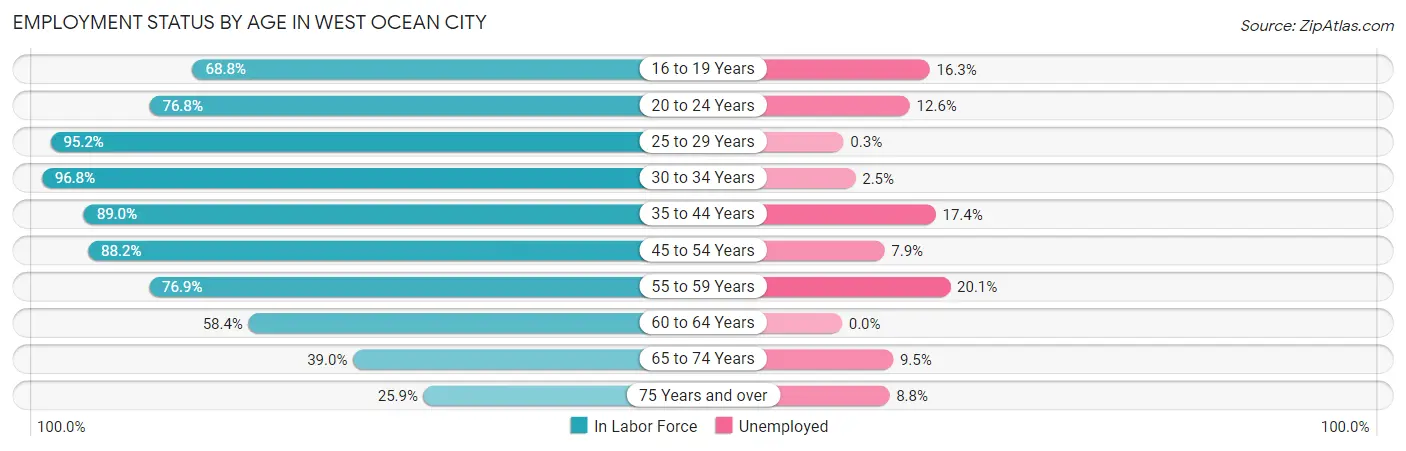
| Age Bracket | In Labor Force | Unemployed |
| 16 to 19 Years | 86 (68.8%) | 14 (16.3%) |
| 20 to 24 Years | 119 (76.8%) | 15 (12.6%) |
| 25 to 29 Years | 320 (95.2%) | 1 (0.3%) |
| 30 to 34 Years | 239 (96.8%) | 6 (2.5%) |
| 35 to 44 Years | 582 (89.0%) | 101 (17.4%) |
| 45 to 54 Years | 618 (88.2%) | 49 (7.9%) |
| 55 to 59 Years | 399 (76.9%) | 80 (20.1%) |
| 60 to 64 Years | 269 (58.4%) | 0 (0.0%) |
| 65 to 74 Years | 241 (39.0%) | 23 (9.5%) |
| 75 Years and over | 113 (25.9%) | 10 (8.8%) |
| Total | 2,985 (70.2%) | 298 (10.0%) |
Employment Status by Educational Attainment in West Ocean City
According to labor force statistics for West Ocean City, 83.2% of individuals (2,428) out of the total population between 25 and 64 years of age (2,918) are in the labor force, with 9.8% or 238 of them being unemployed. The group with the highest labor force participation rate are those with the educational attainment of bachelor's degree or higher, with 94.2% or 1,110 individuals in the labor force. Within the labor force, individuals with high school diploma education have the highest percentage of unemployment, with 31.1% or 197 of them being unemployed.
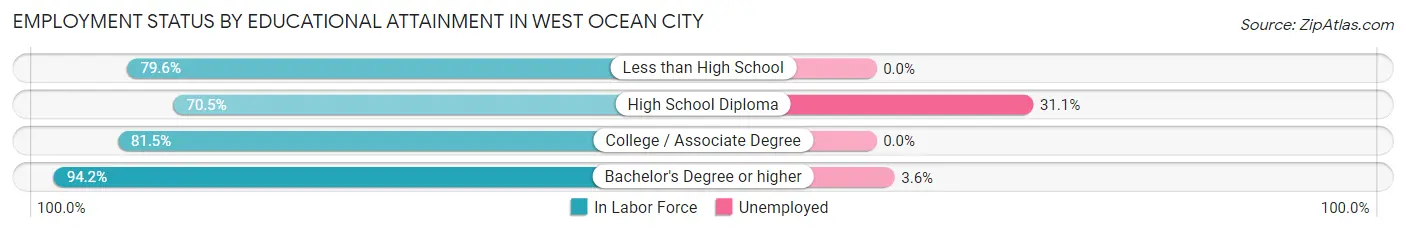
| Educational Attainment | In Labor Force | Unemployed |
| Less than High School | 86 (79.6%) | 0 (0.0%) |
| High School Diploma | 633 (70.5%) | 279 (31.1%) |
| College / Associate Degree | 598 (81.5%) | 0 (0.0%) |
| Bachelor's Degree or higher | 1,110 (94.2%) | 42 (3.6%) |
| Total | 2,428 (83.2%) | 286 (9.8%) |
Employment Occupations by Sex in West Ocean City
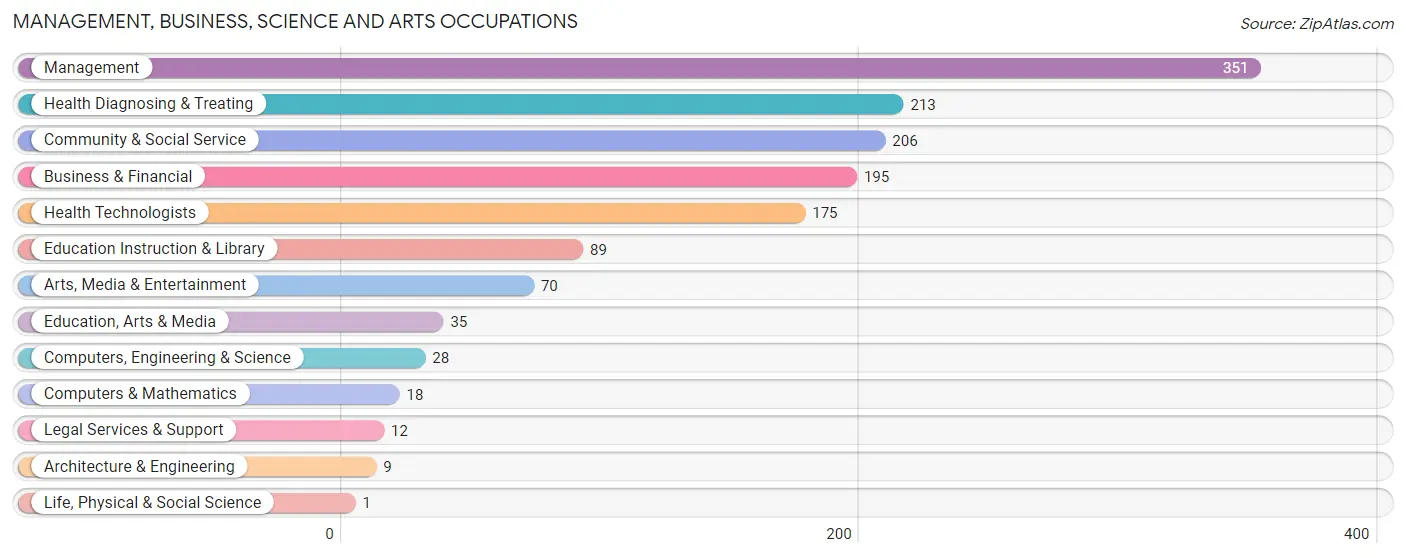
Management, Business, Science and Arts Occupations
The most common Management, Business, Science and Arts occupations in West Ocean City are Management (351 | 13.1%), Health Diagnosing & Treating (213 | 7.9%), Community & Social Service (206 | 7.7%), Business & Financial (195 | 7.3%), and Health Technologists (175 | 6.5%).
Management, Business, Science and Arts Occupations by Sex
Within the Management, Business, Science and Arts occupations in West Ocean City, the most male-oriented occupations are Architecture & Engineering (100.0%), Legal Services & Support (100.0%), and Arts, Media & Entertainment (87.1%), while the most female-oriented occupations are Life, Physical & Social Science (100.0%), Education Instruction & Library (89.9%), and Health Diagnosing & Treating (78.9%).
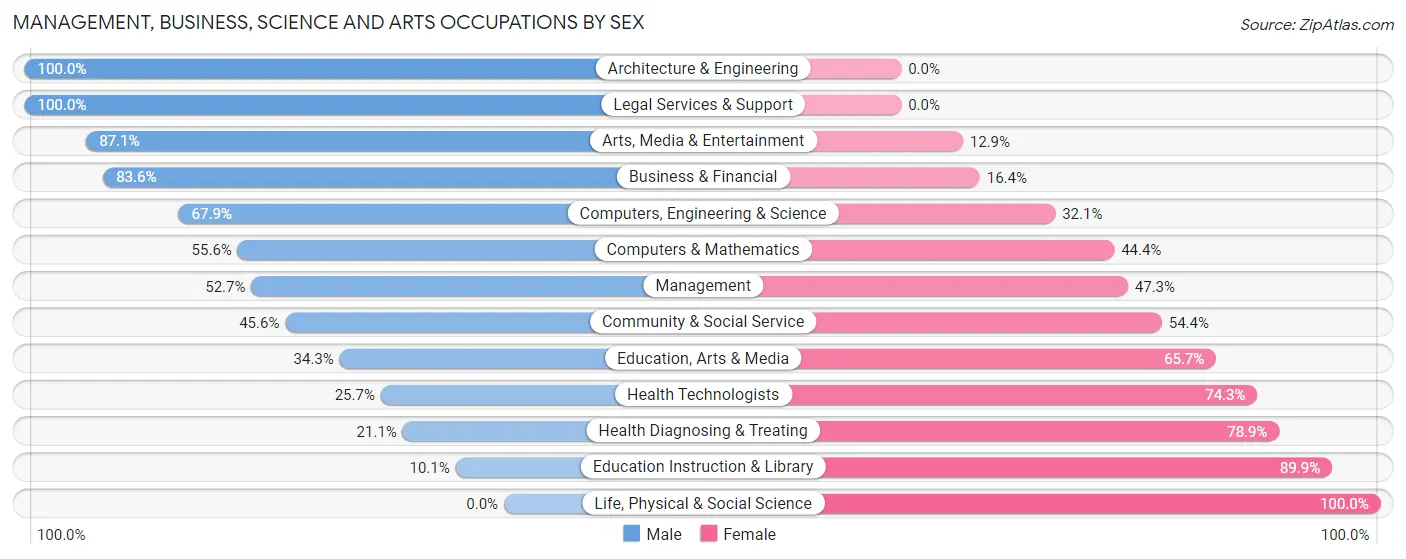
| Occupation | Male | Female |
| Management | 185 (52.7%) | 166 (47.3%) |
| Business & Financial | 163 (83.6%) | 32 (16.4%) |
| Computers, Engineering & Science | 19 (67.9%) | 9 (32.1%) |
| Computers & Mathematics | 10 (55.6%) | 8 (44.4%) |
| Architecture & Engineering | 9 (100.0%) | 0 (0.0%) |
| Life, Physical & Social Science | 0 (0.0%) | 1 (100.0%) |
| Community & Social Service | 94 (45.6%) | 112 (54.4%) |
| Education, Arts & Media | 12 (34.3%) | 23 (65.7%) |
| Legal Services & Support | 12 (100.0%) | 0 (0.0%) |
| Education Instruction & Library | 9 (10.1%) | 80 (89.9%) |
| Arts, Media & Entertainment | 61 (87.1%) | 9 (12.9%) |
| Health Diagnosing & Treating | 45 (21.1%) | 168 (78.9%) |
| Health Technologists | 45 (25.7%) | 130 (74.3%) |
| Total (Category) | 506 (51.0%) | 487 (49.0%) |
| Total (Overall) | 1,536 (57.2%) | 1,151 (42.8%) |
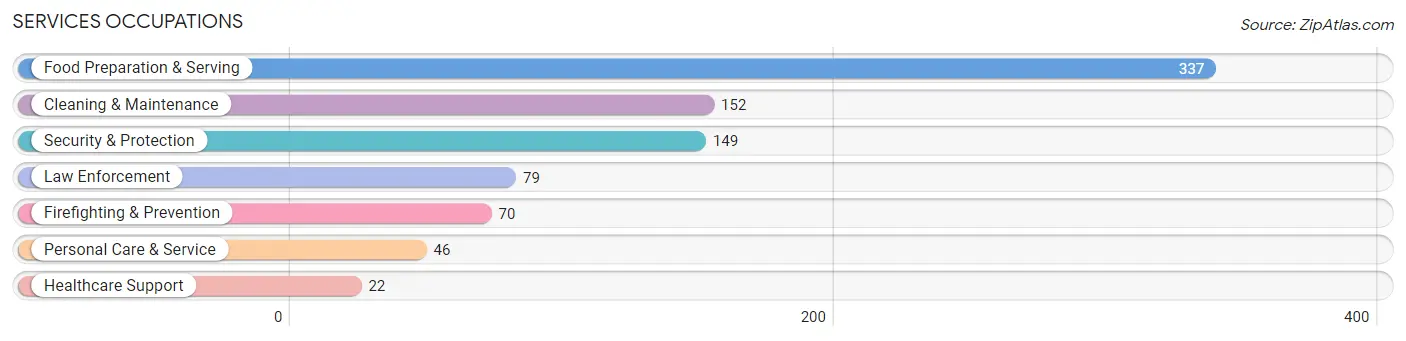
Services Occupations
The most common Services occupations in West Ocean City are Food Preparation & Serving (337 | 12.5%), Cleaning & Maintenance (152 | 5.7%), Security & Protection (149 | 5.6%), Law Enforcement (79 | 2.9%), and Firefighting & Prevention (70 | 2.6%).
Services Occupations by Sex
Within the Services occupations in West Ocean City, the most male-oriented occupations are Security & Protection (100.0%), Firefighting & Prevention (100.0%), and Law Enforcement (100.0%), while the most female-oriented occupations are Healthcare Support (100.0%), Personal Care & Service (56.5%), and Food Preparation & Serving (55.5%).
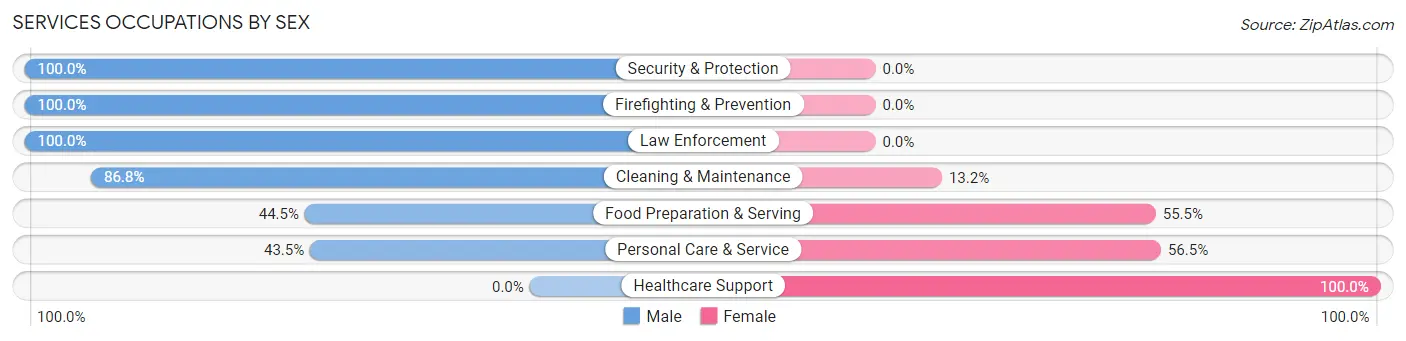
| Occupation | Male | Female |
| Healthcare Support | 0 (0.0%) | 22 (100.0%) |
| Security & Protection | 149 (100.0%) | 0 (0.0%) |
| Firefighting & Prevention | 70 (100.0%) | 0 (0.0%) |
| Law Enforcement | 79 (100.0%) | 0 (0.0%) |
| Food Preparation & Serving | 150 (44.5%) | 187 (55.5%) |
| Cleaning & Maintenance | 132 (86.8%) | 20 (13.2%) |
| Personal Care & Service | 20 (43.5%) | 26 (56.5%) |
| Total (Category) | 451 (63.9%) | 255 (36.1%) |
| Total (Overall) | 1,536 (57.2%) | 1,151 (42.8%) |
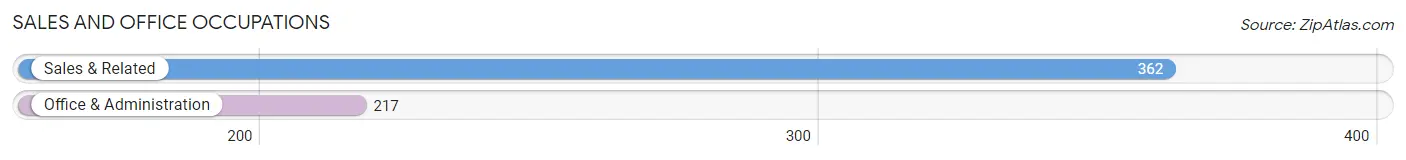
Sales and Office Occupations
The most common Sales and Office occupations in West Ocean City are Sales & Related (362 | 13.5%), and Office & Administration (217 | 8.1%).
Sales and Office Occupations by Sex
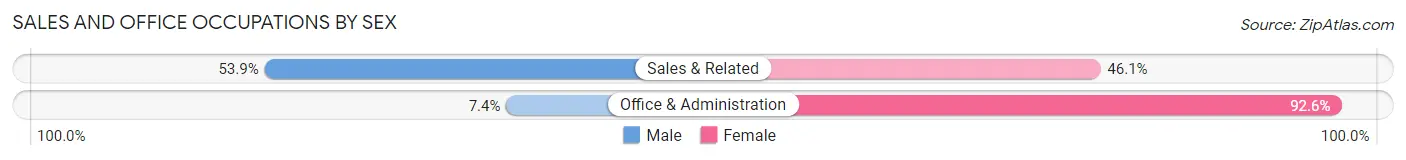
| Occupation | Male | Female |
| Sales & Related | 195 (53.9%) | 167 (46.1%) |
| Office & Administration | 16 (7.4%) | 201 (92.6%) |
| Total (Category) | 211 (36.4%) | 368 (63.6%) |
| Total (Overall) | 1,536 (57.2%) | 1,151 (42.8%) |
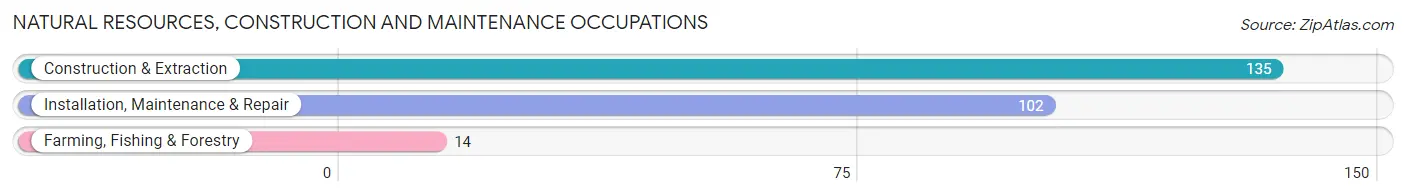
Natural Resources, Construction and Maintenance Occupations
The most common Natural Resources, Construction and Maintenance occupations in West Ocean City are Construction & Extraction (135 | 5.0%), Installation, Maintenance & Repair (102 | 3.8%), and Farming, Fishing & Forestry (14 | 0.5%).
Natural Resources, Construction and Maintenance Occupations by Sex
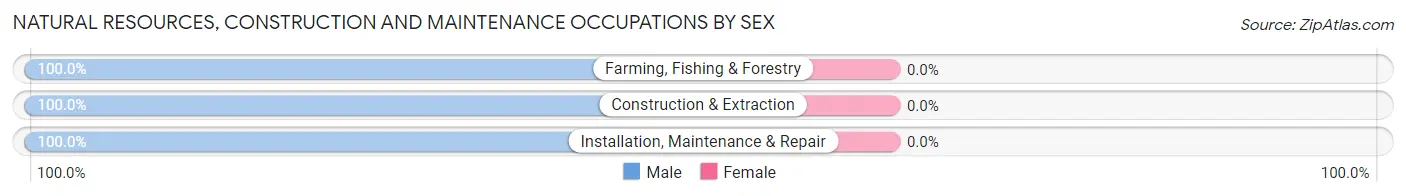
| Occupation | Male | Female |
| Farming, Fishing & Forestry | 14 (100.0%) | 0 (0.0%) |
| Construction & Extraction | 135 (100.0%) | 0 (0.0%) |
| Installation, Maintenance & Repair | 102 (100.0%) | 0 (0.0%) |
| Total (Category) | 251 (100.0%) | 0 (0.0%) |
| Total (Overall) | 1,536 (57.2%) | 1,151 (42.8%) |
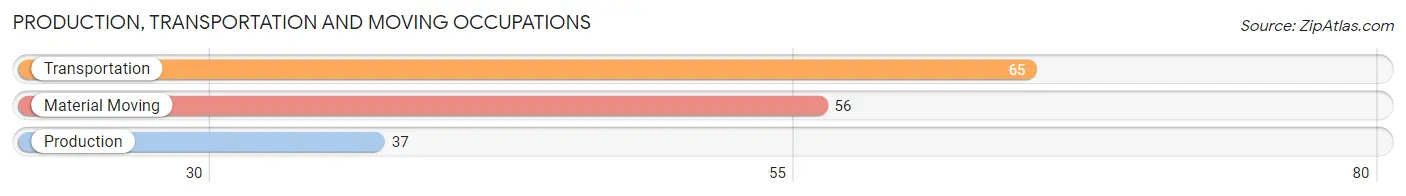
Production, Transportation and Moving Occupations
The most common Production, Transportation and Moving occupations in West Ocean City are Transportation (65 | 2.4%), Material Moving (56 | 2.1%), and Production (37 | 1.4%).
Production, Transportation and Moving Occupations by Sex
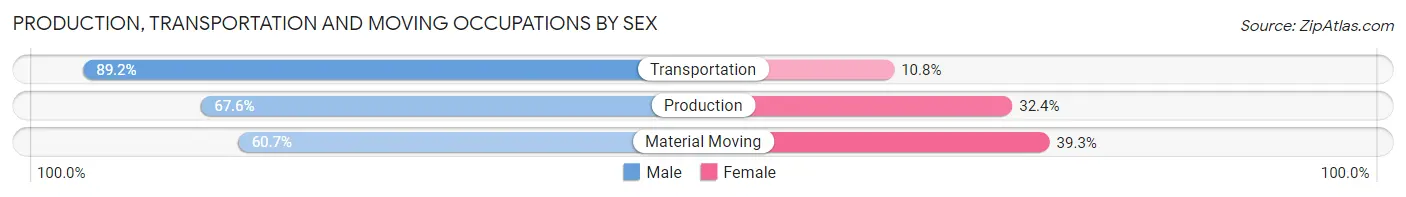
| Occupation | Male | Female |
| Production | 25 (67.6%) | 12 (32.4%) |
| Transportation | 58 (89.2%) | 7 (10.8%) |
| Material Moving | 34 (60.7%) | 22 (39.3%) |
| Total (Category) | 117 (74.1%) | 41 (26.0%) |
| Total (Overall) | 1,536 (57.2%) | 1,151 (42.8%) |
Employment Industries by Sex in West Ocean City
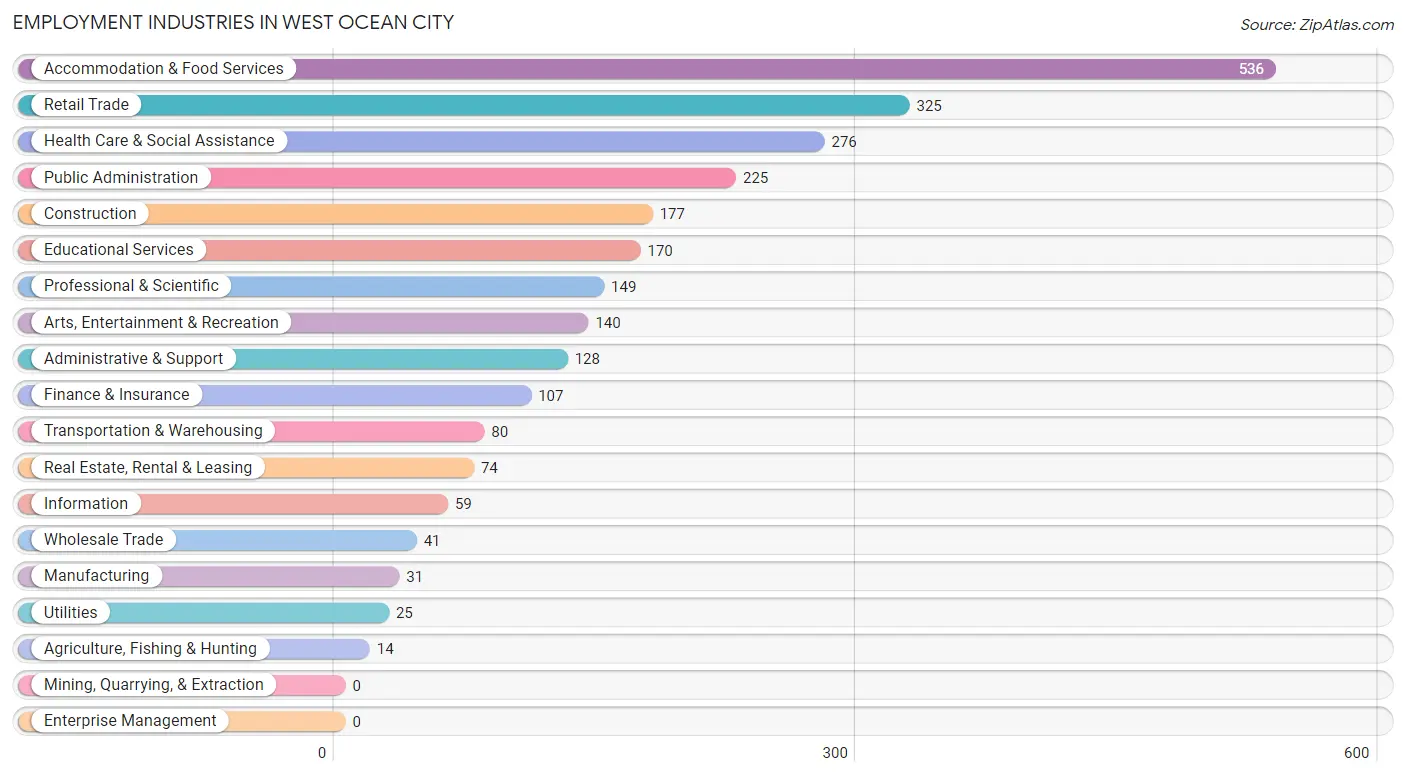
Employment Industries in West Ocean City
The major employment industries in West Ocean City include Accommodation & Food Services (536 | 20.0%), Retail Trade (325 | 12.1%), Health Care & Social Assistance (276 | 10.3%), Public Administration (225 | 8.4%), and Construction (177 | 6.6%).
Employment Industries by Sex in West Ocean City
The West Ocean City industries that see more men than women are Agriculture, Fishing & Hunting (100.0%), Public Administration (100.0%), and Administrative & Support (91.4%), whereas the industries that tend to have a higher number of women are Health Care & Social Assistance (83.7%), Information (83.1%), and Retail Trade (66.5%).
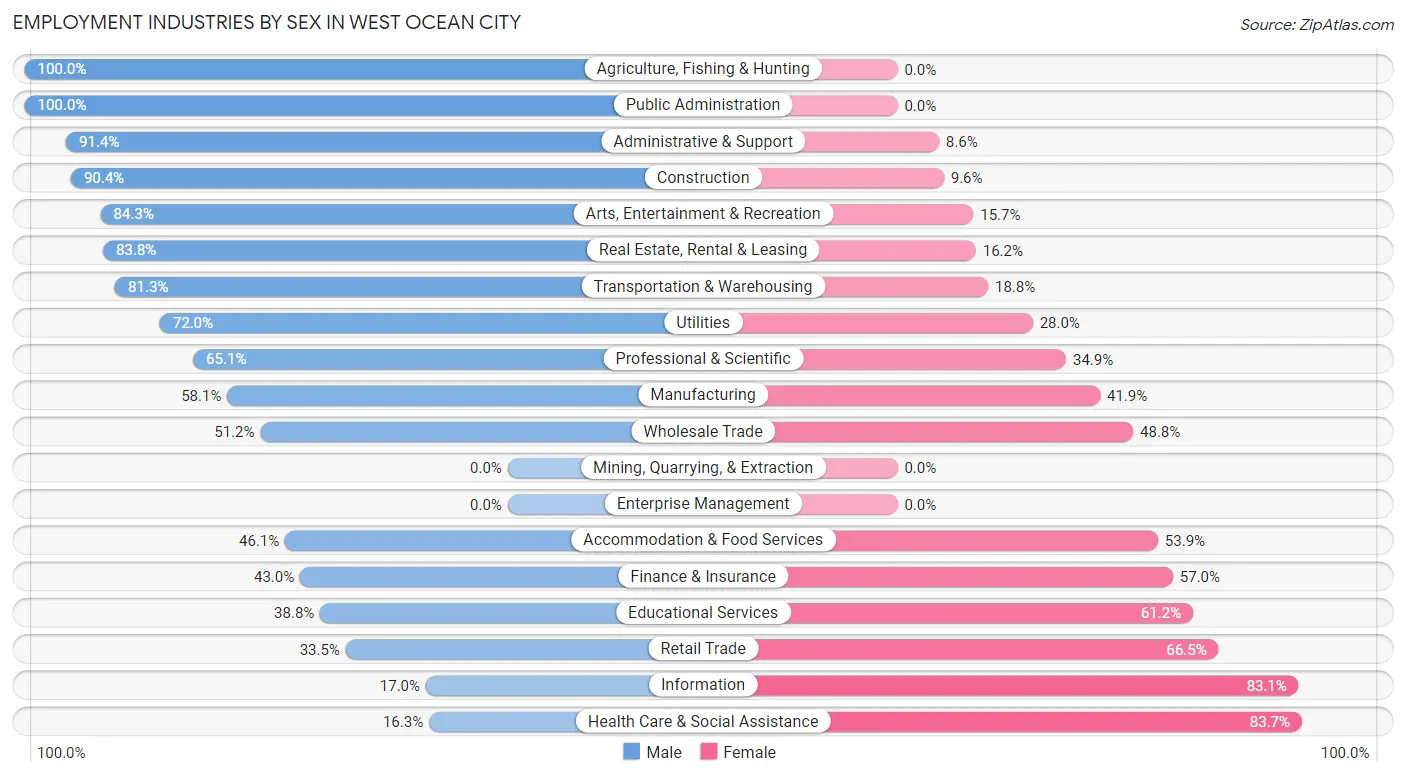
| Industry | Male | Female |
| Agriculture, Fishing & Hunting | 14 (100.0%) | 0 (0.0%) |
| Mining, Quarrying, & Extraction | 0 (0.0%) | 0 (0.0%) |
| Construction | 160 (90.4%) | 17 (9.6%) |
| Manufacturing | 18 (58.1%) | 13 (41.9%) |
| Wholesale Trade | 21 (51.2%) | 20 (48.8%) |
| Retail Trade | 109 (33.5%) | 216 (66.5%) |
| Transportation & Warehousing | 65 (81.2%) | 15 (18.8%) |
| Utilities | 18 (72.0%) | 7 (28.0%) |
| Information | 10 (17.0%) | 49 (83.1%) |
| Finance & Insurance | 46 (43.0%) | 61 (57.0%) |
| Real Estate, Rental & Leasing | 62 (83.8%) | 12 (16.2%) |
| Professional & Scientific | 97 (65.1%) | 52 (34.9%) |
| Enterprise Management | 0 (0.0%) | 0 (0.0%) |
| Administrative & Support | 117 (91.4%) | 11 (8.6%) |
| Educational Services | 66 (38.8%) | 104 (61.2%) |
| Health Care & Social Assistance | 45 (16.3%) | 231 (83.7%) |
| Arts, Entertainment & Recreation | 118 (84.3%) | 22 (15.7%) |
| Accommodation & Food Services | 247 (46.1%) | 289 (53.9%) |
| Public Administration | 225 (100.0%) | 0 (0.0%) |
| Total | 1,536 (57.2%) | 1,151 (42.8%) |
Education in West Ocean City
School Enrollment in West Ocean City
The most common levels of schooling among the 1,056 students in West Ocean City are middle school (341 | 32.3%), high school (262 | 24.8%), and elementary school (193 | 18.3%).
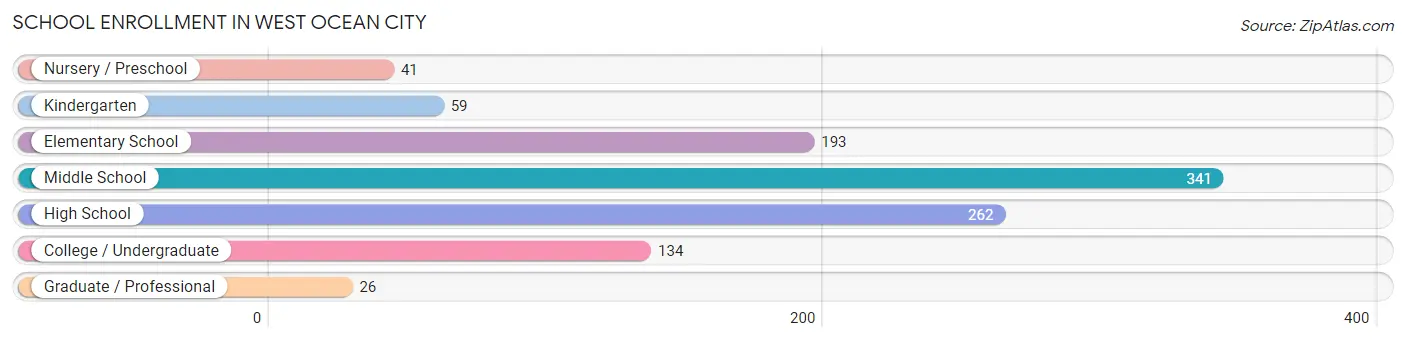
| School Level | # Students | % Students |
| Nursery / Preschool | 41 | 3.9% |
| Kindergarten | 59 | 5.6% |
| Elementary School | 193 | 18.3% |
| Middle School | 341 | 32.3% |
| High School | 262 | 24.8% |
| College / Undergraduate | 134 | 12.7% |
| Graduate / Professional | 26 | 2.5% |
| Total | 1,056 | 100.0% |
School Enrollment by Age by Funding Source in West Ocean City
Out of a total of 1,056 students who are enrolled in schools in West Ocean City, 163 (15.4%) attend a private institution, while the remaining 893 (84.6%) are enrolled in public schools. The age group of 20 to 24 year olds has the highest likelihood of being enrolled in private schools, with 21 (50.0% in the age bracket) enrolled. Conversely, the age group of 3 to 4 year olds has the lowest likelihood of being enrolled in a private school, with 21 (100.0% in the age bracket) attending a public institution.
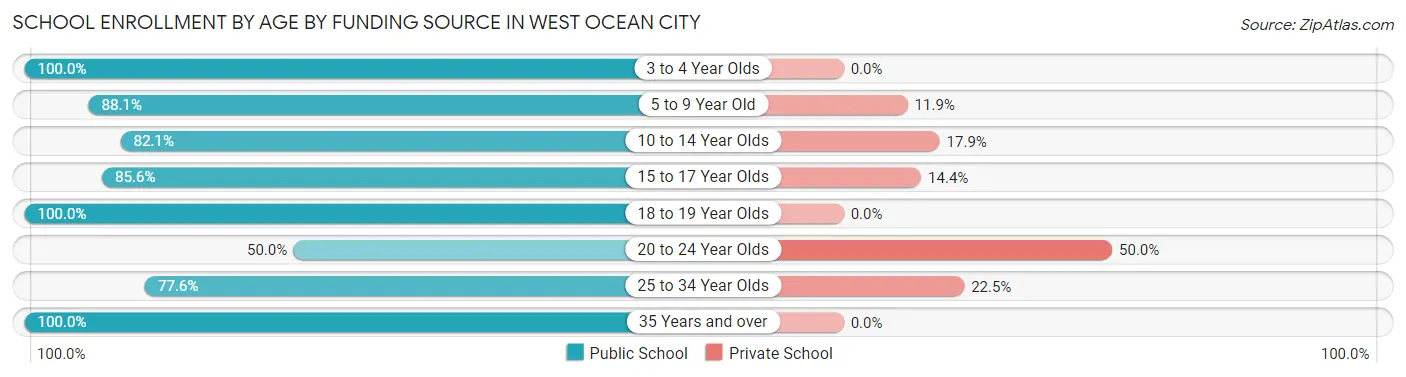
| Age Bracket | Public School | Private School |
| 3 to 4 Year Olds | 21 (100.0%) | 0 (0.0%) |
| 5 to 9 Year Old | 229 (88.1%) | 31 (11.9%) |
| 10 to 14 Year Olds | 326 (82.1%) | 71 (17.9%) |
| 15 to 17 Year Olds | 172 (85.6%) | 29 (14.4%) |
| 18 to 19 Year Olds | 19 (100.0%) | 0 (0.0%) |
| 20 to 24 Year Olds | 21 (50.0%) | 21 (50.0%) |
| 25 to 34 Year Olds | 38 (77.5%) | 11 (22.5%) |
| 35 Years and over | 67 (100.0%) | 0 (0.0%) |
| Total | 893 (84.6%) | 163 (15.4%) |
Educational Attainment by Field of Study in West Ocean City
Business (358 | 23.7%), education (193 | 12.8%), science & technology (180 | 11.9%), communications (140 | 9.3%), and arts & humanities (139 | 9.2%) are the most common fields of study among 1,512 individuals in West Ocean City who have obtained a bachelor's degree or higher.
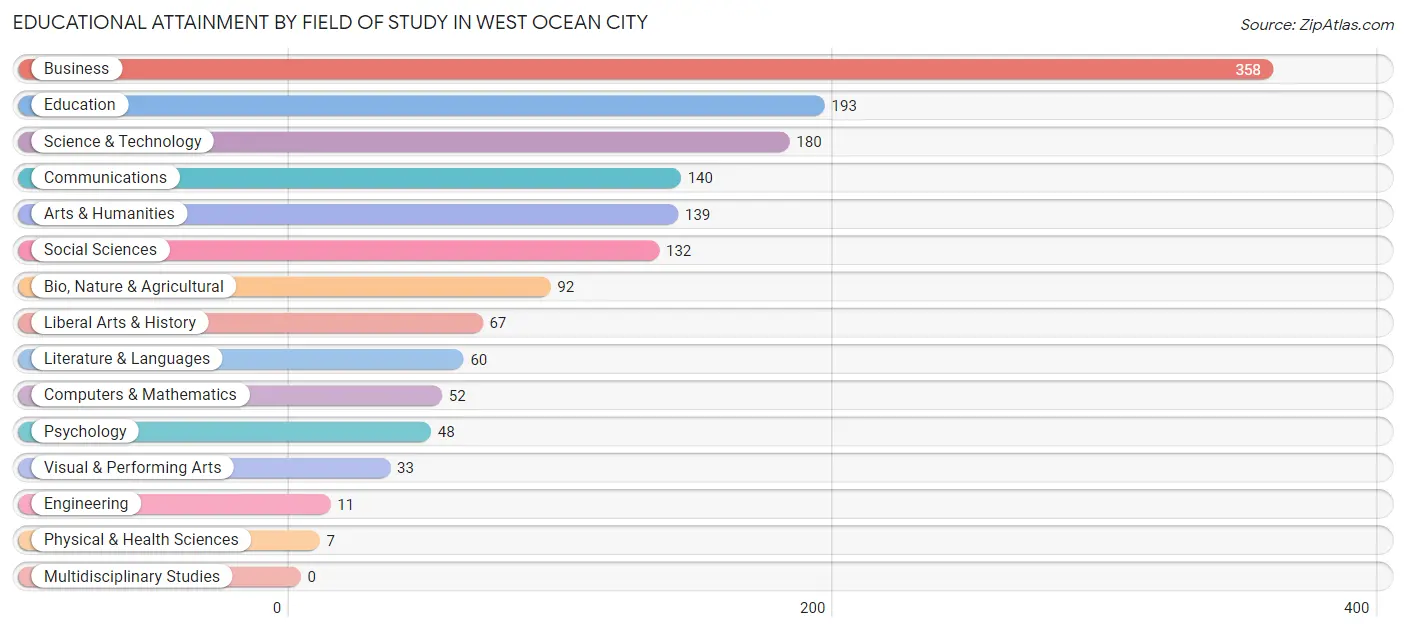
| Field of Study | # Graduates | % Graduates |
| Computers & Mathematics | 52 | 3.4% |
| Bio, Nature & Agricultural | 92 | 6.1% |
| Physical & Health Sciences | 7 | 0.5% |
| Psychology | 48 | 3.2% |
| Social Sciences | 132 | 8.7% |
| Engineering | 11 | 0.7% |
| Multidisciplinary Studies | 0 | 0.0% |
| Science & Technology | 180 | 11.9% |
| Business | 358 | 23.7% |
| Education | 193 | 12.8% |
| Literature & Languages | 60 | 4.0% |
| Liberal Arts & History | 67 | 4.4% |
| Visual & Performing Arts | 33 | 2.2% |
| Communications | 140 | 9.3% |
| Arts & Humanities | 139 | 9.2% |
| Total | 1,512 | 100.0% |
Transportation & Commute in West Ocean City
Vehicle Availability by Sex in West Ocean City
The most prevalent vehicle ownership categories in West Ocean City are males with 2 vehicles (777, accounting for 51.2%) and females with 2 vehicles (504, making up 69.3%).
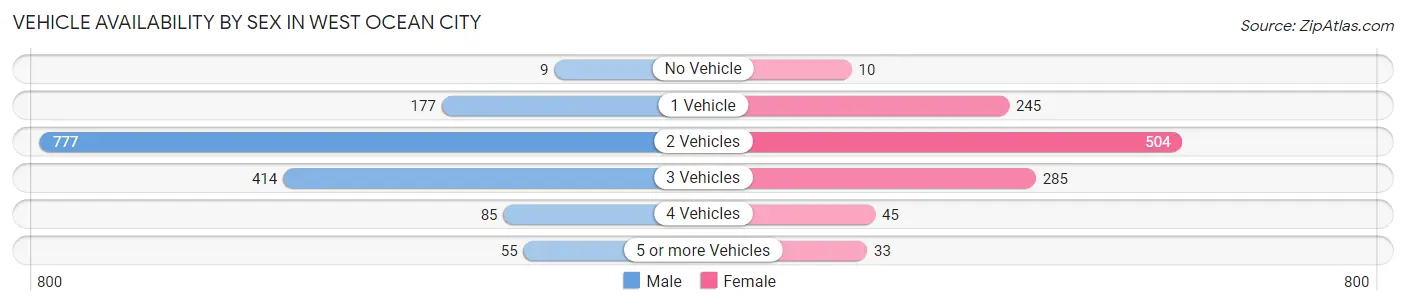
| Vehicles Available | Male | Female |
| No Vehicle | 9 (0.6%) | 10 (0.9%) |
| 1 Vehicle | 177 (11.7%) | 245 (21.8%) |
| 2 Vehicles | 777 (51.2%) | 504 (44.9%) |
| 3 Vehicles | 414 (27.3%) | 285 (25.4%) |
| 4 Vehicles | 85 (5.6%) | 45 (4.0%) |
| 5 or more Vehicles | 55 (3.6%) | 33 (2.9%) |
| Total | 1,517 (100.0%) | 1,122 (100.0%) |
Commute Time in West Ocean City
The most frequently occuring commute durations in West Ocean City are 10 to 14 minutes (532 commuters, 21.1%), 15 to 19 minutes (485 commuters, 19.2%), and 5 to 9 minutes (468 commuters, 18.6%).
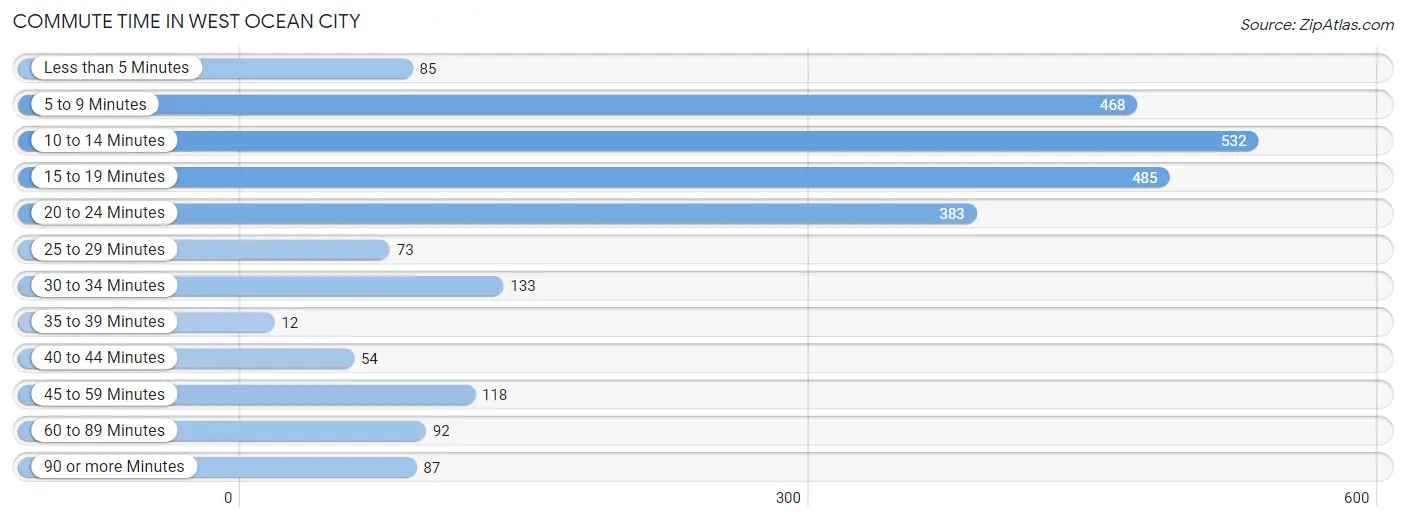
| Commute Time | # Commuters | % Commuters |
| Less than 5 Minutes | 85 | 3.4% |
| 5 to 9 Minutes | 468 | 18.6% |
| 10 to 14 Minutes | 532 | 21.1% |
| 15 to 19 Minutes | 485 | 19.2% |
| 20 to 24 Minutes | 383 | 15.2% |
| 25 to 29 Minutes | 73 | 2.9% |
| 30 to 34 Minutes | 133 | 5.3% |
| 35 to 39 Minutes | 12 | 0.5% |
| 40 to 44 Minutes | 54 | 2.1% |
| 45 to 59 Minutes | 118 | 4.7% |
| 60 to 89 Minutes | 92 | 3.6% |
| 90 or more Minutes | 87 | 3.5% |
Commute Time by Sex in West Ocean City
The most common commute times in West Ocean City are 15 to 19 minutes (334 commuters, 22.6%) for males and 10 to 14 minutes (250 commuters, 24.0%) for females.
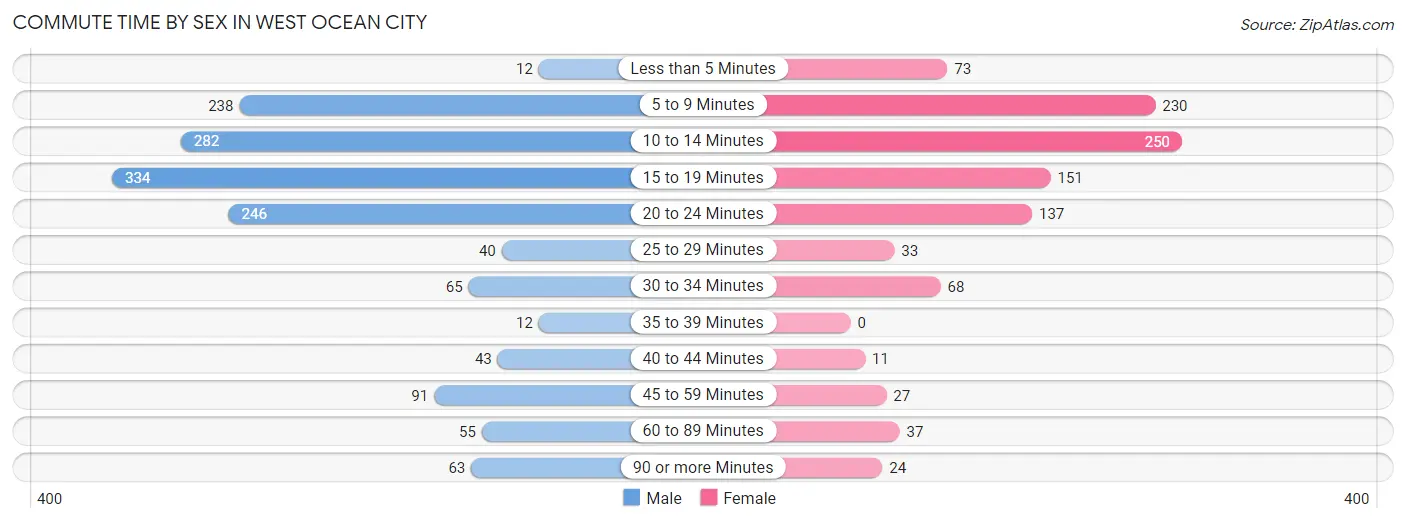
| Commute Time | Male | Female |
| Less than 5 Minutes | 12 (0.8%) | 73 (7.0%) |
| 5 to 9 Minutes | 238 (16.1%) | 230 (22.1%) |
| 10 to 14 Minutes | 282 (19.0%) | 250 (24.0%) |
| 15 to 19 Minutes | 334 (22.6%) | 151 (14.5%) |
| 20 to 24 Minutes | 246 (16.6%) | 137 (13.2%) |
| 25 to 29 Minutes | 40 (2.7%) | 33 (3.2%) |
| 30 to 34 Minutes | 65 (4.4%) | 68 (6.5%) |
| 35 to 39 Minutes | 12 (0.8%) | 0 (0.0%) |
| 40 to 44 Minutes | 43 (2.9%) | 11 (1.1%) |
| 45 to 59 Minutes | 91 (6.1%) | 27 (2.6%) |
| 60 to 89 Minutes | 55 (3.7%) | 37 (3.5%) |
| 90 or more Minutes | 63 (4.3%) | 24 (2.3%) |
Time of Departure to Work by Sex in West Ocean City
The most frequent times of departure to work in West Ocean City are 9:00 AM to 9:59 AM (251, 17.0%) for males and 8:00 AM to 8:29 AM (169, 16.2%) for females.
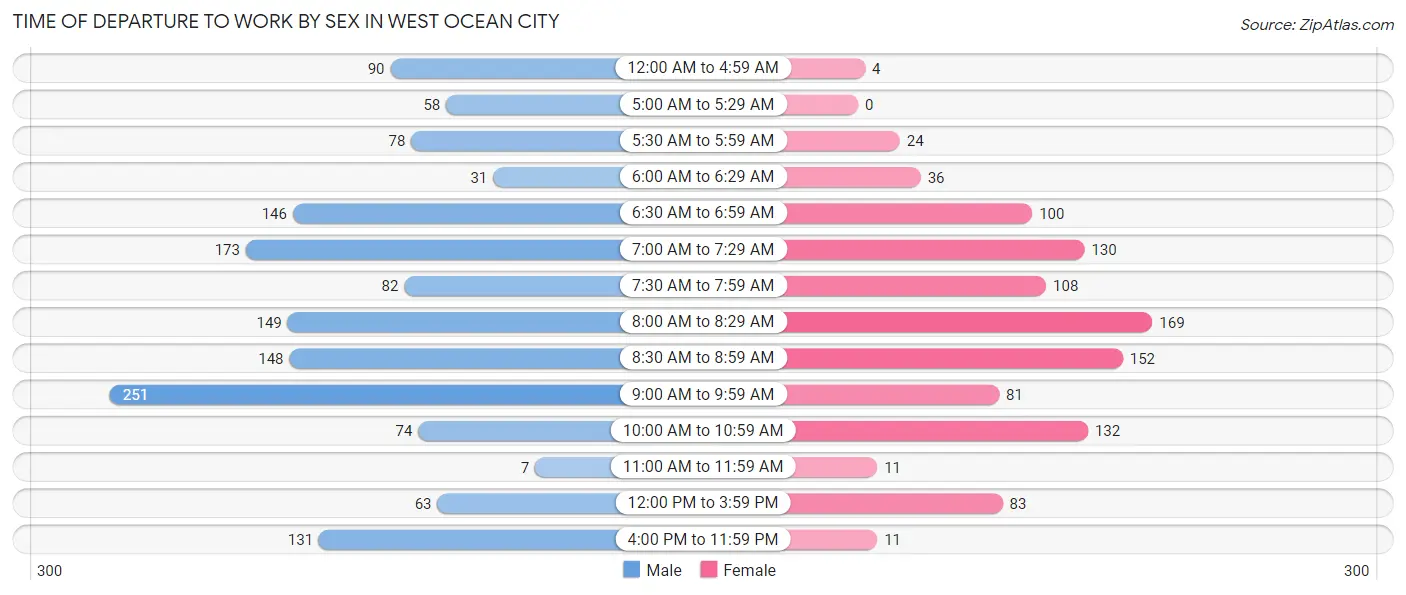
| Time of Departure | Male | Female |
| 12:00 AM to 4:59 AM | 90 (6.1%) | 4 (0.4%) |
| 5:00 AM to 5:29 AM | 58 (3.9%) | 0 (0.0%) |
| 5:30 AM to 5:59 AM | 78 (5.3%) | 24 (2.3%) |
| 6:00 AM to 6:29 AM | 31 (2.1%) | 36 (3.5%) |
| 6:30 AM to 6:59 AM | 146 (9.9%) | 100 (9.6%) |
| 7:00 AM to 7:29 AM | 173 (11.7%) | 130 (12.5%) |
| 7:30 AM to 7:59 AM | 82 (5.5%) | 108 (10.4%) |
| 8:00 AM to 8:29 AM | 149 (10.1%) | 169 (16.2%) |
| 8:30 AM to 8:59 AM | 148 (10.0%) | 152 (14.6%) |
| 9:00 AM to 9:59 AM | 251 (17.0%) | 81 (7.8%) |
| 10:00 AM to 10:59 AM | 74 (5.0%) | 132 (12.7%) |
| 11:00 AM to 11:59 AM | 7 (0.5%) | 11 (1.1%) |
| 12:00 PM to 3:59 PM | 63 (4.3%) | 83 (8.0%) |
| 4:00 PM to 11:59 PM | 131 (8.8%) | 11 (1.1%) |
| Total | 1,481 (100.0%) | 1,041 (100.0%) |
Housing Occupancy in West Ocean City
Occupancy by Ownership in West Ocean City
Of the total 2,266 dwellings in West Ocean City, owner-occupied units account for 1,725 (76.1%), while renter-occupied units make up 541 (23.9%).
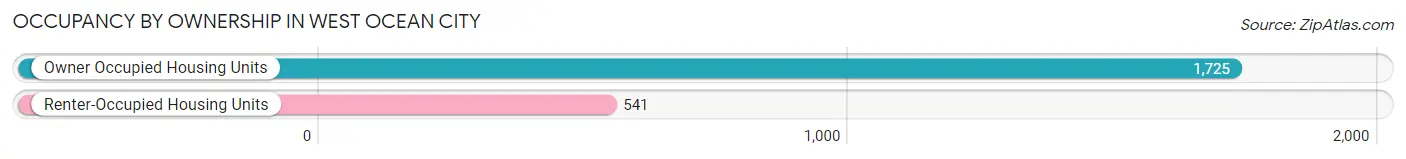
| Occupancy | # Housing Units | % Housing Units |
| Owner Occupied Housing Units | 1,725 | 76.1% |
| Renter-Occupied Housing Units | 541 | 23.9% |
| Total Occupied Housing Units | 2,266 | 100.0% |
Occupancy by Household Size in West Ocean City
| Household Size | # Housing Units | % Housing Units |
| 1-Person Household | 624 | 27.5% |
| 2-Person Household | 934 | 41.2% |
| 3-Person Household | 301 | 13.3% |
| 4+ Person Household | 407 | 18.0% |
| Total Housing Units | 2,266 | 100.0% |
Occupancy by Ownership by Household Size in West Ocean City
| Household Size | Owner-occupied | Renter-occupied |
| 1-Person Household | 458 (73.4%) | 166 (26.6%) |
| 2-Person Household | 700 (75.0%) | 234 (25.1%) |
| 3-Person Household | 244 (81.1%) | 57 (18.9%) |
| 4+ Person Household | 323 (79.4%) | 84 (20.6%) |
| Total Housing Units | 1,725 (76.1%) | 541 (23.9%) |
Occupancy by Educational Attainment in West Ocean City
| Household Size | Owner-occupied | Renter-occupied |
| Less than High School | 72 (100.0%) | 0 (0.0%) |
| High School Diploma | 464 (71.7%) | 183 (28.3%) |
| College/Associate Degree | 458 (68.9%) | 207 (31.1%) |
| Bachelor's Degree or higher | 731 (82.9%) | 151 (17.1%) |
Occupancy by Age of Householder in West Ocean City
| Age Bracket | # Households | % Households |
| Under 35 Years | 257 | 11.3% |
| 35 to 44 Years | 384 | 17.0% |
| 45 to 54 Years | 348 | 15.4% |
| 55 to 64 Years | 530 | 23.4% |
| 65 to 74 Years | 447 | 19.7% |
| 75 to 84 Years | 233 | 10.3% |
| 85 Years and Over | 67 | 3.0% |
| Total | 2,266 | 100.0% |
Housing Finances in West Ocean City
Median Income by Occupancy in West Ocean City
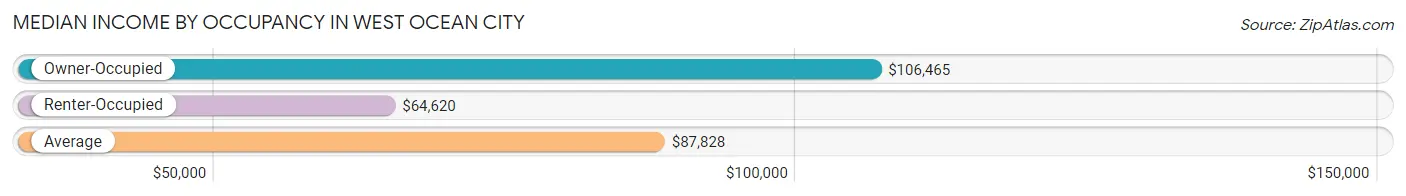
| Occupancy Type | # Households | Median Income |
| Owner-Occupied | 1,725 (76.1%) | $106,465 |
| Renter-Occupied | 541 (23.9%) | $64,620 |
| Average | 2,266 (100.0%) | $87,828 |
Occupancy by Householder Income Bracket in West Ocean City
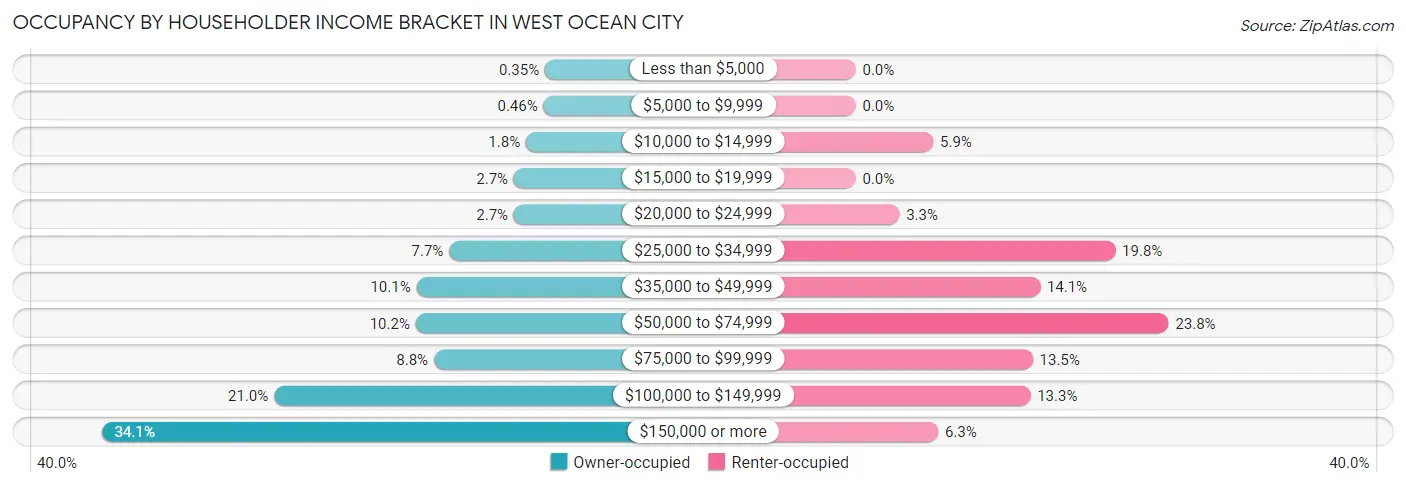
| Income Bracket | Owner-occupied | Renter-occupied |
| Less than $5,000 | 6 (0.4%) | 0 (0.0%) |
| $5,000 to $9,999 | 8 (0.5%) | 0 (0.0%) |
| $10,000 to $14,999 | 31 (1.8%) | 32 (5.9%) |
| $15,000 to $19,999 | 47 (2.7%) | 0 (0.0%) |
| $20,000 to $24,999 | 47 (2.7%) | 18 (3.3%) |
| $25,000 to $34,999 | 132 (7.6%) | 107 (19.8%) |
| $35,000 to $49,999 | 175 (10.1%) | 76 (14.1%) |
| $50,000 to $74,999 | 176 (10.2%) | 129 (23.8%) |
| $75,000 to $99,999 | 152 (8.8%) | 73 (13.5%) |
| $100,000 to $149,999 | 362 (21.0%) | 72 (13.3%) |
| $150,000 or more | 589 (34.1%) | 34 (6.3%) |
| Total | 1,725 (100.0%) | 541 (100.0%) |
Monthly Housing Cost Tiers in West Ocean City
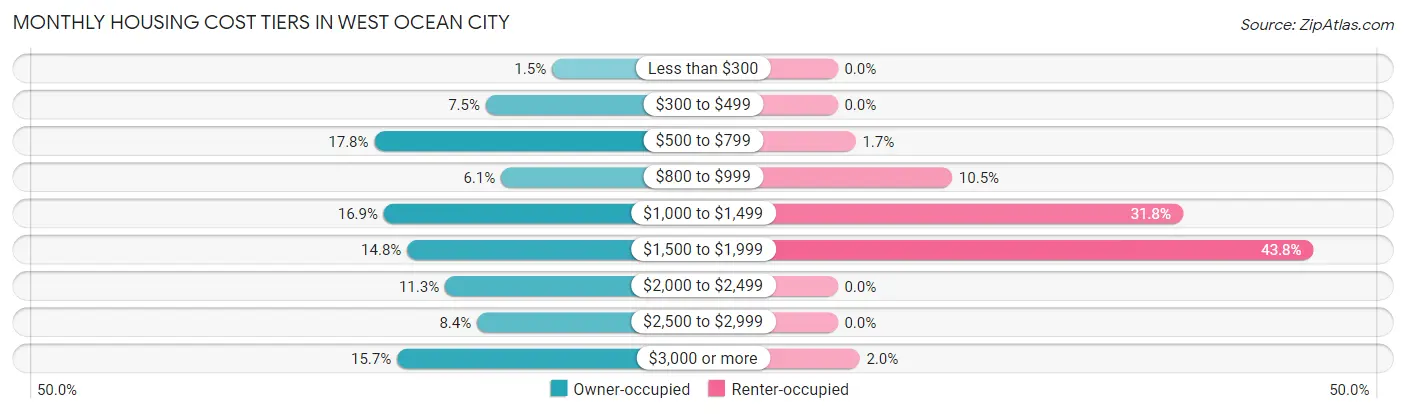
| Monthly Cost | Owner-occupied | Renter-occupied |
| Less than $300 | 25 (1.5%) | 0 (0.0%) |
| $300 to $499 | 130 (7.5%) | 0 (0.0%) |
| $500 to $799 | 307 (17.8%) | 9 (1.7%) |
| $800 to $999 | 106 (6.1%) | 57 (10.5%) |
| $1,000 to $1,499 | 292 (16.9%) | 172 (31.8%) |
| $1,500 to $1,999 | 255 (14.8%) | 237 (43.8%) |
| $2,000 to $2,499 | 195 (11.3%) | 0 (0.0%) |
| $2,500 to $2,999 | 144 (8.4%) | 0 (0.0%) |
| $3,000 or more | 271 (15.7%) | 11 (2.0%) |
| Total | 1,725 (100.0%) | 541 (100.0%) |
Physical Housing Characteristics in West Ocean City
Housing Structures in West Ocean City
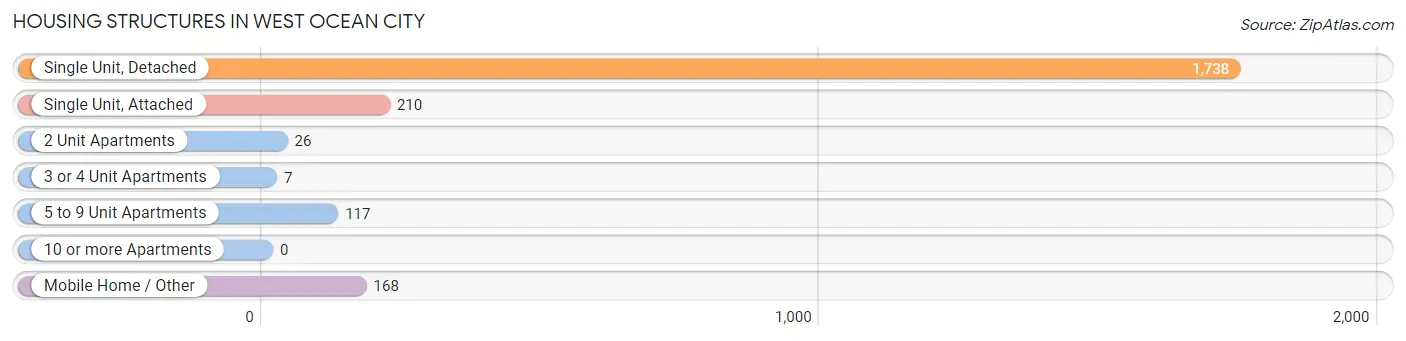
| Structure Type | # Housing Units | % Housing Units |
| Single Unit, Detached | 1,738 | 76.7% |
| Single Unit, Attached | 210 | 9.3% |
| 2 Unit Apartments | 26 | 1.1% |
| 3 or 4 Unit Apartments | 7 | 0.3% |
| 5 to 9 Unit Apartments | 117 | 5.2% |
| 10 or more Apartments | 0 | 0.0% |
| Mobile Home / Other | 168 | 7.4% |
| Total | 2,266 | 100.0% |
Housing Structures by Occupancy in West Ocean City
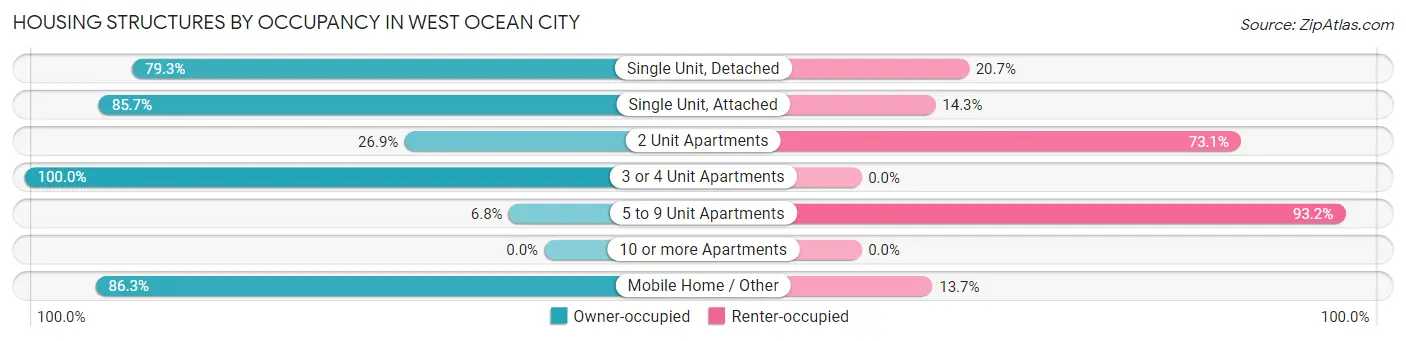
| Structure Type | Owner-occupied | Renter-occupied |
| Single Unit, Detached | 1,378 (79.3%) | 360 (20.7%) |
| Single Unit, Attached | 180 (85.7%) | 30 (14.3%) |
| 2 Unit Apartments | 7 (26.9%) | 19 (73.1%) |
| 3 or 4 Unit Apartments | 7 (100.0%) | 0 (0.0%) |
| 5 to 9 Unit Apartments | 8 (6.8%) | 109 (93.2%) |
| 10 or more Apartments | 0 (0.0%) | 0 (0.0%) |
| Mobile Home / Other | 145 (86.3%) | 23 (13.7%) |
| Total | 1,725 (76.1%) | 541 (23.9%) |
Housing Structures by Number of Rooms in West Ocean City
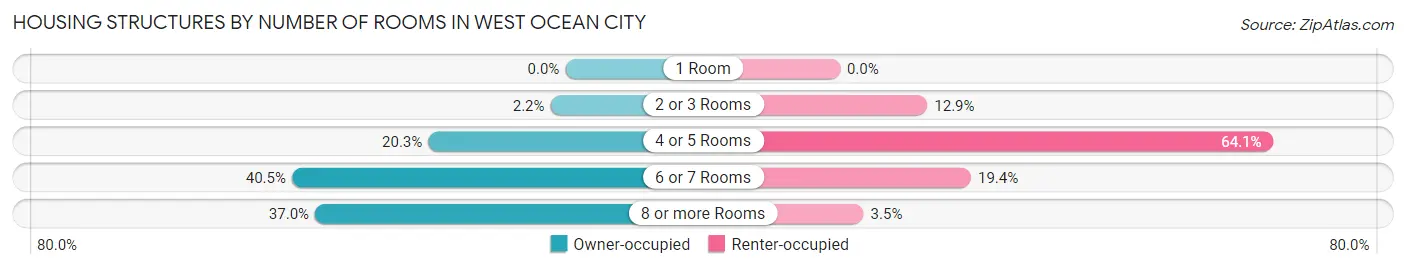
| Number of Rooms | Owner-occupied | Renter-occupied |
| 1 Room | 0 (0.0%) | 0 (0.0%) |
| 2 or 3 Rooms | 38 (2.2%) | 70 (12.9%) |
| 4 or 5 Rooms | 350 (20.3%) | 347 (64.1%) |
| 6 or 7 Rooms | 698 (40.5%) | 105 (19.4%) |
| 8 or more Rooms | 639 (37.0%) | 19 (3.5%) |
| Total | 1,725 (100.0%) | 541 (100.0%) |
Housing Structure by Heating Type in West Ocean City
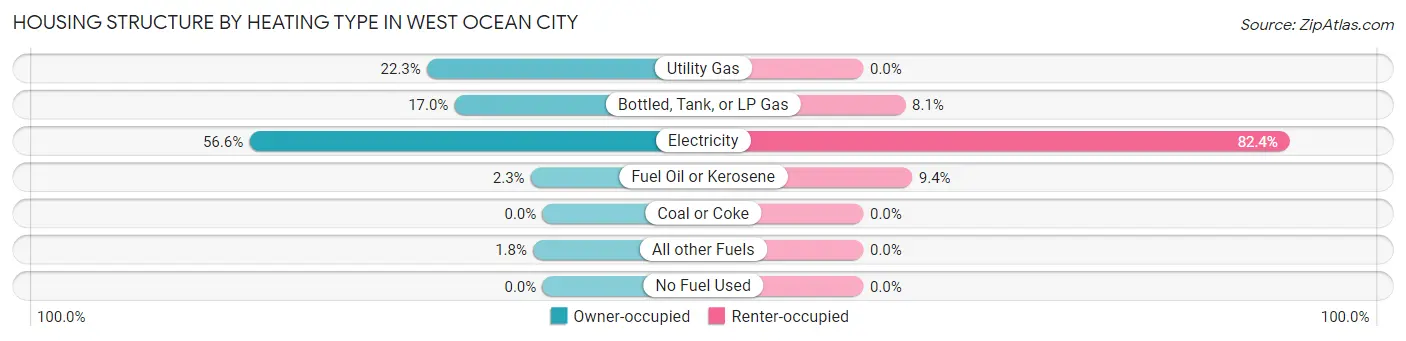
| Heating Type | Owner-occupied | Renter-occupied |
| Utility Gas | 385 (22.3%) | 0 (0.0%) |
| Bottled, Tank, or LP Gas | 293 (17.0%) | 44 (8.1%) |
| Electricity | 977 (56.6%) | 446 (82.4%) |
| Fuel Oil or Kerosene | 39 (2.3%) | 51 (9.4%) |
| Coal or Coke | 0 (0.0%) | 0 (0.0%) |
| All other Fuels | 31 (1.8%) | 0 (0.0%) |
| No Fuel Used | 0 (0.0%) | 0 (0.0%) |
| Total | 1,725 (100.0%) | 541 (100.0%) |
Household Vehicle Usage in West Ocean City
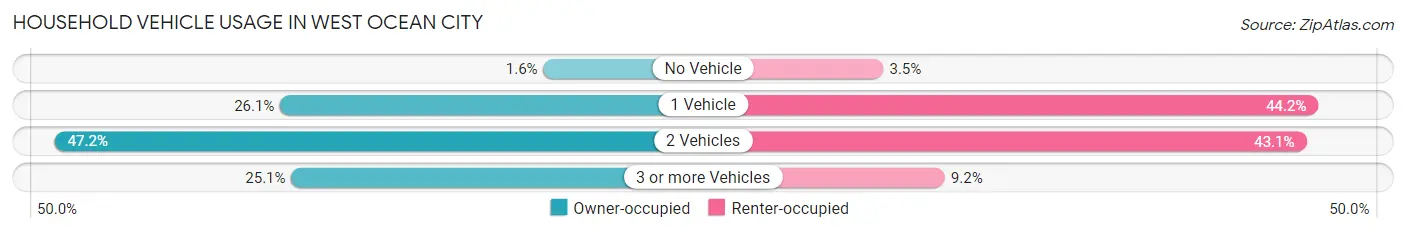
| Vehicles per Household | Owner-occupied | Renter-occupied |
| No Vehicle | 27 (1.6%) | 19 (3.5%) |
| 1 Vehicle | 451 (26.1%) | 239 (44.2%) |
| 2 Vehicles | 814 (47.2%) | 233 (43.1%) |
| 3 or more Vehicles | 433 (25.1%) | 50 (9.2%) |
| Total | 1,725 (100.0%) | 541 (100.0%) |
Real Estate & Mortgages in West Ocean City
Real Estate and Mortgage Overview in West Ocean City
| Characteristic | Without Mortgage | With Mortgage |
| Housing Units | 743 | 982 |
| Median Property Value | $349,700 | $391,000 |
| Median Household Income | $75,096 | $385 |
| Monthly Housing Costs | $712 | $262 |
| Real Estate Taxes | $2,456 | $125 |
Property Value by Mortgage Status in West Ocean City
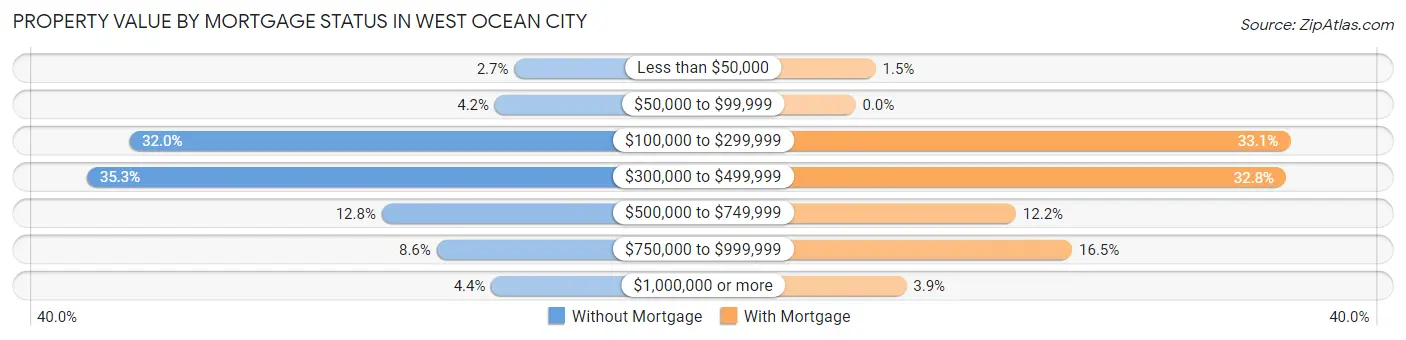
| Property Value | Without Mortgage | With Mortgage |
| Less than $50,000 | 20 (2.7%) | 15 (1.5%) |
| $50,000 to $99,999 | 31 (4.2%) | 0 (0.0%) |
| $100,000 to $299,999 | 238 (32.0%) | 325 (33.1%) |
| $300,000 to $499,999 | 262 (35.3%) | 322 (32.8%) |
| $500,000 to $749,999 | 95 (12.8%) | 120 (12.2%) |
| $750,000 to $999,999 | 64 (8.6%) | 162 (16.5%) |
| $1,000,000 or more | 33 (4.4%) | 38 (3.9%) |
| Total | 743 (100.0%) | 982 (100.0%) |
Household Income by Mortgage Status in West Ocean City
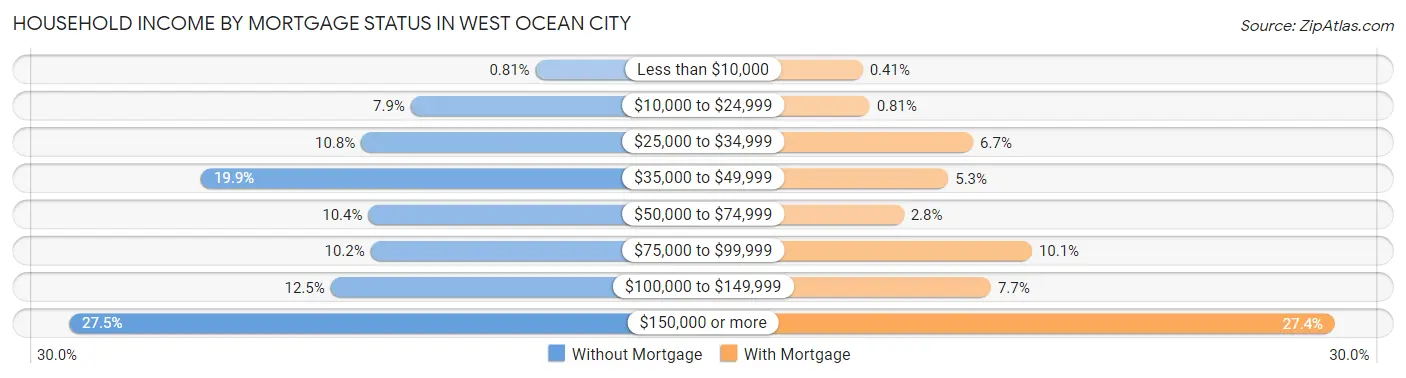
| Household Income | Without Mortgage | With Mortgage |
| Less than $10,000 | 6 (0.8%) | 4 (0.4%) |
| $10,000 to $24,999 | 59 (7.9%) | 8 (0.8%) |
| $25,000 to $34,999 | 80 (10.8%) | 66 (6.7%) |
| $35,000 to $49,999 | 148 (19.9%) | 52 (5.3%) |
| $50,000 to $74,999 | 77 (10.4%) | 27 (2.8%) |
| $75,000 to $99,999 | 76 (10.2%) | 99 (10.1%) |
| $100,000 to $149,999 | 93 (12.5%) | 76 (7.7%) |
| $150,000 or more | 204 (27.5%) | 269 (27.4%) |
| Total | 743 (100.0%) | 982 (100.0%) |
Property Value to Household Income Ratio in West Ocean City
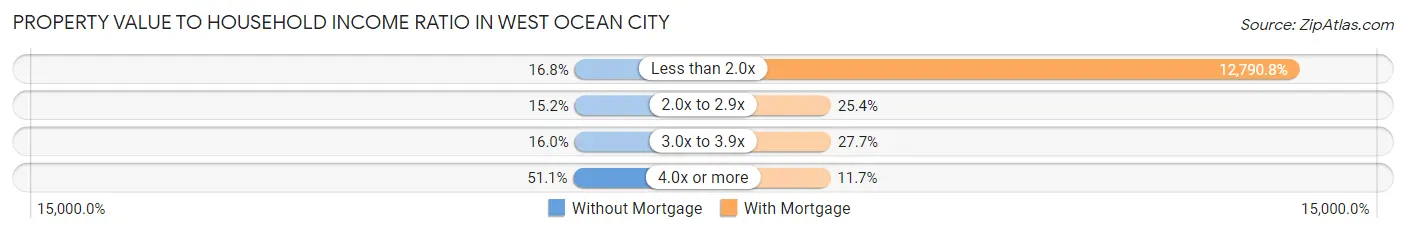
| Value-to-Income Ratio | Without Mortgage | With Mortgage |
| Less than 2.0x | 125 (16.8%) | 125,606 (12,790.8%) |
| 2.0x to 2.9x | 113 (15.2%) | 249 (25.4%) |
| 3.0x to 3.9x | 119 (16.0%) | 272 (27.7%) |
| 4.0x or more | 380 (51.1%) | 115 (11.7%) |
| Total | 743 (100.0%) | 982 (100.0%) |
Real Estate Taxes by Mortgage Status in West Ocean City
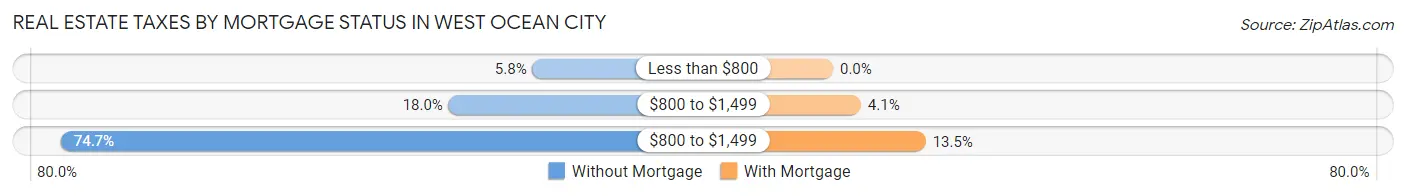
| Property Taxes | Without Mortgage | With Mortgage |
| Less than $800 | 43 (5.8%) | 0 (0.0%) |
| $800 to $1,499 | 134 (18.0%) | 40 (4.1%) |
| $800 to $1,499 | 555 (74.7%) | 133 (13.5%) |
| Total | 743 (100.0%) | 982 (100.0%) |
Health & Disability in West Ocean City
Health Insurance Coverage by Age in West Ocean City
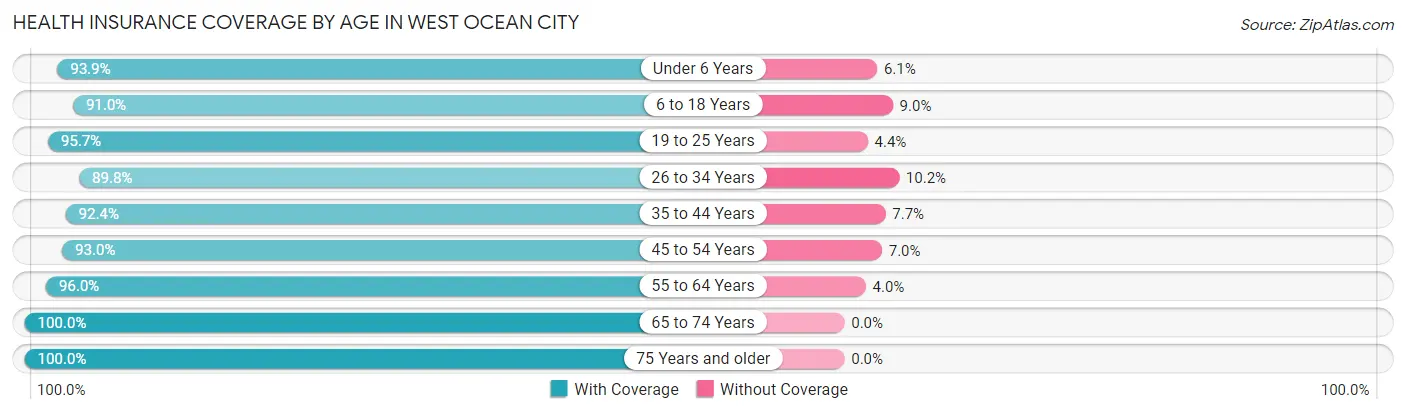
| Age Bracket | With Coverage | Without Coverage |
| Under 6 Years | 277 (93.9%) | 18 (6.1%) |
| 6 to 18 Years | 726 (91.0%) | 72 (9.0%) |
| 19 to 25 Years | 242 (95.7%) | 11 (4.3%) |
| 26 to 34 Years | 459 (89.8%) | 52 (10.2%) |
| 35 to 44 Years | 604 (92.3%) | 50 (7.6%) |
| 45 to 54 Years | 652 (93.0%) | 49 (7.0%) |
| 55 to 64 Years | 941 (96.0%) | 39 (4.0%) |
| 65 to 74 Years | 618 (100.0%) | 0 (0.0%) |
| 75 Years and older | 433 (100.0%) | 0 (0.0%) |
| Total | 4,952 (94.5%) | 291 (5.6%) |
Health Insurance Coverage by Citizenship Status in West Ocean City
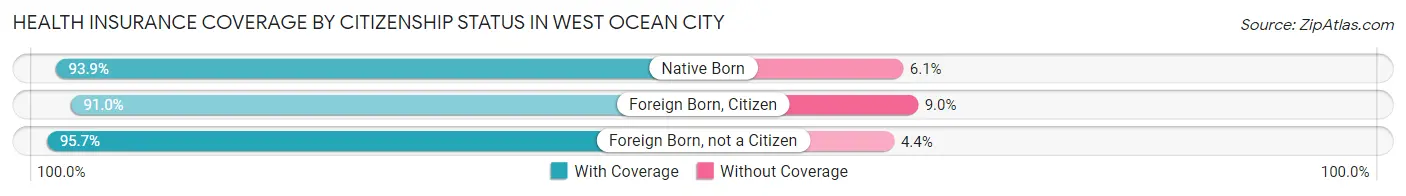
| Citizenship Status | With Coverage | Without Coverage |
| Native Born | 277 (93.9%) | 18 (6.1%) |
| Foreign Born, Citizen | 726 (91.0%) | 72 (9.0%) |
| Foreign Born, not a Citizen | 242 (95.7%) | 11 (4.3%) |
Health Insurance Coverage by Household Income in West Ocean City
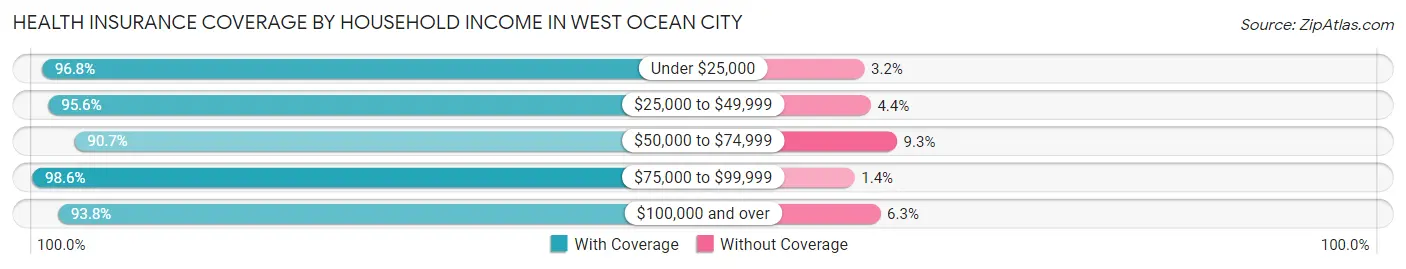
| Household Income | With Coverage | Without Coverage |
| Under $25,000 | 328 (96.8%) | 11 (3.2%) |
| $25,000 to $49,999 | 753 (95.6%) | 35 (4.4%) |
| $50,000 to $74,999 | 553 (90.7%) | 57 (9.3%) |
| $75,000 to $99,999 | 626 (98.6%) | 9 (1.4%) |
| $100,000 and over | 2,687 (93.8%) | 179 (6.2%) |
Public vs Private Health Insurance Coverage by Age in West Ocean City
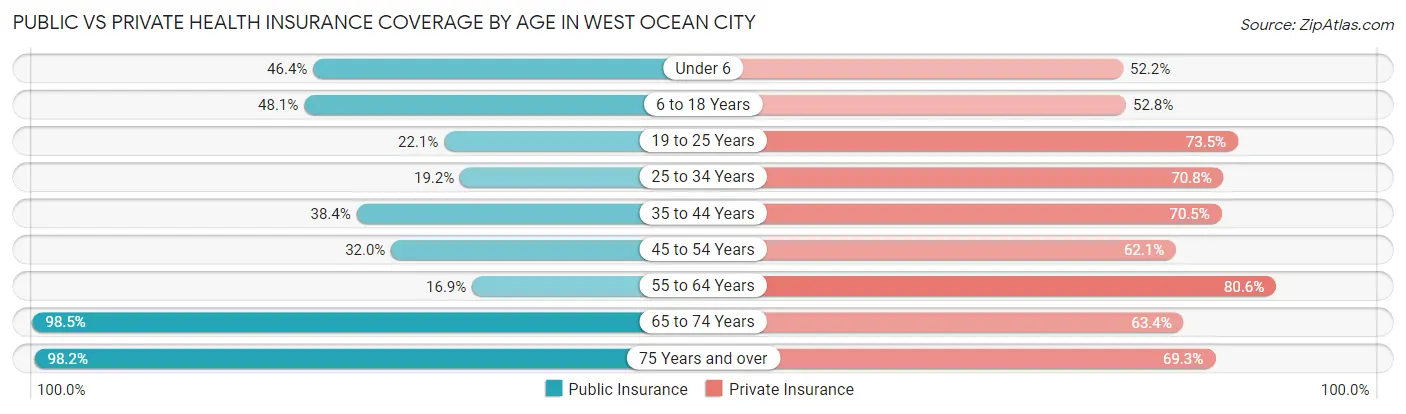
| Age Bracket | Public Insurance | Private Insurance |
| Under 6 | 137 (46.4%) | 154 (52.2%) |
| 6 to 18 Years | 384 (48.1%) | 421 (52.8%) |
| 19 to 25 Years | 56 (22.1%) | 186 (73.5%) |
| 25 to 34 Years | 98 (19.2%) | 362 (70.8%) |
| 35 to 44 Years | 251 (38.4%) | 461 (70.5%) |
| 45 to 54 Years | 224 (32.0%) | 435 (62.1%) |
| 55 to 64 Years | 166 (16.9%) | 790 (80.6%) |
| 65 to 74 Years | 609 (98.5%) | 392 (63.4%) |
| 75 Years and over | 425 (98.2%) | 300 (69.3%) |
| Total | 2,350 (44.8%) | 3,501 (66.8%) |
Disability Status by Sex by Age in West Ocean City
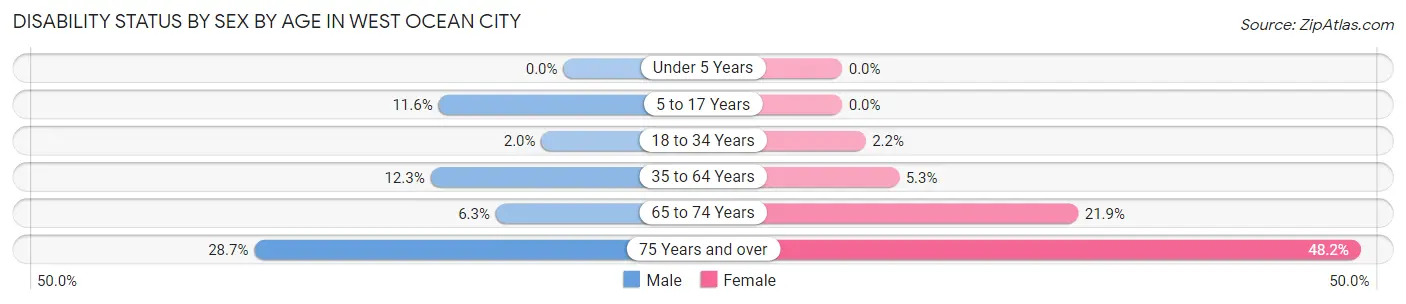
| Age Bracket | Male | Female |
| Under 5 Years | 0 (0.0%) | 0 (0.0%) |
| 5 to 17 Years | 46 (11.6%) | 0 (0.0%) |
| 18 to 34 Years | 9 (2.0%) | 7 (2.2%) |
| 35 to 64 Years | 150 (12.3%) | 59 (5.3%) |
| 65 to 74 Years | 17 (6.3%) | 76 (21.9%) |
| 75 Years and over | 70 (28.7%) | 91 (48.1%) |
Disability Class by Sex by Age in West Ocean City
Disability Class: Hearing Difficulty
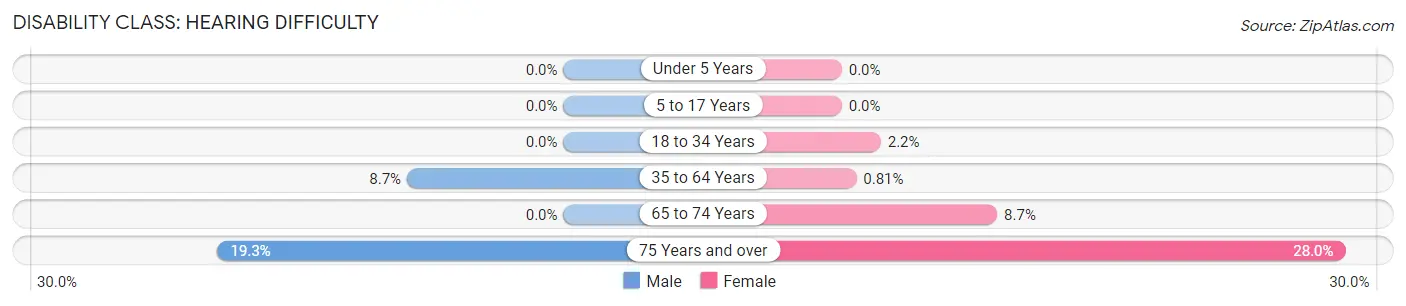
| Age Bracket | Male | Female |
| Under 5 Years | 0 (0.0%) | 0 (0.0%) |
| 5 to 17 Years | 0 (0.0%) | 0 (0.0%) |
| 18 to 34 Years | 0 (0.0%) | 7 (2.2%) |
| 35 to 64 Years | 106 (8.7%) | 9 (0.8%) |
| 65 to 74 Years | 0 (0.0%) | 30 (8.6%) |
| 75 Years and over | 47 (19.3%) | 53 (28.0%) |
Disability Class: Vision Difficulty
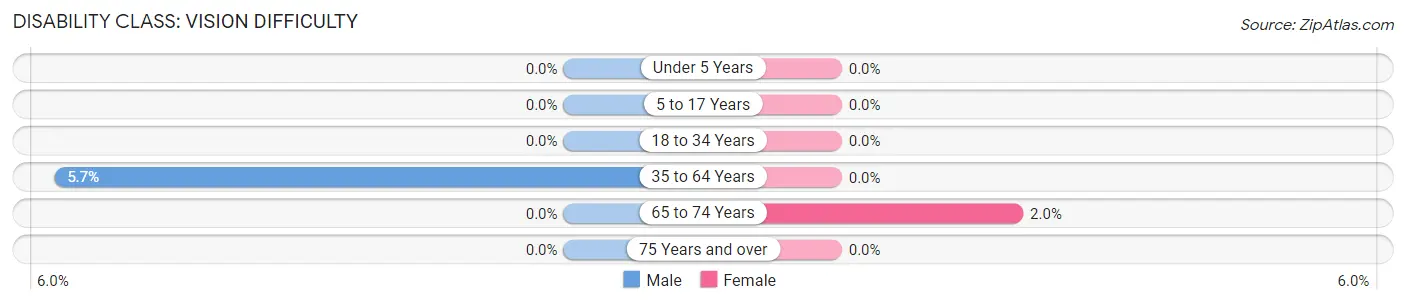
| Age Bracket | Male | Female |
| Under 5 Years | 0 (0.0%) | 0 (0.0%) |
| 5 to 17 Years | 0 (0.0%) | 0 (0.0%) |
| 18 to 34 Years | 0 (0.0%) | 0 (0.0%) |
| 35 to 64 Years | 69 (5.7%) | 0 (0.0%) |
| 65 to 74 Years | 0 (0.0%) | 7 (2.0%) |
| 75 Years and over | 0 (0.0%) | 0 (0.0%) |
Disability Class: Cognitive Difficulty
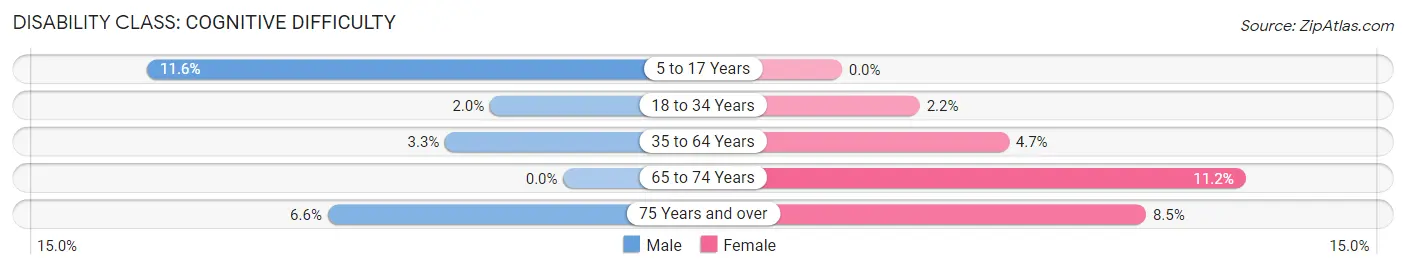
| Age Bracket | Male | Female |
| 5 to 17 Years | 46 (11.6%) | 0 (0.0%) |
| 18 to 34 Years | 9 (2.0%) | 7 (2.2%) |
| 35 to 64 Years | 40 (3.3%) | 52 (4.6%) |
| 65 to 74 Years | 0 (0.0%) | 39 (11.2%) |
| 75 Years and over | 16 (6.6%) | 16 (8.5%) |
Disability Class: Ambulatory Difficulty
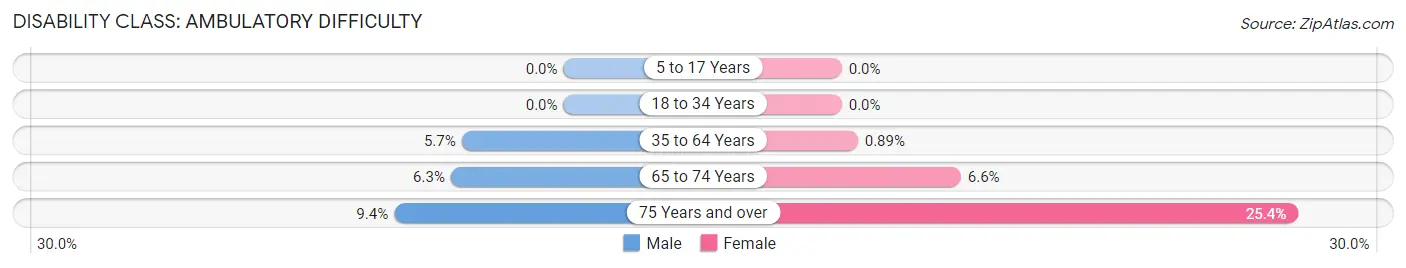
| Age Bracket | Male | Female |
| 5 to 17 Years | 0 (0.0%) | 0 (0.0%) |
| 18 to 34 Years | 0 (0.0%) | 0 (0.0%) |
| 35 to 64 Years | 69 (5.7%) | 10 (0.9%) |
| 65 to 74 Years | 17 (6.3%) | 23 (6.6%) |
| 75 Years and over | 23 (9.4%) | 48 (25.4%) |
Disability Class: Self-Care Difficulty
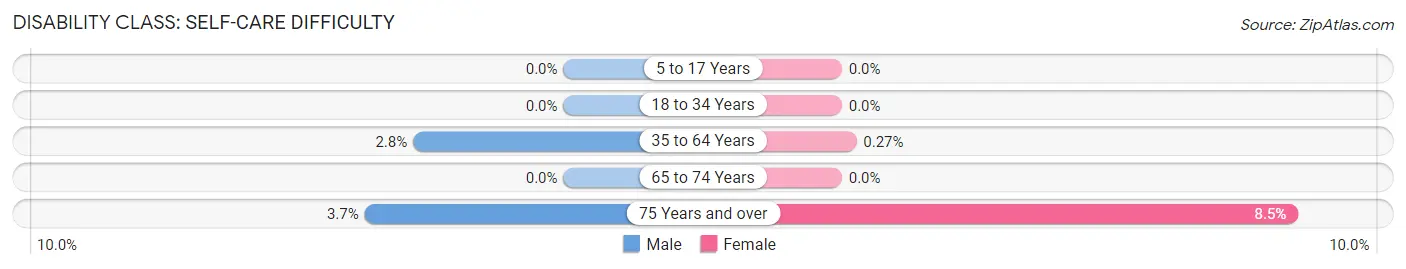
| Age Bracket | Male | Female |
| 5 to 17 Years | 0 (0.0%) | 0 (0.0%) |
| 18 to 34 Years | 0 (0.0%) | 0 (0.0%) |
| 35 to 64 Years | 34 (2.8%) | 3 (0.3%) |
| 65 to 74 Years | 0 (0.0%) | 0 (0.0%) |
| 75 Years and over | 9 (3.7%) | 16 (8.5%) |
Technology Access in West Ocean City
Computing Device Access in West Ocean City
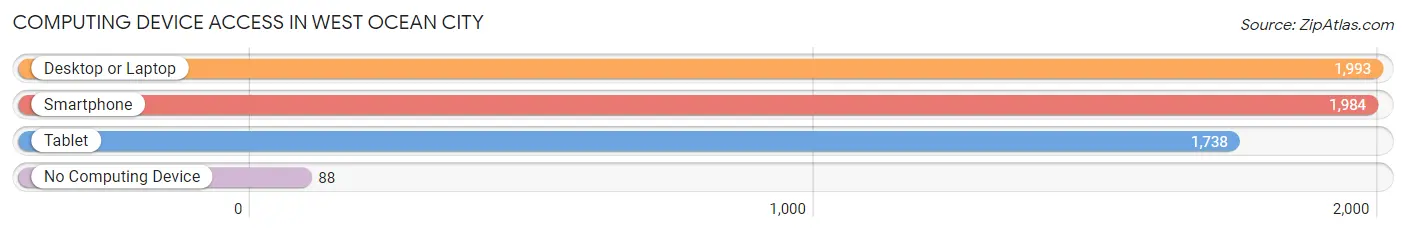
| Device Type | # Households | % Households |
| Desktop or Laptop | 1,993 | 87.9% |
| Smartphone | 1,984 | 87.6% |
| Tablet | 1,738 | 76.7% |
| No Computing Device | 88 | 3.9% |
| Total | 2,266 | 100.0% |
Internet Access in West Ocean City
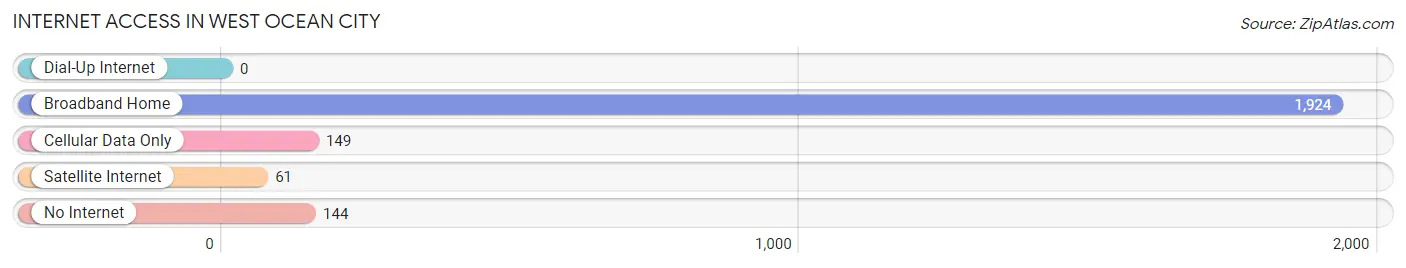
| Internet Type | # Households | % Households |
| Dial-Up Internet | 0 | 0.0% |
| Broadband Home | 1,924 | 84.9% |
| Cellular Data Only | 149 | 6.6% |
| Satellite Internet | 61 | 2.7% |
| No Internet | 144 | 6.4% |
| Total | 2,266 | 100.0% |
West Ocean City Summary
Ocean City, Maryland is a coastal resort town located in Worcester County, Maryland. It is situated on the Atlantic Ocean, just south of the Delaware border. The town is known for its beaches, boardwalk, and amusement parks. It is a popular destination for tourists and vacationers from all over the United States.
History
The area that is now Ocean City was first inhabited by Native Americans, who used the area for hunting and fishing. The first European settlers arrived in the area in the late 1600s. The town was officially founded in 1875 by Isaac Coffin, who named it after the nearby Atlantic Ocean.
In the early 1900s, Ocean City began to develop as a resort town. The first hotel was built in 1906, and the first boardwalk was constructed in 1910. The boardwalk quickly became a popular destination for tourists and vacationers.
In the 1950s, Ocean City began to expand and develop further. The town was incorporated in 1952, and the first high-rise hotel was built in 1956. The town continued to grow throughout the 1960s and 1970s, and by the 1980s, it had become a popular destination for tourists and vacationers from all over the United States.
Geography
Ocean City is located on the Atlantic Ocean, just south of the Delaware border. It is situated on a barrier island, which is separated from the mainland by the Isle of Wight Bay. The town is bordered by the Assawoman Bay to the west and the Sinepuxent Bay to the east.
The town has a total area of 10.2 square miles, of which 8.9 square miles is land and 1.3 square miles is water. The town has a humid subtropical climate, with hot, humid summers and mild winters.
Economy
The economy of Ocean City is largely based on tourism. The town is a popular destination for vacationers and tourists from all over the United States. The town is home to numerous hotels, restaurants, and other businesses that cater to tourists.
The town also has a thriving fishing industry. The local waters are home to a variety of fish, including flounder, bluefish, and sea bass. The town also has a number of marinas, which provide services to recreational boaters.
Demographics
As of the 2010 census, Ocean City had a population of 7,102. The racial makeup of the town was 94.3% White, 2.2% African American, 0.4% Native American, 0.9% Asian, 0.1% Pacific Islander, 0.7% from other races, and 1.4% from two or more races. Hispanic or Latino of any race were 2.7% of the population.
The median income for a household in the town was $50,944, and the median income for a family was $60,944. The per capita income for the town was $30,944. About 8.2% of families and 10.3% of the population were below the poverty line, including 15.2% of those under age 18 and 5.2% of those age 65 or over.
Common Questions
What is Per Capita Income in West Ocean City?
Per Capita income in West Ocean City is $64,548.
What is the Median Family Income in West Ocean City?
Median Family Income in West Ocean City is $113,221.
What is the Median Household income in West Ocean City?
Median Household Income in West Ocean City is $87,828.
What is Income or Wage Gap in West Ocean City?
Income or Wage Gap in West Ocean City is 30.7%.
Women in West Ocean City earn 69.3 cents for every dollar earned by a man.
What is Inequality or Gini Index in West Ocean City?
Inequality or Gini Index in West Ocean City is 0.54.
What is the Total Population of West Ocean City?
Total Population of West Ocean City is 5,246.
What is the Total Male Population of West Ocean City?
Total Male Population of West Ocean City is 2,699.
What is the Total Female Population of West Ocean City?
Total Female Population of West Ocean City is 2,547.
What is the Ratio of Males per 100 Females in West Ocean City?
There are 105.97 Males per 100 Females in West Ocean City.
What is the Ratio of Females per 100 Males in West Ocean City?
There are 94.37 Females per 100 Males in West Ocean City.
What is the Median Population Age in West Ocean City?
Median Population Age in West Ocean City is 46.3 Years.
What is the Average Family Size in West Ocean City
Average Family Size in West Ocean City is 2.9 People.
What is the Average Household Size in West Ocean City
Average Household Size in West Ocean City is 2.3 People.
How Large is the Labor Force in West Ocean City?
There are 2,985 People in the Labor Forcein in West Ocean City.
What is the Percentage of People in the Labor Force in West Ocean City?
70.2% of People are in the Labor Force in West Ocean City.
What is the Unemployment Rate in West Ocean City?
Unemployment Rate in West Ocean City is 10.0%.