Pinon Hills, CA Map & Demographics
Pinon Hills Overview
$35,831
PER CAPITA INCOME
$68,528
AVG FAMILY INCOME
$60,156
AVG HOUSEHOLD INCOME
34.2%
WAGE / INCOME GAP [ % ]
65.8¢/ $1
WAGE / INCOME GAP [ $ ]
0.59
INEQUALITY / GINI INDEX
7,157
TOTAL POPULATION
3,490
MALE POPULATION
3,667
FEMALE POPULATION
95.17
MALES / 100 FEMALES
105.07
FEMALES / 100 MALES
36.8
MEDIAN AGE
3.6
AVG FAMILY SIZE
3.0
AVG HOUSEHOLD SIZE
2,638
LABOR FORCE [ PEOPLE ]
48.9%
PERCENT IN LABOR FORCE
14.3%
UNEMPLOYMENT RATE
Pinon Hills Zip Codes
Income in Pinon Hills
Income Overview in Pinon Hills
Per Capita Income in Pinon Hills is $35,831, while median incomes of families and households are $68,528 and $60,156 respectively.
| Characteristic | Number | Measure |
| Per Capita Income | 7,157 | $35,831 |
| Median Family Income | 1,789 | $68,528 |
| Mean Family Income | 1,789 | $113,485 |
| Median Household Income | 2,389 | $60,156 |
| Mean Household Income | 2,389 | $106,183 |
| Income Deficit | 1,789 | $0 |
| Wage / Income Gap (%) | 7,157 | 34.16% |
| Wage / Income Gap ($) | 7,157 | 65.84¢ per $1 |
| Gini / Inequality Index | 7,157 | 0.59 |
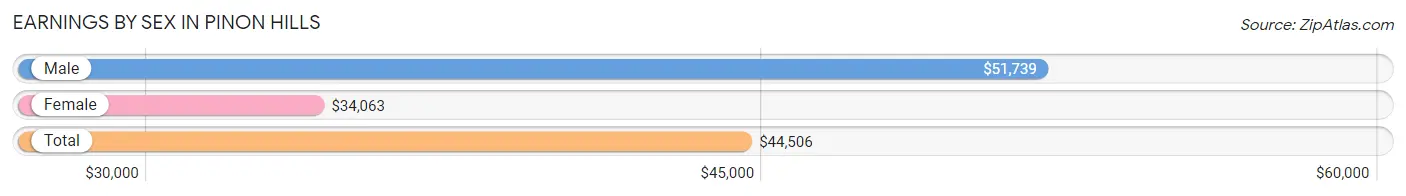
Earnings by Sex in Pinon Hills
Average Earnings in Pinon Hills are $44,506, $51,739 for men and $34,063 for women, a difference of 34.2%.
| Sex | Number | Average Earnings |
| Male | 1,387 (56.2%) | $51,739 |
| Female | 1,082 (43.8%) | $34,063 |
| Total | 2,469 (100.0%) | $44,506 |
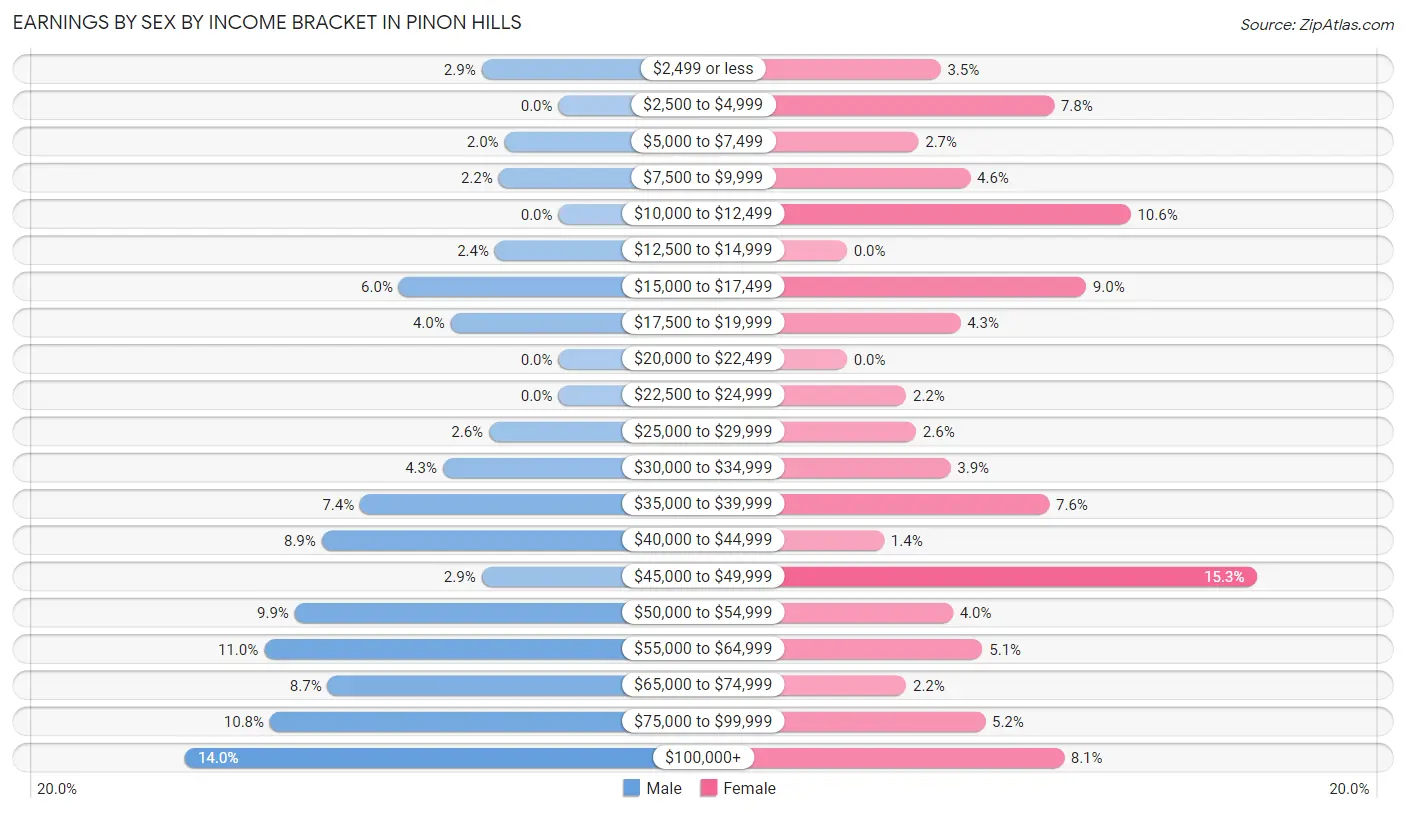
Earnings by Sex by Income Bracket in Pinon Hills
The most common earnings brackets in Pinon Hills are $100,000+ for men (194 | 14.0%) and $45,000 to $49,999 for women (166 | 15.3%).
| Income | Male | Female |
| $2,499 or less | 40 (2.9%) | 38 (3.5%) |
| $2,500 to $4,999 | 0 (0.0%) | 84 (7.8%) |
| $5,000 to $7,499 | 28 (2.0%) | 29 (2.7%) |
| $7,500 to $9,999 | 31 (2.2%) | 50 (4.6%) |
| $10,000 to $12,499 | 0 (0.0%) | 115 (10.6%) |
| $12,500 to $14,999 | 33 (2.4%) | 0 (0.0%) |
| $15,000 to $17,499 | 83 (6.0%) | 97 (9.0%) |
| $17,500 to $19,999 | 56 (4.0%) | 46 (4.3%) |
| $20,000 to $22,499 | 0 (0.0%) | 0 (0.0%) |
| $22,500 to $24,999 | 0 (0.0%) | 24 (2.2%) |
| $25,000 to $29,999 | 36 (2.6%) | 28 (2.6%) |
| $30,000 to $34,999 | 60 (4.3%) | 42 (3.9%) |
| $35,000 to $39,999 | 103 (7.4%) | 82 (7.6%) |
| $40,000 to $44,999 | 123 (8.9%) | 15 (1.4%) |
| $45,000 to $49,999 | 40 (2.9%) | 166 (15.3%) |
| $50,000 to $54,999 | 137 (9.9%) | 43 (4.0%) |
| $55,000 to $64,999 | 153 (11.0%) | 55 (5.1%) |
| $65,000 to $74,999 | 120 (8.6%) | 24 (2.2%) |
| $75,000 to $99,999 | 150 (10.8%) | 56 (5.2%) |
| $100,000+ | 194 (14.0%) | 88 (8.1%) |
| Total | 1,387 (100.0%) | 1,082 (100.0%) |
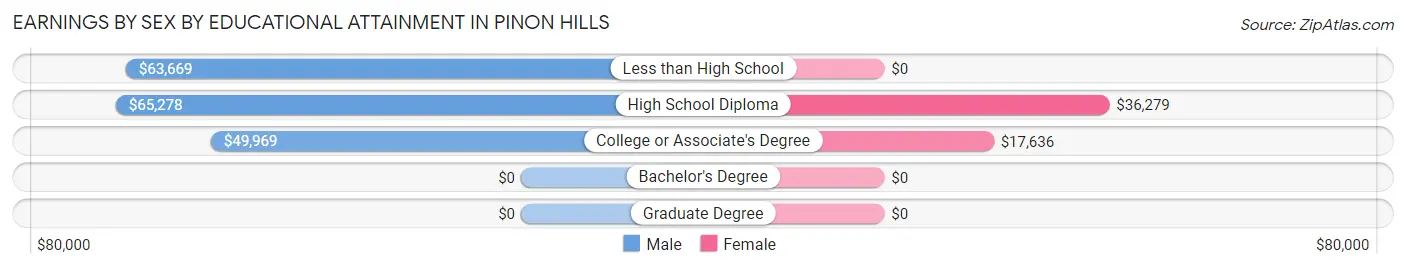
Earnings by Sex by Educational Attainment in Pinon Hills
Average earnings in Pinon Hills are $60,435 for men and $32,125 for women, a difference of 46.8%. Men with an educational attainment of high school diploma enjoy the highest average annual earnings of $65,278, while those with college or associate's degree education earn the least with $49,969. Women with an educational attainment of high school diploma earn the most with the average annual earnings of $36,279, while those with college or associate's degree education have the smallest earnings of $17,636.
| Educational Attainment | Male Income | Female Income |
| Less than High School | $63,669 | $0 |
| High School Diploma | $65,278 | $36,279 |
| College or Associate's Degree | $49,969 | $17,636 |
| Bachelor's Degree | - | - |
| Graduate Degree | - | - |
| Total | $60,435 | $32,125 |
Family Income in Pinon Hills
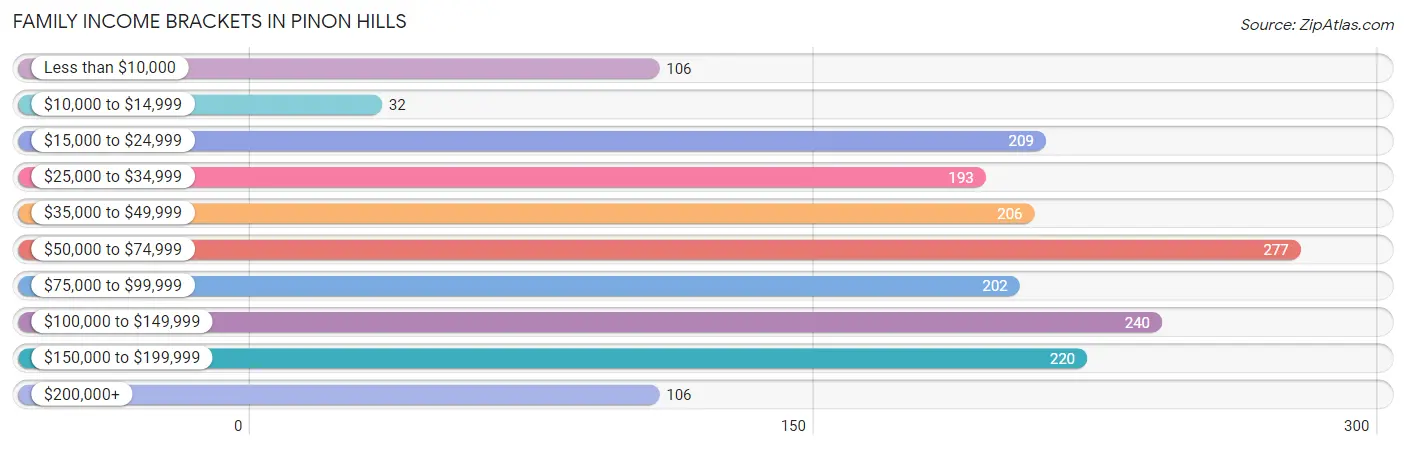
Family Income Brackets in Pinon Hills
According to the Pinon Hills family income data, there are 277 families falling into the $50,000 to $74,999 income range, which is the most common income bracket and makes up 15.5% of all families. Conversely, the $10,000 to $14,999 income bracket is the least frequent group with only 32 families (1.8%) belonging to this category.
| Income Bracket | # Families | % Families |
| Less than $10,000 | 106 | 5.9% |
| $10,000 to $14,999 | 32 | 1.8% |
| $15,000 to $24,999 | 209 | 11.7% |
| $25,000 to $34,999 | 193 | 10.8% |
| $35,000 to $49,999 | 206 | 11.5% |
| $50,000 to $74,999 | 277 | 15.5% |
| $75,000 to $99,999 | 202 | 11.3% |
| $100,000 to $149,999 | 240 | 13.4% |
| $150,000 to $199,999 | 220 | 12.3% |
| $200,000+ | 106 | 5.9% |
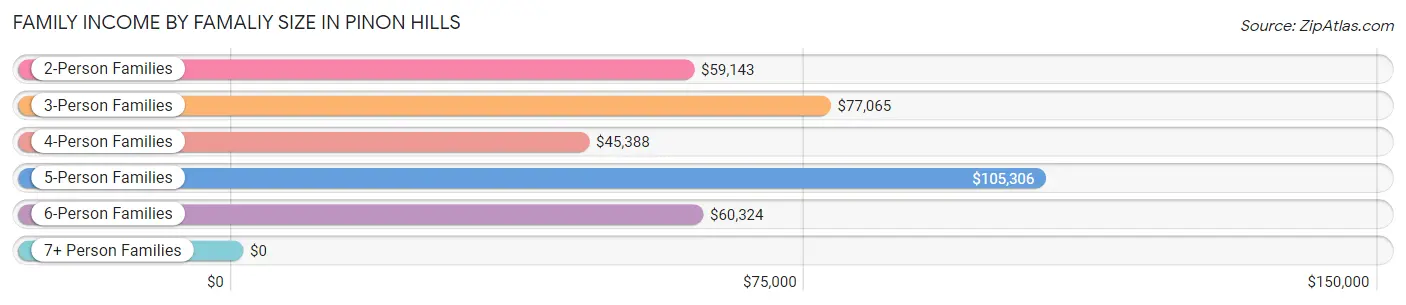
Family Income by Famaliy Size in Pinon Hills
5-person families (193 | 10.8%) account for the highest median family income in Pinon Hills with $105,306 per family, while 2-person families (874 | 48.8%) have the highest median income of $29,572 per family member.
| Income Bracket | # Families | Median Income |
| 2-Person Families | 874 (48.8%) | $59,143 |
| 3-Person Families | 250 (14.0%) | $77,065 |
| 4-Person Families | 265 (14.8%) | $45,388 |
| 5-Person Families | 193 (10.8%) | $105,306 |
| 6-Person Families | 123 (6.9%) | $60,324 |
| 7+ Person Families | 84 (4.7%) | $0 |
| Total | 1,789 (100.0%) | $68,528 |
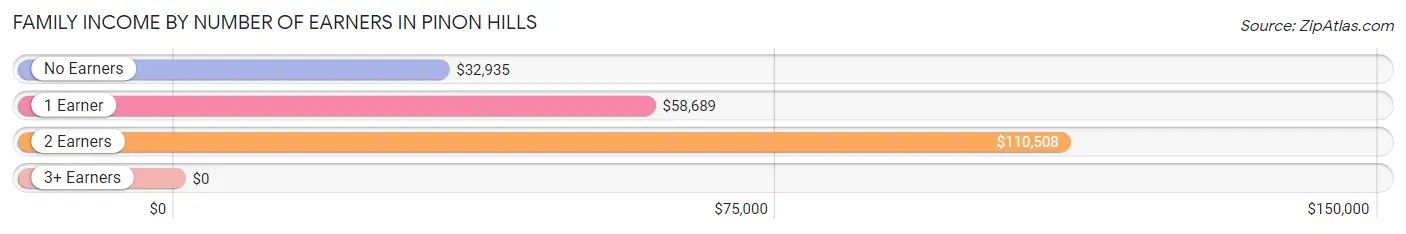
Family Income by Number of Earners in Pinon Hills
| Number of Earners | # Families | Median Income |
| No Earners | 572 (32.0%) | $32,935 |
| 1 Earner | 653 (36.5%) | $58,689 |
| 2 Earners | 519 (29.0%) | $110,508 |
| 3+ Earners | 45 (2.5%) | $0 |
| Total | 1,789 (100.0%) | $68,528 |
Household Income in Pinon Hills
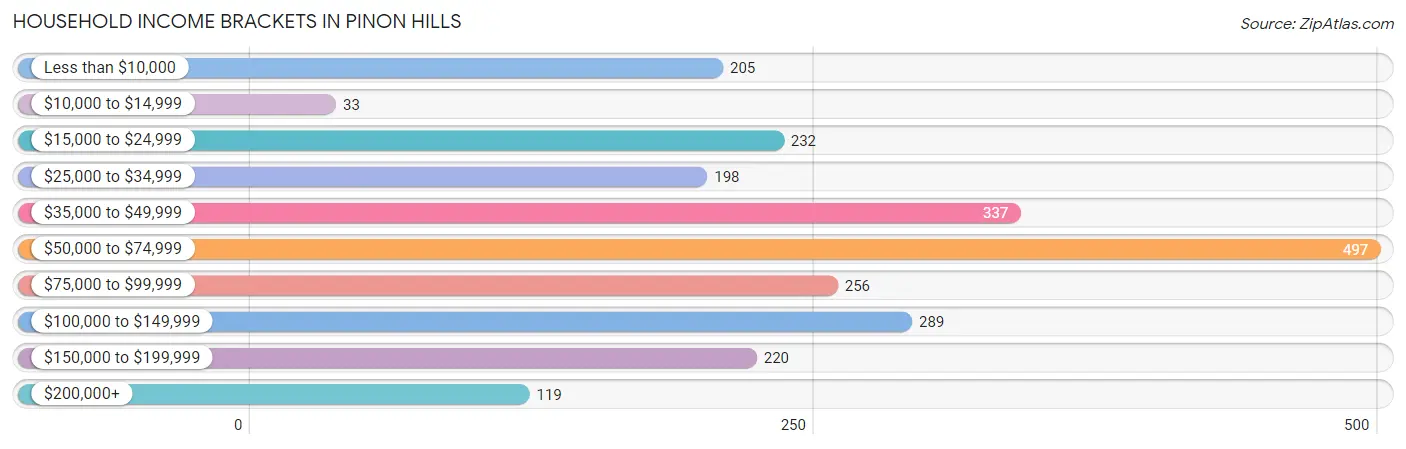
Household Income Brackets in Pinon Hills
With 497 households falling in the category, the $50,000 to $74,999 income range is the most frequent in Pinon Hills, accounting for 20.8% of all households. In contrast, only 33 households (1.4%) fall into the $10,000 to $14,999 income bracket, making it the least populous group.
| Income Bracket | # Households | % Households |
| Less than $10,000 | 205 | 8.6% |
| $10,000 to $14,999 | 33 | 1.4% |
| $15,000 to $24,999 | 232 | 9.7% |
| $25,000 to $34,999 | 198 | 8.3% |
| $35,000 to $49,999 | 337 | 14.1% |
| $50,000 to $74,999 | 497 | 20.8% |
| $75,000 to $99,999 | 256 | 10.7% |
| $100,000 to $149,999 | 289 | 12.1% |
| $150,000 to $199,999 | 220 | 9.2% |
| $200,000+ | 119 | 5.0% |
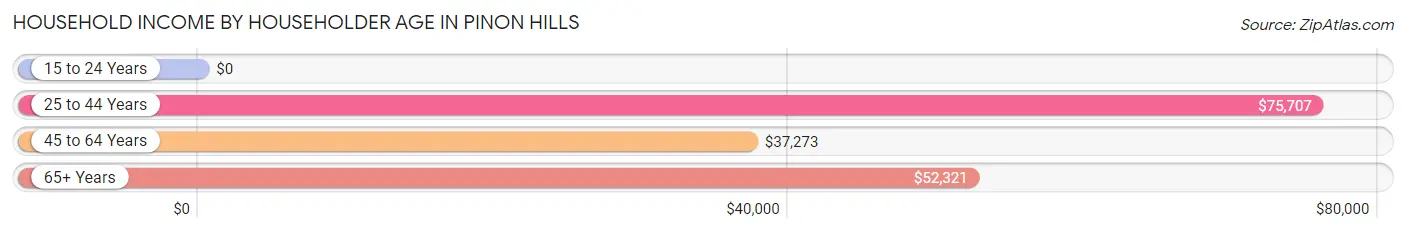
Household Income by Householder Age in Pinon Hills
The median household income in Pinon Hills is $60,156, with the highest median household income of $75,707 found in the 25 to 44 years age bracket for the primary householder. A total of 673 households (28.2%) fall into this category. Meanwhile, the 15 to 24 years age bracket for the primary householder has the lowest median household income of $0, with 66 households (2.8%) in this group.
| Income Bracket | # Households | Median Income |
| 15 to 24 Years | 66 (2.8%) | $0 |
| 25 to 44 Years | 673 (28.2%) | $75,707 |
| 45 to 64 Years | 944 (39.5%) | $37,273 |
| 65+ Years | 706 (29.5%) | $52,321 |
| Total | 2,389 (100.0%) | $60,156 |
Poverty in Pinon Hills
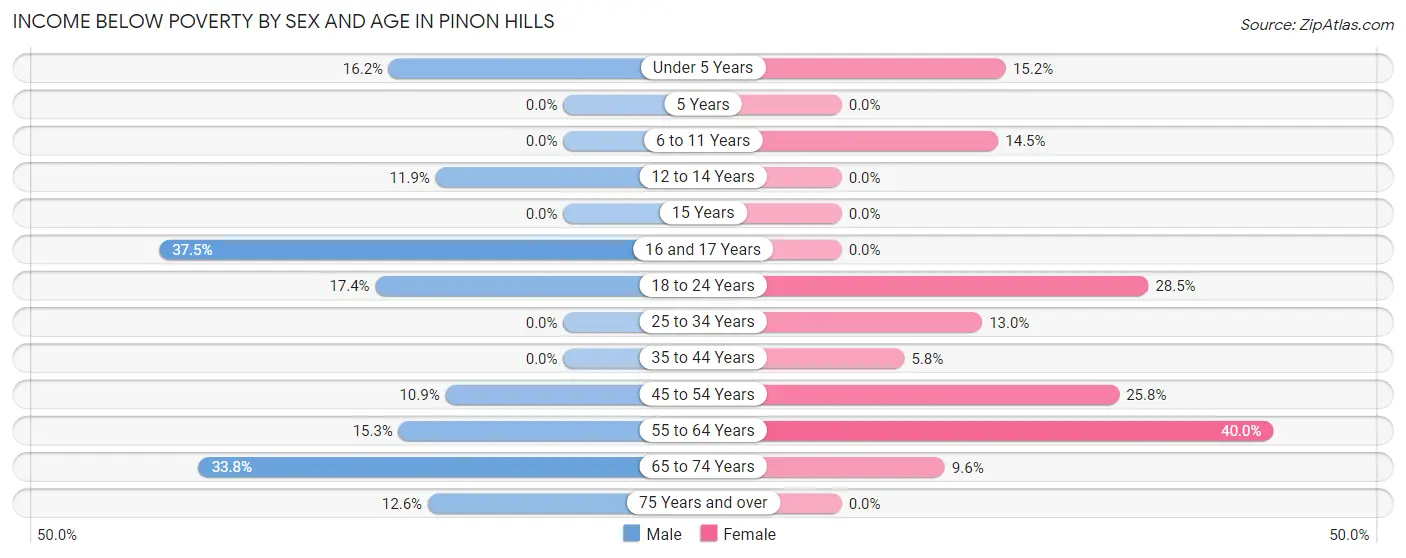
Income Below Poverty by Sex and Age in Pinon Hills
With 11.5% poverty level for males and 16.1% for females among the residents of Pinon Hills, 16 and 17 year old males and 55 to 64 year old females are the most vulnerable to poverty, with 15 males (37.5%) and 217 females (40.0%) in their respective age groups living below the poverty level.
| Age Bracket | Male | Female |
| Under 5 Years | 51 (16.2%) | 48 (15.2%) |
| 5 Years | 0 (0.0%) | 0 (0.0%) |
| 6 to 11 Years | 0 (0.0%) | 69 (14.5%) |
| 12 to 14 Years | 16 (11.8%) | 0 (0.0%) |
| 15 Years | 0 (0.0%) | 0 (0.0%) |
| 16 and 17 Years | 15 (37.5%) | 0 (0.0%) |
| 18 to 24 Years | 34 (17.4%) | 37 (28.5%) |
| 25 to 34 Years | 0 (0.0%) | 77 (13.0%) |
| 35 to 44 Years | 0 (0.0%) | 17 (5.8%) |
| 45 to 54 Years | 28 (10.9%) | 86 (25.8%) |
| 55 to 64 Years | 99 (15.3%) | 217 (40.0%) |
| 65 to 74 Years | 134 (33.8%) | 38 (9.6%) |
| 75 Years and over | 24 (12.6%) | 0 (0.0%) |
| Total | 401 (11.5%) | 589 (16.1%) |
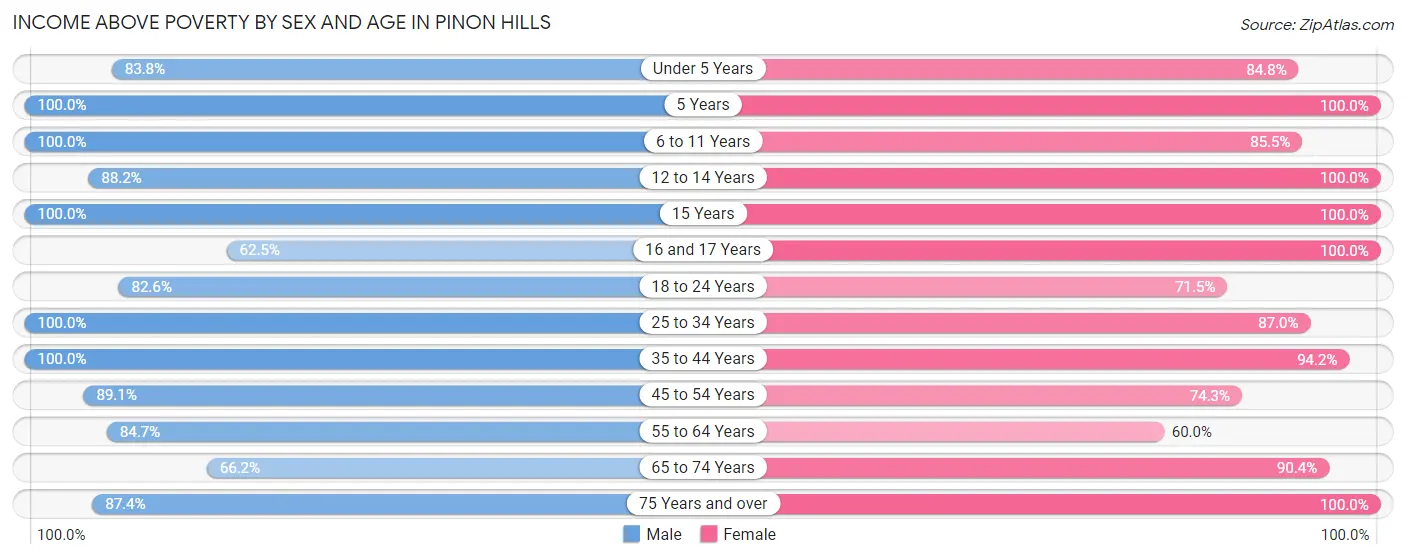
Income Above Poverty by Sex and Age in Pinon Hills
According to the poverty statistics in Pinon Hills, males aged 5 years and females aged 5 years are the age groups that are most secure financially, with 100.0% of males and 100.0% of females in these age groups living above the poverty line.
| Age Bracket | Male | Female |
| Under 5 Years | 264 (83.8%) | 267 (84.8%) |
| 5 Years | 67 (100.0%) | 35 (100.0%) |
| 6 to 11 Years | 164 (100.0%) | 406 (85.5%) |
| 12 to 14 Years | 119 (88.1%) | 178 (100.0%) |
| 15 Years | 44 (100.0%) | 34 (100.0%) |
| 16 and 17 Years | 25 (62.5%) | 85 (100.0%) |
| 18 to 24 Years | 161 (82.6%) | 93 (71.5%) |
| 25 to 34 Years | 514 (100.0%) | 514 (87.0%) |
| 35 to 44 Years | 525 (100.0%) | 275 (94.2%) |
| 45 to 54 Years | 228 (89.1%) | 248 (74.3%) |
| 55 to 64 Years | 549 (84.7%) | 325 (60.0%) |
| 65 to 74 Years | 262 (66.2%) | 359 (90.4%) |
| 75 Years and over | 167 (87.4%) | 259 (100.0%) |
| Total | 3,089 (88.5%) | 3,078 (83.9%) |
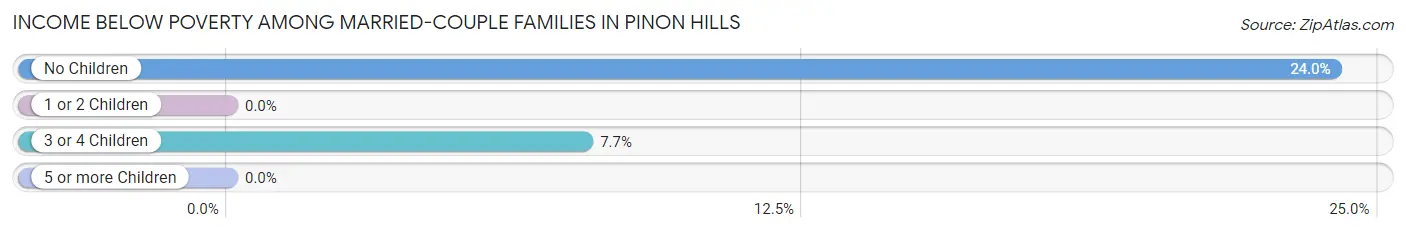
Income Below Poverty Among Married-Couple Families in Pinon Hills
The poverty statistics for married-couple families in Pinon Hills show that 14.1% or 197 of the total 1,401 families live below the poverty line. Families with no children have the highest poverty rate of 24.0%, comprising of 180 families. On the other hand, families with 1 or 2 children have the lowest poverty rate of 0.0%, which includes 0 families.
| Children | Above Poverty | Below Poverty |
| No Children | 569 (76.0%) | 180 (24.0%) |
| 1 or 2 Children | 432 (100.0%) | 0 (0.0%) |
| 3 or 4 Children | 203 (92.3%) | 17 (7.7%) |
| 5 or more Children | 0 (0.0%) | 0 (0.0%) |
| Total | 1,204 (85.9%) | 197 (14.1%) |
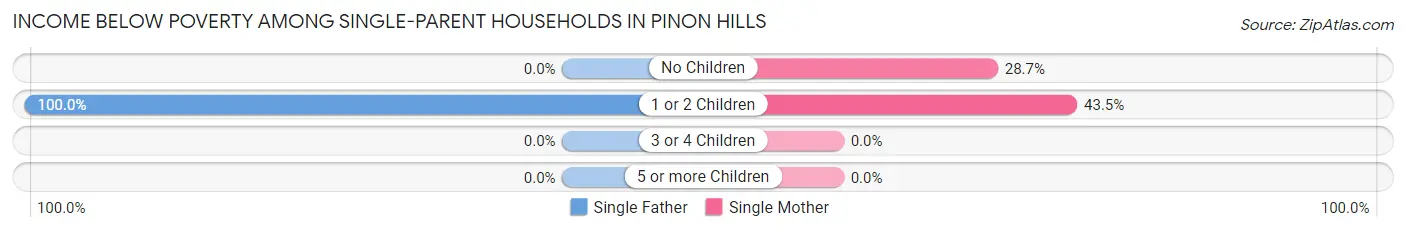
Income Below Poverty Among Single-Parent Households in Pinon Hills
According to the poverty data in Pinon Hills, 8.8% or 16 single-father households and 35.3% or 73 single-mother households are living below the poverty line. Among single-father households, those with 1 or 2 children have the highest poverty rate, with 16 households (100.0%) experiencing poverty. Likewise, among single-mother households, those with 1 or 2 children have the highest poverty rate, with 40 households (43.5%) falling below the poverty line.
| Children | Single Father | Single Mother |
| No Children | 0 (0.0%) | 33 (28.7%) |
| 1 or 2 Children | 16 (100.0%) | 40 (43.5%) |
| 3 or 4 Children | 0 (0.0%) | 0 (0.0%) |
| 5 or more Children | 0 (0.0%) | 0 (0.0%) |
| Total | 16 (8.8%) | 73 (35.3%) |
Income Below Poverty Among Married-Couple vs Single-Parent Households in Pinon Hills
The poverty data for Pinon Hills shows that 197 of the married-couple family households (14.1%) and 89 of the single-parent households (22.9%) are living below the poverty level. Within the married-couple family households, those with no children have the highest poverty rate, with 180 households (24.0%) falling below the poverty line. Among the single-parent households, those with 1 or 2 children have the highest poverty rate, with 56 household (51.8%) living below poverty.
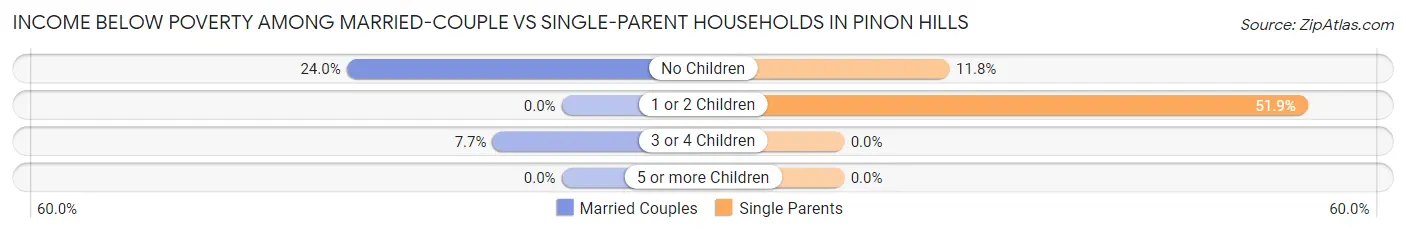
| Children | Married-Couple Families | Single-Parent Households |
| No Children | 180 (24.0%) | 33 (11.8%) |
| 1 or 2 Children | 0 (0.0%) | 56 (51.8%) |
| 3 or 4 Children | 17 (7.7%) | 0 (0.0%) |
| 5 or more Children | 0 (0.0%) | 0 (0.0%) |
| Total | 197 (14.1%) | 89 (22.9%) |
Race in Pinon Hills
The most populous races in Pinon Hills are White / Caucasian (4,906 | 68.5%), Hispanic or Latino (3,257 | 45.5%), and Two or more Races (1,072 | 15.0%).
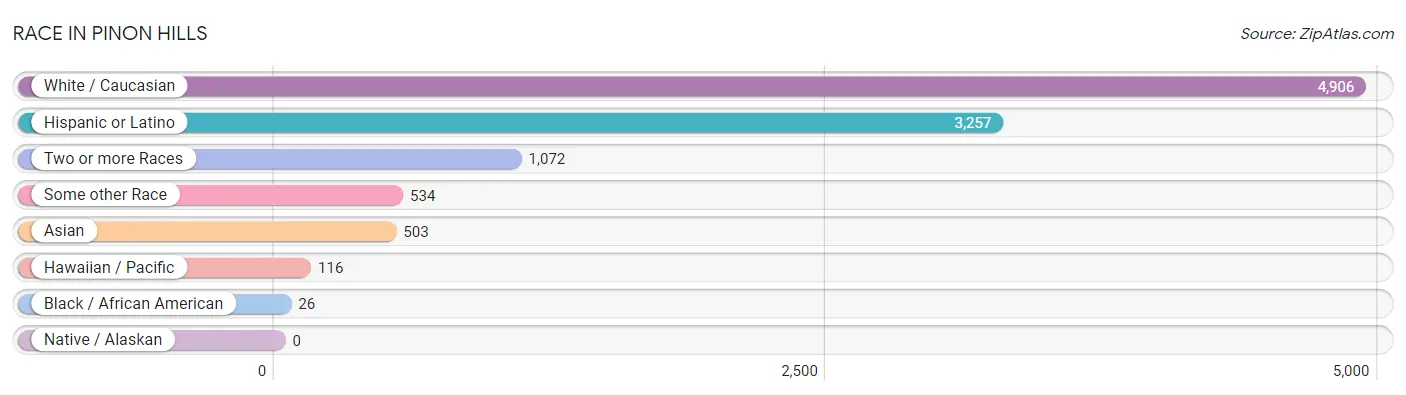
| Race | # Population | % Population |
| Asian | 503 | 7.0% |
| Black / African American | 26 | 0.4% |
| Hawaiian / Pacific | 116 | 1.6% |
| Hispanic or Latino | 3,257 | 45.5% |
| Native / Alaskan | 0 | 0.0% |
| White / Caucasian | 4,906 | 68.5% |
| Two or more Races | 1,072 | 15.0% |
| Some other Race | 534 | 7.5% |
| Total | 7,157 | 100.0% |
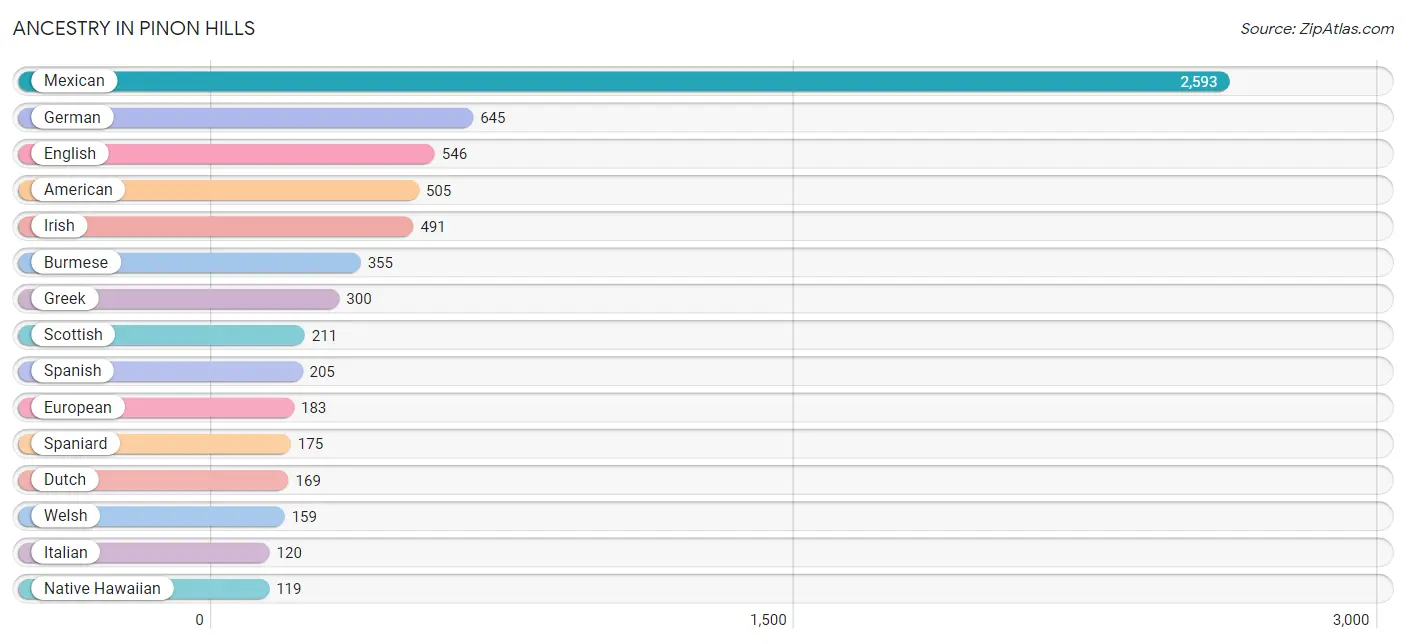
Ancestry in Pinon Hills
The most populous ancestries reported in Pinon Hills are Mexican (2,593 | 36.2%), German (645 | 9.0%), English (546 | 7.6%), American (505 | 7.1%), and Irish (491 | 6.9%), together accounting for 66.8% of all Pinon Hills residents.
| Ancestry | # Population | % Population |
| American | 505 | 7.1% |
| Australian | 24 | 0.3% |
| Austrian | 29 | 0.4% |
| Burmese | 355 | 5.0% |
| Cuban | 33 | 0.5% |
| Dutch | 169 | 2.4% |
| English | 546 | 7.6% |
| European | 183 | 2.6% |
| German | 645 | 9.0% |
| Greek | 300 | 4.2% |
| Guamanian / Chamorro | 45 | 0.6% |
| Indian (Asian) | 46 | 0.6% |
| Irish | 491 | 6.9% |
| Israeli | 111 | 1.5% |
| Italian | 120 | 1.7% |
| Korean | 58 | 0.8% |
| Lithuanian | 14 | 0.2% |
| Mexican | 2,593 | 36.2% |
| Native Hawaiian | 119 | 1.7% |
| Norwegian | 42 | 0.6% |
| Polish | 72 | 1.0% |
| Portuguese | 17 | 0.2% |
| Puerto Rican | 93 | 1.3% |
| Russian | 39 | 0.5% |
| Scandinavian | 38 | 0.5% |
| Scotch-Irish | 42 | 0.6% |
| Scottish | 211 | 2.9% |
| Spaniard | 175 | 2.5% |
| Spanish | 205 | 2.9% |
| Swiss | 41 | 0.6% |
| Thai | 44 | 0.6% |
| Welsh | 159 | 2.2% | View All 32 Rows |
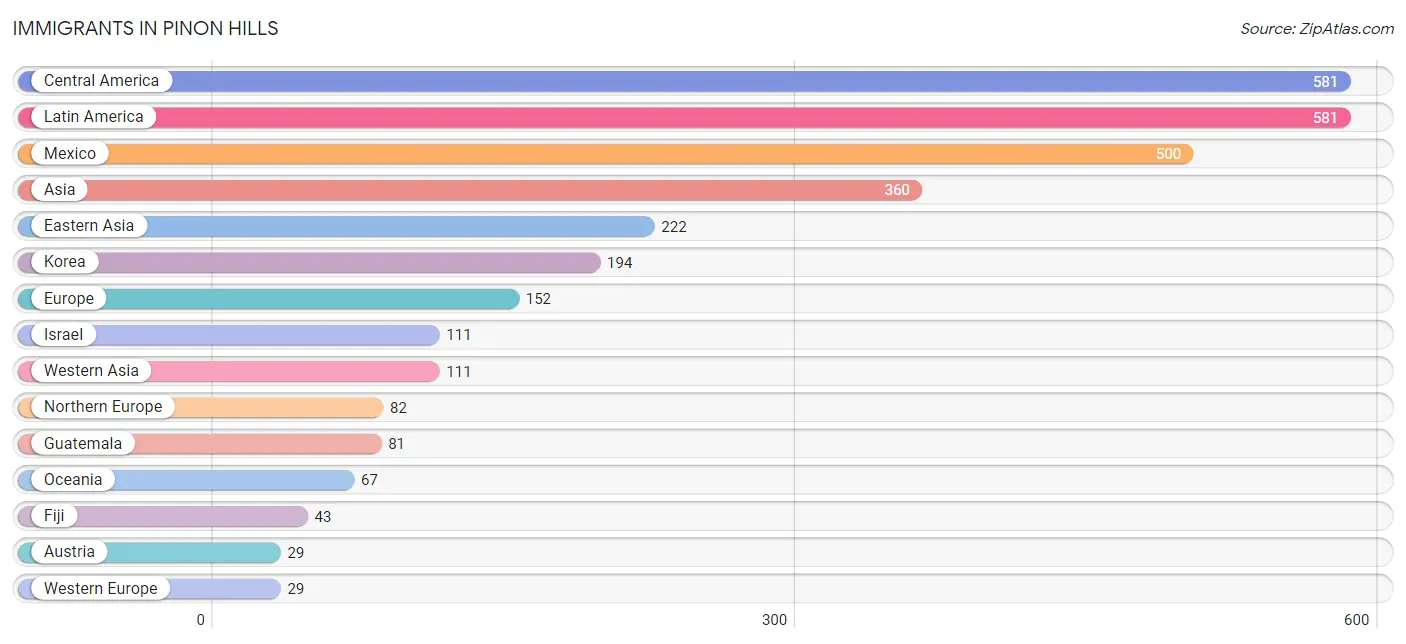
Immigrants in Pinon Hills
The most numerous immigrant groups reported in Pinon Hills came from Central America (581 | 8.1%), Latin America (581 | 8.1%), Mexico (500 | 7.0%), Asia (360 | 5.0%), and Eastern Asia (222 | 3.1%), together accounting for 31.4% of all Pinon Hills residents.
| Immigration Origin | # Population | % Population |
| Asia | 360 | 5.0% |
| Australia | 24 | 0.3% |
| Austria | 29 | 0.4% |
| Central America | 581 | 8.1% |
| China | 28 | 0.4% |
| Eastern Asia | 222 | 3.1% |
| Eastern Europe | 14 | 0.2% |
| Europe | 152 | 2.1% |
| Fiji | 43 | 0.6% |
| Greece | 27 | 0.4% |
| Guatemala | 81 | 1.1% |
| Israel | 111 | 1.5% |
| Korea | 194 | 2.7% |
| Latin America | 581 | 8.1% |
| Lithuania | 14 | 0.2% |
| Mexico | 500 | 7.0% |
| Northern Europe | 82 | 1.1% |
| Oceania | 67 | 0.9% |
| Philippines | 27 | 0.4% |
| South Eastern Asia | 27 | 0.4% |
| Southern Europe | 27 | 0.4% |
| Western Asia | 111 | 1.5% |
| Western Europe | 29 | 0.4% | View All 23 Rows |
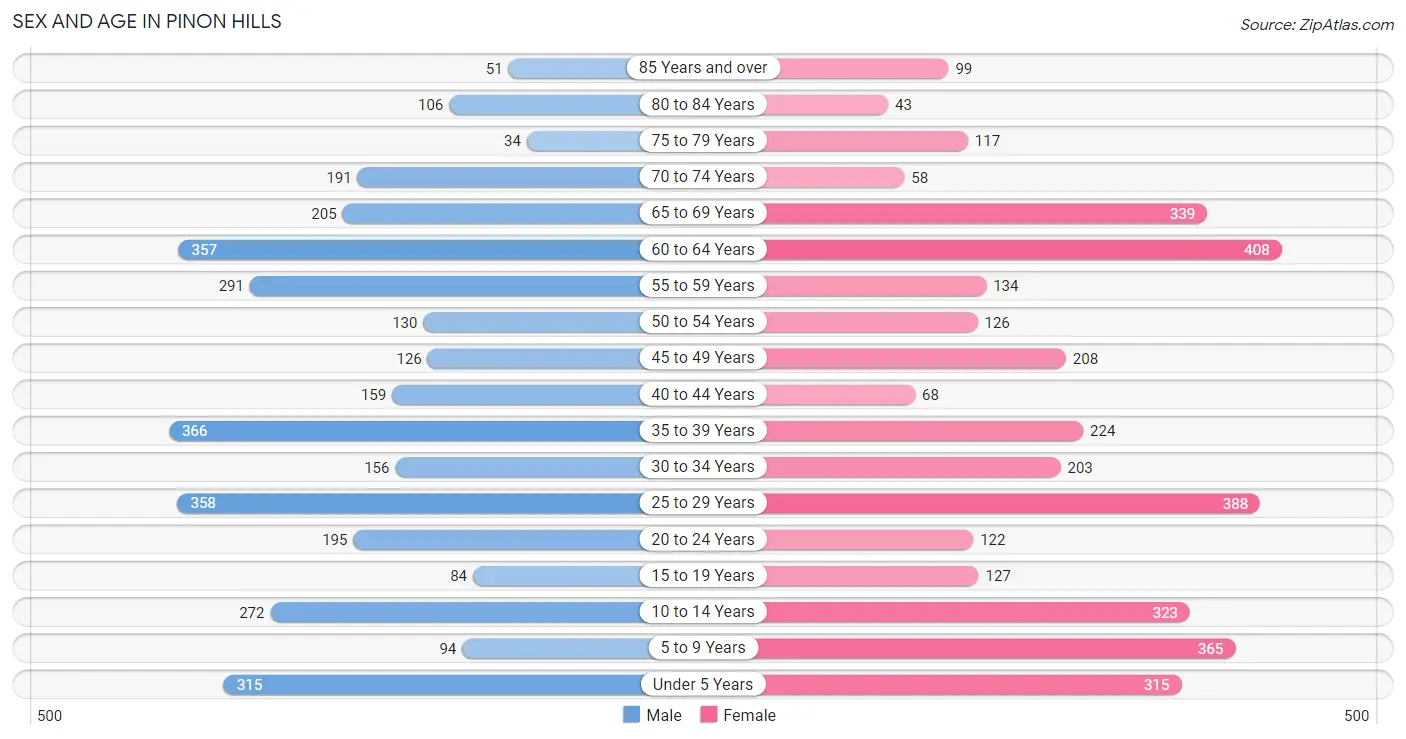
Sex and Age in Pinon Hills
Sex and Age in Pinon Hills
The most populous age groups in Pinon Hills are 35 to 39 Years (366 | 10.5%) for men and 60 to 64 Years (408 | 11.1%) for women.
| Age Bracket | Male | Female |
| Under 5 Years | 315 (9.0%) | 315 (8.6%) |
| 5 to 9 Years | 94 (2.7%) | 365 (10.0%) |
| 10 to 14 Years | 272 (7.8%) | 323 (8.8%) |
| 15 to 19 Years | 84 (2.4%) | 127 (3.5%) |
| 20 to 24 Years | 195 (5.6%) | 122 (3.3%) |
| 25 to 29 Years | 358 (10.3%) | 388 (10.6%) |
| 30 to 34 Years | 156 (4.5%) | 203 (5.5%) |
| 35 to 39 Years | 366 (10.5%) | 224 (6.1%) |
| 40 to 44 Years | 159 (4.6%) | 68 (1.8%) |
| 45 to 49 Years | 126 (3.6%) | 208 (5.7%) |
| 50 to 54 Years | 130 (3.7%) | 126 (3.4%) |
| 55 to 59 Years | 291 (8.3%) | 134 (3.6%) |
| 60 to 64 Years | 357 (10.2%) | 408 (11.1%) |
| 65 to 69 Years | 205 (5.9%) | 339 (9.2%) |
| 70 to 74 Years | 191 (5.5%) | 58 (1.6%) |
| 75 to 79 Years | 34 (1.0%) | 117 (3.2%) |
| 80 to 84 Years | 106 (3.0%) | 43 (1.2%) |
| 85 Years and over | 51 (1.5%) | 99 (2.7%) |
| Total | 3,490 (100.0%) | 3,667 (100.0%) |
Families and Households in Pinon Hills
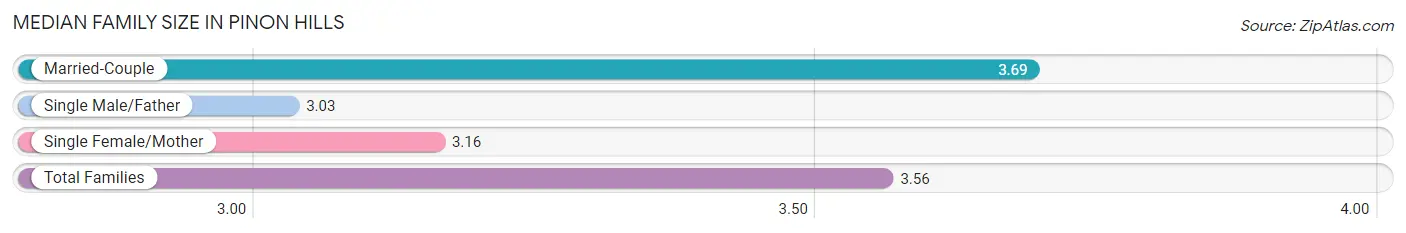
Median Family Size in Pinon Hills
The median family size in Pinon Hills is 3.56 persons per family, with married-couple families (1,401 | 78.3%) accounting for the largest median family size of 3.69 persons per family. On the other hand, single male/father families (181 | 10.1%) represent the smallest median family size with 3.03 persons per family.
| Family Type | # Families | Family Size |
| Married-Couple | 1,401 (78.3%) | 3.69 |
| Single Male/Father | 181 (10.1%) | 3.03 |
| Single Female/Mother | 207 (11.6%) | 3.16 |
| Total Families | 1,789 (100.0%) | 3.56 |
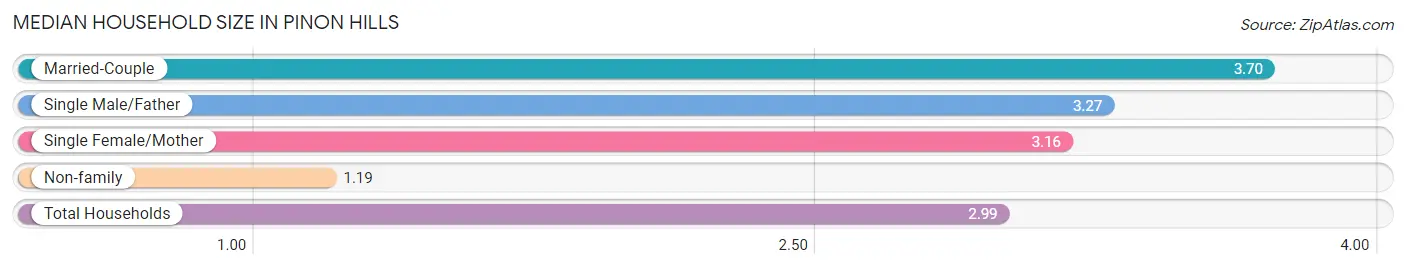
Median Household Size in Pinon Hills
The median household size in Pinon Hills is 2.99 persons per household, with married-couple households (1,401 | 58.6%) accounting for the largest median household size of 3.7 persons per household. non-family households (600 | 25.1%) represent the smallest median household size with 1.19 persons per household.
| Household Type | # Households | Household Size |
| Married-Couple | 1,401 (58.6%) | 3.70 |
| Single Male/Father | 181 (7.6%) | 3.27 |
| Single Female/Mother | 207 (8.7%) | 3.16 |
| Non-family | 600 (25.1%) | 1.19 |
| Total Households | 2,389 (100.0%) | 2.99 |
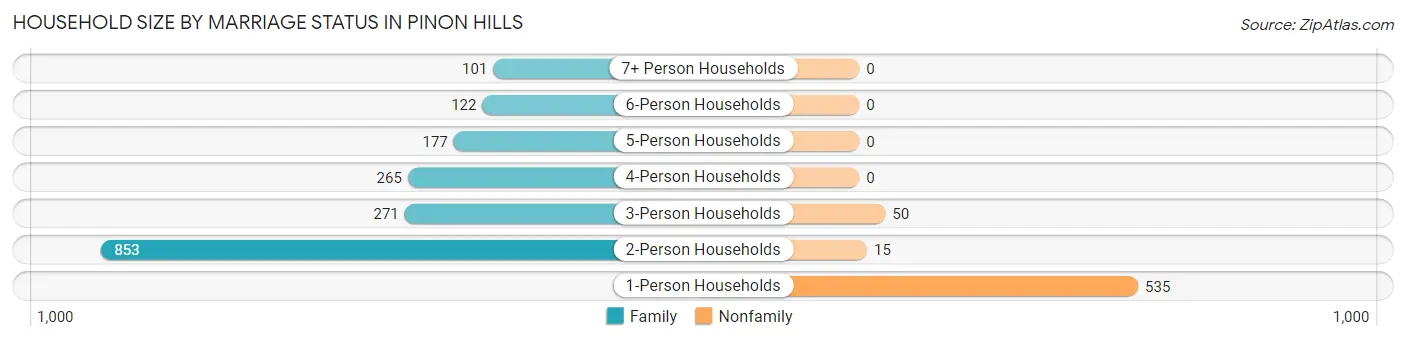
Household Size by Marriage Status in Pinon Hills
Out of a total of 2,389 households in Pinon Hills, 1,789 (74.9%) are family households, while 600 (25.1%) are nonfamily households. The most numerous type of family households are 2-person households, comprising 853, and the most common type of nonfamily households are 1-person households, comprising 535.
| Household Size | Family Households | Nonfamily Households |
| 1-Person Households | - | 535 (22.4%) |
| 2-Person Households | 853 (35.7%) | 15 (0.6%) |
| 3-Person Households | 271 (11.3%) | 50 (2.1%) |
| 4-Person Households | 265 (11.1%) | 0 (0.0%) |
| 5-Person Households | 177 (7.4%) | 0 (0.0%) |
| 6-Person Households | 122 (5.1%) | 0 (0.0%) |
| 7+ Person Households | 101 (4.2%) | 0 (0.0%) |
| Total | 1,789 (74.9%) | 600 (25.1%) |
Female Fertility in Pinon Hills
Fertility by Age in Pinon Hills
Average fertility rate in Pinon Hills is 46.0 births per 1,000 women. Women in the age bracket of 20 to 34 years have the highest fertility rate with 88.0 births per 1,000 women. Women in the age bracket of 20 to 34 years acount for 100.0% of all women with births.
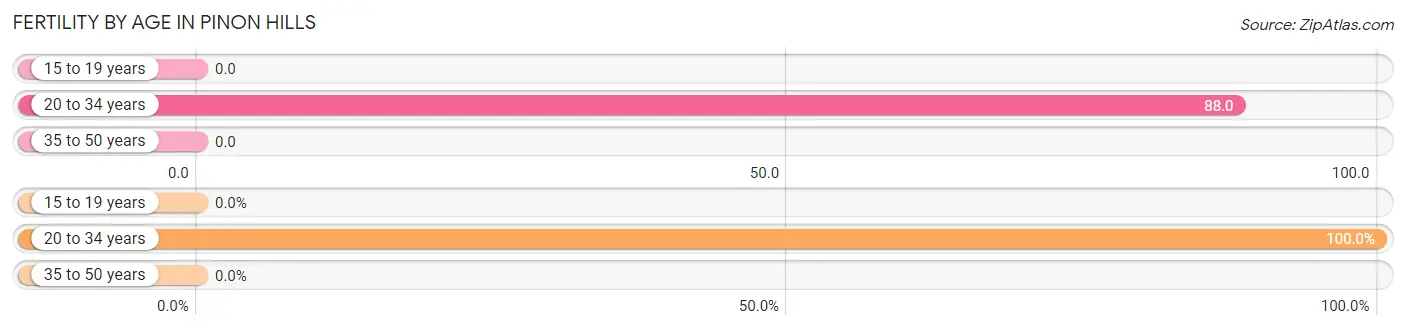
| Age Bracket | Women with Births | Births / 1,000 Women |
| 15 to 19 years | 0 (0.0%) | 0.0 |
| 20 to 34 years | 63 (100.0%) | 88.0 |
| 35 to 50 years | 0 (0.0%) | 0.0 |
| Total | 63 (100.0%) | 46.0 |
Fertility by Age by Marriage Status in Pinon Hills
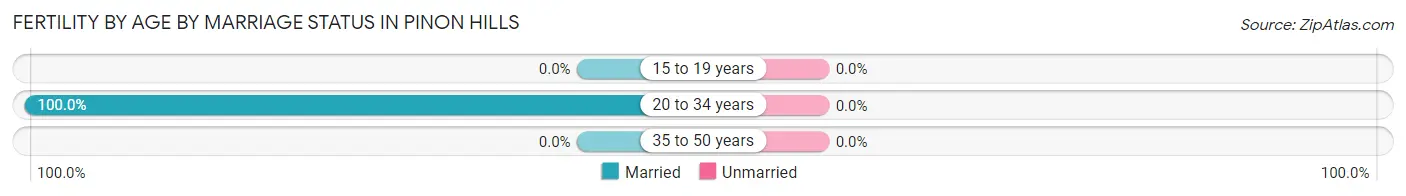
| Age Bracket | Married | Unmarried |
| 15 to 19 years | 0 (0.0%) | 0 (0.0%) |
| 20 to 34 years | 63 (100.0%) | 0 (0.0%) |
| 35 to 50 years | 0 (0.0%) | 0 (0.0%) |
| Total | 63 (100.0%) | 0 (0.0%) |
Fertility by Education in Pinon Hills
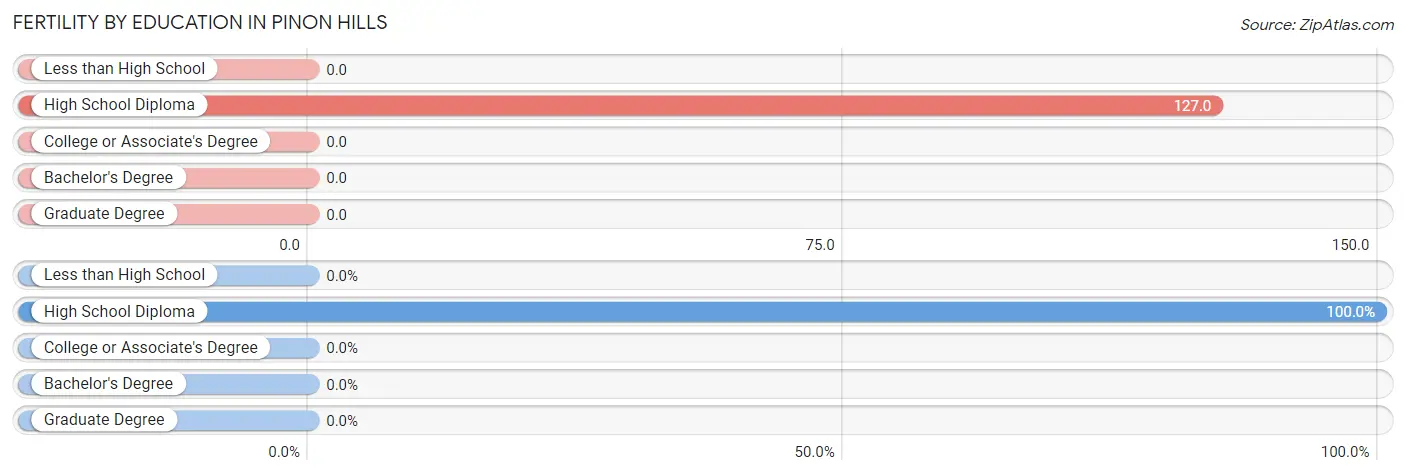
| Educational Attainment | Women with Births | Births / 1,000 Women |
| Less than High School | 0 (0.0%) | 0.0 |
| High School Diploma | 63 (100.0%) | 127.0 |
| College or Associate's Degree | 0 (0.0%) | 0.0 |
| Bachelor's Degree | 0 (0.0%) | 0.0 |
| Graduate Degree | 0 (0.0%) | 0.0 |
| Total | 63 (100.0%) | 46.0 |
Fertility by Education by Marriage Status in Pinon Hills
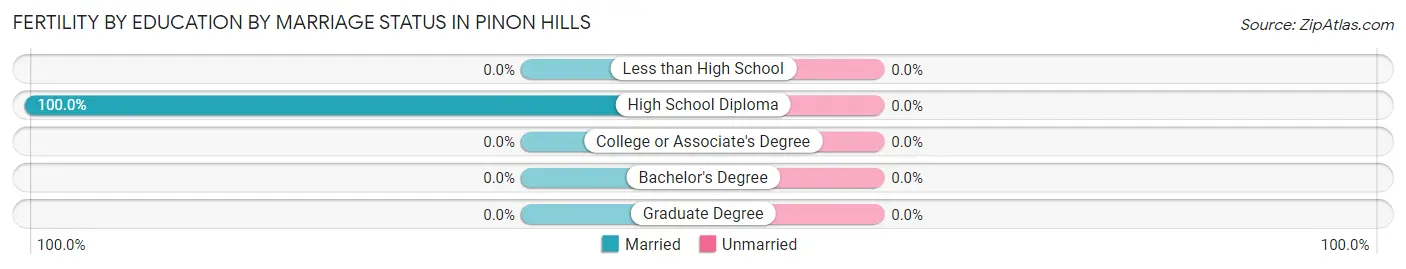
| Educational Attainment | Married | Unmarried |
| Less than High School | 0 (0.0%) | 0 (0.0%) |
| High School Diploma | 63 (100.0%) | 0 (0.0%) |
| College or Associate's Degree | 0 (0.0%) | 0 (0.0%) |
| Bachelor's Degree | 0 (0.0%) | 0 (0.0%) |
| Graduate Degree | 0 (0.0%) | 0 (0.0%) |
| Total | 63 (100.0%) | 0 (0.0%) |
Employment Characteristics in Pinon Hills
Employment by Class of Employer in Pinon Hills
Among the 2,242 employed individuals in Pinon Hills, private company employees (1,573 | 70.2%), self-employed (not incorporated) (177 | 7.9%), and local government employees (152 | 6.8%) make up the most common classes of employment.
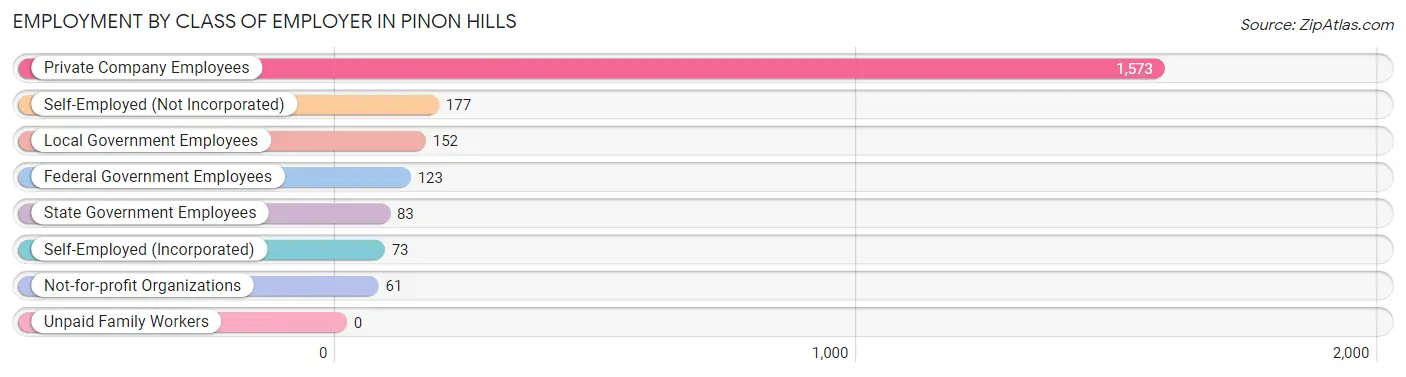
| Employer Class | # Employees | % Employees |
| Private Company Employees | 1,573 | 70.2% |
| Self-Employed (Incorporated) | 73 | 3.3% |
| Self-Employed (Not Incorporated) | 177 | 7.9% |
| Not-for-profit Organizations | 61 | 2.7% |
| Local Government Employees | 152 | 6.8% |
| State Government Employees | 83 | 3.7% |
| Federal Government Employees | 123 | 5.5% |
| Unpaid Family Workers | 0 | 0.0% |
| Total | 2,242 | 100.0% |
Employment Status by Age in Pinon Hills
According to the labor force statistics for Pinon Hills, out of the total population over 16 years of age (5,395), 48.9% or 2,638 individuals are in the labor force, with 14.3% or 377 of them unemployed. The age group with the highest labor force participation rate is 20 to 24 years, with 78.5% or 249 individuals in the labor force. Within the labor force, the 60 to 64 years age range has the highest percentage of unemployed individuals, with 25.6% or 41 of them being unemployed.
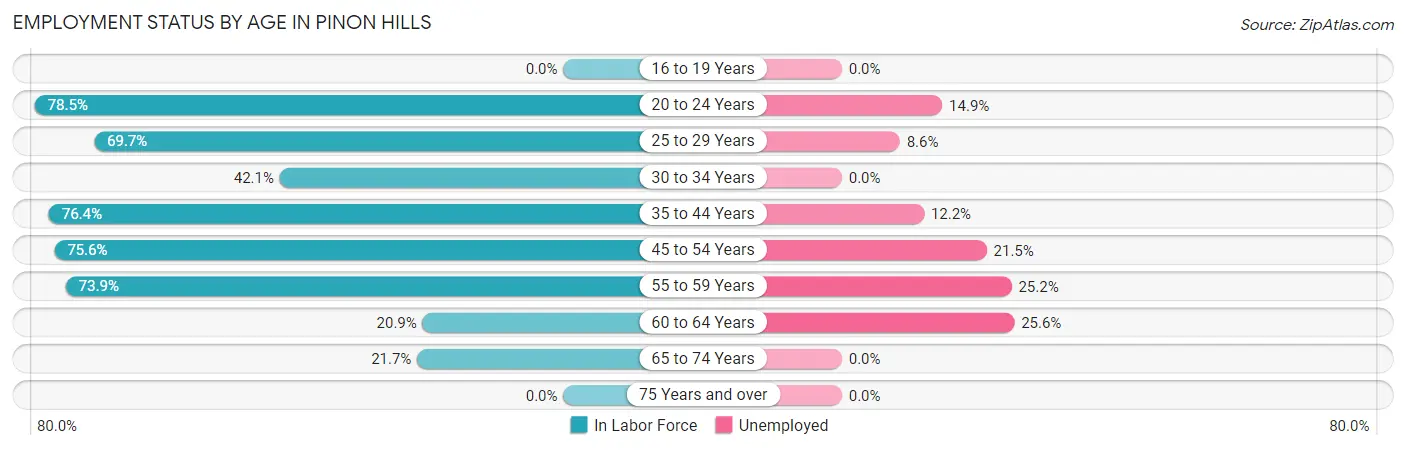
| Age Bracket | In Labor Force | Unemployed |
| 16 to 19 Years | 0 (0.0%) | 0 (0.0%) |
| 20 to 24 Years | 249 (78.5%) | 37 (14.9%) |
| 25 to 29 Years | 520 (69.7%) | 45 (8.6%) |
| 30 to 34 Years | 151 (42.1%) | 0 (0.0%) |
| 35 to 44 Years | 624 (76.4%) | 76 (12.2%) |
| 45 to 54 Years | 446 (75.6%) | 96 (21.5%) |
| 55 to 59 Years | 314 (73.9%) | 79 (25.2%) |
| 60 to 64 Years | 160 (20.9%) | 41 (25.6%) |
| 65 to 74 Years | 172 (21.7%) | 0 (0.0%) |
| 75 Years and over | 0 (0.0%) | 0 (0.0%) |
| Total | 2,638 (48.9%) | 377 (14.3%) |
Employment Status by Educational Attainment in Pinon Hills
According to labor force statistics for Pinon Hills, 59.8% of individuals (2,214) out of the total population between 25 and 64 years of age (3,702) are in the labor force, with 15.3% or 339 of them being unemployed. The group with the highest labor force participation rate are those with the educational attainment of bachelor's degree or higher, with 77.2% or 403 individuals in the labor force. Within the labor force, individuals with high school diploma education have the highest percentage of unemployment, with 24.5% or 155 of them being unemployed.
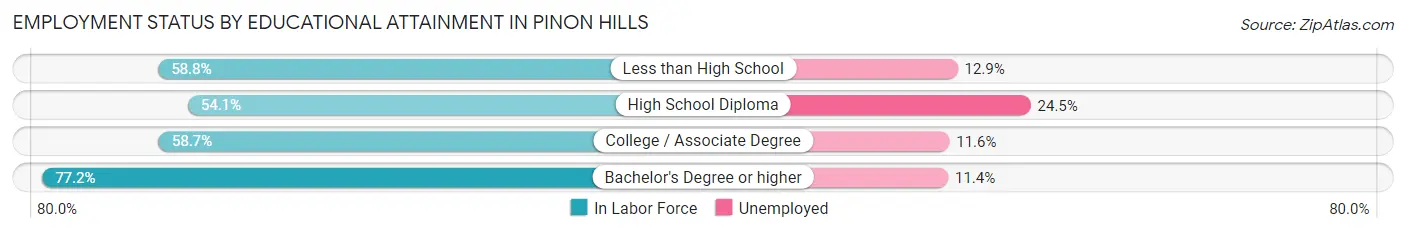
| Educational Attainment | In Labor Force | Unemployed |
| Less than High School | 318 (58.8%) | 70 (12.9%) |
| High School Diploma | 634 (54.1%) | 287 (24.5%) |
| College / Associate Degree | 862 (58.7%) | 170 (11.6%) |
| Bachelor's Degree or higher | 403 (77.2%) | 60 (11.4%) |
| Total | 2,214 (59.8%) | 566 (15.3%) |
Employment Occupations by Sex in Pinon Hills
Management, Business, Science and Arts Occupations
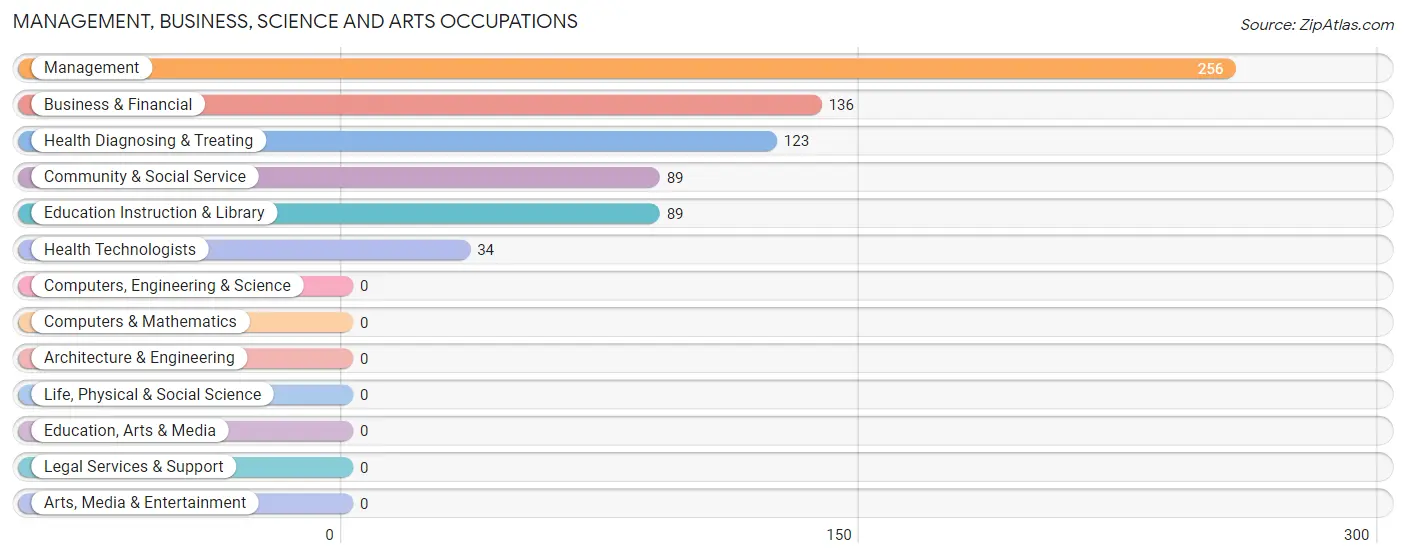
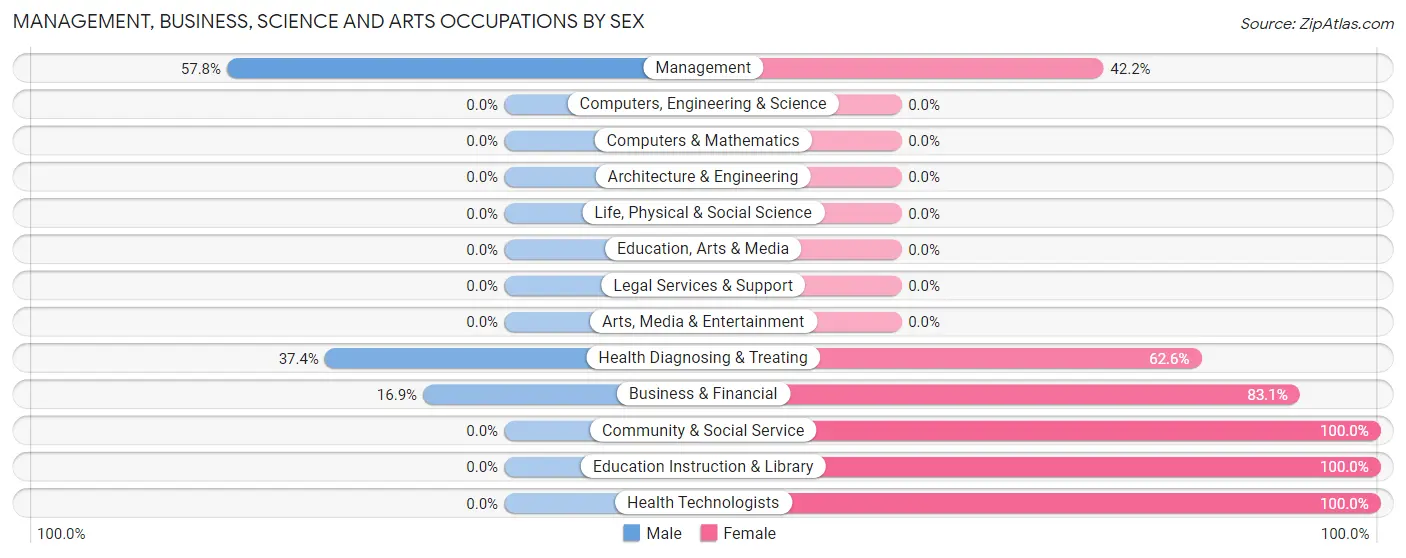
The most common Management, Business, Science and Arts occupations in Pinon Hills are Management (256 | 11.5%), Business & Financial (136 | 6.1%), Health Diagnosing & Treating (123 | 5.5%), Community & Social Service (89 | 4.0%), and Education Instruction & Library (89 | 4.0%).
Management, Business, Science and Arts Occupations by Sex
Within the Management, Business, Science and Arts occupations in Pinon Hills, the most male-oriented occupations are Management (57.8%), Health Diagnosing & Treating (37.4%), and Business & Financial (16.9%), while the most female-oriented occupations are Community & Social Service (100.0%), Education Instruction & Library (100.0%), and Health Technologists (100.0%).
| Occupation | Male | Female |
| Management | 148 (57.8%) | 108 (42.2%) |
| Business & Financial | 23 (16.9%) | 113 (83.1%) |
| Computers, Engineering & Science | 0 (0.0%) | 0 (0.0%) |
| Computers & Mathematics | 0 (0.0%) | 0 (0.0%) |
| Architecture & Engineering | 0 (0.0%) | 0 (0.0%) |
| Life, Physical & Social Science | 0 (0.0%) | 0 (0.0%) |
| Community & Social Service | 0 (0.0%) | 89 (100.0%) |
| Education, Arts & Media | 0 (0.0%) | 0 (0.0%) |
| Legal Services & Support | 0 (0.0%) | 0 (0.0%) |
| Education Instruction & Library | 0 (0.0%) | 89 (100.0%) |
| Arts, Media & Entertainment | 0 (0.0%) | 0 (0.0%) |
| Health Diagnosing & Treating | 46 (37.4%) | 77 (62.6%) |
| Health Technologists | 0 (0.0%) | 34 (100.0%) |
| Total (Category) | 217 (35.9%) | 387 (64.1%) |
| Total (Overall) | 1,278 (57.3%) | 953 (42.7%) |
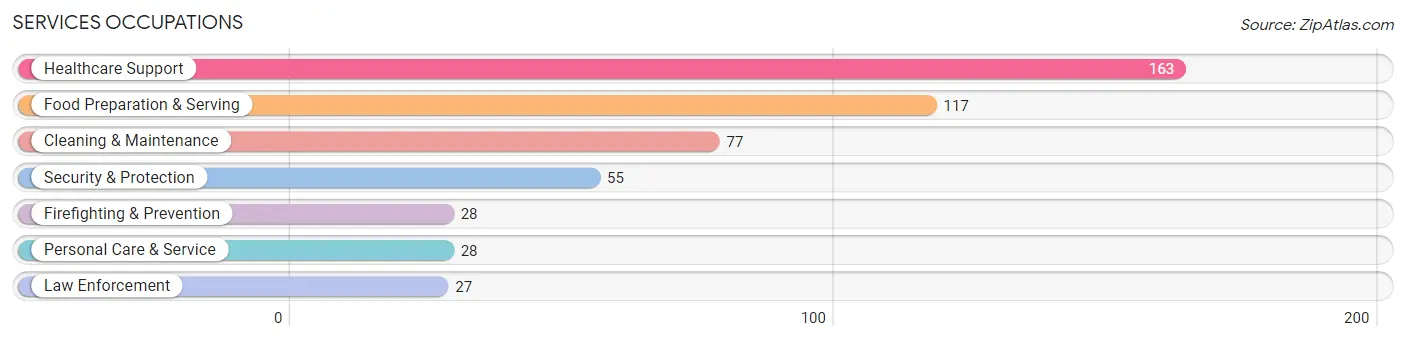
Services Occupations
The most common Services occupations in Pinon Hills are Healthcare Support (163 | 7.3%), Food Preparation & Serving (117 | 5.2%), Cleaning & Maintenance (77 | 3.5%), Security & Protection (55 | 2.5%), and Firefighting & Prevention (28 | 1.3%).
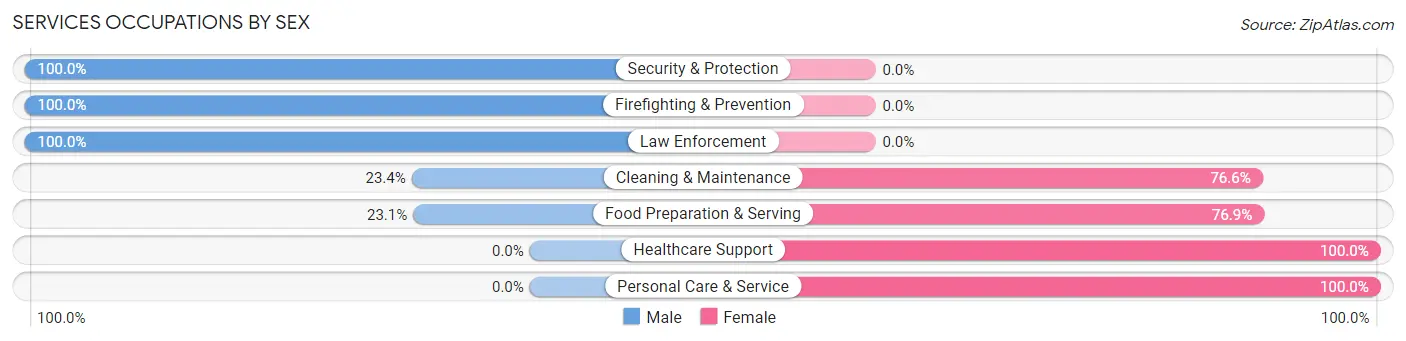
Services Occupations by Sex
Within the Services occupations in Pinon Hills, the most male-oriented occupations are Security & Protection (100.0%), Firefighting & Prevention (100.0%), and Law Enforcement (100.0%), while the most female-oriented occupations are Healthcare Support (100.0%), Personal Care & Service (100.0%), and Food Preparation & Serving (76.9%).
| Occupation | Male | Female |
| Healthcare Support | 0 (0.0%) | 163 (100.0%) |
| Security & Protection | 55 (100.0%) | 0 (0.0%) |
| Firefighting & Prevention | 28 (100.0%) | 0 (0.0%) |
| Law Enforcement | 27 (100.0%) | 0 (0.0%) |
| Food Preparation & Serving | 27 (23.1%) | 90 (76.9%) |
| Cleaning & Maintenance | 18 (23.4%) | 59 (76.6%) |
| Personal Care & Service | 0 (0.0%) | 28 (100.0%) |
| Total (Category) | 100 (22.7%) | 340 (77.3%) |
| Total (Overall) | 1,278 (57.3%) | 953 (42.7%) |
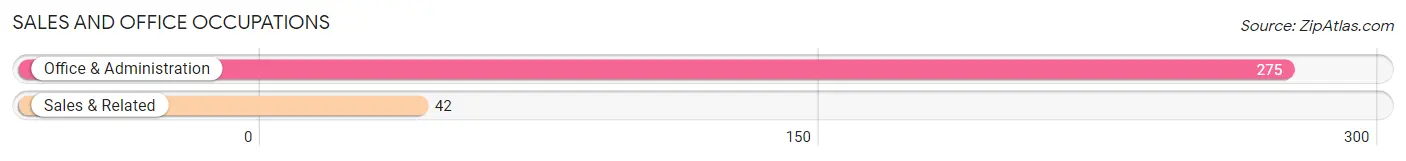
Sales and Office Occupations
The most common Sales and Office occupations in Pinon Hills are Office & Administration (275 | 12.3%), and Sales & Related (42 | 1.9%).
Sales and Office Occupations by Sex

| Occupation | Male | Female |
| Sales & Related | 42 (100.0%) | 0 (0.0%) |
| Office & Administration | 83 (30.2%) | 192 (69.8%) |
| Total (Category) | 125 (39.4%) | 192 (60.6%) |
| Total (Overall) | 1,278 (57.3%) | 953 (42.7%) |
Natural Resources, Construction and Maintenance Occupations
The most common Natural Resources, Construction and Maintenance occupations in Pinon Hills are Construction & Extraction (224 | 10.0%), and Installation, Maintenance & Repair (166 | 7.4%).
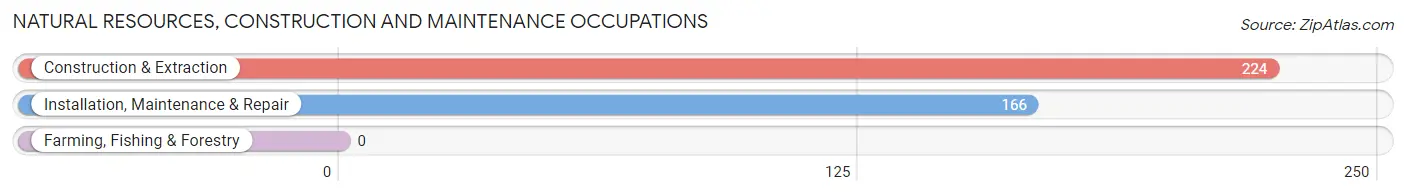
Natural Resources, Construction and Maintenance Occupations by Sex
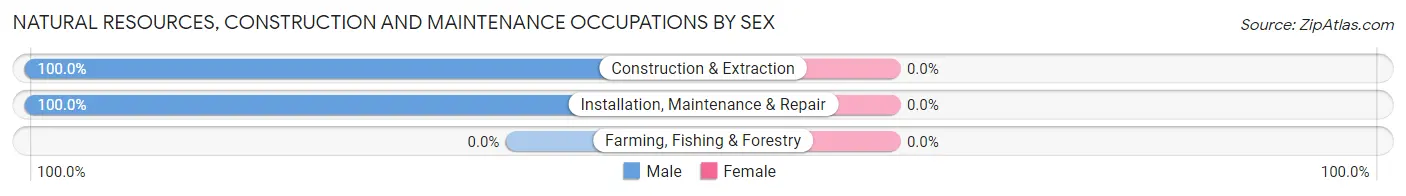
| Occupation | Male | Female |
| Farming, Fishing & Forestry | 0 (0.0%) | 0 (0.0%) |
| Construction & Extraction | 224 (100.0%) | 0 (0.0%) |
| Installation, Maintenance & Repair | 166 (100.0%) | 0 (0.0%) |
| Total (Category) | 390 (100.0%) | 0 (0.0%) |
| Total (Overall) | 1,278 (57.3%) | 953 (42.7%) |
Production, Transportation and Moving Occupations
The most common Production, Transportation and Moving occupations in Pinon Hills are Material Moving (200 | 9.0%), Transportation (182 | 8.2%), and Production (98 | 4.4%).
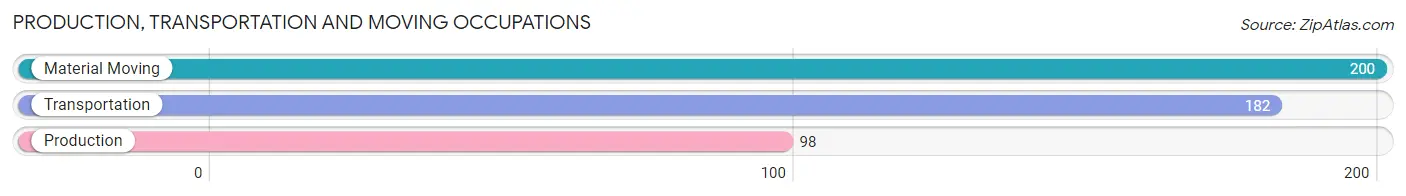
Production, Transportation and Moving Occupations by Sex
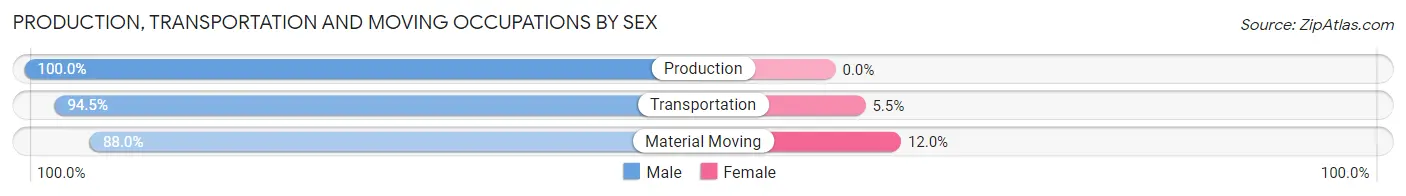
| Occupation | Male | Female |
| Production | 98 (100.0%) | 0 (0.0%) |
| Transportation | 172 (94.5%) | 10 (5.5%) |
| Material Moving | 176 (88.0%) | 24 (12.0%) |
| Total (Category) | 446 (92.9%) | 34 (7.1%) |
| Total (Overall) | 1,278 (57.3%) | 953 (42.7%) |
Employment Industries by Sex in Pinon Hills
Employment Industries in Pinon Hills
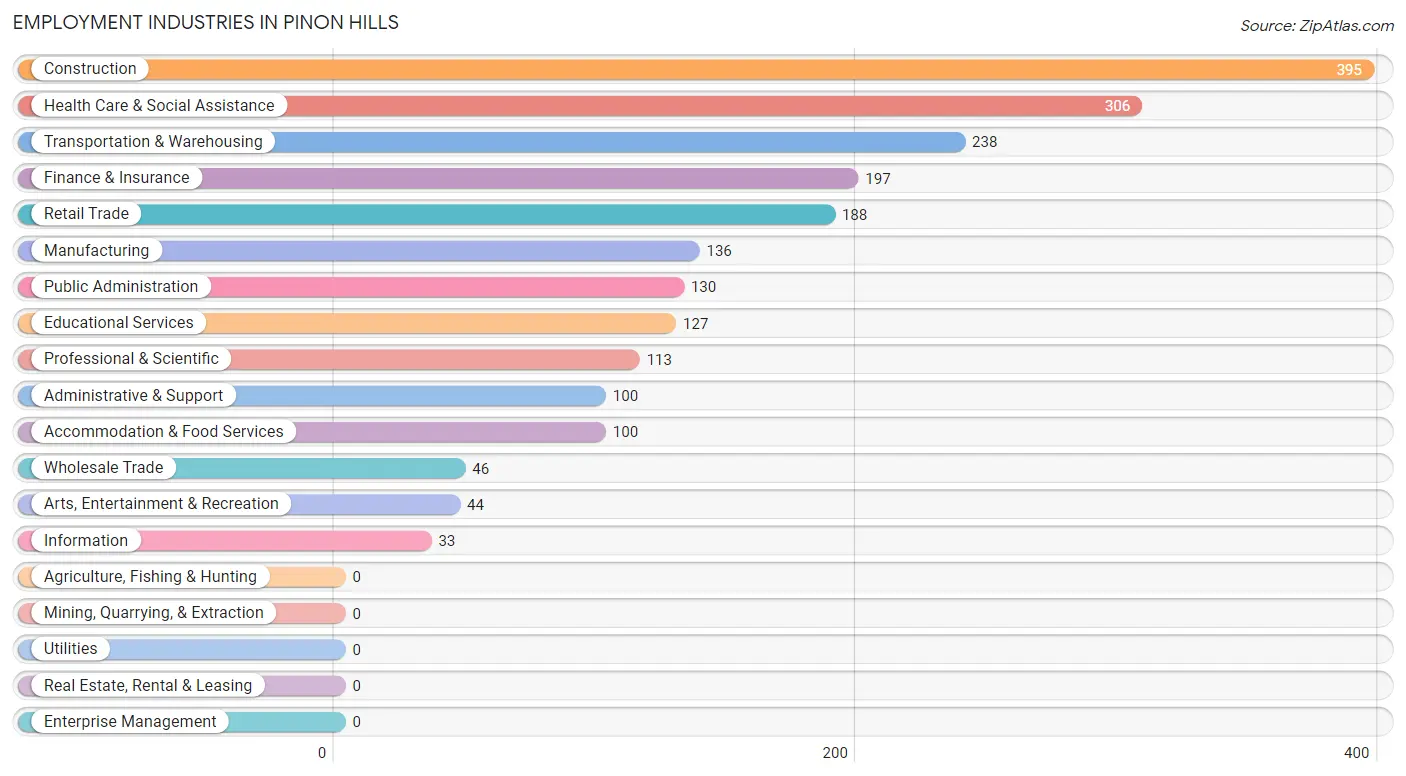
The major employment industries in Pinon Hills include Construction (395 | 17.7%), Health Care & Social Assistance (306 | 13.7%), Transportation & Warehousing (238 | 10.7%), Finance & Insurance (197 | 8.8%), and Retail Trade (188 | 8.4%).
Employment Industries by Sex in Pinon Hills
The Pinon Hills industries that see more men than women are Manufacturing (100.0%), Construction (87.3%), and Transportation & Warehousing (80.2%), whereas the industries that tend to have a higher number of women are Information (100.0%), Educational Services (100.0%), and Arts, Entertainment & Recreation (100.0%).
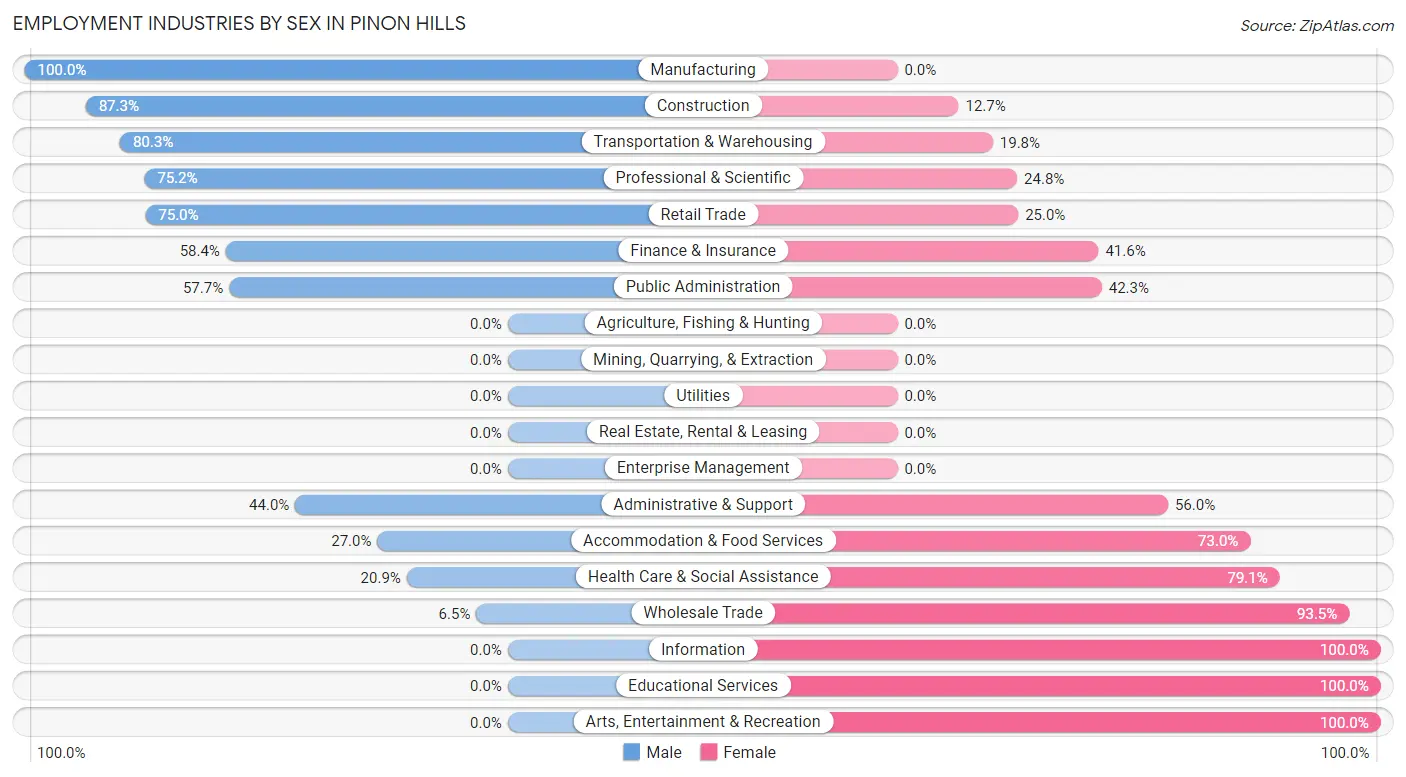
| Industry | Male | Female |
| Agriculture, Fishing & Hunting | 0 (0.0%) | 0 (0.0%) |
| Mining, Quarrying, & Extraction | 0 (0.0%) | 0 (0.0%) |
| Construction | 345 (87.3%) | 50 (12.7%) |
| Manufacturing | 136 (100.0%) | 0 (0.0%) |
| Wholesale Trade | 3 (6.5%) | 43 (93.5%) |
| Retail Trade | 141 (75.0%) | 47 (25.0%) |
| Transportation & Warehousing | 191 (80.2%) | 47 (19.8%) |
| Utilities | 0 (0.0%) | 0 (0.0%) |
| Information | 0 (0.0%) | 33 (100.0%) |
| Finance & Insurance | 115 (58.4%) | 82 (41.6%) |
| Real Estate, Rental & Leasing | 0 (0.0%) | 0 (0.0%) |
| Professional & Scientific | 85 (75.2%) | 28 (24.8%) |
| Enterprise Management | 0 (0.0%) | 0 (0.0%) |
| Administrative & Support | 44 (44.0%) | 56 (56.0%) |
| Educational Services | 0 (0.0%) | 127 (100.0%) |
| Health Care & Social Assistance | 64 (20.9%) | 242 (79.1%) |
| Arts, Entertainment & Recreation | 0 (0.0%) | 44 (100.0%) |
| Accommodation & Food Services | 27 (27.0%) | 73 (73.0%) |
| Public Administration | 75 (57.7%) | 55 (42.3%) |
| Total | 1,278 (57.3%) | 953 (42.7%) |
Education in Pinon Hills
School Enrollment in Pinon Hills
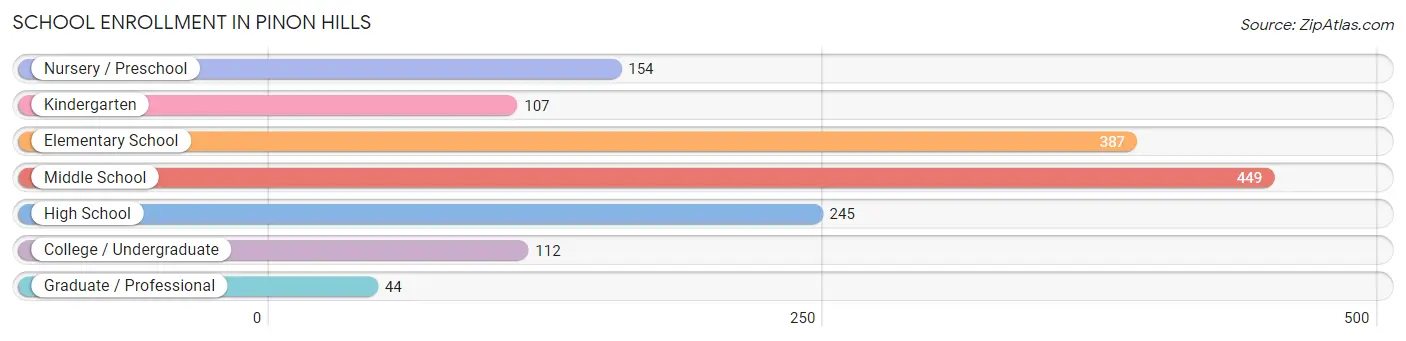
The most common levels of schooling among the 1,498 students in Pinon Hills are middle school (449 | 30.0%), elementary school (387 | 25.8%), and high school (245 | 16.4%).
| School Level | # Students | % Students |
| Nursery / Preschool | 154 | 10.3% |
| Kindergarten | 107 | 7.1% |
| Elementary School | 387 | 25.8% |
| Middle School | 449 | 30.0% |
| High School | 245 | 16.4% |
| College / Undergraduate | 112 | 7.5% |
| Graduate / Professional | 44 | 2.9% |
| Total | 1,498 | 100.0% |
School Enrollment by Age by Funding Source in Pinon Hills
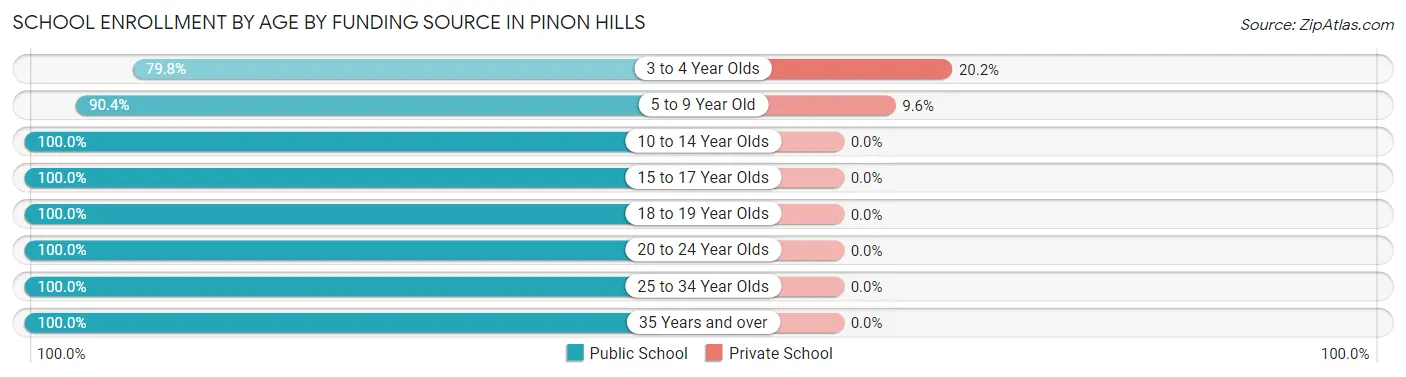
Out of a total of 1,498 students who are enrolled in schools in Pinon Hills, 66 (4.4%) attend a private institution, while the remaining 1,432 (95.6%) are enrolled in public schools. The age group of 3 to 4 year olds has the highest likelihood of being enrolled in private schools, with 24 (20.2% in the age bracket) enrolled. Conversely, the age group of 10 to 14 year olds has the lowest likelihood of being enrolled in a private school, with 548 (100.0% in the age bracket) attending a public institution.
| Age Bracket | Public School | Private School |
| 3 to 4 Year Olds | 95 (79.8%) | 24 (20.2%) |
| 5 to 9 Year Old | 395 (90.4%) | 42 (9.6%) |
| 10 to 14 Year Olds | 548 (100.0%) | 0 (0.0%) |
| 15 to 17 Year Olds | 169 (100.0%) | 0 (0.0%) |
| 18 to 19 Year Olds | 8 (100.0%) | 0 (0.0%) |
| 20 to 24 Year Olds | 50 (100.0%) | 0 (0.0%) |
| 25 to 34 Year Olds | 60 (100.0%) | 0 (0.0%) |
| 35 Years and over | 107 (100.0%) | 0 (0.0%) |
| Total | 1,432 (95.6%) | 66 (4.4%) |
Educational Attainment by Field of Study in Pinon Hills
Liberal arts & history (164 | 22.8%), arts & humanities (147 | 20.4%), science & technology (86 | 11.9%), social sciences (75 | 10.4%), and education (73 | 10.1%) are the most common fields of study among 720 individuals in Pinon Hills who have obtained a bachelor's degree or higher.
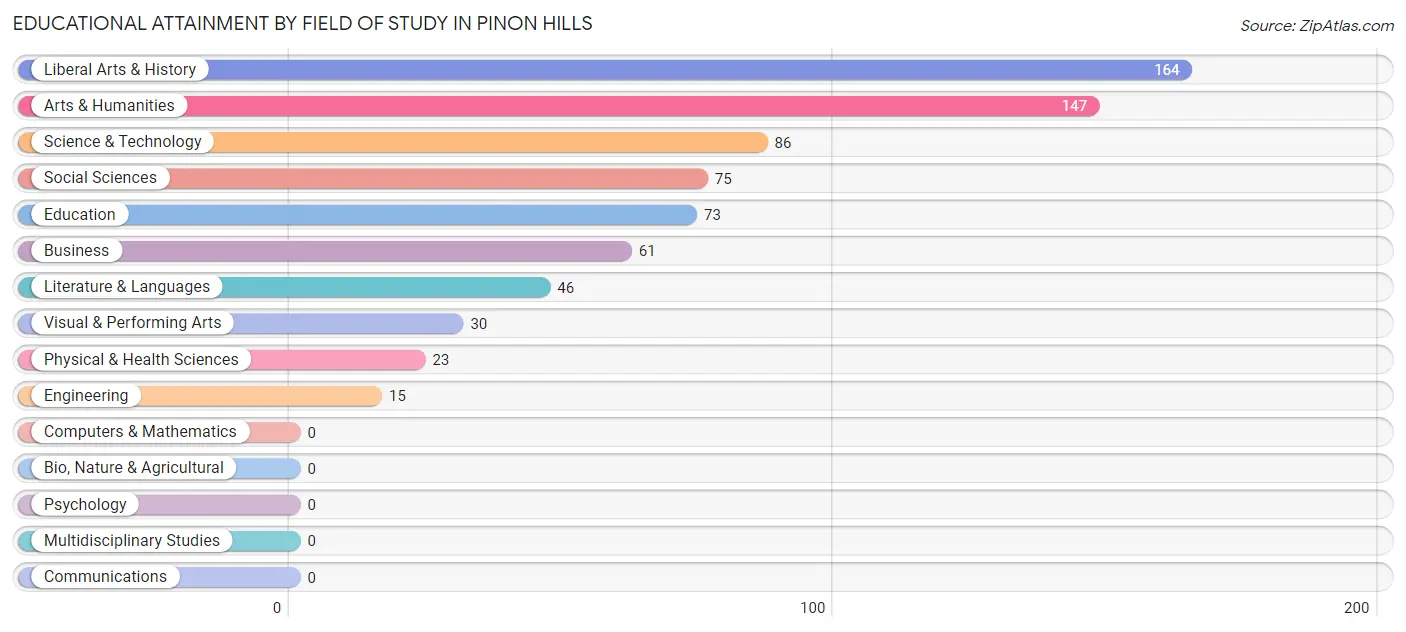
| Field of Study | # Graduates | % Graduates |
| Computers & Mathematics | 0 | 0.0% |
| Bio, Nature & Agricultural | 0 | 0.0% |
| Physical & Health Sciences | 23 | 3.2% |
| Psychology | 0 | 0.0% |
| Social Sciences | 75 | 10.4% |
| Engineering | 15 | 2.1% |
| Multidisciplinary Studies | 0 | 0.0% |
| Science & Technology | 86 | 11.9% |
| Business | 61 | 8.5% |
| Education | 73 | 10.1% |
| Literature & Languages | 46 | 6.4% |
| Liberal Arts & History | 164 | 22.8% |
| Visual & Performing Arts | 30 | 4.2% |
| Communications | 0 | 0.0% |
| Arts & Humanities | 147 | 20.4% |
| Total | 720 | 100.0% |
Transportation & Commute in Pinon Hills
Vehicle Availability by Sex in Pinon Hills
The most prevalent vehicle ownership categories in Pinon Hills are males with 3 vehicles (433, accounting for 33.1%) and females with 3 vehicles (130, making up 46.6%).
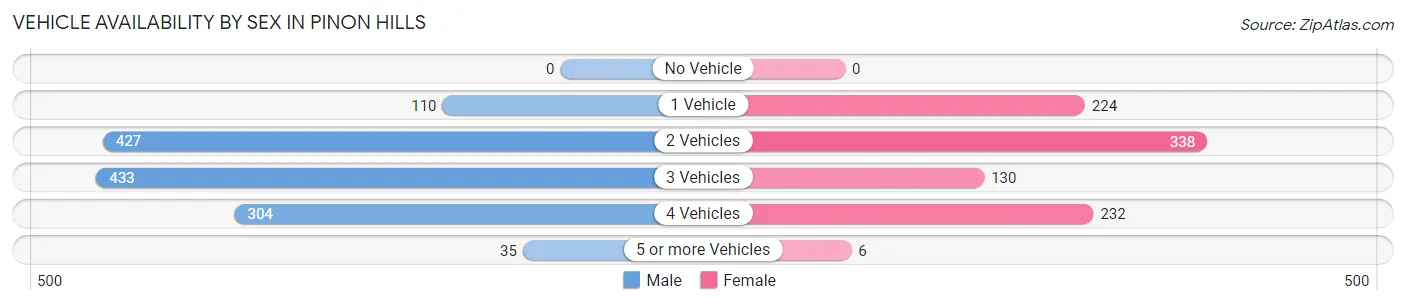
| Vehicles Available | Male | Female |
| No Vehicle | 0 (0.0%) | 0 (0.0%) |
| 1 Vehicle | 110 (8.4%) | 224 (24.1%) |
| 2 Vehicles | 427 (32.6%) | 338 (36.3%) |
| 3 Vehicles | 433 (33.1%) | 130 (14.0%) |
| 4 Vehicles | 304 (23.2%) | 232 (24.9%) |
| 5 or more Vehicles | 35 (2.7%) | 6 (0.6%) |
| Total | 1,309 (100.0%) | 930 (100.0%) |
Commute Time in Pinon Hills
The most frequently occuring commute durations in Pinon Hills are 45 to 59 minutes (404 commuters, 20.8%), 90 or more minutes (356 commuters, 18.3%), and 60 to 89 minutes (332 commuters, 17.1%).
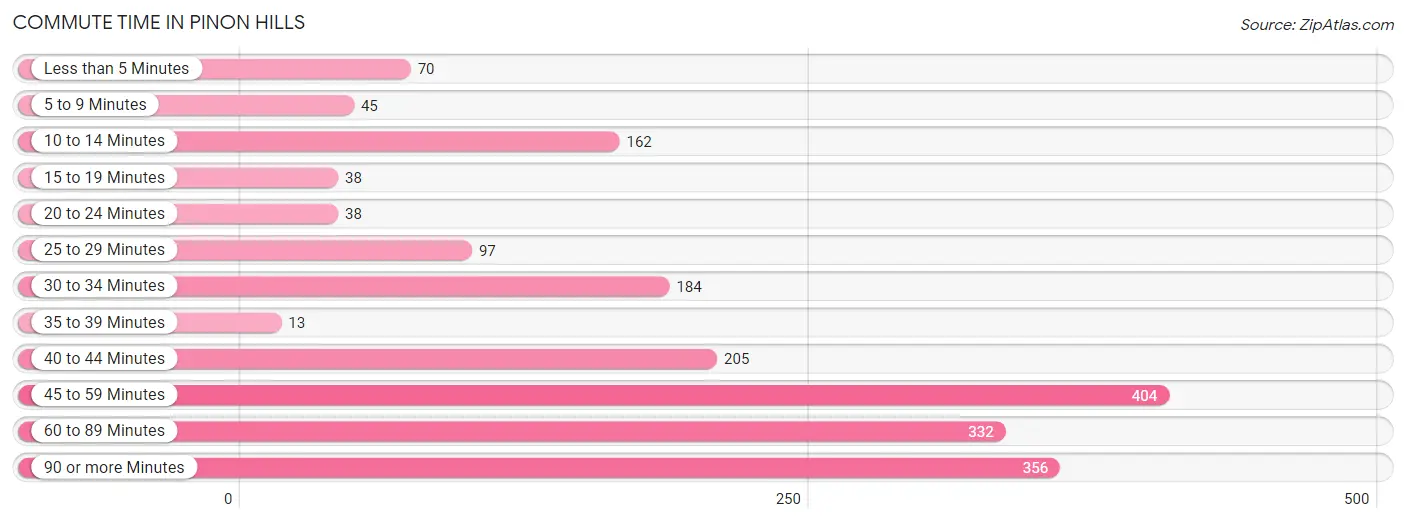
| Commute Time | # Commuters | % Commuters |
| Less than 5 Minutes | 70 | 3.6% |
| 5 to 9 Minutes | 45 | 2.3% |
| 10 to 14 Minutes | 162 | 8.3% |
| 15 to 19 Minutes | 38 | 1.9% |
| 20 to 24 Minutes | 38 | 1.9% |
| 25 to 29 Minutes | 97 | 5.0% |
| 30 to 34 Minutes | 184 | 9.5% |
| 35 to 39 Minutes | 13 | 0.7% |
| 40 to 44 Minutes | 205 | 10.5% |
| 45 to 59 Minutes | 404 | 20.8% |
| 60 to 89 Minutes | 332 | 17.1% |
| 90 or more Minutes | 356 | 18.3% |
Commute Time by Sex in Pinon Hills
The most common commute times in Pinon Hills are 90 or more minutes (295 commuters, 25.8%) for males and 40 to 44 minutes (180 commuters, 22.5%) for females.
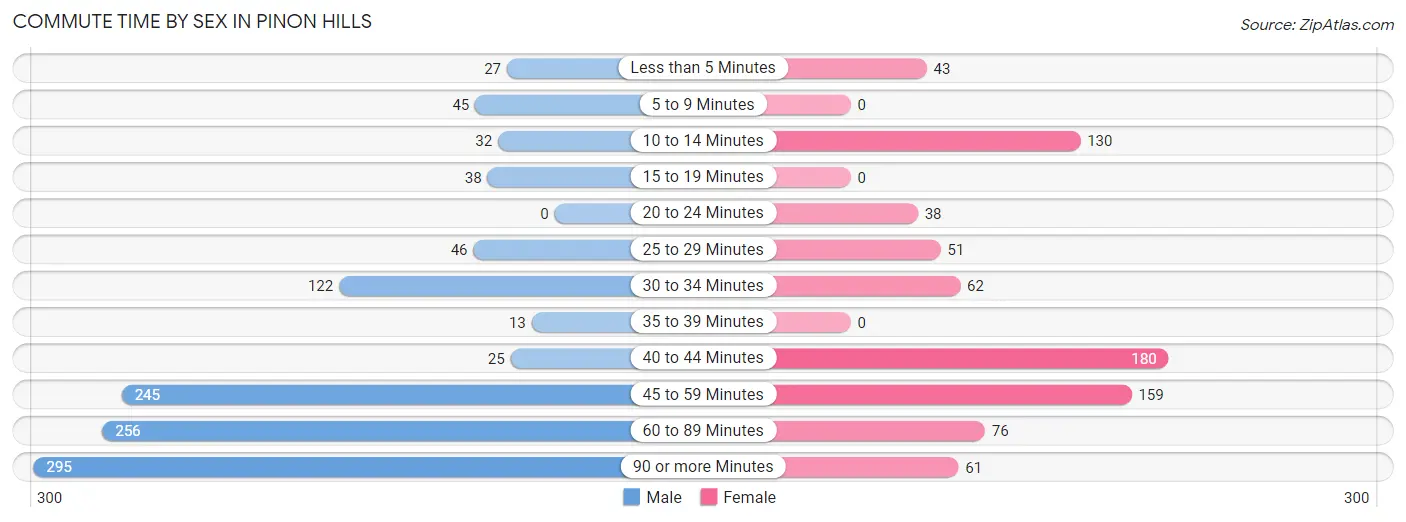
| Commute Time | Male | Female |
| Less than 5 Minutes | 27 (2.4%) | 43 (5.4%) |
| 5 to 9 Minutes | 45 (3.9%) | 0 (0.0%) |
| 10 to 14 Minutes | 32 (2.8%) | 130 (16.3%) |
| 15 to 19 Minutes | 38 (3.3%) | 0 (0.0%) |
| 20 to 24 Minutes | 0 (0.0%) | 38 (4.8%) |
| 25 to 29 Minutes | 46 (4.0%) | 51 (6.4%) |
| 30 to 34 Minutes | 122 (10.7%) | 62 (7.7%) |
| 35 to 39 Minutes | 13 (1.1%) | 0 (0.0%) |
| 40 to 44 Minutes | 25 (2.2%) | 180 (22.5%) |
| 45 to 59 Minutes | 245 (21.4%) | 159 (19.9%) |
| 60 to 89 Minutes | 256 (22.4%) | 76 (9.5%) |
| 90 or more Minutes | 295 (25.8%) | 61 (7.6%) |
Time of Departure to Work by Sex in Pinon Hills
The most frequent times of departure to work in Pinon Hills are 12:00 AM to 4:59 AM (352, 30.8%) for males and 6:00 AM to 6:29 AM (228, 28.5%) for females.
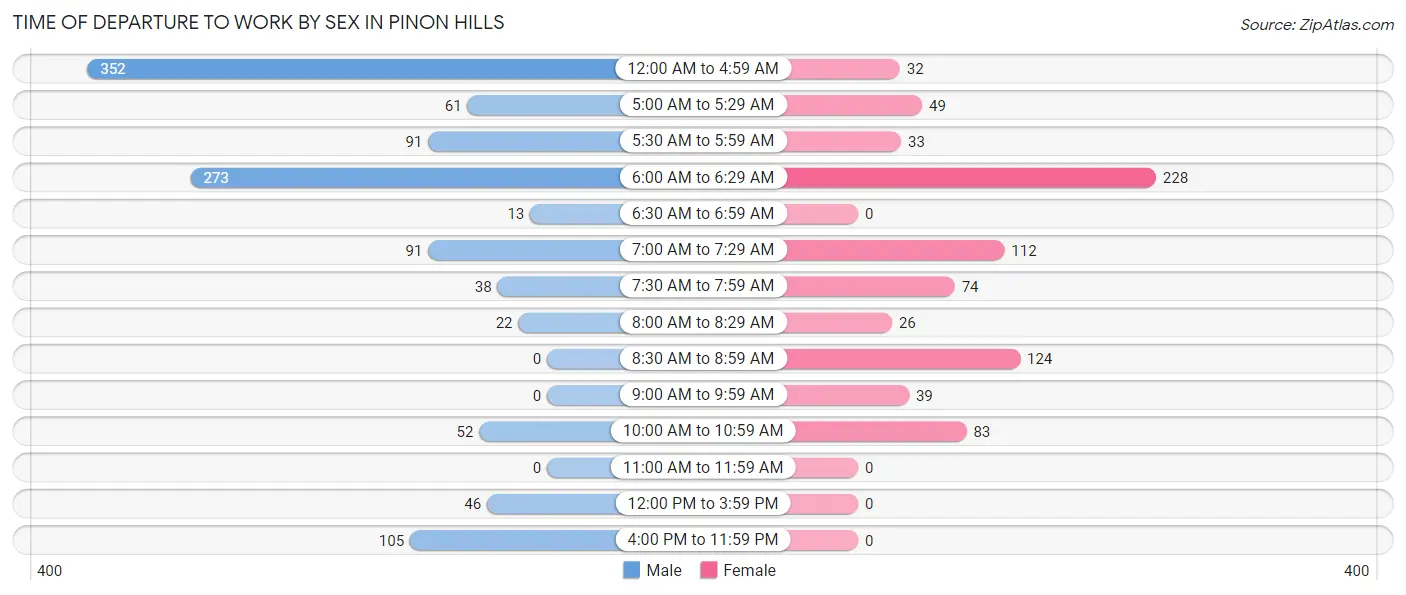
| Time of Departure | Male | Female |
| 12:00 AM to 4:59 AM | 352 (30.8%) | 32 (4.0%) |
| 5:00 AM to 5:29 AM | 61 (5.3%) | 49 (6.1%) |
| 5:30 AM to 5:59 AM | 91 (8.0%) | 33 (4.1%) |
| 6:00 AM to 6:29 AM | 273 (23.9%) | 228 (28.5%) |
| 6:30 AM to 6:59 AM | 13 (1.1%) | 0 (0.0%) |
| 7:00 AM to 7:29 AM | 91 (8.0%) | 112 (14.0%) |
| 7:30 AM to 7:59 AM | 38 (3.3%) | 74 (9.2%) |
| 8:00 AM to 8:29 AM | 22 (1.9%) | 26 (3.3%) |
| 8:30 AM to 8:59 AM | 0 (0.0%) | 124 (15.5%) |
| 9:00 AM to 9:59 AM | 0 (0.0%) | 39 (4.9%) |
| 10:00 AM to 10:59 AM | 52 (4.5%) | 83 (10.4%) |
| 11:00 AM to 11:59 AM | 0 (0.0%) | 0 (0.0%) |
| 12:00 PM to 3:59 PM | 46 (4.0%) | 0 (0.0%) |
| 4:00 PM to 11:59 PM | 105 (9.2%) | 0 (0.0%) |
| Total | 1,144 (100.0%) | 800 (100.0%) |
Housing Occupancy in Pinon Hills
Occupancy by Ownership in Pinon Hills
Of the total 2,389 dwellings in Pinon Hills, owner-occupied units account for 1,834 (76.8%), while renter-occupied units make up 555 (23.2%).
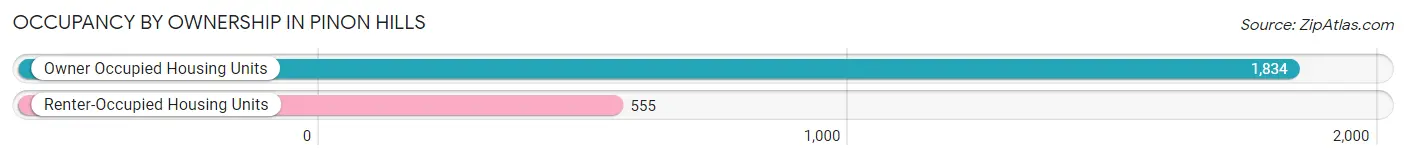
| Occupancy | # Housing Units | % Housing Units |
| Owner Occupied Housing Units | 1,834 | 76.8% |
| Renter-Occupied Housing Units | 555 | 23.2% |
| Total Occupied Housing Units | 2,389 | 100.0% |
Occupancy by Household Size in Pinon Hills
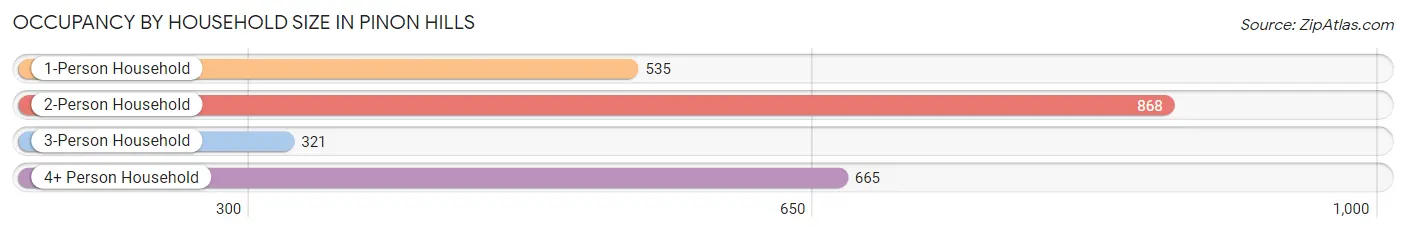
| Household Size | # Housing Units | % Housing Units |
| 1-Person Household | 535 | 22.4% |
| 2-Person Household | 868 | 36.3% |
| 3-Person Household | 321 | 13.4% |
| 4+ Person Household | 665 | 27.8% |
| Total Housing Units | 2,389 | 100.0% |
Occupancy by Ownership by Household Size in Pinon Hills
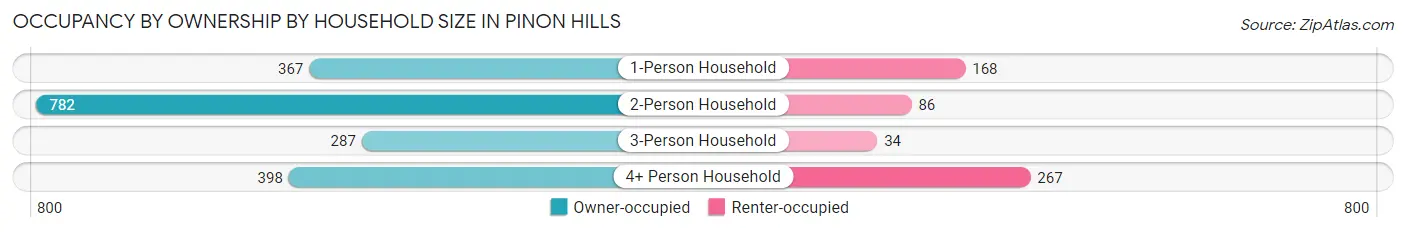
| Household Size | Owner-occupied | Renter-occupied |
| 1-Person Household | 367 (68.6%) | 168 (31.4%) |
| 2-Person Household | 782 (90.1%) | 86 (9.9%) |
| 3-Person Household | 287 (89.4%) | 34 (10.6%) |
| 4+ Person Household | 398 (59.9%) | 267 (40.2%) |
| Total Housing Units | 1,834 (76.8%) | 555 (23.2%) |
Occupancy by Educational Attainment in Pinon Hills
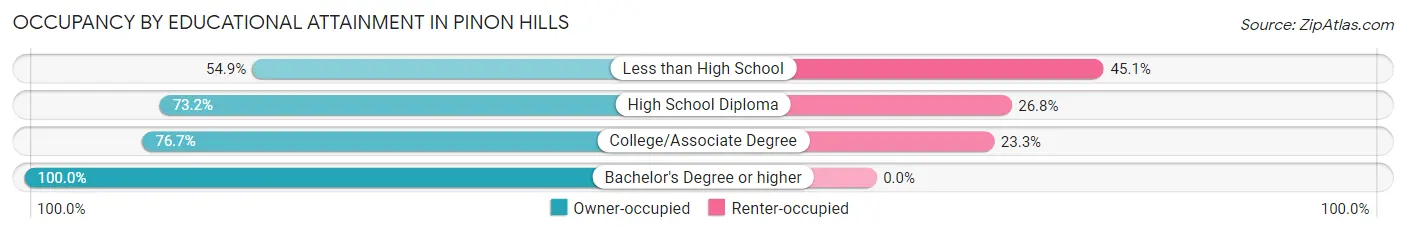
| Household Size | Owner-occupied | Renter-occupied |
| Less than High School | 140 (54.9%) | 115 (45.1%) |
| High School Diploma | 451 (73.2%) | 165 (26.8%) |
| College/Associate Degree | 903 (76.7%) | 275 (23.3%) |
| Bachelor's Degree or higher | 340 (100.0%) | 0 (0.0%) |
Occupancy by Age of Householder in Pinon Hills
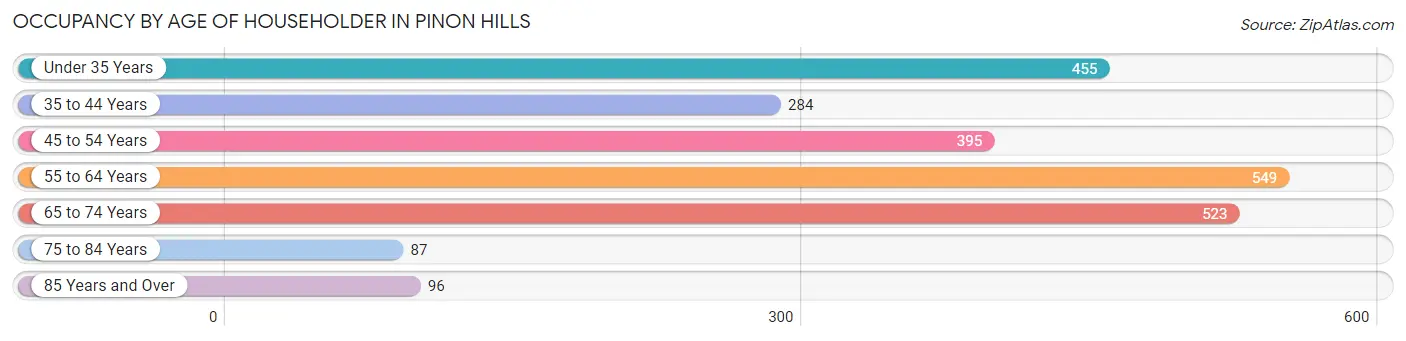
| Age Bracket | # Households | % Households |
| Under 35 Years | 455 | 19.1% |
| 35 to 44 Years | 284 | 11.9% |
| 45 to 54 Years | 395 | 16.5% |
| 55 to 64 Years | 549 | 23.0% |
| 65 to 74 Years | 523 | 21.9% |
| 75 to 84 Years | 87 | 3.6% |
| 85 Years and Over | 96 | 4.0% |
| Total | 2,389 | 100.0% |
Housing Finances in Pinon Hills
Median Income by Occupancy in Pinon Hills
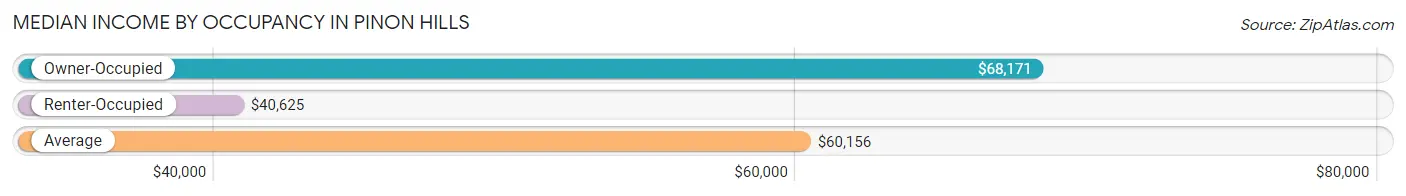
| Occupancy Type | # Households | Median Income |
| Owner-Occupied | 1,834 (76.8%) | $68,171 |
| Renter-Occupied | 555 (23.2%) | $40,625 |
| Average | 2,389 (100.0%) | $60,156 |
Occupancy by Householder Income Bracket in Pinon Hills
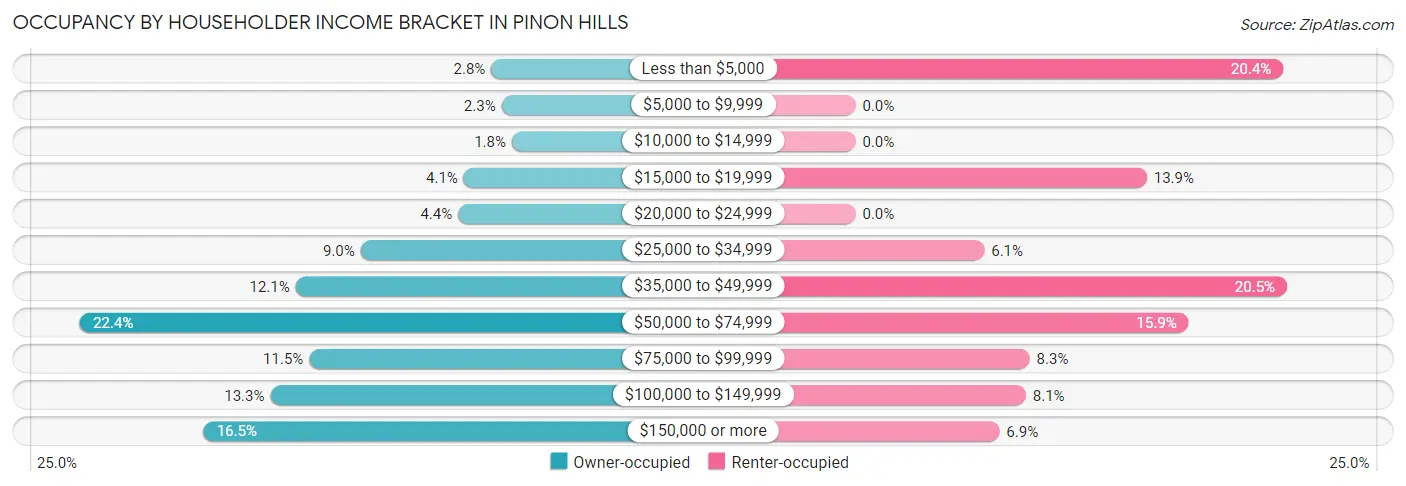
| Income Bracket | Owner-occupied | Renter-occupied |
| Less than $5,000 | 51 (2.8%) | 113 (20.4%) |
| $5,000 to $9,999 | 42 (2.3%) | 0 (0.0%) |
| $10,000 to $14,999 | 33 (1.8%) | 0 (0.0%) |
| $15,000 to $19,999 | 75 (4.1%) | 77 (13.9%) |
| $20,000 to $24,999 | 80 (4.4%) | 0 (0.0%) |
| $25,000 to $34,999 | 165 (9.0%) | 34 (6.1%) |
| $35,000 to $49,999 | 222 (12.1%) | 114 (20.5%) |
| $50,000 to $74,999 | 410 (22.4%) | 88 (15.9%) |
| $75,000 to $99,999 | 210 (11.5%) | 46 (8.3%) |
| $100,000 to $149,999 | 244 (13.3%) | 45 (8.1%) |
| $150,000 or more | 302 (16.5%) | 38 (6.9%) |
| Total | 1,834 (100.0%) | 555 (100.0%) |
Monthly Housing Cost Tiers in Pinon Hills
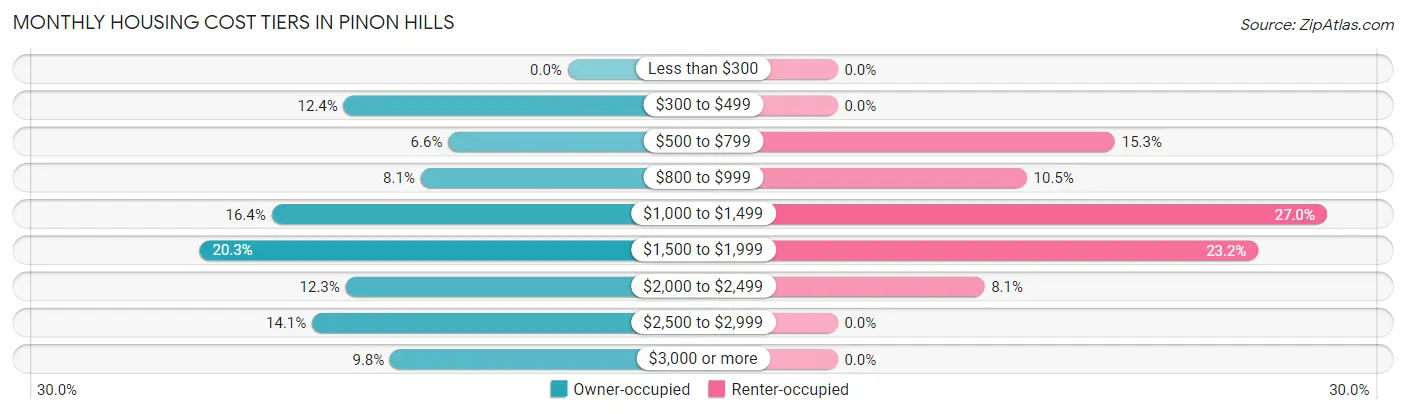
| Monthly Cost | Owner-occupied | Renter-occupied |
| Less than $300 | 0 (0.0%) | 0 (0.0%) |
| $300 to $499 | 227 (12.4%) | 0 (0.0%) |
| $500 to $799 | 121 (6.6%) | 85 (15.3%) |
| $800 to $999 | 149 (8.1%) | 58 (10.4%) |
| $1,000 to $1,499 | 300 (16.4%) | 150 (27.0%) |
| $1,500 to $1,999 | 373 (20.3%) | 129 (23.2%) |
| $2,000 to $2,499 | 225 (12.3%) | 45 (8.1%) |
| $2,500 to $2,999 | 259 (14.1%) | 0 (0.0%) |
| $3,000 or more | 180 (9.8%) | 0 (0.0%) |
| Total | 1,834 (100.0%) | 555 (100.0%) |
Physical Housing Characteristics in Pinon Hills
Housing Structures in Pinon Hills
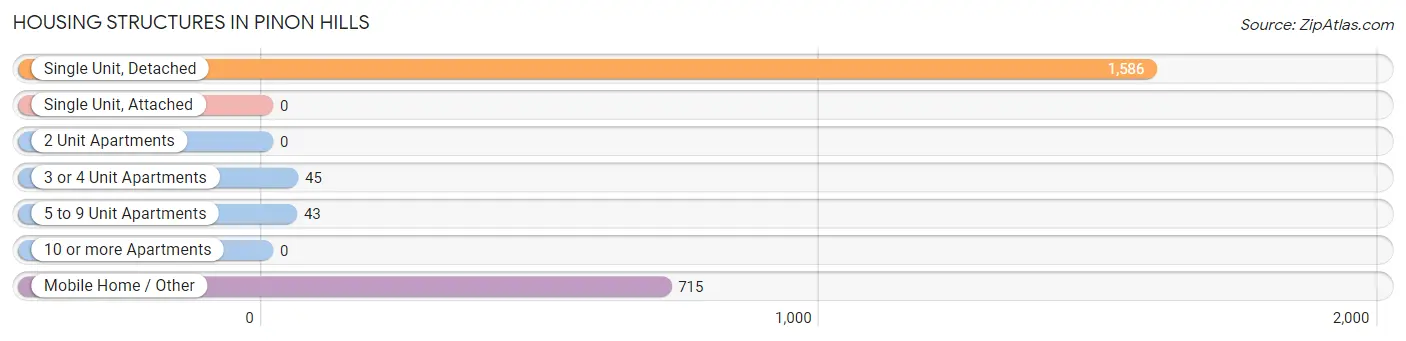
| Structure Type | # Housing Units | % Housing Units |
| Single Unit, Detached | 1,586 | 66.4% |
| Single Unit, Attached | 0 | 0.0% |
| 2 Unit Apartments | 0 | 0.0% |
| 3 or 4 Unit Apartments | 45 | 1.9% |
| 5 to 9 Unit Apartments | 43 | 1.8% |
| 10 or more Apartments | 0 | 0.0% |
| Mobile Home / Other | 715 | 29.9% |
| Total | 2,389 | 100.0% |
Housing Structures by Occupancy in Pinon Hills
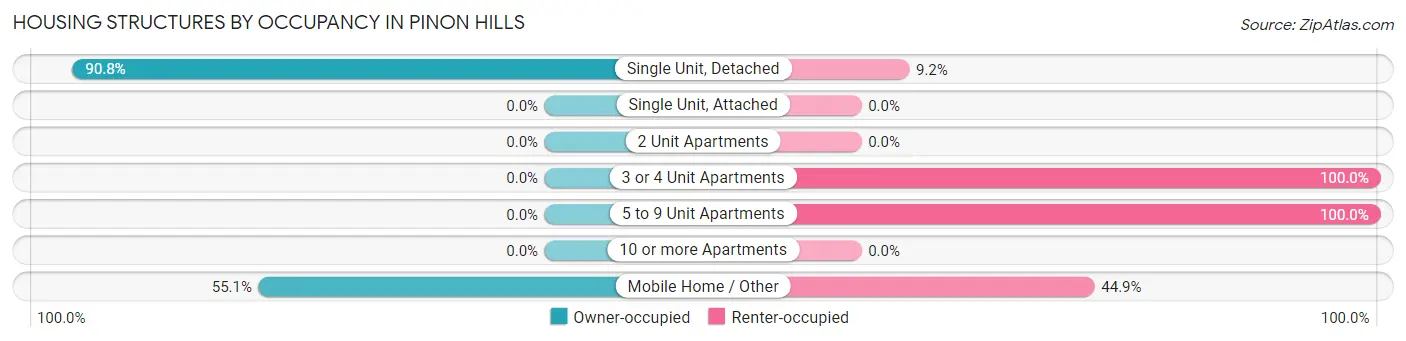
| Structure Type | Owner-occupied | Renter-occupied |
| Single Unit, Detached | 1,440 (90.8%) | 146 (9.2%) |
| Single Unit, Attached | 0 (0.0%) | 0 (0.0%) |
| 2 Unit Apartments | 0 (0.0%) | 0 (0.0%) |
| 3 or 4 Unit Apartments | 0 (0.0%) | 45 (100.0%) |
| 5 to 9 Unit Apartments | 0 (0.0%) | 43 (100.0%) |
| 10 or more Apartments | 0 (0.0%) | 0 (0.0%) |
| Mobile Home / Other | 394 (55.1%) | 321 (44.9%) |
| Total | 1,834 (76.8%) | 555 (23.2%) |
Housing Structures by Number of Rooms in Pinon Hills
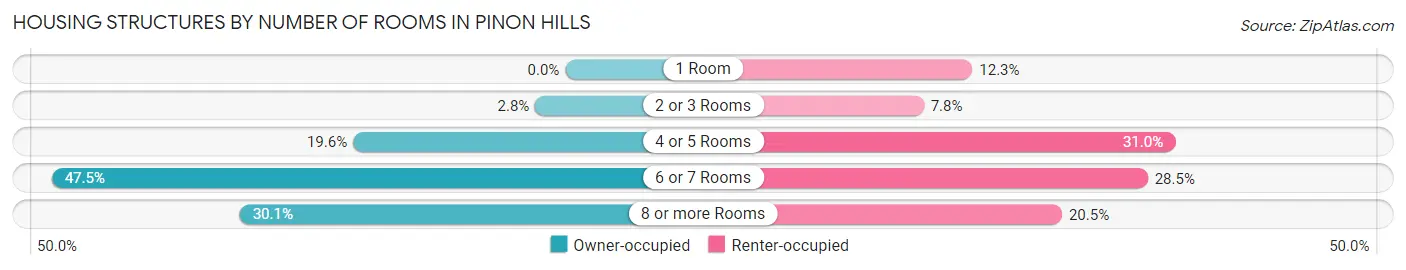
| Number of Rooms | Owner-occupied | Renter-occupied |
| 1 Room | 0 (0.0%) | 68 (12.2%) |
| 2 or 3 Rooms | 51 (2.8%) | 43 (7.7%) |
| 4 or 5 Rooms | 360 (19.6%) | 172 (31.0%) |
| 6 or 7 Rooms | 871 (47.5%) | 158 (28.5%) |
| 8 or more Rooms | 552 (30.1%) | 114 (20.5%) |
| Total | 1,834 (100.0%) | 555 (100.0%) |
Housing Structure by Heating Type in Pinon Hills
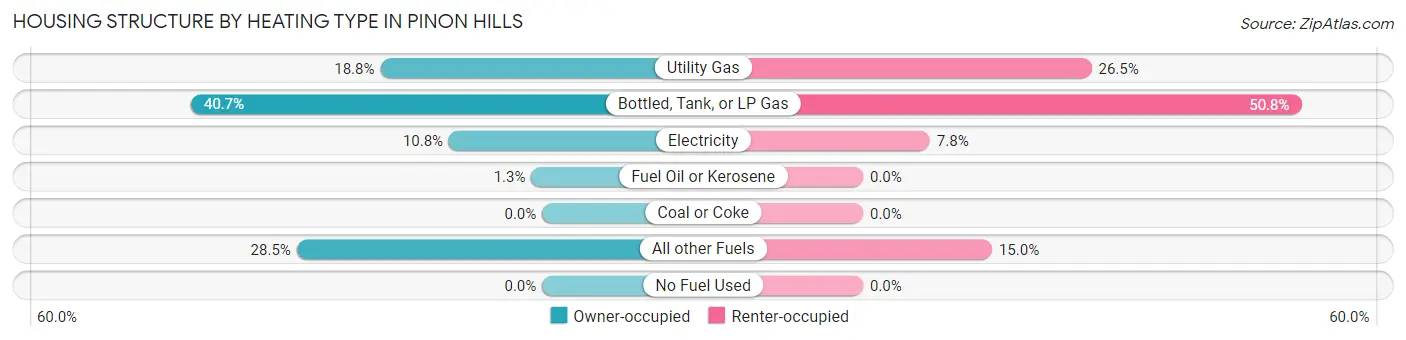
| Heating Type | Owner-occupied | Renter-occupied |
| Utility Gas | 344 (18.8%) | 147 (26.5%) |
| Bottled, Tank, or LP Gas | 747 (40.7%) | 282 (50.8%) |
| Electricity | 198 (10.8%) | 43 (7.7%) |
| Fuel Oil or Kerosene | 23 (1.3%) | 0 (0.0%) |
| Coal or Coke | 0 (0.0%) | 0 (0.0%) |
| All other Fuels | 522 (28.5%) | 83 (14.9%) |
| No Fuel Used | 0 (0.0%) | 0 (0.0%) |
| Total | 1,834 (100.0%) | 555 (100.0%) |
Household Vehicle Usage in Pinon Hills
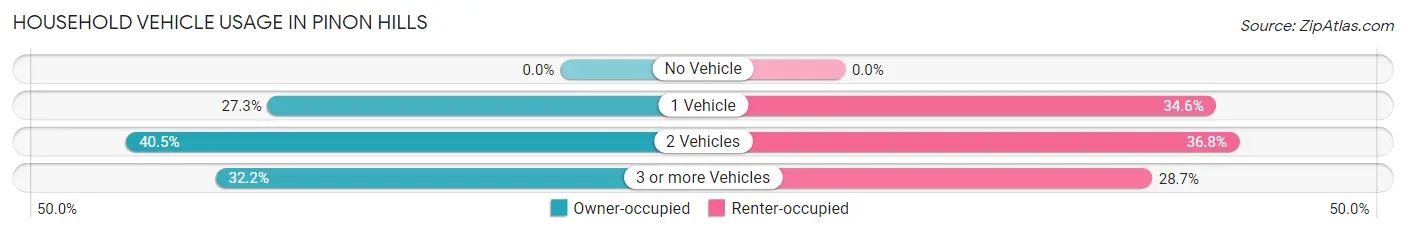
| Vehicles per Household | Owner-occupied | Renter-occupied |
| No Vehicle | 0 (0.0%) | 0 (0.0%) |
| 1 Vehicle | 501 (27.3%) | 192 (34.6%) |
| 2 Vehicles | 743 (40.5%) | 204 (36.8%) |
| 3 or more Vehicles | 590 (32.2%) | 159 (28.6%) |
| Total | 1,834 (100.0%) | 555 (100.0%) |
Real Estate & Mortgages in Pinon Hills
Real Estate and Mortgage Overview in Pinon Hills
| Characteristic | Without Mortgage | With Mortgage |
| Housing Units | 407 | 1,427 |
| Median Property Value | $209,500 | $423,100 |
| Median Household Income | $45,203 | $302 |
| Monthly Housing Costs | $457 | $180 |
| Real Estate Taxes | $1,945 | $81 |
Property Value by Mortgage Status in Pinon Hills
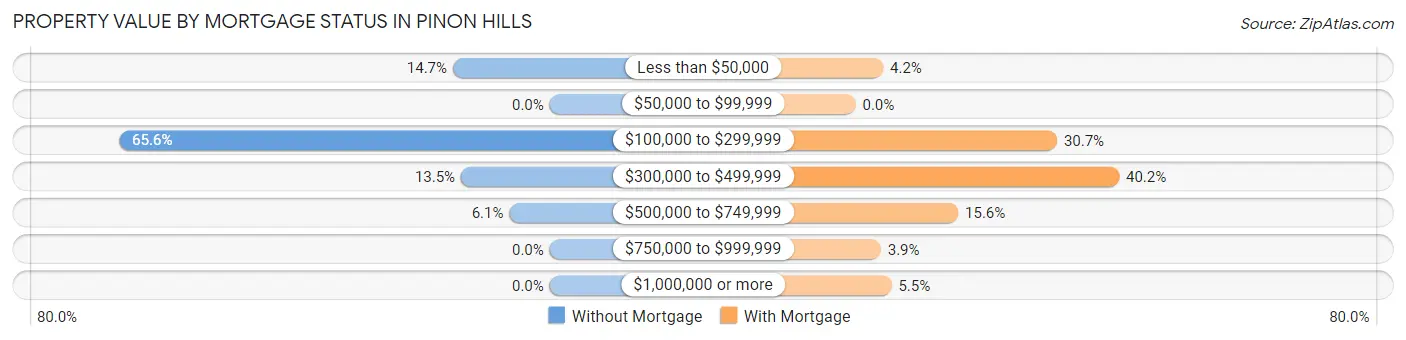
| Property Value | Without Mortgage | With Mortgage |
| Less than $50,000 | 60 (14.7%) | 60 (4.2%) |
| $50,000 to $99,999 | 0 (0.0%) | 0 (0.0%) |
| $100,000 to $299,999 | 267 (65.6%) | 438 (30.7%) |
| $300,000 to $499,999 | 55 (13.5%) | 573 (40.2%) |
| $500,000 to $749,999 | 25 (6.1%) | 223 (15.6%) |
| $750,000 to $999,999 | 0 (0.0%) | 55 (3.8%) |
| $1,000,000 or more | 0 (0.0%) | 78 (5.5%) |
| Total | 407 (100.0%) | 1,427 (100.0%) |
Household Income by Mortgage Status in Pinon Hills
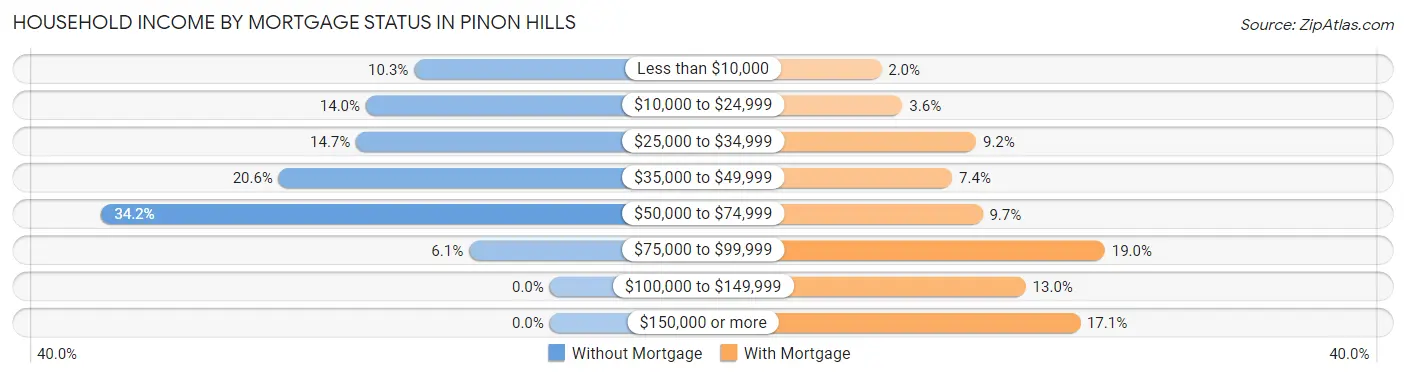
| Household Income | Without Mortgage | With Mortgage |
| Less than $10,000 | 42 (10.3%) | 28 (2.0%) |
| $10,000 to $24,999 | 57 (14.0%) | 51 (3.6%) |
| $25,000 to $34,999 | 60 (14.7%) | 131 (9.2%) |
| $35,000 to $49,999 | 84 (20.6%) | 105 (7.4%) |
| $50,000 to $74,999 | 139 (34.2%) | 138 (9.7%) |
| $75,000 to $99,999 | 25 (6.1%) | 271 (19.0%) |
| $100,000 to $149,999 | 0 (0.0%) | 185 (13.0%) |
| $150,000 or more | 0 (0.0%) | 244 (17.1%) |
| Total | 407 (100.0%) | 1,427 (100.0%) |
Property Value to Household Income Ratio in Pinon Hills
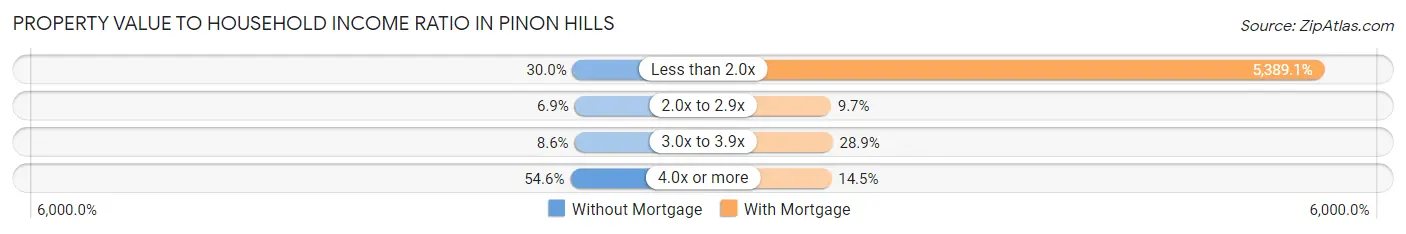
| Value-to-Income Ratio | Without Mortgage | With Mortgage |
| Less than 2.0x | 122 (30.0%) | 76,902 (5,389.1%) |
| 2.0x to 2.9x | 28 (6.9%) | 139 (9.7%) |
| 3.0x to 3.9x | 35 (8.6%) | 412 (28.9%) |
| 4.0x or more | 222 (54.5%) | 207 (14.5%) |
| Total | 407 (100.0%) | 1,427 (100.0%) |
Real Estate Taxes by Mortgage Status in Pinon Hills
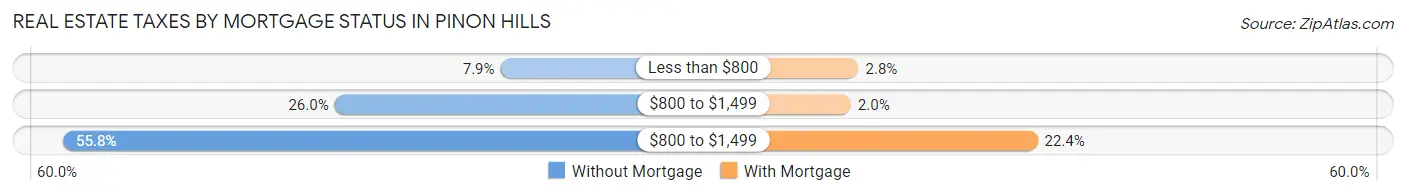
| Property Taxes | Without Mortgage | With Mortgage |
| Less than $800 | 32 (7.9%) | 40 (2.8%) |
| $800 to $1,499 | 106 (26.0%) | 28 (2.0%) |
| $800 to $1,499 | 227 (55.8%) | 320 (22.4%) |
| Total | 407 (100.0%) | 1,427 (100.0%) |
Health & Disability in Pinon Hills
Health Insurance Coverage by Age in Pinon Hills
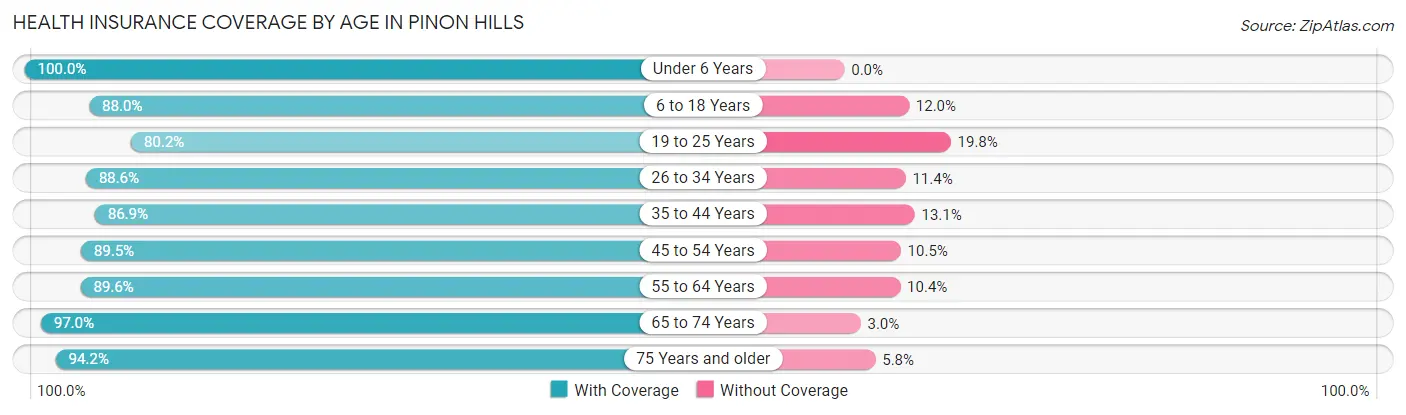
| Age Bracket | With Coverage | Without Coverage |
| Under 6 Years | 732 (100.0%) | 0 (0.0%) |
| 6 to 18 Years | 1,023 (88.0%) | 140 (12.0%) |
| 19 to 25 Years | 368 (80.2%) | 91 (19.8%) |
| 26 to 34 Years | 823 (88.6%) | 106 (11.4%) |
| 35 to 44 Years | 710 (86.9%) | 107 (13.1%) |
| 45 to 54 Years | 528 (89.5%) | 62 (10.5%) |
| 55 to 64 Years | 1,066 (89.6%) | 124 (10.4%) |
| 65 to 74 Years | 769 (97.0%) | 24 (3.0%) |
| 75 Years and older | 424 (94.2%) | 26 (5.8%) |
| Total | 6,443 (90.4%) | 680 (9.6%) |
Health Insurance Coverage by Citizenship Status in Pinon Hills
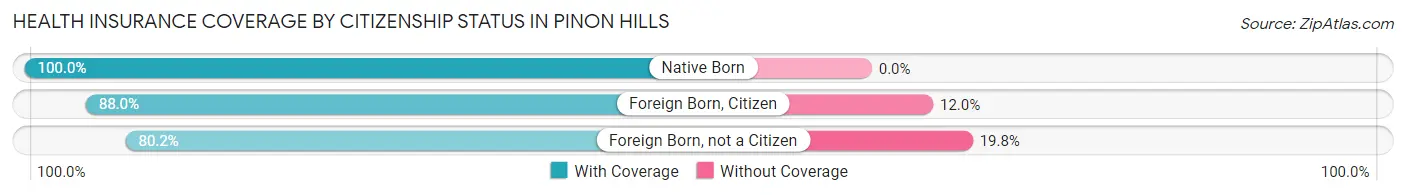
| Citizenship Status | With Coverage | Without Coverage |
| Native Born | 732 (100.0%) | 0 (0.0%) |
| Foreign Born, Citizen | 1,023 (88.0%) | 140 (12.0%) |
| Foreign Born, not a Citizen | 368 (80.2%) | 91 (19.8%) |
Health Insurance Coverage by Household Income in Pinon Hills
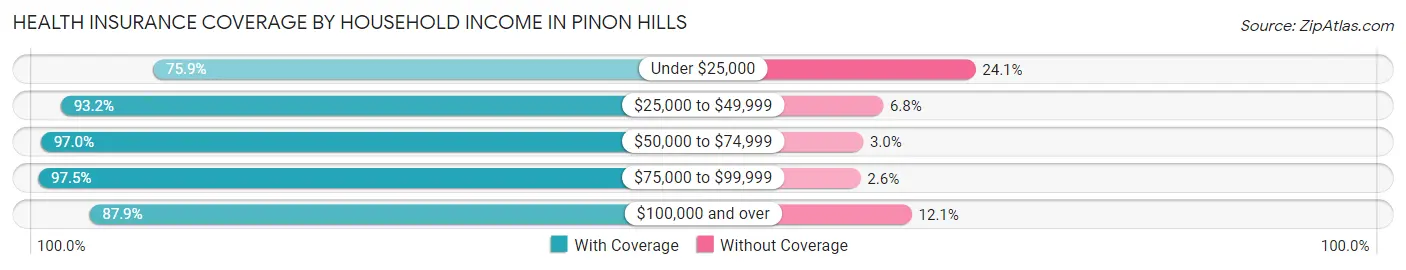
| Household Income | With Coverage | Without Coverage |
| Under $25,000 | 712 (75.9%) | 226 (24.1%) |
| $25,000 to $49,999 | 1,390 (93.2%) | 101 (6.8%) |
| $50,000 to $74,999 | 1,662 (97.0%) | 52 (3.0%) |
| $75,000 to $99,999 | 611 (97.5%) | 16 (2.5%) |
| $100,000 and over | 2,062 (87.9%) | 285 (12.1%) |
Public vs Private Health Insurance Coverage by Age in Pinon Hills
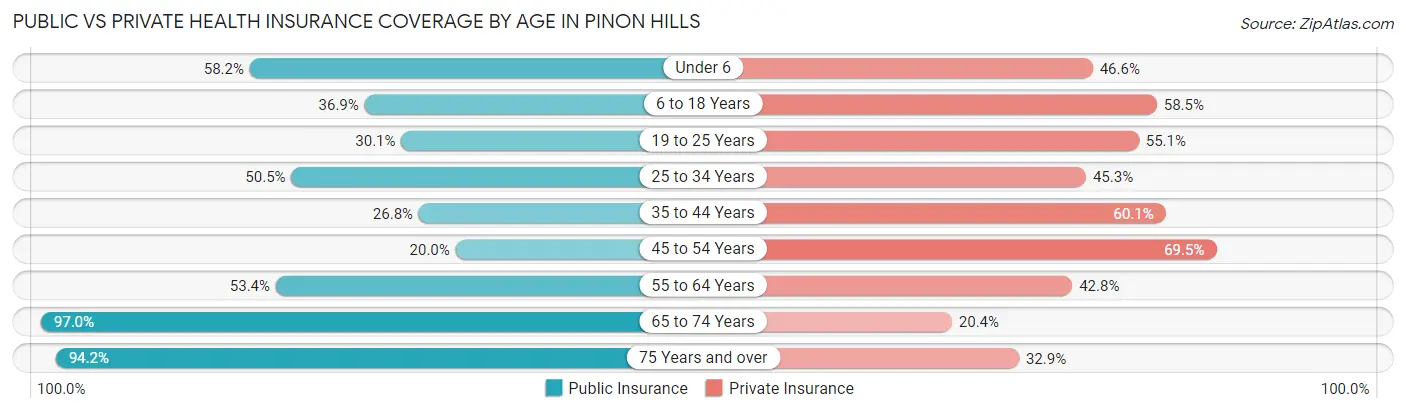
| Age Bracket | Public Insurance | Private Insurance |
| Under 6 | 426 (58.2%) | 341 (46.6%) |
| 6 to 18 Years | 429 (36.9%) | 680 (58.5%) |
| 19 to 25 Years | 138 (30.1%) | 253 (55.1%) |
| 25 to 34 Years | 469 (50.5%) | 421 (45.3%) |
| 35 to 44 Years | 219 (26.8%) | 491 (60.1%) |
| 45 to 54 Years | 118 (20.0%) | 410 (69.5%) |
| 55 to 64 Years | 635 (53.4%) | 509 (42.8%) |
| 65 to 74 Years | 769 (97.0%) | 162 (20.4%) |
| 75 Years and over | 424 (94.2%) | 148 (32.9%) |
| Total | 3,627 (50.9%) | 3,415 (47.9%) |
Disability Status by Sex by Age in Pinon Hills
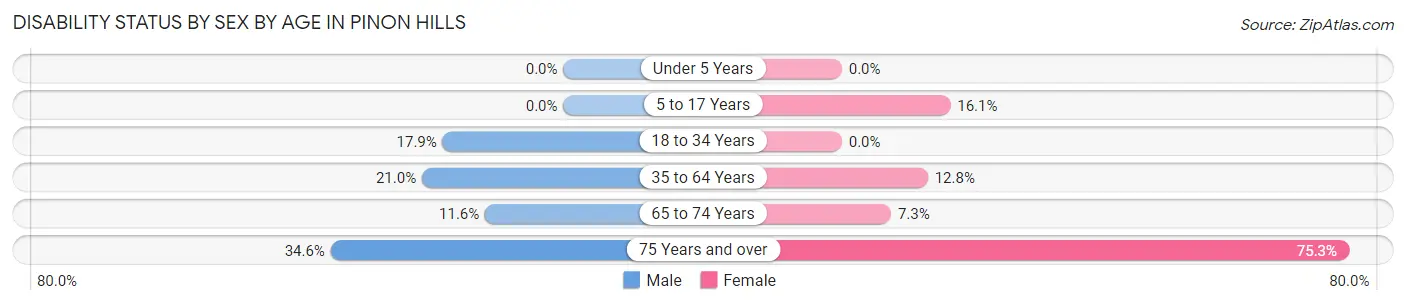
| Age Bracket | Male | Female |
| Under 5 Years | 0 (0.0%) | 0 (0.0%) |
| 5 to 17 Years | 0 (0.0%) | 130 (16.1%) |
| 18 to 34 Years | 121 (17.9%) | 0 (0.0%) |
| 35 to 64 Years | 300 (21.0%) | 149 (12.8%) |
| 65 to 74 Years | 46 (11.6%) | 29 (7.3%) |
| 75 Years and over | 66 (34.5%) | 195 (75.3%) |
Disability Class by Sex by Age in Pinon Hills
Disability Class: Hearing Difficulty
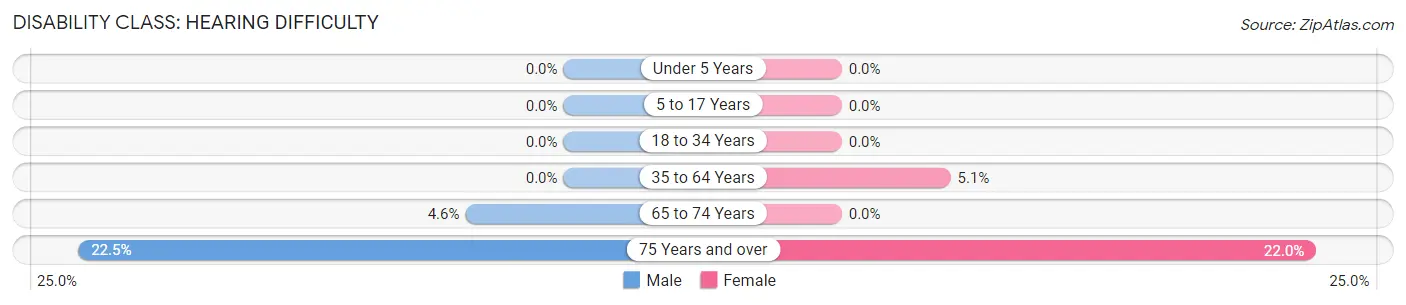
| Age Bracket | Male | Female |
| Under 5 Years | 0 (0.0%) | 0 (0.0%) |
| 5 to 17 Years | 0 (0.0%) | 0 (0.0%) |
| 18 to 34 Years | 0 (0.0%) | 0 (0.0%) |
| 35 to 64 Years | 0 (0.0%) | 59 (5.1%) |
| 65 to 74 Years | 18 (4.5%) | 0 (0.0%) |
| 75 Years and over | 43 (22.5%) | 57 (22.0%) |
Disability Class: Vision Difficulty
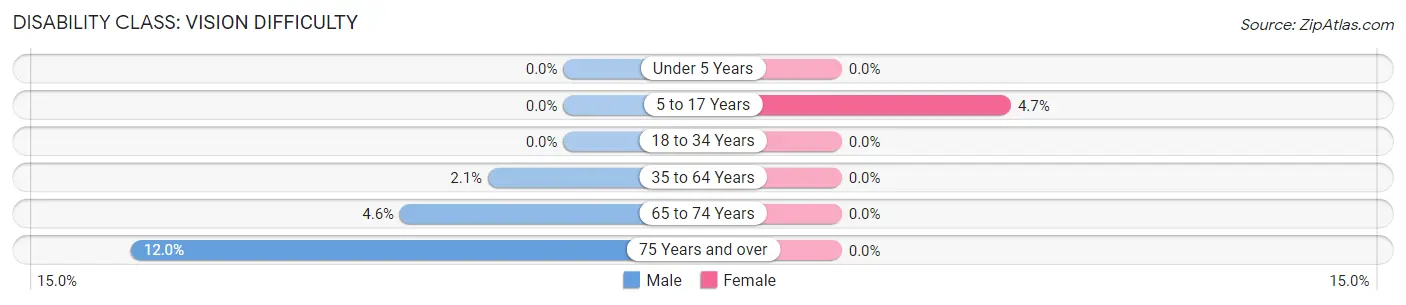
| Age Bracket | Male | Female |
| Under 5 Years | 0 (0.0%) | 0 (0.0%) |
| 5 to 17 Years | 0 (0.0%) | 38 (4.7%) |
| 18 to 34 Years | 0 (0.0%) | 0 (0.0%) |
| 35 to 64 Years | 30 (2.1%) | 0 (0.0%) |
| 65 to 74 Years | 18 (4.5%) | 0 (0.0%) |
| 75 Years and over | 23 (12.0%) | 0 (0.0%) |
Disability Class: Cognitive Difficulty
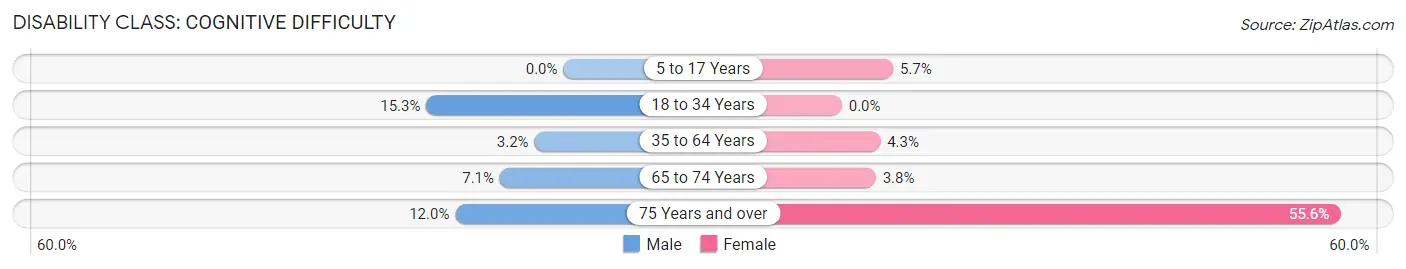
| Age Bracket | Male | Female |
| 5 to 17 Years | 0 (0.0%) | 46 (5.7%) |
| 18 to 34 Years | 103 (15.3%) | 0 (0.0%) |
| 35 to 64 Years | 46 (3.2%) | 50 (4.3%) |
| 65 to 74 Years | 28 (7.1%) | 15 (3.8%) |
| 75 Years and over | 23 (12.0%) | 144 (55.6%) |
Disability Class: Ambulatory Difficulty
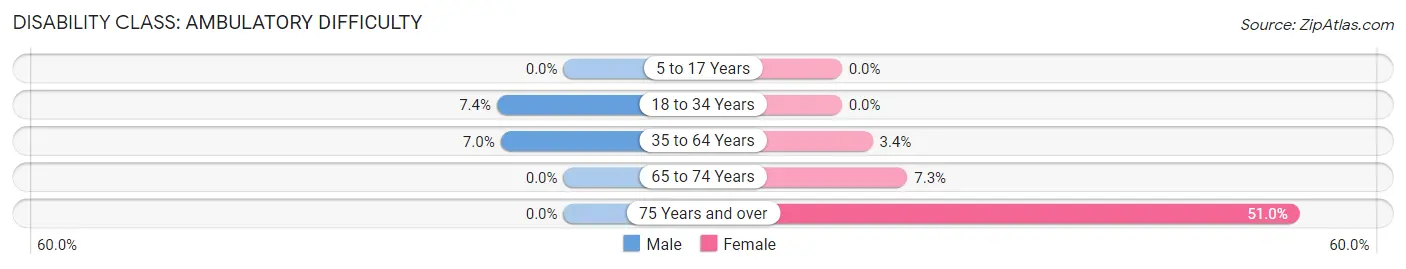
| Age Bracket | Male | Female |
| 5 to 17 Years | 0 (0.0%) | 0 (0.0%) |
| 18 to 34 Years | 50 (7.4%) | 0 (0.0%) |
| 35 to 64 Years | 100 (7.0%) | 40 (3.4%) |
| 65 to 74 Years | 0 (0.0%) | 29 (7.3%) |
| 75 Years and over | 0 (0.0%) | 132 (51.0%) |
Disability Class: Self-Care Difficulty
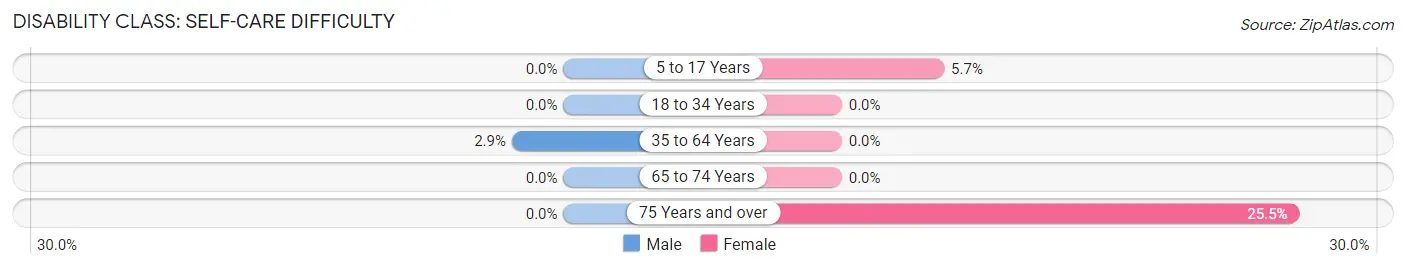
| Age Bracket | Male | Female |
| 5 to 17 Years | 0 (0.0%) | 46 (5.7%) |
| 18 to 34 Years | 0 (0.0%) | 0 (0.0%) |
| 35 to 64 Years | 41 (2.9%) | 0 (0.0%) |
| 65 to 74 Years | 0 (0.0%) | 0 (0.0%) |
| 75 Years and over | 0 (0.0%) | 66 (25.5%) |
Technology Access in Pinon Hills
Computing Device Access in Pinon Hills
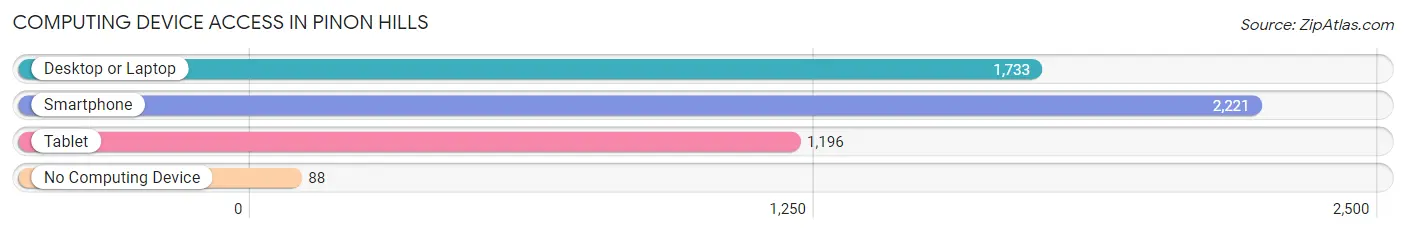
| Device Type | # Households | % Households |
| Desktop or Laptop | 1,733 | 72.5% |
| Smartphone | 2,221 | 93.0% |
| Tablet | 1,196 | 50.1% |
| No Computing Device | 88 | 3.7% |
| Total | 2,389 | 100.0% |
Internet Access in Pinon Hills
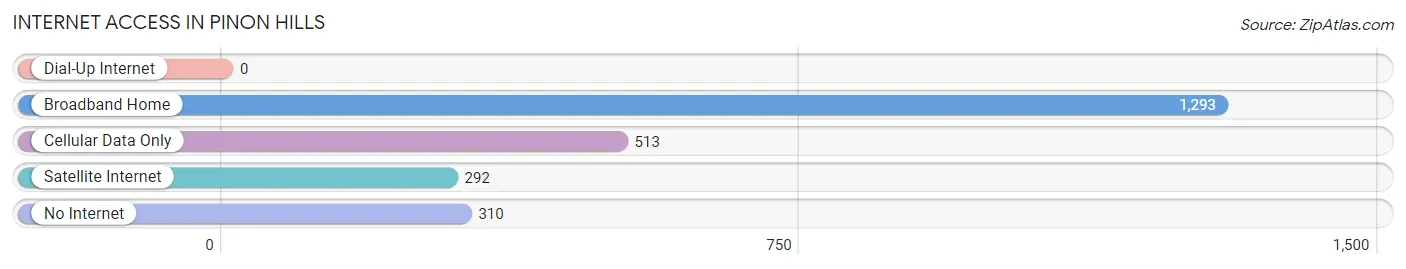
| Internet Type | # Households | % Households |
| Dial-Up Internet | 0 | 0.0% |
| Broadband Home | 1,293 | 54.1% |
| Cellular Data Only | 513 | 21.5% |
| Satellite Internet | 292 | 12.2% |
| No Internet | 310 | 13.0% |
| Total | 2,389 | 100.0% |
Pinon Hills Summary
Pinon Hills is a small unincorporated community located in the Mojave Desert of San Bernardino County, California. It is situated in the foothills of the San Gabriel Mountains, approximately 25 miles northeast of the city of San Bernardino. The community is located along the historic Route 66, and is home to a population of approximately 8,000 people.
History
Pinon Hills was originally inhabited by the Serrano Indians, who were the original inhabitants of the area. The Serrano Indians were a peaceful tribe who lived in the area for centuries before the arrival of the Spanish in the late 1700s. The Spanish established a mission in the area, and the Serrano Indians were forced to relocate to the nearby San Bernardino Valley.
In the late 1800s, the area was settled by ranchers and farmers, who established small ranches and farms in the area. The area was known as Pinon Hills due to the abundance of pinon trees in the area. The area was also home to a number of small mining operations, which were established to extract gold, silver, and other minerals from the area.
In the early 1900s, the area was connected to the rest of the country by the historic Route 66, which ran through the area. The area was also home to a number of small businesses, including a general store, a gas station, and a post office.
Geography
Pinon Hills is located in the Mojave Desert of San Bernardino County, California. It is situated in the foothills of the San Gabriel Mountains, approximately 25 miles northeast of the city of San Bernardino. The area is characterized by its dry, desert climate, with hot summers and mild winters. The area is also home to a number of small mountain ranges, including the San Gabriel Mountains, the San Bernardino Mountains, and the San Jacinto Mountains.
Economy
The economy of Pinon Hills is largely based on agriculture and tourism. The area is home to a number of small farms and ranches, which produce a variety of crops, including alfalfa, hay, and vegetables. The area is also home to a number of small businesses, including restaurants, gas stations, and convenience stores.
The area is also home to a number of tourist attractions, including the historic Route 66, the Mojave National Preserve, and the San Bernardino National Forest. The area is also home to a number of recreational activities, including camping, hiking, and fishing.
Demographics
As of the 2010 census, the population of Pinon Hills was 8,000. The racial makeup of the area was 79.3% White, 0.7% African American, 0.7% Native American, 0.7% Asian, 0.2% Pacific Islander, and 17.1% from other races. The median household income in the area was $45,000, and the median age was 37. The area is home to a number of small churches, including the Pinon Hills Community Church, the Pinon Hills Baptist Church, and the Pinon Hills United Methodist Church.
Common Questions
What is Per Capita Income in Pinon Hills?
Per Capita income in Pinon Hills is $35,831.
What is the Median Family Income in Pinon Hills?
Median Family Income in Pinon Hills is $68,528.
What is the Median Household income in Pinon Hills?
Median Household Income in Pinon Hills is $60,156.
What is Income or Wage Gap in Pinon Hills?
Income or Wage Gap in Pinon Hills is 34.2%.
Women in Pinon Hills earn 65.8 cents for every dollar earned by a man.
What is Inequality or Gini Index in Pinon Hills?
Inequality or Gini Index in Pinon Hills is 0.59.
What is the Total Population of Pinon Hills?
Total Population of Pinon Hills is 7,157.
What is the Total Male Population of Pinon Hills?
Total Male Population of Pinon Hills is 3,490.
What is the Total Female Population of Pinon Hills?
Total Female Population of Pinon Hills is 3,667.
What is the Ratio of Males per 100 Females in Pinon Hills?
There are 95.17 Males per 100 Females in Pinon Hills.
What is the Ratio of Females per 100 Males in Pinon Hills?
There are 105.07 Females per 100 Males in Pinon Hills.
What is the Median Population Age in Pinon Hills?
Median Population Age in Pinon Hills is 36.8 Years.
What is the Average Family Size in Pinon Hills
Average Family Size in Pinon Hills is 3.6 People.
What is the Average Household Size in Pinon Hills
Average Household Size in Pinon Hills is 3.0 People.
How Large is the Labor Force in Pinon Hills?
There are 2,638 People in the Labor Forcein in Pinon Hills.
What is the Percentage of People in the Labor Force in Pinon Hills?
48.9% of People are in the Labor Force in Pinon Hills.
What is the Unemployment Rate in Pinon Hills?
Unemployment Rate in Pinon Hills is 14.3%.