Mammoth Lakes, CA Map & Demographics
Mammoth Lakes Map
Mammoth Lakes Overview
$45,969
PER CAPITA INCOME
$102,500
AVG FAMILY INCOME
$80,795
AVG HOUSEHOLD INCOME
10.2%
WAGE / INCOME GAP [ % ]
89.8¢/ $1
WAGE / INCOME GAP [ $ ]
0.40
INEQUALITY / GINI INDEX
7,253
TOTAL POPULATION
3,697
MALE POPULATION
3,556
FEMALE POPULATION
103.97
MALES / 100 FEMALES
96.19
FEMALES / 100 MALES
38.4
MEDIAN AGE
3.2
AVG FAMILY SIZE
2.3
AVG HOUSEHOLD SIZE
4,481
LABOR FORCE [ PEOPLE ]
75.7%
PERCENT IN LABOR FORCE
1.2%
UNEMPLOYMENT RATE
Mammoth Lakes Zip Codes
Mammoth Lakes Area Codes
Income in Mammoth Lakes
Income Overview in Mammoth Lakes
Per Capita Income in Mammoth Lakes is $45,969, while median incomes of families and households are $102,500 and $80,795 respectively.
| Characteristic | Number | Measure |
| Per Capita Income | 7,253 | $45,969 |
| Median Family Income | 1,590 | $102,500 |
| Mean Family Income | 1,590 | $120,488 |
| Median Household Income | 3,101 | $80,795 |
| Mean Household Income | 3,101 | $102,670 |
| Income Deficit | 1,590 | $0 |
| Wage / Income Gap (%) | 7,253 | 10.17% |
| Wage / Income Gap ($) | 7,253 | 89.83¢ per $1 |
| Gini / Inequality Index | 7,253 | 0.40 |
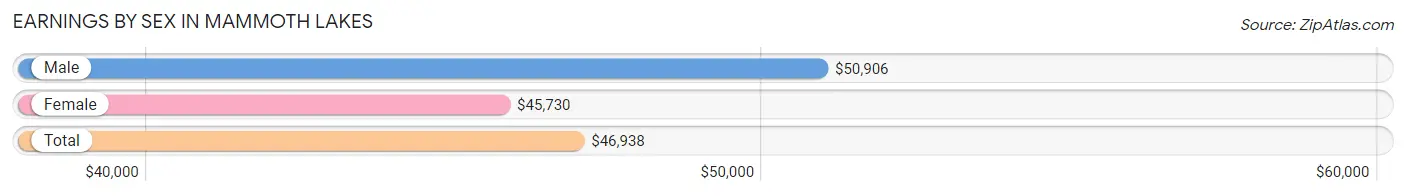
Earnings by Sex in Mammoth Lakes
Average Earnings in Mammoth Lakes are $46,938, $50,906 for men and $45,730 for women, a difference of 10.2%.
| Sex | Number | Average Earnings |
| Male | 2,446 (52.8%) | $50,906 |
| Female | 2,184 (47.2%) | $45,730 |
| Total | 4,630 (100.0%) | $46,938 |
Earnings by Sex by Income Bracket in Mammoth Lakes
The most common earnings brackets in Mammoth Lakes are $75,000 to $99,999 for men (380 | 15.5%) and $22,500 to $24,999 for women (382 | 17.5%).
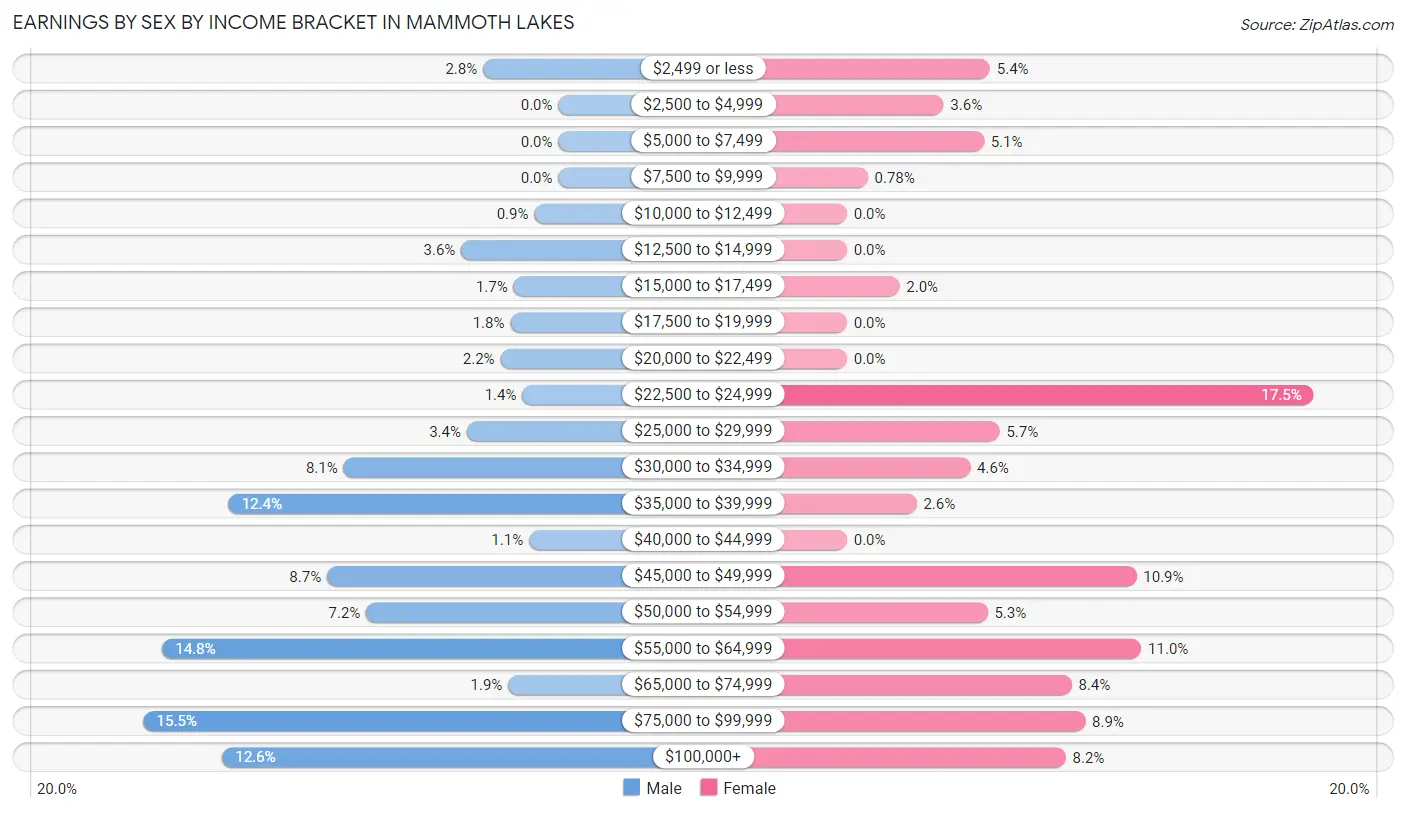
| Income | Male | Female |
| $2,499 or less | 69 (2.8%) | 117 (5.4%) |
| $2,500 to $4,999 | 0 (0.0%) | 79 (3.6%) |
| $5,000 to $7,499 | 0 (0.0%) | 112 (5.1%) |
| $7,500 to $9,999 | 0 (0.0%) | 17 (0.8%) |
| $10,000 to $12,499 | 22 (0.9%) | 0 (0.0%) |
| $12,500 to $14,999 | 89 (3.6%) | 0 (0.0%) |
| $15,000 to $17,499 | 41 (1.7%) | 43 (2.0%) |
| $17,500 to $19,999 | 44 (1.8%) | 0 (0.0%) |
| $20,000 to $22,499 | 53 (2.2%) | 0 (0.0%) |
| $22,500 to $24,999 | 33 (1.3%) | 382 (17.5%) |
| $25,000 to $29,999 | 84 (3.4%) | 125 (5.7%) |
| $30,000 to $34,999 | 197 (8.1%) | 101 (4.6%) |
| $35,000 to $39,999 | 302 (12.3%) | 57 (2.6%) |
| $40,000 to $44,999 | 27 (1.1%) | 0 (0.0%) |
| $45,000 to $49,999 | 212 (8.7%) | 237 (10.8%) |
| $50,000 to $54,999 | 176 (7.2%) | 115 (5.3%) |
| $55,000 to $64,999 | 363 (14.8%) | 241 (11.0%) |
| $65,000 to $74,999 | 46 (1.9%) | 184 (8.4%) |
| $75,000 to $99,999 | 380 (15.5%) | 195 (8.9%) |
| $100,000+ | 308 (12.6%) | 179 (8.2%) |
| Total | 2,446 (100.0%) | 2,184 (100.0%) |
Earnings by Sex by Educational Attainment in Mammoth Lakes
Average earnings in Mammoth Lakes are $50,290 for men and $47,500 for women, a difference of 5.6%. Men with an educational attainment of college or associate's degree enjoy the highest average annual earnings of $52,480, while those with less than high school education earn the least with $33,615. Women with an educational attainment of graduate degree earn the most with the average annual earnings of $89,437, while those with less than high school education have the smallest earnings of $24,626.
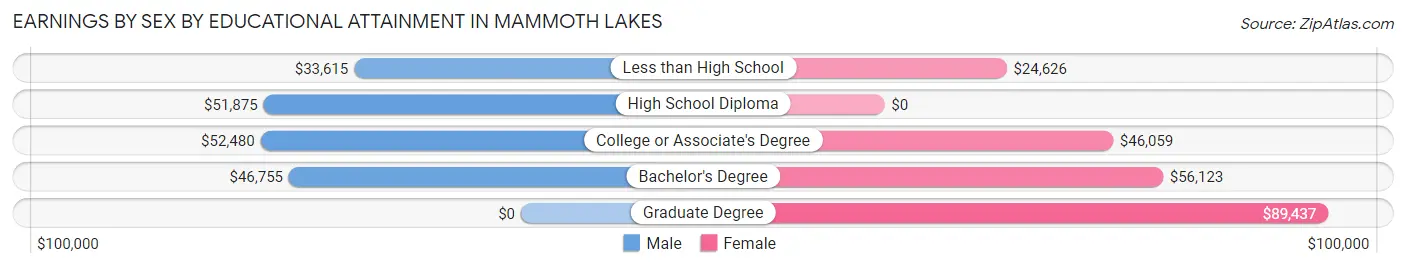
| Educational Attainment | Male Income | Female Income |
| Less than High School | $33,615 | $24,626 |
| High School Diploma | $51,875 | $0 |
| College or Associate's Degree | $52,480 | $46,059 |
| Bachelor's Degree | $46,755 | $56,123 |
| Graduate Degree | - | - |
| Total | $50,290 | $47,500 |
Family Income in Mammoth Lakes
Family Income Brackets in Mammoth Lakes
According to the Mammoth Lakes family income data, there are 598 families falling into the $100,000 to $149,999 income range, which is the most common income bracket and makes up 37.6% of all families.
| Income Bracket | # Families | % Families |
| Less than $10,000 | 57 | 3.6% |
| $10,000 to $14,999 | 0 | 0.0% |
| $15,000 to $24,999 | 25 | 1.6% |
| $25,000 to $34,999 | 60 | 3.8% |
| $35,000 to $49,999 | 52 | 3.3% |
| $50,000 to $74,999 | 251 | 15.8% |
| $75,000 to $99,999 | 310 | 19.5% |
| $100,000 to $149,999 | 598 | 37.6% |
| $150,000 to $199,999 | 0 | 0.0% |
| $200,000+ | 235 | 14.8% |
Family Income by Famaliy Size in Mammoth Lakes
2-person families (870 | 54.7%) account for the highest median family income in Mammoth Lakes with $105,345 per family, while 2-person families (870 | 54.7%) have the highest median income of $52,672 per family member.
| Income Bracket | # Families | Median Income |
| 2-Person Families | 870 (54.7%) | $105,345 |
| 3-Person Families | 247 (15.5%) | $0 |
| 4-Person Families | 375 (23.6%) | $86,740 |
| 5-Person Families | 71 (4.5%) | $0 |
| 6-Person Families | 27 (1.7%) | $0 |
| 7+ Person Families | 0 (0.0%) | $0 |
| Total | 1,590 (100.0%) | $102,500 |
Family Income by Number of Earners in Mammoth Lakes
| Number of Earners | # Families | Median Income |
| No Earners | 381 (24.0%) | $0 |
| 1 Earner | 205 (12.9%) | $100,888 |
| 2 Earners | 799 (50.2%) | $125,097 |
| 3+ Earners | 205 (12.9%) | $99,016 |
| Total | 1,590 (100.0%) | $102,500 |
Household Income in Mammoth Lakes
Household Income Brackets in Mammoth Lakes
With 974 households falling in the category, the $50,000 to $74,999 income range is the most frequent in Mammoth Lakes, accounting for 31.4% of all households. In contrast, only 81 households (2.6%) fall into the $150,000 to $199,999 income bracket, making it the least populous group.
| Income Bracket | # Households | % Households |
| Less than $10,000 | 84 | 2.7% |
| $10,000 to $14,999 | 90 | 2.9% |
| $15,000 to $24,999 | 109 | 3.5% |
| $25,000 to $34,999 | 93 | 3.0% |
| $35,000 to $49,999 | 121 | 3.9% |
| $50,000 to $74,999 | 974 | 31.4% |
| $75,000 to $99,999 | 493 | 15.9% |
| $100,000 to $149,999 | 738 | 23.8% |
| $150,000 to $199,999 | 81 | 2.6% |
| $200,000+ | 319 | 10.3% |
Household Income by Householder Age in Mammoth Lakes
The median household income in Mammoth Lakes is $80,795, with the highest median household income of $97,923 found in the 45 to 64 years age bracket for the primary householder. A total of 1,209 households (39.0%) fall into this category. Meanwhile, the 15 to 24 years age bracket for the primary householder has the lowest median household income of $0, with 214 households (6.9%) in this group.
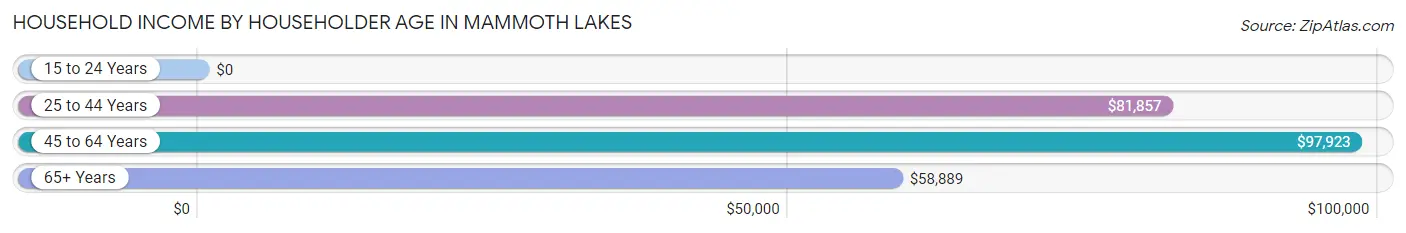
| Income Bracket | # Households | Median Income |
| 15 to 24 Years | 214 (6.9%) | $0 |
| 25 to 44 Years | 1,116 (36.0%) | $81,857 |
| 45 to 64 Years | 1,209 (39.0%) | $97,923 |
| 65+ Years | 562 (18.1%) | $58,889 |
| Total | 3,101 (100.0%) | $80,795 |
Poverty in Mammoth Lakes
Income Below Poverty by Sex and Age in Mammoth Lakes
With 11.4% poverty level for males and 6.2% for females among the residents of Mammoth Lakes, 5 year old males and 18 to 24 year old females are the most vulnerable to poverty, with 68 males (100.0%) and 99 females (42.5%) in their respective age groups living below the poverty level.
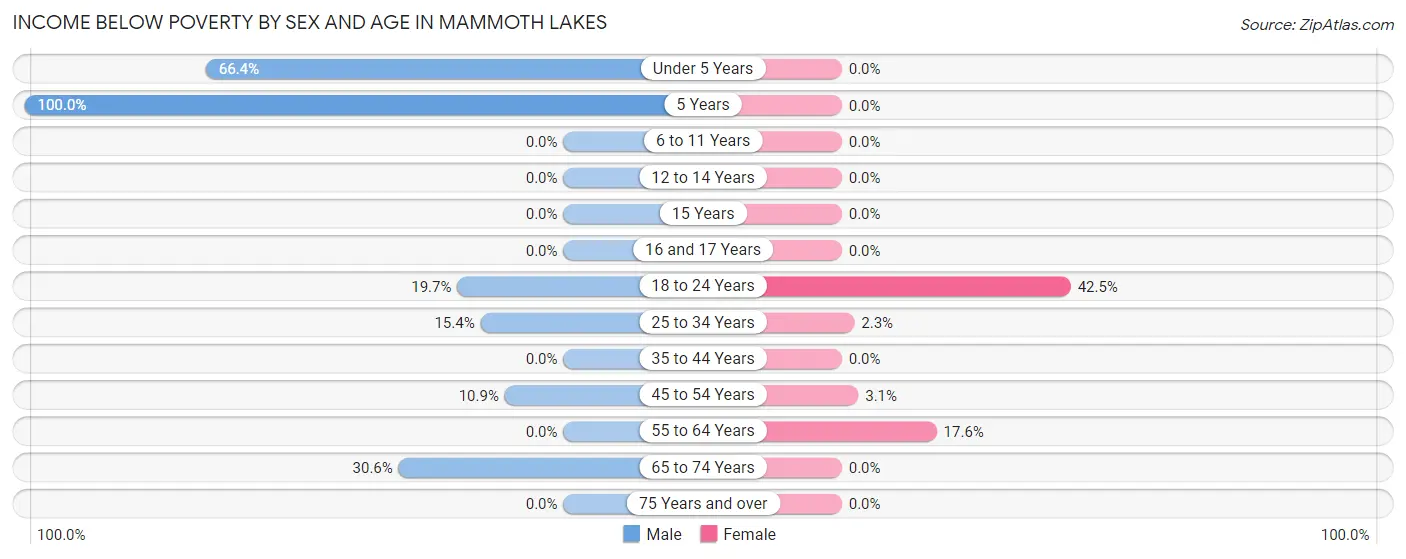
| Age Bracket | Male | Female |
| Under 5 Years | 73 (66.4%) | 0 (0.0%) |
| 5 Years | 68 (100.0%) | 0 (0.0%) |
| 6 to 11 Years | 0 (0.0%) | 0 (0.0%) |
| 12 to 14 Years | 0 (0.0%) | 0 (0.0%) |
| 15 Years | 0 (0.0%) | 0 (0.0%) |
| 16 and 17 Years | 0 (0.0%) | 0 (0.0%) |
| 18 to 24 Years | 63 (19.7%) | 99 (42.5%) |
| 25 to 34 Years | 70 (15.4%) | 17 (2.3%) |
| 35 to 44 Years | 0 (0.0%) | 0 (0.0%) |
| 45 to 54 Years | 57 (10.9%) | 20 (3.1%) |
| 55 to 64 Years | 0 (0.0%) | 84 (17.6%) |
| 65 to 74 Years | 89 (30.6%) | 0 (0.0%) |
| 75 Years and over | 0 (0.0%) | 0 (0.0%) |
| Total | 420 (11.4%) | 220 (6.2%) |
Income Above Poverty by Sex and Age in Mammoth Lakes
According to the poverty statistics in Mammoth Lakes, males aged 6 to 11 years and females aged under 5 years are the age groups that are most secure financially, with 100.0% of males and 100.0% of females in these age groups living above the poverty line.
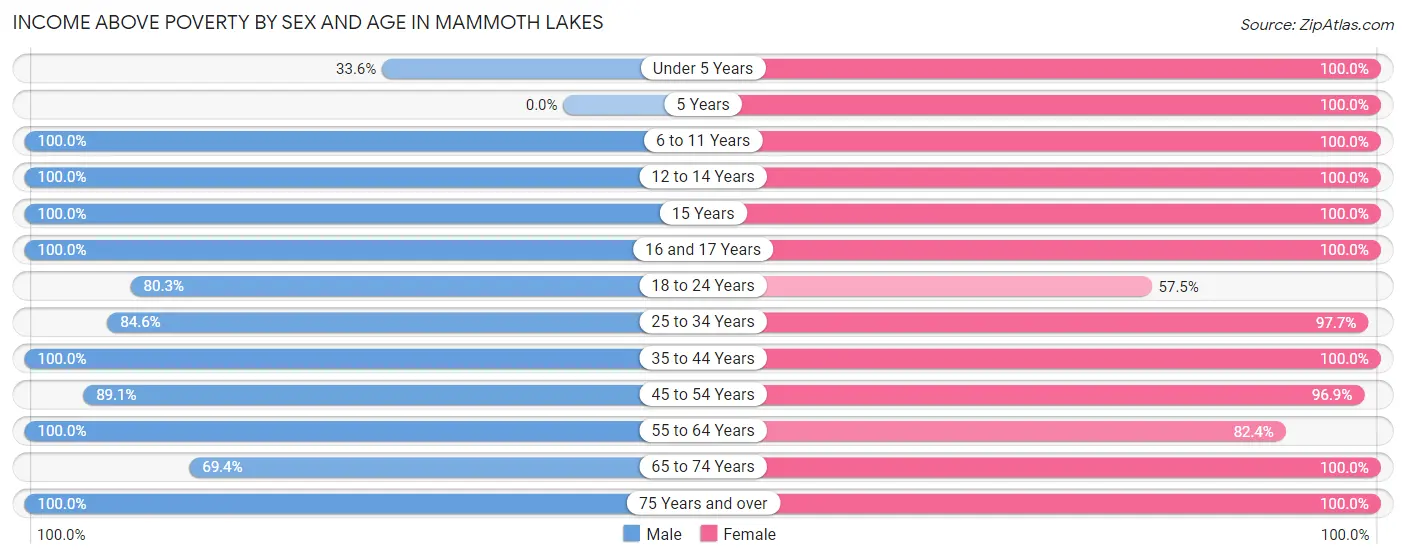
| Age Bracket | Male | Female |
| Under 5 Years | 37 (33.6%) | 35 (100.0%) |
| 5 Years | 0 (0.0%) | 154 (100.0%) |
| 6 to 11 Years | 304 (100.0%) | 109 (100.0%) |
| 12 to 14 Years | 161 (100.0%) | 125 (100.0%) |
| 15 Years | 125 (100.0%) | 142 (100.0%) |
| 16 and 17 Years | 41 (100.0%) | 108 (100.0%) |
| 18 to 24 Years | 257 (80.3%) | 134 (57.5%) |
| 25 to 34 Years | 385 (84.6%) | 713 (97.7%) |
| 35 to 44 Years | 530 (100.0%) | 462 (100.0%) |
| 45 to 54 Years | 467 (89.1%) | 634 (96.9%) |
| 55 to 64 Years | 557 (100.0%) | 393 (82.4%) |
| 65 to 74 Years | 202 (69.4%) | 241 (100.0%) |
| 75 Years and over | 211 (100.0%) | 86 (100.0%) |
| Total | 3,277 (88.6%) | 3,336 (93.8%) |
Income Below Poverty Among Married-Couple Families in Mammoth Lakes
The poverty statistics for married-couple families in Mammoth Lakes show that 5.5% or 83 of the total 1,504 families live below the poverty line. Families with no children have the highest poverty rate of 5.9%, comprising of 57 families. On the other hand, families with 3 or 4 children have the lowest poverty rate of 0.0%, which includes 0 families.
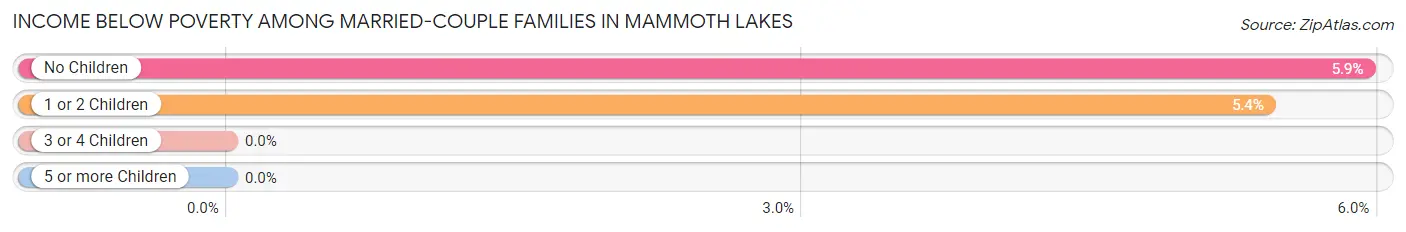
| Children | Above Poverty | Below Poverty |
| No Children | 902 (94.1%) | 57 (5.9%) |
| 1 or 2 Children | 454 (94.6%) | 26 (5.4%) |
| 3 or 4 Children | 65 (100.0%) | 0 (0.0%) |
| 5 or more Children | 0 (0.0%) | 0 (0.0%) |
| Total | 1,421 (94.5%) | 83 (5.5%) |
Income Below Poverty Among Single-Parent Households in Mammoth Lakes
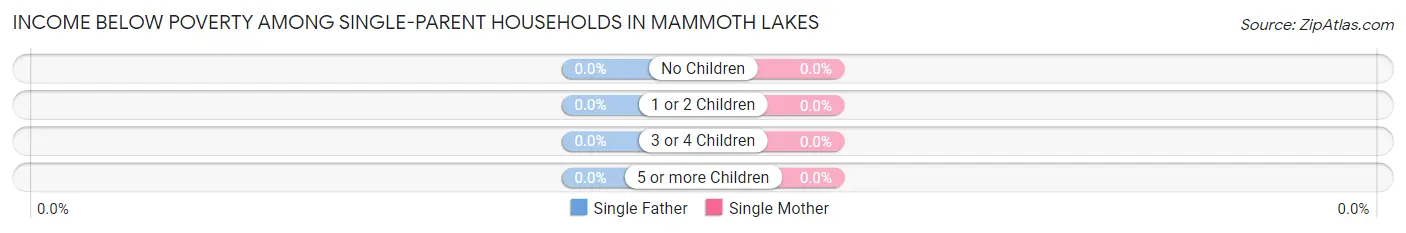
| Children | Single Father | Single Mother |
| No Children | 0 (0.0%) | 0 (0.0%) |
| 1 or 2 Children | 0 (0.0%) | 0 (0.0%) |
| 3 or 4 Children | 0 (0.0%) | 0 (0.0%) |
| 5 or more Children | 0 (0.0%) | 0 (0.0%) |
| Total | 0 (0.0%) | 0 (0.0%) |
Income Below Poverty Among Married-Couple vs Single-Parent Households in Mammoth Lakes
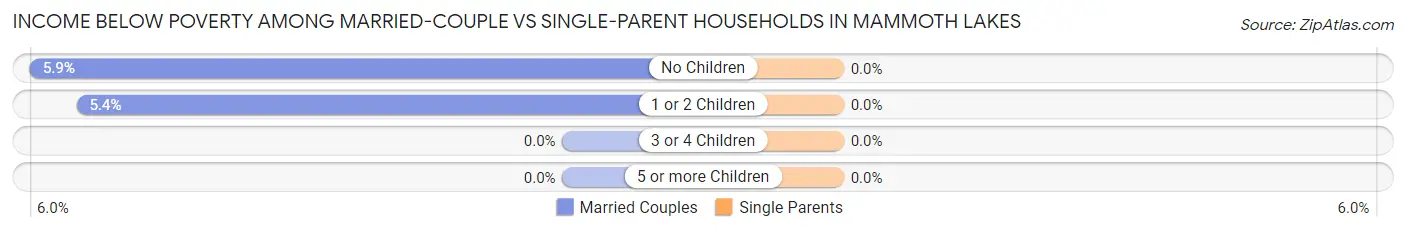
| Children | Married-Couple Families | Single-Parent Households |
| No Children | 57 (5.9%) | 0 (0.0%) |
| 1 or 2 Children | 26 (5.4%) | 0 (0.0%) |
| 3 or 4 Children | 0 (0.0%) | 0 (0.0%) |
| 5 or more Children | 0 (0.0%) | 0 (0.0%) |
| Total | 83 (5.5%) | 0 (0.0%) |
Race in Mammoth Lakes
The most populous races in Mammoth Lakes are White / Caucasian (6,008 | 82.8%), Hispanic or Latino (1,997 | 27.5%), and Some other Race (484 | 6.7%).
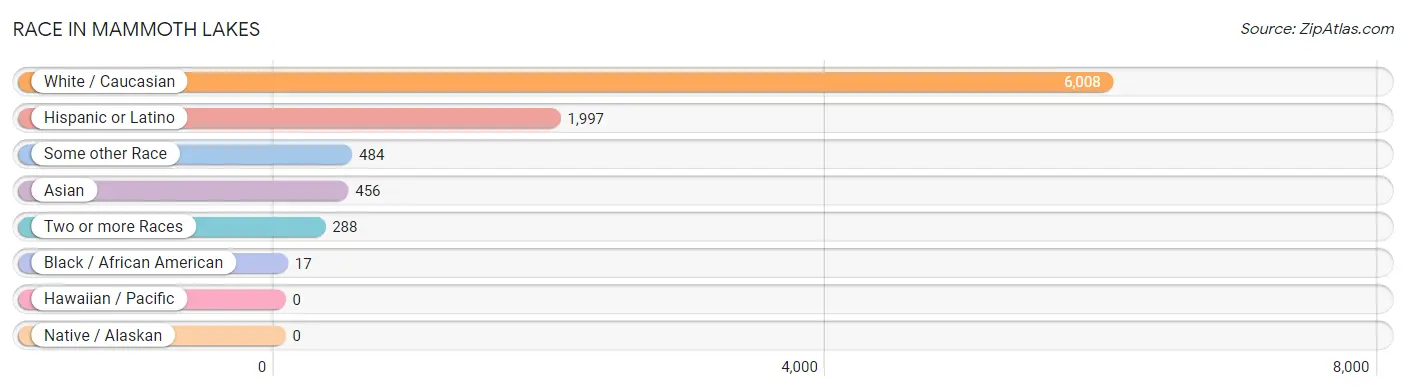
| Race | # Population | % Population |
| Asian | 456 | 6.3% |
| Black / African American | 17 | 0.2% |
| Hawaiian / Pacific | 0 | 0.0% |
| Hispanic or Latino | 1,997 | 27.5% |
| Native / Alaskan | 0 | 0.0% |
| White / Caucasian | 6,008 | 82.8% |
| Two or more Races | 288 | 4.0% |
| Some other Race | 484 | 6.7% |
| Total | 7,253 | 100.0% |
Ancestry in Mammoth Lakes
The most populous ancestries reported in Mammoth Lakes are Mexican (1,931 | 26.6%), German (1,092 | 15.1%), Irish (728 | 10.0%), English (532 | 7.3%), and Swedish (418 | 5.8%), together accounting for 64.8% of all Mammoth Lakes residents.
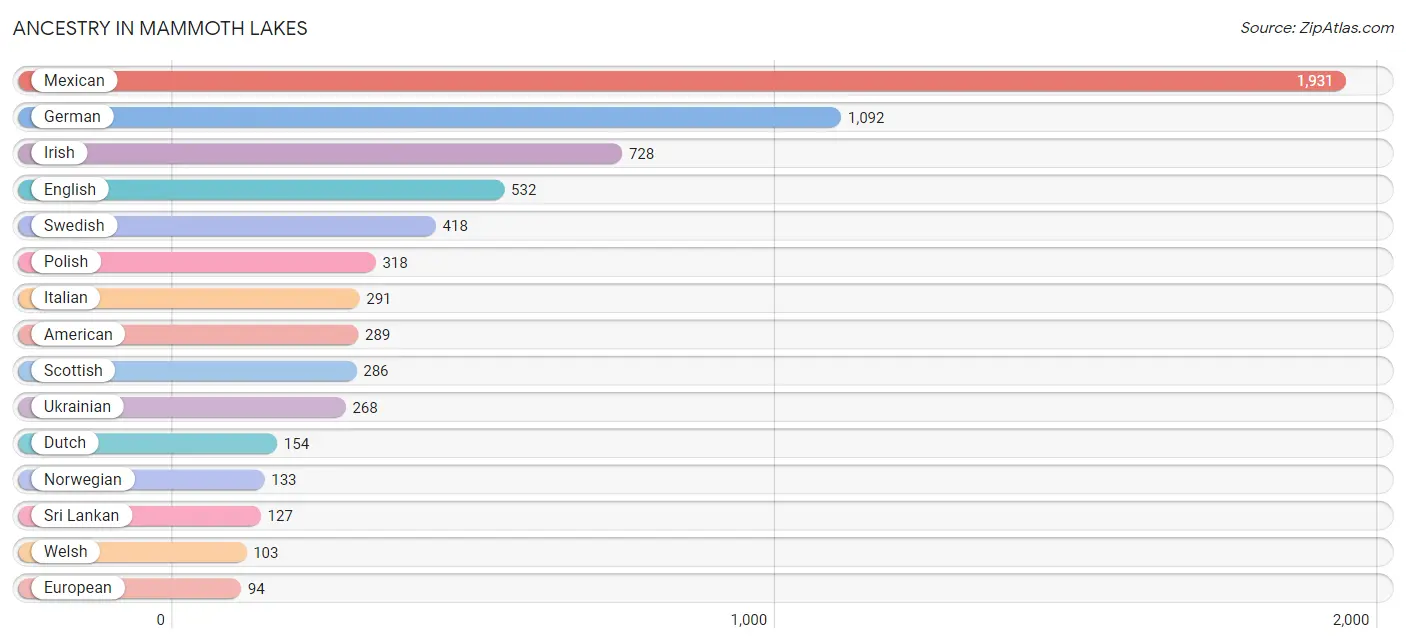
| Ancestry | # Population | % Population |
| African | 17 | 0.2% |
| American | 289 | 4.0% |
| Apache | 39 | 0.5% |
| Arab | 41 | 0.6% |
| Central American | 17 | 0.2% |
| Costa Rican | 17 | 0.2% |
| Dutch | 154 | 2.1% |
| Egyptian | 41 | 0.6% |
| English | 532 | 7.3% |
| European | 94 | 1.3% |
| Finnish | 42 | 0.6% |
| French | 24 | 0.3% |
| French Canadian | 73 | 1.0% |
| German | 1,092 | 15.1% |
| Hungarian | 92 | 1.3% |
| Irish | 728 | 10.0% |
| Italian | 291 | 4.0% |
| Korean | 34 | 0.5% |
| Mexican | 1,931 | 26.6% |
| Norwegian | 133 | 1.8% |
| Polish | 318 | 4.4% |
| Russian | 68 | 0.9% |
| Scotch-Irish | 24 | 0.3% |
| Scottish | 286 | 3.9% |
| Spaniard | 17 | 0.2% |
| Sri Lankan | 127 | 1.8% |
| Subsaharan African | 17 | 0.2% |
| Swedish | 418 | 5.8% |
| Ukrainian | 268 | 3.7% |
| Welsh | 103 | 1.4% | View All 30 Rows |
Immigrants in Mammoth Lakes
The most numerous immigrant groups reported in Mammoth Lakes came from Latin America (1,174 | 16.2%), Central America (1,142 | 15.8%), Mexico (1,125 | 15.5%), Asia (392 | 5.4%), and Israel (231 | 3.2%), together accounting for 56.0% of all Mammoth Lakes residents.
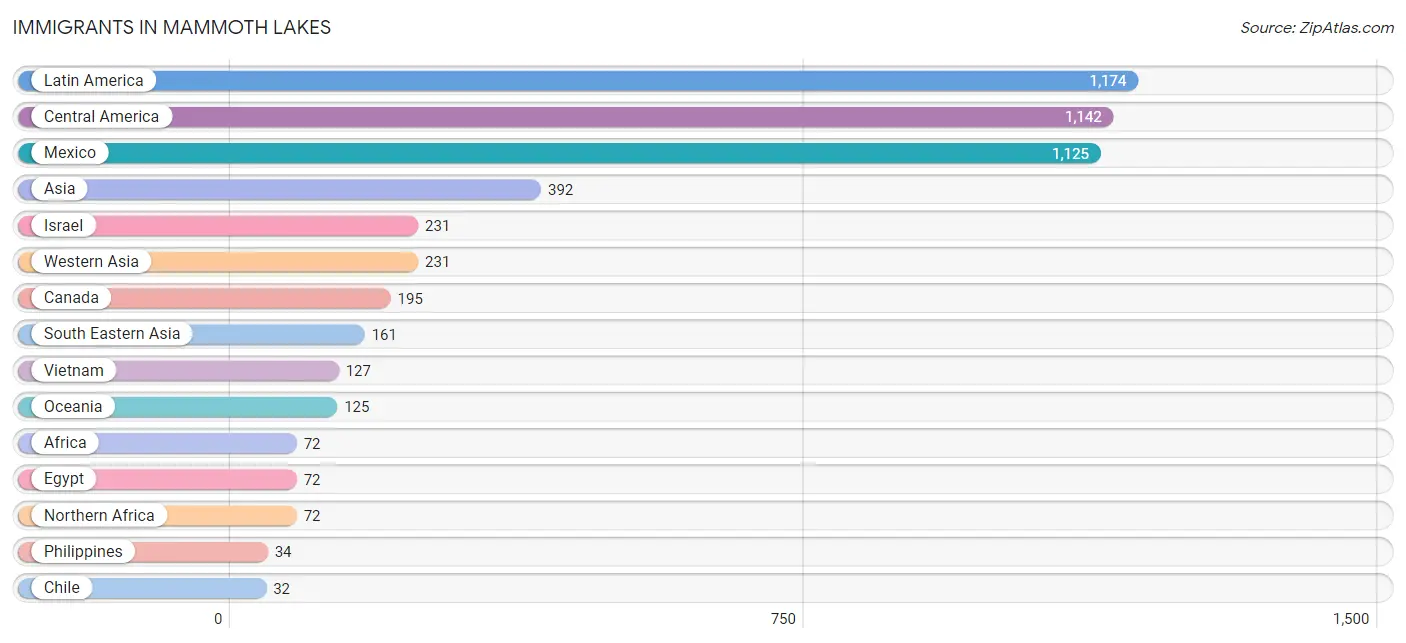
| Immigration Origin | # Population | % Population |
| Africa | 72 | 1.0% |
| Asia | 392 | 5.4% |
| Canada | 195 | 2.7% |
| Central America | 1,142 | 15.8% |
| Chile | 32 | 0.4% |
| Costa Rica | 17 | 0.2% |
| Egypt | 72 | 1.0% |
| Israel | 231 | 3.2% |
| Latin America | 1,174 | 16.2% |
| Mexico | 1,125 | 15.5% |
| Northern Africa | 72 | 1.0% |
| Oceania | 125 | 1.7% |
| Philippines | 34 | 0.5% |
| South America | 32 | 0.4% |
| South Eastern Asia | 161 | 2.2% |
| Vietnam | 127 | 1.8% |
| Western Asia | 231 | 3.2% | View All 17 Rows |
Sex and Age in Mammoth Lakes
Sex and Age in Mammoth Lakes
The most populous age groups in Mammoth Lakes are 10 to 14 Years (431 | 11.7%) for men and 15 to 19 Years (418 | 11.7%) for women.
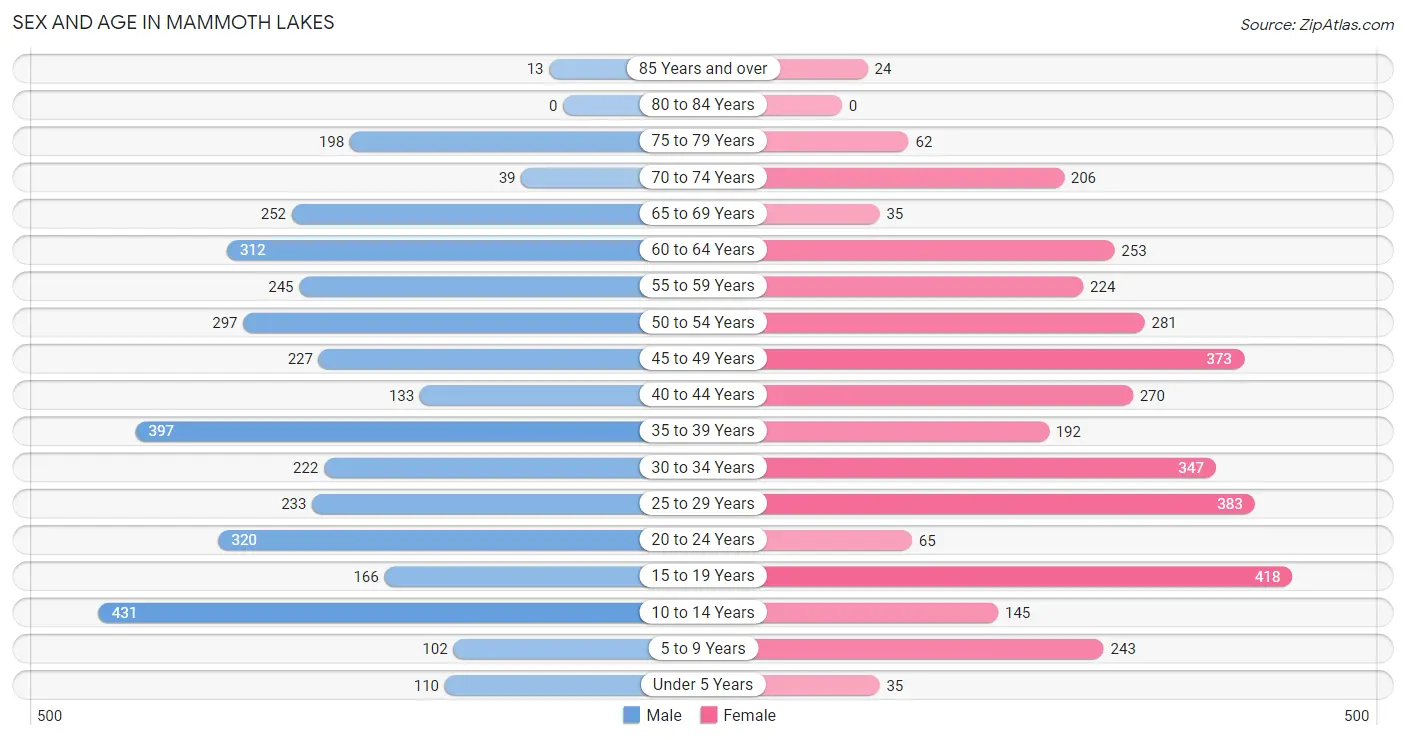
| Age Bracket | Male | Female |
| Under 5 Years | 110 (3.0%) | 35 (1.0%) |
| 5 to 9 Years | 102 (2.8%) | 243 (6.8%) |
| 10 to 14 Years | 431 (11.7%) | 145 (4.1%) |
| 15 to 19 Years | 166 (4.5%) | 418 (11.7%) |
| 20 to 24 Years | 320 (8.7%) | 65 (1.8%) |
| 25 to 29 Years | 233 (6.3%) | 383 (10.8%) |
| 30 to 34 Years | 222 (6.0%) | 347 (9.8%) |
| 35 to 39 Years | 397 (10.7%) | 192 (5.4%) |
| 40 to 44 Years | 133 (3.6%) | 270 (7.6%) |
| 45 to 49 Years | 227 (6.1%) | 373 (10.5%) |
| 50 to 54 Years | 297 (8.0%) | 281 (7.9%) |
| 55 to 59 Years | 245 (6.6%) | 224 (6.3%) |
| 60 to 64 Years | 312 (8.4%) | 253 (7.1%) |
| 65 to 69 Years | 252 (6.8%) | 35 (1.0%) |
| 70 to 74 Years | 39 (1.1%) | 206 (5.8%) |
| 75 to 79 Years | 198 (5.4%) | 62 (1.7%) |
| 80 to 84 Years | 0 (0.0%) | 0 (0.0%) |
| 85 Years and over | 13 (0.4%) | 24 (0.7%) |
| Total | 3,697 (100.0%) | 3,556 (100.0%) |
Families and Households in Mammoth Lakes
Median Family Size in Mammoth Lakes
The median family size in Mammoth Lakes is 3.19 persons per family, with single female/mother families (69 | 4.3%) accounting for the largest median family size of 3.65 persons per family. On the other hand, single male/father families (17 | 1.1%) represent the smallest median family size with 2.82 persons per family.
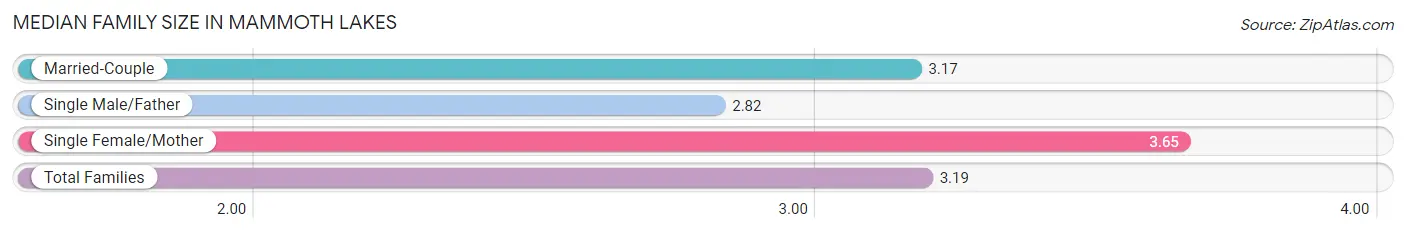
| Family Type | # Families | Family Size |
| Married-Couple | 1,504 (94.6%) | 3.17 |
| Single Male/Father | 17 (1.1%) | 2.82 |
| Single Female/Mother | 69 (4.3%) | 3.65 |
| Total Families | 1,590 (100.0%) | 3.19 |
Median Household Size in Mammoth Lakes
The median household size in Mammoth Lakes is 2.27 persons per household, with single female/mother households (69 | 2.2%) accounting for the largest median household size of 3.65 persons per household. non-family households (1,511 | 48.7%) represent the smallest median household size with 1.30 persons per household.
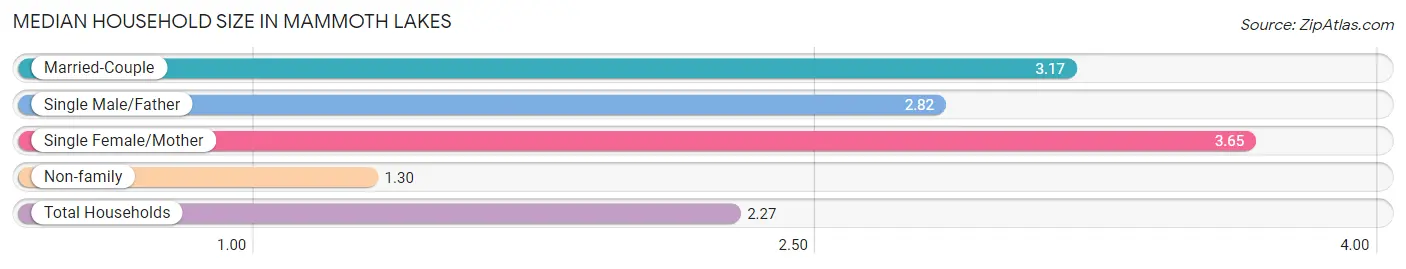
| Household Type | # Households | Household Size |
| Married-Couple | 1,504 (48.5%) | 3.17 |
| Single Male/Father | 17 (0.5%) | 2.82 |
| Single Female/Mother | 69 (2.2%) | 3.65 |
| Non-family | 1,511 (48.7%) | 1.30 |
| Total Households | 3,101 (100.0%) | 2.27 |
Household Size by Marriage Status in Mammoth Lakes
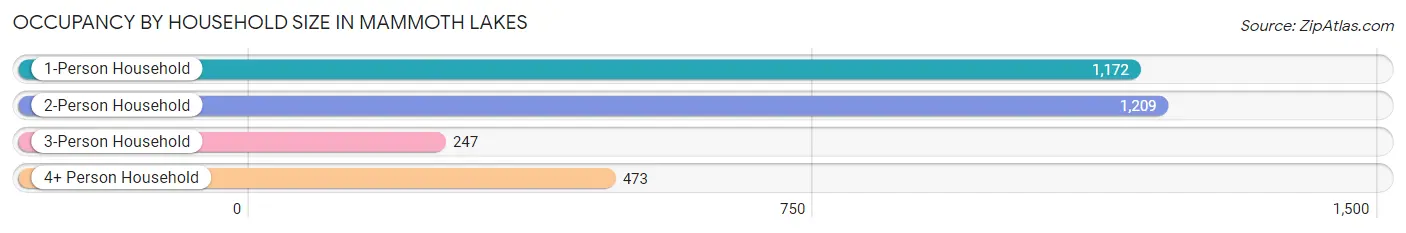
Out of a total of 3,101 households in Mammoth Lakes, 1,590 (51.3%) are family households, while 1,511 (48.7%) are nonfamily households. The most numerous type of family households are 2-person households, comprising 870, and the most common type of nonfamily households are 1-person households, comprising 1,172.
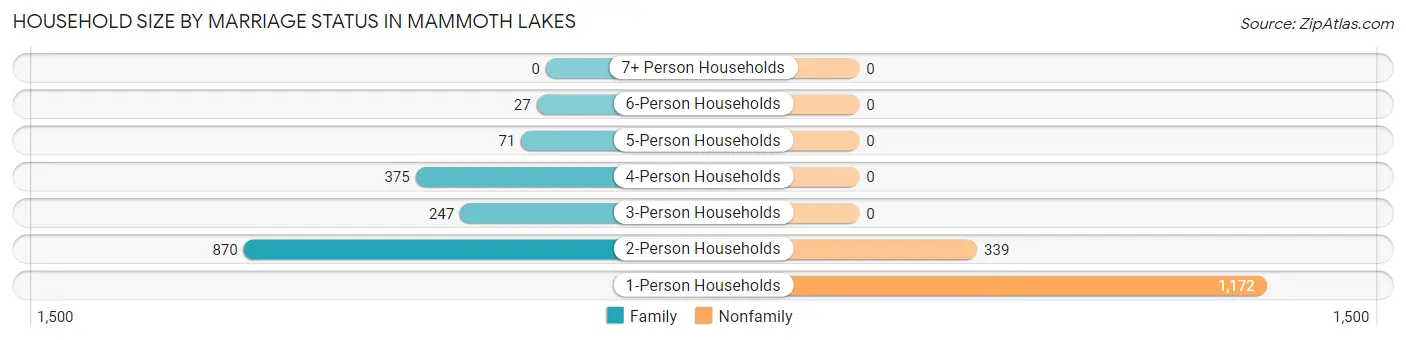
| Household Size | Family Households | Nonfamily Households |
| 1-Person Households | - | 1,172 (37.8%) |
| 2-Person Households | 870 (28.1%) | 339 (10.9%) |
| 3-Person Households | 247 (8.0%) | 0 (0.0%) |
| 4-Person Households | 375 (12.1%) | 0 (0.0%) |
| 5-Person Households | 71 (2.3%) | 0 (0.0%) |
| 6-Person Households | 27 (0.9%) | 0 (0.0%) |
| 7+ Person Households | 0 (0.0%) | 0 (0.0%) |
| Total | 1,590 (51.3%) | 1,511 (48.7%) |
Female Fertility in Mammoth Lakes
Fertility by Age in Mammoth Lakes
Average fertility rate in Mammoth Lakes is 18.0 births per 1,000 women. Women in the age bracket of 35 to 50 years have the highest fertility rate with 41.0 births per 1,000 women. Women in the age bracket of 35 to 50 years acount for 100.0% of all women with births.
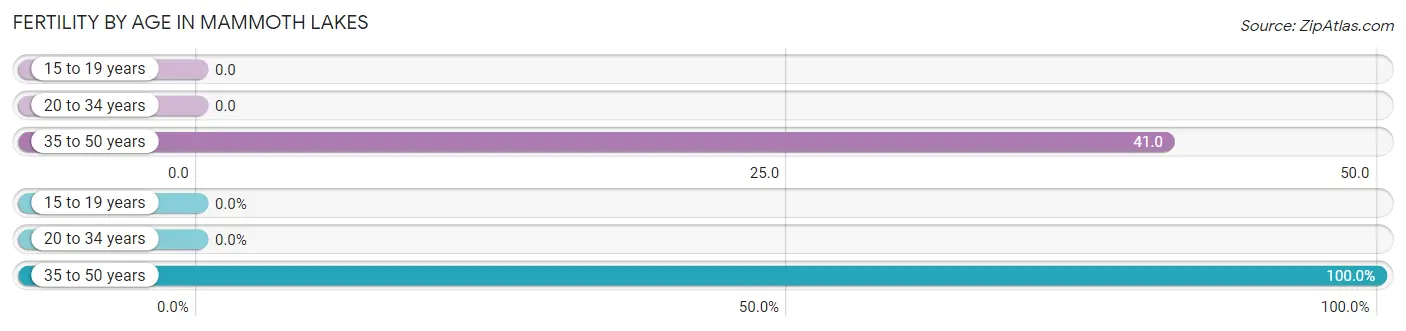
| Age Bracket | Women with Births | Births / 1,000 Women |
| 15 to 19 years | 0 (0.0%) | 0.0 |
| 20 to 34 years | 0 (0.0%) | 0.0 |
| 35 to 50 years | 38 (100.0%) | 41.0 |
| Total | 38 (100.0%) | 18.0 |
Fertility by Age by Marriage Status in Mammoth Lakes
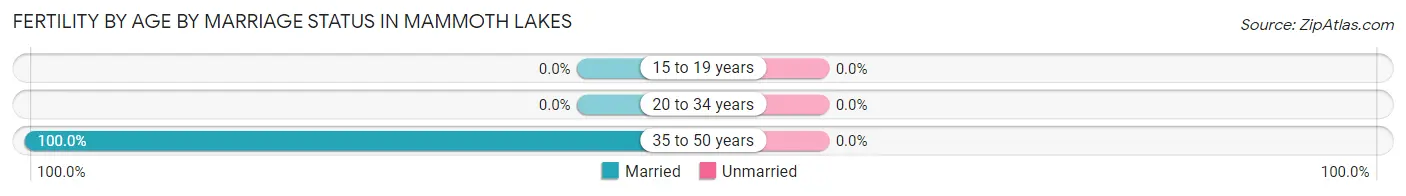
| Age Bracket | Married | Unmarried |
| 15 to 19 years | 0 (0.0%) | 0 (0.0%) |
| 20 to 34 years | 0 (0.0%) | 0 (0.0%) |
| 35 to 50 years | 38 (100.0%) | 0 (0.0%) |
| Total | 38 (100.0%) | 0 (0.0%) |
Fertility by Education in Mammoth Lakes
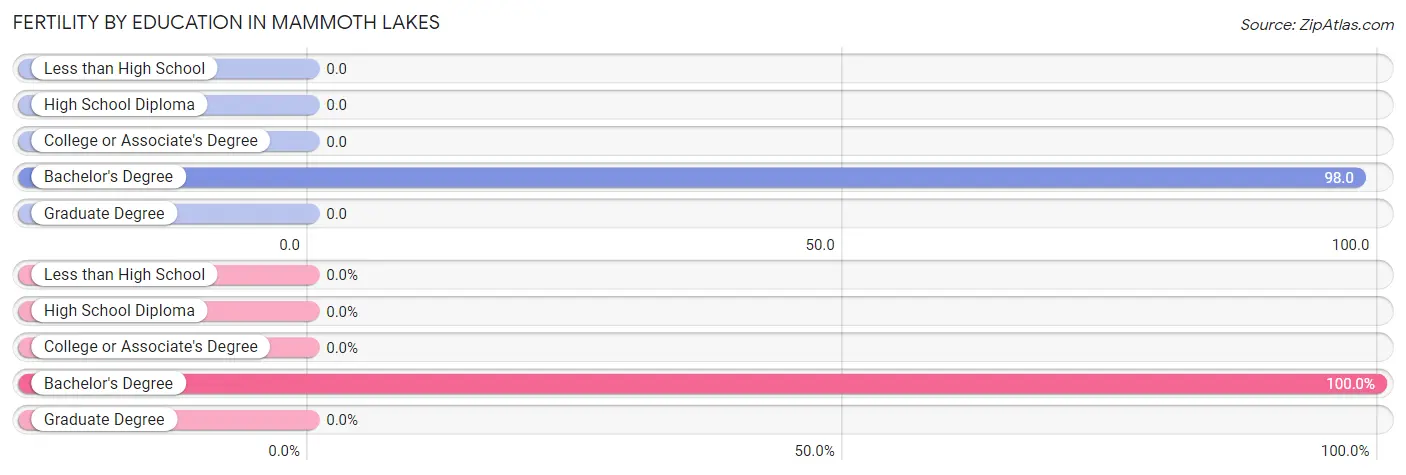
| Educational Attainment | Women with Births | Births / 1,000 Women |
| Less than High School | 0 (0.0%) | 0.0 |
| High School Diploma | 0 (0.0%) | 0.0 |
| College or Associate's Degree | 0 (0.0%) | 0.0 |
| Bachelor's Degree | 38 (100.0%) | 98.0 |
| Graduate Degree | 0 (0.0%) | 0.0 |
| Total | 38 (100.0%) | 18.0 |
Fertility by Education by Marriage Status in Mammoth Lakes
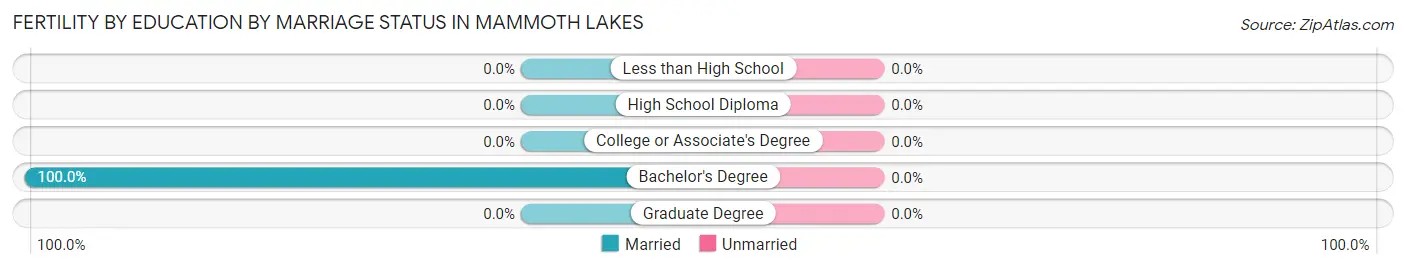
| Educational Attainment | Married | Unmarried |
| Less than High School | 0 (0.0%) | 0 (0.0%) |
| High School Diploma | 0 (0.0%) | 0 (0.0%) |
| College or Associate's Degree | 0 (0.0%) | 0 (0.0%) |
| Bachelor's Degree | 38 (100.0%) | 0 (0.0%) |
| Graduate Degree | 0 (0.0%) | 0 (0.0%) |
| Total | 38 (100.0%) | 0 (0.0%) |
Employment Characteristics in Mammoth Lakes
Employment by Class of Employer in Mammoth Lakes
Among the 4,430 employed individuals in Mammoth Lakes, private company employees (2,917 | 65.8%), self-employed (not incorporated) (751 | 17.0%), and local government employees (361 | 8.2%) make up the most common classes of employment.
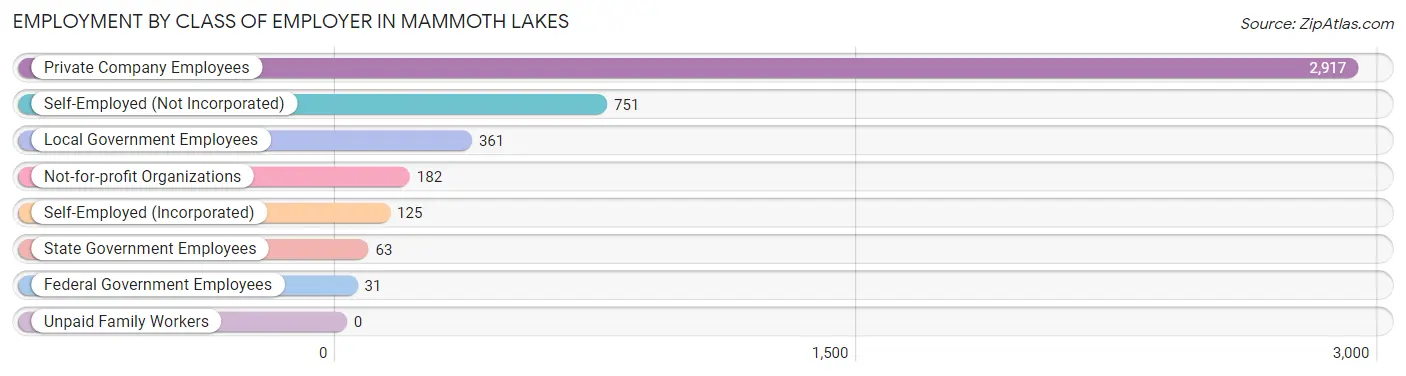
| Employer Class | # Employees | % Employees |
| Private Company Employees | 2,917 | 65.8% |
| Self-Employed (Incorporated) | 125 | 2.8% |
| Self-Employed (Not Incorporated) | 751 | 17.0% |
| Not-for-profit Organizations | 182 | 4.1% |
| Local Government Employees | 361 | 8.2% |
| State Government Employees | 63 | 1.4% |
| Federal Government Employees | 31 | 0.7% |
| Unpaid Family Workers | 0 | 0.0% |
| Total | 4,430 | 100.0% |
Employment Status by Age in Mammoth Lakes
According to the labor force statistics for Mammoth Lakes, out of the total population over 16 years of age (5,920), 75.7% or 4,481 individuals are in the labor force, with 1.2% or 54 of them unemployed. The age group with the highest labor force participation rate is 30 to 34 years, with 100.0% or 569 individuals in the labor force. Within the labor force, the 35 to 44 years age range has the highest percentage of unemployed individuals, with 5.6% or 52 of them being unemployed.
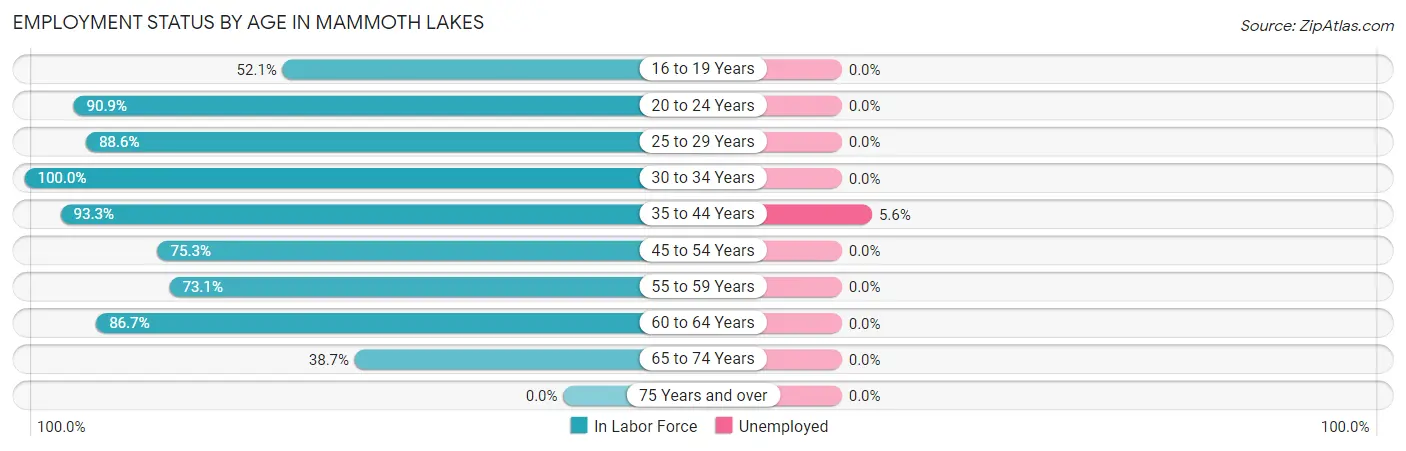
| Age Bracket | In Labor Force | Unemployed |
| 16 to 19 Years | 165 (52.1%) | 0 (0.0%) |
| 20 to 24 Years | 350 (90.9%) | 0 (0.0%) |
| 25 to 29 Years | 546 (88.6%) | 0 (0.0%) |
| 30 to 34 Years | 569 (100.0%) | 0 (0.0%) |
| 35 to 44 Years | 926 (93.3%) | 52 (5.6%) |
| 45 to 54 Years | 887 (75.3%) | 0 (0.0%) |
| 55 to 59 Years | 343 (73.1%) | 0 (0.0%) |
| 60 to 64 Years | 490 (86.7%) | 0 (0.0%) |
| 65 to 74 Years | 206 (38.7%) | 0 (0.0%) |
| 75 Years and over | 0 (0.0%) | 0 (0.0%) |
| Total | 4,481 (75.7%) | 54 (1.2%) |
Employment Status by Educational Attainment in Mammoth Lakes
According to labor force statistics for Mammoth Lakes, 85.7% of individuals (3,761) out of the total population between 25 and 64 years of age (4,389) are in the labor force, with 1.4% or 53 of them being unemployed. The group with the highest labor force participation rate are those with the educational attainment of bachelor's degree or higher, with 93.7% or 865 individuals in the labor force. Within the labor force, individuals with high school diploma education have the highest percentage of unemployment, with 5.7% or 52 of them being unemployed.
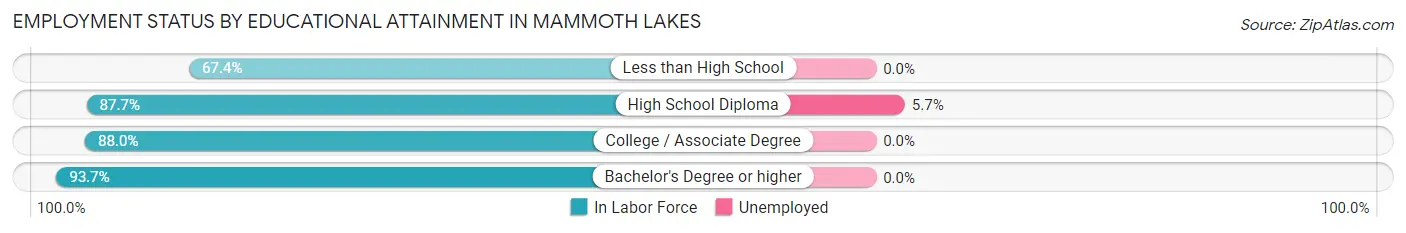
| Educational Attainment | In Labor Force | Unemployed |
| Less than High School | 496 (67.4%) | 0 (0.0%) |
| High School Diploma | 915 (87.7%) | 59 (5.7%) |
| College / Associate Degree | 1,485 (88.0%) | 0 (0.0%) |
| Bachelor's Degree or higher | 865 (93.7%) | 0 (0.0%) |
| Total | 3,761 (85.7%) | 61 (1.4%) |
Employment Occupations by Sex in Mammoth Lakes
Management, Business, Science and Arts Occupations
The most common Management, Business, Science and Arts occupations in Mammoth Lakes are Management (1,057 | 23.9%), Community & Social Service (331 | 7.5%), Education Instruction & Library (276 | 6.2%), Health Diagnosing & Treating (194 | 4.4%), and Business & Financial (168 | 3.8%).
Management, Business, Science and Arts Occupations by Sex
Within the Management, Business, Science and Arts occupations in Mammoth Lakes, the most male-oriented occupations are Architecture & Engineering (100.0%), Management (63.3%), and Health Diagnosing & Treating (62.4%), while the most female-oriented occupations are Life, Physical & Social Science (100.0%), Education Instruction & Library (85.5%), and Community & Social Service (79.5%).
| Occupation | Male | Female |
| Management | 669 (63.3%) | 388 (36.7%) |
| Business & Financial | 86 (51.2%) | 82 (48.8%) |
| Computers, Engineering & Science | 29 (26.1%) | 82 (73.9%) |
| Computers & Mathematics | 0 (0.0%) | 0 (0.0%) |
| Architecture & Engineering | 29 (100.0%) | 0 (0.0%) |
| Life, Physical & Social Science | 0 (0.0%) | 82 (100.0%) |
| Community & Social Service | 68 (20.5%) | 263 (79.5%) |
| Education, Arts & Media | 0 (0.0%) | 0 (0.0%) |
| Legal Services & Support | 0 (0.0%) | 0 (0.0%) |
| Education Instruction & Library | 40 (14.5%) | 236 (85.5%) |
| Arts, Media & Entertainment | 28 (50.9%) | 27 (49.1%) |
| Health Diagnosing & Treating | 121 (62.4%) | 73 (37.6%) |
| Health Technologists | 20 (21.5%) | 73 (78.5%) |
| Total (Category) | 973 (52.3%) | 888 (47.7%) |
| Total (Overall) | 2,327 (52.5%) | 2,103 (47.5%) |
Services Occupations
The most common Services occupations in Mammoth Lakes are Cleaning & Maintenance (557 | 12.6%), Food Preparation & Serving (322 | 7.3%), Healthcare Support (136 | 3.1%), Security & Protection (131 | 3.0%), and Firefighting & Prevention (131 | 3.0%).
Services Occupations by Sex
Within the Services occupations in Mammoth Lakes, the most male-oriented occupations are Personal Care & Service (100.0%), Food Preparation & Serving (75.8%), and Cleaning & Maintenance (32.0%), while the most female-oriented occupations are Healthcare Support (100.0%), Security & Protection (100.0%), and Firefighting & Prevention (100.0%).
| Occupation | Male | Female |
| Healthcare Support | 0 (0.0%) | 136 (100.0%) |
| Security & Protection | 0 (0.0%) | 131 (100.0%) |
| Firefighting & Prevention | 0 (0.0%) | 131 (100.0%) |
| Law Enforcement | 0 (0.0%) | 0 (0.0%) |
| Food Preparation & Serving | 244 (75.8%) | 78 (24.2%) |
| Cleaning & Maintenance | 178 (32.0%) | 379 (68.0%) |
| Personal Care & Service | 57 (100.0%) | 0 (0.0%) |
| Total (Category) | 479 (39.8%) | 724 (60.2%) |
| Total (Overall) | 2,327 (52.5%) | 2,103 (47.5%) |
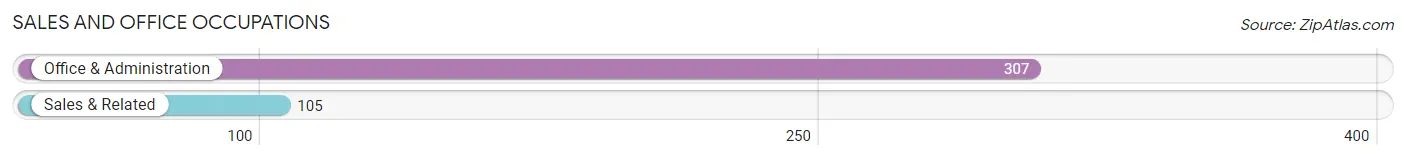
Sales and Office Occupations
The most common Sales and Office occupations in Mammoth Lakes are Office & Administration (307 | 6.9%), and Sales & Related (105 | 2.4%).
Sales and Office Occupations by Sex
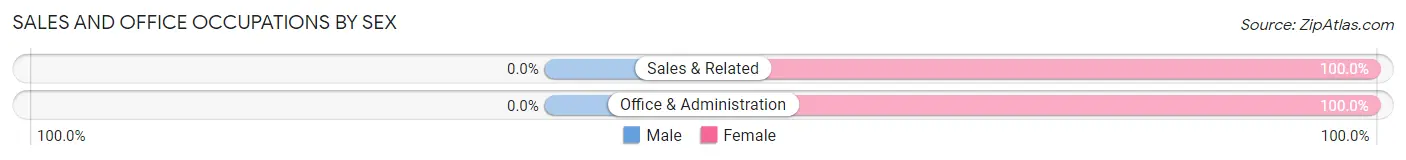
| Occupation | Male | Female |
| Sales & Related | 0 (0.0%) | 105 (100.0%) |
| Office & Administration | 0 (0.0%) | 307 (100.0%) |
| Total (Category) | 0 (0.0%) | 412 (100.0%) |
| Total (Overall) | 2,327 (52.5%) | 2,103 (47.5%) |
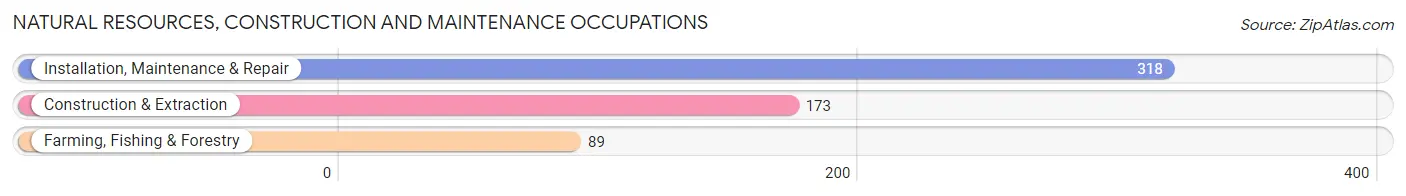
Natural Resources, Construction and Maintenance Occupations
The most common Natural Resources, Construction and Maintenance occupations in Mammoth Lakes are Installation, Maintenance & Repair (318 | 7.2%), Construction & Extraction (173 | 3.9%), and Farming, Fishing & Forestry (89 | 2.0%).
Natural Resources, Construction and Maintenance Occupations by Sex
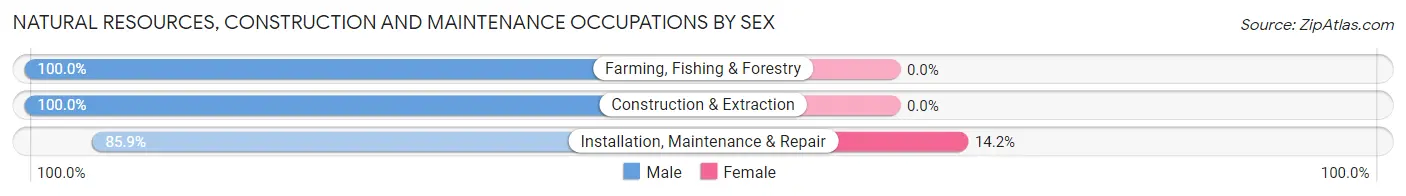
| Occupation | Male | Female |
| Farming, Fishing & Forestry | 89 (100.0%) | 0 (0.0%) |
| Construction & Extraction | 173 (100.0%) | 0 (0.0%) |
| Installation, Maintenance & Repair | 273 (85.9%) | 45 (14.1%) |
| Total (Category) | 535 (92.2%) | 45 (7.8%) |
| Total (Overall) | 2,327 (52.5%) | 2,103 (47.5%) |
Production, Transportation and Moving Occupations
The most common Production, Transportation and Moving occupations in Mammoth Lakes are Production (340 | 7.7%), and Material Moving (34 | 0.8%).
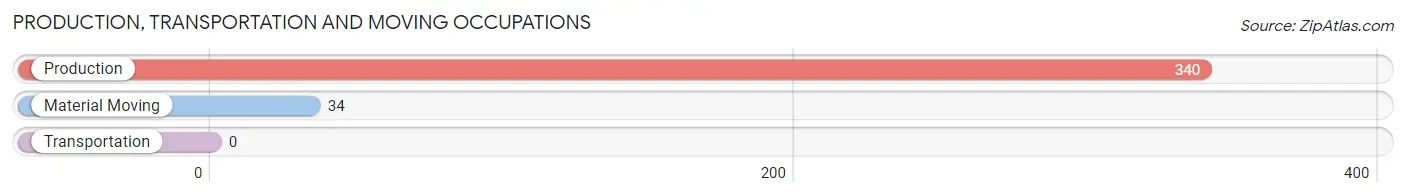
Production, Transportation and Moving Occupations by Sex
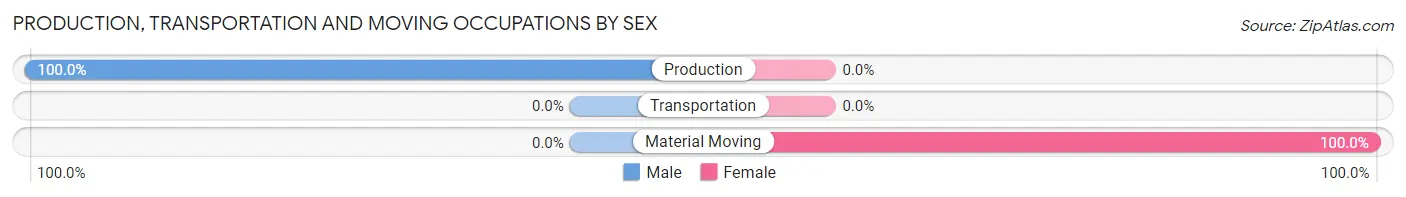
| Occupation | Male | Female |
| Production | 340 (100.0%) | 0 (0.0%) |
| Transportation | 0 (0.0%) | 0 (0.0%) |
| Material Moving | 0 (0.0%) | 34 (100.0%) |
| Total (Category) | 340 (90.9%) | 34 (9.1%) |
| Total (Overall) | 2,327 (52.5%) | 2,103 (47.5%) |
Employment Industries by Sex in Mammoth Lakes
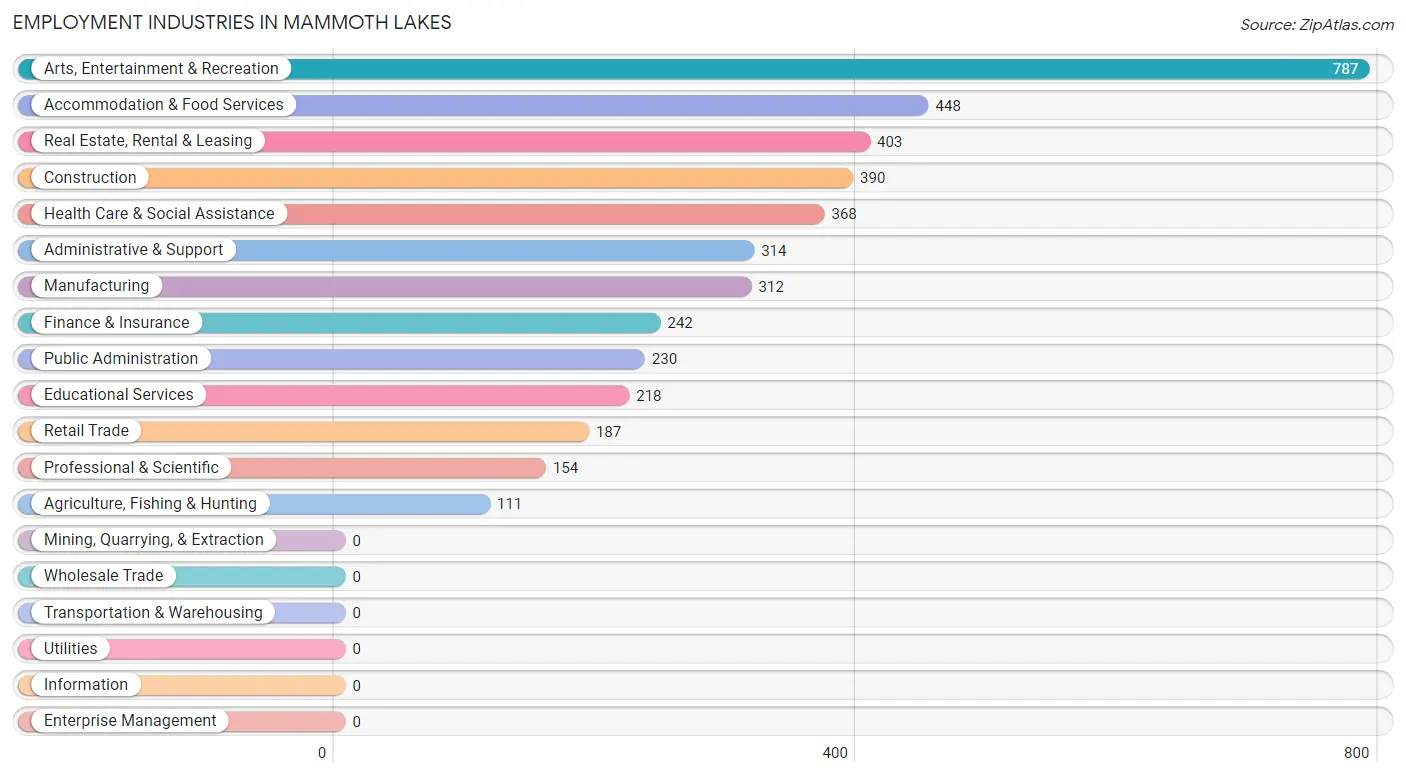
Employment Industries in Mammoth Lakes
The major employment industries in Mammoth Lakes include Arts, Entertainment & Recreation (787 | 17.8%), Accommodation & Food Services (448 | 10.1%), Real Estate, Rental & Leasing (403 | 9.1%), Construction (390 | 8.8%), and Health Care & Social Assistance (368 | 8.3%).
Employment Industries by Sex in Mammoth Lakes
The Mammoth Lakes industries that see more men than women are Manufacturing (100.0%), Construction (88.7%), and Finance & Insurance (86.0%), whereas the industries that tend to have a higher number of women are Public Administration (87.8%), Health Care & Social Assistance (82.6%), and Educational Services (81.7%).
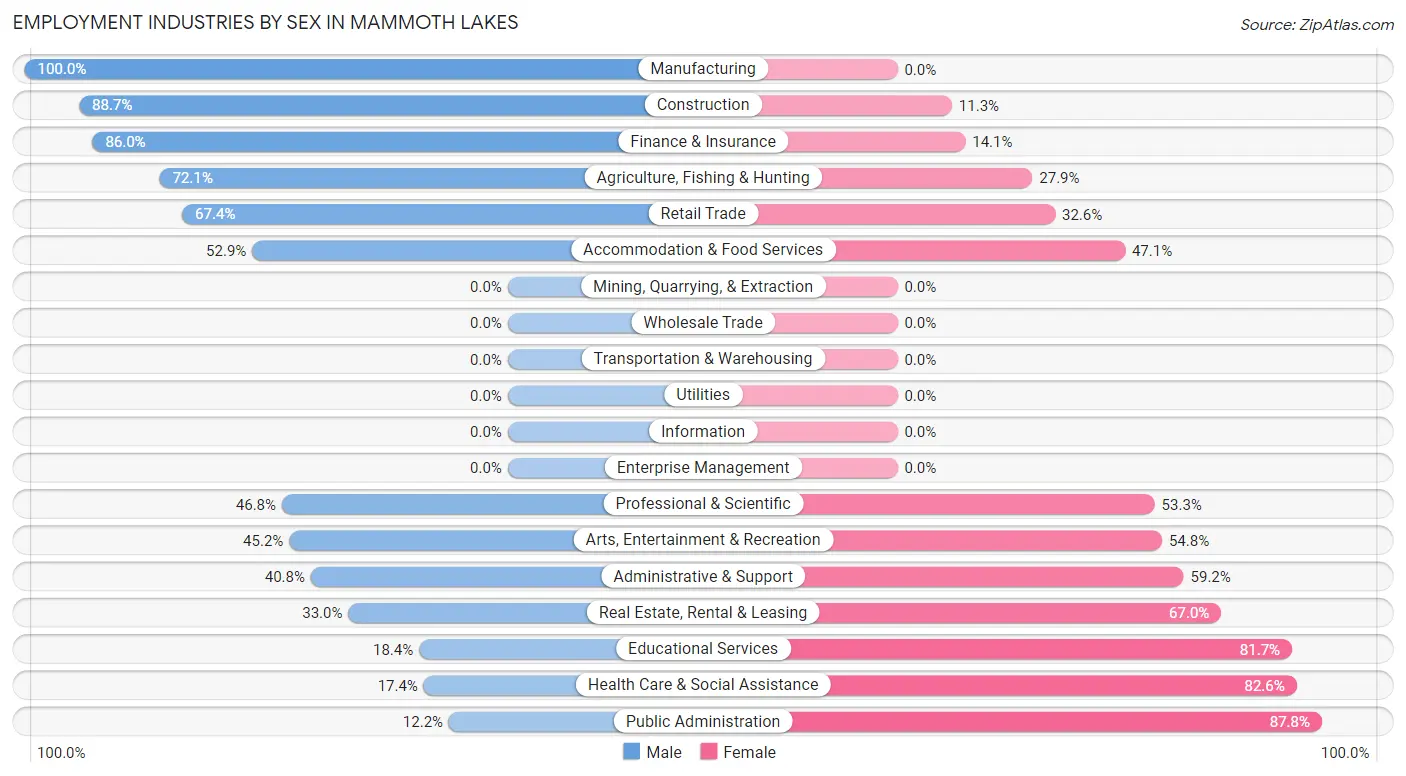
| Industry | Male | Female |
| Agriculture, Fishing & Hunting | 80 (72.1%) | 31 (27.9%) |
| Mining, Quarrying, & Extraction | 0 (0.0%) | 0 (0.0%) |
| Construction | 346 (88.7%) | 44 (11.3%) |
| Manufacturing | 312 (100.0%) | 0 (0.0%) |
| Wholesale Trade | 0 (0.0%) | 0 (0.0%) |
| Retail Trade | 126 (67.4%) | 61 (32.6%) |
| Transportation & Warehousing | 0 (0.0%) | 0 (0.0%) |
| Utilities | 0 (0.0%) | 0 (0.0%) |
| Information | 0 (0.0%) | 0 (0.0%) |
| Finance & Insurance | 208 (86.0%) | 34 (14.1%) |
| Real Estate, Rental & Leasing | 133 (33.0%) | 270 (67.0%) |
| Professional & Scientific | 72 (46.8%) | 82 (53.2%) |
| Enterprise Management | 0 (0.0%) | 0 (0.0%) |
| Administrative & Support | 128 (40.8%) | 186 (59.2%) |
| Educational Services | 40 (18.3%) | 178 (81.7%) |
| Health Care & Social Assistance | 64 (17.4%) | 304 (82.6%) |
| Arts, Entertainment & Recreation | 356 (45.2%) | 431 (54.8%) |
| Accommodation & Food Services | 237 (52.9%) | 211 (47.1%) |
| Public Administration | 28 (12.2%) | 202 (87.8%) |
| Total | 2,327 (52.5%) | 2,103 (47.5%) |
Education in Mammoth Lakes
School Enrollment in Mammoth Lakes
The most common levels of schooling among the 1,510 students in Mammoth Lakes are high school (507 | 33.6%), middle school (422 | 28.0%), and college / undergraduate (241 | 16.0%).
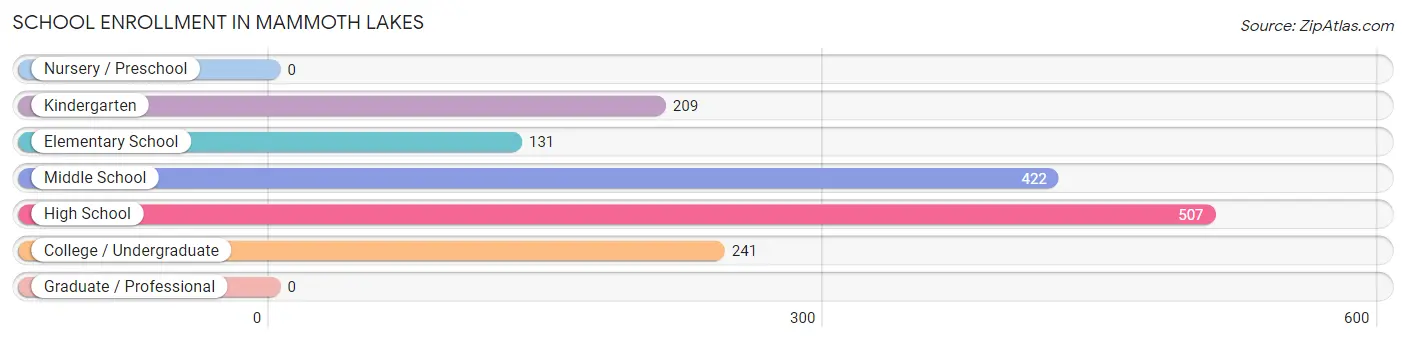
| School Level | # Students | % Students |
| Nursery / Preschool | 0 | 0.0% |
| Kindergarten | 209 | 13.8% |
| Elementary School | 131 | 8.7% |
| Middle School | 422 | 28.0% |
| High School | 507 | 33.6% |
| College / Undergraduate | 241 | 16.0% |
| Graduate / Professional | 0 | 0.0% |
| Total | 1,510 | 100.0% |
School Enrollment by Age by Funding Source in Mammoth Lakes
Out of a total of 1,510 students who are enrolled in schools in Mammoth Lakes, 62 (4.1%) attend a private institution, while the remaining 1,448 (95.9%) are enrolled in public schools. The age group of 5 to 9 year old has the highest likelihood of being enrolled in private schools, with 21 (7.6% in the age bracket) enrolled. Conversely, the age group of 15 to 17 year olds has the lowest likelihood of being enrolled in a private school, with 416 (100.0% in the age bracket) attending a public institution.
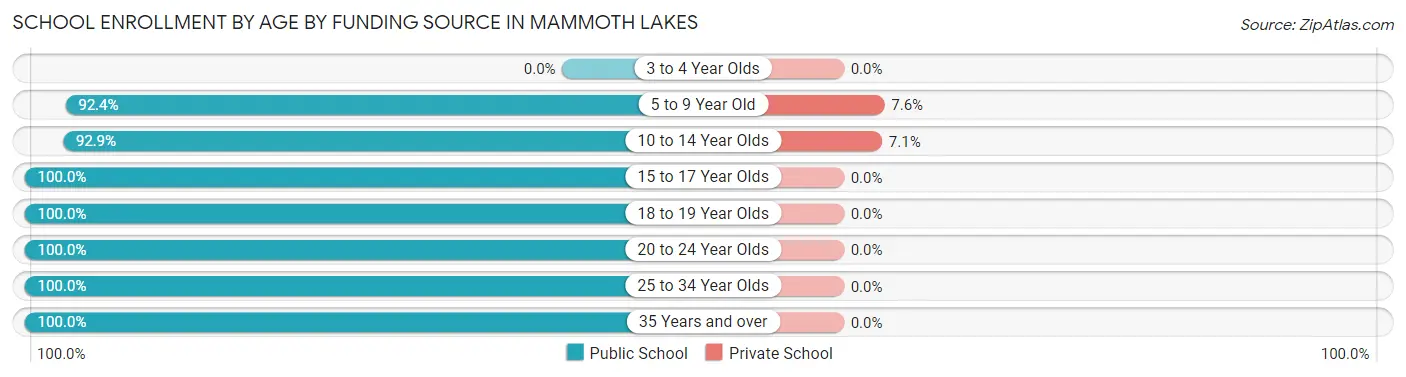
| Age Bracket | Public School | Private School |
| 3 to 4 Year Olds | 0 (0.0%) | 0 (0.0%) |
| 5 to 9 Year Old | 256 (92.4%) | 21 (7.6%) |
| 10 to 14 Year Olds | 535 (92.9%) | 41 (7.1%) |
| 15 to 17 Year Olds | 416 (100.0%) | 0 (0.0%) |
| 18 to 19 Year Olds | 134 (100.0%) | 0 (0.0%) |
| 20 to 24 Year Olds | 17 (100.0%) | 0 (0.0%) |
| 25 to 34 Year Olds | 62 (100.0%) | 0 (0.0%) |
| 35 Years and over | 28 (100.0%) | 0 (0.0%) |
| Total | 1,448 (95.9%) | 62 (4.1%) |
Educational Attainment by Field of Study in Mammoth Lakes
Social sciences (312 | 21.0%), business (237 | 16.0%), liberal arts & history (235 | 15.9%), computers & mathematics (226 | 15.2%), and engineering (125 | 8.4%) are the most common fields of study among 1,483 individuals in Mammoth Lakes who have obtained a bachelor's degree or higher.
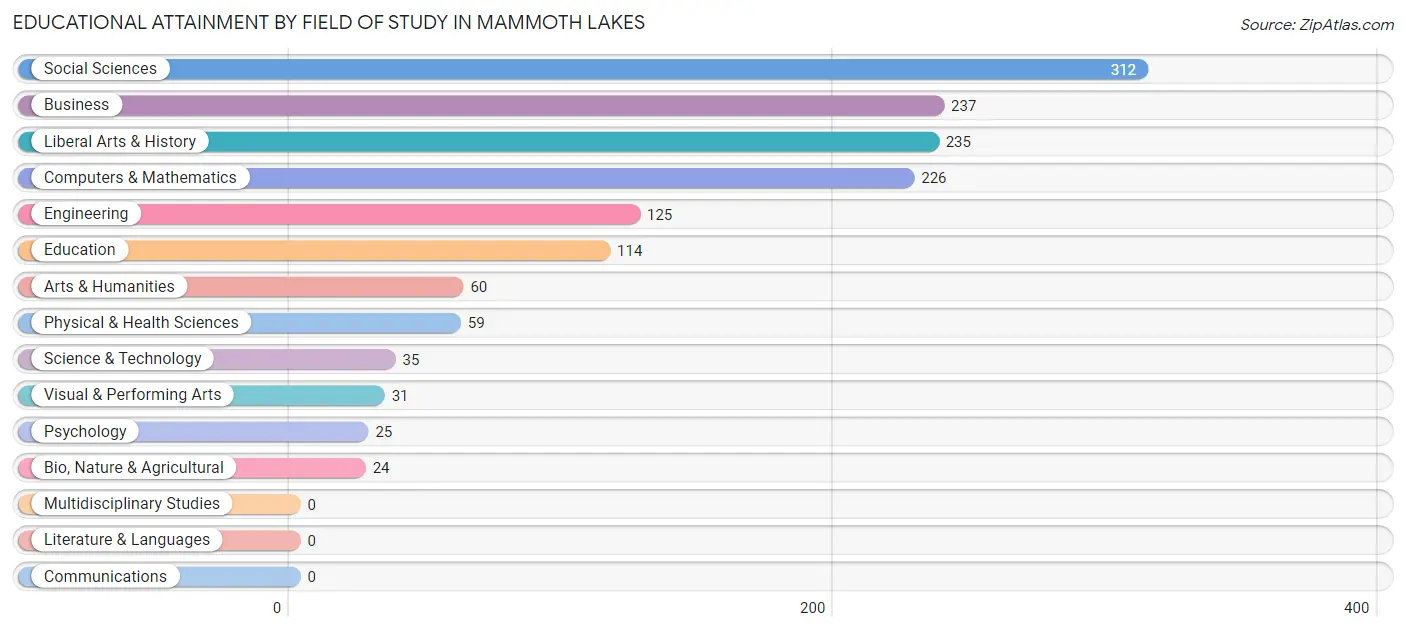
| Field of Study | # Graduates | % Graduates |
| Computers & Mathematics | 226 | 15.2% |
| Bio, Nature & Agricultural | 24 | 1.6% |
| Physical & Health Sciences | 59 | 4.0% |
| Psychology | 25 | 1.7% |
| Social Sciences | 312 | 21.0% |
| Engineering | 125 | 8.4% |
| Multidisciplinary Studies | 0 | 0.0% |
| Science & Technology | 35 | 2.4% |
| Business | 237 | 16.0% |
| Education | 114 | 7.7% |
| Literature & Languages | 0 | 0.0% |
| Liberal Arts & History | 235 | 15.9% |
| Visual & Performing Arts | 31 | 2.1% |
| Communications | 0 | 0.0% |
| Arts & Humanities | 60 | 4.1% |
| Total | 1,483 | 100.0% |
Transportation & Commute in Mammoth Lakes
Vehicle Availability by Sex in Mammoth Lakes
The most prevalent vehicle ownership categories in Mammoth Lakes are males with 2 vehicles (778, accounting for 34.8%) and females with 2 vehicles (746, making up 37.6%).
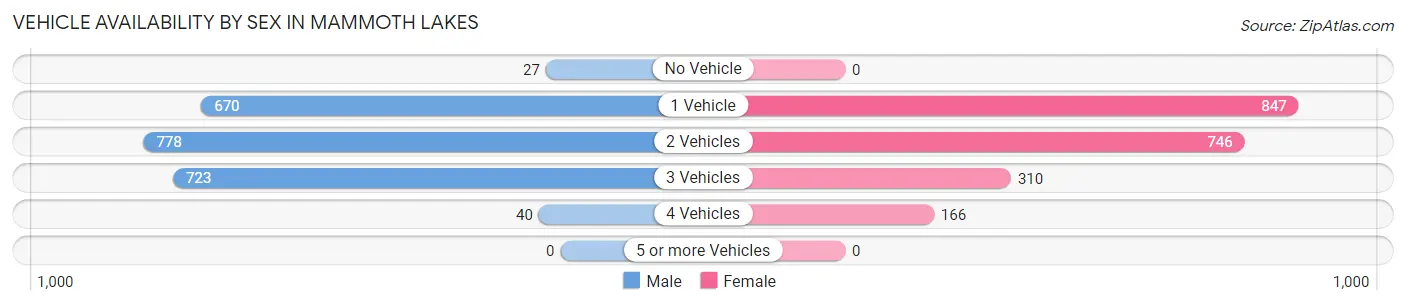
| Vehicles Available | Male | Female |
| No Vehicle | 27 (1.2%) | 0 (0.0%) |
| 1 Vehicle | 670 (29.9%) | 847 (40.9%) |
| 2 Vehicles | 778 (34.8%) | 746 (36.1%) |
| 3 Vehicles | 723 (32.3%) | 310 (15.0%) |
| 4 Vehicles | 40 (1.8%) | 166 (8.0%) |
| 5 or more Vehicles | 0 (0.0%) | 0 (0.0%) |
| Total | 2,238 (100.0%) | 2,069 (100.0%) |
Commute Time in Mammoth Lakes
The most frequently occuring commute durations in Mammoth Lakes are 5 to 9 minutes (1,368 commuters, 34.6%), 10 to 14 minutes (694 commuters, 17.5%), and 15 to 19 minutes (623 commuters, 15.8%).
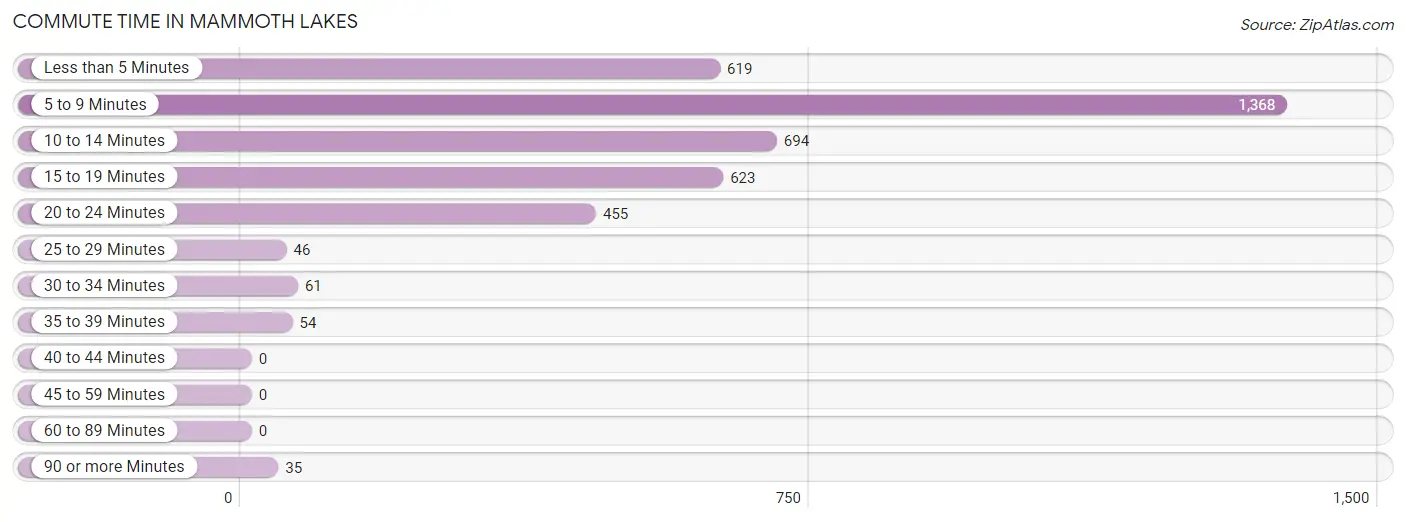
| Commute Time | # Commuters | % Commuters |
| Less than 5 Minutes | 619 | 15.7% |
| 5 to 9 Minutes | 1,368 | 34.6% |
| 10 to 14 Minutes | 694 | 17.5% |
| 15 to 19 Minutes | 623 | 15.8% |
| 20 to 24 Minutes | 455 | 11.5% |
| 25 to 29 Minutes | 46 | 1.2% |
| 30 to 34 Minutes | 61 | 1.5% |
| 35 to 39 Minutes | 54 | 1.4% |
| 40 to 44 Minutes | 0 | 0.0% |
| 45 to 59 Minutes | 0 | 0.0% |
| 60 to 89 Minutes | 0 | 0.0% |
| 90 or more Minutes | 35 | 0.9% |
Commute Time by Sex in Mammoth Lakes
The most common commute times in Mammoth Lakes are 5 to 9 minutes (730 commuters, 38.0%) for males and 5 to 9 minutes (638 commuters, 31.4%) for females.
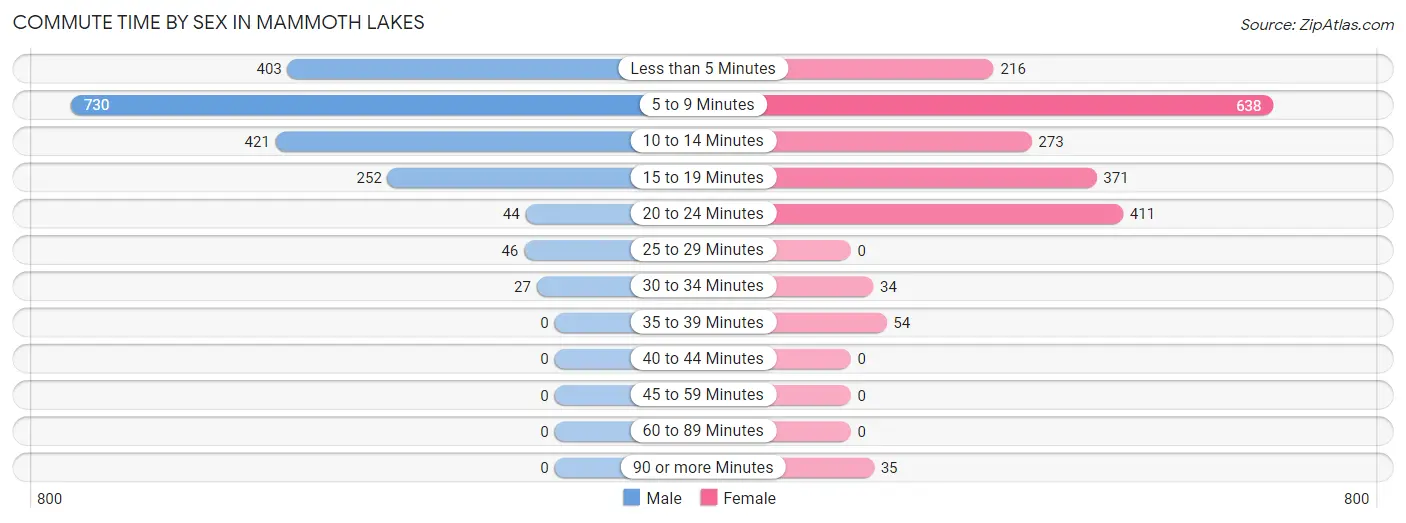
| Commute Time | Male | Female |
| Less than 5 Minutes | 403 (21.0%) | 216 (10.6%) |
| 5 to 9 Minutes | 730 (38.0%) | 638 (31.4%) |
| 10 to 14 Minutes | 421 (21.9%) | 273 (13.4%) |
| 15 to 19 Minutes | 252 (13.1%) | 371 (18.3%) |
| 20 to 24 Minutes | 44 (2.3%) | 411 (20.2%) |
| 25 to 29 Minutes | 46 (2.4%) | 0 (0.0%) |
| 30 to 34 Minutes | 27 (1.4%) | 34 (1.7%) |
| 35 to 39 Minutes | 0 (0.0%) | 54 (2.7%) |
| 40 to 44 Minutes | 0 (0.0%) | 0 (0.0%) |
| 45 to 59 Minutes | 0 (0.0%) | 0 (0.0%) |
| 60 to 89 Minutes | 0 (0.0%) | 0 (0.0%) |
| 90 or more Minutes | 0 (0.0%) | 35 (1.7%) |
Time of Departure to Work by Sex in Mammoth Lakes
The most frequent times of departure to work in Mammoth Lakes are 7:30 AM to 7:59 AM (423, 22.0%) for males and 7:30 AM to 7:59 AM (715, 35.2%) for females.
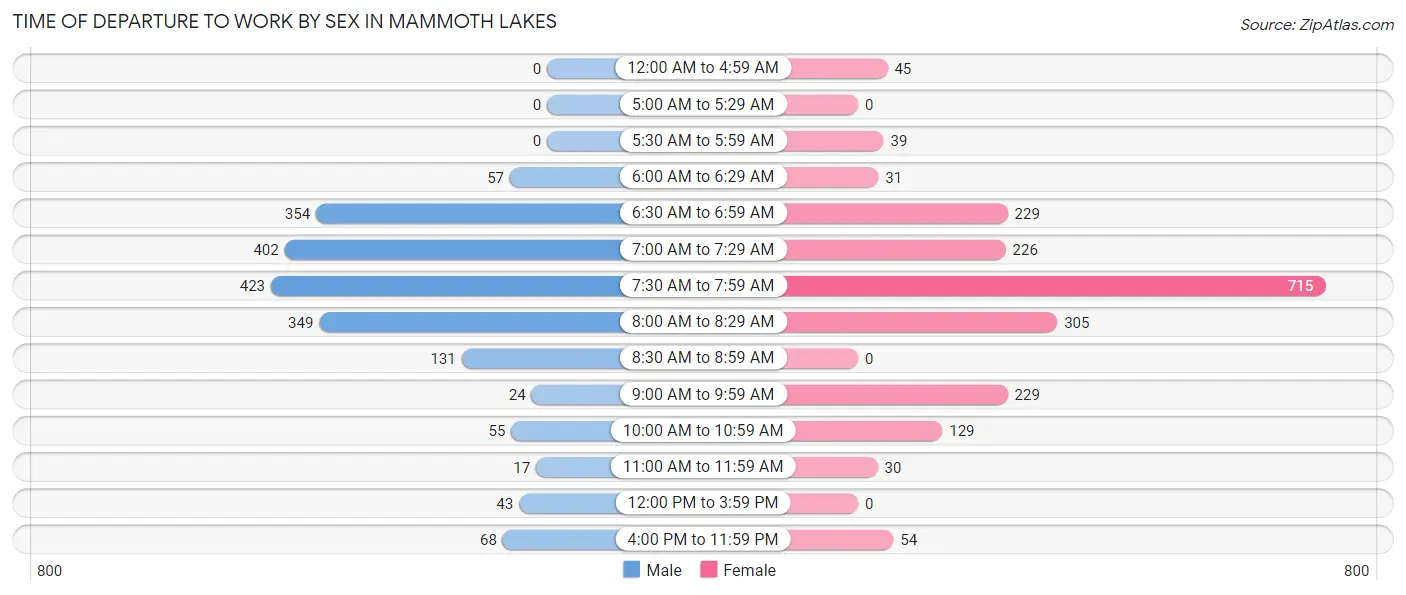
| Time of Departure | Male | Female |
| 12:00 AM to 4:59 AM | 0 (0.0%) | 45 (2.2%) |
| 5:00 AM to 5:29 AM | 0 (0.0%) | 0 (0.0%) |
| 5:30 AM to 5:59 AM | 0 (0.0%) | 39 (1.9%) |
| 6:00 AM to 6:29 AM | 57 (3.0%) | 31 (1.5%) |
| 6:30 AM to 6:59 AM | 354 (18.4%) | 229 (11.3%) |
| 7:00 AM to 7:29 AM | 402 (20.9%) | 226 (11.1%) |
| 7:30 AM to 7:59 AM | 423 (22.0%) | 715 (35.2%) |
| 8:00 AM to 8:29 AM | 349 (18.1%) | 305 (15.0%) |
| 8:30 AM to 8:59 AM | 131 (6.8%) | 0 (0.0%) |
| 9:00 AM to 9:59 AM | 24 (1.3%) | 229 (11.3%) |
| 10:00 AM to 10:59 AM | 55 (2.9%) | 129 (6.4%) |
| 11:00 AM to 11:59 AM | 17 (0.9%) | 30 (1.5%) |
| 12:00 PM to 3:59 PM | 43 (2.2%) | 0 (0.0%) |
| 4:00 PM to 11:59 PM | 68 (3.5%) | 54 (2.7%) |
| Total | 1,923 (100.0%) | 2,032 (100.0%) |
Housing Occupancy in Mammoth Lakes
Occupancy by Ownership in Mammoth Lakes
Of the total 3,101 dwellings in Mammoth Lakes, owner-occupied units account for 1,850 (59.7%), while renter-occupied units make up 1,251 (40.3%).
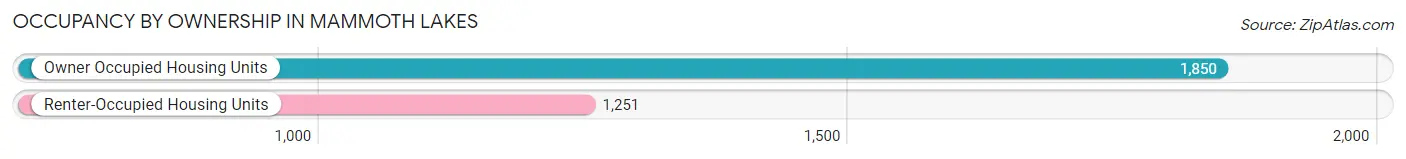
| Occupancy | # Housing Units | % Housing Units |
| Owner Occupied Housing Units | 1,850 | 59.7% |
| Renter-Occupied Housing Units | 1,251 | 40.3% |
| Total Occupied Housing Units | 3,101 | 100.0% |
Occupancy by Household Size in Mammoth Lakes
| Household Size | # Housing Units | % Housing Units |
| 1-Person Household | 1,172 | 37.8% |
| 2-Person Household | 1,209 | 39.0% |
| 3-Person Household | 247 | 8.0% |
| 4+ Person Household | 473 | 15.2% |
| Total Housing Units | 3,101 | 100.0% |
Occupancy by Ownership by Household Size in Mammoth Lakes
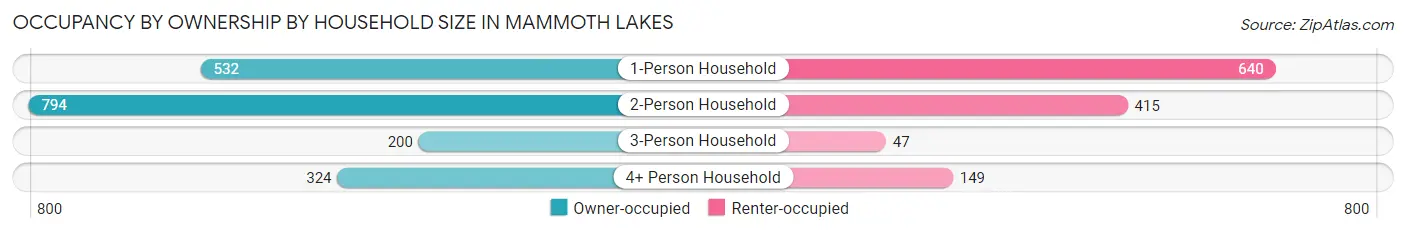
| Household Size | Owner-occupied | Renter-occupied |
| 1-Person Household | 532 (45.4%) | 640 (54.6%) |
| 2-Person Household | 794 (65.7%) | 415 (34.3%) |
| 3-Person Household | 200 (81.0%) | 47 (19.0%) |
| 4+ Person Household | 324 (68.5%) | 149 (31.5%) |
| Total Housing Units | 1,850 (59.7%) | 1,251 (40.3%) |
Occupancy by Educational Attainment in Mammoth Lakes
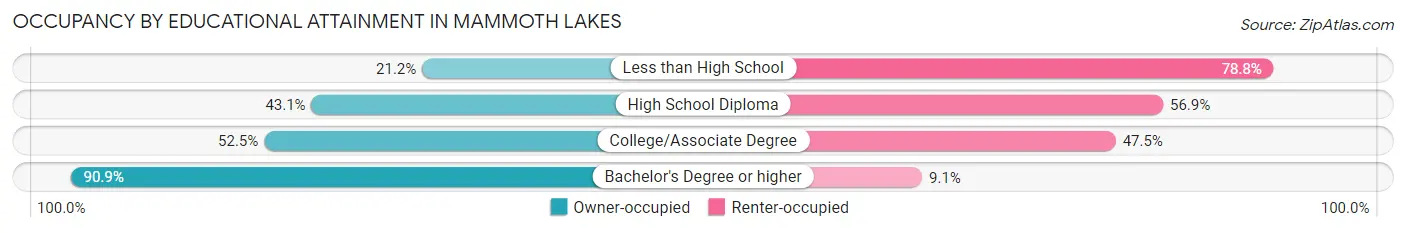
| Household Size | Owner-occupied | Renter-occupied |
| Less than High School | 57 (21.2%) | 212 (78.8%) |
| High School Diploma | 298 (43.1%) | 393 (56.9%) |
| College/Associate Degree | 617 (52.5%) | 558 (47.5%) |
| Bachelor's Degree or higher | 878 (90.9%) | 88 (9.1%) |
Occupancy by Age of Householder in Mammoth Lakes
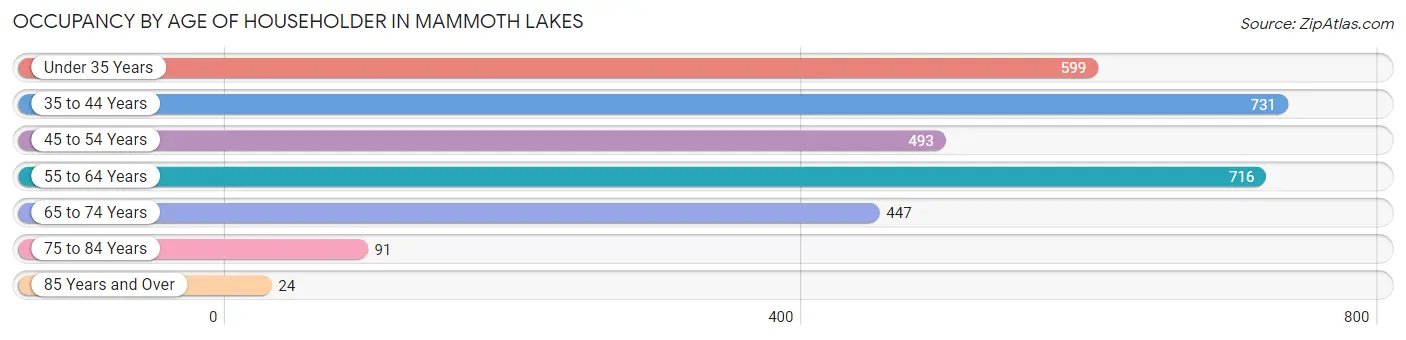
| Age Bracket | # Households | % Households |
| Under 35 Years | 599 | 19.3% |
| 35 to 44 Years | 731 | 23.6% |
| 45 to 54 Years | 493 | 15.9% |
| 55 to 64 Years | 716 | 23.1% |
| 65 to 74 Years | 447 | 14.4% |
| 75 to 84 Years | 91 | 2.9% |
| 85 Years and Over | 24 | 0.8% |
| Total | 3,101 | 100.0% |
Housing Finances in Mammoth Lakes
Median Income by Occupancy in Mammoth Lakes
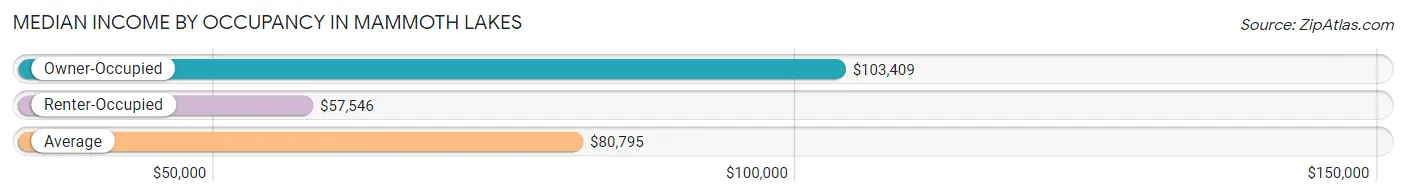
| Occupancy Type | # Households | Median Income |
| Owner-Occupied | 1,850 (59.7%) | $103,409 |
| Renter-Occupied | 1,251 (40.3%) | $57,546 |
| Average | 3,101 (100.0%) | $80,795 |
Occupancy by Householder Income Bracket in Mammoth Lakes
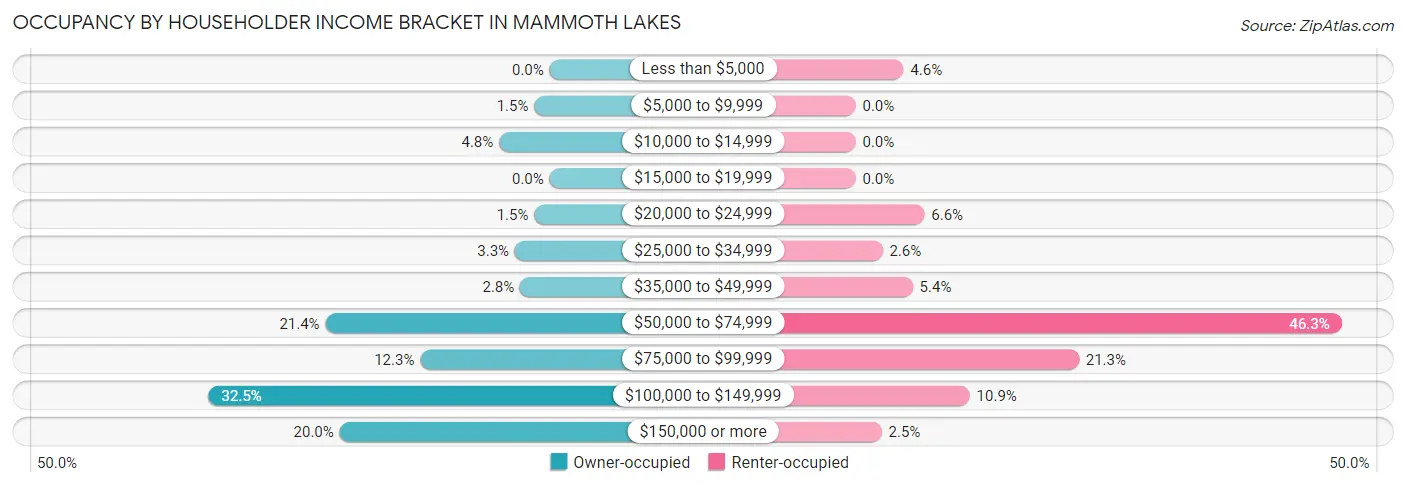
| Income Bracket | Owner-occupied | Renter-occupied |
| Less than $5,000 | 0 (0.0%) | 57 (4.6%) |
| $5,000 to $9,999 | 27 (1.5%) | 0 (0.0%) |
| $10,000 to $14,999 | 89 (4.8%) | 0 (0.0%) |
| $15,000 to $19,999 | 0 (0.0%) | 0 (0.0%) |
| $20,000 to $24,999 | 27 (1.5%) | 82 (6.6%) |
| $25,000 to $34,999 | 61 (3.3%) | 32 (2.6%) |
| $35,000 to $49,999 | 52 (2.8%) | 68 (5.4%) |
| $50,000 to $74,999 | 395 (21.3%) | 579 (46.3%) |
| $75,000 to $99,999 | 228 (12.3%) | 266 (21.3%) |
| $100,000 to $149,999 | 601 (32.5%) | 136 (10.9%) |
| $150,000 or more | 370 (20.0%) | 31 (2.5%) |
| Total | 1,850 (100.0%) | 1,251 (100.0%) |
Monthly Housing Cost Tiers in Mammoth Lakes
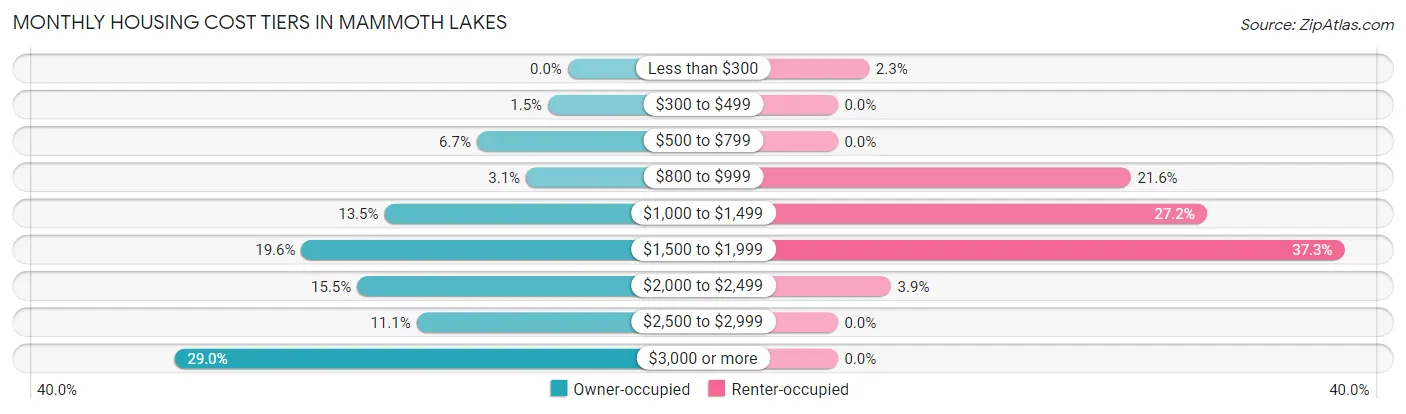
| Monthly Cost | Owner-occupied | Renter-occupied |
| Less than $300 | 0 (0.0%) | 29 (2.3%) |
| $300 to $499 | 27 (1.5%) | 0 (0.0%) |
| $500 to $799 | 124 (6.7%) | 0 (0.0%) |
| $800 to $999 | 57 (3.1%) | 270 (21.6%) |
| $1,000 to $1,499 | 250 (13.5%) | 340 (27.2%) |
| $1,500 to $1,999 | 363 (19.6%) | 467 (37.3%) |
| $2,000 to $2,499 | 287 (15.5%) | 49 (3.9%) |
| $2,500 to $2,999 | 206 (11.1%) | 0 (0.0%) |
| $3,000 or more | 536 (29.0%) | 0 (0.0%) |
| Total | 1,850 (100.0%) | 1,251 (100.0%) |
Physical Housing Characteristics in Mammoth Lakes
Housing Structures in Mammoth Lakes
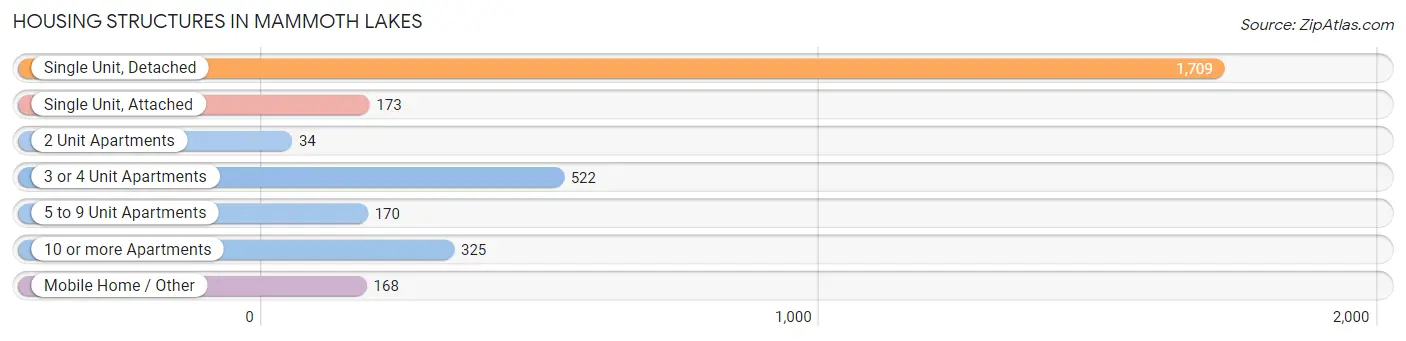
| Structure Type | # Housing Units | % Housing Units |
| Single Unit, Detached | 1,709 | 55.1% |
| Single Unit, Attached | 173 | 5.6% |
| 2 Unit Apartments | 34 | 1.1% |
| 3 or 4 Unit Apartments | 522 | 16.8% |
| 5 to 9 Unit Apartments | 170 | 5.5% |
| 10 or more Apartments | 325 | 10.5% |
| Mobile Home / Other | 168 | 5.4% |
| Total | 3,101 | 100.0% |
Housing Structures by Occupancy in Mammoth Lakes
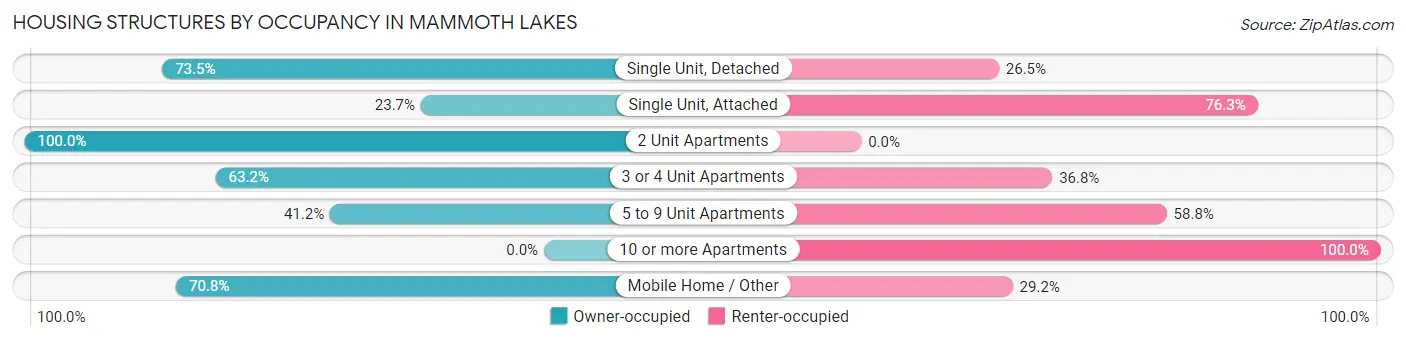
| Structure Type | Owner-occupied | Renter-occupied |
| Single Unit, Detached | 1,256 (73.5%) | 453 (26.5%) |
| Single Unit, Attached | 41 (23.7%) | 132 (76.3%) |
| 2 Unit Apartments | 34 (100.0%) | 0 (0.0%) |
| 3 or 4 Unit Apartments | 330 (63.2%) | 192 (36.8%) |
| 5 to 9 Unit Apartments | 70 (41.2%) | 100 (58.8%) |
| 10 or more Apartments | 0 (0.0%) | 325 (100.0%) |
| Mobile Home / Other | 119 (70.8%) | 49 (29.2%) |
| Total | 1,850 (59.7%) | 1,251 (40.3%) |
Housing Structures by Number of Rooms in Mammoth Lakes
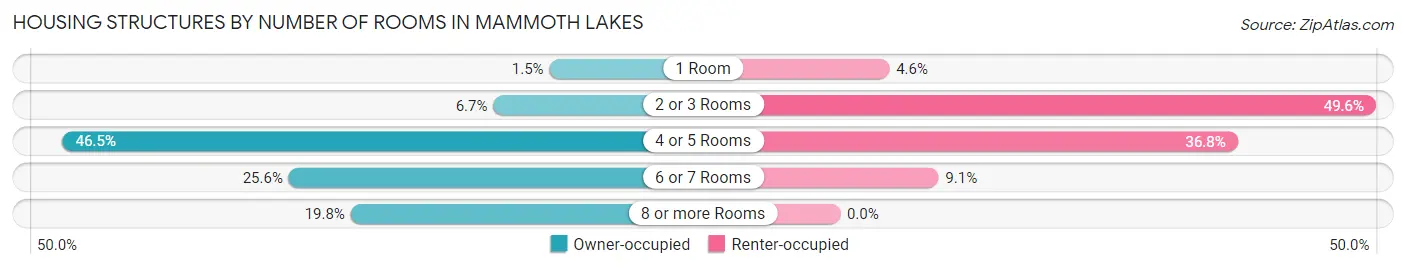
| Number of Rooms | Owner-occupied | Renter-occupied |
| 1 Room | 27 (1.5%) | 57 (4.6%) |
| 2 or 3 Rooms | 123 (6.7%) | 620 (49.6%) |
| 4 or 5 Rooms | 860 (46.5%) | 460 (36.8%) |
| 6 or 7 Rooms | 473 (25.6%) | 114 (9.1%) |
| 8 or more Rooms | 367 (19.8%) | 0 (0.0%) |
| Total | 1,850 (100.0%) | 1,251 (100.0%) |
Housing Structure by Heating Type in Mammoth Lakes
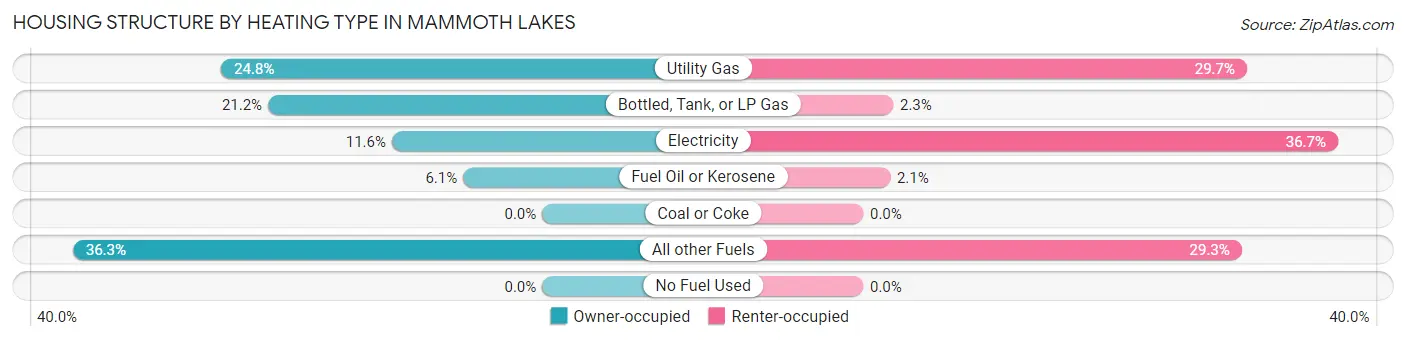
| Heating Type | Owner-occupied | Renter-occupied |
| Utility Gas | 459 (24.8%) | 371 (29.7%) |
| Bottled, Tank, or LP Gas | 392 (21.2%) | 29 (2.3%) |
| Electricity | 215 (11.6%) | 459 (36.7%) |
| Fuel Oil or Kerosene | 113 (6.1%) | 26 (2.1%) |
| Coal or Coke | 0 (0.0%) | 0 (0.0%) |
| All other Fuels | 671 (36.3%) | 366 (29.3%) |
| No Fuel Used | 0 (0.0%) | 0 (0.0%) |
| Total | 1,850 (100.0%) | 1,251 (100.0%) |
Household Vehicle Usage in Mammoth Lakes
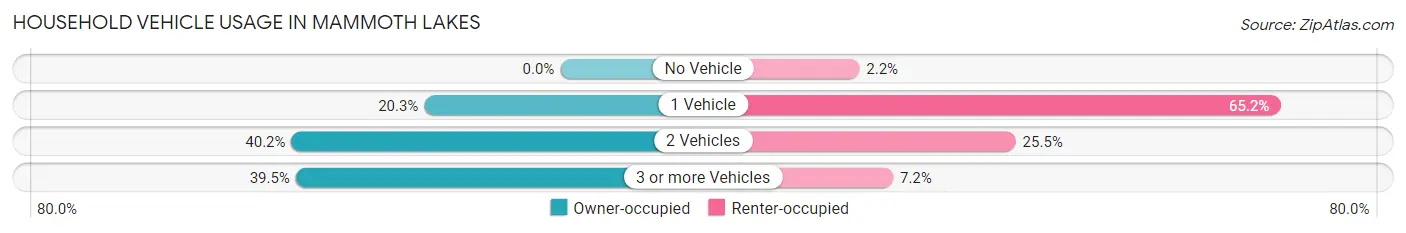
| Vehicles per Household | Owner-occupied | Renter-occupied |
| No Vehicle | 0 (0.0%) | 27 (2.2%) |
| 1 Vehicle | 376 (20.3%) | 815 (65.1%) |
| 2 Vehicles | 743 (40.2%) | 319 (25.5%) |
| 3 or more Vehicles | 731 (39.5%) | 90 (7.2%) |
| Total | 1,850 (100.0%) | 1,251 (100.0%) |
Real Estate & Mortgages in Mammoth Lakes
Real Estate and Mortgage Overview in Mammoth Lakes
| Characteristic | Without Mortgage | With Mortgage |
| Housing Units | 381 | 1,469 |
| Median Property Value | $701,300 | $554,100 |
| Median Household Income | - | - |
| Monthly Housing Costs | $1,134 | $536 |
| Real Estate Taxes | $4,260 | $57 |
Property Value by Mortgage Status in Mammoth Lakes
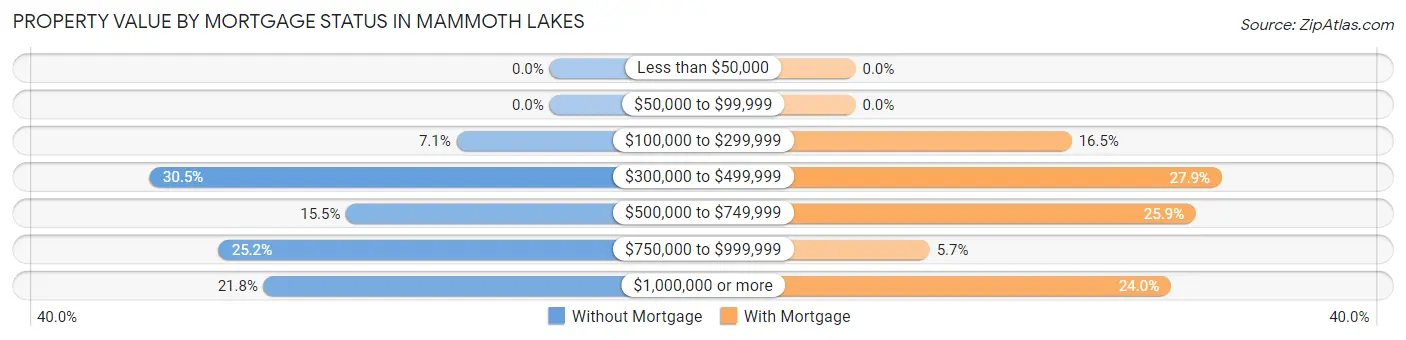
| Property Value | Without Mortgage | With Mortgage |
| Less than $50,000 | 0 (0.0%) | 0 (0.0%) |
| $50,000 to $99,999 | 0 (0.0%) | 0 (0.0%) |
| $100,000 to $299,999 | 27 (7.1%) | 242 (16.5%) |
| $300,000 to $499,999 | 116 (30.4%) | 410 (27.9%) |
| $500,000 to $749,999 | 59 (15.5%) | 381 (25.9%) |
| $750,000 to $999,999 | 96 (25.2%) | 83 (5.7%) |
| $1,000,000 or more | 83 (21.8%) | 353 (24.0%) |
| Total | 381 (100.0%) | 1,469 (100.0%) |
Household Income by Mortgage Status in Mammoth Lakes
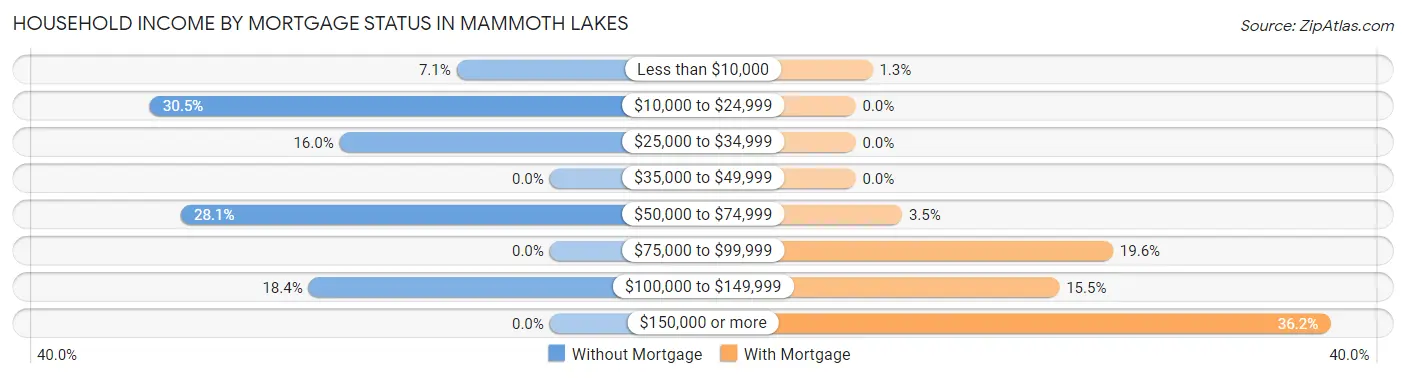
| Household Income | Without Mortgage | With Mortgage |
| Less than $10,000 | 27 (7.1%) | 19 (1.3%) |
| $10,000 to $24,999 | 116 (30.4%) | 0 (0.0%) |
| $25,000 to $34,999 | 61 (16.0%) | 0 (0.0%) |
| $35,000 to $49,999 | 0 (0.0%) | 0 (0.0%) |
| $50,000 to $74,999 | 107 (28.1%) | 52 (3.5%) |
| $75,000 to $99,999 | 0 (0.0%) | 288 (19.6%) |
| $100,000 to $149,999 | 70 (18.4%) | 228 (15.5%) |
| $150,000 or more | 0 (0.0%) | 531 (36.1%) |
| Total | 381 (100.0%) | 1,469 (100.0%) |
Property Value to Household Income Ratio in Mammoth Lakes
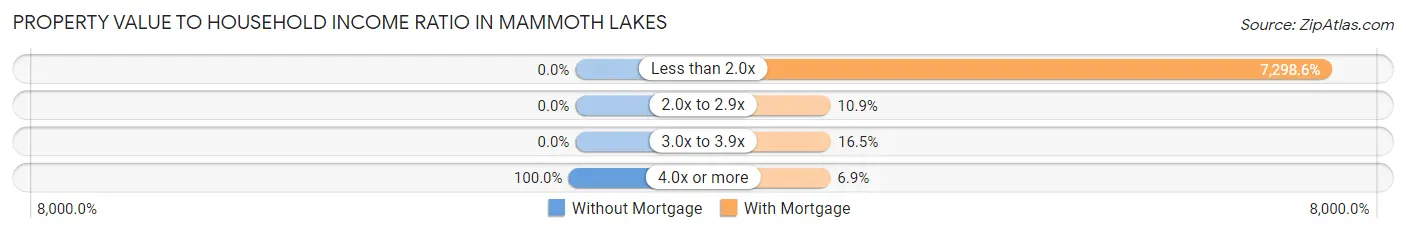
| Value-to-Income Ratio | Without Mortgage | With Mortgage |
| Less than 2.0x | 0 (0.0%) | 107,216 (7,298.6%) |
| 2.0x to 2.9x | 0 (0.0%) | 160 (10.9%) |
| 3.0x to 3.9x | 0 (0.0%) | 243 (16.5%) |
| 4.0x or more | 381 (100.0%) | 101 (6.9%) |
| Total | 381 (100.0%) | 1,469 (100.0%) |
Real Estate Taxes by Mortgage Status in Mammoth Lakes
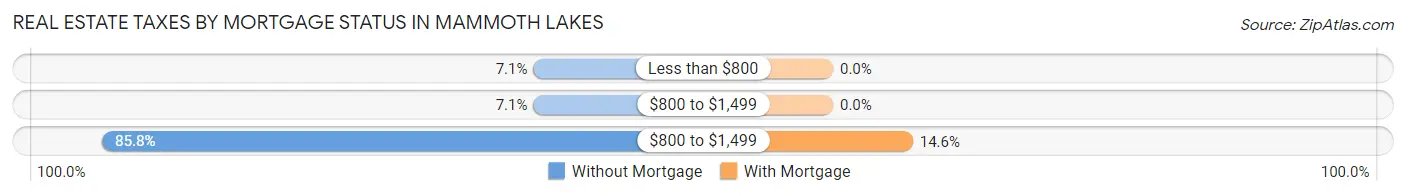
| Property Taxes | Without Mortgage | With Mortgage |
| Less than $800 | 27 (7.1%) | 0 (0.0%) |
| $800 to $1,499 | 27 (7.1%) | 0 (0.0%) |
| $800 to $1,499 | 327 (85.8%) | 214 (14.6%) |
| Total | 381 (100.0%) | 1,469 (100.0%) |
Health & Disability in Mammoth Lakes
Health Insurance Coverage by Age in Mammoth Lakes
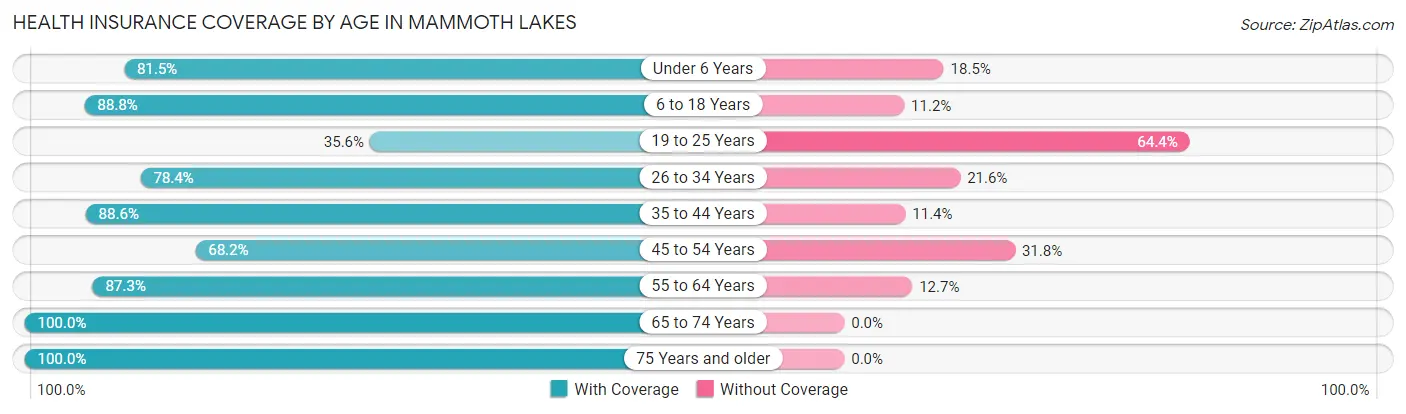
| Age Bracket | With Coverage | Without Coverage |
| Under 6 Years | 299 (81.5%) | 68 (18.5%) |
| 6 to 18 Years | 1,091 (88.8%) | 137 (11.2%) |
| 19 to 25 Years | 193 (35.6%) | 349 (64.4%) |
| 26 to 34 Years | 849 (78.4%) | 234 (21.6%) |
| 35 to 44 Years | 879 (88.6%) | 113 (11.4%) |
| 45 to 54 Years | 803 (68.2%) | 375 (31.8%) |
| 55 to 64 Years | 903 (87.3%) | 131 (12.7%) |
| 65 to 74 Years | 532 (100.0%) | 0 (0.0%) |
| 75 Years and older | 297 (100.0%) | 0 (0.0%) |
| Total | 5,846 (80.6%) | 1,407 (19.4%) |
Health Insurance Coverage by Citizenship Status in Mammoth Lakes
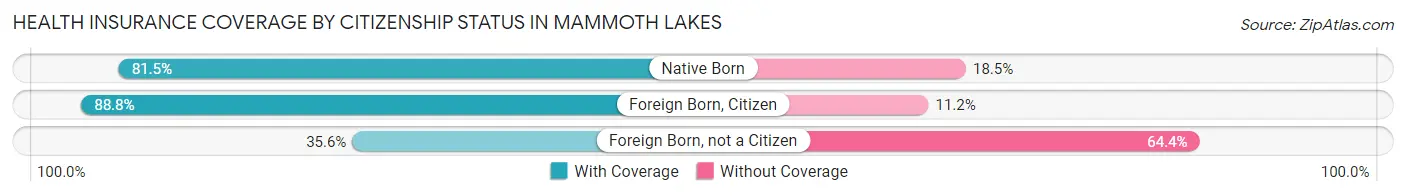
| Citizenship Status | With Coverage | Without Coverage |
| Native Born | 299 (81.5%) | 68 (18.5%) |
| Foreign Born, Citizen | 1,091 (88.8%) | 137 (11.2%) |
| Foreign Born, not a Citizen | 193 (35.6%) | 349 (64.4%) |
Health Insurance Coverage by Household Income in Mammoth Lakes
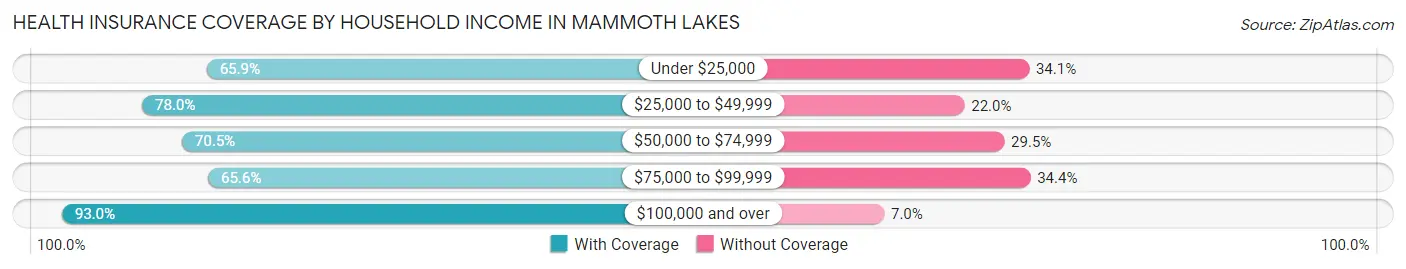
| Household Income | With Coverage | Without Coverage |
| Under $25,000 | 359 (65.9%) | 186 (34.1%) |
| $25,000 to $49,999 | 255 (78.0%) | 72 (22.0%) |
| $50,000 to $74,999 | 1,122 (70.5%) | 469 (29.5%) |
| $75,000 to $99,999 | 865 (65.6%) | 453 (34.4%) |
| $100,000 and over | 3,023 (93.0%) | 227 (7.0%) |
Public vs Private Health Insurance Coverage by Age in Mammoth Lakes
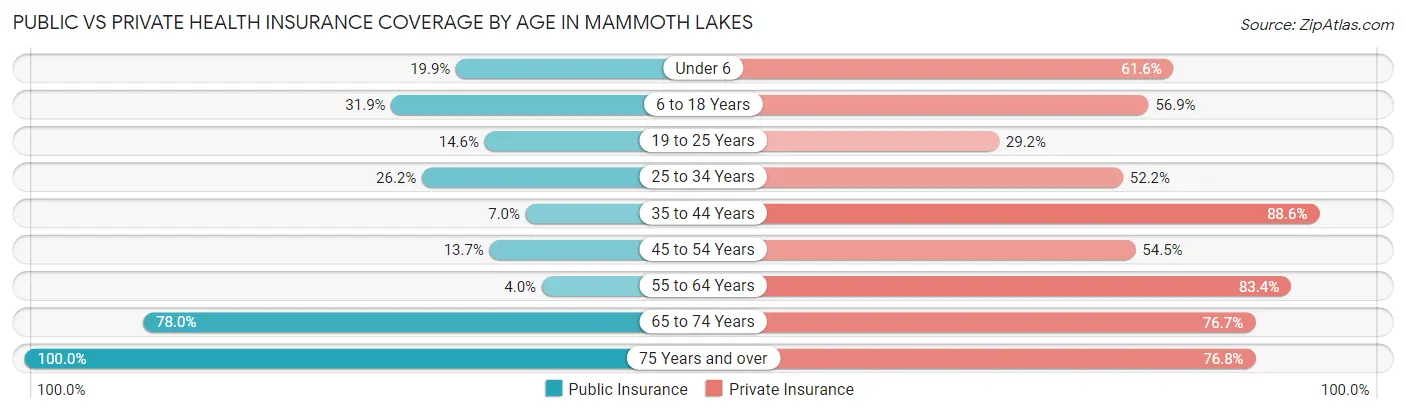
| Age Bracket | Public Insurance | Private Insurance |
| Under 6 | 73 (19.9%) | 226 (61.6%) |
| 6 to 18 Years | 392 (31.9%) | 699 (56.9%) |
| 19 to 25 Years | 79 (14.6%) | 158 (29.1%) |
| 25 to 34 Years | 284 (26.2%) | 565 (52.2%) |
| 35 to 44 Years | 69 (7.0%) | 879 (88.6%) |
| 45 to 54 Years | 161 (13.7%) | 642 (54.5%) |
| 55 to 64 Years | 41 (4.0%) | 862 (83.4%) |
| 65 to 74 Years | 415 (78.0%) | 408 (76.7%) |
| 75 Years and over | 297 (100.0%) | 228 (76.8%) |
| Total | 1,811 (25.0%) | 4,667 (64.3%) |
Disability Status by Sex by Age in Mammoth Lakes
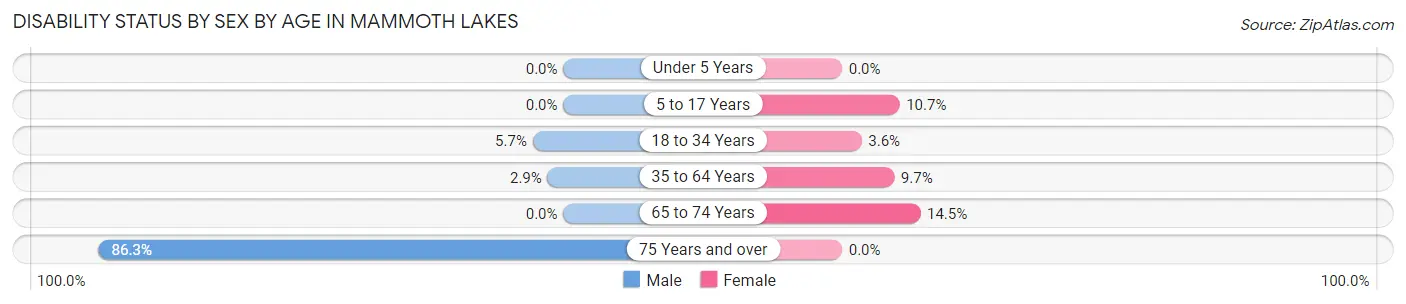
| Age Bracket | Male | Female |
| Under 5 Years | 0 (0.0%) | 0 (0.0%) |
| 5 to 17 Years | 0 (0.0%) | 68 (10.7%) |
| 18 to 34 Years | 44 (5.7%) | 35 (3.6%) |
| 35 to 64 Years | 47 (2.9%) | 154 (9.7%) |
| 65 to 74 Years | 0 (0.0%) | 35 (14.5%) |
| 75 Years and over | 182 (86.3%) | 0 (0.0%) |
Disability Class by Sex by Age in Mammoth Lakes
Disability Class: Hearing Difficulty
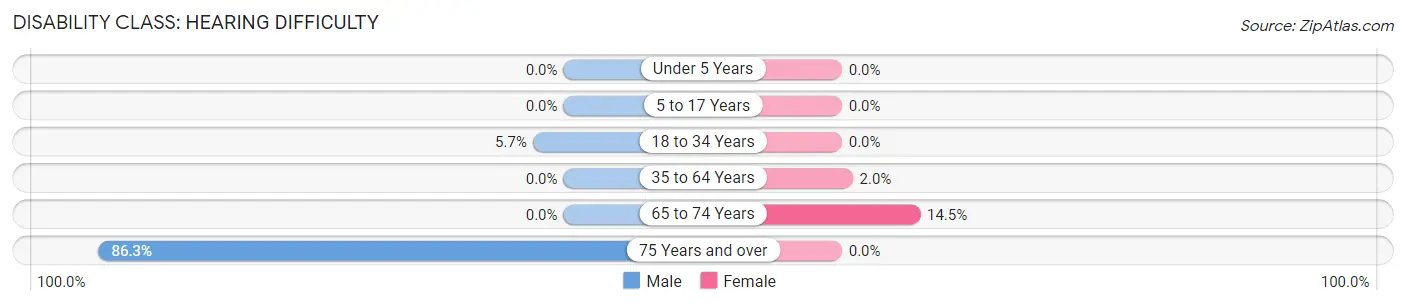
| Age Bracket | Male | Female |
| Under 5 Years | 0 (0.0%) | 0 (0.0%) |
| 5 to 17 Years | 0 (0.0%) | 0 (0.0%) |
| 18 to 34 Years | 44 (5.7%) | 0 (0.0%) |
| 35 to 64 Years | 0 (0.0%) | 32 (2.0%) |
| 65 to 74 Years | 0 (0.0%) | 35 (14.5%) |
| 75 Years and over | 182 (86.3%) | 0 (0.0%) |
Disability Class: Vision Difficulty
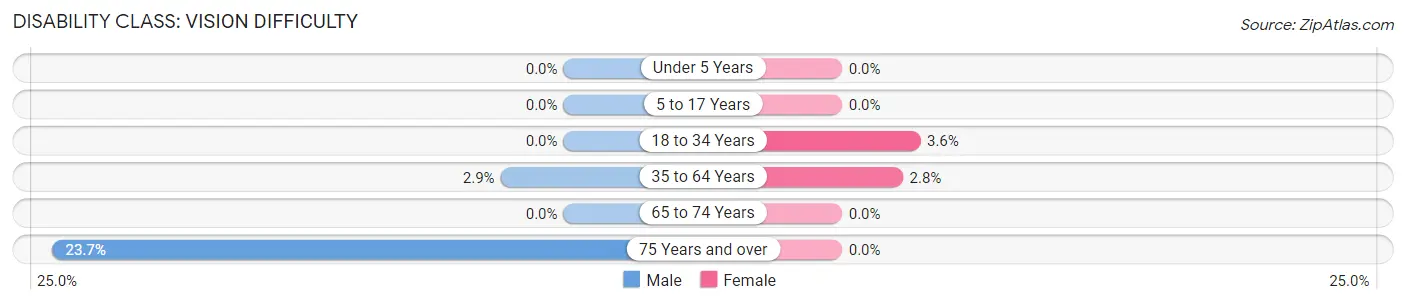
| Age Bracket | Male | Female |
| Under 5 Years | 0 (0.0%) | 0 (0.0%) |
| 5 to 17 Years | 0 (0.0%) | 0 (0.0%) |
| 18 to 34 Years | 0 (0.0%) | 35 (3.6%) |
| 35 to 64 Years | 47 (2.9%) | 45 (2.8%) |
| 65 to 74 Years | 0 (0.0%) | 0 (0.0%) |
| 75 Years and over | 50 (23.7%) | 0 (0.0%) |
Disability Class: Cognitive Difficulty
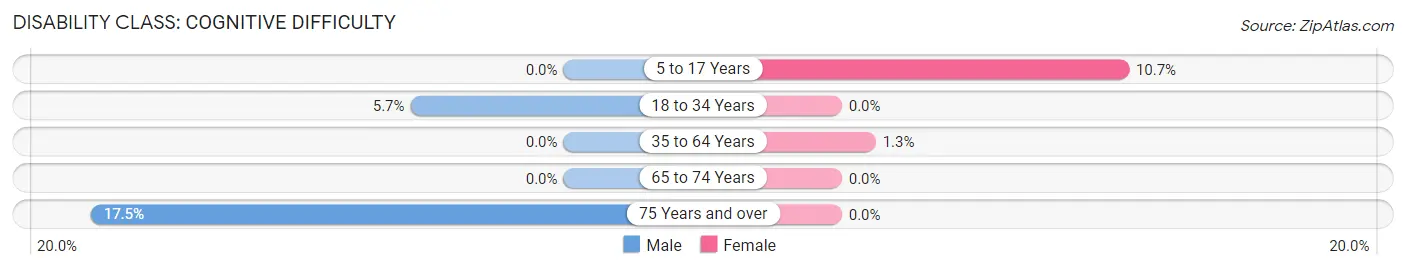
| Age Bracket | Male | Female |
| 5 to 17 Years | 0 (0.0%) | 68 (10.7%) |
| 18 to 34 Years | 44 (5.7%) | 0 (0.0%) |
| 35 to 64 Years | 0 (0.0%) | 20 (1.3%) |
| 65 to 74 Years | 0 (0.0%) | 0 (0.0%) |
| 75 Years and over | 37 (17.5%) | 0 (0.0%) |
Disability Class: Ambulatory Difficulty
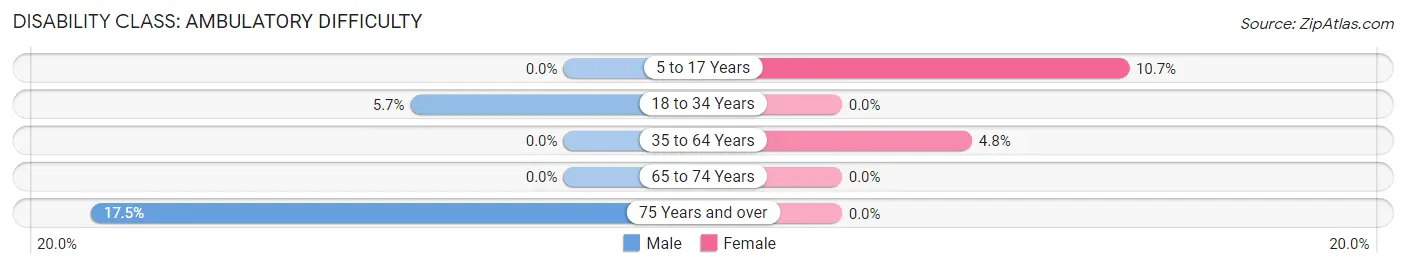
| Age Bracket | Male | Female |
| 5 to 17 Years | 0 (0.0%) | 68 (10.7%) |
| 18 to 34 Years | 44 (5.7%) | 0 (0.0%) |
| 35 to 64 Years | 0 (0.0%) | 77 (4.8%) |
| 65 to 74 Years | 0 (0.0%) | 0 (0.0%) |
| 75 Years and over | 37 (17.5%) | 0 (0.0%) |
Disability Class: Self-Care Difficulty
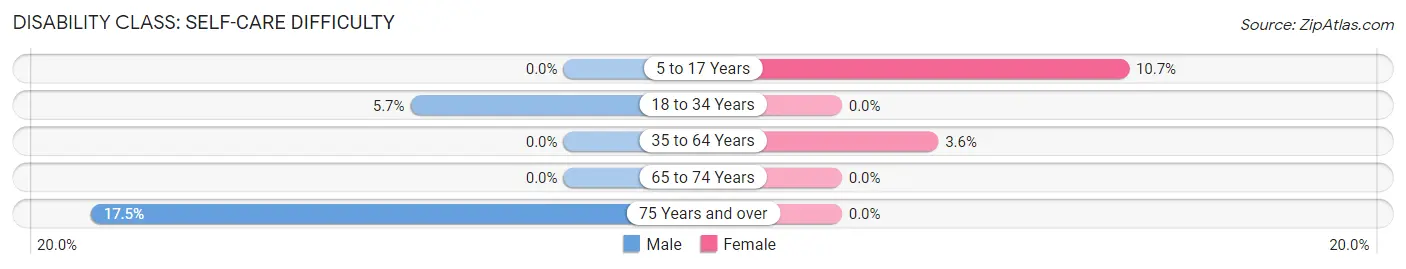
| Age Bracket | Male | Female |
| 5 to 17 Years | 0 (0.0%) | 68 (10.7%) |
| 18 to 34 Years | 44 (5.7%) | 0 (0.0%) |
| 35 to 64 Years | 0 (0.0%) | 57 (3.6%) |
| 65 to 74 Years | 0 (0.0%) | 0 (0.0%) |
| 75 Years and over | 37 (17.5%) | 0 (0.0%) |
Technology Access in Mammoth Lakes
Computing Device Access in Mammoth Lakes
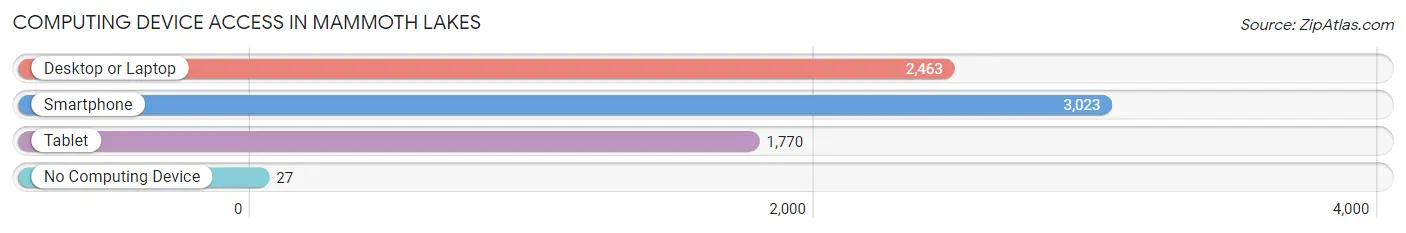
| Device Type | # Households | % Households |
| Desktop or Laptop | 2,463 | 79.4% |
| Smartphone | 3,023 | 97.5% |
| Tablet | 1,770 | 57.1% |
| No Computing Device | 27 | 0.9% |
| Total | 3,101 | 100.0% |
Internet Access in Mammoth Lakes
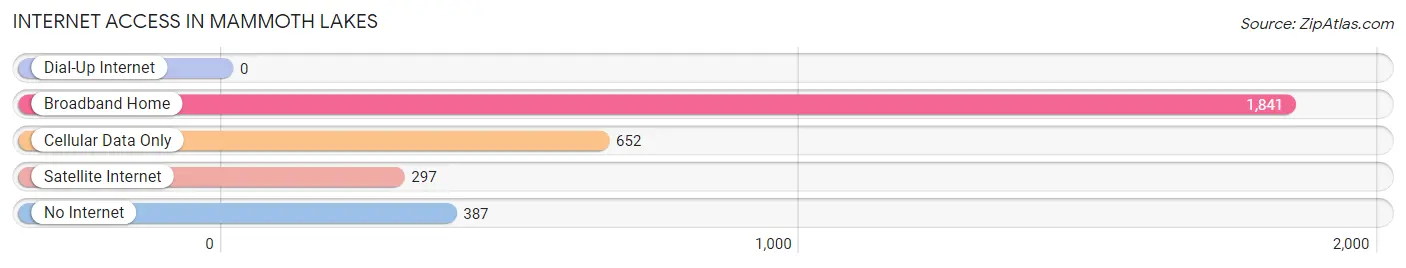
| Internet Type | # Households | % Households |
| Dial-Up Internet | 0 | 0.0% |
| Broadband Home | 1,841 | 59.4% |
| Cellular Data Only | 652 | 21.0% |
| Satellite Internet | 297 | 9.6% |
| No Internet | 387 | 12.5% |
| Total | 3,101 | 100.0% |
Mammoth Lakes Summary
Mammoth Lakes is a small town located in the Eastern Sierra Nevada Mountains of California. It is situated in Mono County, approximately 250 miles northeast of Los Angeles and 300 miles south of Reno, Nevada. The town is surrounded by the Ansel Adams Wilderness, the John Muir Wilderness, and the Hoover Wilderness, making it a popular destination for outdoor recreation. The town is home to a population of approximately 8,000 people, and is the gateway to the Mammoth Mountain Ski Area, one of the largest ski resorts in the United States.
History
The area that is now Mammoth Lakes was originally inhabited by the Mono people, who lived in the area for thousands of years. The first European settlers arrived in the area in the late 1800s, and the town of Mammoth Lakes was officially founded in 1877. The town was named after the nearby Mammoth Mountain, which was named for the large number of mammoth fossils that were discovered in the area.
In the early 1900s, the town began to grow as a tourist destination, and the first ski resort was built in the area in the 1930s. The ski resort was a success, and the town continued to grow as a popular destination for outdoor recreation. In the 1950s, the town was incorporated, and the population continued to grow throughout the following decades.
Geography
Mammoth Lakes is located in the Eastern Sierra Nevada Mountains of California. The town is situated at an elevation of 7,880 feet, making it one of the highest towns in the United States. The town is surrounded by the Ansel Adams Wilderness, the John Muir Wilderness, and the Hoover Wilderness, and is located near the Mammoth Mountain Ski Area. The town is located approximately 250 miles northeast of Los Angeles and 300 miles south of Reno, Nevada.
The town is located in a high desert climate, with hot summers and cold winters. The average high temperature in the summer is around 80 degrees Fahrenheit, and the average low temperature in the winter is around 20 degrees Fahrenheit. The town receives an average of around 200 inches of snowfall each year.
Economy
Mammoth Lakes is a popular tourist destination, and the town’s economy is largely based on tourism and outdoor recreation. The town is home to the Mammoth Mountain Ski Area, one of the largest ski resorts in the United States. The ski resort is a major employer in the town, and the resort’s visitors contribute significantly to the local economy.
In addition to the ski resort, the town is also home to a variety of other businesses, including restaurants, hotels, and retail stores. The town is also home to a number of outdoor recreation companies, which offer guided tours and activities in the surrounding wilderness areas.
Demographics
As of the 2010 census, the population of Mammoth Lakes was 8,234. The town has a median age of 36.7 years, and the median household income is $63,944. The town is predominantly white, with 87.3% of the population identifying as white. The town also has a significant Hispanic population, with 8.3% of the population identifying as Hispanic or Latino. The town also has a small Native American population, with 0.7% of the population identifying as Native American.
Common Questions
What is Per Capita Income in Mammoth Lakes?
Per Capita income in Mammoth Lakes is $45,969.
What is the Median Family Income in Mammoth Lakes?
Median Family Income in Mammoth Lakes is $102,500.
What is the Median Household income in Mammoth Lakes?
Median Household Income in Mammoth Lakes is $80,795.
What is Income or Wage Gap in Mammoth Lakes?
Income or Wage Gap in Mammoth Lakes is 10.2%.
Women in Mammoth Lakes earn 89.8 cents for every dollar earned by a man.
What is Inequality or Gini Index in Mammoth Lakes?
Inequality or Gini Index in Mammoth Lakes is 0.40.
What is the Total Population of Mammoth Lakes?
Total Population of Mammoth Lakes is 7,253.
What is the Total Male Population of Mammoth Lakes?
Total Male Population of Mammoth Lakes is 3,697.
What is the Total Female Population of Mammoth Lakes?
Total Female Population of Mammoth Lakes is 3,556.
What is the Ratio of Males per 100 Females in Mammoth Lakes?
There are 103.97 Males per 100 Females in Mammoth Lakes.
What is the Ratio of Females per 100 Males in Mammoth Lakes?
There are 96.19 Females per 100 Males in Mammoth Lakes.
What is the Median Population Age in Mammoth Lakes?
Median Population Age in Mammoth Lakes is 38.4 Years.
What is the Average Family Size in Mammoth Lakes
Average Family Size in Mammoth Lakes is 3.2 People.
What is the Average Household Size in Mammoth Lakes
Average Household Size in Mammoth Lakes is 2.3 People.
How Large is the Labor Force in Mammoth Lakes?
There are 4,481 People in the Labor Forcein in Mammoth Lakes.
What is the Percentage of People in the Labor Force in Mammoth Lakes?
75.7% of People are in the Labor Force in Mammoth Lakes.
What is the Unemployment Rate in Mammoth Lakes?
Unemployment Rate in Mammoth Lakes is 1.2%.