Zip Codes with the Highest Poverty Level Among Children Under the Age of 5 in Utah
RELATED REPORTS & OPTIONS
Highest Poverty | Child 0-5
Utah
Compare Zip Codes
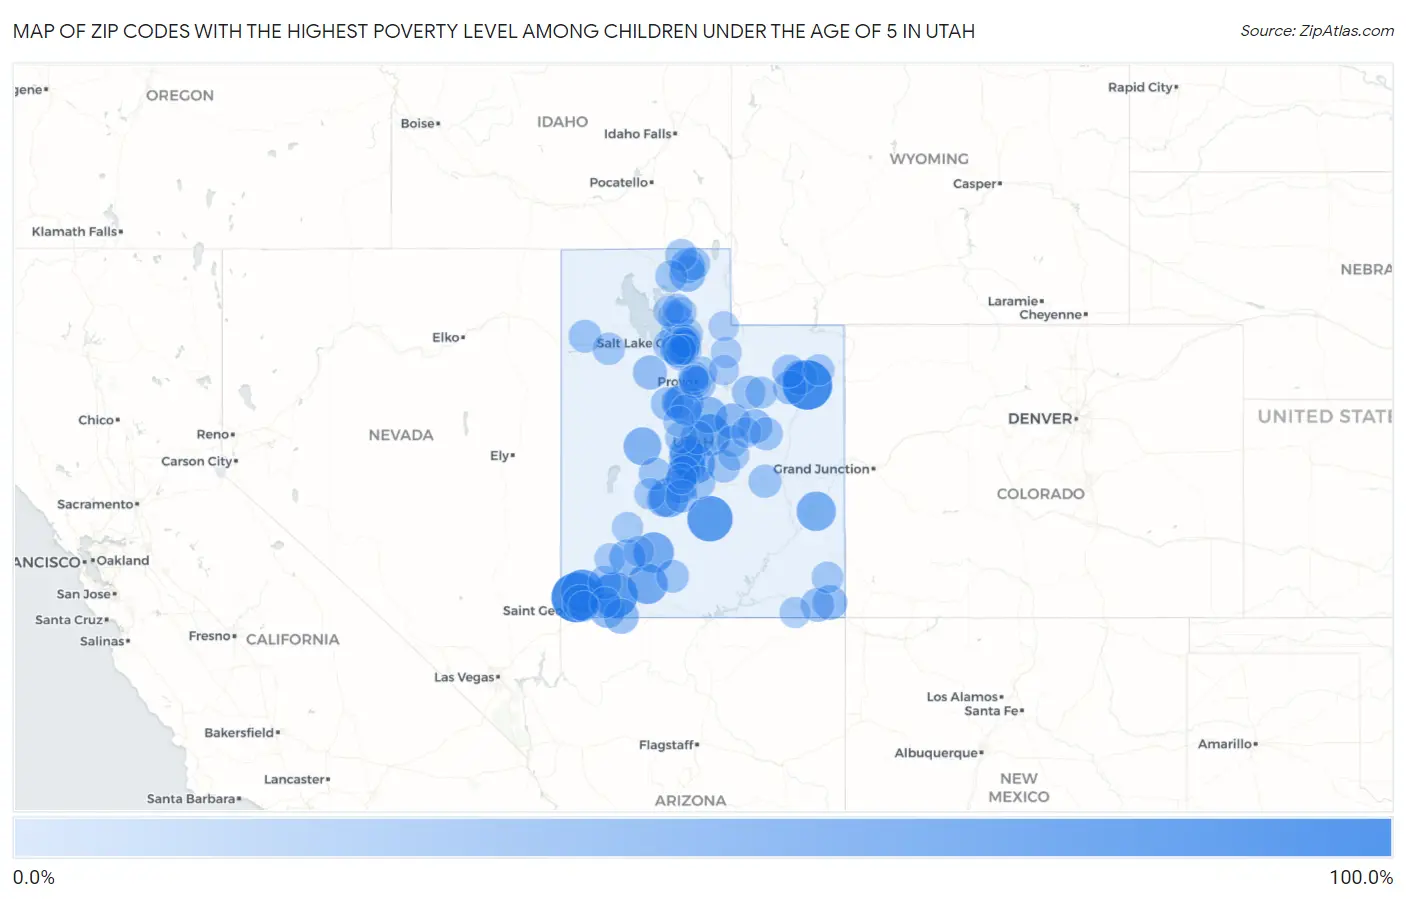
Map of Zip Codes with the Highest Poverty Level Among Children Under the Age of 5 in Utah
0.0%
100.0%
Zip Codes with the Highest Poverty Level Among Children Under the Age of 5 in Utah
| Zip Code | Child Poverty | vs State | vs National | |
| 1. | 84063 | 100.0% | 10.0%(+90.0)#1 | 18.1%(+81.9)#330 |
| 2. | 84733 | 100.0% | 10.0%(+90.0)#2 | 18.1%(+81.9)#367 |
| 3. | 84779 | 80.0% | 10.0%(+70.0)#3 | 18.1%(+61.9)#810 |
| 4. | 84749 | 80.0% | 10.0%(+70.0)#4 | 18.1%(+61.9)#824 |
| 5. | 84782 | 70.6% | 10.0%(+60.6)#5 | 18.1%(+52.5)#1,131 |
| 6. | 84647 | 61.8% | 10.0%(+51.8)#6 | 18.1%(+43.7)#1,571 |
| 7. | 84759 | 56.5% | 10.0%(+46.5)#7 | 18.1%(+38.4)#1,950 |
| 8. | 84710 | 56.2% | 10.0%(+46.3)#8 | 18.1%(+38.2)#1,970 |
| 9. | 84643 | 55.9% | 10.0%(+45.9)#9 | 18.1%(+37.8)#1,998 |
| 10. | 84724 | 52.5% | 10.0%(+42.5)#10 | 18.1%(+34.4)#2,301 |
| 11. | 84633 | 52.2% | 10.0%(+42.2)#11 | 18.1%(+34.1)#2,327 |
| 12. | 84532 | 51.3% | 10.0%(+41.3)#12 | 18.1%(+33.2)#2,407 |
| 13. | 84624 | 43.8% | 10.0%(+33.8)#13 | 18.1%(+25.8)#3,363 |
| 14. | 84634 | 39.8% | 10.0%(+29.8)#14 | 18.1%(+21.7)#4,070 |
| 15. | 84622 | 38.2% | 10.0%(+28.2)#15 | 18.1%(+20.2)#4,359 |
| 16. | 84629 | 38.1% | 10.0%(+28.1)#16 | 18.1%(+20.0)#4,387 |
| 17. | 84761 | 36.6% | 10.0%(+26.7)#17 | 18.1%(+18.6)#4,665 |
| 18. | 84326 | 35.6% | 10.0%(+25.7)#18 | 18.1%(+17.6)#4,918 |
| 19. | 84526 | 34.5% | 10.0%(+24.5)#19 | 18.1%(+16.4)#5,180 |
| 20. | 84737 | 34.0% | 10.0%(+24.0)#20 | 18.1%(+15.9)#5,304 |
| 21. | 84738 | 33.8% | 10.0%(+23.8)#21 | 18.1%(+15.7)#5,349 |
| 22. | 84784 | 31.9% | 10.0%(+22.0)#22 | 18.1%(+13.9)#5,852 |
| 23. | 84341 | 30.0% | 10.0%(+20.0)#23 | 18.1%(+11.9)#6,338 |
| 24. | 84534 | 29.3% | 10.0%(+19.3)#24 | 18.1%(+11.3)#6,562 |
| 25. | 84026 | 29.2% | 10.0%(+19.2)#25 | 18.1%(+11.1)#6,606 |
| 26. | 84111 | 27.4% | 10.0%(+17.4)#26 | 18.1%(+9.33)#7,169 |
| 27. | 84542 | 27.3% | 10.0%(+17.3)#27 | 18.1%(+9.21)#7,213 |
| 28. | 84069 | 27.3% | 10.0%(+17.3)#28 | 18.1%(+9.21)#7,226 |
| 29. | 84657 | 27.2% | 10.0%(+17.2)#29 | 18.1%(+9.11)#7,254 |
| 30. | 84739 | 26.7% | 10.0%(+16.7)#30 | 18.1%(+8.60)#7,421 |
| 31. | 84606 | 25.6% | 10.0%(+15.6)#31 | 18.1%(+7.54)#7,769 |
| 32. | 84052 | 25.0% | 10.0%(+15.0)#32 | 18.1%(+6.94)#7,993 |
| 33. | 84512 | 25.0% | 10.0%(+15.0)#33 | 18.1%(+6.94)#8,008 |
| 34. | 84630 | 25.0% | 10.0%(+15.0)#34 | 18.1%(+6.94)#8,020 |
| 35. | 84027 | 24.7% | 10.0%(+14.7)#35 | 18.1%(+6.61)#8,125 |
| 36. | 84667 | 24.3% | 10.0%(+14.3)#36 | 18.1%(+6.26)#8,239 |
| 37. | 84720 | 24.0% | 10.0%(+14.0)#37 | 18.1%(+5.90)#8,363 |
| 38. | 84628 | 23.1% | 10.0%(+13.1)#38 | 18.1%(+5.01)#8,738 |
| 39. | 84129 | 23.0% | 10.0%(+13.1)#39 | 18.1%(+4.99)#8,751 |
| 40. | 84116 | 23.0% | 10.0%(+13.0)#40 | 18.1%(+4.97)#8,759 |
| 41. | 84525 | 22.5% | 10.0%(+12.5)#41 | 18.1%(+4.44)#8,962 |
| 42. | 84066 | 22.3% | 10.0%(+12.3)#42 | 18.1%(+4.23)#9,051 |
| 43. | 84520 | 22.0% | 10.0%(+12.0)#43 | 18.1%(+3.97)#9,184 |
| 44. | 84654 | 21.9% | 10.0%(+11.9)#44 | 18.1%(+3.83)#9,237 |
| 45. | 84652 | 21.9% | 10.0%(+11.9)#45 | 18.1%(+3.81)#9,245 |
| 46. | 84083 | 21.6% | 10.0%(+11.7)#46 | 18.1%(+3.59)#9,335 |
| 47. | 84718 | 21.4% | 10.0%(+11.4)#47 | 18.1%(+3.37)#9,426 |
| 48. | 84626 | 21.4% | 10.0%(+11.4)#48 | 18.1%(+3.32)#9,446 |
| 49. | 84701 | 21.3% | 10.0%(+11.3)#49 | 18.1%(+3.26)#9,474 |
| 50. | 84523 | 20.8% | 10.0%(+10.8)#50 | 18.1%(+2.69)#9,703 |
| 51. | 84321 | 20.7% | 10.0%(+10.7)#51 | 18.1%(+2.63)#9,720 |
| 52. | 84120 | 20.1% | 10.0%(+10.1)#52 | 18.1%(+2.02)#9,982 |
| 53. | 84631 | 20.0% | 10.0%(+10.0)#53 | 18.1%(+1.94)#10,011 |
| 54. | 84115 | 19.8% | 10.0%(+9.83)#54 | 18.1%(+1.76)#10,124 |
| 55. | 84029 | 19.3% | 10.0%(+9.31)#55 | 18.1%(+1.23)#10,362 |
| 56. | 84639 | 18.2% | 10.0%(+8.19)#56 | 18.1%(+0.119)#10,874 |
| 57. | 84338 | 17.8% | 10.0%(+7.79)#57 | 18.1%(-0.285)#11,071 |
| 58. | 84314 | 17.7% | 10.0%(+7.73)#58 | 18.1%(-0.341)#11,093 |
| 59. | 84604 | 17.3% | 10.0%(+7.26)#59 | 18.1%(-0.812)#11,297 |
| 60. | 84601 | 17.1% | 10.0%(+7.09)#60 | 18.1%(-0.982)#11,390 |
| 61. | 84528 | 16.7% | 10.0%(+6.68)#61 | 18.1%(-1.40)#11,542 |
| 62. | 84021 | 16.4% | 10.0%(+6.38)#62 | 18.1%(-1.69)#11,709 |
| 63. | 84119 | 16.0% | 10.0%(+6.05)#63 | 18.1%(-2.02)#11,896 |
| 64. | 84511 | 16.0% | 10.0%(+6.03)#64 | 18.1%(-2.05)#11,915 |
| 65. | 84637 | 15.6% | 10.0%(+5.60)#65 | 18.1%(-2.48)#12,140 |
| 66. | 84015 | 15.2% | 10.0%(+5.22)#66 | 18.1%(-2.86)#12,348 |
| 67. | 84044 | 14.7% | 10.0%(+4.73)#67 | 18.1%(-3.34)#12,623 |
| 68. | 84078 | 14.5% | 10.0%(+4.51)#68 | 18.1%(-3.56)#12,727 |
| 69. | 84104 | 14.3% | 10.0%(+4.33)#69 | 18.1%(-3.74)#12,809 |
| 70. | 84645 | 14.3% | 10.0%(+4.30)#70 | 18.1%(-3.78)#12,838 |
| 71. | 84041 | 13.9% | 10.0%(+3.92)#71 | 18.1%(-4.16)#13,080 |
| 72. | 84752 | 13.8% | 10.0%(+3.86)#72 | 18.1%(-4.22)#13,131 |
| 73. | 84745 | 13.6% | 10.0%(+3.62)#73 | 18.1%(-4.46)#13,266 |
| 74. | 84721 | 13.4% | 10.0%(+3.39)#74 | 18.1%(-4.68)#13,392 |
| 75. | 84513 | 13.2% | 10.0%(+3.25)#75 | 18.1%(-4.83)#13,497 |
| 76. | 84648 | 13.2% | 10.0%(+3.23)#76 | 18.1%(-4.85)#13,504 |
| 77. | 84531 | 12.8% | 10.0%(+2.78)#77 | 18.1%(-5.30)#13,771 |
| 78. | 84010 | 12.7% | 10.0%(+2.76)#78 | 18.1%(-5.32)#13,779 |
| 79. | 84620 | 12.7% | 10.0%(+2.74)#79 | 18.1%(-5.34)#13,788 |
| 80. | 84405 | 12.4% | 10.0%(+2.44)#80 | 18.1%(-5.63)#13,956 |
| 81. | 84057 | 12.2% | 10.0%(+2.23)#81 | 18.1%(-5.85)#14,088 |
| 82. | 84103 | 12.2% | 10.0%(+2.23)#82 | 18.1%(-5.85)#14,089 |
| 83. | 84036 | 12.2% | 10.0%(+2.18)#83 | 18.1%(-5.90)#14,120 |
| 84. | 84760 | 12.1% | 10.0%(+2.10)#84 | 18.1%(-5.97)#14,155 |
| 85. | 84088 | 12.0% | 10.0%(+1.99)#85 | 18.1%(-6.08)#14,229 |
| 86. | 84105 | 12.0% | 10.0%(+1.99)#86 | 18.1%(-6.09)#14,231 |
| 87. | 84117 | 11.9% | 10.0%(+1.87)#87 | 18.1%(-6.21)#14,303 |
| 88. | 84315 | 11.8% | 10.0%(+1.79)#88 | 18.1%(-6.29)#14,344 |
| 89. | 84058 | 11.6% | 10.0%(+1.62)#89 | 18.1%(-6.46)#14,471 |
| 90. | 84770 | 11.3% | 10.0%(+1.31)#90 | 18.1%(-6.76)#14,644 |
| 91. | 84084 | 11.3% | 10.0%(+1.30)#91 | 18.1%(-6.77)#14,651 |
| 92. | 84032 | 11.0% | 10.0%(+0.997)#92 | 18.1%(-7.08)#14,841 |
| 93. | 84501 | 10.8% | 10.0%(+0.817)#93 | 18.1%(-7.26)#14,952 |
| 94. | 84101 | 10.7% | 10.0%(+0.750)#94 | 18.1%(-7.32)#14,980 |
| 95. | 84102 | 9.8% | 10.0%(-0.140)#95 | 18.1%(-8.21)#15,511 |
| 96. | 84401 | 9.8% | 10.0%(-0.172)#96 | 18.1%(-8.25)#15,527 |
| 97. | 84107 | 9.7% | 10.0%(-0.302)#97 | 18.1%(-8.38)#15,600 |
| 98. | 84118 | 9.6% | 10.0%(-0.423)#98 | 18.1%(-8.50)#15,658 |
| 99. | 84123 | 9.5% | 10.0%(-0.456)#99 | 18.1%(-8.53)#15,686 |
| 100. | 84017 | 9.5% | 10.0%(-0.465)#100 | 18.1%(-8.54)#15,692 |
Common Questions
What are the Top 10 Zip Codes with the Highest Poverty Level Among Children Under the Age of 5 in Utah?
Top 10 Zip Codes with the Highest Poverty Level Among Children Under the Age of 5 in Utah are:
What zip code has the Highest Poverty Level Among Children Under the Age of 5 in Utah?
84063 has the Highest Poverty Level Among Children Under the Age of 5 in Utah with 100.0%.
What is the Poverty Level Among Children Under the Age of 5 in the State of Utah?
Poverty Level Among Children Under the Age of 5 in Utah is 10.0%.
What is the Poverty Level Among Children Under the Age of 5 in the United States?
Poverty Level Among Children Under the Age of 5 in the United States is 18.1%.