Wichita Falls, TX Map & Demographics
Wichita Falls Map
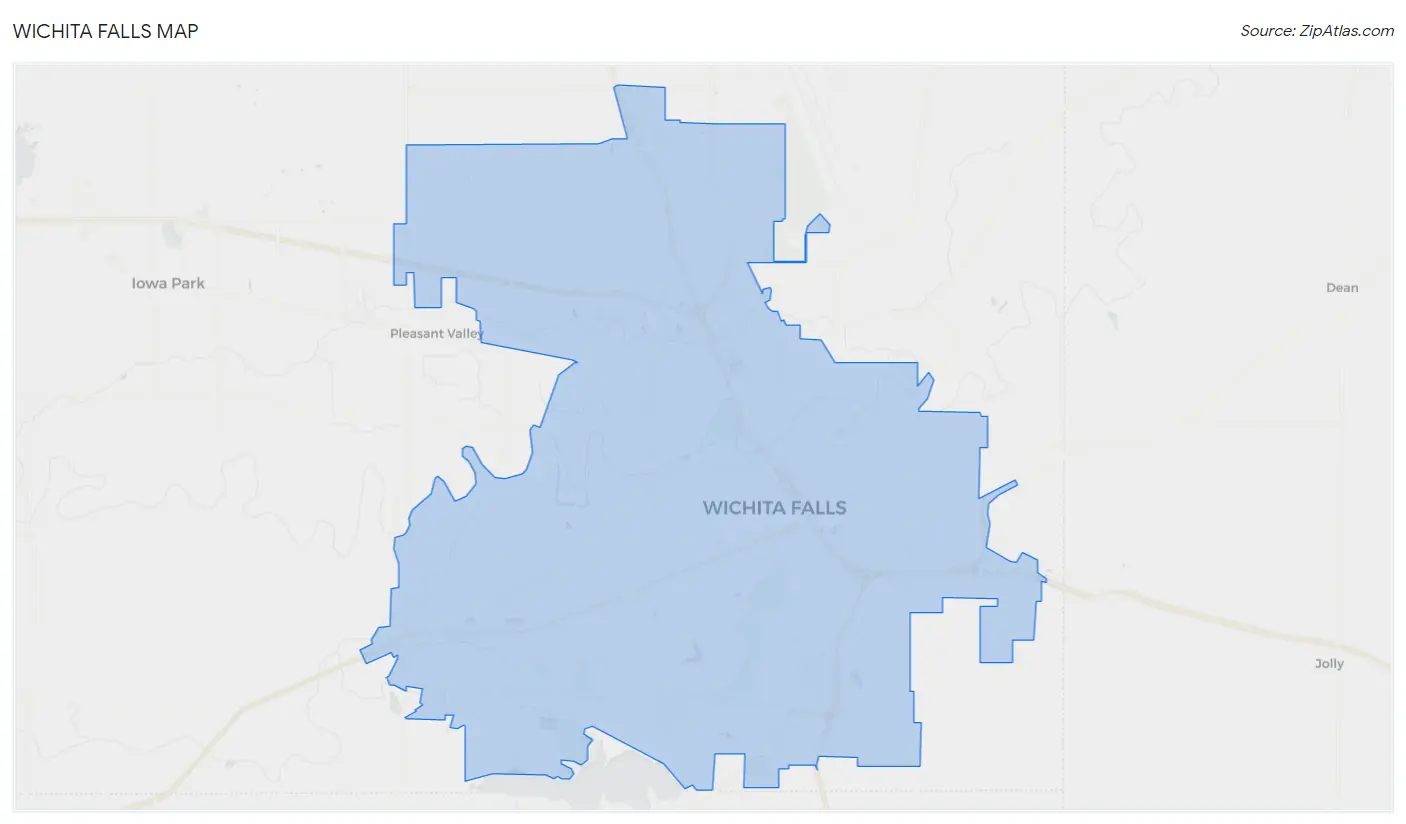
Wichita Falls Overview
$29,940
PER CAPITA INCOME
$73,795
AVG FAMILY INCOME
$55,584
AVG HOUSEHOLD INCOME
24.2%
WAGE / INCOME GAP [ % ]
75.8¢/ $1
WAGE / INCOME GAP [ $ ]
$10,795
FAMILY INCOME DEFICIT
0.47
INEQUALITY / GINI INDEX
102,482
TOTAL POPULATION
53,656
MALE POPULATION
48,826
FEMALE POPULATION
109.89
MALES / 100 FEMALES
91.00
FEMALES / 100 MALES
32.8
MEDIAN AGE
3.1
AVG FAMILY SIZE
2.4
AVG HOUSEHOLD SIZE
52,188
LABOR FORCE [ PEOPLE ]
63.8%
PERCENT IN LABOR FORCE
4.4%
UNEMPLOYMENT RATE
Wichita Falls Area Codes
Income in Wichita Falls
Income Overview in Wichita Falls
Per Capita Income in Wichita Falls is $29,940, while median incomes of families and households are $73,795 and $55,584 respectively.
| Characteristic | Number | Measure |
| Per Capita Income | 102,482 | $29,940 |
| Median Family Income | 23,077 | $73,795 |
| Mean Family Income | 23,077 | $93,562 |
| Median Household Income | 37,676 | $55,584 |
| Mean Household Income | 37,676 | $76,967 |
| Income Deficit | 23,077 | $10,795 |
| Wage / Income Gap (%) | 102,482 | 24.19% |
| Wage / Income Gap ($) | 102,482 | 75.81¢ per $1 |
| Gini / Inequality Index | 102,482 | 0.47 |
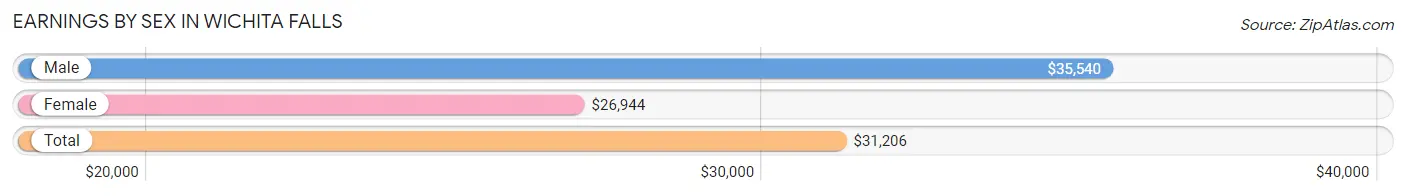
Earnings by Sex in Wichita Falls
Average Earnings in Wichita Falls are $31,206, $35,540 for men and $26,944 for women, a difference of 24.2%.
| Sex | Number | Average Earnings |
| Male | 30,050 (55.3%) | $35,540 |
| Female | 24,329 (44.7%) | $26,944 |
| Total | 54,379 (100.0%) | $31,206 |
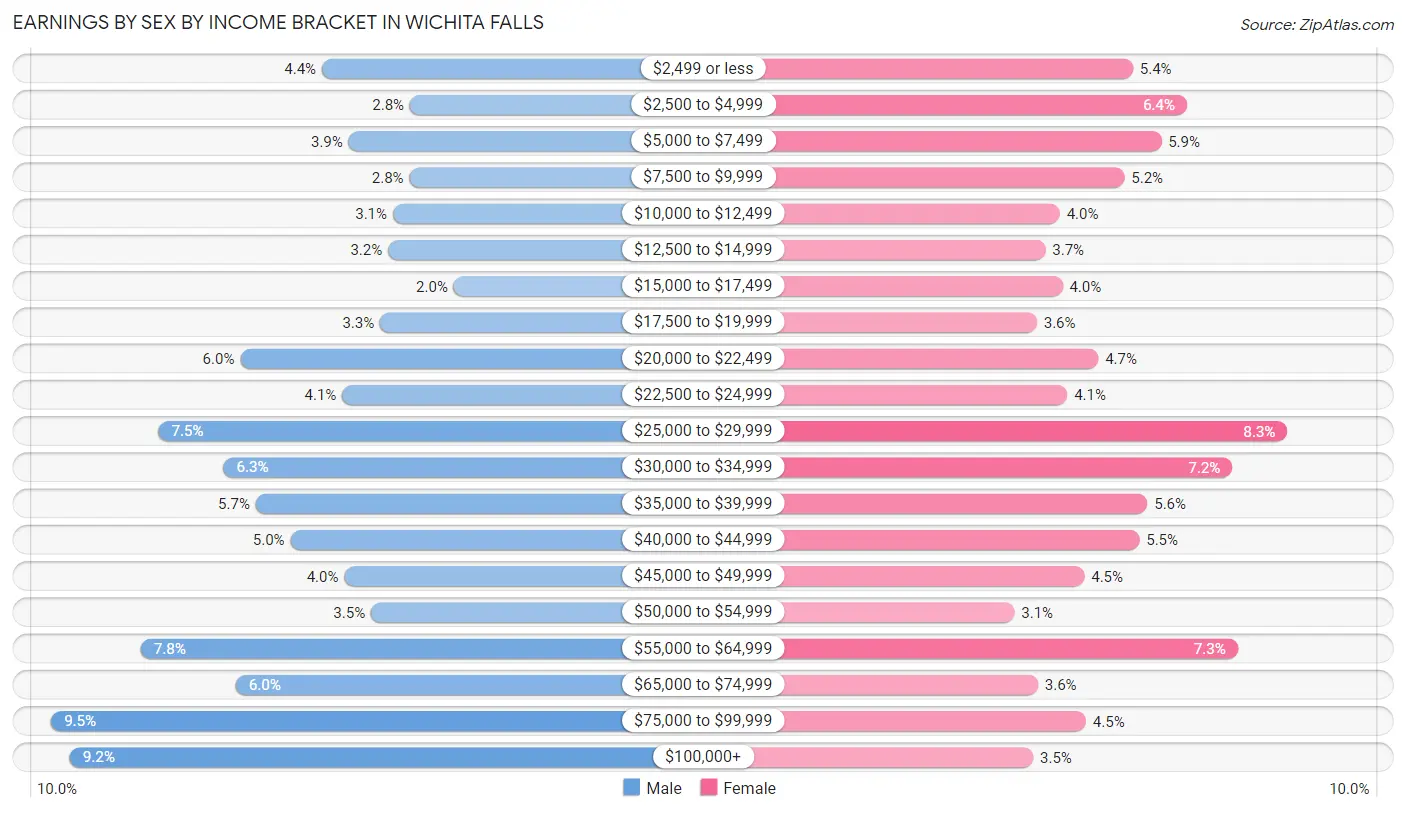
Earnings by Sex by Income Bracket in Wichita Falls
The most common earnings brackets in Wichita Falls are $75,000 to $99,999 for men (2,855 | 9.5%) and $25,000 to $29,999 for women (2,007 | 8.3%).
| Income | Male | Female |
| $2,499 or less | 1,331 (4.4%) | 1,304 (5.4%) |
| $2,500 to $4,999 | 835 (2.8%) | 1,550 (6.4%) |
| $5,000 to $7,499 | 1,182 (3.9%) | 1,434 (5.9%) |
| $7,500 to $9,999 | 839 (2.8%) | 1,264 (5.2%) |
| $10,000 to $12,499 | 932 (3.1%) | 970 (4.0%) |
| $12,500 to $14,999 | 960 (3.2%) | 904 (3.7%) |
| $15,000 to $17,499 | 588 (2.0%) | 982 (4.0%) |
| $17,500 to $19,999 | 1,003 (3.3%) | 865 (3.6%) |
| $20,000 to $22,499 | 1,790 (6.0%) | 1,147 (4.7%) |
| $22,500 to $24,999 | 1,216 (4.1%) | 1,005 (4.1%) |
| $25,000 to $29,999 | 2,251 (7.5%) | 2,007 (8.3%) |
| $30,000 to $34,999 | 1,883 (6.3%) | 1,757 (7.2%) |
| $35,000 to $39,999 | 1,703 (5.7%) | 1,369 (5.6%) |
| $40,000 to $44,999 | 1,509 (5.0%) | 1,334 (5.5%) |
| $45,000 to $49,999 | 1,206 (4.0%) | 1,082 (4.4%) |
| $50,000 to $54,999 | 1,055 (3.5%) | 764 (3.1%) |
| $55,000 to $64,999 | 2,349 (7.8%) | 1,781 (7.3%) |
| $65,000 to $74,999 | 1,814 (6.0%) | 871 (3.6%) |
| $75,000 to $99,999 | 2,855 (9.5%) | 1,089 (4.5%) |
| $100,000+ | 2,749 (9.1%) | 850 (3.5%) |
| Total | 30,050 (100.0%) | 24,329 (100.0%) |
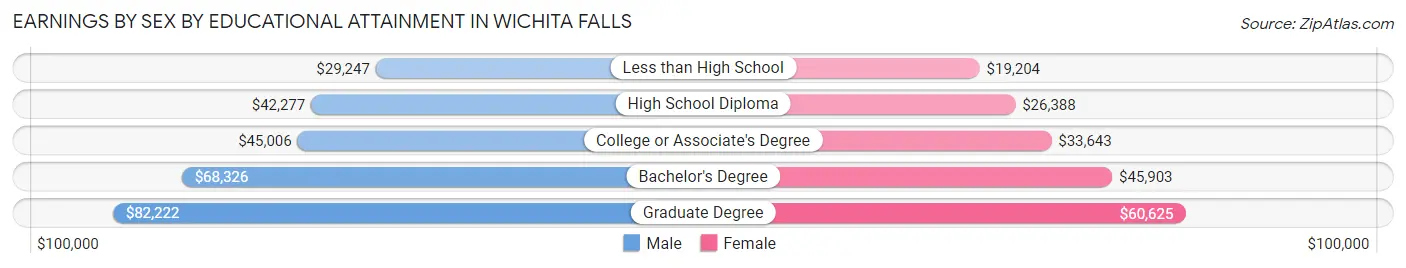
Earnings by Sex by Educational Attainment in Wichita Falls
Average earnings in Wichita Falls are $46,489 for men and $32,735 for women, a difference of 29.6%. Men with an educational attainment of graduate degree enjoy the highest average annual earnings of $82,222, while those with less than high school education earn the least with $29,247. Women with an educational attainment of graduate degree earn the most with the average annual earnings of $60,625, while those with less than high school education have the smallest earnings of $19,204.
| Educational Attainment | Male Income | Female Income |
| Less than High School | $29,247 | $19,204 |
| High School Diploma | $42,277 | $26,388 |
| College or Associate's Degree | $45,006 | $33,643 |
| Bachelor's Degree | $68,326 | $45,903 |
| Graduate Degree | $82,222 | $60,625 |
| Total | $46,489 | $32,735 |
Family Income in Wichita Falls
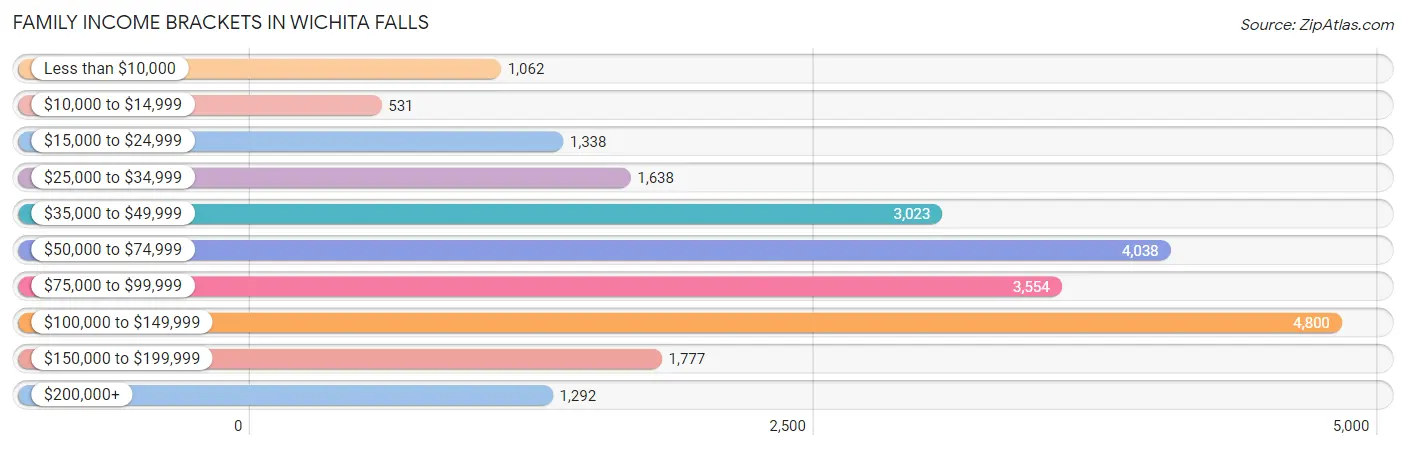
Family Income Brackets in Wichita Falls
According to the Wichita Falls family income data, there are 4,800 families falling into the $100,000 to $149,999 income range, which is the most common income bracket and makes up 20.8% of all families. Conversely, the $10,000 to $14,999 income bracket is the least frequent group with only 531 families (2.3%) belonging to this category.
| Income Bracket | # Families | % Families |
| Less than $10,000 | 1,062 | 4.6% |
| $10,000 to $14,999 | 531 | 2.3% |
| $15,000 to $24,999 | 1,338 | 5.8% |
| $25,000 to $34,999 | 1,638 | 7.1% |
| $35,000 to $49,999 | 3,023 | 13.1% |
| $50,000 to $74,999 | 4,038 | 17.5% |
| $75,000 to $99,999 | 3,554 | 15.4% |
| $100,000 to $149,999 | 4,800 | 20.8% |
| $150,000 to $199,999 | 1,777 | 7.7% |
| $200,000+ | 1,292 | 5.6% |
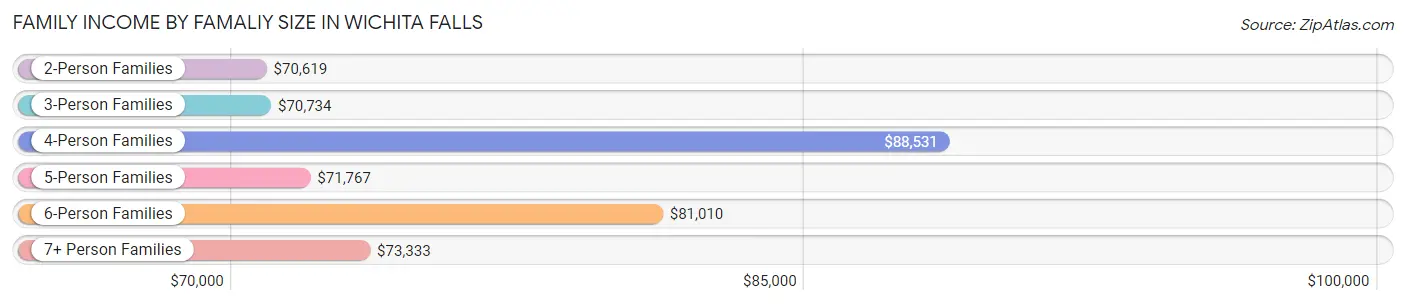
Family Income by Famaliy Size in Wichita Falls
4-person families (3,447 | 14.9%) account for the highest median family income in Wichita Falls with $88,531 per family, while 2-person families (12,265 | 53.1%) have the highest median income of $35,310 per family member.
| Income Bracket | # Families | Median Income |
| 2-Person Families | 12,265 (53.1%) | $70,619 |
| 3-Person Families | 4,843 (21.0%) | $70,734 |
| 4-Person Families | 3,447 (14.9%) | $88,531 |
| 5-Person Families | 1,657 (7.2%) | $71,767 |
| 6-Person Families | 533 (2.3%) | $81,010 |
| 7+ Person Families | 332 (1.4%) | $73,333 |
| Total | 23,077 (100.0%) | $73,795 |
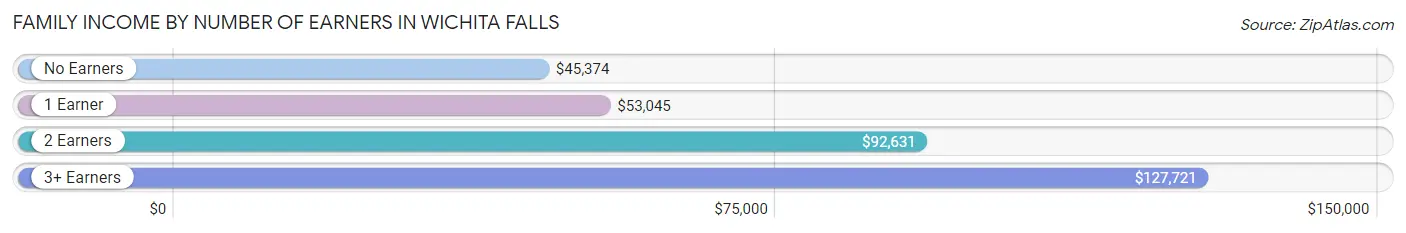
Family Income by Number of Earners in Wichita Falls
The median family income in Wichita Falls is $73,795, with families comprising 3+ earners (1,665) having the highest median family income of $127,721, while families with no earners (2,855) have the lowest median family income of $45,374, accounting for 7.2% and 12.4% of families, respectively.
| Number of Earners | # Families | Median Income |
| No Earners | 2,855 (12.4%) | $45,374 |
| 1 Earner | 8,133 (35.2%) | $53,045 |
| 2 Earners | 10,424 (45.2%) | $92,631 |
| 3+ Earners | 1,665 (7.2%) | $127,721 |
| Total | 23,077 (100.0%) | $73,795 |
Household Income in Wichita Falls
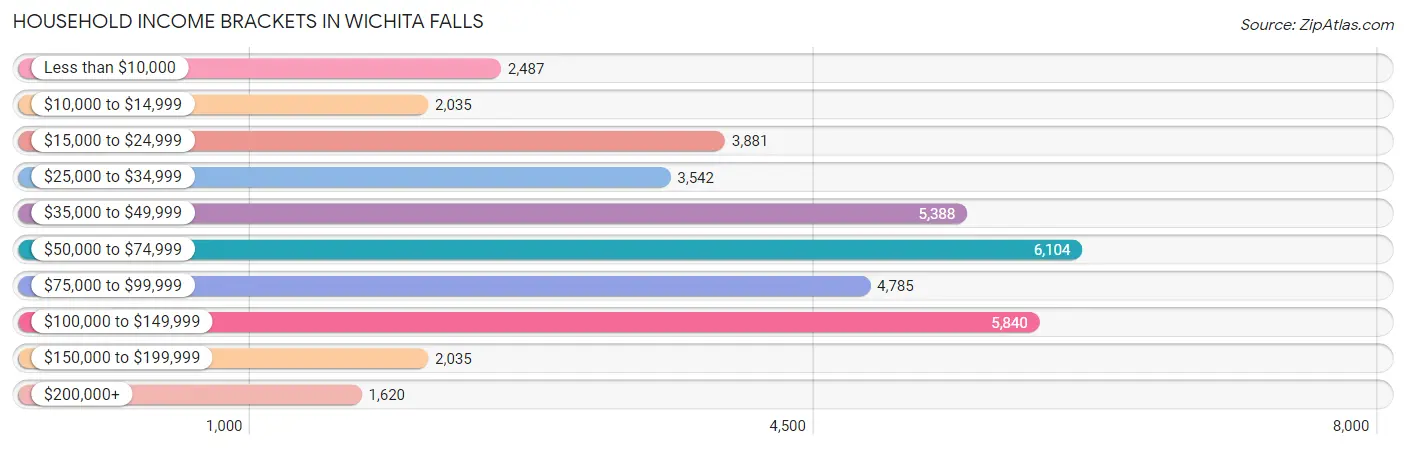
Household Income Brackets in Wichita Falls
With 6,104 households falling in the category, the $50,000 to $74,999 income range is the most frequent in Wichita Falls, accounting for 16.2% of all households. In contrast, only 1,620 households (4.3%) fall into the $200,000+ income bracket, making it the least populous group.
| Income Bracket | # Households | % Households |
| Less than $10,000 | 2,487 | 6.6% |
| $10,000 to $14,999 | 2,035 | 5.4% |
| $15,000 to $24,999 | 3,881 | 10.3% |
| $25,000 to $34,999 | 3,542 | 9.4% |
| $35,000 to $49,999 | 5,388 | 14.3% |
| $50,000 to $74,999 | 6,104 | 16.2% |
| $75,000 to $99,999 | 4,785 | 12.7% |
| $100,000 to $149,999 | 5,840 | 15.5% |
| $150,000 to $199,999 | 2,035 | 5.4% |
| $200,000+ | 1,620 | 4.3% |
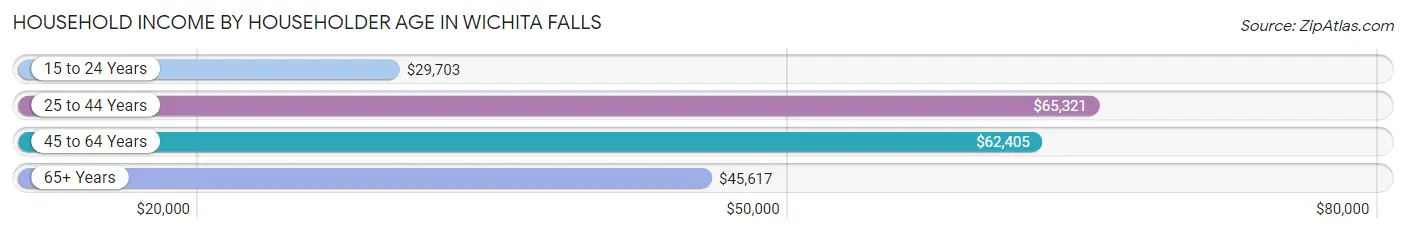
Household Income by Householder Age in Wichita Falls
The median household income in Wichita Falls is $55,584, with the highest median household income of $65,321 found in the 25 to 44 years age bracket for the primary householder. A total of 13,614 households (36.1%) fall into this category. Meanwhile, the 15 to 24 years age bracket for the primary householder has the lowest median household income of $29,703, with 2,695 households (7.1%) in this group.
| Income Bracket | # Households | Median Income |
| 15 to 24 Years | 2,695 (7.1%) | $29,703 |
| 25 to 44 Years | 13,614 (36.1%) | $65,321 |
| 45 to 64 Years | 11,894 (31.6%) | $62,405 |
| 65+ Years | 9,473 (25.1%) | $45,617 |
| Total | 37,676 (100.0%) | $55,584 |
Poverty in Wichita Falls
Income Below Poverty by Sex and Age in Wichita Falls
With 15.3% poverty level for males and 20.1% for females among the residents of Wichita Falls, 12 to 14 year old males and 18 to 24 year old females are the most vulnerable to poverty, with 549 males (29.5%) and 1,495 females (32.5%) in their respective age groups living below the poverty level.
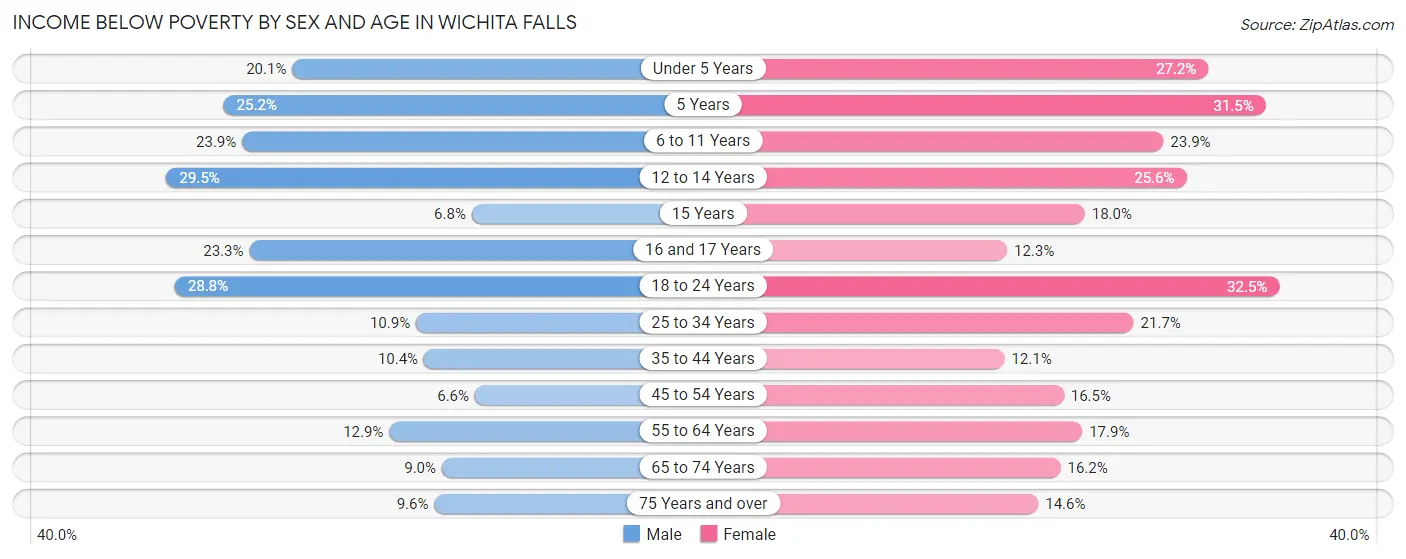
| Age Bracket | Male | Female |
| Under 5 Years | 663 (20.1%) | 830 (27.2%) |
| 5 Years | 175 (25.2%) | 123 (31.5%) |
| 6 to 11 Years | 970 (23.8%) | 995 (23.9%) |
| 12 to 14 Years | 549 (29.5%) | 485 (25.6%) |
| 15 Years | 37 (6.8%) | 101 (18.0%) |
| 16 and 17 Years | 268 (23.3%) | 153 (12.3%) |
| 18 to 24 Years | 1,265 (28.8%) | 1,495 (32.5%) |
| 25 to 34 Years | 798 (10.9%) | 1,485 (21.7%) |
| 35 to 44 Years | 570 (10.3%) | 665 (12.1%) |
| 45 to 54 Years | 293 (6.6%) | 784 (16.5%) |
| 55 to 64 Years | 656 (12.9%) | 1,004 (17.8%) |
| 65 to 74 Years | 341 (9.0%) | 678 (16.2%) |
| 75 Years and over | 209 (9.6%) | 491 (14.6%) |
| Total | 6,794 (15.3%) | 9,289 (20.1%) |
Income Above Poverty by Sex and Age in Wichita Falls
According to the poverty statistics in Wichita Falls, males aged 45 to 54 years and females aged 35 to 44 years are the age groups that are most secure financially, with 93.4% of males and 87.9% of females in these age groups living above the poverty line.
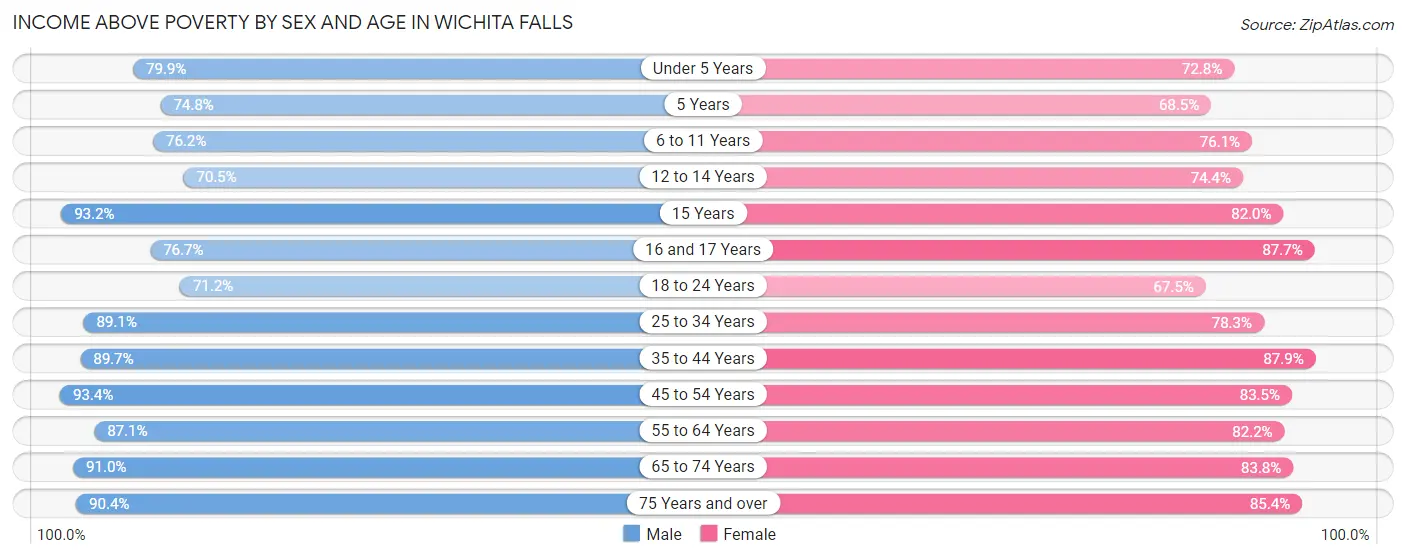
| Age Bracket | Male | Female |
| Under 5 Years | 2,630 (79.9%) | 2,222 (72.8%) |
| 5 Years | 519 (74.8%) | 268 (68.5%) |
| 6 to 11 Years | 3,097 (76.1%) | 3,172 (76.1%) |
| 12 to 14 Years | 1,314 (70.5%) | 1,411 (74.4%) |
| 15 Years | 507 (93.2%) | 459 (82.0%) |
| 16 and 17 Years | 881 (76.7%) | 1,094 (87.7%) |
| 18 to 24 Years | 3,122 (71.2%) | 3,109 (67.5%) |
| 25 to 34 Years | 6,495 (89.1%) | 5,367 (78.3%) |
| 35 to 44 Years | 4,937 (89.6%) | 4,838 (87.9%) |
| 45 to 54 Years | 4,170 (93.4%) | 3,974 (83.5%) |
| 55 to 64 Years | 4,419 (87.1%) | 4,621 (82.2%) |
| 65 to 74 Years | 3,441 (91.0%) | 3,497 (83.8%) |
| 75 Years and over | 1,973 (90.4%) | 2,874 (85.4%) |
| Total | 37,505 (84.7%) | 36,906 (79.9%) |
Income Below Poverty Among Married-Couple Families in Wichita Falls
The poverty statistics for married-couple families in Wichita Falls show that 4.8% or 742 of the total 15,370 families live below the poverty line. Families with 5 or more children have the highest poverty rate of 44.9%, comprising of 35 families. On the other hand, families with no children have the lowest poverty rate of 3.4%, which includes 304 families.
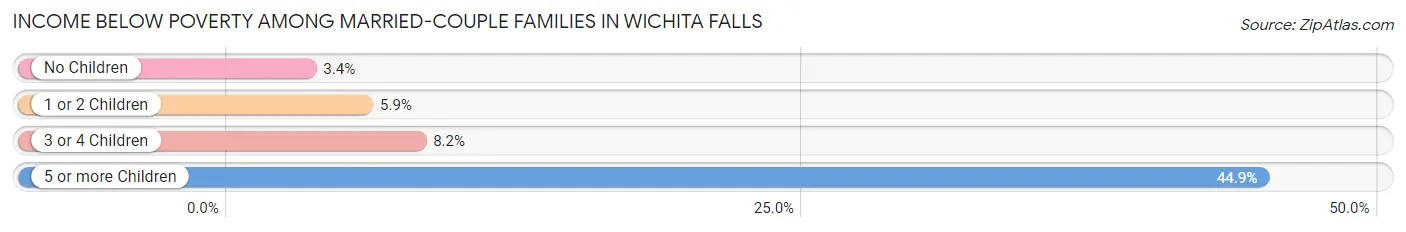
| Children | Above Poverty | Below Poverty |
| No Children | 8,599 (96.6%) | 304 (3.4%) |
| 1 or 2 Children | 4,899 (94.1%) | 306 (5.9%) |
| 3 or 4 Children | 1,087 (91.8%) | 97 (8.2%) |
| 5 or more Children | 43 (55.1%) | 35 (44.9%) |
| Total | 14,628 (95.2%) | 742 (4.8%) |
Income Below Poverty Among Single-Parent Households in Wichita Falls
According to the poverty data in Wichita Falls, 15.6% or 392 single-father households and 31.7% or 1,645 single-mother households are living below the poverty line. Among single-father households, those with 5 or more children have the highest poverty rate, with 53 households (100.0%) experiencing poverty. Likewise, among single-mother households, those with 5 or more children have the highest poverty rate, with 86 households (86.9%) falling below the poverty line.
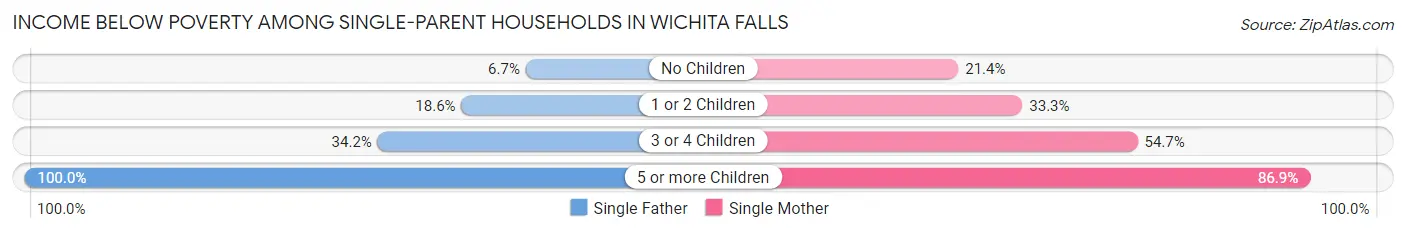
| Children | Single Father | Single Mother |
| No Children | 82 (6.7%) | 465 (21.3%) |
| 1 or 2 Children | 194 (18.6%) | 782 (33.3%) |
| 3 or 4 Children | 63 (34.2%) | 312 (54.7%) |
| 5 or more Children | 53 (100.0%) | 86 (86.9%) |
| Total | 392 (15.6%) | 1,645 (31.7%) |
Income Below Poverty Among Married-Couple vs Single-Parent Households in Wichita Falls
The poverty data for Wichita Falls shows that 742 of the married-couple family households (4.8%) and 2,037 of the single-parent households (26.4%) are living below the poverty level. Within the married-couple family households, those with 5 or more children have the highest poverty rate, with 35 households (44.9%) falling below the poverty line. Among the single-parent households, those with 5 or more children have the highest poverty rate, with 139 household (91.4%) living below poverty.
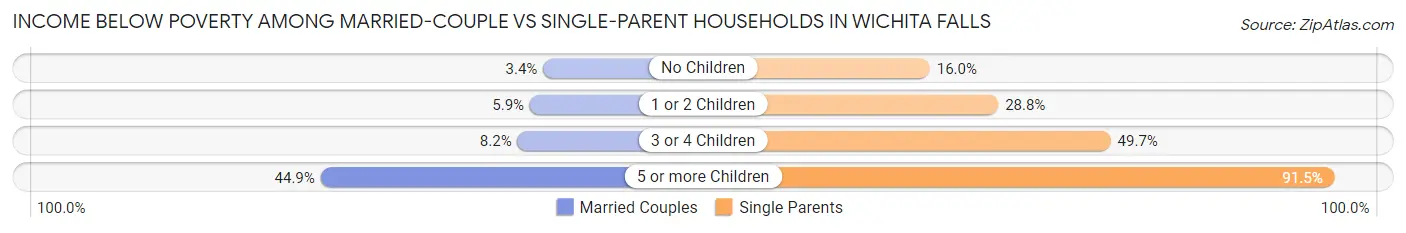
| Children | Married-Couple Families | Single-Parent Households |
| No Children | 304 (3.4%) | 547 (16.0%) |
| 1 or 2 Children | 306 (5.9%) | 976 (28.8%) |
| 3 or 4 Children | 97 (8.2%) | 375 (49.7%) |
| 5 or more Children | 35 (44.9%) | 139 (91.4%) |
| Total | 742 (4.8%) | 2,037 (26.4%) |
Race in Wichita Falls
The most populous races in Wichita Falls are White / Caucasian (74,051 | 72.3%), Hispanic or Latino (22,831 | 22.3%), and Black / African American (12,757 | 12.4%).
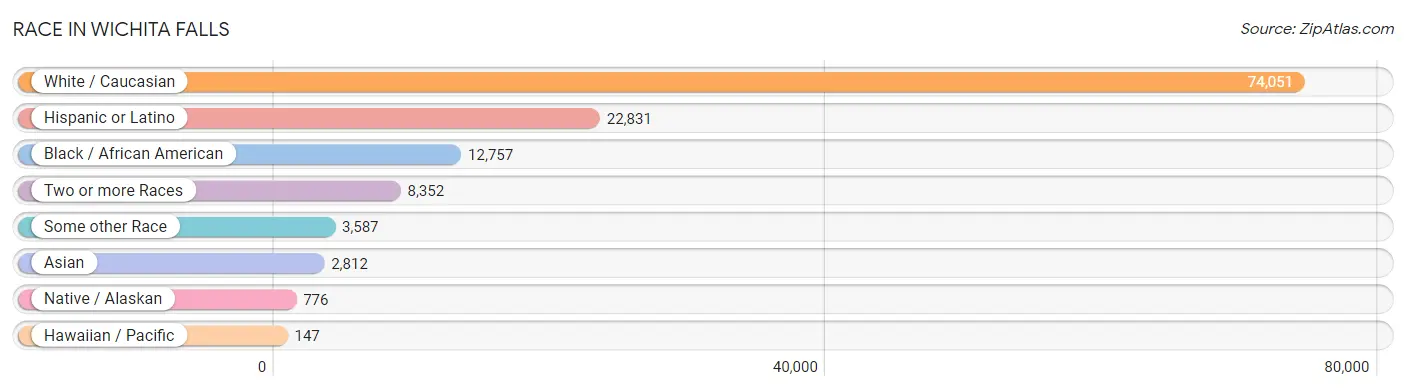
| Race | # Population | % Population |
| Asian | 2,812 | 2.7% |
| Black / African American | 12,757 | 12.4% |
| Hawaiian / Pacific | 147 | 0.1% |
| Hispanic or Latino | 22,831 | 22.3% |
| Native / Alaskan | 776 | 0.8% |
| White / Caucasian | 74,051 | 72.3% |
| Two or more Races | 8,352 | 8.2% |
| Some other Race | 3,587 | 3.5% |
| Total | 102,482 | 100.0% |
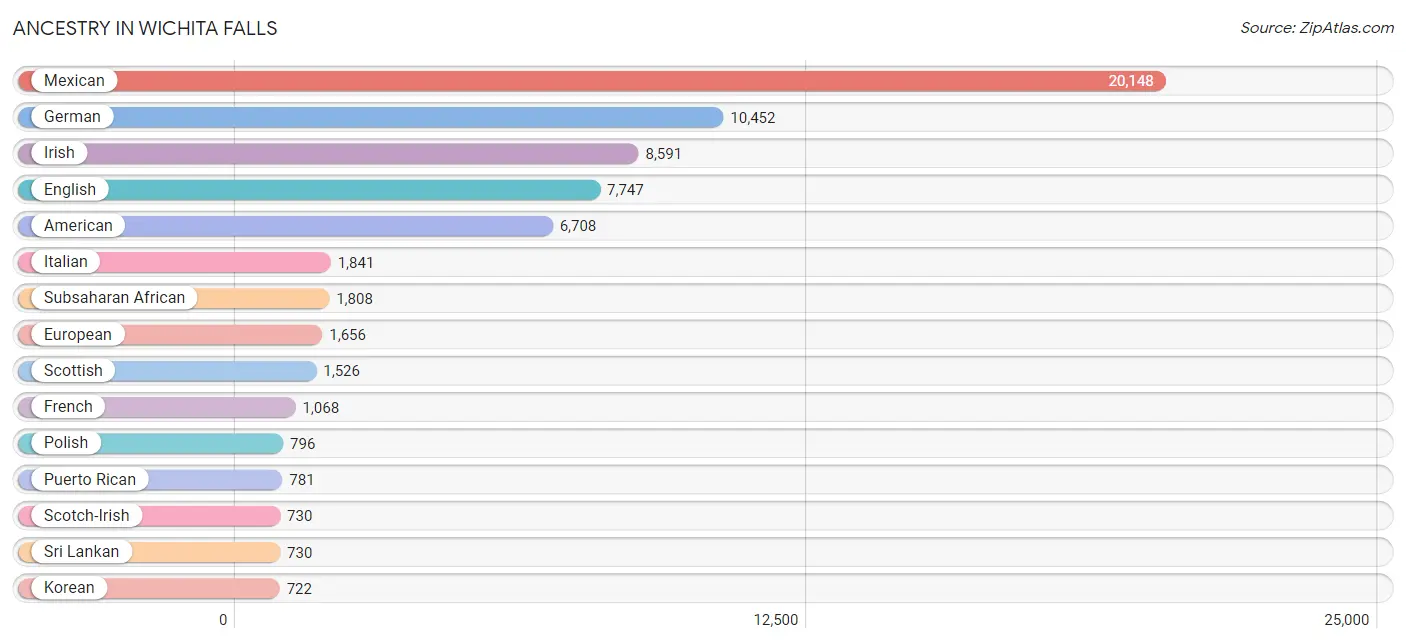
Ancestry in Wichita Falls
The most populous ancestries reported in Wichita Falls are Mexican (20,148 | 19.7%), German (10,452 | 10.2%), Irish (8,591 | 8.4%), English (7,747 | 7.6%), and American (6,708 | 6.6%), together accounting for 52.3% of all Wichita Falls residents.
| Ancestry | # Population | % Population |
| African | 694 | 0.7% |
| American | 6,708 | 6.6% |
| Apache | 168 | 0.2% |
| Arab | 161 | 0.2% |
| Arapaho | 10 | 0.0% |
| Armenian | 16 | 0.0% |
| Assyrian / Chaldean / Syriac | 43 | 0.0% |
| Australian | 3 | 0.0% |
| Austrian | 45 | 0.0% |
| Bahamian | 13 | 0.0% |
| Belgian | 12 | 0.0% |
| Bhutanese | 340 | 0.3% |
| Blackfeet | 82 | 0.1% |
| Brazilian | 54 | 0.1% |
| British | 376 | 0.4% |
| British West Indian | 104 | 0.1% |
| Burmese | 507 | 0.5% |
| Cajun | 73 | 0.1% |
| Canadian | 60 | 0.1% |
| Central American | 458 | 0.4% |
| Central American Indian | 149 | 0.2% |
| Cherokee | 241 | 0.2% |
| Chickasaw | 77 | 0.1% |
| Chilean | 10 | 0.0% |
| Chippewa | 23 | 0.0% |
| Choctaw | 267 | 0.3% |
| Colombian | 125 | 0.1% |
| Comanche | 66 | 0.1% |
| Creek | 47 | 0.1% |
| Croatian | 105 | 0.1% |
| Cuban | 235 | 0.2% |
| Czech | 288 | 0.3% |
| Czechoslovakian | 122 | 0.1% |
| Danish | 216 | 0.2% |
| Dominican | 63 | 0.1% |
| Dutch | 654 | 0.6% |
| Dutch West Indian | 7 | 0.0% |
| Eastern European | 22 | 0.0% |
| Ecuadorian | 7 | 0.0% |
| Egyptian | 2 | 0.0% |
| English | 7,747 | 7.6% |
| Estonian | 5 | 0.0% |
| European | 1,656 | 1.6% |
| Finnish | 141 | 0.1% |
| French | 1,068 | 1.0% |
| French Canadian | 327 | 0.3% |
| German | 10,452 | 10.2% |
| Ghanaian | 36 | 0.0% |
| Greek | 96 | 0.1% |
| Guamanian / Chamorro | 58 | 0.1% |
| Guatemalan | 171 | 0.2% |
| Honduran | 81 | 0.1% |
| Hungarian | 63 | 0.1% |
| Indian (Asian) | 359 | 0.4% |
| Indonesian | 18 | 0.0% |
| Iranian | 8 | 0.0% |
| Irish | 8,591 | 8.4% |
| Iroquois | 2 | 0.0% |
| Italian | 1,841 | 1.8% |
| Jamaican | 85 | 0.1% |
| Japanese | 320 | 0.3% |
| Kiowa | 10 | 0.0% |
| Korean | 722 | 0.7% |
| Lebanese | 159 | 0.2% |
| Lithuanian | 134 | 0.1% |
| Lumbee | 24 | 0.0% |
| Malaysian | 27 | 0.0% |
| Mexican | 20,148 | 19.7% |
| Mexican American Indian | 170 | 0.2% |
| Native Hawaiian | 88 | 0.1% |
| Navajo | 24 | 0.0% |
| Nicaraguan | 13 | 0.0% |
| Nigerian | 493 | 0.5% |
| Northern European | 41 | 0.0% |
| Norwegian | 606 | 0.6% |
| Pakistani | 200 | 0.2% |
| Panamanian | 46 | 0.0% |
| Pennsylvania German | 6 | 0.0% |
| Peruvian | 41 | 0.0% |
| Pima | 21 | 0.0% |
| Polish | 796 | 0.8% |
| Portuguese | 128 | 0.1% |
| Puerto Rican | 781 | 0.8% |
| Romanian | 20 | 0.0% |
| Russian | 134 | 0.1% |
| Salvadoran | 147 | 0.1% |
| Samoan | 39 | 0.0% |
| Scandinavian | 295 | 0.3% |
| Scotch-Irish | 730 | 0.7% |
| Scottish | 1,526 | 1.5% |
| Seminole | 27 | 0.0% |
| Serbian | 132 | 0.1% |
| Sioux | 29 | 0.0% |
| Slavic | 26 | 0.0% |
| Slovak | 14 | 0.0% |
| Slovene | 14 | 0.0% |
| Somali | 7 | 0.0% |
| South African | 48 | 0.1% |
| South American | 278 | 0.3% |
| South American Indian | 25 | 0.0% |
| Spaniard | 213 | 0.2% |
| Spanish | 303 | 0.3% |
| Spanish American | 5 | 0.0% |
| Spanish American Indian | 7 | 0.0% |
| Sri Lankan | 730 | 0.7% |
| Subsaharan African | 1,808 | 1.8% |
| Sudanese | 5 | 0.0% |
| Swedish | 697 | 0.7% |
| Swiss | 86 | 0.1% |
| Thai | 440 | 0.4% |
| Tlingit-Haida | 27 | 0.0% |
| Trinidadian and Tobagonian | 7 | 0.0% |
| Ugandan | 10 | 0.0% |
| Ukrainian | 24 | 0.0% |
| Venezuelan | 95 | 0.1% |
| Welsh | 340 | 0.3% |
| West Indian | 84 | 0.1% |
| Yugoslavian | 13 | 0.0% |
| Zimbabwean | 54 | 0.1% | View All 119 Rows |
Immigrants in Wichita Falls
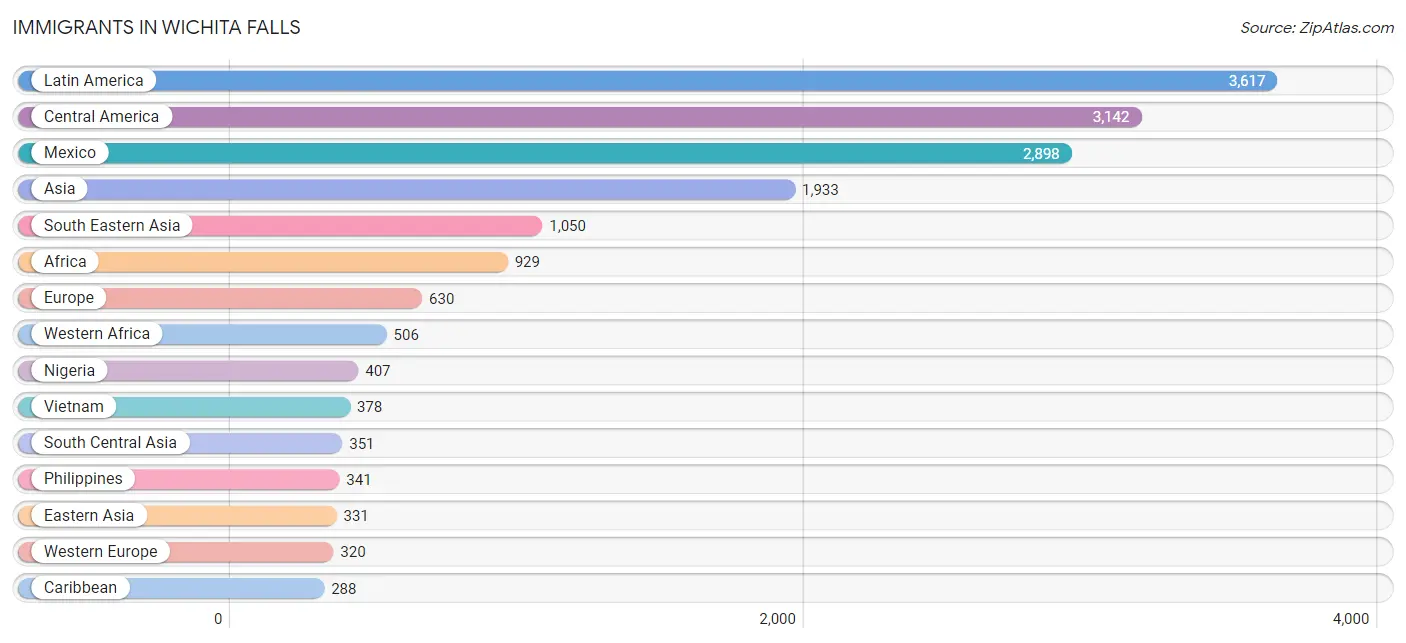
The most numerous immigrant groups reported in Wichita Falls came from Latin America (3,617 | 3.5%), Central America (3,142 | 3.1%), Mexico (2,898 | 2.8%), Asia (1,933 | 1.9%), and South Eastern Asia (1,050 | 1.0%), together accounting for 12.3% of all Wichita Falls residents.
| Immigration Origin | # Population | % Population |
| Africa | 929 | 0.9% |
| Asia | 1,933 | 1.9% |
| Australia | 26 | 0.0% |
| Bahamas | 60 | 0.1% |
| Bangladesh | 35 | 0.0% |
| Belgium | 12 | 0.0% |
| Brazil | 16 | 0.0% |
| Cambodia | 151 | 0.2% |
| Cameroon | 207 | 0.2% |
| Canada | 86 | 0.1% |
| Caribbean | 288 | 0.3% |
| Central America | 3,142 | 3.1% |
| Chile | 10 | 0.0% |
| China | 177 | 0.2% |
| Colombia | 65 | 0.1% |
| Croatia | 19 | 0.0% |
| Cuba | 32 | 0.0% |
| Czechoslovakia | 5 | 0.0% |
| Denmark | 5 | 0.0% |
| Dominica | 30 | 0.0% |
| Eastern Africa | 125 | 0.1% |
| Eastern Asia | 331 | 0.3% |
| Eastern Europe | 30 | 0.0% |
| Ecuador | 7 | 0.0% |
| El Salvador | 72 | 0.1% |
| England | 65 | 0.1% |
| Europe | 630 | 0.6% |
| France | 28 | 0.0% |
| Germany | 260 | 0.3% |
| Ghana | 21 | 0.0% |
| Greece | 19 | 0.0% |
| Grenada | 83 | 0.1% |
| Guatemala | 151 | 0.2% |
| Guyana | 17 | 0.0% |
| Honduras | 8 | 0.0% |
| Hong Kong | 14 | 0.0% |
| India | 194 | 0.2% |
| Iran | 8 | 0.0% |
| Ireland | 31 | 0.0% |
| Italy | 38 | 0.0% |
| Jamaica | 24 | 0.0% |
| Japan | 71 | 0.1% |
| Kenya | 22 | 0.0% |
| Korea | 83 | 0.1% |
| Laos | 6 | 0.0% |
| Latin America | 3,617 | 3.5% |
| Malaysia | 46 | 0.0% |
| Mexico | 2,898 | 2.8% |
| Middle Africa | 247 | 0.2% |
| Nepal | 65 | 0.1% |
| Netherlands | 20 | 0.0% |
| Nicaragua | 13 | 0.0% |
| Nigeria | 407 | 0.4% |
| Northern Europe | 167 | 0.2% |
| Oceania | 26 | 0.0% |
| Pakistan | 49 | 0.1% |
| Peru | 29 | 0.0% |
| Philippines | 341 | 0.3% |
| Russia | 6 | 0.0% |
| Saudi Arabia | 201 | 0.2% |
| Somalia | 7 | 0.0% |
| South Africa | 12 | 0.0% |
| South America | 187 | 0.2% |
| South Central Asia | 351 | 0.3% |
| South Eastern Asia | 1,050 | 1.0% |
| Southern Europe | 57 | 0.1% |
| Sweden | 9 | 0.0% |
| Thailand | 120 | 0.1% |
| Trinidad and Tobago | 11 | 0.0% |
| Venezuela | 43 | 0.0% |
| Vietnam | 378 | 0.4% |
| Western Africa | 506 | 0.5% |
| Western Asia | 201 | 0.2% |
| Western Europe | 320 | 0.3% |
| Zaire | 25 | 0.0% |
| Zimbabwe | 96 | 0.1% | View All 76 Rows |
Sex and Age in Wichita Falls
Sex and Age in Wichita Falls
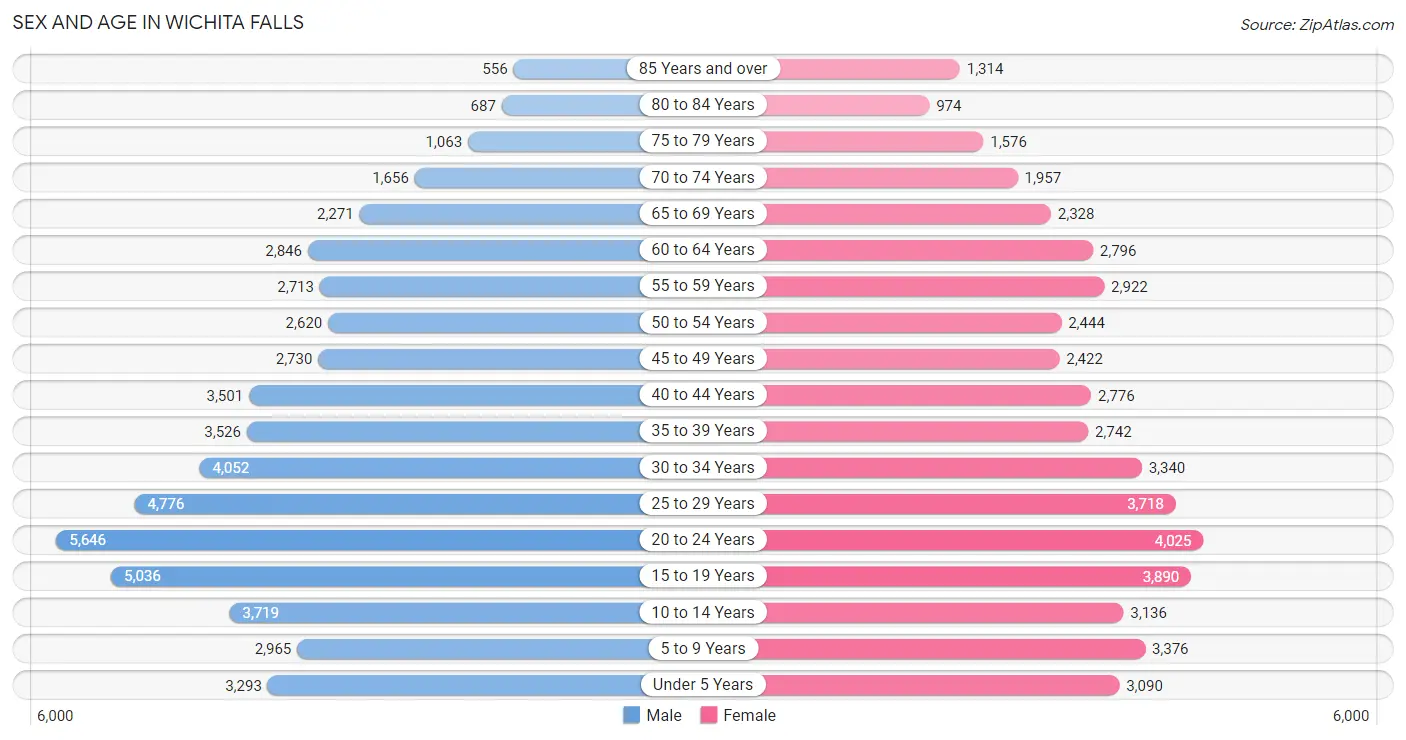
The most populous age groups in Wichita Falls are 20 to 24 Years (5,646 | 10.5%) for men and 20 to 24 Years (4,025 | 8.2%) for women.
| Age Bracket | Male | Female |
| Under 5 Years | 3,293 (6.1%) | 3,090 (6.3%) |
| 5 to 9 Years | 2,965 (5.5%) | 3,376 (6.9%) |
| 10 to 14 Years | 3,719 (6.9%) | 3,136 (6.4%) |
| 15 to 19 Years | 5,036 (9.4%) | 3,890 (8.0%) |
| 20 to 24 Years | 5,646 (10.5%) | 4,025 (8.2%) |
| 25 to 29 Years | 4,776 (8.9%) | 3,718 (7.6%) |
| 30 to 34 Years | 4,052 (7.5%) | 3,340 (6.8%) |
| 35 to 39 Years | 3,526 (6.6%) | 2,742 (5.6%) |
| 40 to 44 Years | 3,501 (6.5%) | 2,776 (5.7%) |
| 45 to 49 Years | 2,730 (5.1%) | 2,422 (5.0%) |
| 50 to 54 Years | 2,620 (4.9%) | 2,444 (5.0%) |
| 55 to 59 Years | 2,713 (5.1%) | 2,922 (6.0%) |
| 60 to 64 Years | 2,846 (5.3%) | 2,796 (5.7%) |
| 65 to 69 Years | 2,271 (4.2%) | 2,328 (4.8%) |
| 70 to 74 Years | 1,656 (3.1%) | 1,957 (4.0%) |
| 75 to 79 Years | 1,063 (2.0%) | 1,576 (3.2%) |
| 80 to 84 Years | 687 (1.3%) | 974 (2.0%) |
| 85 Years and over | 556 (1.0%) | 1,314 (2.7%) |
| Total | 53,656 (100.0%) | 48,826 (100.0%) |
Families and Households in Wichita Falls
Median Family Size in Wichita Falls
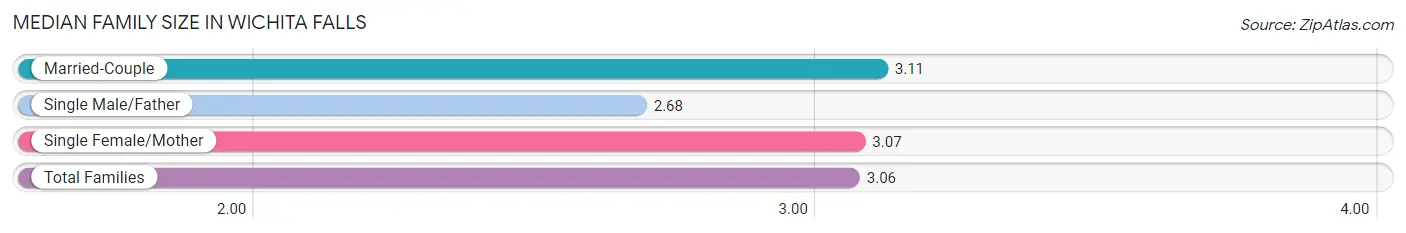
The median family size in Wichita Falls is 3.06 persons per family, with married-couple families (15,370 | 66.6%) accounting for the largest median family size of 3.11 persons per family. On the other hand, single male/father families (2,510 | 10.9%) represent the smallest median family size with 2.68 persons per family.
| Family Type | # Families | Family Size |
| Married-Couple | 15,370 (66.6%) | 3.11 |
| Single Male/Father | 2,510 (10.9%) | 2.68 |
| Single Female/Mother | 5,197 (22.5%) | 3.07 |
| Total Families | 23,077 (100.0%) | 3.06 |
Median Household Size in Wichita Falls
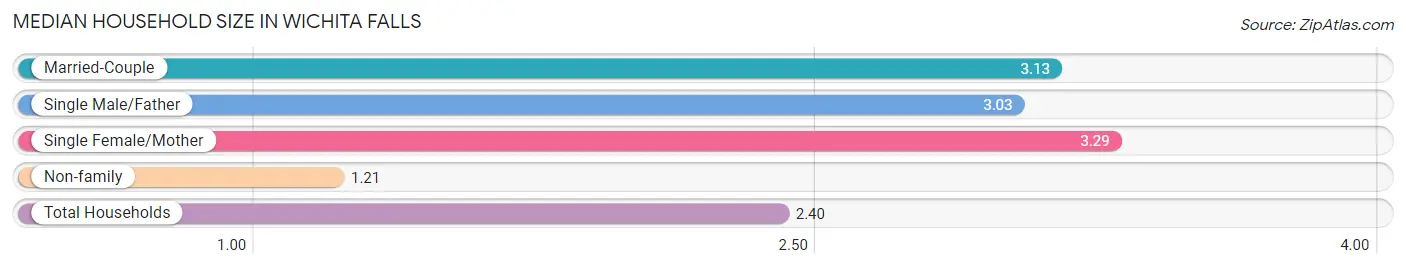
The median household size in Wichita Falls is 2.40 persons per household, with single female/mother households (5,197 | 13.8%) accounting for the largest median household size of 3.29 persons per household. non-family households (14,599 | 38.8%) represent the smallest median household size with 1.21 persons per household.
| Household Type | # Households | Household Size |
| Married-Couple | 15,370 (40.8%) | 3.13 |
| Single Male/Father | 2,510 (6.7%) | 3.03 |
| Single Female/Mother | 5,197 (13.8%) | 3.29 |
| Non-family | 14,599 (38.8%) | 1.21 |
| Total Households | 37,676 (100.0%) | 2.40 |
Household Size by Marriage Status in Wichita Falls
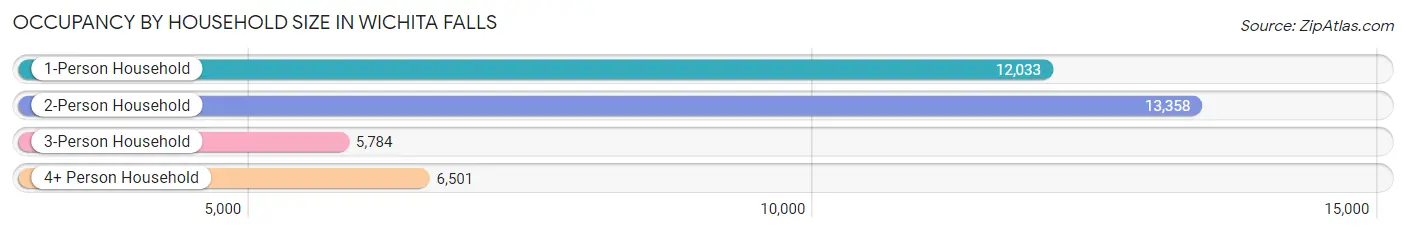
Out of a total of 37,676 households in Wichita Falls, 23,077 (61.3%) are family households, while 14,599 (38.8%) are nonfamily households. The most numerous type of family households are 2-person households, comprising 11,035, and the most common type of nonfamily households are 1-person households, comprising 12,033.
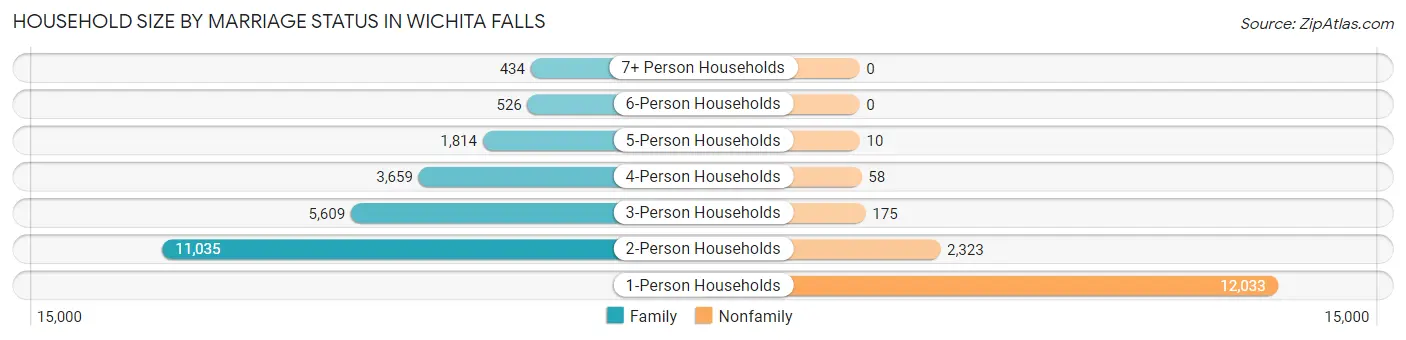
| Household Size | Family Households | Nonfamily Households |
| 1-Person Households | - | 12,033 (31.9%) |
| 2-Person Households | 11,035 (29.3%) | 2,323 (6.2%) |
| 3-Person Households | 5,609 (14.9%) | 175 (0.5%) |
| 4-Person Households | 3,659 (9.7%) | 58 (0.2%) |
| 5-Person Households | 1,814 (4.8%) | 10 (0.0%) |
| 6-Person Households | 526 (1.4%) | 0 (0.0%) |
| 7+ Person Households | 434 (1.1%) | 0 (0.0%) |
| Total | 23,077 (61.3%) | 14,599 (38.8%) |
Female Fertility in Wichita Falls
Fertility by Age in Wichita Falls
Average fertility rate in Wichita Falls is 42.0 births per 1,000 women. Women in the age bracket of 20 to 34 years have the highest fertility rate with 70.0 births per 1,000 women. Women in the age bracket of 20 to 34 years acount for 78.2% of all women with births.
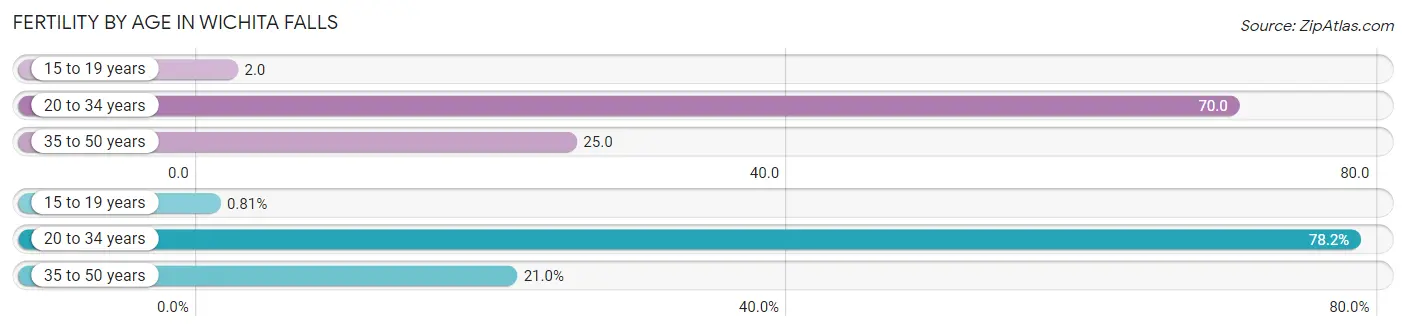
| Age Bracket | Women with Births | Births / 1,000 Women |
| 15 to 19 years | 8 (0.8%) | 2.0 |
| 20 to 34 years | 773 (78.2%) | 70.0 |
| 35 to 50 years | 207 (20.9%) | 25.0 |
| Total | 988 (100.0%) | 42.0 |
Fertility by Age by Marriage Status in Wichita Falls
70.2% of women with births (988) in Wichita Falls are married. The highest percentage of unmarried women with births falls into 35 to 50 years age bracket with 40.6% of them unmarried at the time of birth, while the lowest percentage of unmarried women with births belong to 15 to 19 years age bracket with 0.0% of them unmarried.
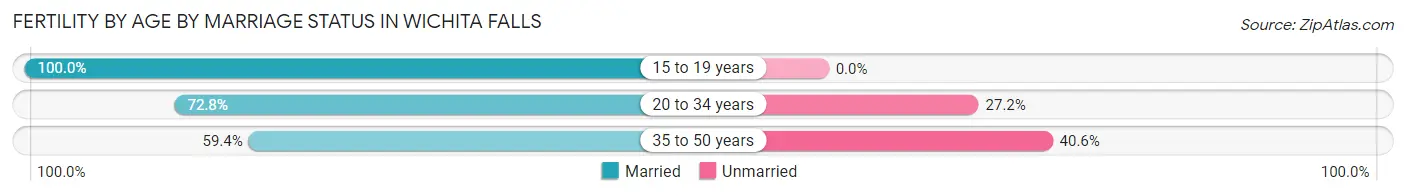
| Age Bracket | Married | Unmarried |
| 15 to 19 years | 8 (100.0%) | 0 (0.0%) |
| 20 to 34 years | 563 (72.8%) | 210 (27.2%) |
| 35 to 50 years | 123 (59.4%) | 84 (40.6%) |
| Total | 694 (70.2%) | 294 (29.8%) |
Fertility by Education in Wichita Falls
Average fertility rate in Wichita Falls is 42.0 births per 1,000 women. Women with the education attainment of high school diploma have the highest fertility rate of 54.0 births per 1,000 women, while women with the education attainment of less than high school have the lowest fertility at 30.0 births per 1,000 women. Women with the education attainment of college or associate's degree represent 32.2% of all women with births.
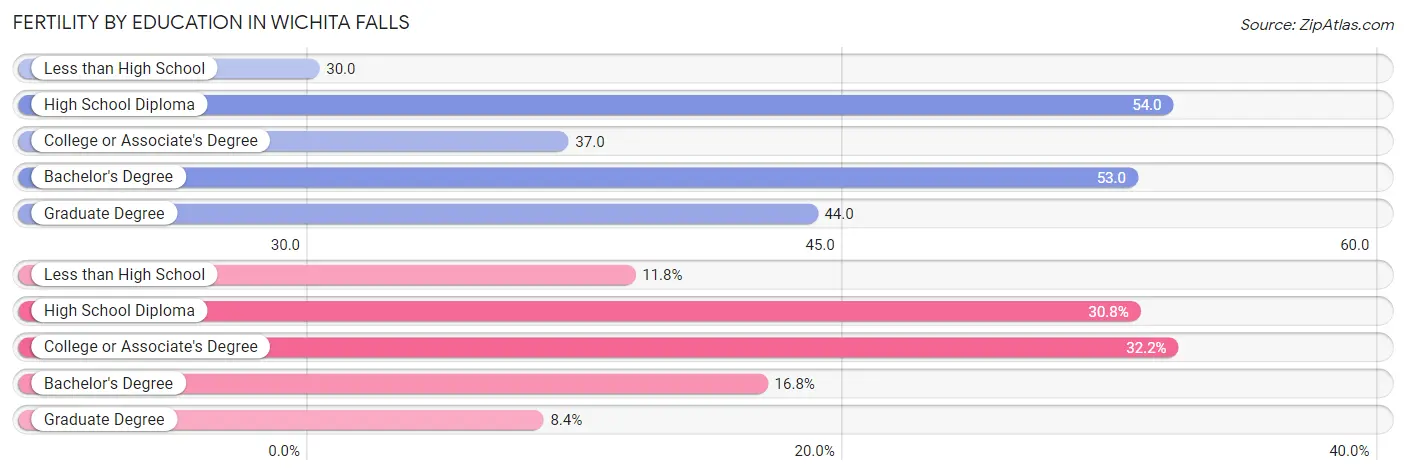
| Educational Attainment | Women with Births | Births / 1,000 Women |
| Less than High School | 117 (11.8%) | 30.0 |
| High School Diploma | 304 (30.8%) | 54.0 |
| College or Associate's Degree | 318 (32.2%) | 37.0 |
| Bachelor's Degree | 166 (16.8%) | 53.0 |
| Graduate Degree | 83 (8.4%) | 44.0 |
| Total | 988 (100.0%) | 42.0 |
Fertility by Education by Marriage Status in Wichita Falls
29.8% of women with births in Wichita Falls are unmarried. Women with the educational attainment of graduate degree are most likely to be married with 100.0% of them married at childbirth, while women with the educational attainment of less than high school are least likely to be married with 56.4% of them unmarried at childbirth.
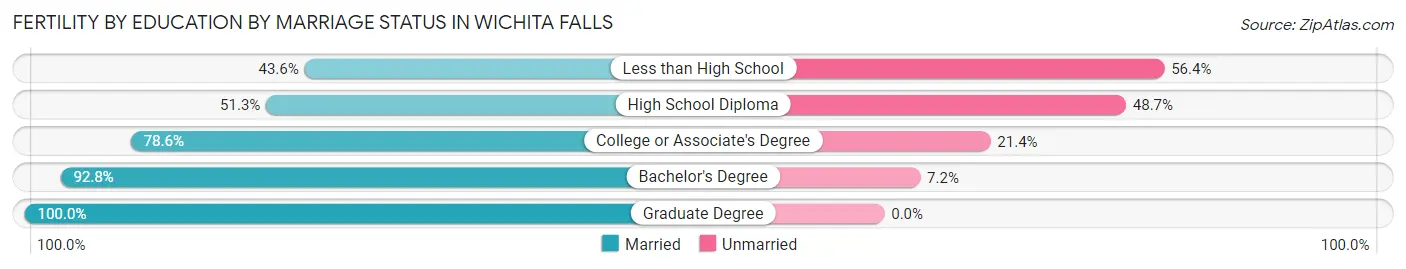
| Educational Attainment | Married | Unmarried |
| Less than High School | 51 (43.6%) | 66 (56.4%) |
| High School Diploma | 156 (51.3%) | 148 (48.7%) |
| College or Associate's Degree | 250 (78.6%) | 68 (21.4%) |
| Bachelor's Degree | 154 (92.8%) | 12 (7.2%) |
| Graduate Degree | 83 (100.0%) | 0 (0.0%) |
| Total | 694 (70.2%) | 294 (29.8%) |
Employment Characteristics in Wichita Falls
Employment by Class of Employer in Wichita Falls
Among the 49,329 employed individuals in Wichita Falls, private company employees (29,552 | 59.9%), federal government employees (7,185 | 14.6%), and not-for-profit organizations (3,381 | 6.9%) make up the most common classes of employment.
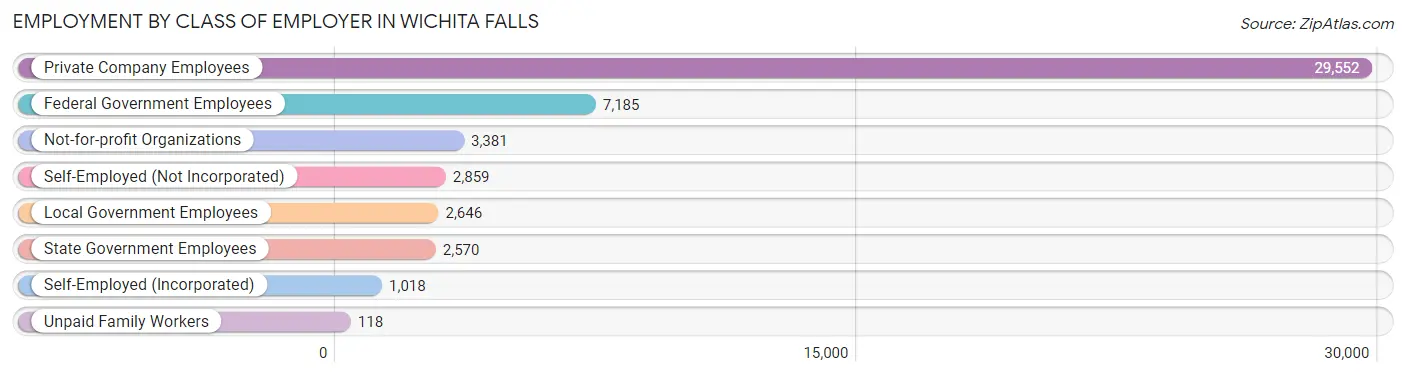
| Employer Class | # Employees | % Employees |
| Private Company Employees | 29,552 | 59.9% |
| Self-Employed (Incorporated) | 1,018 | 2.1% |
| Self-Employed (Not Incorporated) | 2,859 | 5.8% |
| Not-for-profit Organizations | 3,381 | 6.9% |
| Local Government Employees | 2,646 | 5.4% |
| State Government Employees | 2,570 | 5.2% |
| Federal Government Employees | 7,185 | 14.6% |
| Unpaid Family Workers | 118 | 0.2% |
| Total | 49,329 | 100.0% |
Employment Status by Age in Wichita Falls
According to the labor force statistics for Wichita Falls, out of the total population over 16 years of age (81,799), 63.8% or 52,188 individuals are in the labor force, with 4.4% or 2,296 of them unemployed. The age group with the highest labor force participation rate is 25 to 29 years, with 82.8% or 7,033 individuals in the labor force. Within the labor force, the 16 to 19 years age range has the highest percentage of unemployed individuals, with 12.1% or 553 of them being unemployed.
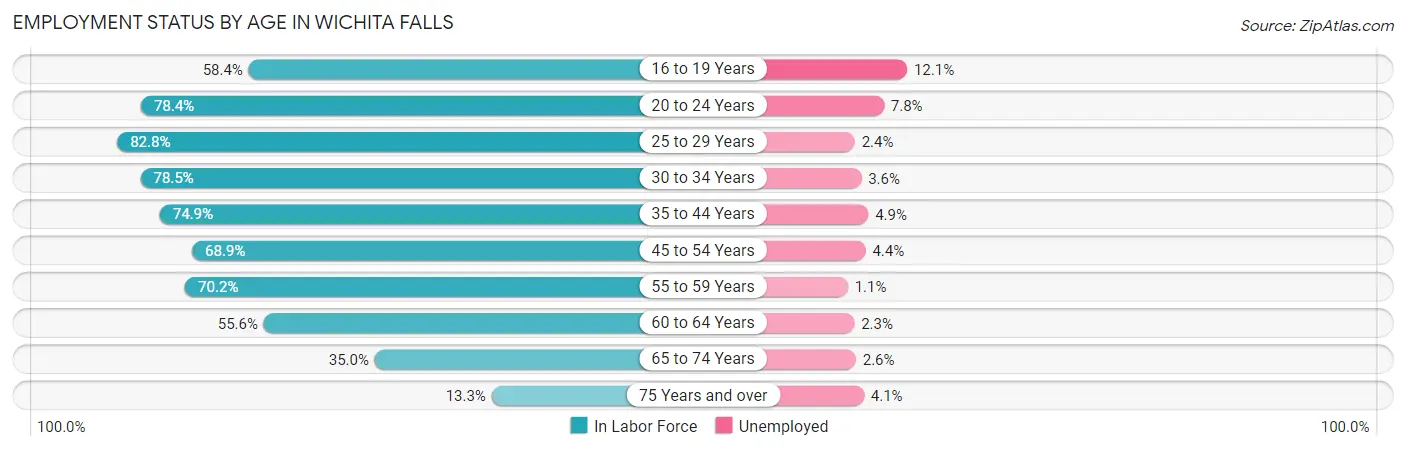
| Age Bracket | In Labor Force | Unemployed |
| 16 to 19 Years | 4,568 (58.4%) | 553 (12.1%) |
| 20 to 24 Years | 7,582 (78.4%) | 591 (7.8%) |
| 25 to 29 Years | 7,033 (82.8%) | 169 (2.4%) |
| 30 to 34 Years | 5,803 (78.5%) | 209 (3.6%) |
| 35 to 44 Years | 9,396 (74.9%) | 460 (4.9%) |
| 45 to 54 Years | 7,039 (68.9%) | 310 (4.4%) |
| 55 to 59 Years | 3,956 (70.2%) | 44 (1.1%) |
| 60 to 64 Years | 3,137 (55.6%) | 72 (2.3%) |
| 65 to 74 Years | 2,874 (35.0%) | 75 (2.6%) |
| 75 Years and over | 821 (13.3%) | 34 (4.1%) |
| Total | 52,188 (63.8%) | 2,296 (4.4%) |
Employment Status by Educational Attainment in Wichita Falls
According to labor force statistics for Wichita Falls, 72.8% of individuals (36,345) out of the total population between 25 and 64 years of age (49,924) are in the labor force, with 3.5% or 1,272 of them being unemployed. The group with the highest labor force participation rate are those with the educational attainment of bachelor's degree or higher, with 84.9% or 10,190 individuals in the labor force. Within the labor force, individuals with less than high school education have the highest percentage of unemployment, with 7.3% or 221 of them being unemployed.
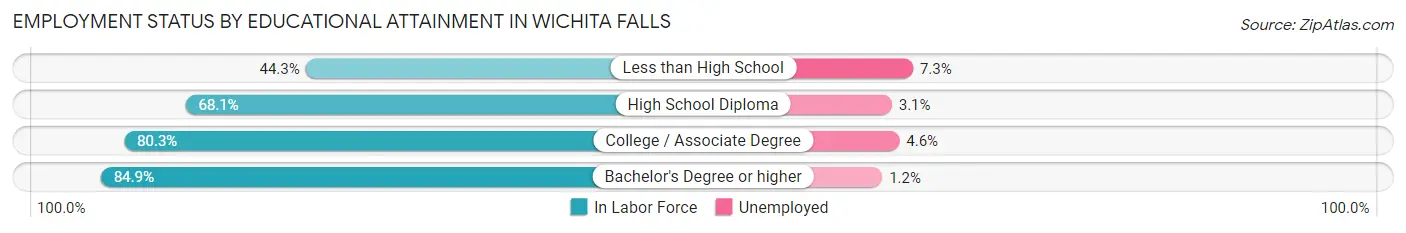
| Educational Attainment | In Labor Force | Unemployed |
| Less than High School | 3,021 (44.3%) | 498 (7.3%) |
| High School Diploma | 10,145 (68.1%) | 462 (3.1%) |
| College / Associate Degree | 13,013 (80.3%) | 745 (4.6%) |
| Bachelor's Degree or higher | 10,190 (84.9%) | 144 (1.2%) |
| Total | 36,345 (72.8%) | 1,747 (3.5%) |
Employment Occupations by Sex in Wichita Falls
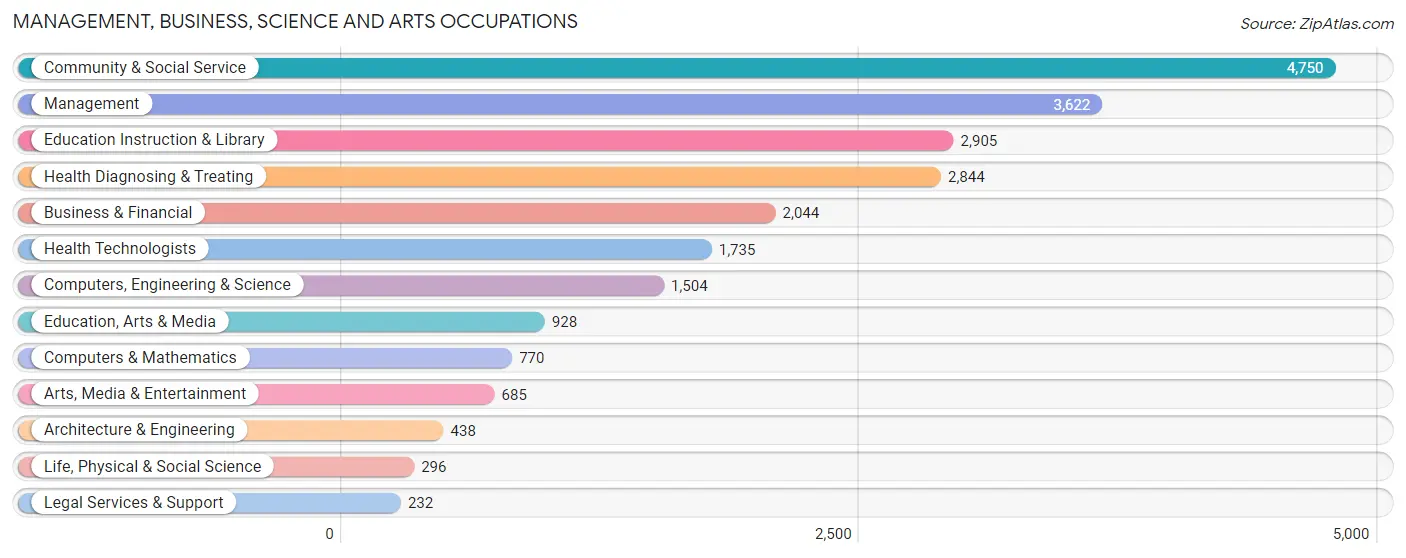
Management, Business, Science and Arts Occupations
The most common Management, Business, Science and Arts occupations in Wichita Falls are Community & Social Service (4,750 | 10.6%), Management (3,622 | 8.1%), Education Instruction & Library (2,905 | 6.5%), Health Diagnosing & Treating (2,844 | 6.3%), and Business & Financial (2,044 | 4.6%).
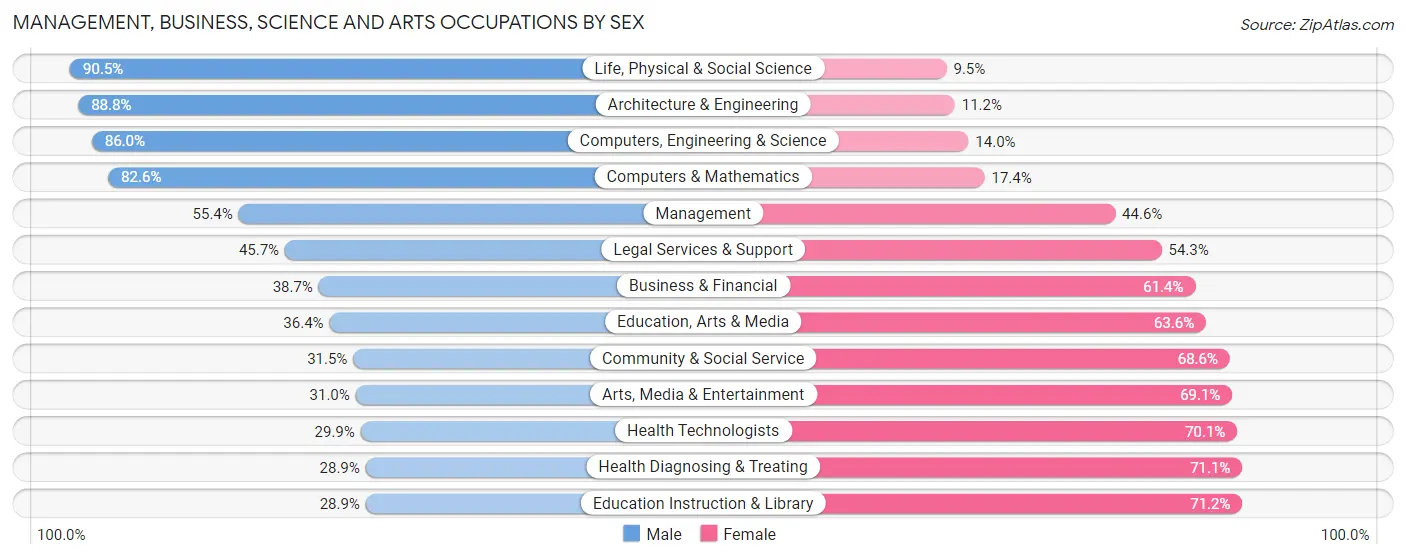
Management, Business, Science and Arts Occupations by Sex
Within the Management, Business, Science and Arts occupations in Wichita Falls, the most male-oriented occupations are Life, Physical & Social Science (90.5%), Architecture & Engineering (88.8%), and Computers, Engineering & Science (86.0%), while the most female-oriented occupations are Education Instruction & Library (71.2%), Health Diagnosing & Treating (71.1%), and Health Technologists (70.1%).
| Occupation | Male | Female |
| Management | 2,005 (55.4%) | 1,617 (44.6%) |
| Business & Financial | 790 (38.7%) | 1,254 (61.4%) |
| Computers, Engineering & Science | 1,293 (86.0%) | 211 (14.0%) |
| Computers & Mathematics | 636 (82.6%) | 134 (17.4%) |
| Architecture & Engineering | 389 (88.8%) | 49 (11.2%) |
| Life, Physical & Social Science | 268 (90.5%) | 28 (9.5%) |
| Community & Social Service | 1,494 (31.5%) | 3,256 (68.5%) |
| Education, Arts & Media | 338 (36.4%) | 590 (63.6%) |
| Legal Services & Support | 106 (45.7%) | 126 (54.3%) |
| Education Instruction & Library | 838 (28.8%) | 2,067 (71.2%) |
| Arts, Media & Entertainment | 212 (30.9%) | 473 (69.1%) |
| Health Diagnosing & Treating | 821 (28.9%) | 2,023 (71.1%) |
| Health Technologists | 519 (29.9%) | 1,216 (70.1%) |
| Total (Category) | 6,403 (43.4%) | 8,361 (56.6%) |
| Total (Overall) | 23,335 (52.0%) | 21,507 (48.0%) |
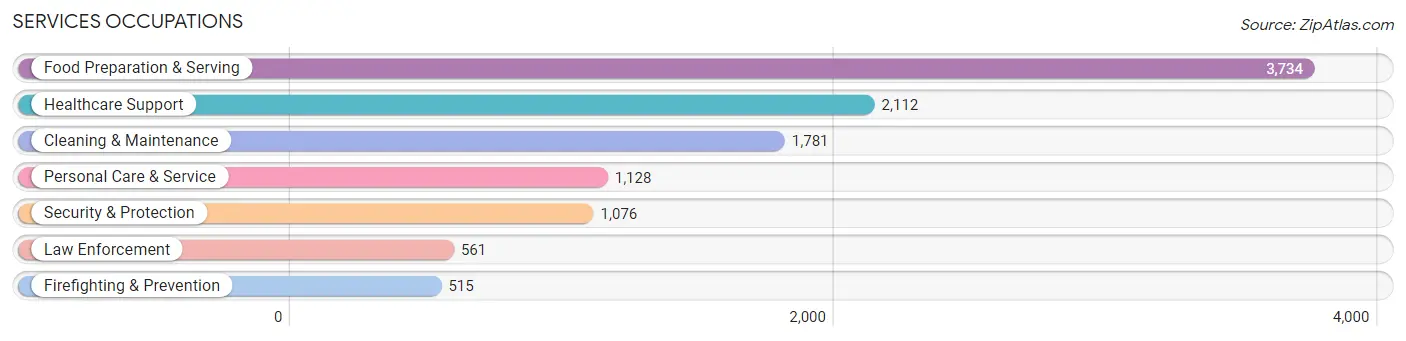
Services Occupations
The most common Services occupations in Wichita Falls are Food Preparation & Serving (3,734 | 8.3%), Healthcare Support (2,112 | 4.7%), Cleaning & Maintenance (1,781 | 4.0%), Personal Care & Service (1,128 | 2.5%), and Security & Protection (1,076 | 2.4%).
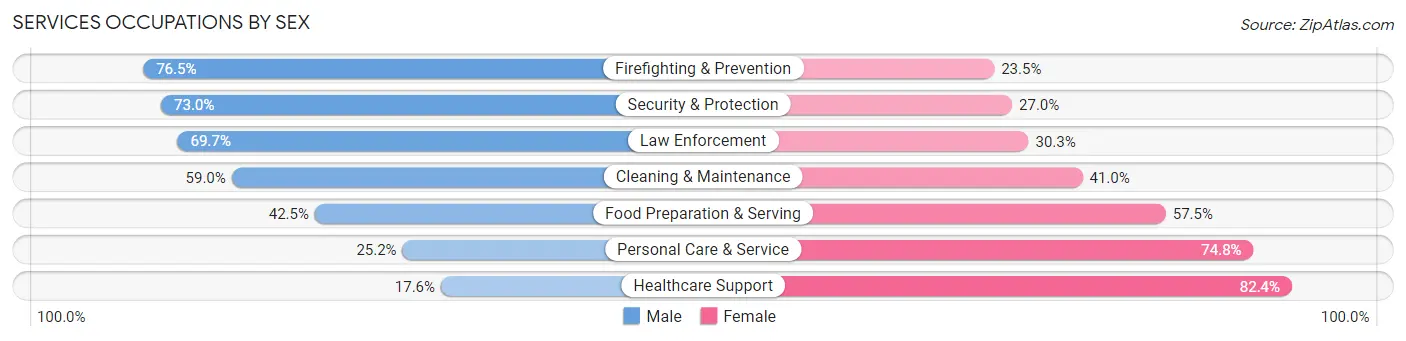
Services Occupations by Sex
Within the Services occupations in Wichita Falls, the most male-oriented occupations are Firefighting & Prevention (76.5%), Security & Protection (73.0%), and Law Enforcement (69.7%), while the most female-oriented occupations are Healthcare Support (82.4%), Personal Care & Service (74.8%), and Food Preparation & Serving (57.5%).
| Occupation | Male | Female |
| Healthcare Support | 371 (17.6%) | 1,741 (82.4%) |
| Security & Protection | 785 (73.0%) | 291 (27.0%) |
| Firefighting & Prevention | 394 (76.5%) | 121 (23.5%) |
| Law Enforcement | 391 (69.7%) | 170 (30.3%) |
| Food Preparation & Serving | 1,588 (42.5%) | 2,146 (57.5%) |
| Cleaning & Maintenance | 1,051 (59.0%) | 730 (41.0%) |
| Personal Care & Service | 284 (25.2%) | 844 (74.8%) |
| Total (Category) | 4,079 (41.5%) | 5,752 (58.5%) |
| Total (Overall) | 23,335 (52.0%) | 21,507 (48.0%) |
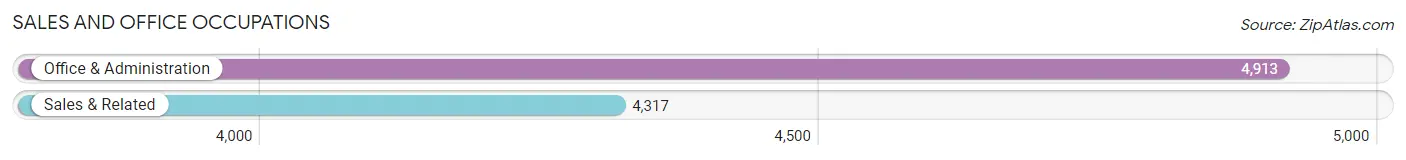
Sales and Office Occupations
The most common Sales and Office occupations in Wichita Falls are Office & Administration (4,913 | 11.0%), and Sales & Related (4,317 | 9.6%).
Sales and Office Occupations by Sex
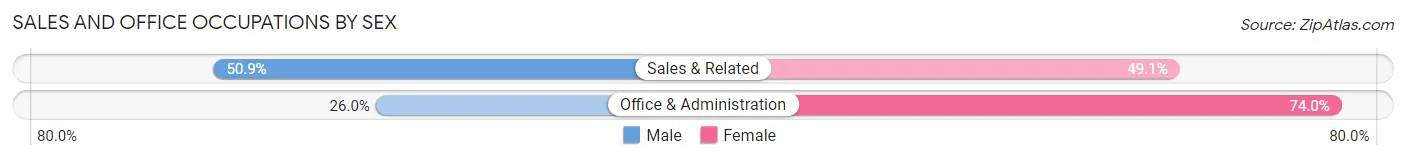
| Occupation | Male | Female |
| Sales & Related | 2,199 (50.9%) | 2,118 (49.1%) |
| Office & Administration | 1,277 (26.0%) | 3,636 (74.0%) |
| Total (Category) | 3,476 (37.7%) | 5,754 (62.3%) |
| Total (Overall) | 23,335 (52.0%) | 21,507 (48.0%) |
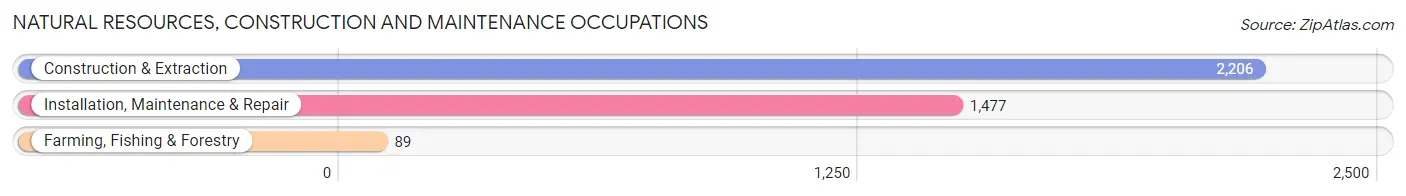
Natural Resources, Construction and Maintenance Occupations
The most common Natural Resources, Construction and Maintenance occupations in Wichita Falls are Construction & Extraction (2,206 | 4.9%), Installation, Maintenance & Repair (1,477 | 3.3%), and Farming, Fishing & Forestry (89 | 0.2%).
Natural Resources, Construction and Maintenance Occupations by Sex
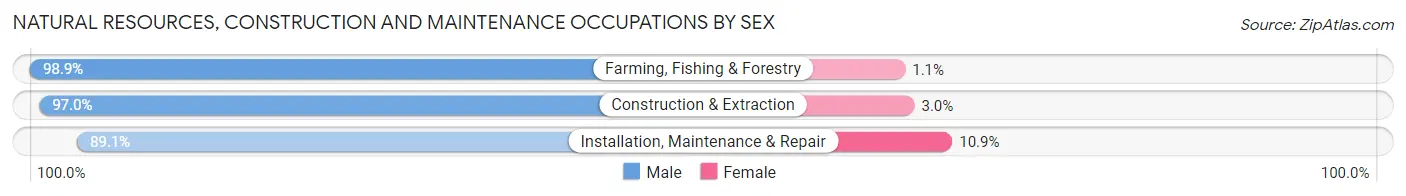
| Occupation | Male | Female |
| Farming, Fishing & Forestry | 88 (98.9%) | 1 (1.1%) |
| Construction & Extraction | 2,139 (97.0%) | 67 (3.0%) |
| Installation, Maintenance & Repair | 1,316 (89.1%) | 161 (10.9%) |
| Total (Category) | 3,543 (93.9%) | 229 (6.1%) |
| Total (Overall) | 23,335 (52.0%) | 21,507 (48.0%) |
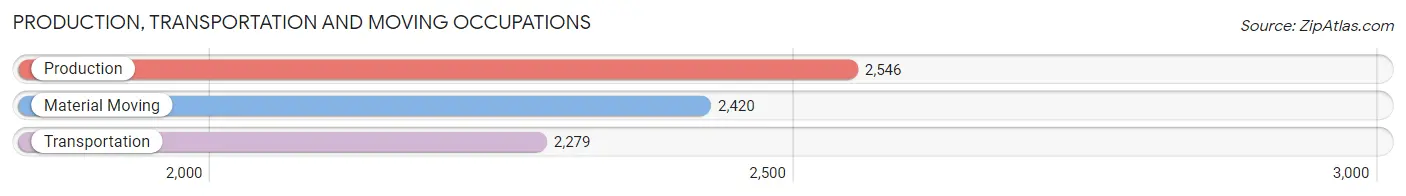
Production, Transportation and Moving Occupations
The most common Production, Transportation and Moving occupations in Wichita Falls are Production (2,546 | 5.7%), Material Moving (2,420 | 5.4%), and Transportation (2,279 | 5.1%).
Production, Transportation and Moving Occupations by Sex
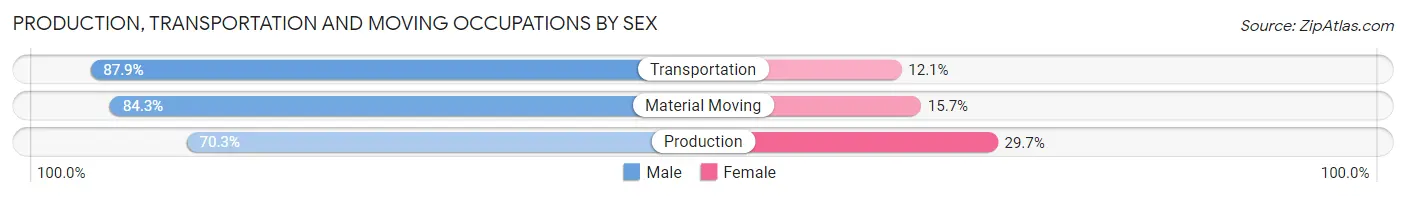
| Occupation | Male | Female |
| Production | 1,789 (70.3%) | 757 (29.7%) |
| Transportation | 2,004 (87.9%) | 275 (12.1%) |
| Material Moving | 2,041 (84.3%) | 379 (15.7%) |
| Total (Category) | 5,834 (80.5%) | 1,411 (19.5%) |
| Total (Overall) | 23,335 (52.0%) | 21,507 (48.0%) |
Employment Industries by Sex in Wichita Falls
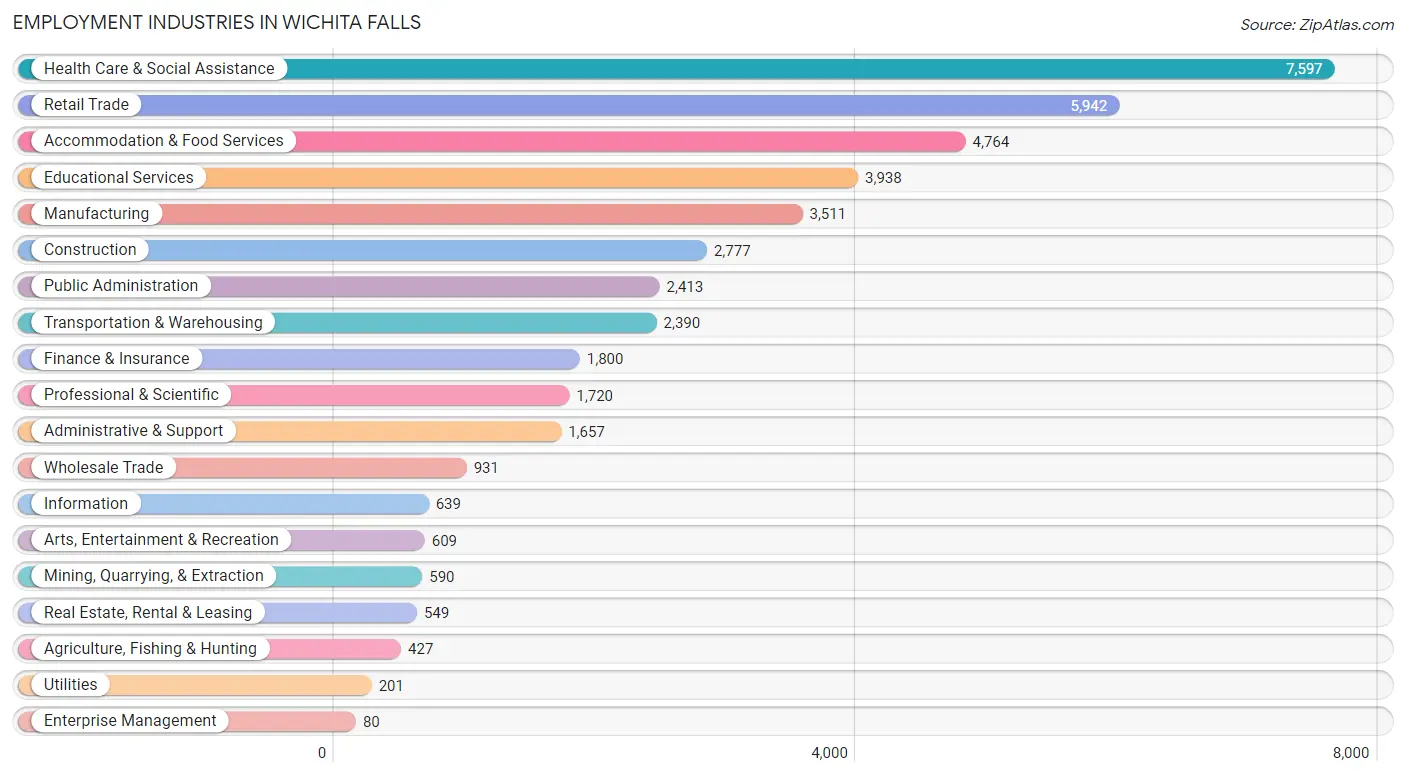
Employment Industries in Wichita Falls
The major employment industries in Wichita Falls include Health Care & Social Assistance (7,597 | 16.9%), Retail Trade (5,942 | 13.3%), Accommodation & Food Services (4,764 | 10.6%), Educational Services (3,938 | 8.8%), and Manufacturing (3,511 | 7.8%).
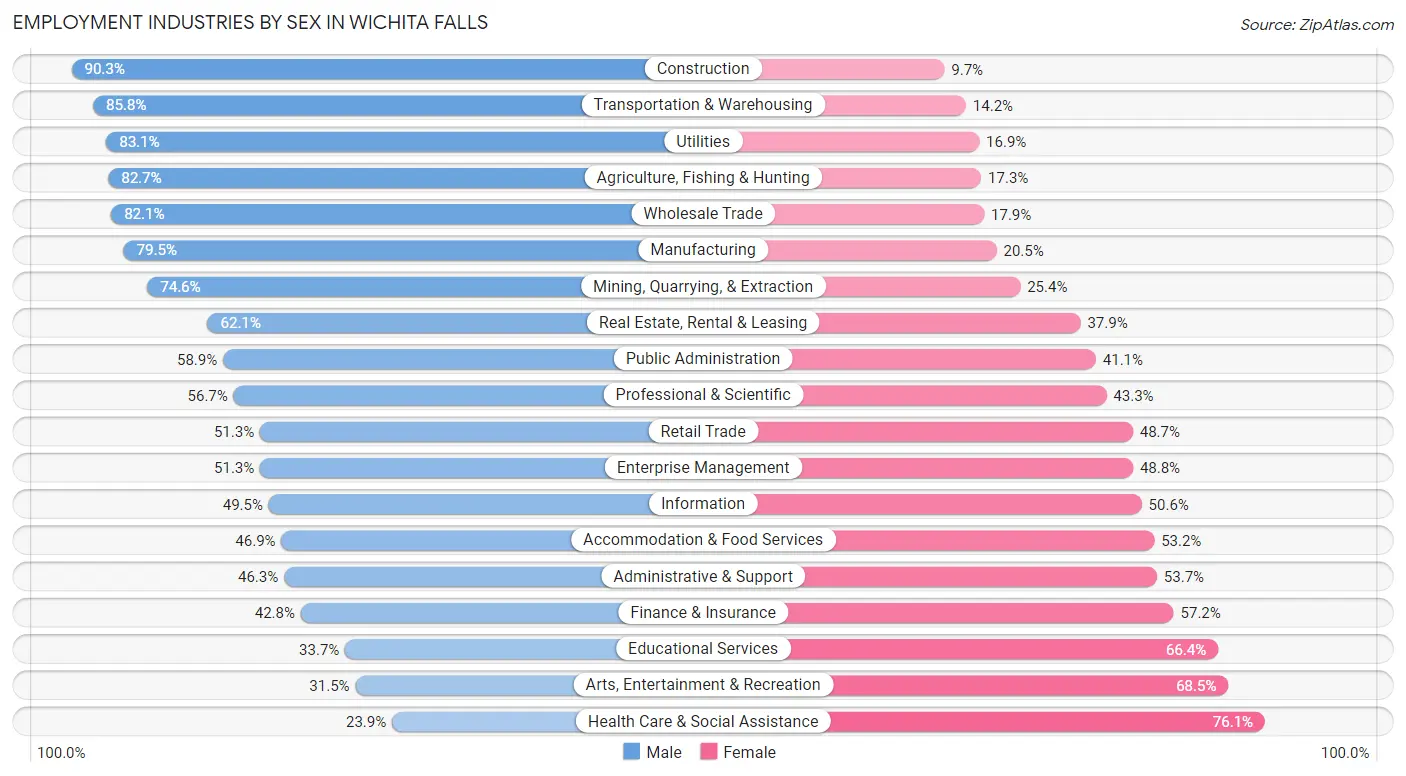
Employment Industries by Sex in Wichita Falls
The Wichita Falls industries that see more men than women are Construction (90.3%), Transportation & Warehousing (85.8%), and Utilities (83.1%), whereas the industries that tend to have a higher number of women are Health Care & Social Assistance (76.1%), Arts, Entertainment & Recreation (68.5%), and Educational Services (66.3%).
| Industry | Male | Female |
| Agriculture, Fishing & Hunting | 353 (82.7%) | 74 (17.3%) |
| Mining, Quarrying, & Extraction | 440 (74.6%) | 150 (25.4%) |
| Construction | 2,507 (90.3%) | 270 (9.7%) |
| Manufacturing | 2,791 (79.5%) | 720 (20.5%) |
| Wholesale Trade | 764 (82.1%) | 167 (17.9%) |
| Retail Trade | 3,047 (51.3%) | 2,895 (48.7%) |
| Transportation & Warehousing | 2,051 (85.8%) | 339 (14.2%) |
| Utilities | 167 (83.1%) | 34 (16.9%) |
| Information | 316 (49.4%) | 323 (50.5%) |
| Finance & Insurance | 771 (42.8%) | 1,029 (57.2%) |
| Real Estate, Rental & Leasing | 341 (62.1%) | 208 (37.9%) |
| Professional & Scientific | 976 (56.7%) | 744 (43.3%) |
| Enterprise Management | 41 (51.2%) | 39 (48.7%) |
| Administrative & Support | 767 (46.3%) | 890 (53.7%) |
| Educational Services | 1,325 (33.7%) | 2,613 (66.3%) |
| Health Care & Social Assistance | 1,819 (23.9%) | 5,778 (76.1%) |
| Arts, Entertainment & Recreation | 192 (31.5%) | 417 (68.5%) |
| Accommodation & Food Services | 2,232 (46.9%) | 2,532 (53.1%) |
| Public Administration | 1,422 (58.9%) | 991 (41.1%) |
| Total | 23,335 (52.0%) | 21,507 (48.0%) |
Education in Wichita Falls
School Enrollment in Wichita Falls
The most common levels of schooling among the 25,708 students in Wichita Falls are college / undergraduate (6,640 | 25.8%), middle school (5,362 | 20.9%), and elementary school (5,240 | 20.4%).
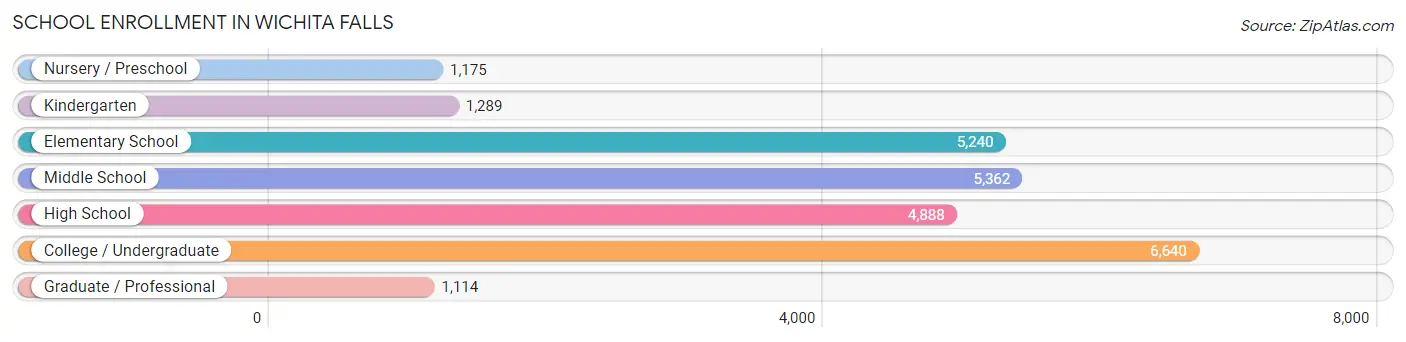
| School Level | # Students | % Students |
| Nursery / Preschool | 1,175 | 4.6% |
| Kindergarten | 1,289 | 5.0% |
| Elementary School | 5,240 | 20.4% |
| Middle School | 5,362 | 20.9% |
| High School | 4,888 | 19.0% |
| College / Undergraduate | 6,640 | 25.8% |
| Graduate / Professional | 1,114 | 4.3% |
| Total | 25,708 | 100.0% |
School Enrollment by Age by Funding Source in Wichita Falls
Out of a total of 25,708 students who are enrolled in schools in Wichita Falls, 2,134 (8.3%) attend a private institution, while the remaining 23,574 (91.7%) are enrolled in public schools. The age group of 35 years and over has the highest likelihood of being enrolled in private schools, with 279 (24.6% in the age bracket) enrolled. Conversely, the age group of 18 to 19 year olds has the lowest likelihood of being enrolled in a private school, with 2,025 (96.4% in the age bracket) attending a public institution.
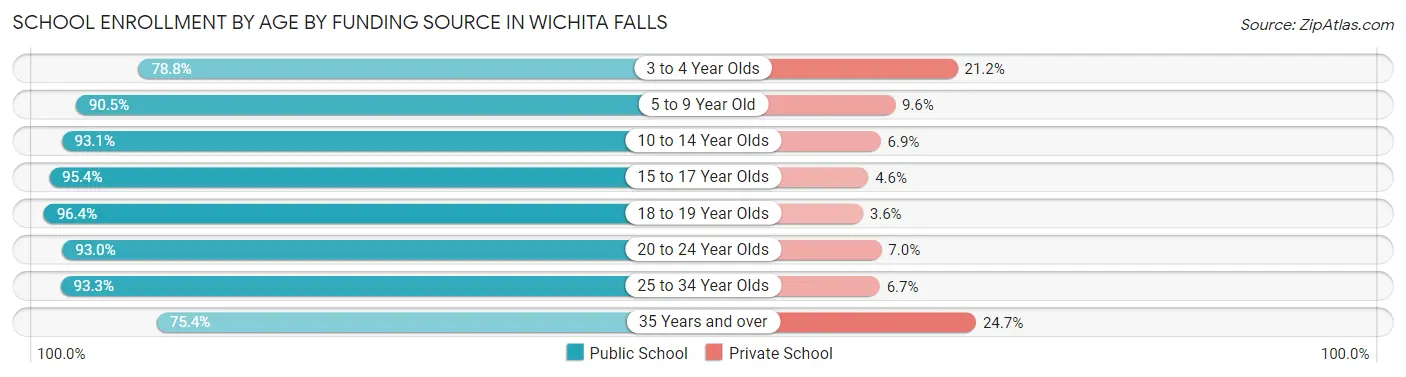
| Age Bracket | Public School | Private School |
| 3 to 4 Year Olds | 843 (78.8%) | 227 (21.2%) |
| 5 to 9 Year Old | 5,428 (90.4%) | 573 (9.6%) |
| 10 to 14 Year Olds | 6,229 (93.1%) | 460 (6.9%) |
| 15 to 17 Year Olds | 3,171 (95.4%) | 152 (4.6%) |
| 18 to 19 Year Olds | 2,025 (96.4%) | 75 (3.6%) |
| 20 to 24 Year Olds | 3,227 (93.0%) | 244 (7.0%) |
| 25 to 34 Year Olds | 1,793 (93.3%) | 129 (6.7%) |
| 35 Years and over | 853 (75.3%) | 279 (24.6%) |
| Total | 23,574 (91.7%) | 2,134 (8.3%) |
Educational Attainment by Field of Study in Wichita Falls
Business (3,018 | 18.3%), education (2,722 | 16.5%), science & technology (1,895 | 11.5%), arts & humanities (1,363 | 8.3%), and social sciences (1,044 | 6.3%) are the most common fields of study among 16,511 individuals in Wichita Falls who have obtained a bachelor's degree or higher.
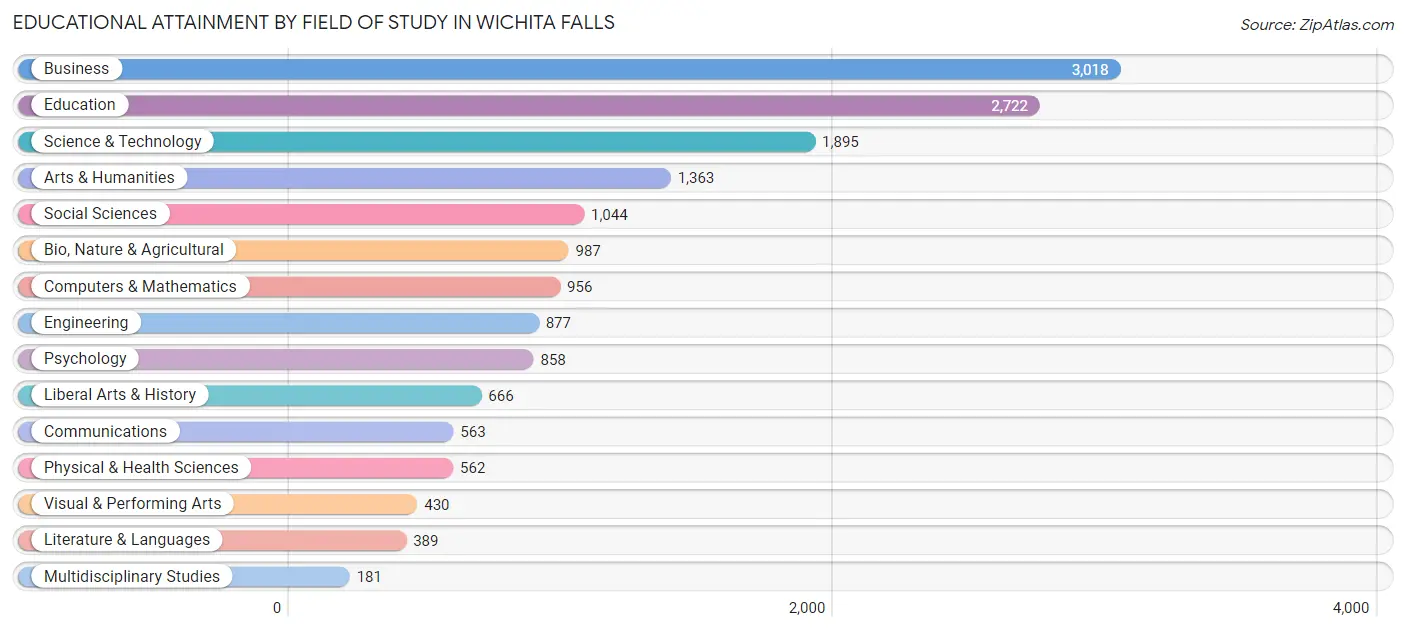
| Field of Study | # Graduates | % Graduates |
| Computers & Mathematics | 956 | 5.8% |
| Bio, Nature & Agricultural | 987 | 6.0% |
| Physical & Health Sciences | 562 | 3.4% |
| Psychology | 858 | 5.2% |
| Social Sciences | 1,044 | 6.3% |
| Engineering | 877 | 5.3% |
| Multidisciplinary Studies | 181 | 1.1% |
| Science & Technology | 1,895 | 11.5% |
| Business | 3,018 | 18.3% |
| Education | 2,722 | 16.5% |
| Literature & Languages | 389 | 2.4% |
| Liberal Arts & History | 666 | 4.0% |
| Visual & Performing Arts | 430 | 2.6% |
| Communications | 563 | 3.4% |
| Arts & Humanities | 1,363 | 8.3% |
| Total | 16,511 | 100.0% |
Transportation & Commute in Wichita Falls
Vehicle Availability by Sex in Wichita Falls
The most prevalent vehicle ownership categories in Wichita Falls are males with 2 vehicles (10,231, accounting for 44.0%) and females with 2 vehicles (9,193, making up 48.9%).
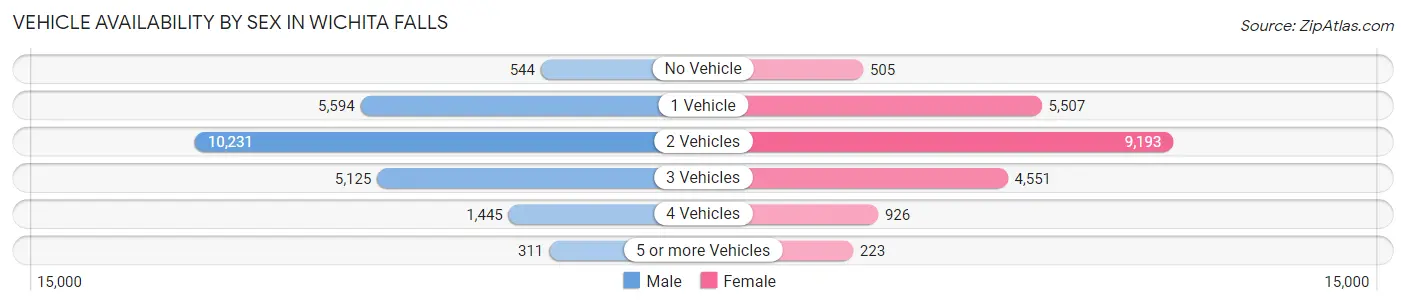
| Vehicles Available | Male | Female |
| No Vehicle | 544 (2.3%) | 505 (2.4%) |
| 1 Vehicle | 5,594 (24.1%) | 5,507 (26.3%) |
| 2 Vehicles | 10,231 (44.0%) | 9,193 (44.0%) |
| 3 Vehicles | 5,125 (22.0%) | 4,551 (21.8%) |
| 4 Vehicles | 1,445 (6.2%) | 926 (4.4%) |
| 5 or more Vehicles | 311 (1.3%) | 223 (1.1%) |
| Total | 23,250 (100.0%) | 20,905 (100.0%) |
Commute Time in Wichita Falls
The most frequently occuring commute durations in Wichita Falls are 10 to 14 minutes (14,287 commuters, 31.0%), 5 to 9 minutes (10,812 commuters, 23.4%), and 15 to 19 minutes (9,456 commuters, 20.5%).
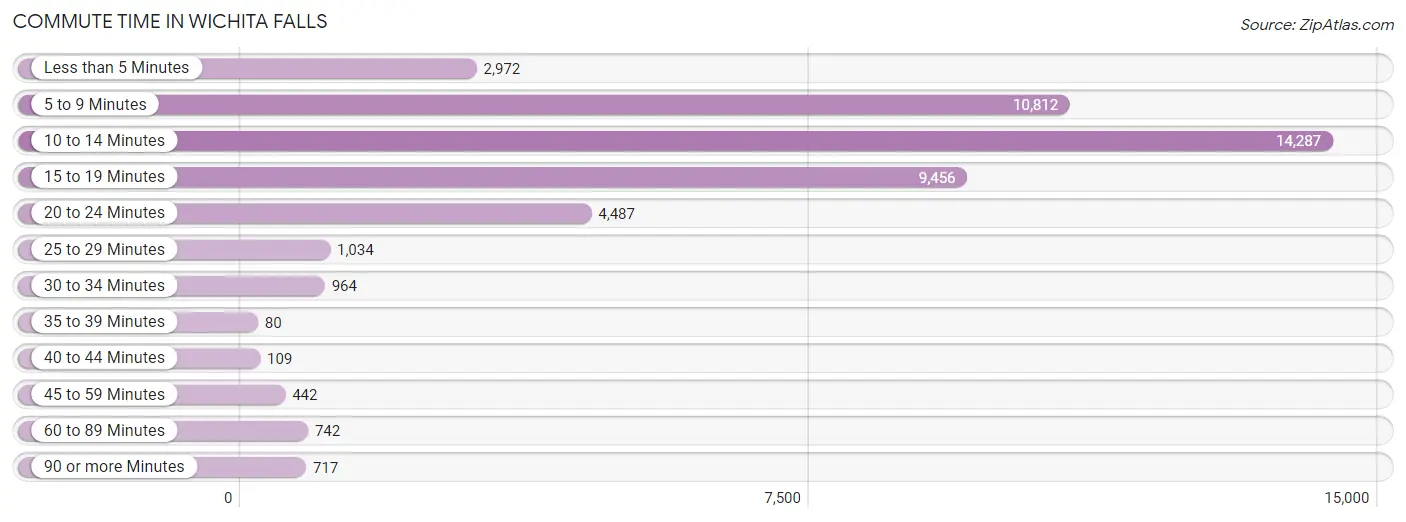
| Commute Time | # Commuters | % Commuters |
| Less than 5 Minutes | 2,972 | 6.5% |
| 5 to 9 Minutes | 10,812 | 23.4% |
| 10 to 14 Minutes | 14,287 | 31.0% |
| 15 to 19 Minutes | 9,456 | 20.5% |
| 20 to 24 Minutes | 4,487 | 9.7% |
| 25 to 29 Minutes | 1,034 | 2.2% |
| 30 to 34 Minutes | 964 | 2.1% |
| 35 to 39 Minutes | 80 | 0.2% |
| 40 to 44 Minutes | 109 | 0.2% |
| 45 to 59 Minutes | 442 | 1.0% |
| 60 to 89 Minutes | 742 | 1.6% |
| 90 or more Minutes | 717 | 1.6% |
Commute Time by Sex in Wichita Falls
The most common commute times in Wichita Falls are 10 to 14 minutes (8,068 commuters, 31.4%) for males and 10 to 14 minutes (6,219 commuters, 30.4%) for females.
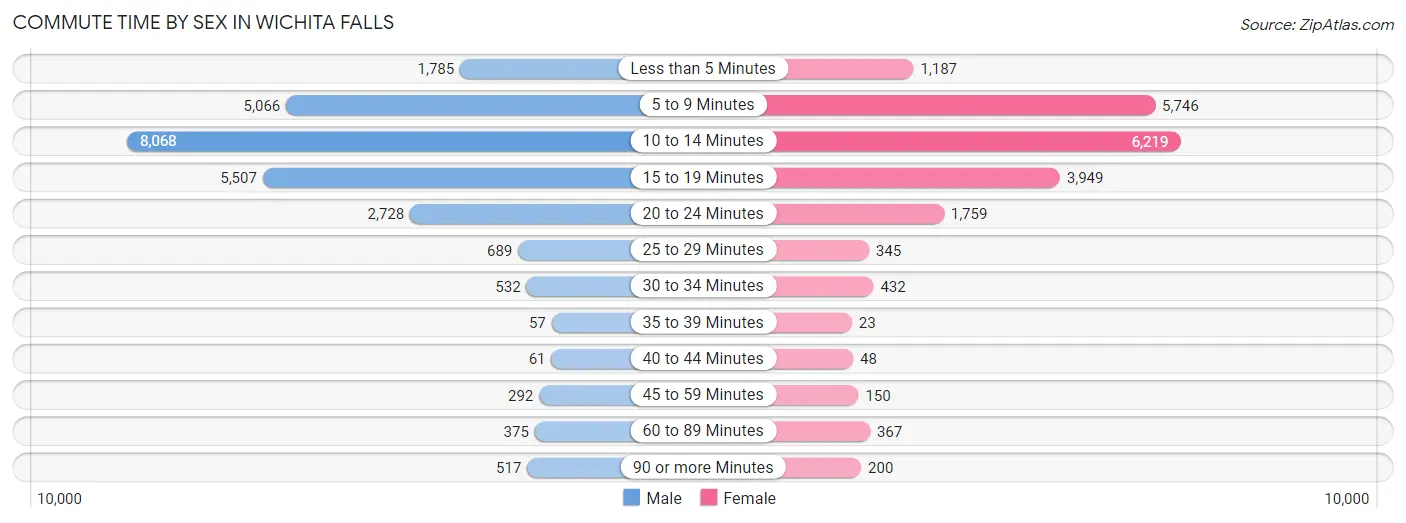
| Commute Time | Male | Female |
| Less than 5 Minutes | 1,785 (7.0%) | 1,187 (5.8%) |
| 5 to 9 Minutes | 5,066 (19.7%) | 5,746 (28.1%) |
| 10 to 14 Minutes | 8,068 (31.4%) | 6,219 (30.4%) |
| 15 to 19 Minutes | 5,507 (21.4%) | 3,949 (19.3%) |
| 20 to 24 Minutes | 2,728 (10.6%) | 1,759 (8.6%) |
| 25 to 29 Minutes | 689 (2.7%) | 345 (1.7%) |
| 30 to 34 Minutes | 532 (2.1%) | 432 (2.1%) |
| 35 to 39 Minutes | 57 (0.2%) | 23 (0.1%) |
| 40 to 44 Minutes | 61 (0.2%) | 48 (0.2%) |
| 45 to 59 Minutes | 292 (1.1%) | 150 (0.7%) |
| 60 to 89 Minutes | 375 (1.5%) | 367 (1.8%) |
| 90 or more Minutes | 517 (2.0%) | 200 (1.0%) |
Time of Departure to Work by Sex in Wichita Falls
The most frequent times of departure to work in Wichita Falls are 6:30 AM to 6:59 AM (4,074, 15.9%) for males and 7:30 AM to 7:59 AM (3,209, 15.7%) for females.
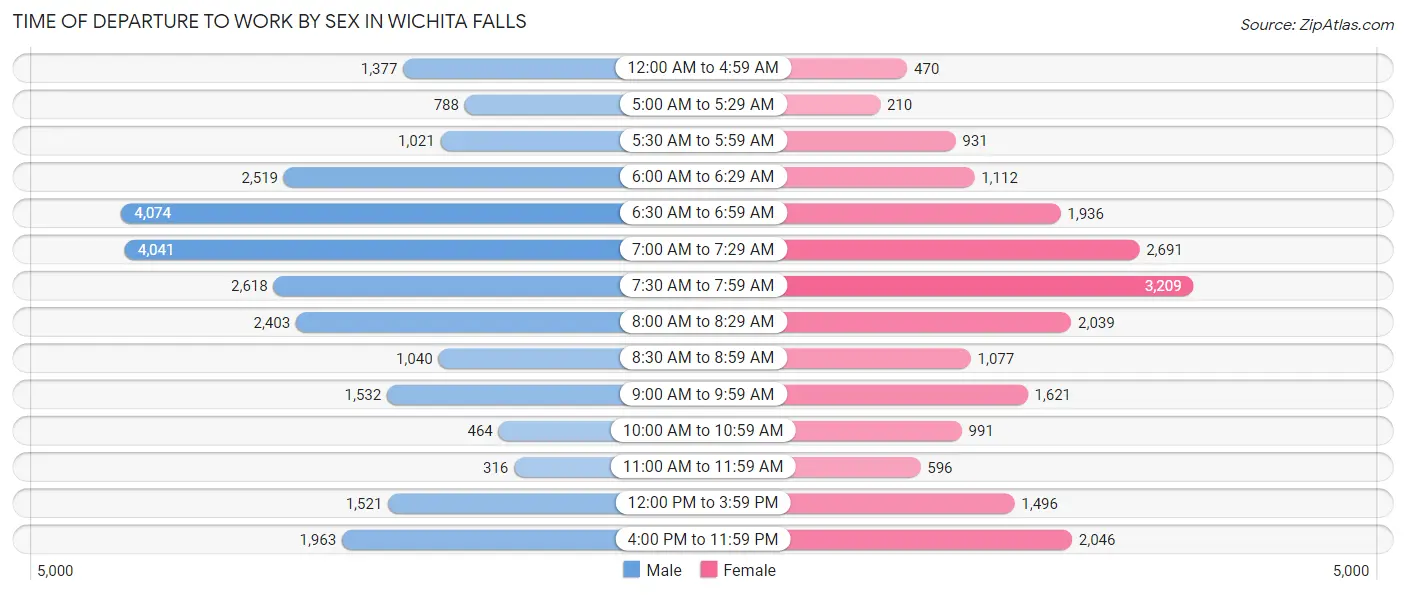
| Time of Departure | Male | Female |
| 12:00 AM to 4:59 AM | 1,377 (5.4%) | 470 (2.3%) |
| 5:00 AM to 5:29 AM | 788 (3.1%) | 210 (1.0%) |
| 5:30 AM to 5:59 AM | 1,021 (4.0%) | 931 (4.6%) |
| 6:00 AM to 6:29 AM | 2,519 (9.8%) | 1,112 (5.4%) |
| 6:30 AM to 6:59 AM | 4,074 (15.9%) | 1,936 (9.5%) |
| 7:00 AM to 7:29 AM | 4,041 (15.7%) | 2,691 (13.2%) |
| 7:30 AM to 7:59 AM | 2,618 (10.2%) | 3,209 (15.7%) |
| 8:00 AM to 8:29 AM | 2,403 (9.4%) | 2,039 (10.0%) |
| 8:30 AM to 8:59 AM | 1,040 (4.1%) | 1,077 (5.3%) |
| 9:00 AM to 9:59 AM | 1,532 (6.0%) | 1,621 (7.9%) |
| 10:00 AM to 10:59 AM | 464 (1.8%) | 991 (4.9%) |
| 11:00 AM to 11:59 AM | 316 (1.2%) | 596 (2.9%) |
| 12:00 PM to 3:59 PM | 1,521 (5.9%) | 1,496 (7.3%) |
| 4:00 PM to 11:59 PM | 1,963 (7.6%) | 2,046 (10.0%) |
| Total | 25,677 (100.0%) | 20,425 (100.0%) |
Housing Occupancy in Wichita Falls
Occupancy by Ownership in Wichita Falls
Of the total 37,676 dwellings in Wichita Falls, owner-occupied units account for 21,194 (56.2%), while renter-occupied units make up 16,482 (43.8%).
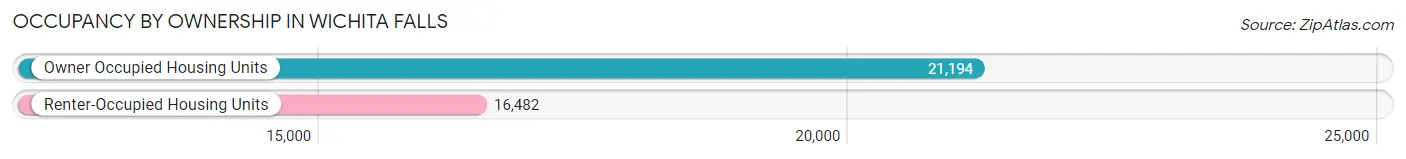
| Occupancy | # Housing Units | % Housing Units |
| Owner Occupied Housing Units | 21,194 | 56.2% |
| Renter-Occupied Housing Units | 16,482 | 43.8% |
| Total Occupied Housing Units | 37,676 | 100.0% |
Occupancy by Household Size in Wichita Falls
| Household Size | # Housing Units | % Housing Units |
| 1-Person Household | 12,033 | 31.9% |
| 2-Person Household | 13,358 | 35.4% |
| 3-Person Household | 5,784 | 15.3% |
| 4+ Person Household | 6,501 | 17.3% |
| Total Housing Units | 37,676 | 100.0% |
Occupancy by Ownership by Household Size in Wichita Falls
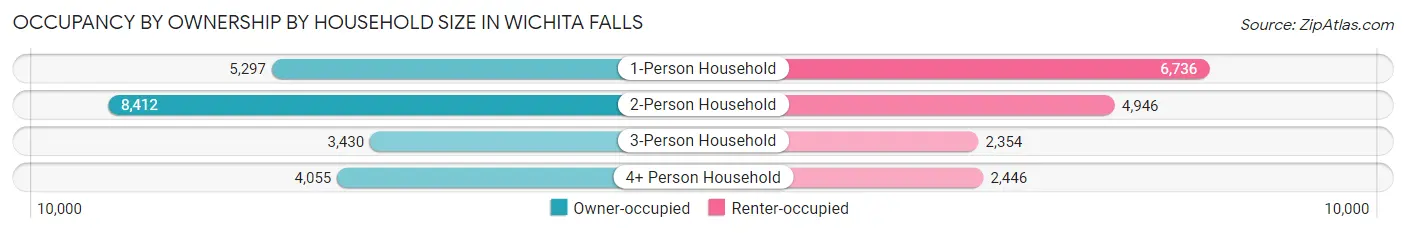
| Household Size | Owner-occupied | Renter-occupied |
| 1-Person Household | 5,297 (44.0%) | 6,736 (56.0%) |
| 2-Person Household | 8,412 (63.0%) | 4,946 (37.0%) |
| 3-Person Household | 3,430 (59.3%) | 2,354 (40.7%) |
| 4+ Person Household | 4,055 (62.4%) | 2,446 (37.6%) |
| Total Housing Units | 21,194 (56.2%) | 16,482 (43.8%) |
Occupancy by Educational Attainment in Wichita Falls
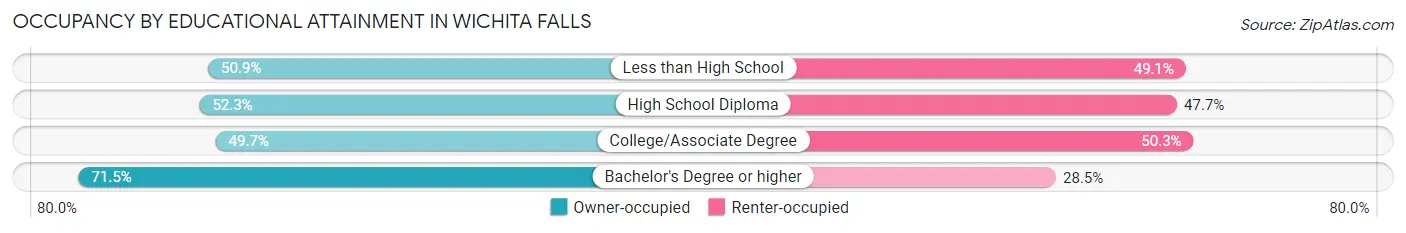
| Household Size | Owner-occupied | Renter-occupied |
| Less than High School | 1,881 (50.9%) | 1,815 (49.1%) |
| High School Diploma | 5,526 (52.3%) | 5,049 (47.7%) |
| College/Associate Degree | 6,707 (49.7%) | 6,790 (50.3%) |
| Bachelor's Degree or higher | 7,080 (71.5%) | 2,828 (28.5%) |
Occupancy by Age of Householder in Wichita Falls
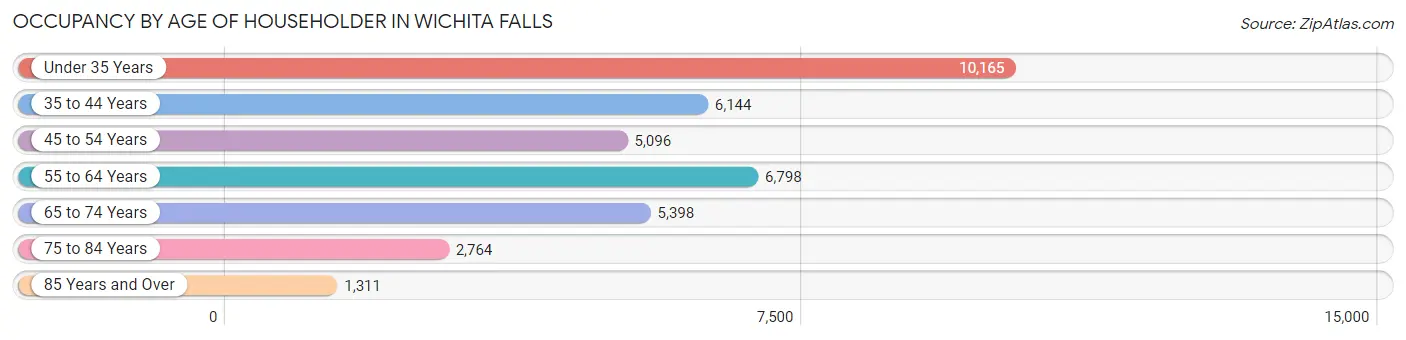
| Age Bracket | # Households | % Households |
| Under 35 Years | 10,165 | 27.0% |
| 35 to 44 Years | 6,144 | 16.3% |
| 45 to 54 Years | 5,096 | 13.5% |
| 55 to 64 Years | 6,798 | 18.0% |
| 65 to 74 Years | 5,398 | 14.3% |
| 75 to 84 Years | 2,764 | 7.3% |
| 85 Years and Over | 1,311 | 3.5% |
| Total | 37,676 | 100.0% |
Housing Finances in Wichita Falls
Median Income by Occupancy in Wichita Falls
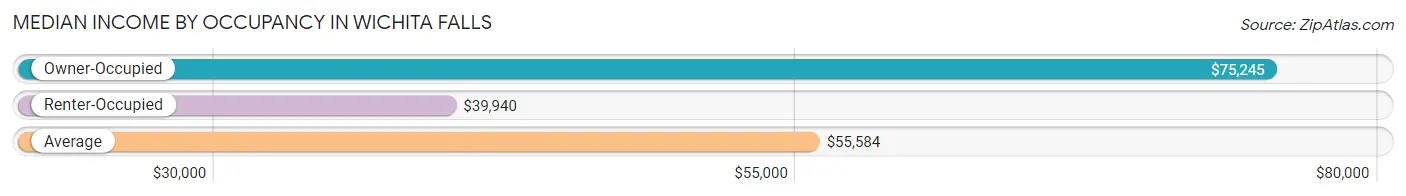
| Occupancy Type | # Households | Median Income |
| Owner-Occupied | 21,194 (56.2%) | $75,245 |
| Renter-Occupied | 16,482 (43.8%) | $39,940 |
| Average | 37,676 (100.0%) | $55,584 |
Occupancy by Householder Income Bracket in Wichita Falls
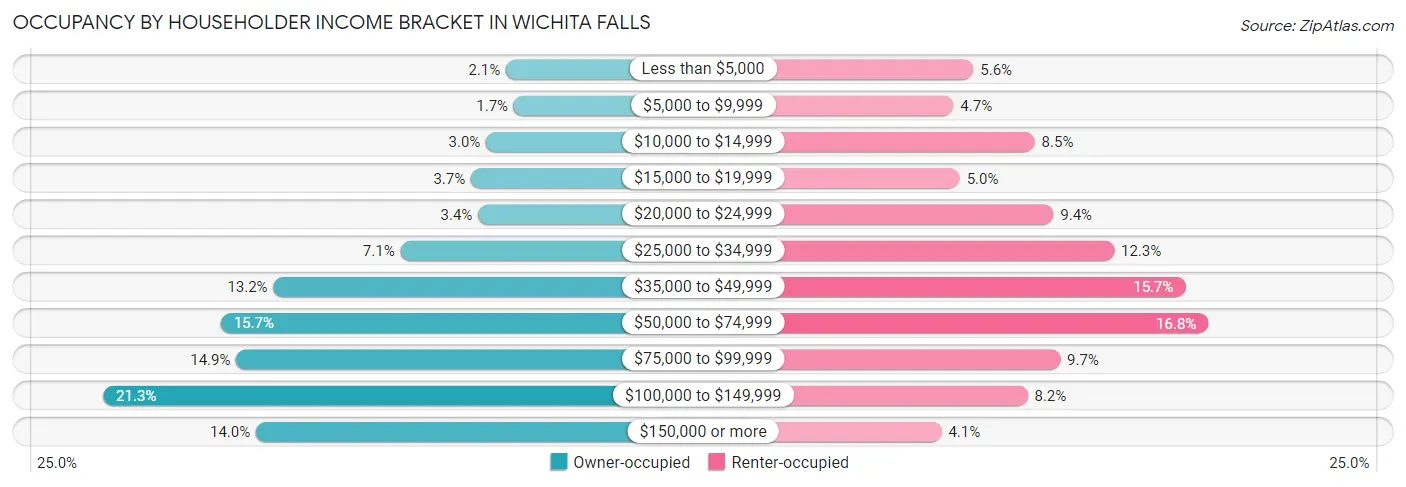
| Income Bracket | Owner-occupied | Renter-occupied |
| Less than $5,000 | 439 (2.1%) | 925 (5.6%) |
| $5,000 to $9,999 | 361 (1.7%) | 768 (4.7%) |
| $10,000 to $14,999 | 641 (3.0%) | 1,406 (8.5%) |
| $15,000 to $19,999 | 793 (3.7%) | 818 (5.0%) |
| $20,000 to $24,999 | 721 (3.4%) | 1,552 (9.4%) |
| $25,000 to $34,999 | 1,504 (7.1%) | 2,029 (12.3%) |
| $35,000 to $49,999 | 2,786 (13.2%) | 2,587 (15.7%) |
| $50,000 to $74,999 | 3,318 (15.7%) | 2,767 (16.8%) |
| $75,000 to $99,999 | 3,163 (14.9%) | 1,606 (9.7%) |
| $100,000 to $149,999 | 4,506 (21.3%) | 1,350 (8.2%) |
| $150,000 or more | 2,962 (14.0%) | 674 (4.1%) |
| Total | 21,194 (100.0%) | 16,482 (100.0%) |
Monthly Housing Cost Tiers in Wichita Falls
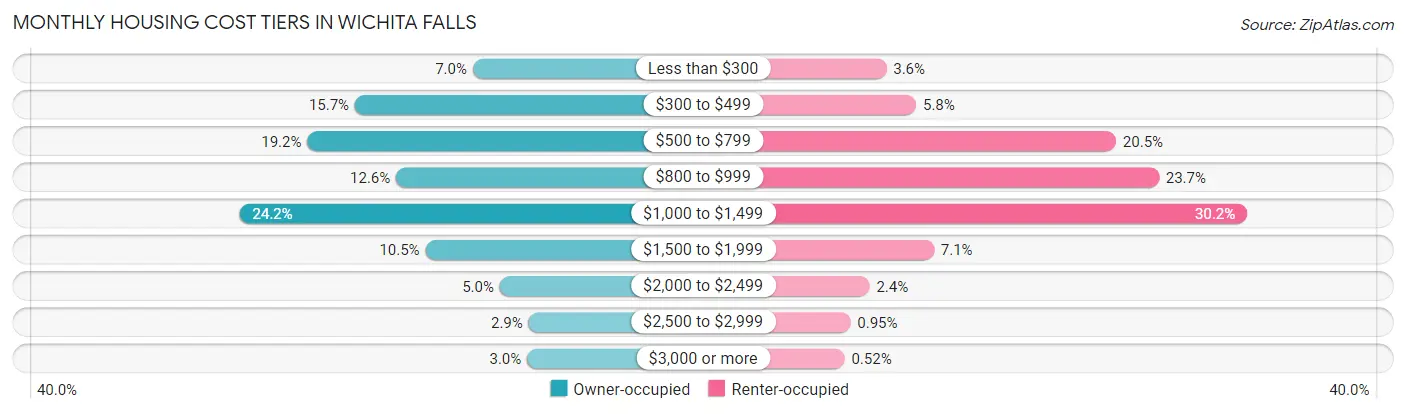
| Monthly Cost | Owner-occupied | Renter-occupied |
| Less than $300 | 1,481 (7.0%) | 594 (3.6%) |
| $300 to $499 | 3,321 (15.7%) | 955 (5.8%) |
| $500 to $799 | 4,064 (19.2%) | 3,381 (20.5%) |
| $800 to $999 | 2,679 (12.6%) | 3,901 (23.7%) |
| $1,000 to $1,499 | 5,124 (24.2%) | 4,973 (30.2%) |
| $1,500 to $1,999 | 2,221 (10.5%) | 1,170 (7.1%) |
| $2,000 to $2,499 | 1,060 (5.0%) | 389 (2.4%) |
| $2,500 to $2,999 | 611 (2.9%) | 156 (0.9%) |
| $3,000 or more | 633 (3.0%) | 85 (0.5%) |
| Total | 21,194 (100.0%) | 16,482 (100.0%) |
Physical Housing Characteristics in Wichita Falls
Housing Structures in Wichita Falls
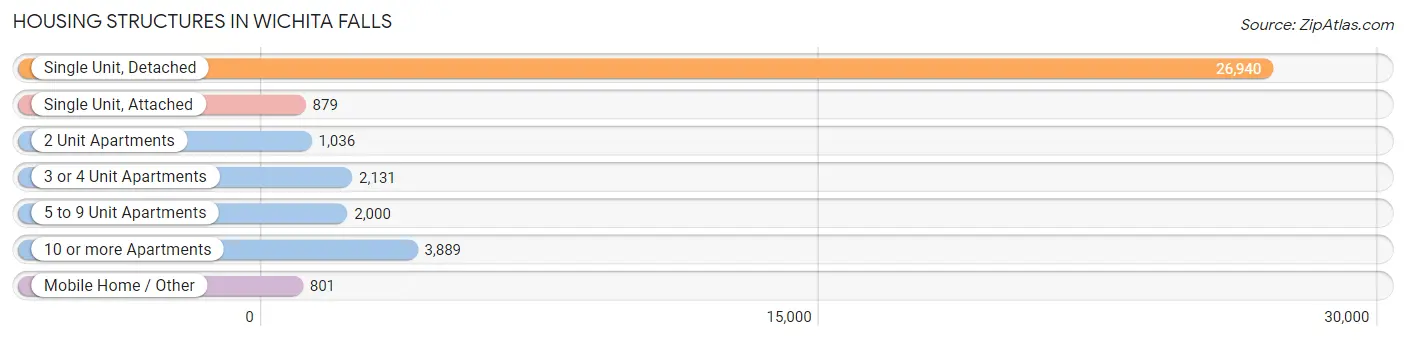
| Structure Type | # Housing Units | % Housing Units |
| Single Unit, Detached | 26,940 | 71.5% |
| Single Unit, Attached | 879 | 2.3% |
| 2 Unit Apartments | 1,036 | 2.8% |
| 3 or 4 Unit Apartments | 2,131 | 5.7% |
| 5 to 9 Unit Apartments | 2,000 | 5.3% |
| 10 or more Apartments | 3,889 | 10.3% |
| Mobile Home / Other | 801 | 2.1% |
| Total | 37,676 | 100.0% |
Housing Structures by Occupancy in Wichita Falls
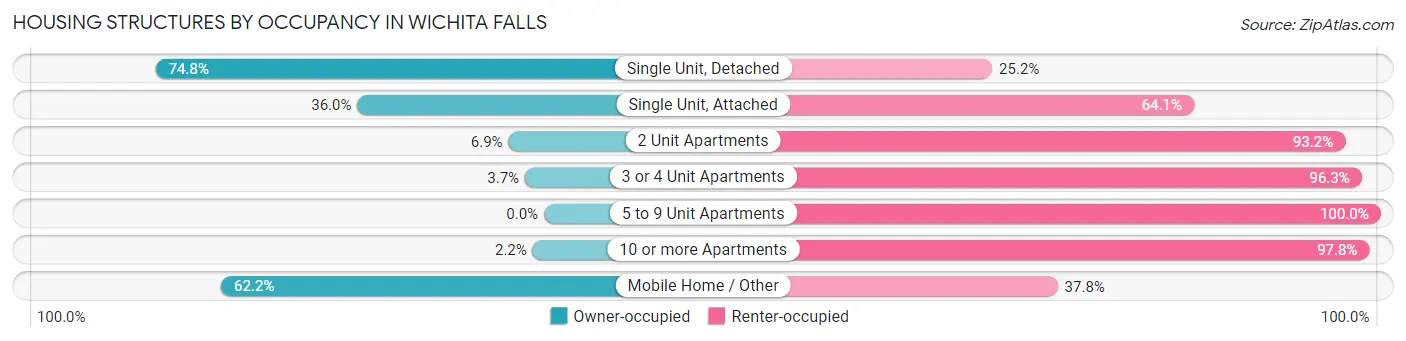
| Structure Type | Owner-occupied | Renter-occupied |
| Single Unit, Detached | 20,146 (74.8%) | 6,794 (25.2%) |
| Single Unit, Attached | 316 (35.9%) | 563 (64.0%) |
| 2 Unit Apartments | 71 (6.9%) | 965 (93.1%) |
| 3 or 4 Unit Apartments | 78 (3.7%) | 2,053 (96.3%) |
| 5 to 9 Unit Apartments | 0 (0.0%) | 2,000 (100.0%) |
| 10 or more Apartments | 85 (2.2%) | 3,804 (97.8%) |
| Mobile Home / Other | 498 (62.2%) | 303 (37.8%) |
| Total | 21,194 (56.2%) | 16,482 (43.8%) |
Housing Structures by Number of Rooms in Wichita Falls
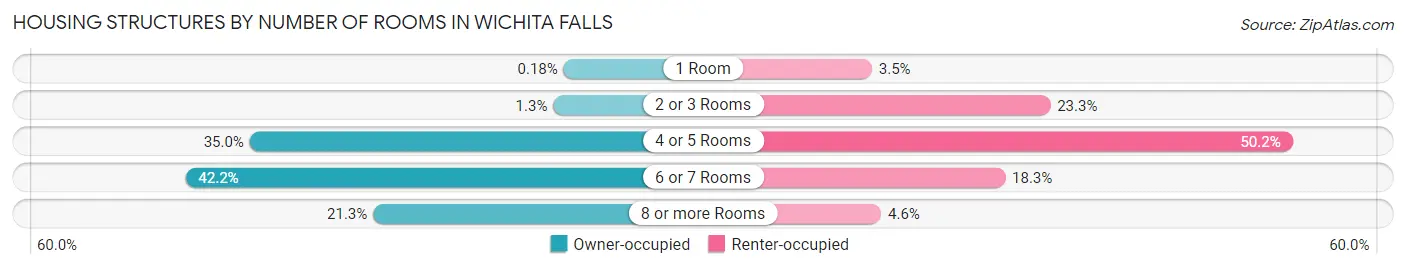
| Number of Rooms | Owner-occupied | Renter-occupied |
| 1 Room | 38 (0.2%) | 583 (3.5%) |
| 2 or 3 Rooms | 282 (1.3%) | 3,847 (23.3%) |
| 4 or 5 Rooms | 7,422 (35.0%) | 8,278 (50.2%) |
| 6 or 7 Rooms | 8,934 (42.1%) | 3,021 (18.3%) |
| 8 or more Rooms | 4,518 (21.3%) | 753 (4.6%) |
| Total | 21,194 (100.0%) | 16,482 (100.0%) |
Housing Structure by Heating Type in Wichita Falls
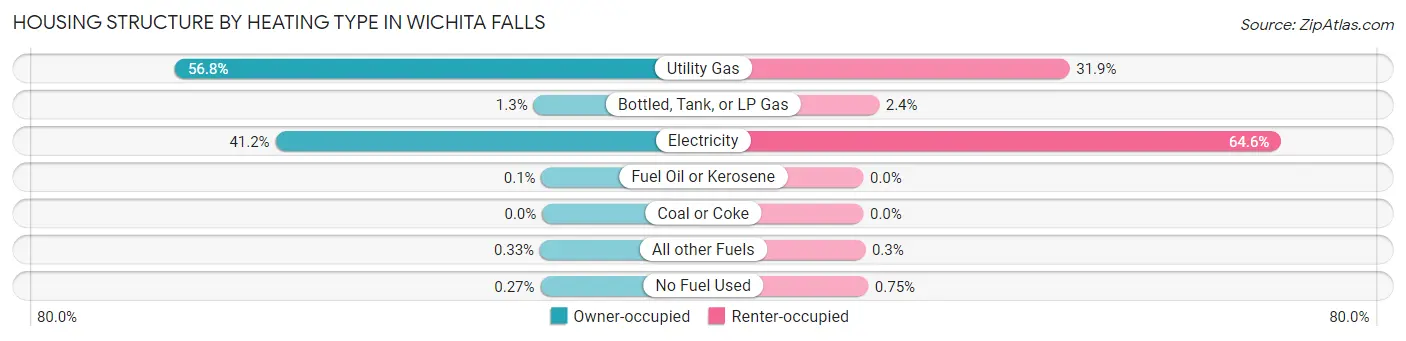
| Heating Type | Owner-occupied | Renter-occupied |
| Utility Gas | 12,028 (56.8%) | 5,256 (31.9%) |
| Bottled, Tank, or LP Gas | 281 (1.3%) | 401 (2.4%) |
| Electricity | 8,737 (41.2%) | 10,653 (64.6%) |
| Fuel Oil or Kerosene | 22 (0.1%) | 0 (0.0%) |
| Coal or Coke | 0 (0.0%) | 0 (0.0%) |
| All other Fuels | 69 (0.3%) | 49 (0.3%) |
| No Fuel Used | 57 (0.3%) | 123 (0.7%) |
| Total | 21,194 (100.0%) | 16,482 (100.0%) |
Household Vehicle Usage in Wichita Falls
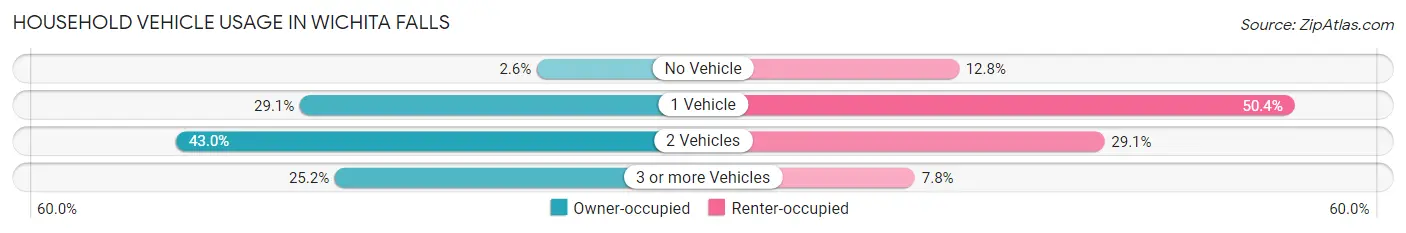
| Vehicles per Household | Owner-occupied | Renter-occupied |
| No Vehicle | 550 (2.6%) | 2,102 (12.8%) |
| 1 Vehicle | 6,175 (29.1%) | 8,301 (50.4%) |
| 2 Vehicles | 9,121 (43.0%) | 4,789 (29.1%) |
| 3 or more Vehicles | 5,348 (25.2%) | 1,290 (7.8%) |
| Total | 21,194 (100.0%) | 16,482 (100.0%) |
Real Estate & Mortgages in Wichita Falls
Real Estate and Mortgage Overview in Wichita Falls
| Characteristic | Without Mortgage | With Mortgage |
| Housing Units | 10,285 | 10,909 |
| Median Property Value | $101,800 | $146,200 |
| Median Household Income | $57,507 | $1,954 |
| Monthly Housing Costs | $538 | $592 |
| Real Estate Taxes | $1,928 | $1,123 |
Property Value by Mortgage Status in Wichita Falls
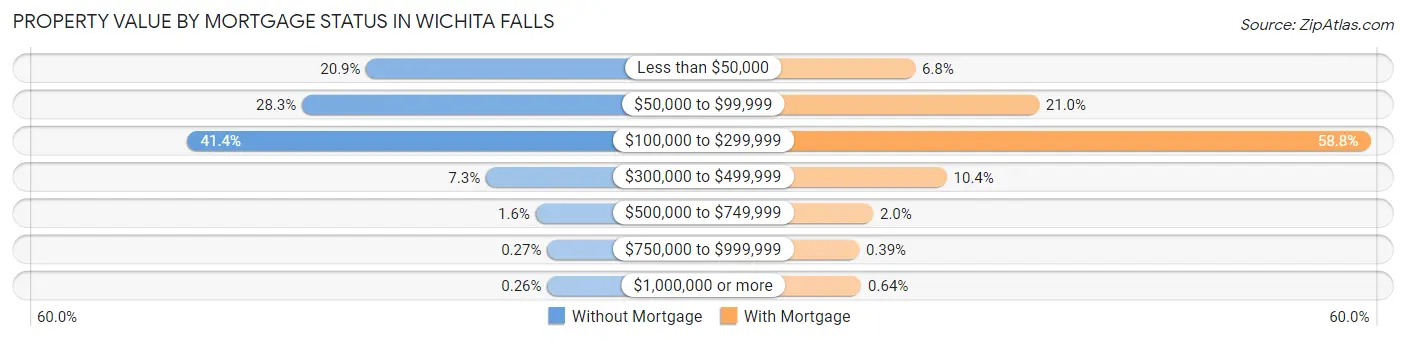
| Property Value | Without Mortgage | With Mortgage |
| Less than $50,000 | 2,154 (20.9%) | 742 (6.8%) |
| $50,000 to $99,999 | 2,910 (28.3%) | 2,285 (20.9%) |
| $100,000 to $299,999 | 4,254 (41.4%) | 6,415 (58.8%) |
| $300,000 to $499,999 | 748 (7.3%) | 1,136 (10.4%) |
| $500,000 to $749,999 | 164 (1.6%) | 218 (2.0%) |
| $750,000 to $999,999 | 28 (0.3%) | 43 (0.4%) |
| $1,000,000 or more | 27 (0.3%) | 70 (0.6%) |
| Total | 10,285 (100.0%) | 10,909 (100.0%) |
Household Income by Mortgage Status in Wichita Falls
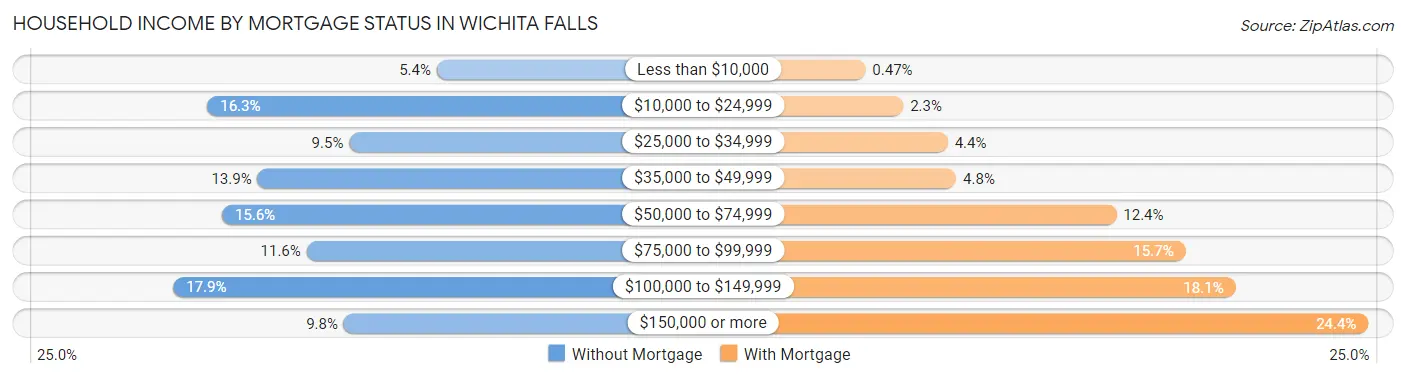
| Household Income | Without Mortgage | With Mortgage |
| Less than $10,000 | 552 (5.4%) | 51 (0.5%) |
| $10,000 to $24,999 | 1,676 (16.3%) | 248 (2.3%) |
| $25,000 to $34,999 | 981 (9.5%) | 479 (4.4%) |
| $35,000 to $49,999 | 1,431 (13.9%) | 523 (4.8%) |
| $50,000 to $74,999 | 1,604 (15.6%) | 1,355 (12.4%) |
| $75,000 to $99,999 | 1,190 (11.6%) | 1,714 (15.7%) |
| $100,000 to $149,999 | 1,843 (17.9%) | 1,973 (18.1%) |
| $150,000 or more | 1,008 (9.8%) | 2,663 (24.4%) |
| Total | 10,285 (100.0%) | 10,909 (100.0%) |
Property Value to Household Income Ratio in Wichita Falls
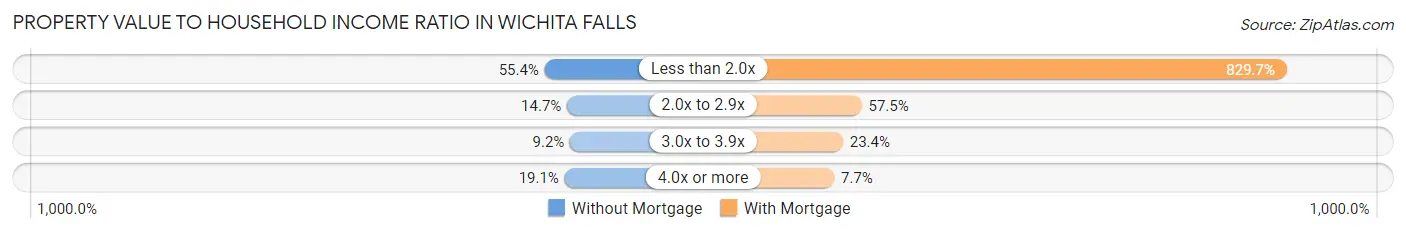
| Value-to-Income Ratio | Without Mortgage | With Mortgage |
| Less than 2.0x | 5,699 (55.4%) | 90,508 (829.7%) |
| 2.0x to 2.9x | 1,510 (14.7%) | 6,270 (57.5%) |
| 3.0x to 3.9x | 946 (9.2%) | 2,552 (23.4%) |
| 4.0x or more | 1,966 (19.1%) | 835 (7.6%) |
| Total | 10,285 (100.0%) | 10,909 (100.0%) |
Real Estate Taxes by Mortgage Status in Wichita Falls
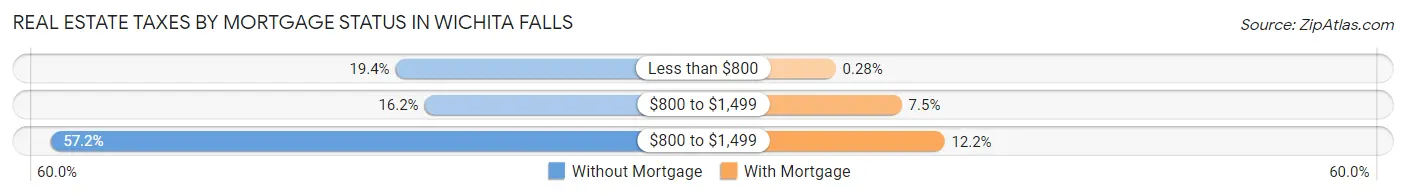
| Property Taxes | Without Mortgage | With Mortgage |
| Less than $800 | 1,991 (19.4%) | 30 (0.3%) |
| $800 to $1,499 | 1,664 (16.2%) | 820 (7.5%) |
| $800 to $1,499 | 5,881 (57.2%) | 1,332 (12.2%) |
| Total | 10,285 (100.0%) | 10,909 (100.0%) |
Health & Disability in Wichita Falls
Health Insurance Coverage by Age in Wichita Falls
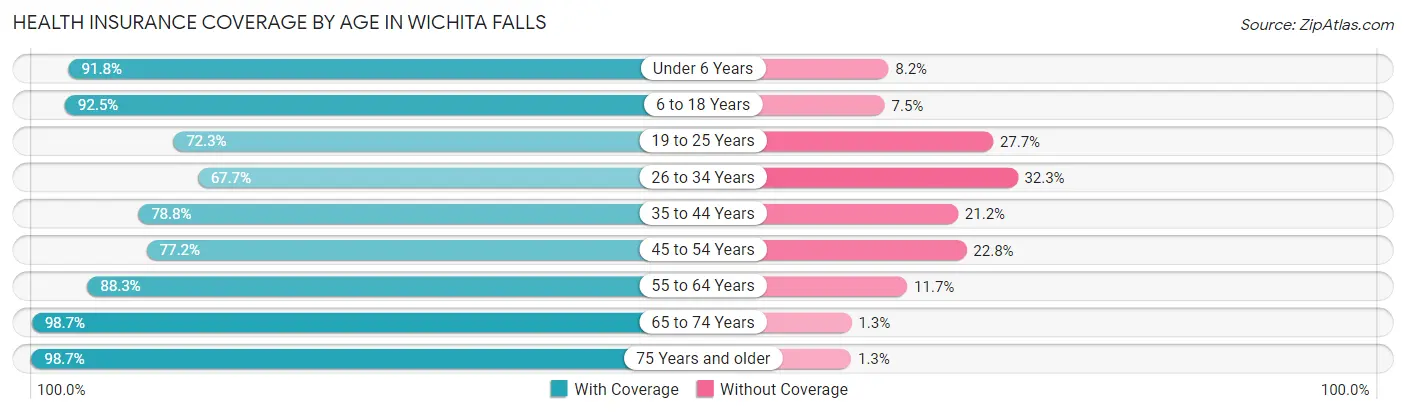
| Age Bracket | With Coverage | Without Coverage |
| Under 6 Years | 6,854 (91.8%) | 614 (8.2%) |
| 6 to 18 Years | 15,878 (92.5%) | 1,291 (7.5%) |
| 19 to 25 Years | 7,448 (72.3%) | 2,857 (27.7%) |
| 26 to 34 Years | 7,803 (67.7%) | 3,721 (32.3%) |
| 35 to 44 Years | 8,478 (78.8%) | 2,279 (21.2%) |
| 45 to 54 Years | 7,121 (77.2%) | 2,100 (22.8%) |
| 55 to 64 Years | 9,446 (88.3%) | 1,254 (11.7%) |
| 65 to 74 Years | 7,851 (98.7%) | 106 (1.3%) |
| 75 Years and older | 5,477 (98.7%) | 70 (1.3%) |
| Total | 76,356 (84.2%) | 14,292 (15.8%) |
Health Insurance Coverage by Citizenship Status in Wichita Falls
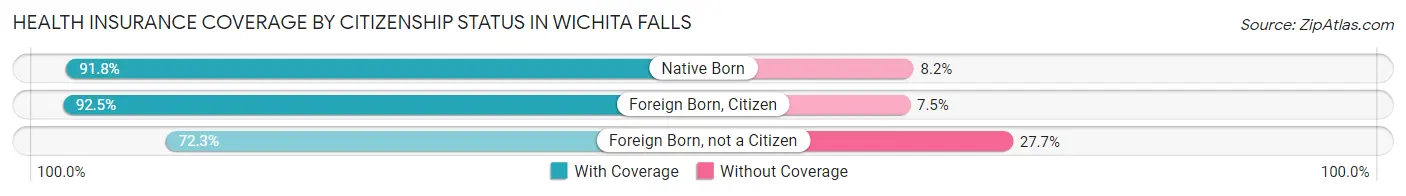
| Citizenship Status | With Coverage | Without Coverage |
| Native Born | 6,854 (91.8%) | 614 (8.2%) |
| Foreign Born, Citizen | 15,878 (92.5%) | 1,291 (7.5%) |
| Foreign Born, not a Citizen | 7,448 (72.3%) | 2,857 (27.7%) |
Health Insurance Coverage by Household Income in Wichita Falls
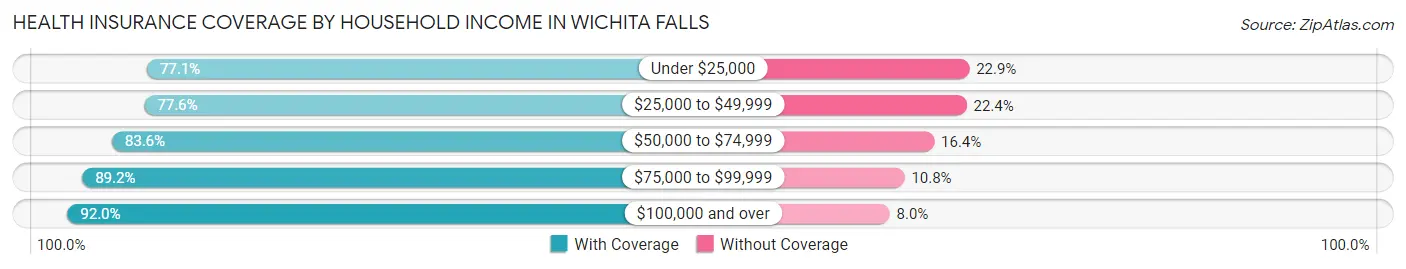
| Household Income | With Coverage | Without Coverage |
| Under $25,000 | 11,487 (77.1%) | 3,417 (22.9%) |
| $25,000 to $49,999 | 15,157 (77.6%) | 4,386 (22.4%) |
| $50,000 to $74,999 | 12,275 (83.6%) | 2,401 (16.4%) |
| $75,000 to $99,999 | 10,999 (89.2%) | 1,332 (10.8%) |
| $100,000 and over | 25,362 (92.0%) | 2,211 (8.0%) |
Public vs Private Health Insurance Coverage by Age in Wichita Falls
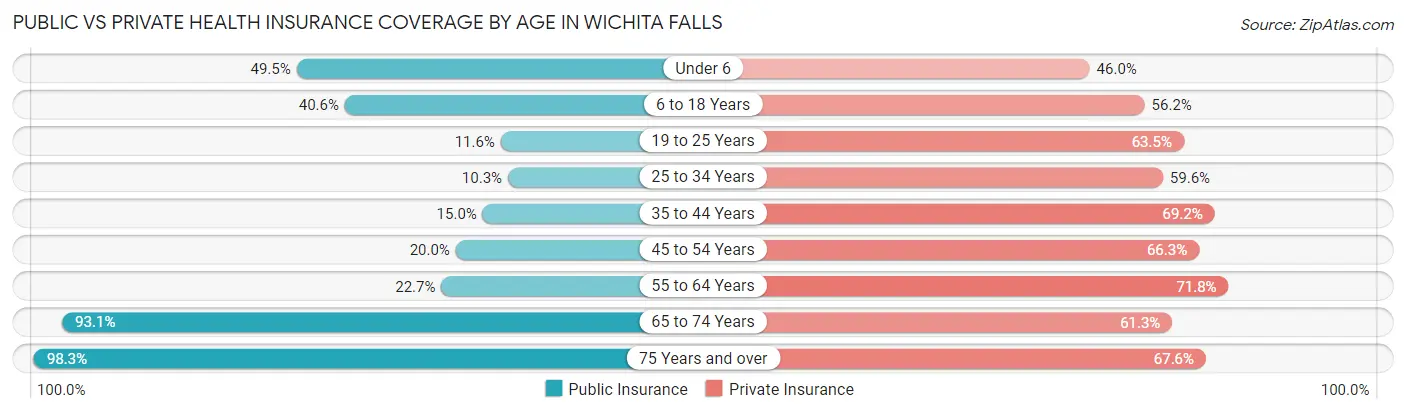
| Age Bracket | Public Insurance | Private Insurance |
| Under 6 | 3,698 (49.5%) | 3,436 (46.0%) |
| 6 to 18 Years | 6,966 (40.6%) | 9,652 (56.2%) |
| 19 to 25 Years | 1,198 (11.6%) | 6,540 (63.5%) |
| 25 to 34 Years | 1,186 (10.3%) | 6,868 (59.6%) |
| 35 to 44 Years | 1,611 (15.0%) | 7,444 (69.2%) |
| 45 to 54 Years | 1,842 (20.0%) | 6,113 (66.3%) |
| 55 to 64 Years | 2,424 (22.7%) | 7,678 (71.8%) |
| 65 to 74 Years | 7,404 (93.0%) | 4,879 (61.3%) |
| 75 Years and over | 5,452 (98.3%) | 3,748 (67.6%) |
| Total | 31,781 (35.1%) | 56,358 (62.2%) |
Disability Status by Sex by Age in Wichita Falls
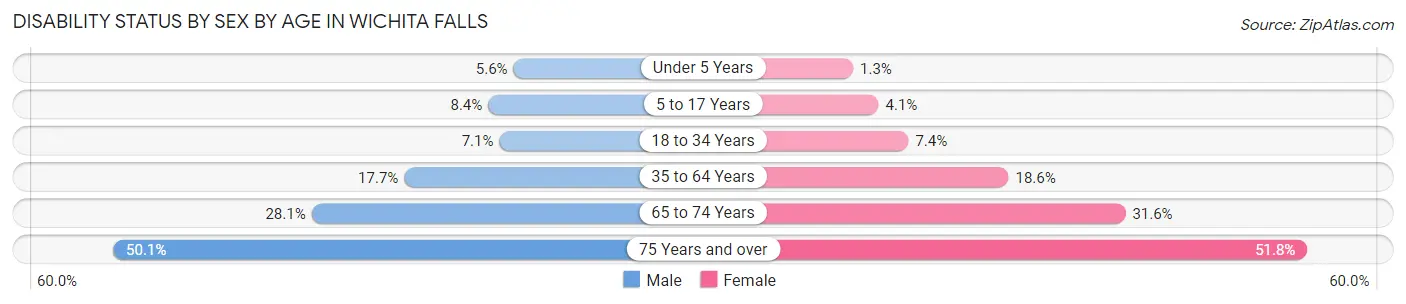
| Age Bracket | Male | Female |
| Under 5 Years | 183 (5.6%) | 39 (1.3%) |
| 5 to 17 Years | 701 (8.4%) | 341 (4.1%) |
| 18 to 34 Years | 807 (7.1%) | 897 (7.4%) |
| 35 to 64 Years | 2,631 (17.7%) | 2,941 (18.6%) |
| 65 to 74 Years | 1,061 (28.1%) | 1,319 (31.6%) |
| 75 Years and over | 1,094 (50.1%) | 1,744 (51.8%) |
Disability Class by Sex by Age in Wichita Falls
Disability Class: Hearing Difficulty
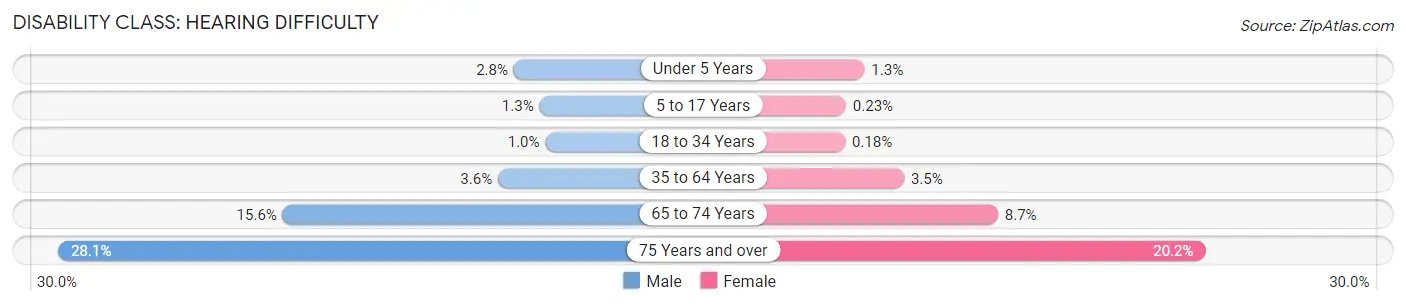
| Age Bracket | Male | Female |
| Under 5 Years | 91 (2.8%) | 39 (1.3%) |
| 5 to 17 Years | 111 (1.3%) | 19 (0.2%) |
| 18 to 34 Years | 113 (1.0%) | 22 (0.2%) |
| 35 to 64 Years | 540 (3.6%) | 548 (3.5%) |
| 65 to 74 Years | 591 (15.6%) | 363 (8.7%) |
| 75 Years and over | 614 (28.1%) | 681 (20.2%) |
Disability Class: Vision Difficulty
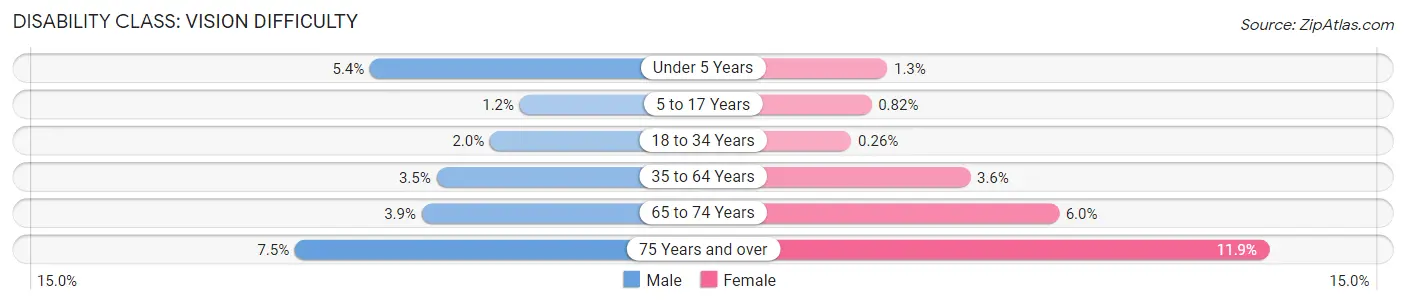
| Age Bracket | Male | Female |
| Under 5 Years | 177 (5.4%) | 39 (1.3%) |
| 5 to 17 Years | 101 (1.2%) | 68 (0.8%) |
| 18 to 34 Years | 231 (2.0%) | 32 (0.3%) |
| 35 to 64 Years | 524 (3.5%) | 566 (3.6%) |
| 65 to 74 Years | 149 (3.9%) | 252 (6.0%) |
| 75 Years and over | 163 (7.5%) | 400 (11.9%) |
Disability Class: Cognitive Difficulty
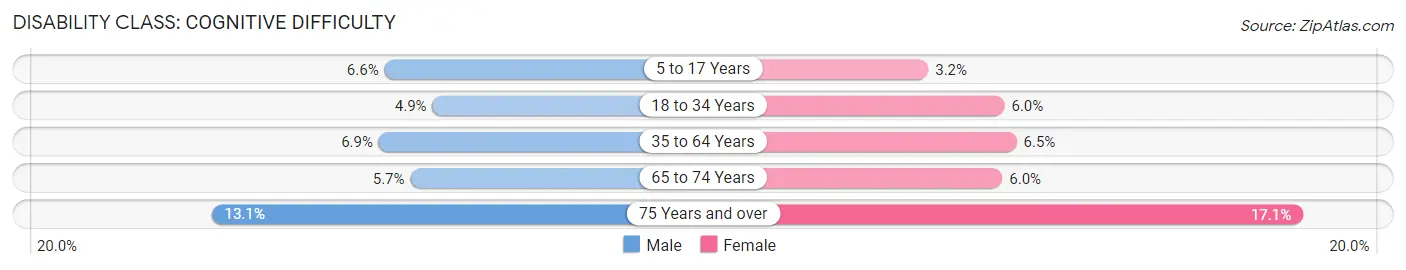
| Age Bracket | Male | Female |
| 5 to 17 Years | 555 (6.6%) | 267 (3.2%) |
| 18 to 34 Years | 551 (4.9%) | 729 (6.0%) |
| 35 to 64 Years | 1,017 (6.9%) | 1,028 (6.5%) |
| 65 to 74 Years | 215 (5.7%) | 249 (6.0%) |
| 75 Years and over | 285 (13.1%) | 576 (17.1%) |
Disability Class: Ambulatory Difficulty
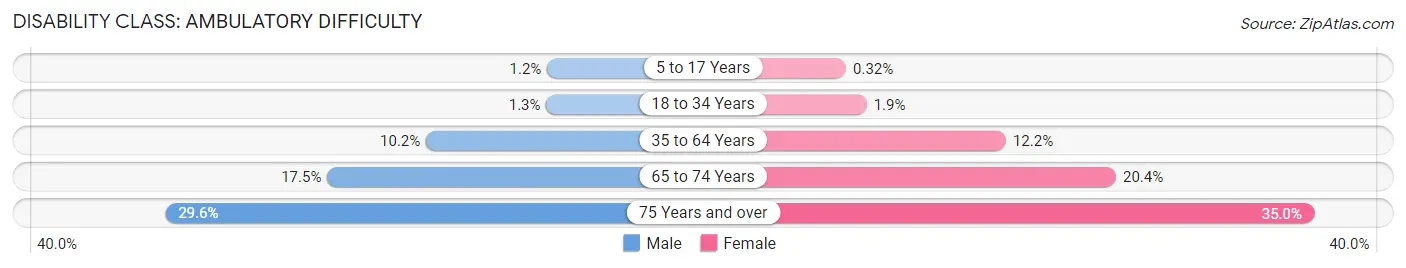
| Age Bracket | Male | Female |
| 5 to 17 Years | 100 (1.2%) | 27 (0.3%) |
| 18 to 34 Years | 143 (1.3%) | 224 (1.8%) |
| 35 to 64 Years | 1,513 (10.2%) | 1,930 (12.2%) |
| 65 to 74 Years | 663 (17.5%) | 850 (20.4%) |
| 75 Years and over | 645 (29.6%) | 1,179 (35.0%) |
Disability Class: Self-Care Difficulty
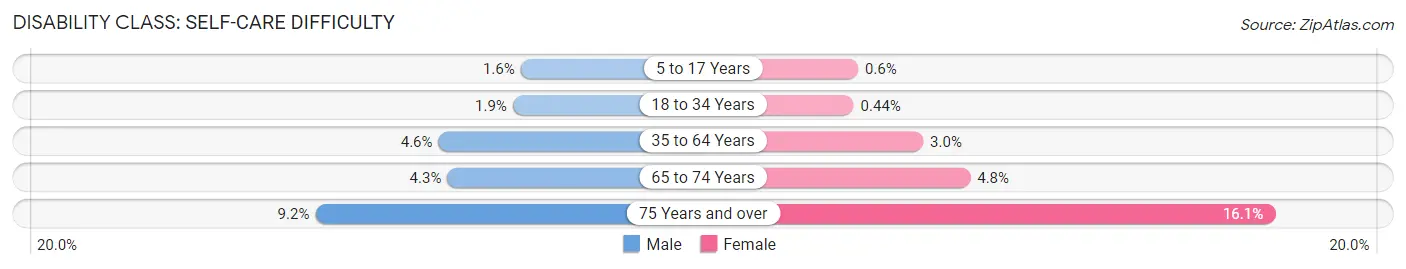
| Age Bracket | Male | Female |
| 5 to 17 Years | 133 (1.6%) | 50 (0.6%) |
| 18 to 34 Years | 213 (1.9%) | 53 (0.4%) |
| 35 to 64 Years | 688 (4.6%) | 478 (3.0%) |
| 65 to 74 Years | 163 (4.3%) | 199 (4.8%) |
| 75 Years and over | 201 (9.2%) | 541 (16.1%) |
Technology Access in Wichita Falls
Computing Device Access in Wichita Falls
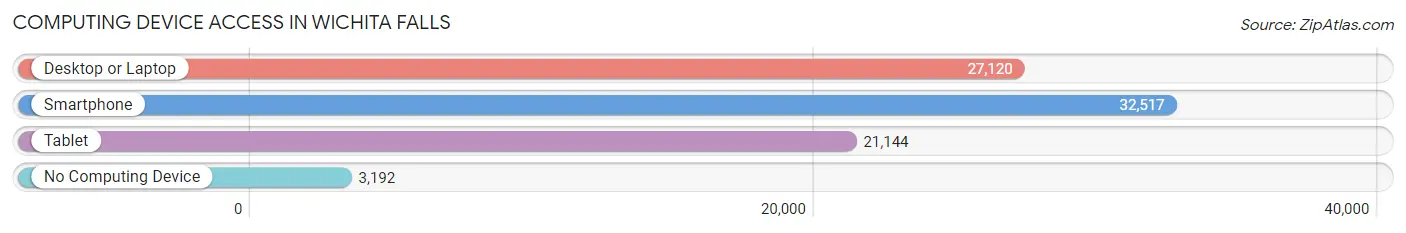
| Device Type | # Households | % Households |
| Desktop or Laptop | 27,120 | 72.0% |
| Smartphone | 32,517 | 86.3% |
| Tablet | 21,144 | 56.1% |
| No Computing Device | 3,192 | 8.5% |
| Total | 37,676 | 100.0% |
Internet Access in Wichita Falls
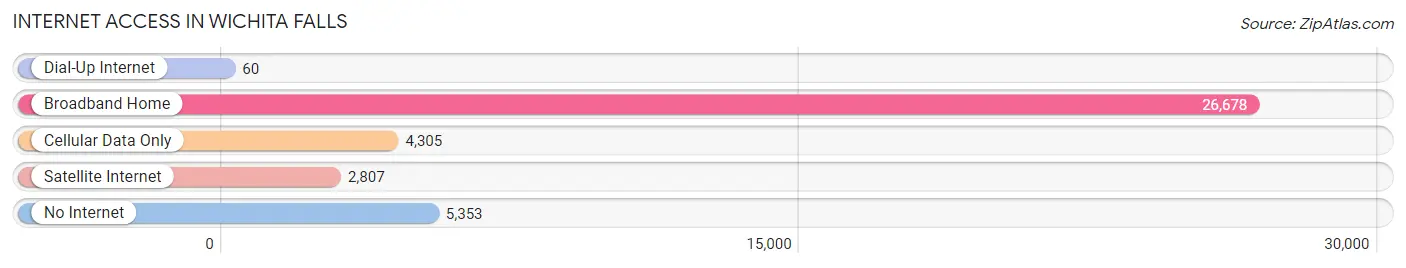
| Internet Type | # Households | % Households |
| Dial-Up Internet | 60 | 0.2% |
| Broadband Home | 26,678 | 70.8% |
| Cellular Data Only | 4,305 | 11.4% |
| Satellite Internet | 2,807 | 7.4% |
| No Internet | 5,353 | 14.2% |
| Total | 37,676 | 100.0% |
Wichita Falls Summary
Wichita Falls is a city located in the state of Texas, United States. It is the county seat of Wichita County and is situated in the northern part of the state. The city is located on the Red River and is the principal city of the Wichita Falls Metropolitan Statistical Area, which encompasses all of Archer, Clay, and Wichita counties. As of the 2010 census, the city had a population of 104,553, making it the 38th-most populous city in Texas.
History
The area that is now Wichita Falls was first settled in 1876 by a group of settlers led by a man named Frank Kell. The settlers established a trading post near the Red River and named it Wichita Falls, after the nearby falls of the same name. The settlement quickly grew and by 1880, the population had reached 1,500.
In 1882, the city was incorporated and the first mayor was elected. The city continued to grow and by 1900, the population had reached 5,000. In the early 1900s, the city experienced a period of rapid growth and development. The city was home to several large businesses, including the Wichita Falls Oil and Gas Company, the Wichita Falls Cotton Oil Company, and the Wichita Falls and Northwestern Railway.
In the 1920s, the city experienced a period of economic growth and prosperity. The city was home to several large businesses, including the Wichita Falls Oil and Gas Company, the Wichita Falls Cotton Oil Company, and the Wichita Falls and Northwestern Railway. The city also became a major center for the oil and gas industry.
In the 1930s, the city experienced a period of economic decline due to the Great Depression. The city's population decreased from a peak of over 40,000 in 1930 to just over 20,000 in 1940. The city's economy slowly recovered in the 1940s and 1950s, and by 1960, the population had reached over 40,000 again.
Geography
Wichita Falls is located in the northern part of Texas, in the Red River Valley. The city is situated on the Red River, which forms the border between Texas and Oklahoma. The city is located approximately 100 miles northwest of Dallas and 200 miles south of Oklahoma City.
The city has a total area of 70.2 square miles, of which 69.9 square miles is land and 0.3 square miles is water. The city is located at an elevation of 1,072 feet above sea level.
Economy
Wichita Falls is a major center for the oil and gas industry. The city is home to several large oil and gas companies, including the Wichita Falls Oil and Gas Company, the Wichita Falls Cotton Oil Company, and the Wichita Falls and Northwestern Railway. The city is also home to several large manufacturing companies, including the Wichita Falls Manufacturing Company, the Wichita Falls Machine Company, and the Wichita Falls Foundry and Machine Company.
The city is also home to Sheppard Air Force Base, which is the largest training base for the United States Air Force. The base is home to the 82nd Training Wing and the 80th Flying Training Wing.
Demographics
As of the 2010 census, the city had a population of 104,553. The racial makeup of the city was 73.3% White, 11.3% African American, 0.7% Native American, 1.7% Asian, 0.1% Pacific Islander, 10.2% from other races, and 3.1% from two or more races. Hispanic or Latino of any race were 20.2% of the population.
The median income for a household in the city was $37,837, and the median income for a family was $45,945. The per capita income for the city was $20,945. About 15.3% of families and 19.2% of the population were below the poverty line, including 28.2% of those under age 18 and 10.2% of those age 65 or over.
Common Questions
What is Per Capita Income in Wichita Falls?
Per Capita income in Wichita Falls is $29,940.
What is the Median Family Income in Wichita Falls?
Median Family Income in Wichita Falls is $73,795.
What is the Median Household income in Wichita Falls?
Median Household Income in Wichita Falls is $55,584.
What is Income or Wage Gap in Wichita Falls?
Income or Wage Gap in Wichita Falls is 24.2%.
Women in Wichita Falls earn 75.8 cents for every dollar earned by a man.
What is Family Income Deficit in Wichita Falls?
Family Income Deficit in Wichita Falls is $10,795.
Families that are below poverty line in Wichita Falls earn $10,795 less on average than the poverty threshold level.
What is Inequality or Gini Index in Wichita Falls?
Inequality or Gini Index in Wichita Falls is 0.47.
What is the Total Population of Wichita Falls?
Total Population of Wichita Falls is 102,482.
What is the Total Male Population of Wichita Falls?
Total Male Population of Wichita Falls is 53,656.
What is the Total Female Population of Wichita Falls?
Total Female Population of Wichita Falls is 48,826.
What is the Ratio of Males per 100 Females in Wichita Falls?
There are 109.89 Males per 100 Females in Wichita Falls.
What is the Ratio of Females per 100 Males in Wichita Falls?
There are 91.00 Females per 100 Males in Wichita Falls.
What is the Median Population Age in Wichita Falls?
Median Population Age in Wichita Falls is 32.8 Years.
What is the Average Family Size in Wichita Falls
Average Family Size in Wichita Falls is 3.1 People.
What is the Average Household Size in Wichita Falls
Average Household Size in Wichita Falls is 2.4 People.
How Large is the Labor Force in Wichita Falls?
There are 52,188 People in the Labor Forcein in Wichita Falls.
What is the Percentage of People in the Labor Force in Wichita Falls?
63.8% of People are in the Labor Force in Wichita Falls.
What is the Unemployment Rate in Wichita Falls?
Unemployment Rate in Wichita Falls is 4.4%.