Cloverleaf, TX Map & Demographics
Cloverleaf Map
Cloverleaf Overview
$19,984
PER CAPITA INCOME
$54,980
AVG FAMILY INCOME
$53,762
AVG HOUSEHOLD INCOME
28.7%
WAGE / INCOME GAP [ % ]
71.3¢/ $1
WAGE / INCOME GAP [ $ ]
$10,068
FAMILY INCOME DEFICIT
0.41
INEQUALITY / GINI INDEX
24,735
TOTAL POPULATION
12,806
MALE POPULATION
11,929
FEMALE POPULATION
107.35
MALES / 100 FEMALES
93.15
FEMALES / 100 MALES
30.0
MEDIAN AGE
4.0
AVG FAMILY SIZE
3.5
AVG HOUSEHOLD SIZE
10,958
LABOR FORCE [ PEOPLE ]
63.0%
PERCENT IN LABOR FORCE
7.6%
UNEMPLOYMENT RATE
Income in Cloverleaf
Income Overview in Cloverleaf
Per Capita Income in Cloverleaf is $19,984, while median incomes of families and households are $54,980 and $53,762 respectively.
| Characteristic | Number | Measure |
| Per Capita Income | 24,735 | $19,984 |
| Median Family Income | 5,448 | $54,980 |
| Mean Family Income | 5,448 | $70,304 |
| Median Household Income | 6,992 | $53,762 |
| Mean Household Income | 6,992 | $67,949 |
| Income Deficit | 5,448 | $10,068 |
| Wage / Income Gap (%) | 24,735 | 28.71% |
| Wage / Income Gap ($) | 24,735 | 71.29¢ per $1 |
| Gini / Inequality Index | 24,735 | 0.41 |
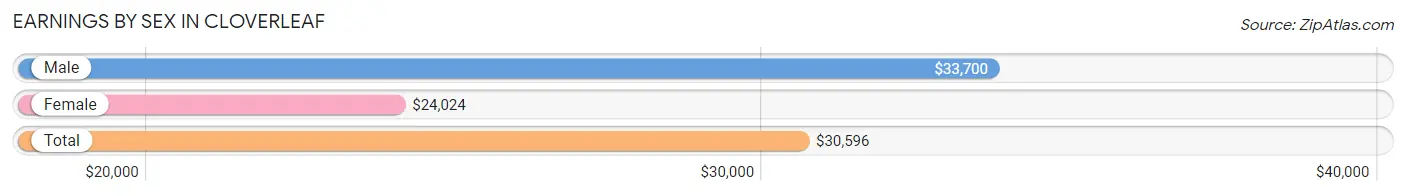
Earnings by Sex in Cloverleaf
Average Earnings in Cloverleaf are $30,596, $33,700 for men and $24,024 for women, a difference of 28.7%.
| Sex | Number | Average Earnings |
| Male | 6,811 (60.9%) | $33,700 |
| Female | 4,368 (39.1%) | $24,024 |
| Total | 11,179 (100.0%) | $30,596 |
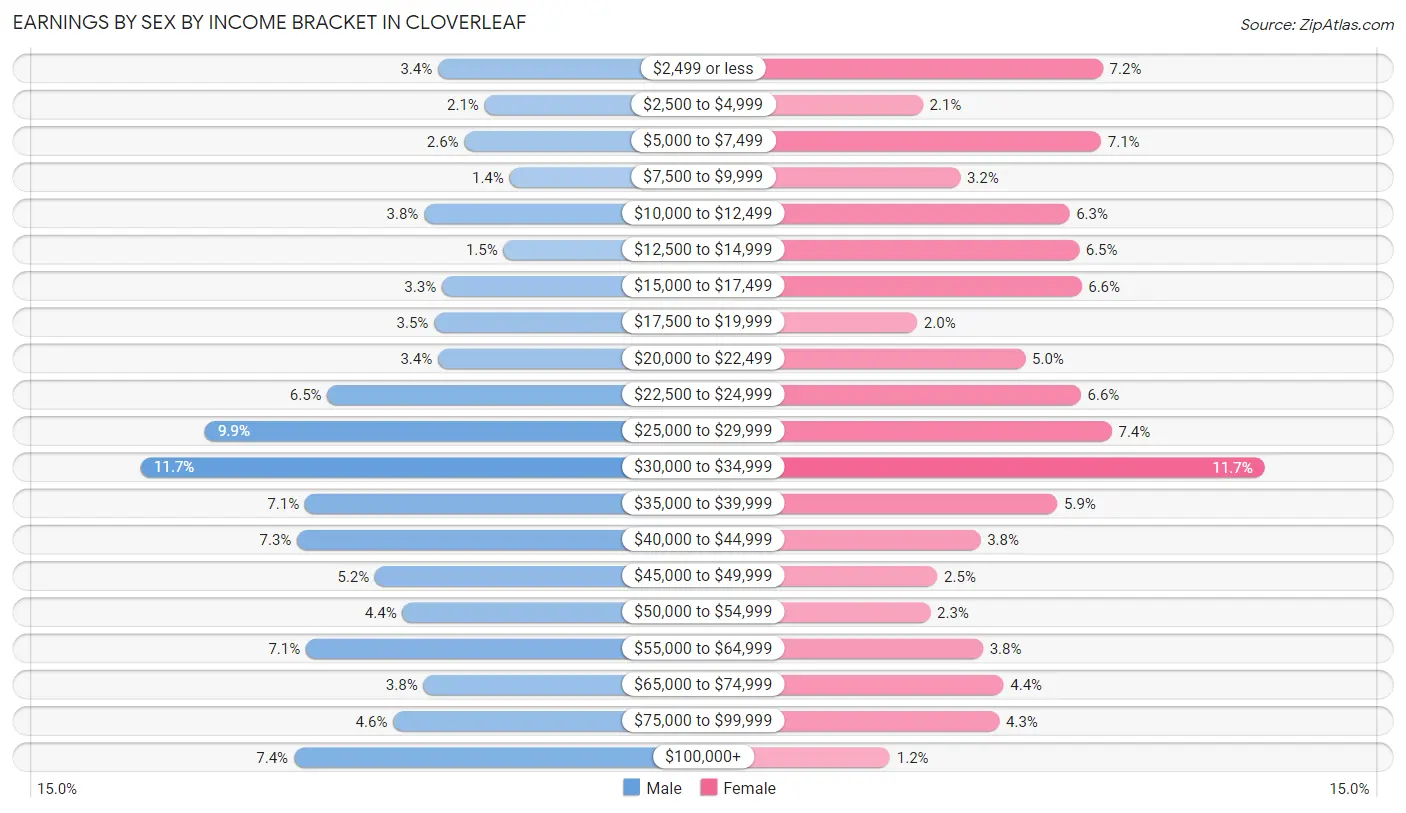
Earnings by Sex by Income Bracket in Cloverleaf
The most common earnings brackets in Cloverleaf are $30,000 to $34,999 for men (799 | 11.7%) and $30,000 to $34,999 for women (513 | 11.7%).
| Income | Male | Female |
| $2,499 or less | 230 (3.4%) | 314 (7.2%) |
| $2,500 to $4,999 | 141 (2.1%) | 93 (2.1%) |
| $5,000 to $7,499 | 180 (2.6%) | 312 (7.1%) |
| $7,500 to $9,999 | 93 (1.4%) | 139 (3.2%) |
| $10,000 to $12,499 | 257 (3.8%) | 273 (6.2%) |
| $12,500 to $14,999 | 105 (1.5%) | 285 (6.5%) |
| $15,000 to $17,499 | 223 (3.3%) | 288 (6.6%) |
| $17,500 to $19,999 | 238 (3.5%) | 86 (2.0%) |
| $20,000 to $22,499 | 230 (3.4%) | 219 (5.0%) |
| $22,500 to $24,999 | 442 (6.5%) | 287 (6.6%) |
| $25,000 to $29,999 | 676 (9.9%) | 325 (7.4%) |
| $30,000 to $34,999 | 799 (11.7%) | 513 (11.7%) |
| $35,000 to $39,999 | 485 (7.1%) | 258 (5.9%) |
| $40,000 to $44,999 | 500 (7.3%) | 164 (3.7%) |
| $45,000 to $49,999 | 351 (5.1%) | 111 (2.5%) |
| $50,000 to $54,999 | 298 (4.4%) | 102 (2.3%) |
| $55,000 to $64,999 | 483 (7.1%) | 167 (3.8%) |
| $65,000 to $74,999 | 258 (3.8%) | 192 (4.4%) |
| $75,000 to $99,999 | 316 (4.6%) | 187 (4.3%) |
| $100,000+ | 506 (7.4%) | 53 (1.2%) |
| Total | 6,811 (100.0%) | 4,368 (100.0%) |
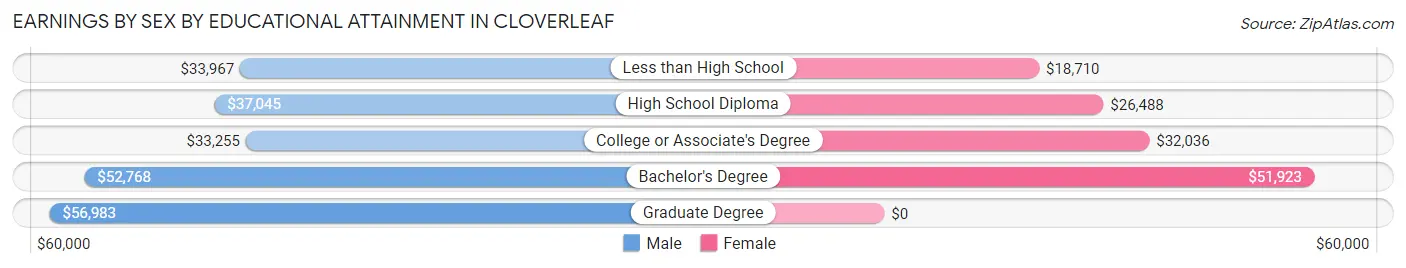
Earnings by Sex by Educational Attainment in Cloverleaf
Average earnings in Cloverleaf are $35,695 for men and $27,003 for women, a difference of 24.3%. Men with an educational attainment of graduate degree enjoy the highest average annual earnings of $56,983, while those with college or associate's degree education earn the least with $33,255. Women with an educational attainment of bachelor's degree earn the most with the average annual earnings of $51,923, while those with less than high school education have the smallest earnings of $18,710.
| Educational Attainment | Male Income | Female Income |
| Less than High School | $33,967 | $18,710 |
| High School Diploma | $37,045 | $26,488 |
| College or Associate's Degree | $33,255 | $32,036 |
| Bachelor's Degree | $52,768 | $51,923 |
| Graduate Degree | $56,983 | $0 |
| Total | $35,695 | $27,003 |
Family Income in Cloverleaf
Family Income Brackets in Cloverleaf
According to the Cloverleaf family income data, there are 1,013 families falling into the $50,000 to $74,999 income range, which is the most common income bracket and makes up 18.6% of all families. Conversely, the $200,000+ income bracket is the least frequent group with only 191 families (3.5%) belonging to this category.
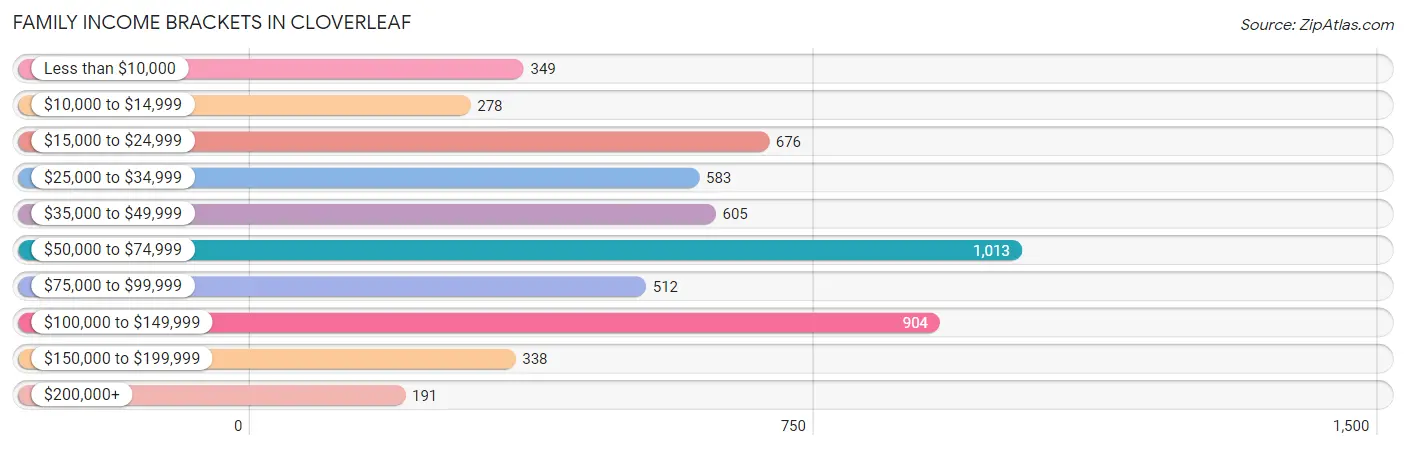
| Income Bracket | # Families | % Families |
| Less than $10,000 | 349 | 6.4% |
| $10,000 to $14,999 | 278 | 5.1% |
| $15,000 to $24,999 | 676 | 12.4% |
| $25,000 to $34,999 | 583 | 10.7% |
| $35,000 to $49,999 | 605 | 11.1% |
| $50,000 to $74,999 | 1,013 | 18.6% |
| $75,000 to $99,999 | 512 | 9.4% |
| $100,000 to $149,999 | 904 | 16.6% |
| $150,000 to $199,999 | 338 | 6.2% |
| $200,000+ | 191 | 3.5% |
Family Income by Famaliy Size in Cloverleaf
7+ person families (312 | 5.7%) account for the highest median family income in Cloverleaf with $96,824 per family, while 3-person families (1,159 | 21.3%) have the highest median income of $18,482 per family member.
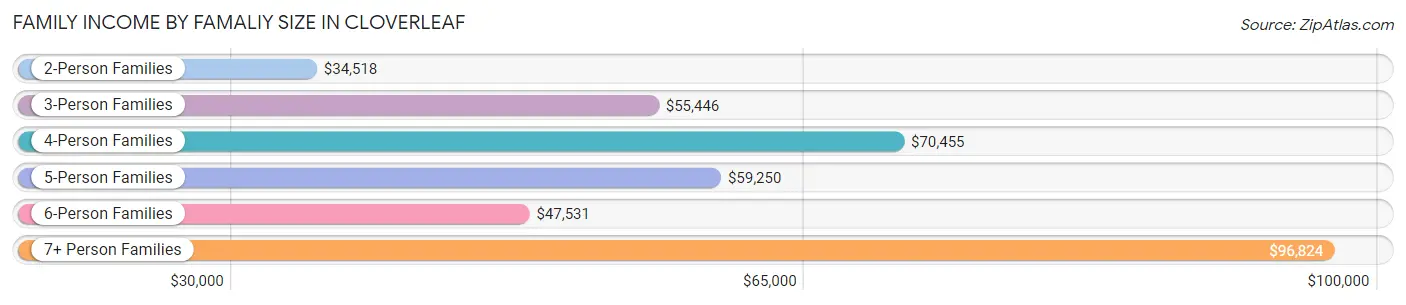
| Income Bracket | # Families | Median Income |
| 2-Person Families | 1,484 (27.2%) | $34,518 |
| 3-Person Families | 1,159 (21.3%) | $55,446 |
| 4-Person Families | 1,096 (20.1%) | $70,455 |
| 5-Person Families | 936 (17.2%) | $59,250 |
| 6-Person Families | 461 (8.5%) | $47,531 |
| 7+ Person Families | 312 (5.7%) | $96,824 |
| Total | 5,448 (100.0%) | $54,980 |
Family Income by Number of Earners in Cloverleaf
The median family income in Cloverleaf is $54,980, with families comprising 3+ earners (1,011) having the highest median family income of $118,007, while families with no earners (793) have the lowest median family income of $16,884, accounting for 18.6% and 14.6% of families, respectively.
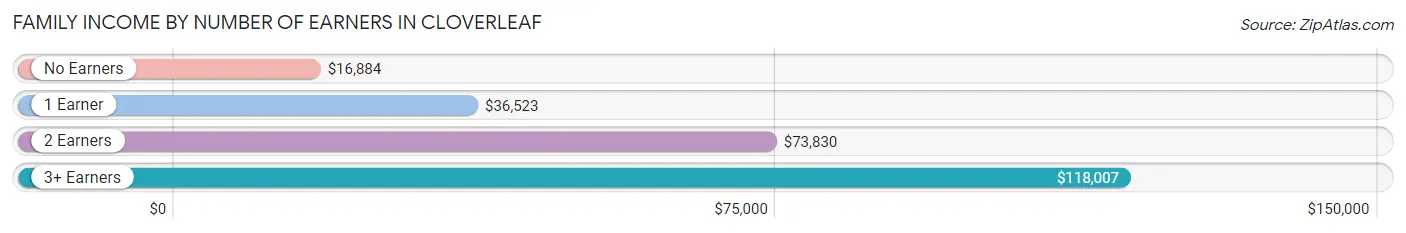
| Number of Earners | # Families | Median Income |
| No Earners | 793 (14.6%) | $16,884 |
| 1 Earner | 2,213 (40.6%) | $36,523 |
| 2 Earners | 1,431 (26.3%) | $73,830 |
| 3+ Earners | 1,011 (18.6%) | $118,007 |
| Total | 5,448 (100.0%) | $54,980 |
Household Income in Cloverleaf
Household Income Brackets in Cloverleaf
With 1,412 households falling in the category, the $50,000 to $74,999 income range is the most frequent in Cloverleaf, accounting for 20.2% of all households. In contrast, only 196 households (2.8%) fall into the $200,000+ income bracket, making it the least populous group.
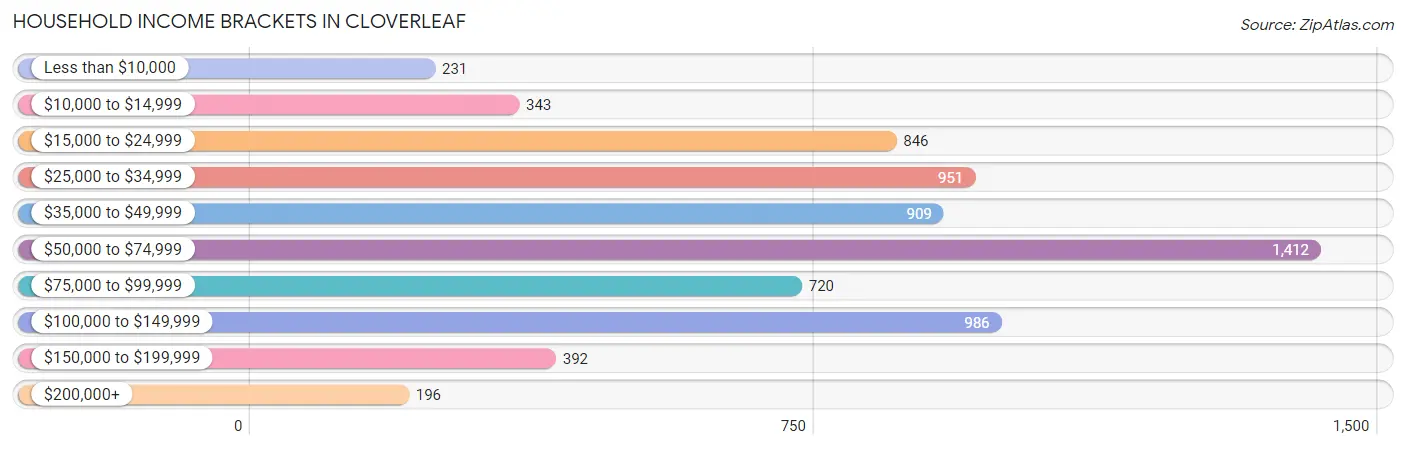
| Income Bracket | # Households | % Households |
| Less than $10,000 | 231 | 3.3% |
| $10,000 to $14,999 | 343 | 4.9% |
| $15,000 to $24,999 | 846 | 12.1% |
| $25,000 to $34,999 | 951 | 13.6% |
| $35,000 to $49,999 | 909 | 13.0% |
| $50,000 to $74,999 | 1,412 | 20.2% |
| $75,000 to $99,999 | 720 | 10.3% |
| $100,000 to $149,999 | 986 | 14.1% |
| $150,000 to $199,999 | 392 | 5.6% |
| $200,000+ | 196 | 2.8% |
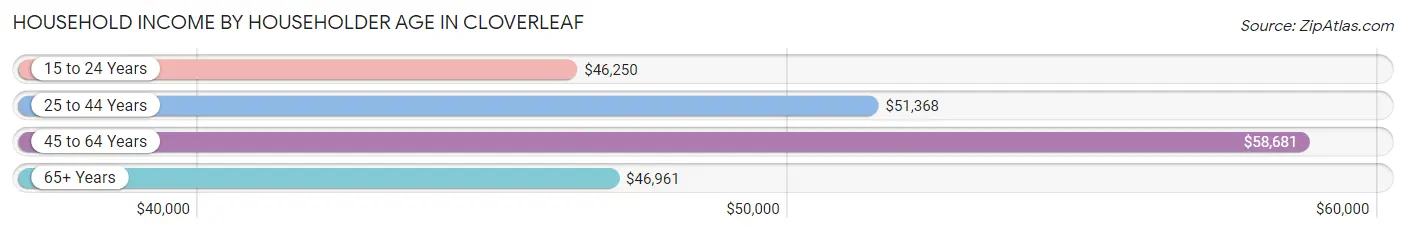
Household Income by Householder Age in Cloverleaf
The median household income in Cloverleaf is $53,762, with the highest median household income of $58,681 found in the 45 to 64 years age bracket for the primary householder. A total of 2,719 households (38.9%) fall into this category. Meanwhile, the 15 to 24 years age bracket for the primary householder has the lowest median household income of $46,250, with 207 households (3.0%) in this group.
| Income Bracket | # Households | Median Income |
| 15 to 24 Years | 207 (3.0%) | $46,250 |
| 25 to 44 Years | 2,873 (41.1%) | $51,368 |
| 45 to 64 Years | 2,719 (38.9%) | $58,681 |
| 65+ Years | 1,193 (17.1%) | $46,961 |
| Total | 6,992 (100.0%) | $53,762 |
Poverty in Cloverleaf
Income Below Poverty by Sex and Age in Cloverleaf
With 21.1% poverty level for males and 31.0% for females among the residents of Cloverleaf, 15 year old males and 5 year old females are the most vulnerable to poverty, with 199 males (63.2%) and 114 females (53.5%) in their respective age groups living below the poverty level.
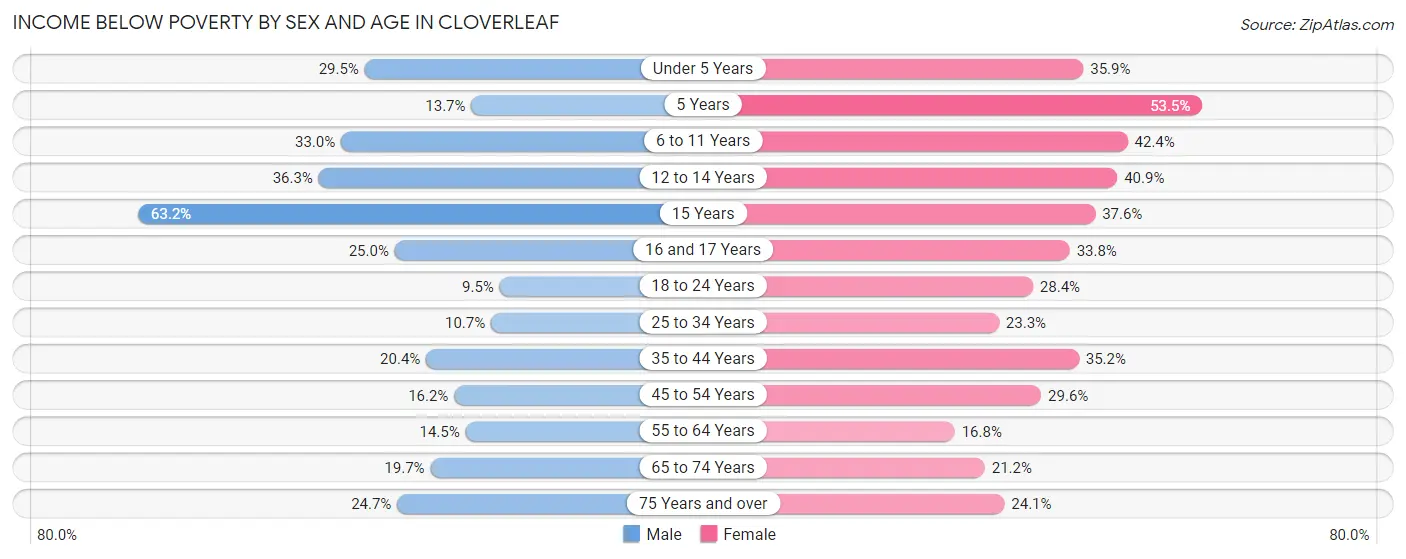
| Age Bracket | Male | Female |
| Under 5 Years | 282 (29.5%) | 341 (35.9%) |
| 5 Years | 28 (13.7%) | 114 (53.5%) |
| 6 to 11 Years | 470 (33.0%) | 646 (42.4%) |
| 12 to 14 Years | 303 (36.3%) | 254 (40.9%) |
| 15 Years | 199 (63.2%) | 108 (37.6%) |
| 16 and 17 Years | 147 (25.0%) | 177 (33.8%) |
| 18 to 24 Years | 110 (9.5%) | 313 (28.4%) |
| 25 to 34 Years | 225 (10.7%) | 346 (23.3%) |
| 35 to 44 Years | 322 (20.4%) | 587 (35.2%) |
| 45 to 54 Years | 245 (16.2%) | 338 (29.6%) |
| 55 to 64 Years | 175 (14.5%) | 219 (16.8%) |
| 65 to 74 Years | 121 (19.7%) | 131 (21.2%) |
| 75 Years and over | 75 (24.7%) | 119 (24.1%) |
| Total | 2,702 (21.1%) | 3,693 (31.0%) |
Income Above Poverty by Sex and Age in Cloverleaf
According to the poverty statistics in Cloverleaf, males aged 18 to 24 years and females aged 55 to 64 years are the age groups that are most secure financially, with 90.5% of males and 83.2% of females in these age groups living above the poverty line.
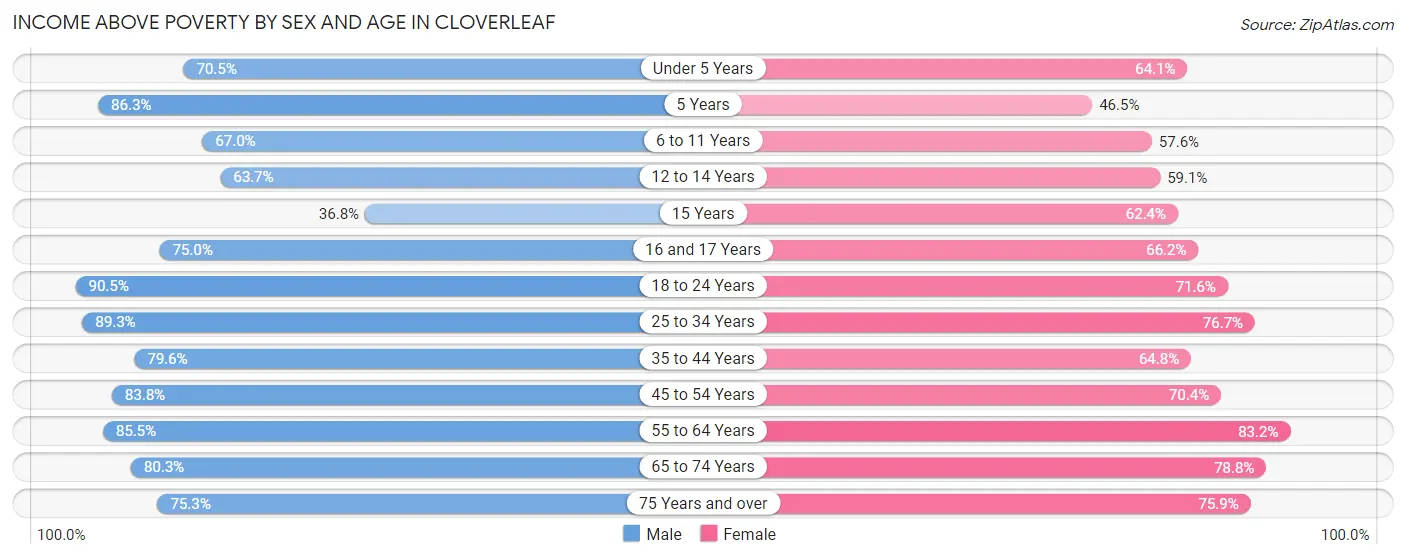
| Age Bracket | Male | Female |
| Under 5 Years | 674 (70.5%) | 610 (64.1%) |
| 5 Years | 177 (86.3%) | 99 (46.5%) |
| 6 to 11 Years | 954 (67.0%) | 876 (57.6%) |
| 12 to 14 Years | 531 (63.7%) | 367 (59.1%) |
| 15 Years | 116 (36.8%) | 179 (62.4%) |
| 16 and 17 Years | 440 (75.0%) | 346 (66.2%) |
| 18 to 24 Years | 1,053 (90.5%) | 790 (71.6%) |
| 25 to 34 Years | 1,870 (89.3%) | 1,137 (76.7%) |
| 35 to 44 Years | 1,259 (79.6%) | 1,081 (64.8%) |
| 45 to 54 Years | 1,266 (83.8%) | 804 (70.4%) |
| 55 to 64 Years | 1,029 (85.5%) | 1,087 (83.2%) |
| 65 to 74 Years | 492 (80.3%) | 486 (78.8%) |
| 75 Years and over | 229 (75.3%) | 374 (75.9%) |
| Total | 10,090 (78.9%) | 8,236 (69.0%) |
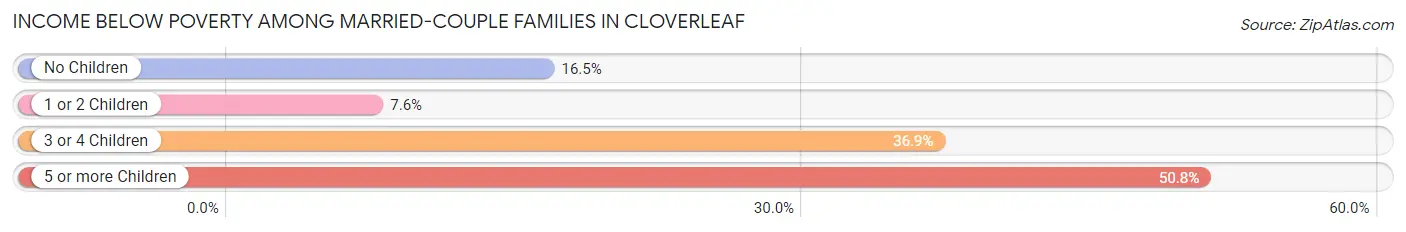
Income Below Poverty Among Married-Couple Families in Cloverleaf
The poverty statistics for married-couple families in Cloverleaf show that 18.2% or 607 of the total 3,334 families live below the poverty line. Families with 5 or more children have the highest poverty rate of 50.8%, comprising of 31 families. On the other hand, families with 1 or 2 children have the lowest poverty rate of 7.6%, which includes 87 families.
| Children | Above Poverty | Below Poverty |
| No Children | 1,212 (83.5%) | 240 (16.5%) |
| 1 or 2 Children | 1,060 (92.4%) | 87 (7.6%) |
| 3 or 4 Children | 425 (63.1%) | 249 (36.9%) |
| 5 or more Children | 30 (49.2%) | 31 (50.8%) |
| Total | 2,727 (81.8%) | 607 (18.2%) |
Income Below Poverty Among Single-Parent Households in Cloverleaf
According to the poverty data in Cloverleaf, 14.0% or 67 single-father households and 45.2% or 738 single-mother households are living below the poverty line. Among single-father households, those with no children have the highest poverty rate, with 42 households (23.2%) experiencing poverty. Likewise, among single-mother households, those with 5 or more children have the highest poverty rate, with 18 households (58.1%) falling below the poverty line.
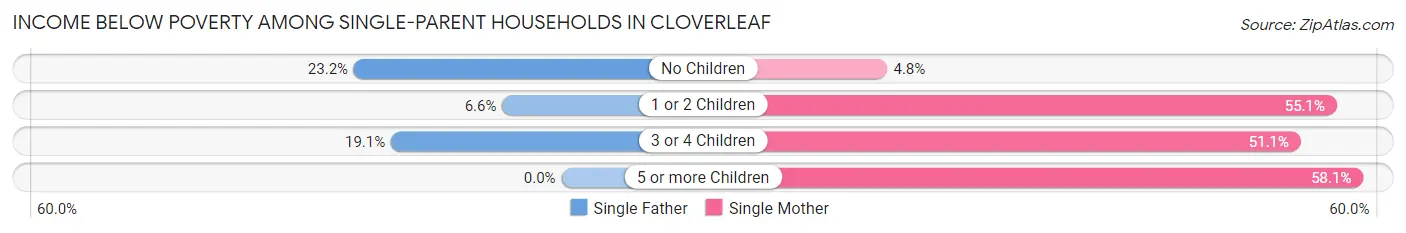
| Children | Single Father | Single Mother |
| No Children | 42 (23.2%) | 14 (4.8%) |
| 1 or 2 Children | 17 (6.6%) | 496 (55.1%) |
| 3 or 4 Children | 8 (19.1%) | 210 (51.1%) |
| 5 or more Children | 0 (0.0%) | 18 (58.1%) |
| Total | 67 (14.0%) | 738 (45.2%) |
Income Below Poverty Among Married-Couple vs Single-Parent Households in Cloverleaf
The poverty data for Cloverleaf shows that 607 of the married-couple family households (18.2%) and 805 of the single-parent households (38.1%) are living below the poverty level. Within the married-couple family households, those with 5 or more children have the highest poverty rate, with 31 households (50.8%) falling below the poverty line. Among the single-parent households, those with 5 or more children have the highest poverty rate, with 18 household (58.1%) living below poverty.
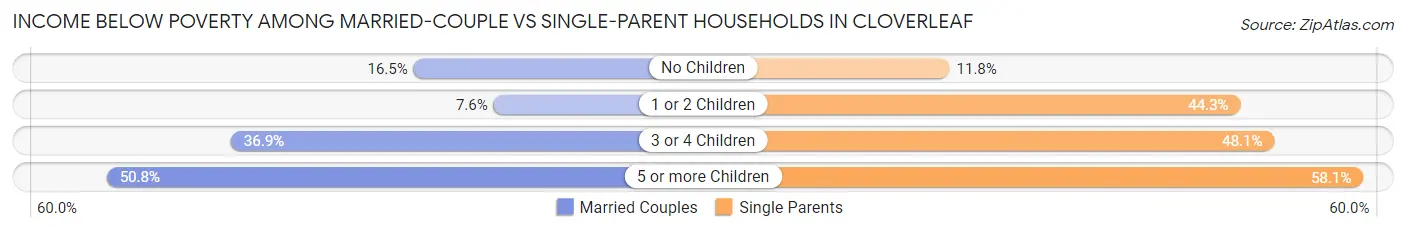
| Children | Married-Couple Families | Single-Parent Households |
| No Children | 240 (16.5%) | 56 (11.8%) |
| 1 or 2 Children | 87 (7.6%) | 513 (44.3%) |
| 3 or 4 Children | 249 (36.9%) | 218 (48.1%) |
| 5 or more Children | 31 (50.8%) | 18 (58.1%) |
| Total | 607 (18.2%) | 805 (38.1%) |
Race in Cloverleaf
The most populous races in Cloverleaf are Hispanic or Latino (19,635 | 79.4%), White / Caucasian (10,755 | 43.5%), and Two or more Races (10,262 | 41.5%).
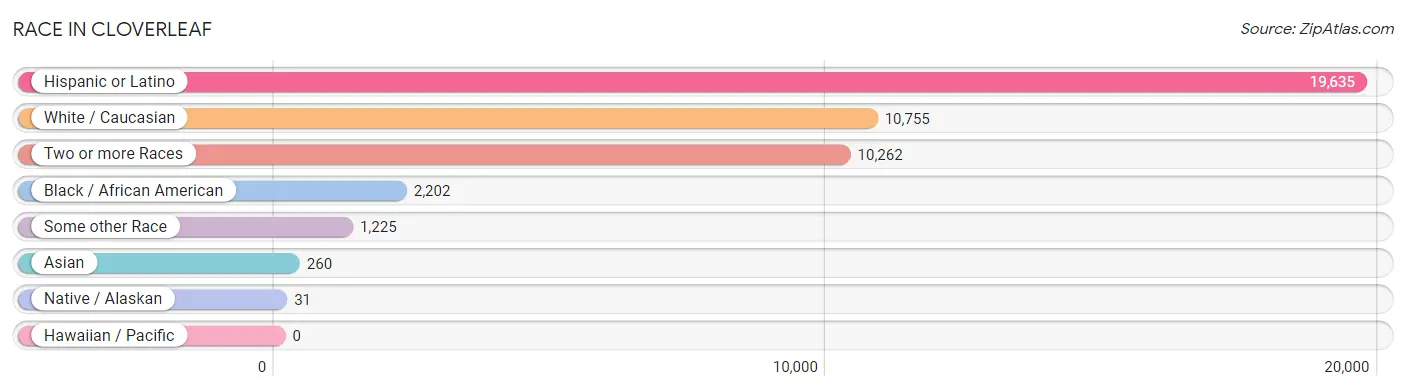
| Race | # Population | % Population |
| Asian | 260 | 1.1% |
| Black / African American | 2,202 | 8.9% |
| Hawaiian / Pacific | 0 | 0.0% |
| Hispanic or Latino | 19,635 | 79.4% |
| Native / Alaskan | 31 | 0.1% |
| White / Caucasian | 10,755 | 43.5% |
| Two or more Races | 10,262 | 41.5% |
| Some other Race | 1,225 | 5.0% |
| Total | 24,735 | 100.0% |
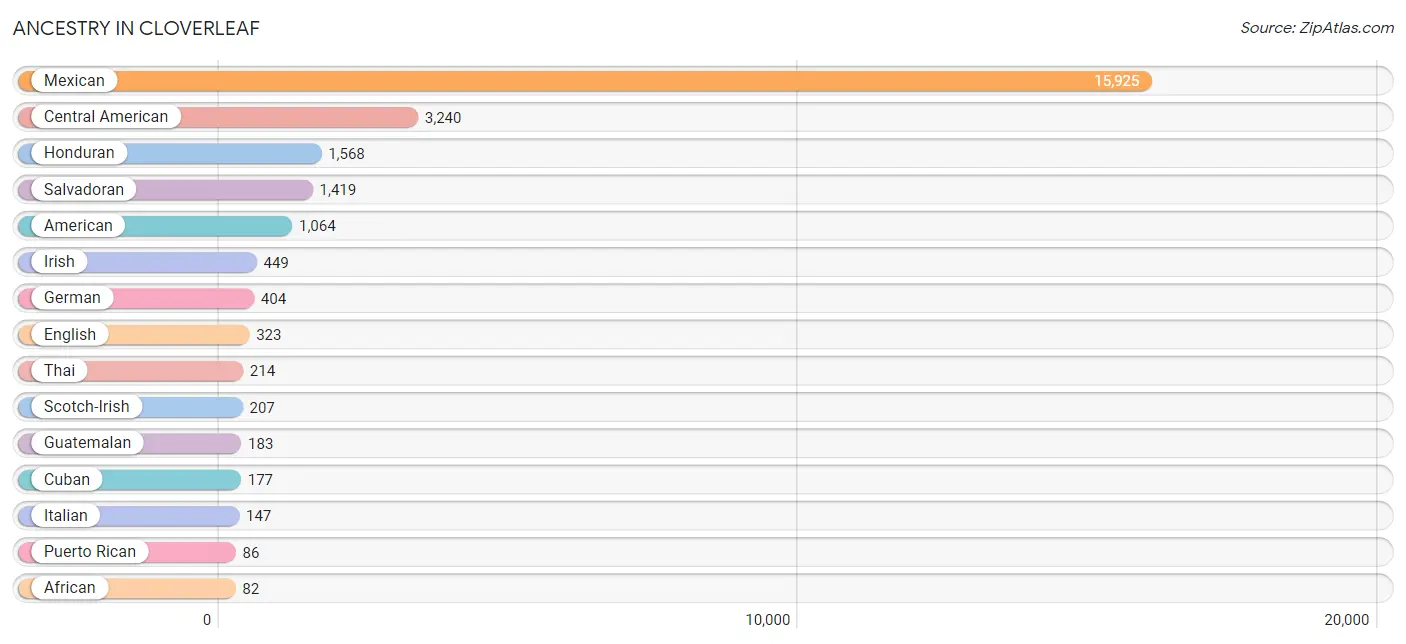
Ancestry in Cloverleaf
The most populous ancestries reported in Cloverleaf are Mexican (15,925 | 64.4%), Central American (3,240 | 13.1%), Honduran (1,568 | 6.3%), Salvadoran (1,419 | 5.7%), and American (1,064 | 4.3%), together accounting for 93.9% of all Cloverleaf residents.
| Ancestry | # Population | % Population |
| African | 82 | 0.3% |
| American | 1,064 | 4.3% |
| Apache | 28 | 0.1% |
| Arab | 23 | 0.1% |
| Argentinean | 14 | 0.1% |
| Austrian | 6 | 0.0% |
| Central American | 3,240 | 13.1% |
| Central American Indian | 13 | 0.1% |
| Cherokee | 14 | 0.1% |
| Colombian | 19 | 0.1% |
| Costa Rican | 24 | 0.1% |
| Cuban | 177 | 0.7% |
| Czech | 25 | 0.1% |
| Danish | 6 | 0.0% |
| Dutch | 44 | 0.2% |
| Eastern European | 44 | 0.2% |
| English | 323 | 1.3% |
| European | 34 | 0.1% |
| French | 53 | 0.2% |
| French Canadian | 9 | 0.0% |
| German | 404 | 1.6% |
| Guatemalan | 183 | 0.7% |
| Honduran | 1,568 | 6.3% |
| Indian (Asian) | 22 | 0.1% |
| Iranian | 12 | 0.1% |
| Irish | 449 | 1.8% |
| Israeli | 11 | 0.0% |
| Italian | 147 | 0.6% |
| Japanese | 11 | 0.0% |
| Korean | 52 | 0.2% |
| Mexican | 15,925 | 64.4% |
| Palestinian | 12 | 0.1% |
| Polish | 45 | 0.2% |
| Puerto Rican | 86 | 0.4% |
| Russian | 7 | 0.0% |
| Salvadoran | 1,419 | 5.7% |
| Scandinavian | 6 | 0.0% |
| Scotch-Irish | 207 | 0.8% |
| Scottish | 50 | 0.2% |
| Slovene | 20 | 0.1% |
| South American | 33 | 0.1% |
| Spaniard | 73 | 0.3% |
| Subsaharan African | 82 | 0.3% |
| Swedish | 27 | 0.1% |
| Swiss | 9 | 0.0% |
| Thai | 214 | 0.9% |
| Trinidadian and Tobagonian | 16 | 0.1% |
| Welsh | 12 | 0.1% |
| West Indian | 17 | 0.1% | View All 49 Rows |
Immigrants in Cloverleaf
The most numerous immigrant groups reported in Cloverleaf came from Latin America (7,766 | 31.4%), Central America (7,626 | 30.8%), Mexico (5,431 | 22.0%), Honduras (998 | 4.0%), and El Salvador (926 | 3.7%), together accounting for 92.0% of all Cloverleaf residents.
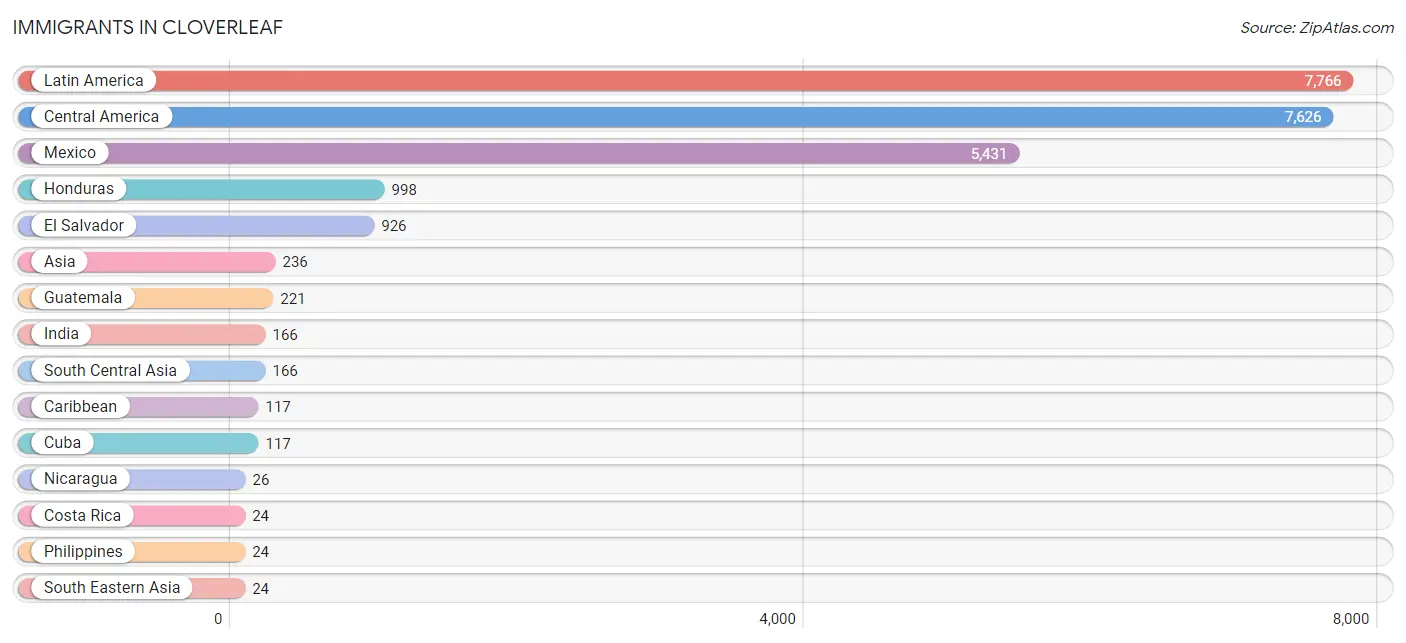
| Immigration Origin | # Population | % Population |
| Argentina | 14 | 0.1% |
| Asia | 236 | 0.9% |
| Brazil | 9 | 0.0% |
| Canada | 6 | 0.0% |
| Caribbean | 117 | 0.5% |
| Central America | 7,626 | 30.8% |
| China | 22 | 0.1% |
| Costa Rica | 24 | 0.1% |
| Cuba | 117 | 0.5% |
| Eastern Asia | 22 | 0.1% |
| El Salvador | 926 | 3.7% |
| Europe | 22 | 0.1% |
| Guatemala | 221 | 0.9% |
| Honduras | 998 | 4.0% |
| Hong Kong | 8 | 0.0% |
| India | 166 | 0.7% |
| Israel | 11 | 0.0% |
| Italy | 6 | 0.0% |
| Kuwait | 13 | 0.1% |
| Latin America | 7,766 | 31.4% |
| Mexico | 5,431 | 22.0% |
| Nicaragua | 26 | 0.1% |
| Philippines | 24 | 0.1% |
| South America | 23 | 0.1% |
| South Central Asia | 166 | 0.7% |
| South Eastern Asia | 24 | 0.1% |
| Southern Europe | 22 | 0.1% |
| Spain | 16 | 0.1% |
| Western Asia | 24 | 0.1% | View All 29 Rows |
Sex and Age in Cloverleaf
Sex and Age in Cloverleaf
The most populous age groups in Cloverleaf are 10 to 14 Years (1,576 | 12.3%) for men and 15 to 19 Years (1,220 | 10.2%) for women.
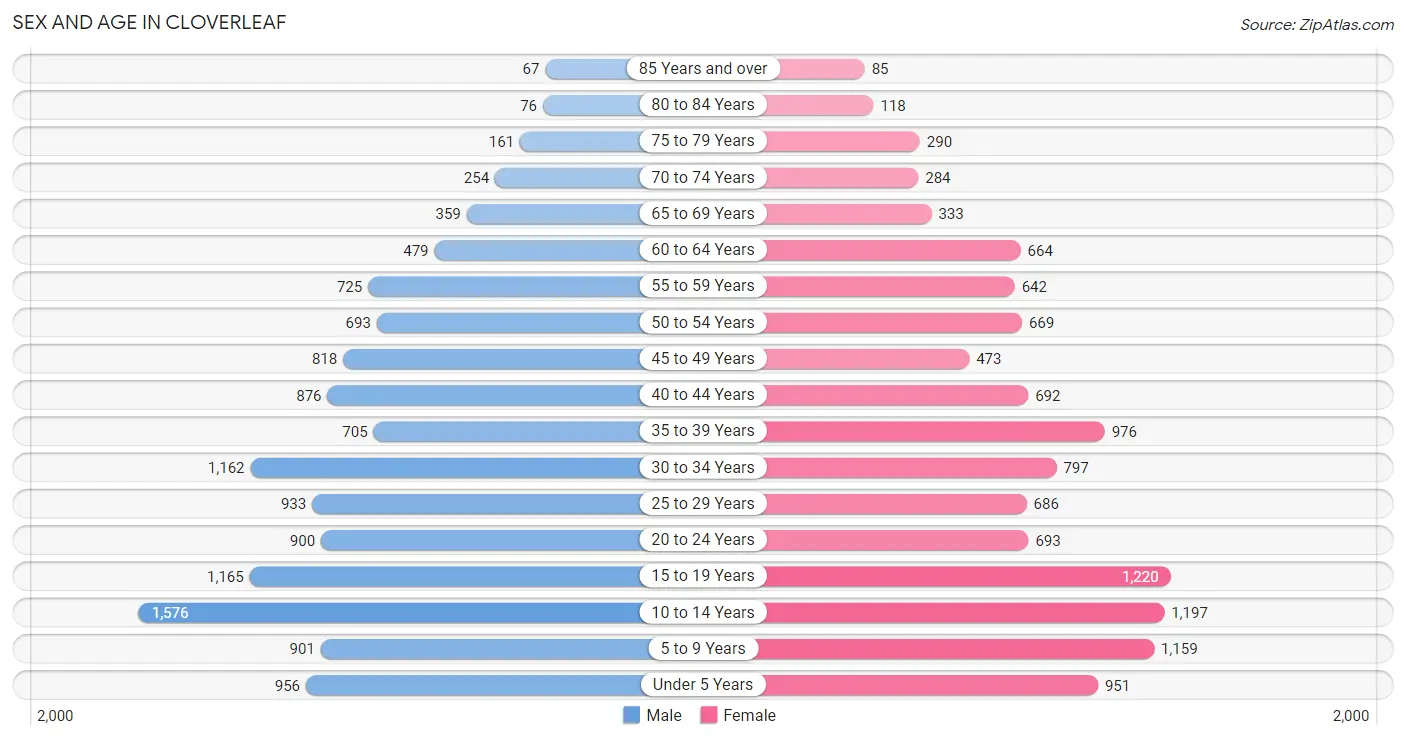
| Age Bracket | Male | Female |
| Under 5 Years | 956 (7.5%) | 951 (8.0%) |
| 5 to 9 Years | 901 (7.0%) | 1,159 (9.7%) |
| 10 to 14 Years | 1,576 (12.3%) | 1,197 (10.0%) |
| 15 to 19 Years | 1,165 (9.1%) | 1,220 (10.2%) |
| 20 to 24 Years | 900 (7.0%) | 693 (5.8%) |
| 25 to 29 Years | 933 (7.3%) | 686 (5.8%) |
| 30 to 34 Years | 1,162 (9.1%) | 797 (6.7%) |
| 35 to 39 Years | 705 (5.5%) | 976 (8.2%) |
| 40 to 44 Years | 876 (6.8%) | 692 (5.8%) |
| 45 to 49 Years | 818 (6.4%) | 473 (4.0%) |
| 50 to 54 Years | 693 (5.4%) | 669 (5.6%) |
| 55 to 59 Years | 725 (5.7%) | 642 (5.4%) |
| 60 to 64 Years | 479 (3.7%) | 664 (5.6%) |
| 65 to 69 Years | 359 (2.8%) | 333 (2.8%) |
| 70 to 74 Years | 254 (2.0%) | 284 (2.4%) |
| 75 to 79 Years | 161 (1.3%) | 290 (2.4%) |
| 80 to 84 Years | 76 (0.6%) | 118 (1.0%) |
| 85 Years and over | 67 (0.5%) | 85 (0.7%) |
| Total | 12,806 (100.0%) | 11,929 (100.0%) |
Families and Households in Cloverleaf
Median Family Size in Cloverleaf
The median family size in Cloverleaf is 4.03 persons per family, with married-couple families (3,334 | 61.2%) accounting for the largest median family size of 4.3 persons per family. On the other hand, single male/father families (480 | 8.8%) represent the smallest median family size with 2.80 persons per family.
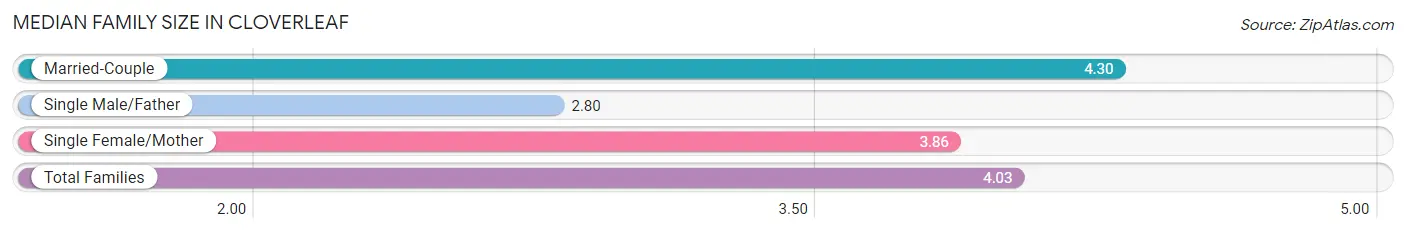
| Family Type | # Families | Family Size |
| Married-Couple | 3,334 (61.2%) | 4.30 |
| Single Male/Father | 480 (8.8%) | 2.80 |
| Single Female/Mother | 1,634 (30.0%) | 3.86 |
| Total Families | 5,448 (100.0%) | 4.03 |
Median Household Size in Cloverleaf
The median household size in Cloverleaf is 3.54 persons per household, with married-couple households (3,334 | 47.7%) accounting for the largest median household size of 4.3 persons per household. non-family households (1,544 | 22.1%) represent the smallest median household size with 1.28 persons per household.
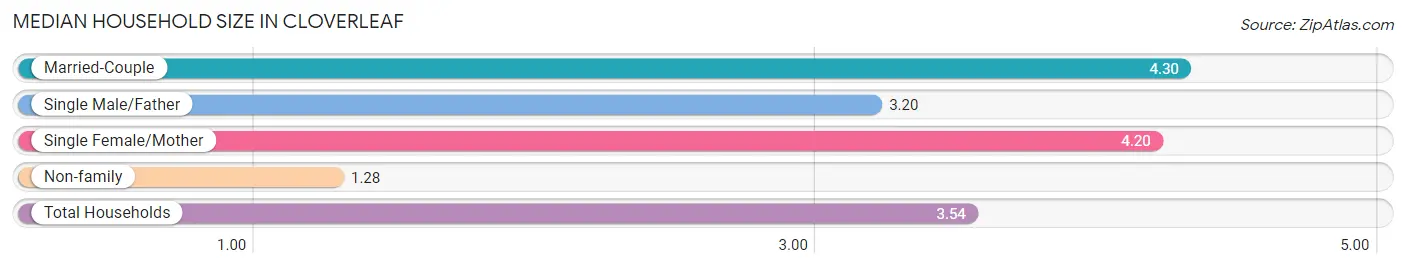
| Household Type | # Households | Household Size |
| Married-Couple | 3,334 (47.7%) | 4.30 |
| Single Male/Father | 480 (6.9%) | 3.20 |
| Single Female/Mother | 1,634 (23.4%) | 4.20 |
| Non-family | 1,544 (22.1%) | 1.28 |
| Total Households | 6,992 (100.0%) | 3.54 |
Household Size by Marriage Status in Cloverleaf
Out of a total of 6,992 households in Cloverleaf, 5,448 (77.9%) are family households, while 1,544 (22.1%) are nonfamily households. The most numerous type of family households are 2-person households, comprising 1,251, and the most common type of nonfamily households are 1-person households, comprising 1,156.
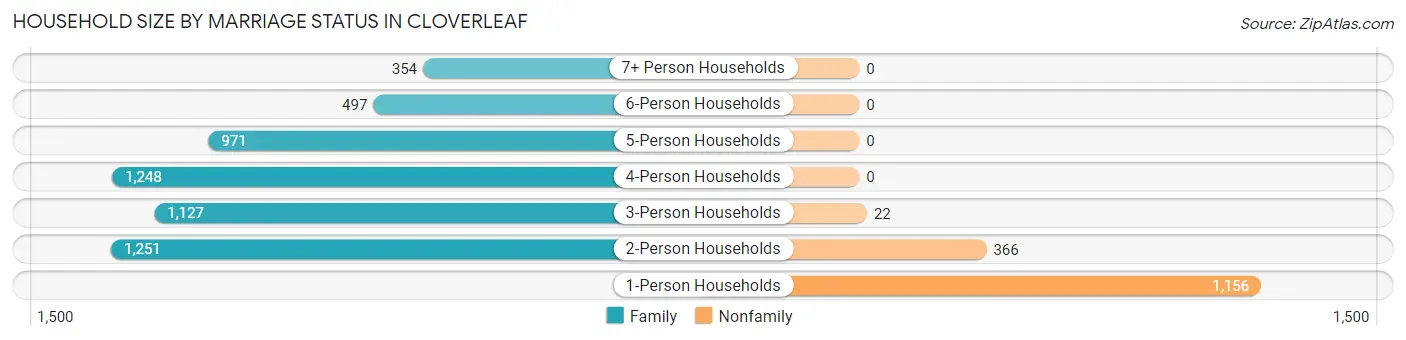
| Household Size | Family Households | Nonfamily Households |
| 1-Person Households | - | 1,156 (16.5%) |
| 2-Person Households | 1,251 (17.9%) | 366 (5.2%) |
| 3-Person Households | 1,127 (16.1%) | 22 (0.3%) |
| 4-Person Households | 1,248 (17.8%) | 0 (0.0%) |
| 5-Person Households | 971 (13.9%) | 0 (0.0%) |
| 6-Person Households | 497 (7.1%) | 0 (0.0%) |
| 7+ Person Households | 354 (5.1%) | 0 (0.0%) |
| Total | 5,448 (77.9%) | 1,544 (22.1%) |
Female Fertility in Cloverleaf
Fertility by Age in Cloverleaf
Average fertility rate in Cloverleaf is 87.0 births per 1,000 women. Women in the age bracket of 20 to 34 years have the highest fertility rate with 164.0 births per 1,000 women. Women in the age bracket of 20 to 34 years acount for 71.8% of all women with births.
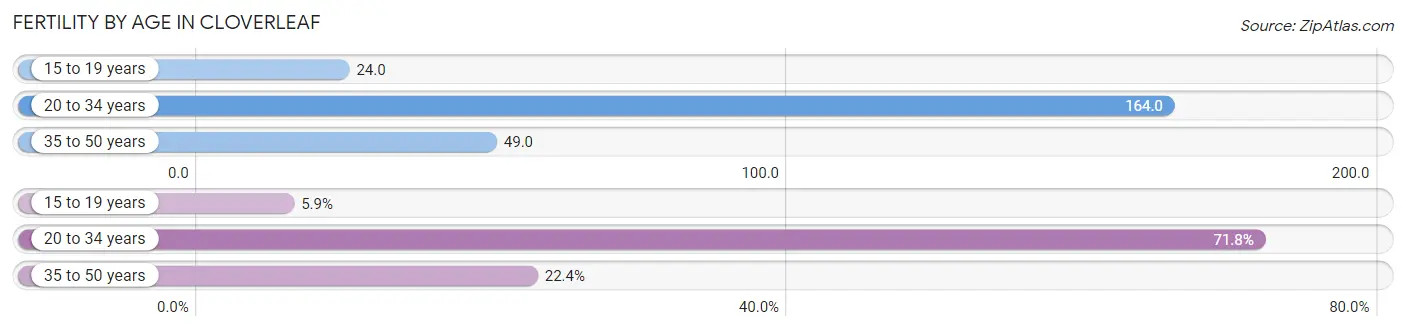
| Age Bracket | Women with Births | Births / 1,000 Women |
| 15 to 19 years | 29 (5.9%) | 24.0 |
| 20 to 34 years | 356 (71.8%) | 164.0 |
| 35 to 50 years | 111 (22.4%) | 49.0 |
| Total | 496 (100.0%) | 87.0 |
Fertility by Age by Marriage Status in Cloverleaf
34.9% of women with births (496) in Cloverleaf are married. The highest percentage of unmarried women with births falls into 15 to 19 years age bracket with 100.0% of them unmarried at the time of birth, while the lowest percentage of unmarried women with births belong to 35 to 50 years age bracket with 39.6% of them unmarried.
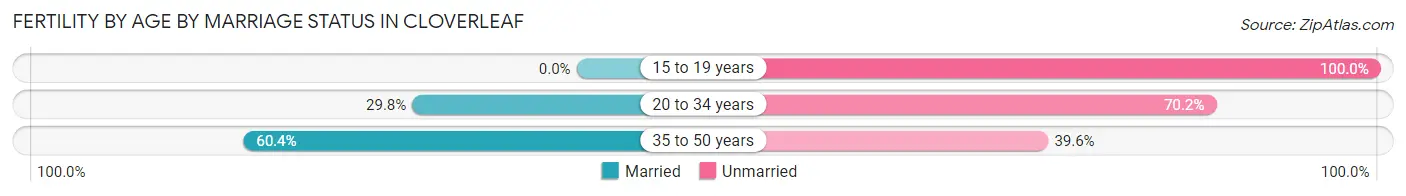
| Age Bracket | Married | Unmarried |
| 15 to 19 years | 0 (0.0%) | 29 (100.0%) |
| 20 to 34 years | 106 (29.8%) | 250 (70.2%) |
| 35 to 50 years | 67 (60.4%) | 44 (39.6%) |
| Total | 173 (34.9%) | 323 (65.1%) |
Fertility by Education in Cloverleaf
Average fertility rate in Cloverleaf is 87.0 births per 1,000 women. Women with the education attainment of graduate degree have the highest fertility rate of 203.0 births per 1,000 women, while women with the education attainment of less than high school have the lowest fertility at 51.0 births per 1,000 women. Women with the education attainment of college or associate's degree represent 52.4% of all women with births.
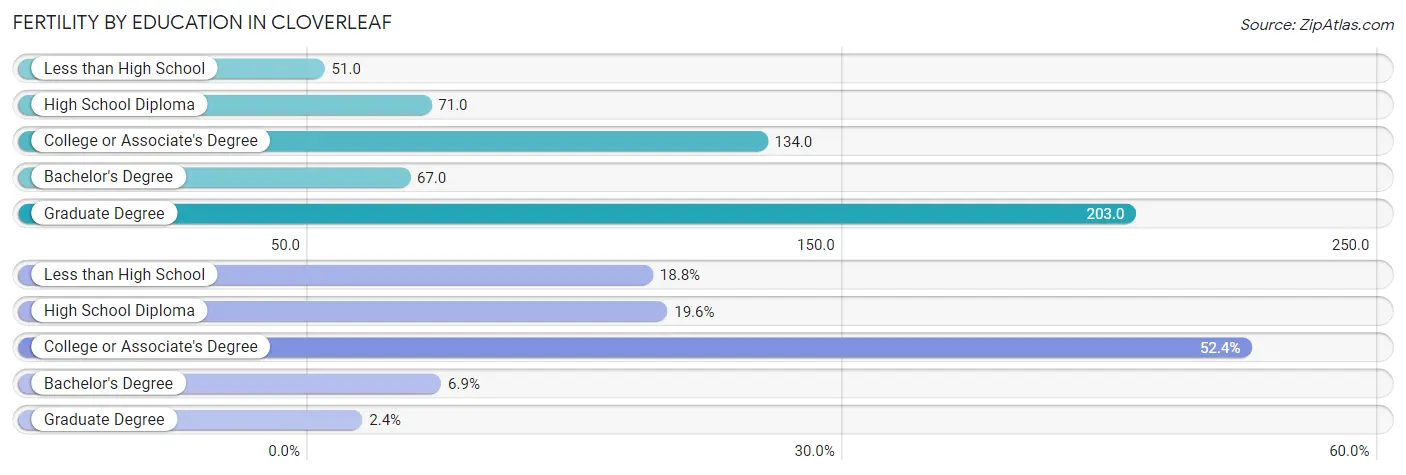
| Educational Attainment | Women with Births | Births / 1,000 Women |
| Less than High School | 93 (18.8%) | 51.0 |
| High School Diploma | 97 (19.6%) | 71.0 |
| College or Associate's Degree | 260 (52.4%) | 134.0 |
| Bachelor's Degree | 34 (6.9%) | 67.0 |
| Graduate Degree | 12 (2.4%) | 203.0 |
| Total | 496 (100.0%) | 87.0 |
Fertility by Education by Marriage Status in Cloverleaf
65.1% of women with births in Cloverleaf are unmarried. Women with the educational attainment of graduate degree are most likely to be married with 100.0% of them married at childbirth, while women with the educational attainment of high school diploma are least likely to be married with 77.3% of them unmarried at childbirth.
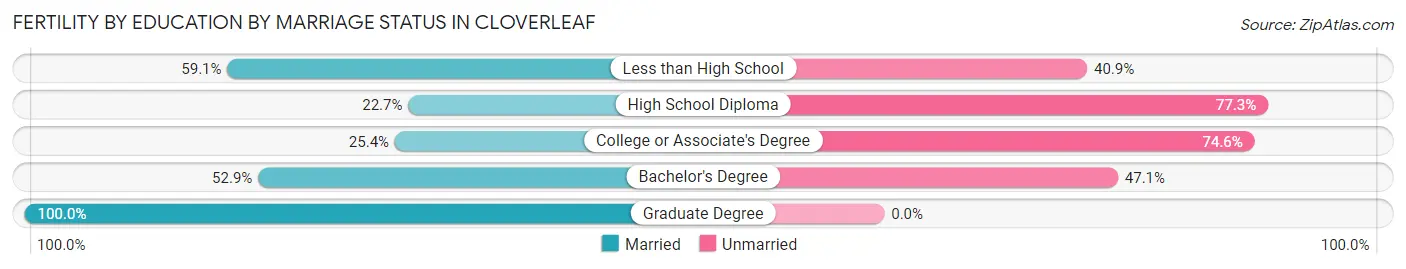
| Educational Attainment | Married | Unmarried |
| Less than High School | 55 (59.1%) | 38 (40.9%) |
| High School Diploma | 22 (22.7%) | 75 (77.3%) |
| College or Associate's Degree | 66 (25.4%) | 194 (74.6%) |
| Bachelor's Degree | 18 (52.9%) | 16 (47.1%) |
| Graduate Degree | 12 (100.0%) | 0 (0.0%) |
| Total | 173 (34.9%) | 323 (65.1%) |
Employment Characteristics in Cloverleaf
Employment by Class of Employer in Cloverleaf
Among the 9,756 employed individuals in Cloverleaf, private company employees (7,543 | 77.3%), self-employed (not incorporated) (928 | 9.5%), and local government employees (586 | 6.0%) make up the most common classes of employment.
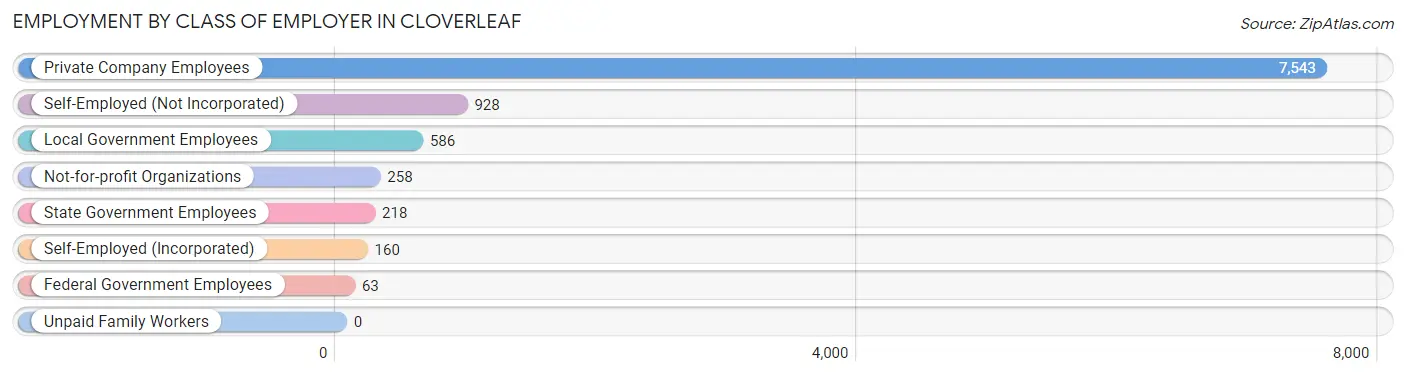
| Employer Class | # Employees | % Employees |
| Private Company Employees | 7,543 | 77.3% |
| Self-Employed (Incorporated) | 160 | 1.6% |
| Self-Employed (Not Incorporated) | 928 | 9.5% |
| Not-for-profit Organizations | 258 | 2.6% |
| Local Government Employees | 586 | 6.0% |
| State Government Employees | 218 | 2.2% |
| Federal Government Employees | 63 | 0.6% |
| Unpaid Family Workers | 0 | 0.0% |
| Total | 9,756 | 100.0% |
Employment Status by Age in Cloverleaf
According to the labor force statistics for Cloverleaf, out of the total population over 16 years of age (17,393), 63.0% or 10,958 individuals are in the labor force, with 7.6% or 833 of them unemployed. The age group with the highest labor force participation rate is 30 to 34 years, with 85.5% or 1,675 individuals in the labor force. Within the labor force, the 20 to 24 years age range has the highest percentage of unemployed individuals, with 16.7% or 205 of them being unemployed.
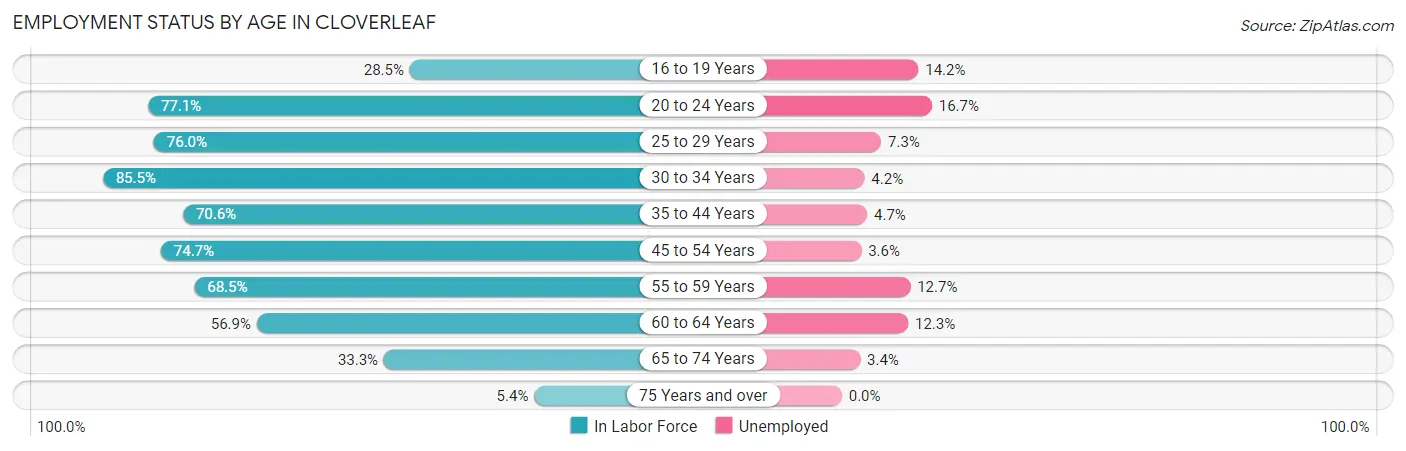
| Age Bracket | In Labor Force | Unemployed |
| 16 to 19 Years | 508 (28.5%) | 72 (14.2%) |
| 20 to 24 Years | 1,228 (77.1%) | 205 (16.7%) |
| 25 to 29 Years | 1,230 (76.0%) | 90 (7.3%) |
| 30 to 34 Years | 1,675 (85.5%) | 70 (4.2%) |
| 35 to 44 Years | 2,294 (70.6%) | 108 (4.7%) |
| 45 to 54 Years | 1,982 (74.7%) | 71 (3.6%) |
| 55 to 59 Years | 936 (68.5%) | 119 (12.7%) |
| 60 to 64 Years | 650 (56.9%) | 80 (12.3%) |
| 65 to 74 Years | 410 (33.3%) | 14 (3.4%) |
| 75 Years and over | 43 (5.4%) | 0 (0.0%) |
| Total | 10,958 (63.0%) | 833 (7.6%) |
Employment Status by Educational Attainment in Cloverleaf
According to labor force statistics for Cloverleaf, 73.1% of individuals (8,765) out of the total population between 25 and 64 years of age (11,990) are in the labor force, with 6.2% or 543 of them being unemployed. The group with the highest labor force participation rate are those with the educational attainment of college / associate degree, with 80.2% or 2,424 individuals in the labor force. Within the labor force, individuals with less than high school education have the highest percentage of unemployment, with 8.8% or 230 of them being unemployed.
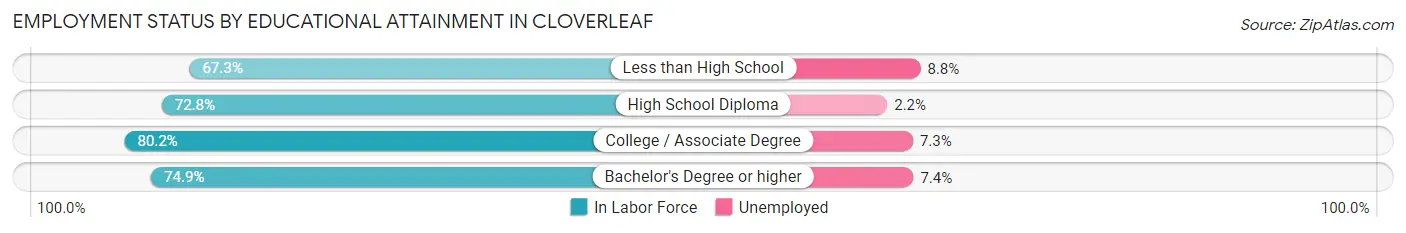
| Educational Attainment | In Labor Force | Unemployed |
| Less than High School | 2,618 (67.3%) | 342 (8.8%) |
| High School Diploma | 2,776 (72.8%) | 84 (2.2%) |
| College / Associate Degree | 2,424 (80.2%) | 221 (7.3%) |
| Bachelor's Degree or higher | 947 (74.9%) | 94 (7.4%) |
| Total | 8,765 (73.1%) | 743 (6.2%) |
Employment Occupations by Sex in Cloverleaf
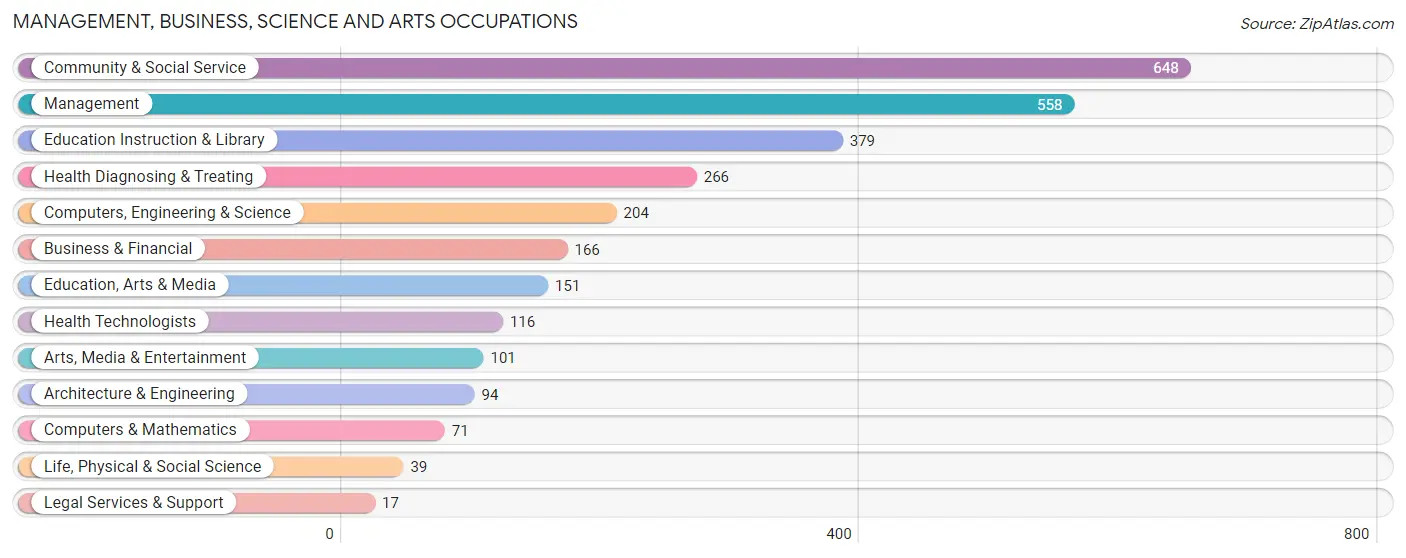
Management, Business, Science and Arts Occupations
The most common Management, Business, Science and Arts occupations in Cloverleaf are Community & Social Service (648 | 6.4%), Management (558 | 5.5%), Education Instruction & Library (379 | 3.7%), Health Diagnosing & Treating (266 | 2.6%), and Computers, Engineering & Science (204 | 2.0%).
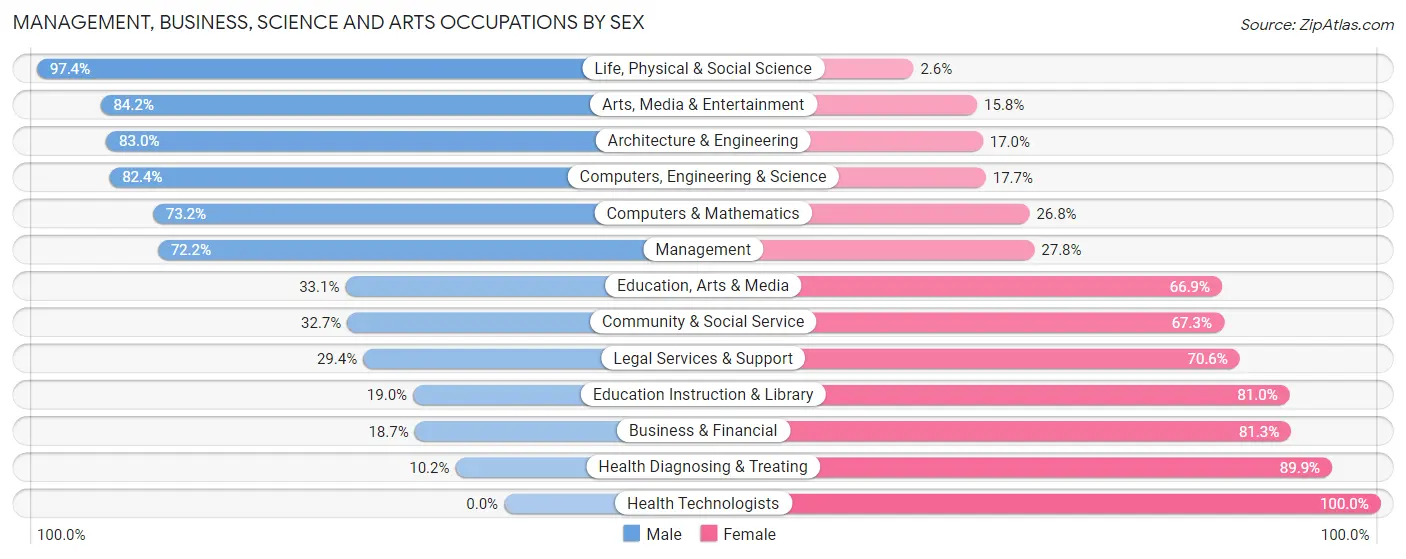
Management, Business, Science and Arts Occupations by Sex
Within the Management, Business, Science and Arts occupations in Cloverleaf, the most male-oriented occupations are Life, Physical & Social Science (97.4%), Arts, Media & Entertainment (84.2%), and Architecture & Engineering (83.0%), while the most female-oriented occupations are Health Technologists (100.0%), Health Diagnosing & Treating (89.8%), and Business & Financial (81.3%).
| Occupation | Male | Female |
| Management | 403 (72.2%) | 155 (27.8%) |
| Business & Financial | 31 (18.7%) | 135 (81.3%) |
| Computers, Engineering & Science | 168 (82.4%) | 36 (17.6%) |
| Computers & Mathematics | 52 (73.2%) | 19 (26.8%) |
| Architecture & Engineering | 78 (83.0%) | 16 (17.0%) |
| Life, Physical & Social Science | 38 (97.4%) | 1 (2.6%) |
| Community & Social Service | 212 (32.7%) | 436 (67.3%) |
| Education, Arts & Media | 50 (33.1%) | 101 (66.9%) |
| Legal Services & Support | 5 (29.4%) | 12 (70.6%) |
| Education Instruction & Library | 72 (19.0%) | 307 (81.0%) |
| Arts, Media & Entertainment | 85 (84.2%) | 16 (15.8%) |
| Health Diagnosing & Treating | 27 (10.2%) | 239 (89.8%) |
| Health Technologists | 0 (0.0%) | 116 (100.0%) |
| Total (Category) | 841 (45.7%) | 1,001 (54.3%) |
| Total (Overall) | 6,214 (61.5%) | 3,892 (38.5%) |
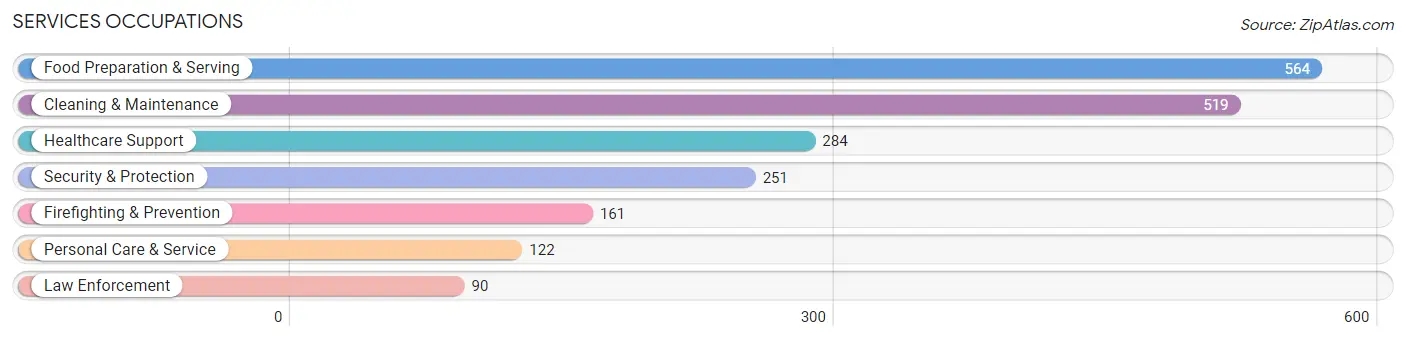
Services Occupations
The most common Services occupations in Cloverleaf are Food Preparation & Serving (564 | 5.6%), Cleaning & Maintenance (519 | 5.1%), Healthcare Support (284 | 2.8%), Security & Protection (251 | 2.5%), and Firefighting & Prevention (161 | 1.6%).
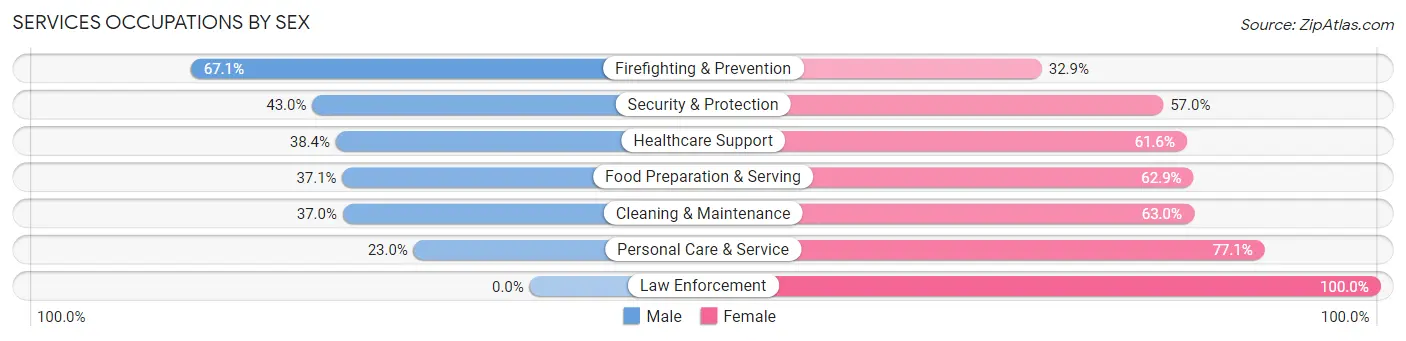
Services Occupations by Sex
Within the Services occupations in Cloverleaf, the most male-oriented occupations are Firefighting & Prevention (67.1%), Security & Protection (43.0%), and Healthcare Support (38.4%), while the most female-oriented occupations are Law Enforcement (100.0%), Personal Care & Service (77.0%), and Cleaning & Maintenance (63.0%).
| Occupation | Male | Female |
| Healthcare Support | 109 (38.4%) | 175 (61.6%) |
| Security & Protection | 108 (43.0%) | 143 (57.0%) |
| Firefighting & Prevention | 108 (67.1%) | 53 (32.9%) |
| Law Enforcement | 0 (0.0%) | 90 (100.0%) |
| Food Preparation & Serving | 209 (37.1%) | 355 (62.9%) |
| Cleaning & Maintenance | 192 (37.0%) | 327 (63.0%) |
| Personal Care & Service | 28 (23.0%) | 94 (77.0%) |
| Total (Category) | 646 (37.1%) | 1,094 (62.9%) |
| Total (Overall) | 6,214 (61.5%) | 3,892 (38.5%) |
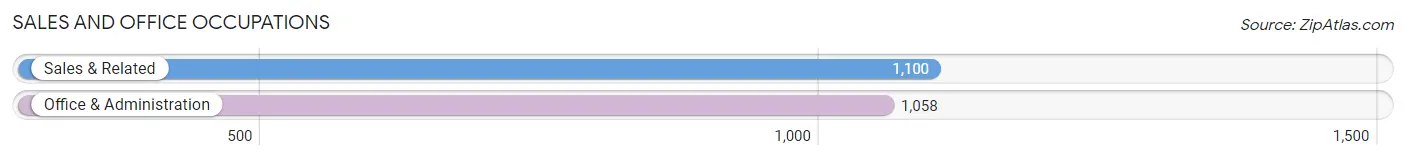
Sales and Office Occupations
The most common Sales and Office occupations in Cloverleaf are Sales & Related (1,100 | 10.9%), and Office & Administration (1,058 | 10.5%).
Sales and Office Occupations by Sex
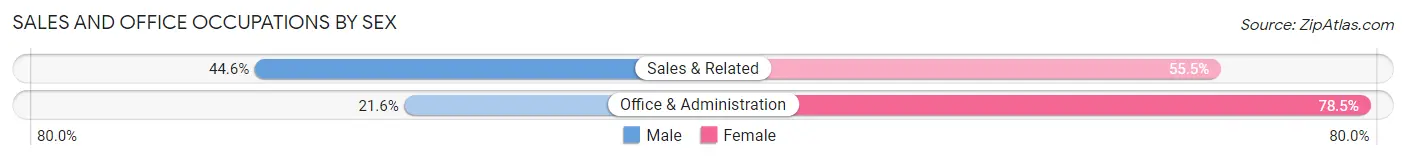
| Occupation | Male | Female |
| Sales & Related | 490 (44.6%) | 610 (55.4%) |
| Office & Administration | 228 (21.5%) | 830 (78.4%) |
| Total (Category) | 718 (33.3%) | 1,440 (66.7%) |
| Total (Overall) | 6,214 (61.5%) | 3,892 (38.5%) |
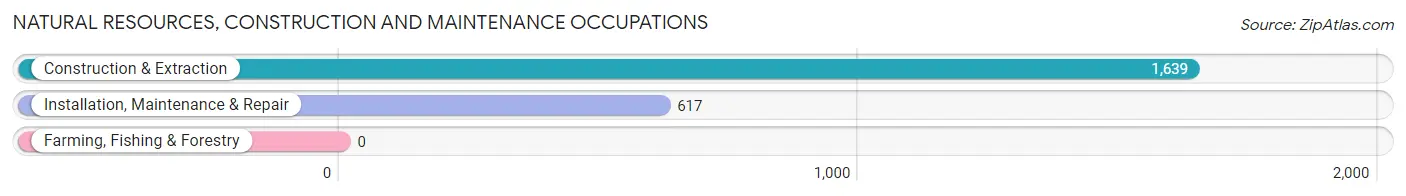
Natural Resources, Construction and Maintenance Occupations
The most common Natural Resources, Construction and Maintenance occupations in Cloverleaf are Construction & Extraction (1,639 | 16.2%), and Installation, Maintenance & Repair (617 | 6.1%).
Natural Resources, Construction and Maintenance Occupations by Sex
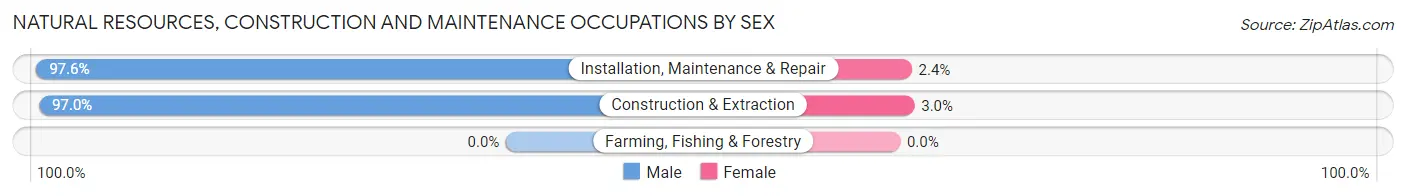
| Occupation | Male | Female |
| Farming, Fishing & Forestry | 0 (0.0%) | 0 (0.0%) |
| Construction & Extraction | 1,590 (97.0%) | 49 (3.0%) |
| Installation, Maintenance & Repair | 602 (97.6%) | 15 (2.4%) |
| Total (Category) | 2,192 (97.2%) | 64 (2.8%) |
| Total (Overall) | 6,214 (61.5%) | 3,892 (38.5%) |
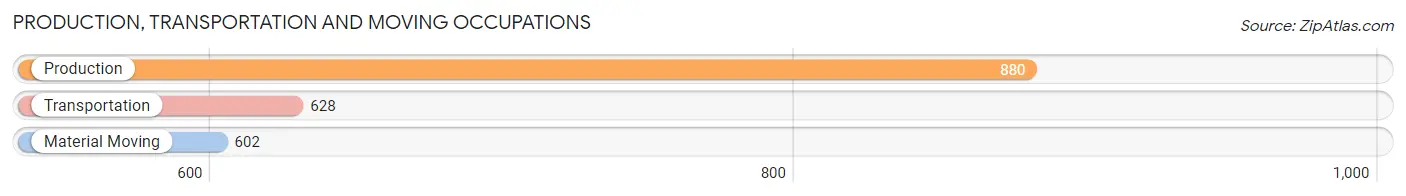
Production, Transportation and Moving Occupations
The most common Production, Transportation and Moving occupations in Cloverleaf are Production (880 | 8.7%), Transportation (628 | 6.2%), and Material Moving (602 | 6.0%).
Production, Transportation and Moving Occupations by Sex
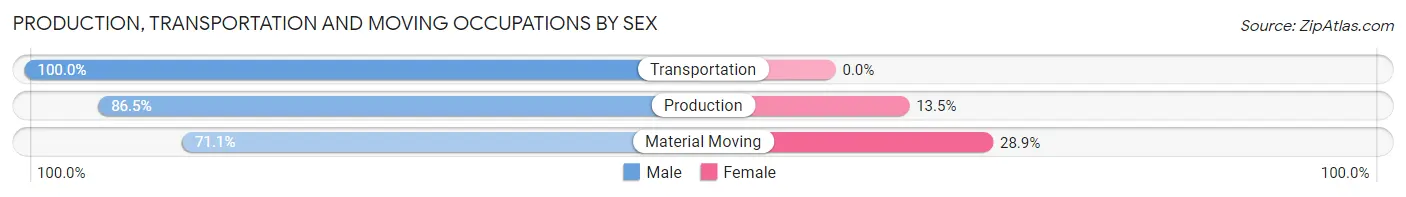
| Occupation | Male | Female |
| Production | 761 (86.5%) | 119 (13.5%) |
| Transportation | 628 (100.0%) | 0 (0.0%) |
| Material Moving | 428 (71.1%) | 174 (28.9%) |
| Total (Category) | 1,817 (86.1%) | 293 (13.9%) |
| Total (Overall) | 6,214 (61.5%) | 3,892 (38.5%) |
Employment Industries by Sex in Cloverleaf
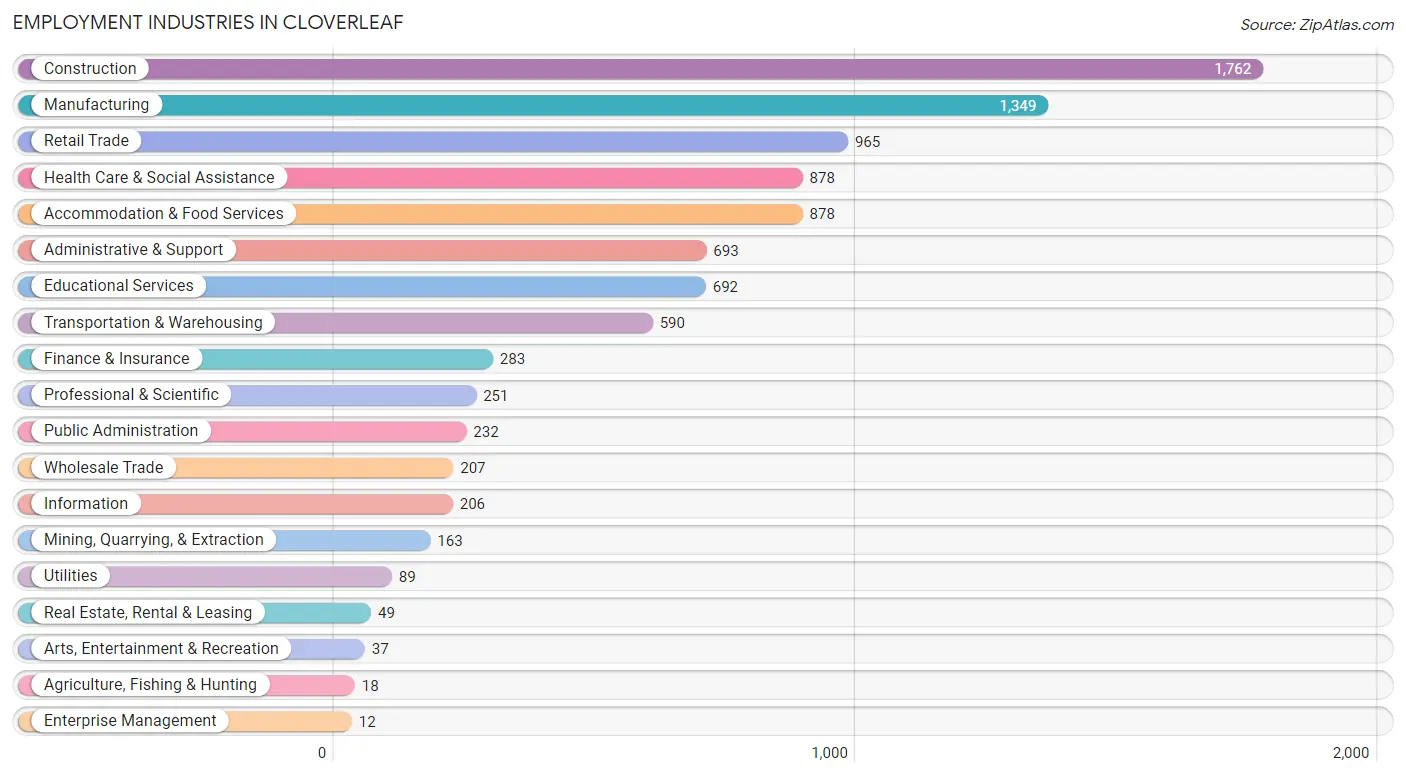
Employment Industries in Cloverleaf
The major employment industries in Cloverleaf include Construction (1,762 | 17.4%), Manufacturing (1,349 | 13.4%), Retail Trade (965 | 9.6%), Health Care & Social Assistance (878 | 8.7%), and Accommodation & Food Services (878 | 8.7%).
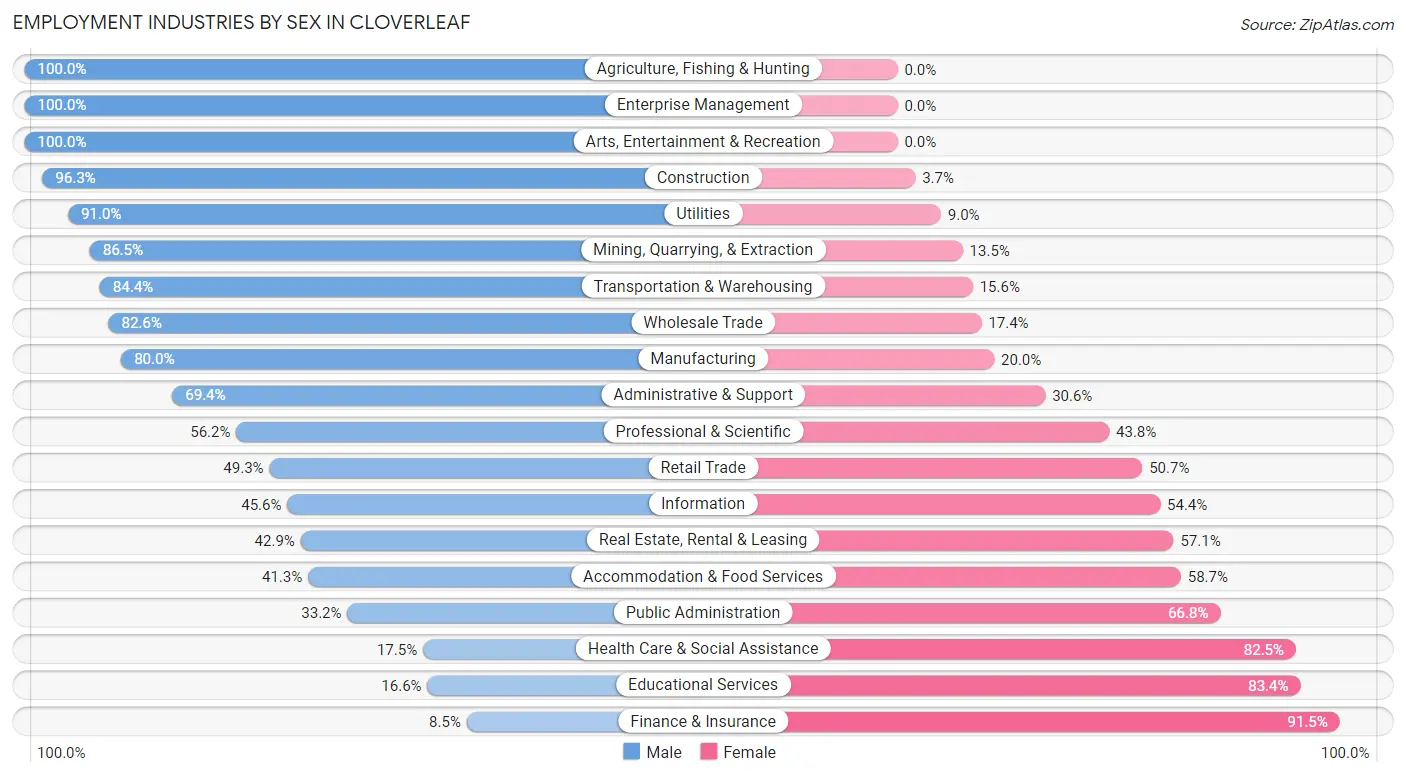
Employment Industries by Sex in Cloverleaf
The Cloverleaf industries that see more men than women are Agriculture, Fishing & Hunting (100.0%), Enterprise Management (100.0%), and Arts, Entertainment & Recreation (100.0%), whereas the industries that tend to have a higher number of women are Finance & Insurance (91.5%), Educational Services (83.4%), and Health Care & Social Assistance (82.5%).
| Industry | Male | Female |
| Agriculture, Fishing & Hunting | 18 (100.0%) | 0 (0.0%) |
| Mining, Quarrying, & Extraction | 141 (86.5%) | 22 (13.5%) |
| Construction | 1,697 (96.3%) | 65 (3.7%) |
| Manufacturing | 1,079 (80.0%) | 270 (20.0%) |
| Wholesale Trade | 171 (82.6%) | 36 (17.4%) |
| Retail Trade | 476 (49.3%) | 489 (50.7%) |
| Transportation & Warehousing | 498 (84.4%) | 92 (15.6%) |
| Utilities | 81 (91.0%) | 8 (9.0%) |
| Information | 94 (45.6%) | 112 (54.4%) |
| Finance & Insurance | 24 (8.5%) | 259 (91.5%) |
| Real Estate, Rental & Leasing | 21 (42.9%) | 28 (57.1%) |
| Professional & Scientific | 141 (56.2%) | 110 (43.8%) |
| Enterprise Management | 12 (100.0%) | 0 (0.0%) |
| Administrative & Support | 481 (69.4%) | 212 (30.6%) |
| Educational Services | 115 (16.6%) | 577 (83.4%) |
| Health Care & Social Assistance | 154 (17.5%) | 724 (82.5%) |
| Arts, Entertainment & Recreation | 37 (100.0%) | 0 (0.0%) |
| Accommodation & Food Services | 363 (41.3%) | 515 (58.7%) |
| Public Administration | 77 (33.2%) | 155 (66.8%) |
| Total | 6,214 (61.5%) | 3,892 (38.5%) |
Education in Cloverleaf
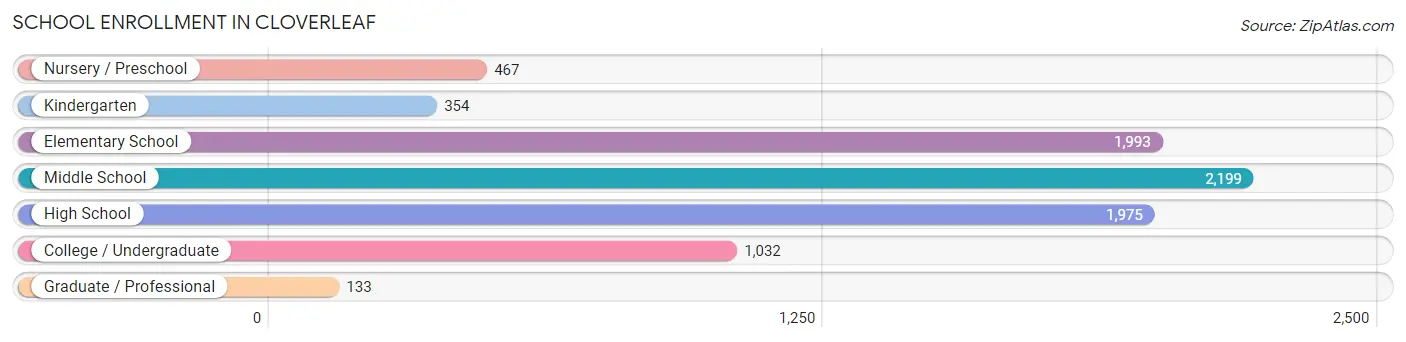
School Enrollment in Cloverleaf
The most common levels of schooling among the 8,153 students in Cloverleaf are middle school (2,199 | 27.0%), elementary school (1,993 | 24.4%), and high school (1,975 | 24.2%).
| School Level | # Students | % Students |
| Nursery / Preschool | 467 | 5.7% |
| Kindergarten | 354 | 4.3% |
| Elementary School | 1,993 | 24.4% |
| Middle School | 2,199 | 27.0% |
| High School | 1,975 | 24.2% |
| College / Undergraduate | 1,032 | 12.7% |
| Graduate / Professional | 133 | 1.6% |
| Total | 8,153 | 100.0% |
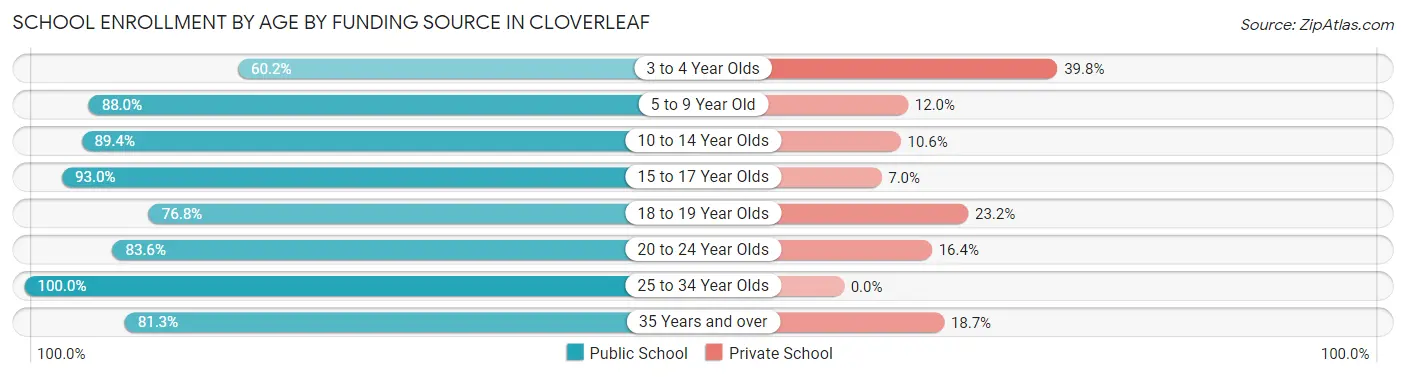
School Enrollment by Age by Funding Source in Cloverleaf
Out of a total of 8,153 students who are enrolled in schools in Cloverleaf, 995 (12.2%) attend a private institution, while the remaining 7,158 (87.8%) are enrolled in public schools. The age group of 3 to 4 year olds has the highest likelihood of being enrolled in private schools, with 144 (39.8% in the age bracket) enrolled. Conversely, the age group of 25 to 34 year olds has the lowest likelihood of being enrolled in a private school, with 351 (100.0% in the age bracket) attending a public institution.
| Age Bracket | Public School | Private School |
| 3 to 4 Year Olds | 218 (60.2%) | 144 (39.8%) |
| 5 to 9 Year Old | 1,767 (88.0%) | 240 (12.0%) |
| 10 to 14 Year Olds | 2,453 (89.4%) | 291 (10.6%) |
| 15 to 17 Year Olds | 1,515 (93.0%) | 114 (7.0%) |
| 18 to 19 Year Olds | 365 (76.8%) | 110 (23.2%) |
| 20 to 24 Year Olds | 413 (83.6%) | 81 (16.4%) |
| 25 to 34 Year Olds | 351 (100.0%) | 0 (0.0%) |
| 35 Years and over | 74 (81.3%) | 17 (18.7%) |
| Total | 7,158 (87.8%) | 995 (12.2%) |
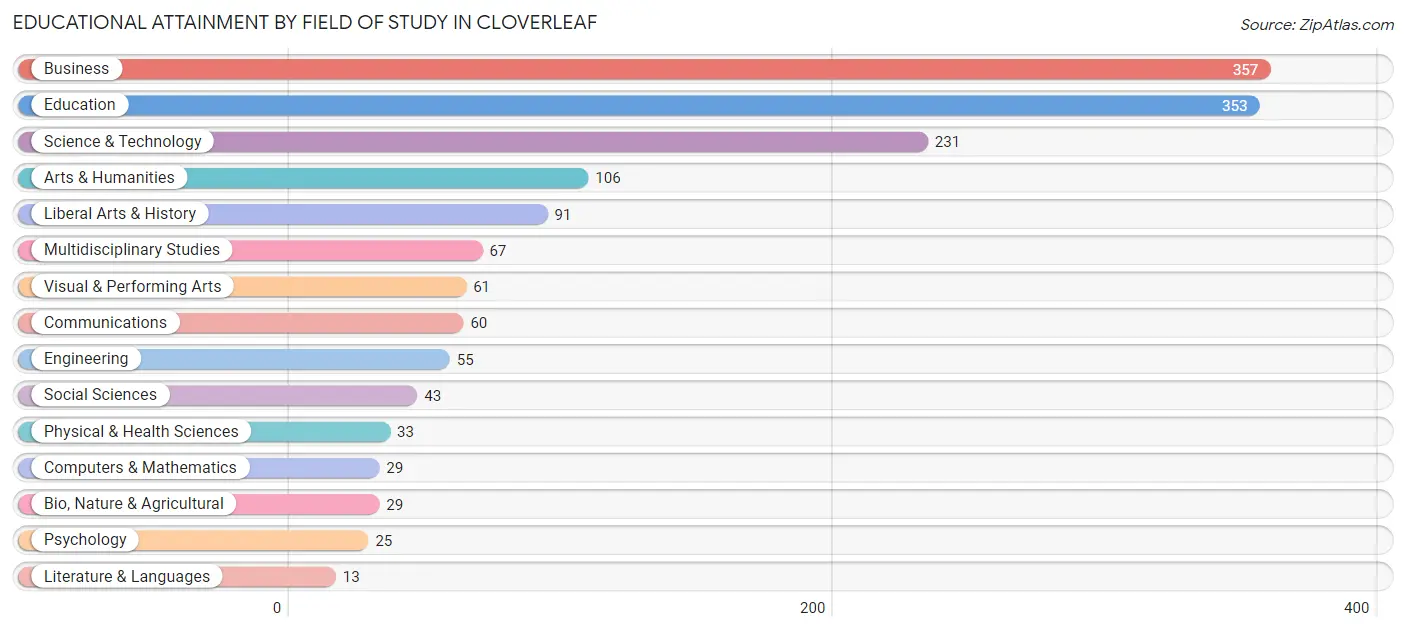
Educational Attainment by Field of Study in Cloverleaf
Business (357 | 23.0%), education (353 | 22.7%), science & technology (231 | 14.9%), arts & humanities (106 | 6.8%), and liberal arts & history (91 | 5.9%) are the most common fields of study among 1,553 individuals in Cloverleaf who have obtained a bachelor's degree or higher.
| Field of Study | # Graduates | % Graduates |
| Computers & Mathematics | 29 | 1.9% |
| Bio, Nature & Agricultural | 29 | 1.9% |
| Physical & Health Sciences | 33 | 2.1% |
| Psychology | 25 | 1.6% |
| Social Sciences | 43 | 2.8% |
| Engineering | 55 | 3.5% |
| Multidisciplinary Studies | 67 | 4.3% |
| Science & Technology | 231 | 14.9% |
| Business | 357 | 23.0% |
| Education | 353 | 22.7% |
| Literature & Languages | 13 | 0.8% |
| Liberal Arts & History | 91 | 5.9% |
| Visual & Performing Arts | 61 | 3.9% |
| Communications | 60 | 3.9% |
| Arts & Humanities | 106 | 6.8% |
| Total | 1,553 | 100.0% |
Transportation & Commute in Cloverleaf
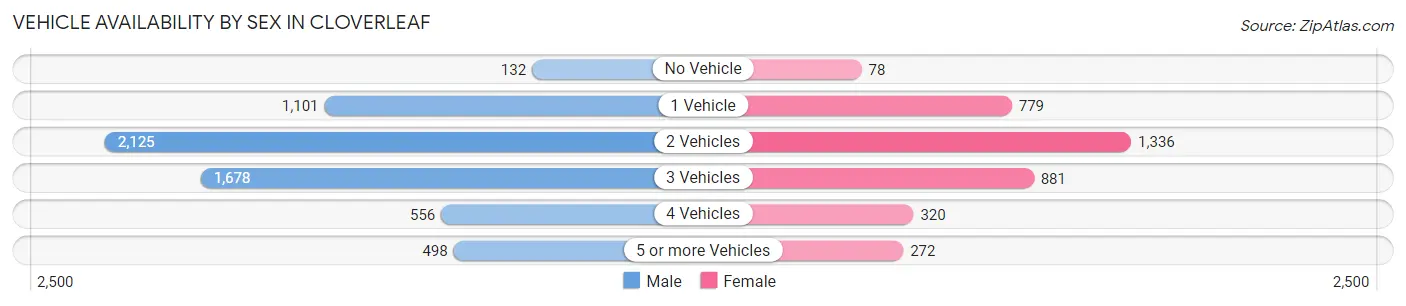
Vehicle Availability by Sex in Cloverleaf
The most prevalent vehicle ownership categories in Cloverleaf are males with 2 vehicles (2,125, accounting for 34.9%) and females with 2 vehicles (1,336, making up 58.0%).
| Vehicles Available | Male | Female |
| No Vehicle | 132 (2.2%) | 78 (2.1%) |
| 1 Vehicle | 1,101 (18.1%) | 779 (21.2%) |
| 2 Vehicles | 2,125 (34.9%) | 1,336 (36.4%) |
| 3 Vehicles | 1,678 (27.6%) | 881 (24.0%) |
| 4 Vehicles | 556 (9.1%) | 320 (8.7%) |
| 5 or more Vehicles | 498 (8.2%) | 272 (7.4%) |
| Total | 6,090 (100.0%) | 3,666 (100.0%) |
Commute Time in Cloverleaf
The most frequently occuring commute durations in Cloverleaf are 30 to 34 minutes (1,793 commuters, 18.9%), 20 to 24 minutes (1,318 commuters, 13.9%), and 45 to 59 minutes (1,147 commuters, 12.1%).
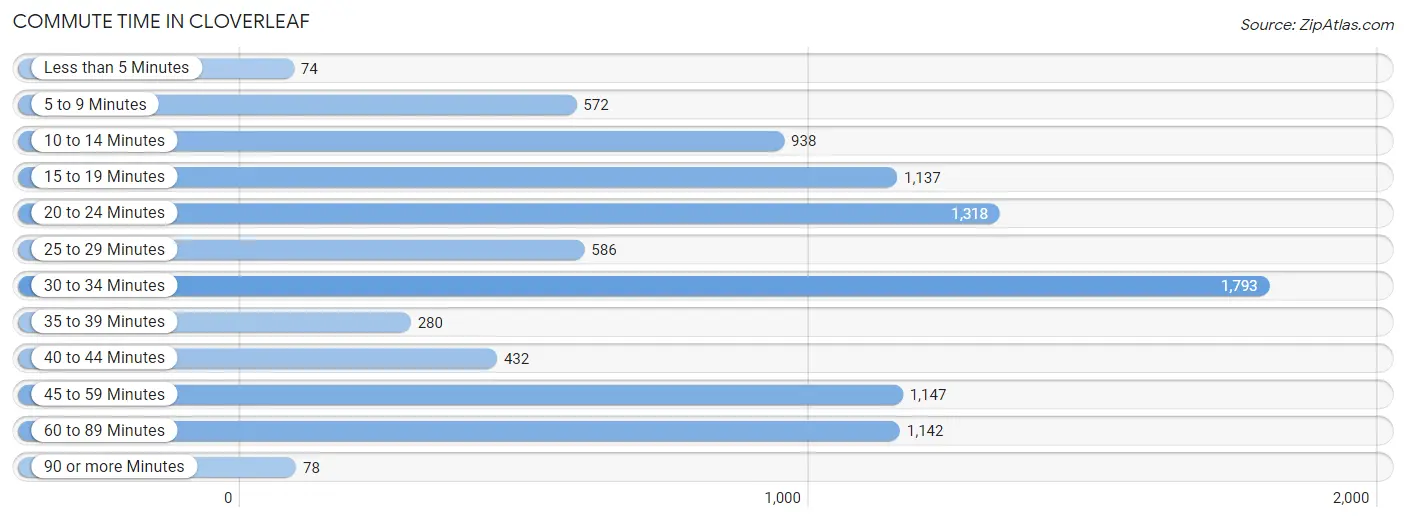
| Commute Time | # Commuters | % Commuters |
| Less than 5 Minutes | 74 | 0.8% |
| 5 to 9 Minutes | 572 | 6.0% |
| 10 to 14 Minutes | 938 | 9.9% |
| 15 to 19 Minutes | 1,137 | 12.0% |
| 20 to 24 Minutes | 1,318 | 13.9% |
| 25 to 29 Minutes | 586 | 6.2% |
| 30 to 34 Minutes | 1,793 | 18.9% |
| 35 to 39 Minutes | 280 | 2.9% |
| 40 to 44 Minutes | 432 | 4.5% |
| 45 to 59 Minutes | 1,147 | 12.1% |
| 60 to 89 Minutes | 1,142 | 12.0% |
| 90 or more Minutes | 78 | 0.8% |
Commute Time by Sex in Cloverleaf
The most common commute times in Cloverleaf are 30 to 34 minutes (1,269 commuters, 21.2%) for males and 10 to 14 minutes (635 commuters, 18.1%) for females.
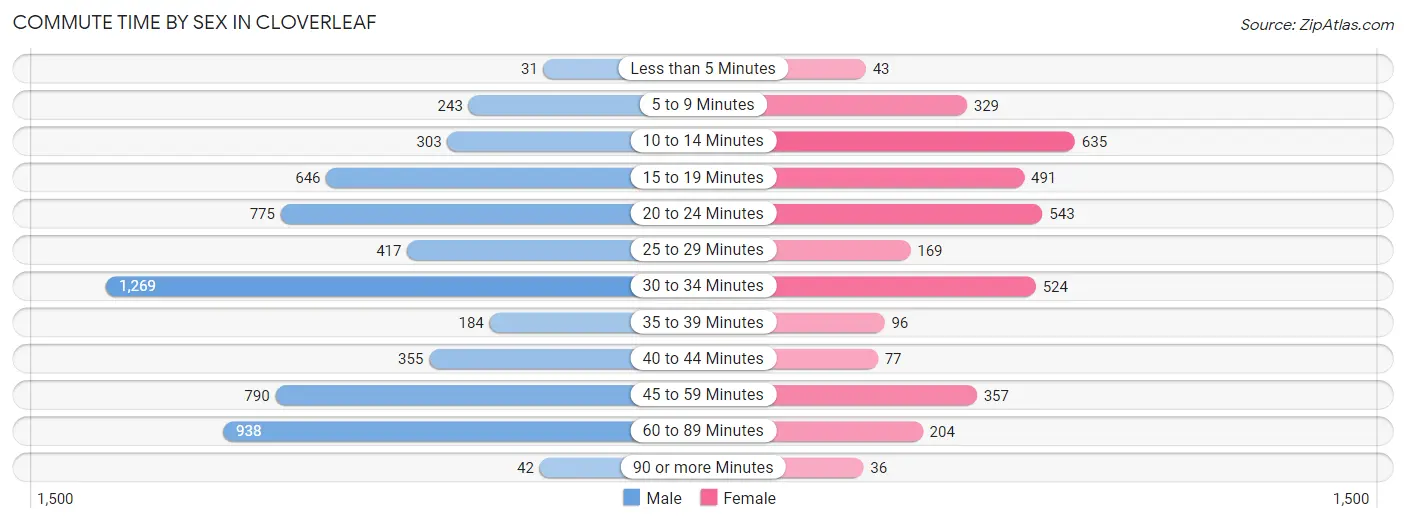
| Commute Time | Male | Female |
| Less than 5 Minutes | 31 (0.5%) | 43 (1.2%) |
| 5 to 9 Minutes | 243 (4.1%) | 329 (9.4%) |
| 10 to 14 Minutes | 303 (5.1%) | 635 (18.1%) |
| 15 to 19 Minutes | 646 (10.8%) | 491 (14.0%) |
| 20 to 24 Minutes | 775 (12.9%) | 543 (15.5%) |
| 25 to 29 Minutes | 417 (7.0%) | 169 (4.8%) |
| 30 to 34 Minutes | 1,269 (21.2%) | 524 (14.9%) |
| 35 to 39 Minutes | 184 (3.1%) | 96 (2.7%) |
| 40 to 44 Minutes | 355 (5.9%) | 77 (2.2%) |
| 45 to 59 Minutes | 790 (13.2%) | 357 (10.2%) |
| 60 to 89 Minutes | 938 (15.7%) | 204 (5.8%) |
| 90 or more Minutes | 42 (0.7%) | 36 (1.0%) |
Time of Departure to Work by Sex in Cloverleaf
The most frequent times of departure to work in Cloverleaf are 6:00 AM to 6:29 AM (1,083, 18.1%) for males and 7:00 AM to 7:29 AM (564, 16.1%) for females.
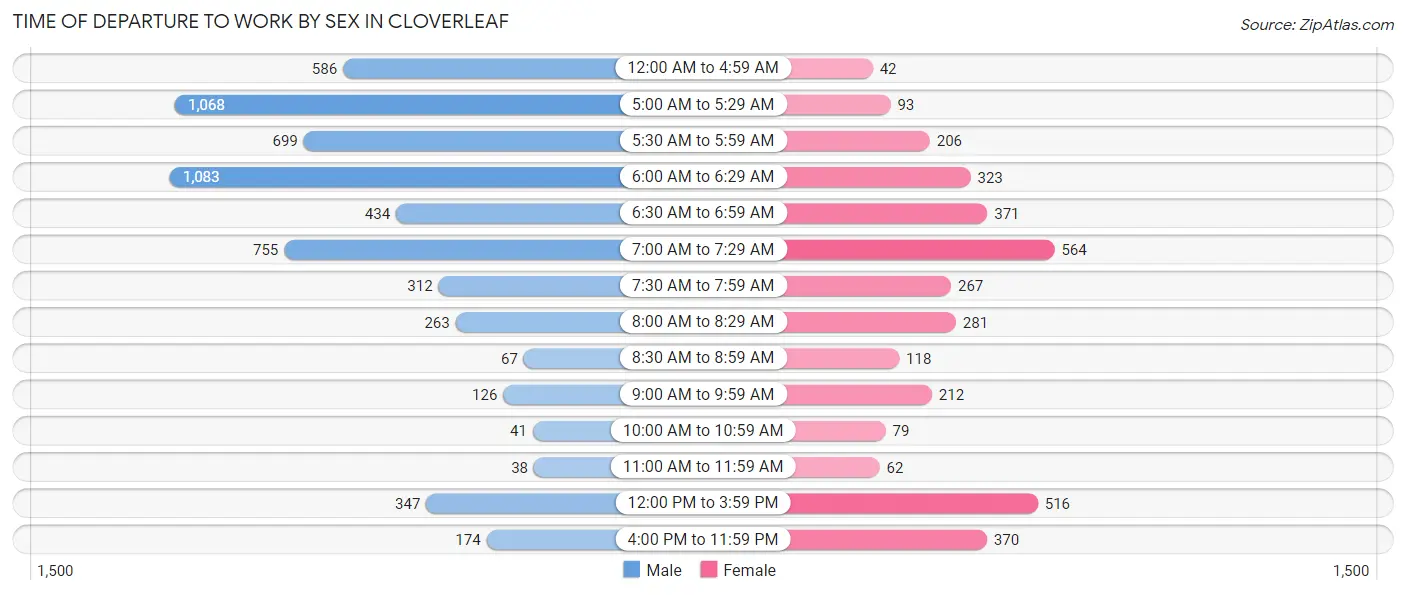
| Time of Departure | Male | Female |
| 12:00 AM to 4:59 AM | 586 (9.8%) | 42 (1.2%) |
| 5:00 AM to 5:29 AM | 1,068 (17.8%) | 93 (2.6%) |
| 5:30 AM to 5:59 AM | 699 (11.7%) | 206 (5.9%) |
| 6:00 AM to 6:29 AM | 1,083 (18.1%) | 323 (9.2%) |
| 6:30 AM to 6:59 AM | 434 (7.2%) | 371 (10.6%) |
| 7:00 AM to 7:29 AM | 755 (12.6%) | 564 (16.1%) |
| 7:30 AM to 7:59 AM | 312 (5.2%) | 267 (7.6%) |
| 8:00 AM to 8:29 AM | 263 (4.4%) | 281 (8.0%) |
| 8:30 AM to 8:59 AM | 67 (1.1%) | 118 (3.4%) |
| 9:00 AM to 9:59 AM | 126 (2.1%) | 212 (6.0%) |
| 10:00 AM to 10:59 AM | 41 (0.7%) | 79 (2.2%) |
| 11:00 AM to 11:59 AM | 38 (0.6%) | 62 (1.8%) |
| 12:00 PM to 3:59 PM | 347 (5.8%) | 516 (14.7%) |
| 4:00 PM to 11:59 PM | 174 (2.9%) | 370 (10.6%) |
| Total | 5,993 (100.0%) | 3,504 (100.0%) |
Housing Occupancy in Cloverleaf
Occupancy by Ownership in Cloverleaf
Of the total 6,992 dwellings in Cloverleaf, owner-occupied units account for 4,391 (62.8%), while renter-occupied units make up 2,601 (37.2%).
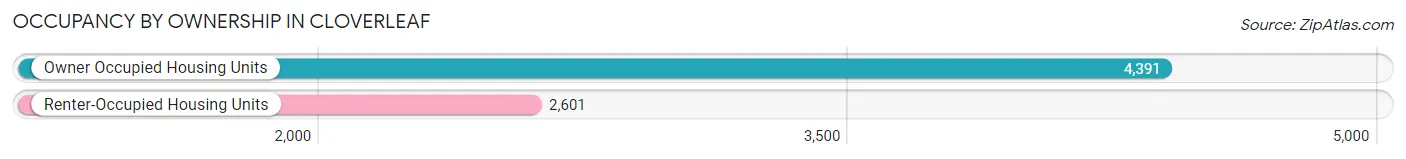
| Occupancy | # Housing Units | % Housing Units |
| Owner Occupied Housing Units | 4,391 | 62.8% |
| Renter-Occupied Housing Units | 2,601 | 37.2% |
| Total Occupied Housing Units | 6,992 | 100.0% |
Occupancy by Household Size in Cloverleaf
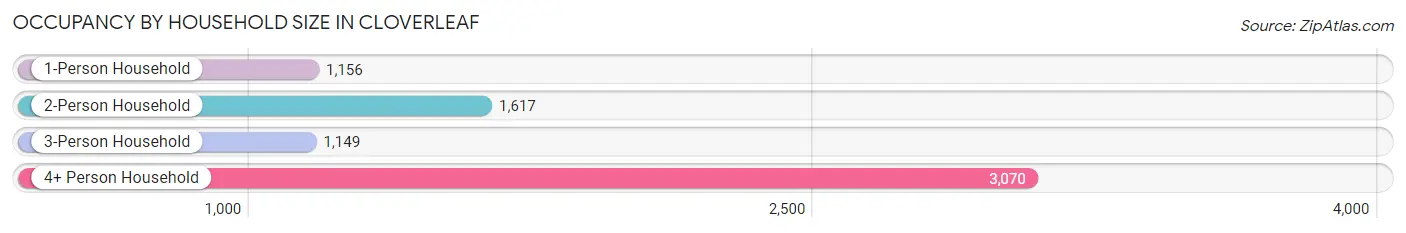
| Household Size | # Housing Units | % Housing Units |
| 1-Person Household | 1,156 | 16.5% |
| 2-Person Household | 1,617 | 23.1% |
| 3-Person Household | 1,149 | 16.4% |
| 4+ Person Household | 3,070 | 43.9% |
| Total Housing Units | 6,992 | 100.0% |
Occupancy by Ownership by Household Size in Cloverleaf
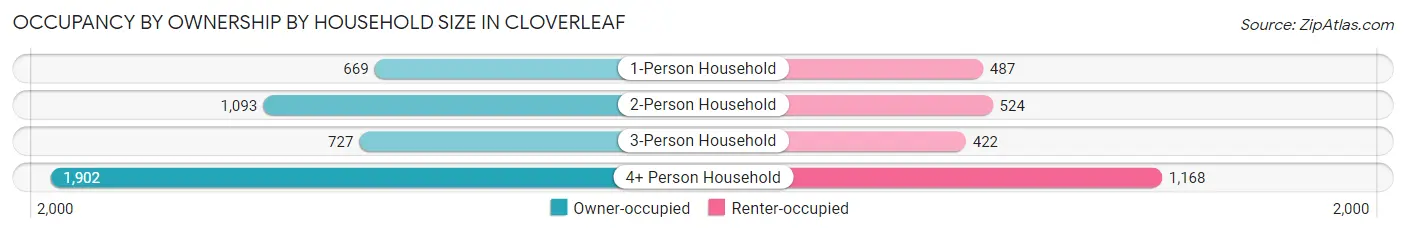
| Household Size | Owner-occupied | Renter-occupied |
| 1-Person Household | 669 (57.9%) | 487 (42.1%) |
| 2-Person Household | 1,093 (67.6%) | 524 (32.4%) |
| 3-Person Household | 727 (63.3%) | 422 (36.7%) |
| 4+ Person Household | 1,902 (62.0%) | 1,168 (38.1%) |
| Total Housing Units | 4,391 (62.8%) | 2,601 (37.2%) |
Occupancy by Educational Attainment in Cloverleaf
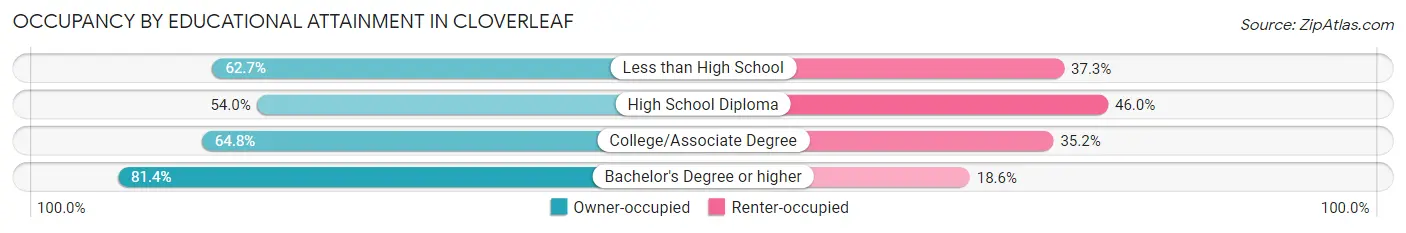
| Household Size | Owner-occupied | Renter-occupied |
| Less than High School | 1,389 (62.7%) | 825 (37.3%) |
| High School Diploma | 1,149 (54.0%) | 978 (46.0%) |
| College/Associate Degree | 1,195 (64.8%) | 648 (35.2%) |
| Bachelor's Degree or higher | 658 (81.4%) | 150 (18.6%) |
Occupancy by Age of Householder in Cloverleaf
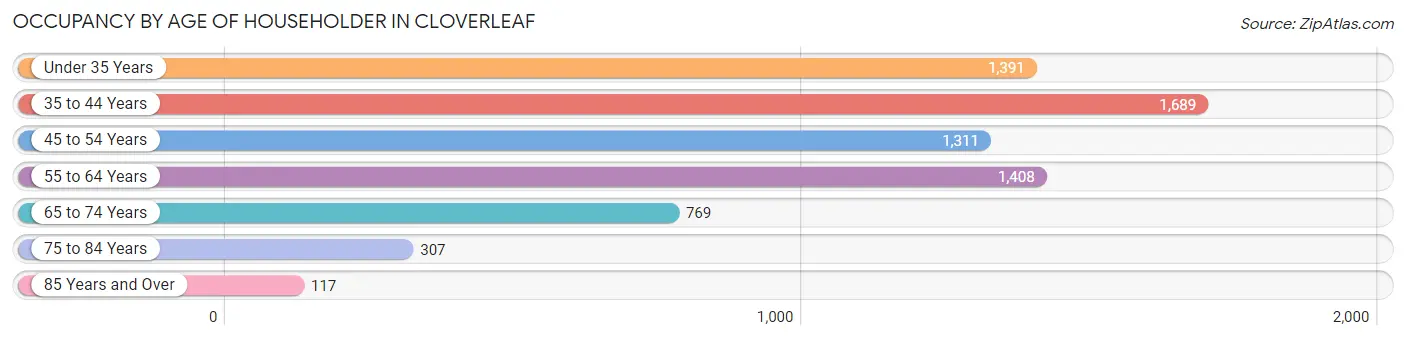
| Age Bracket | # Households | % Households |
| Under 35 Years | 1,391 | 19.9% |
| 35 to 44 Years | 1,689 | 24.2% |
| 45 to 54 Years | 1,311 | 18.8% |
| 55 to 64 Years | 1,408 | 20.1% |
| 65 to 74 Years | 769 | 11.0% |
| 75 to 84 Years | 307 | 4.4% |
| 85 Years and Over | 117 | 1.7% |
| Total | 6,992 | 100.0% |
Housing Finances in Cloverleaf
Median Income by Occupancy in Cloverleaf
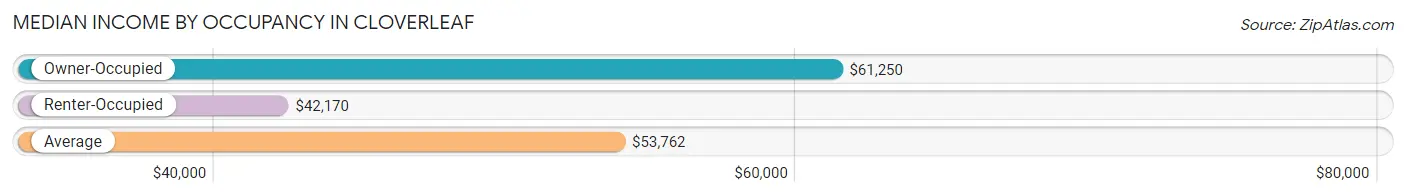
| Occupancy Type | # Households | Median Income |
| Owner-Occupied | 4,391 (62.8%) | $61,250 |
| Renter-Occupied | 2,601 (37.2%) | $42,170 |
| Average | 6,992 (100.0%) | $53,762 |
Occupancy by Householder Income Bracket in Cloverleaf
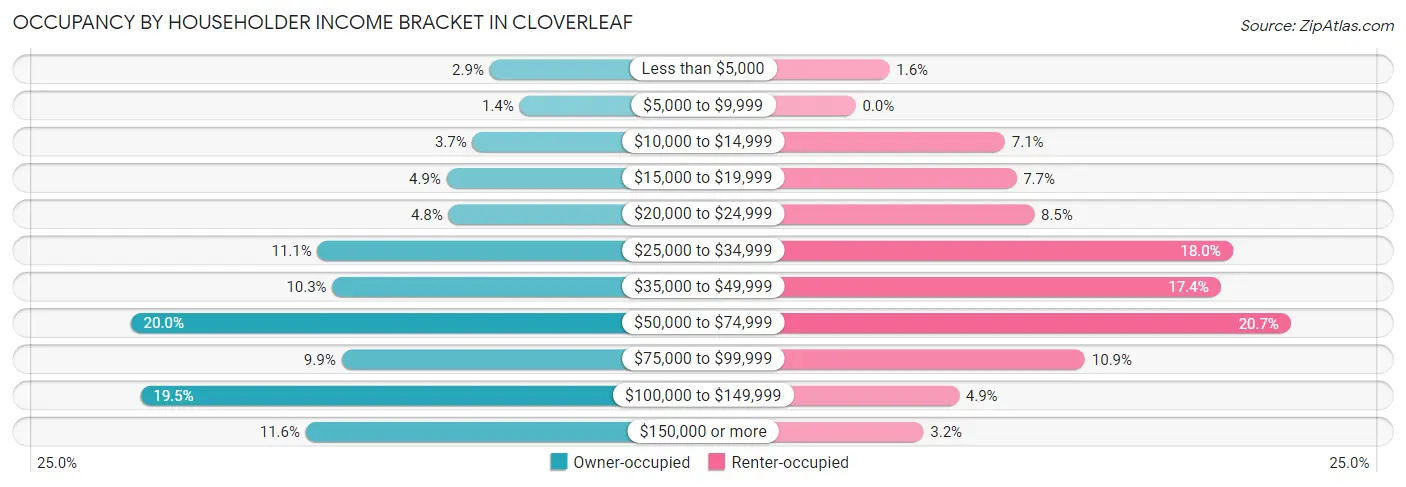
| Income Bracket | Owner-occupied | Renter-occupied |
| Less than $5,000 | 125 (2.9%) | 42 (1.6%) |
| $5,000 to $9,999 | 63 (1.4%) | 0 (0.0%) |
| $10,000 to $14,999 | 161 (3.7%) | 185 (7.1%) |
| $15,000 to $19,999 | 215 (4.9%) | 199 (7.6%) |
| $20,000 to $24,999 | 211 (4.8%) | 221 (8.5%) |
| $25,000 to $34,999 | 485 (11.1%) | 467 (17.9%) |
| $35,000 to $49,999 | 454 (10.3%) | 452 (17.4%) |
| $50,000 to $74,999 | 876 (20.0%) | 539 (20.7%) |
| $75,000 to $99,999 | 435 (9.9%) | 284 (10.9%) |
| $100,000 to $149,999 | 856 (19.5%) | 128 (4.9%) |
| $150,000 or more | 510 (11.6%) | 84 (3.2%) |
| Total | 4,391 (100.0%) | 2,601 (100.0%) |
Monthly Housing Cost Tiers in Cloverleaf
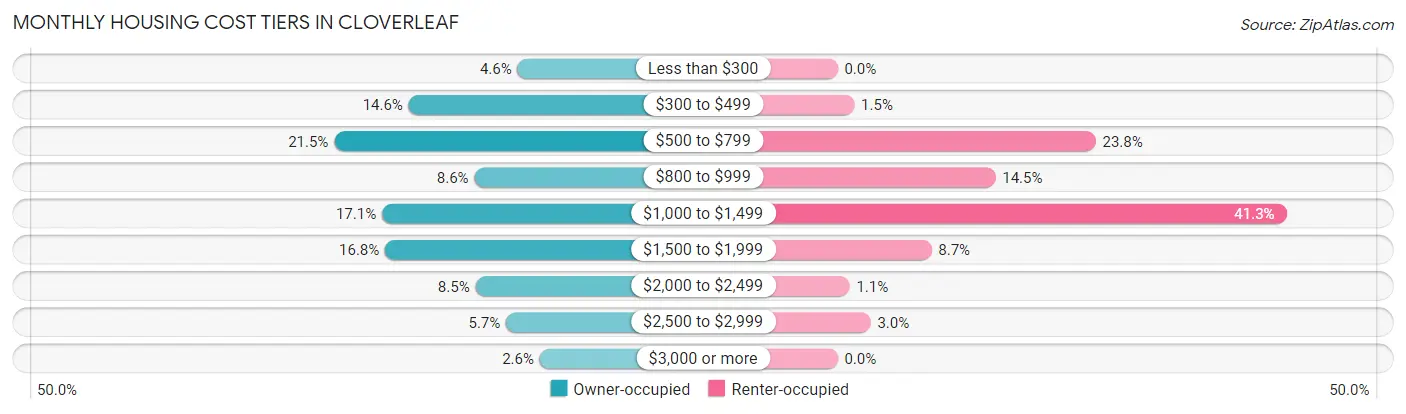
| Monthly Cost | Owner-occupied | Renter-occupied |
| Less than $300 | 203 (4.6%) | 0 (0.0%) |
| $300 to $499 | 643 (14.6%) | 40 (1.5%) |
| $500 to $799 | 944 (21.5%) | 618 (23.8%) |
| $800 to $999 | 377 (8.6%) | 378 (14.5%) |
| $1,000 to $1,499 | 751 (17.1%) | 1,075 (41.3%) |
| $1,500 to $1,999 | 738 (16.8%) | 225 (8.6%) |
| $2,000 to $2,499 | 373 (8.5%) | 29 (1.1%) |
| $2,500 to $2,999 | 249 (5.7%) | 79 (3.0%) |
| $3,000 or more | 113 (2.6%) | 0 (0.0%) |
| Total | 4,391 (100.0%) | 2,601 (100.0%) |
Physical Housing Characteristics in Cloverleaf
Housing Structures in Cloverleaf
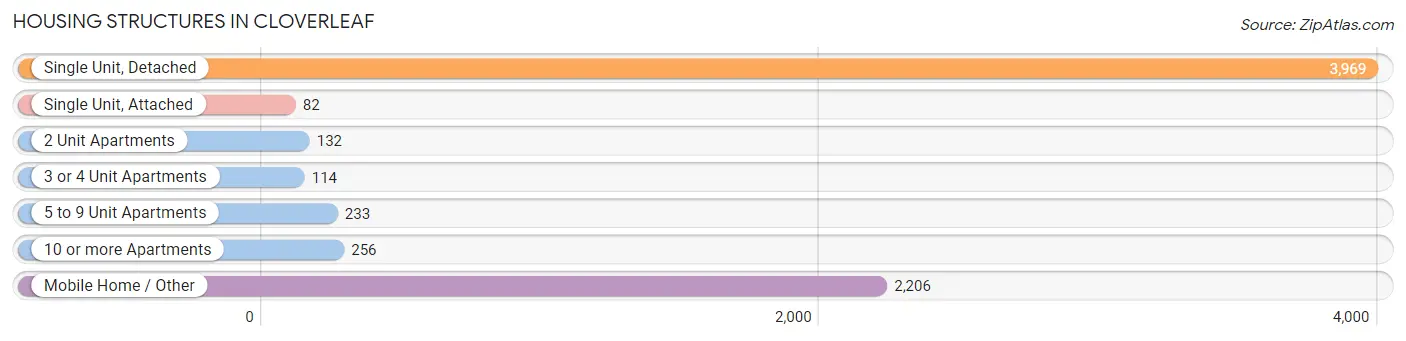
| Structure Type | # Housing Units | % Housing Units |
| Single Unit, Detached | 3,969 | 56.8% |
| Single Unit, Attached | 82 | 1.2% |
| 2 Unit Apartments | 132 | 1.9% |
| 3 or 4 Unit Apartments | 114 | 1.6% |
| 5 to 9 Unit Apartments | 233 | 3.3% |
| 10 or more Apartments | 256 | 3.7% |
| Mobile Home / Other | 2,206 | 31.6% |
| Total | 6,992 | 100.0% |
Housing Structures by Occupancy in Cloverleaf
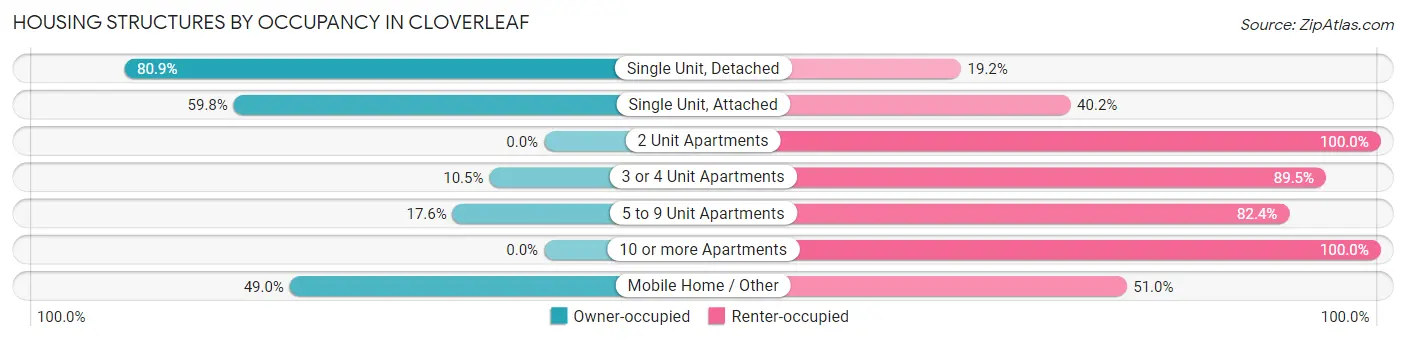
| Structure Type | Owner-occupied | Renter-occupied |
| Single Unit, Detached | 3,209 (80.8%) | 760 (19.2%) |
| Single Unit, Attached | 49 (59.8%) | 33 (40.2%) |
| 2 Unit Apartments | 0 (0.0%) | 132 (100.0%) |
| 3 or 4 Unit Apartments | 12 (10.5%) | 102 (89.5%) |
| 5 to 9 Unit Apartments | 41 (17.6%) | 192 (82.4%) |
| 10 or more Apartments | 0 (0.0%) | 256 (100.0%) |
| Mobile Home / Other | 1,080 (49.0%) | 1,126 (51.0%) |
| Total | 4,391 (62.8%) | 2,601 (37.2%) |
Housing Structures by Number of Rooms in Cloverleaf
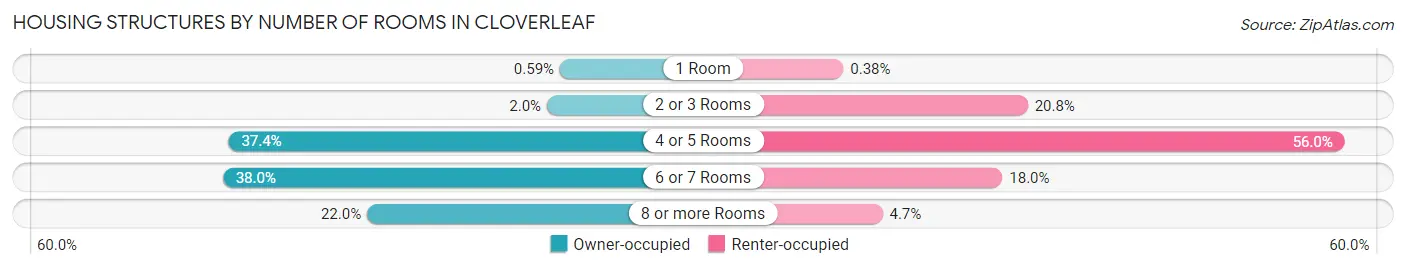
| Number of Rooms | Owner-occupied | Renter-occupied |
| 1 Room | 26 (0.6%) | 10 (0.4%) |
| 2 or 3 Rooms | 89 (2.0%) | 542 (20.8%) |
| 4 or 5 Rooms | 1,641 (37.4%) | 1,457 (56.0%) |
| 6 or 7 Rooms | 1,669 (38.0%) | 469 (18.0%) |
| 8 or more Rooms | 966 (22.0%) | 123 (4.7%) |
| Total | 4,391 (100.0%) | 2,601 (100.0%) |
Housing Structure by Heating Type in Cloverleaf
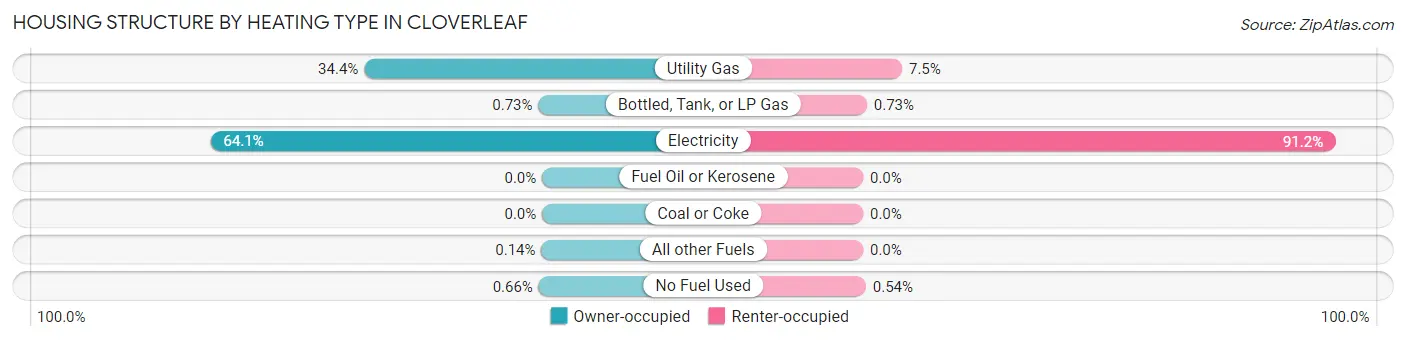
| Heating Type | Owner-occupied | Renter-occupied |
| Utility Gas | 1,510 (34.4%) | 196 (7.5%) |
| Bottled, Tank, or LP Gas | 32 (0.7%) | 19 (0.7%) |
| Electricity | 2,814 (64.1%) | 2,372 (91.2%) |
| Fuel Oil or Kerosene | 0 (0.0%) | 0 (0.0%) |
| Coal or Coke | 0 (0.0%) | 0 (0.0%) |
| All other Fuels | 6 (0.1%) | 0 (0.0%) |
| No Fuel Used | 29 (0.7%) | 14 (0.5%) |
| Total | 4,391 (100.0%) | 2,601 (100.0%) |
Household Vehicle Usage in Cloverleaf
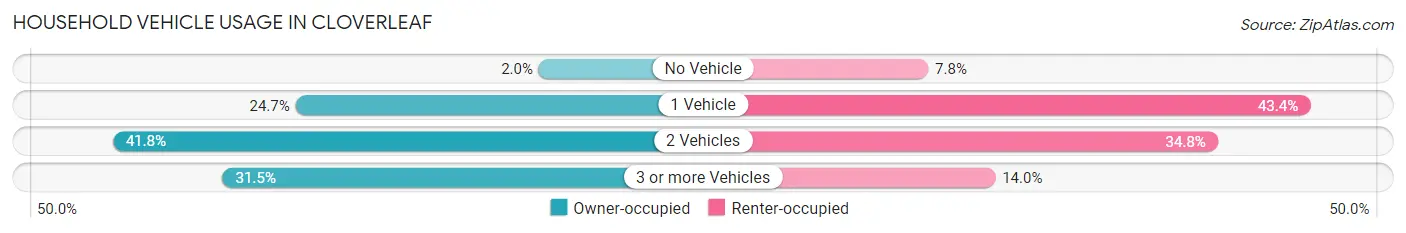
| Vehicles per Household | Owner-occupied | Renter-occupied |
| No Vehicle | 88 (2.0%) | 202 (7.8%) |
| 1 Vehicle | 1,085 (24.7%) | 1,129 (43.4%) |
| 2 Vehicles | 1,834 (41.8%) | 905 (34.8%) |
| 3 or more Vehicles | 1,384 (31.5%) | 365 (14.0%) |
| Total | 4,391 (100.0%) | 2,601 (100.0%) |
Real Estate & Mortgages in Cloverleaf
Real Estate and Mortgage Overview in Cloverleaf
| Characteristic | Without Mortgage | With Mortgage |
| Housing Units | 2,250 | 2,141 |
| Median Property Value | $127,600 | $172,700 |
| Median Household Income | $54,632 | $314 |
| Monthly Housing Costs | $590 | $63 |
| Real Estate Taxes | $1,608 | $246 |
Property Value by Mortgage Status in Cloverleaf
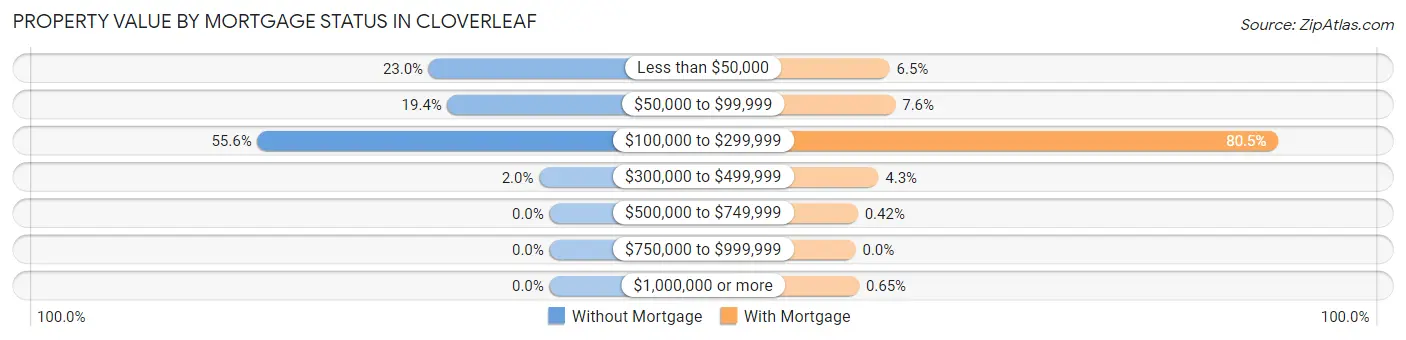
| Property Value | Without Mortgage | With Mortgage |
| Less than $50,000 | 517 (23.0%) | 139 (6.5%) |
| $50,000 to $99,999 | 437 (19.4%) | 162 (7.6%) |
| $100,000 to $299,999 | 1,252 (55.6%) | 1,724 (80.5%) |
| $300,000 to $499,999 | 44 (2.0%) | 93 (4.3%) |
| $500,000 to $749,999 | 0 (0.0%) | 9 (0.4%) |
| $750,000 to $999,999 | 0 (0.0%) | 0 (0.0%) |
| $1,000,000 or more | 0 (0.0%) | 14 (0.6%) |
| Total | 2,250 (100.0%) | 2,141 (100.0%) |
Household Income by Mortgage Status in Cloverleaf
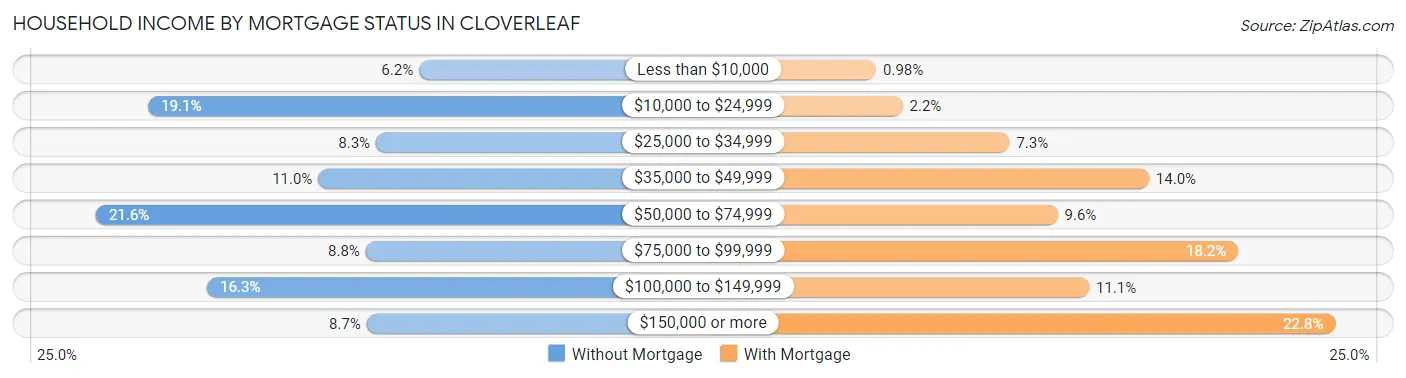
| Household Income | Without Mortgage | With Mortgage |
| Less than $10,000 | 140 (6.2%) | 21 (1.0%) |
| $10,000 to $24,999 | 430 (19.1%) | 48 (2.2%) |
| $25,000 to $34,999 | 186 (8.3%) | 157 (7.3%) |
| $35,000 to $49,999 | 248 (11.0%) | 299 (14.0%) |
| $50,000 to $74,999 | 486 (21.6%) | 206 (9.6%) |
| $75,000 to $99,999 | 197 (8.8%) | 390 (18.2%) |
| $100,000 to $149,999 | 367 (16.3%) | 238 (11.1%) |
| $150,000 or more | 196 (8.7%) | 489 (22.8%) |
| Total | 2,250 (100.0%) | 2,141 (100.0%) |
Property Value to Household Income Ratio in Cloverleaf
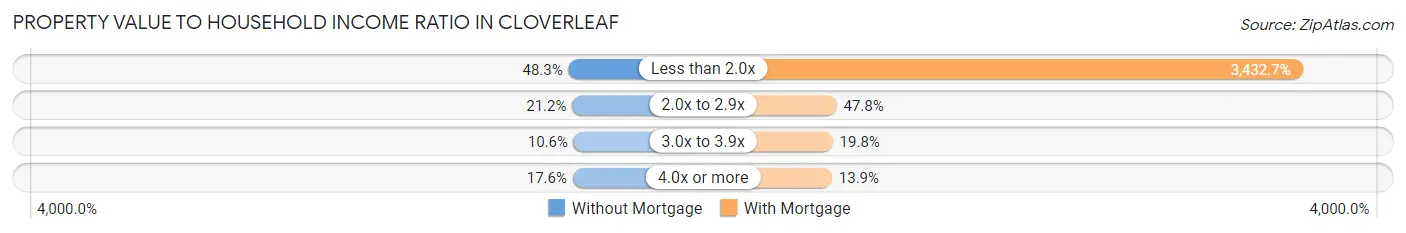
| Value-to-Income Ratio | Without Mortgage | With Mortgage |
| Less than 2.0x | 1,086 (48.3%) | 73,495 (3,432.7%) |
| 2.0x to 2.9x | 476 (21.2%) | 1,023 (47.8%) |
| 3.0x to 3.9x | 239 (10.6%) | 423 (19.8%) |
| 4.0x or more | 396 (17.6%) | 298 (13.9%) |
| Total | 2,250 (100.0%) | 2,141 (100.0%) |
Real Estate Taxes by Mortgage Status in Cloverleaf
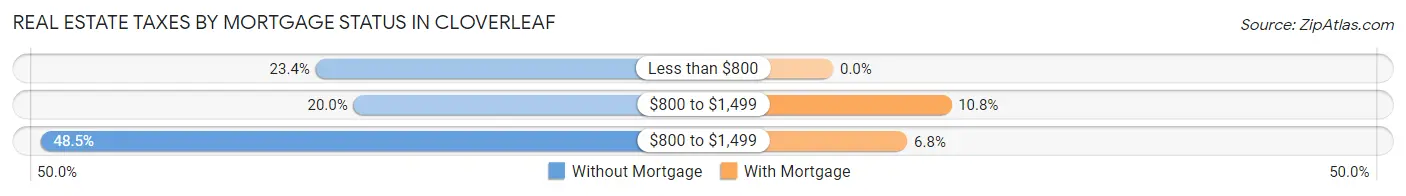
| Property Taxes | Without Mortgage | With Mortgage |
| Less than $800 | 527 (23.4%) | 0 (0.0%) |
| $800 to $1,499 | 449 (20.0%) | 231 (10.8%) |
| $800 to $1,499 | 1,092 (48.5%) | 145 (6.8%) |
| Total | 2,250 (100.0%) | 2,141 (100.0%) |
Health & Disability in Cloverleaf
Health Insurance Coverage by Age in Cloverleaf
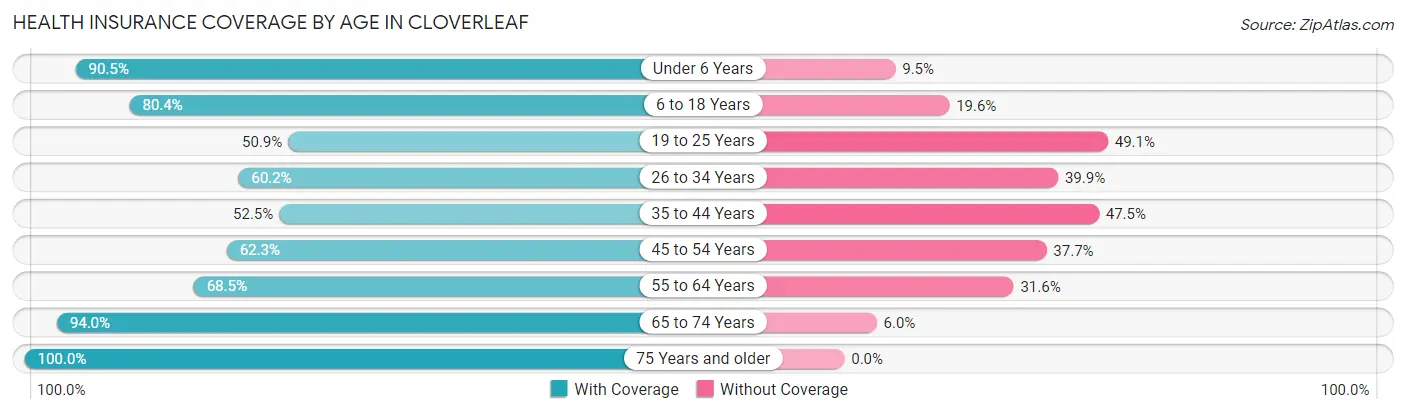
| Age Bracket | With Coverage | Without Coverage |
| Under 6 Years | 2,104 (90.5%) | 221 (9.5%) |
| 6 to 18 Years | 5,144 (80.4%) | 1,251 (19.6%) |
| 19 to 25 Years | 1,177 (50.9%) | 1,137 (49.1%) |
| 26 to 34 Years | 1,950 (60.2%) | 1,292 (39.9%) |
| 35 to 44 Years | 1,707 (52.5%) | 1,542 (47.5%) |
| 45 to 54 Years | 1,653 (62.3%) | 1,000 (37.7%) |
| 55 to 64 Years | 1,718 (68.4%) | 792 (31.6%) |
| 65 to 74 Years | 1,156 (94.0%) | 74 (6.0%) |
| 75 Years and older | 797 (100.0%) | 0 (0.0%) |
| Total | 17,406 (70.4%) | 7,309 (29.6%) |
Health Insurance Coverage by Citizenship Status in Cloverleaf
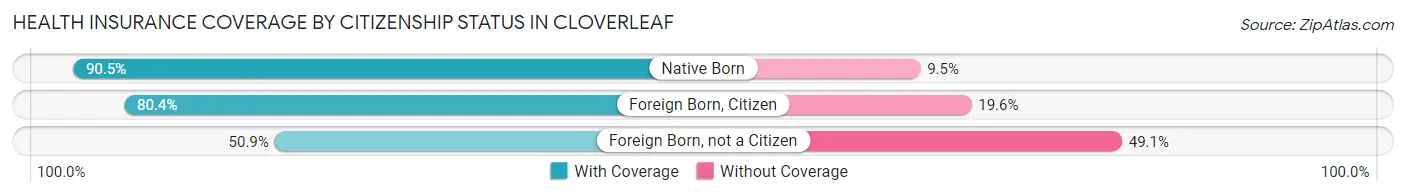
| Citizenship Status | With Coverage | Without Coverage |
| Native Born | 2,104 (90.5%) | 221 (9.5%) |
| Foreign Born, Citizen | 5,144 (80.4%) | 1,251 (19.6%) |
| Foreign Born, not a Citizen | 1,177 (50.9%) | 1,137 (49.1%) |
Health Insurance Coverage by Household Income in Cloverleaf
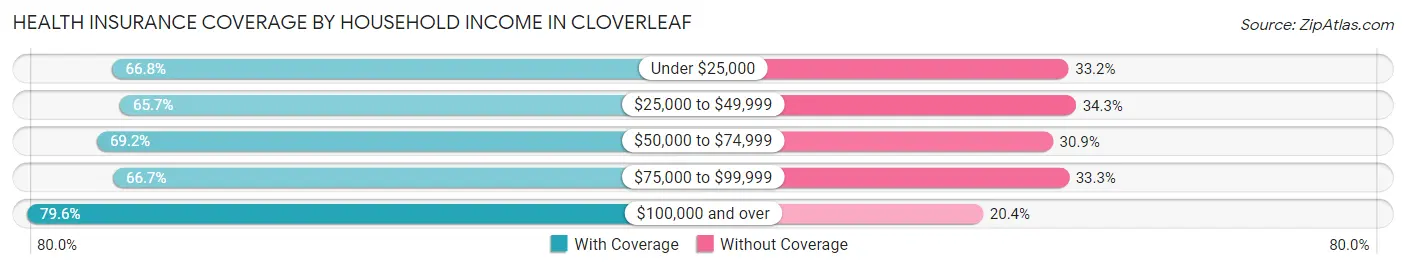
| Household Income | With Coverage | Without Coverage |
| Under $25,000 | 2,523 (66.8%) | 1,254 (33.2%) |
| $25,000 to $49,999 | 4,205 (65.7%) | 2,196 (34.3%) |
| $50,000 to $74,999 | 3,261 (69.2%) | 1,455 (30.8%) |
| $75,000 to $99,999 | 2,083 (66.7%) | 1,038 (33.3%) |
| $100,000 and over | 5,334 (79.6%) | 1,366 (20.4%) |
Public vs Private Health Insurance Coverage by Age in Cloverleaf
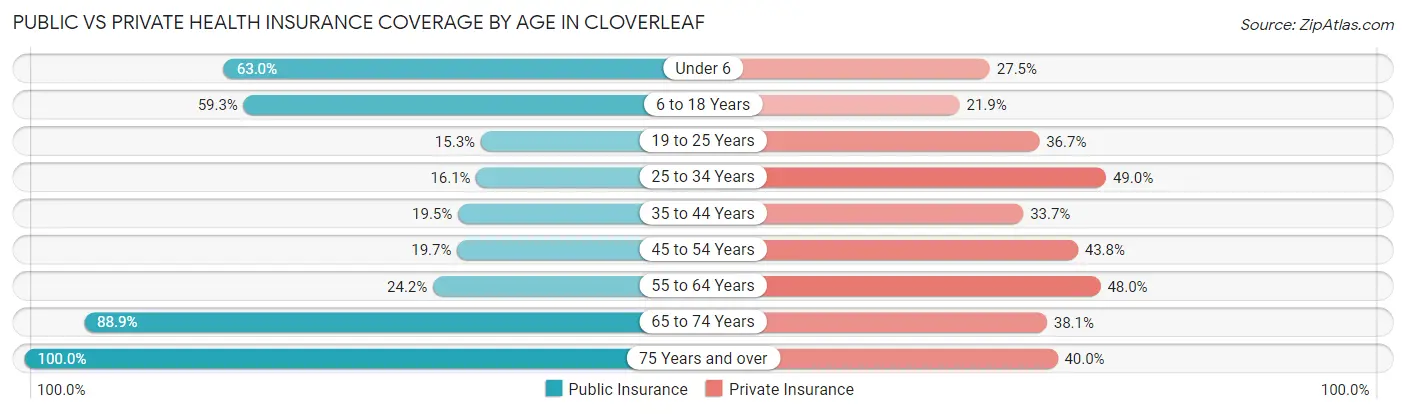
| Age Bracket | Public Insurance | Private Insurance |
| Under 6 | 1,465 (63.0%) | 639 (27.5%) |
| 6 to 18 Years | 3,794 (59.3%) | 1,398 (21.9%) |
| 19 to 25 Years | 354 (15.3%) | 848 (36.6%) |
| 25 to 34 Years | 523 (16.1%) | 1,590 (49.0%) |
| 35 to 44 Years | 635 (19.5%) | 1,094 (33.7%) |
| 45 to 54 Years | 522 (19.7%) | 1,162 (43.8%) |
| 55 to 64 Years | 607 (24.2%) | 1,205 (48.0%) |
| 65 to 74 Years | 1,094 (88.9%) | 468 (38.1%) |
| 75 Years and over | 797 (100.0%) | 319 (40.0%) |
| Total | 9,791 (39.6%) | 8,723 (35.3%) |
Disability Status by Sex by Age in Cloverleaf
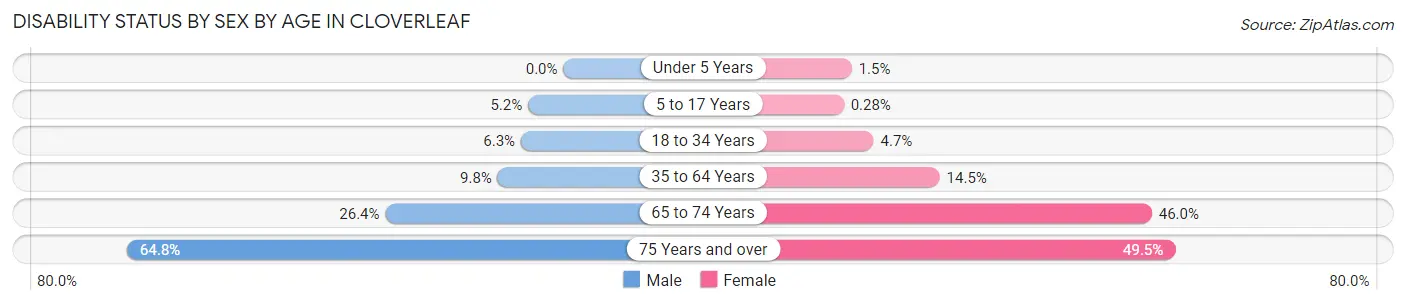
| Age Bracket | Male | Female |
| Under 5 Years | 0 (0.0%) | 14 (1.5%) |
| 5 to 17 Years | 177 (5.2%) | 9 (0.3%) |
| 18 to 34 Years | 204 (6.3%) | 122 (4.7%) |
| 35 to 64 Years | 419 (9.8%) | 598 (14.5%) |
| 65 to 74 Years | 162 (26.4%) | 284 (46.0%) |
| 75 Years and over | 197 (64.8%) | 244 (49.5%) |
Disability Class by Sex by Age in Cloverleaf
Disability Class: Hearing Difficulty
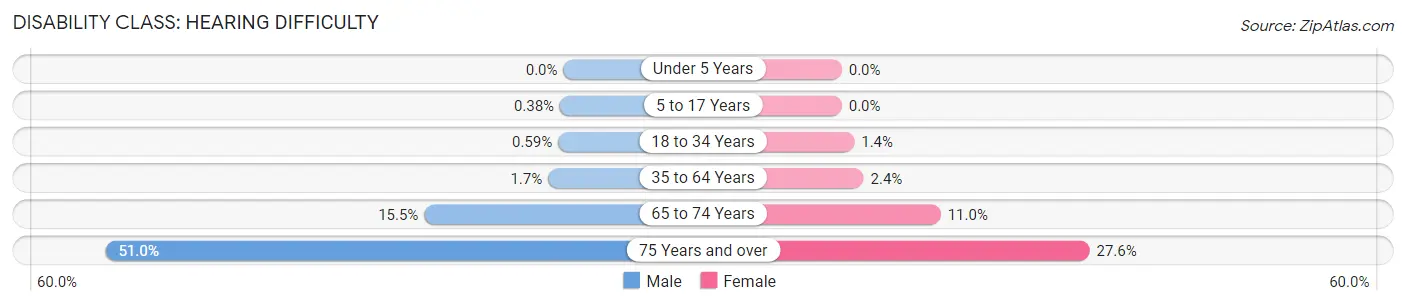
| Age Bracket | Male | Female |
| Under 5 Years | 0 (0.0%) | 0 (0.0%) |
| 5 to 17 Years | 13 (0.4%) | 0 (0.0%) |
| 18 to 34 Years | 19 (0.6%) | 36 (1.4%) |
| 35 to 64 Years | 73 (1.7%) | 100 (2.4%) |
| 65 to 74 Years | 95 (15.5%) | 68 (11.0%) |
| 75 Years and over | 155 (51.0%) | 136 (27.6%) |
Disability Class: Vision Difficulty
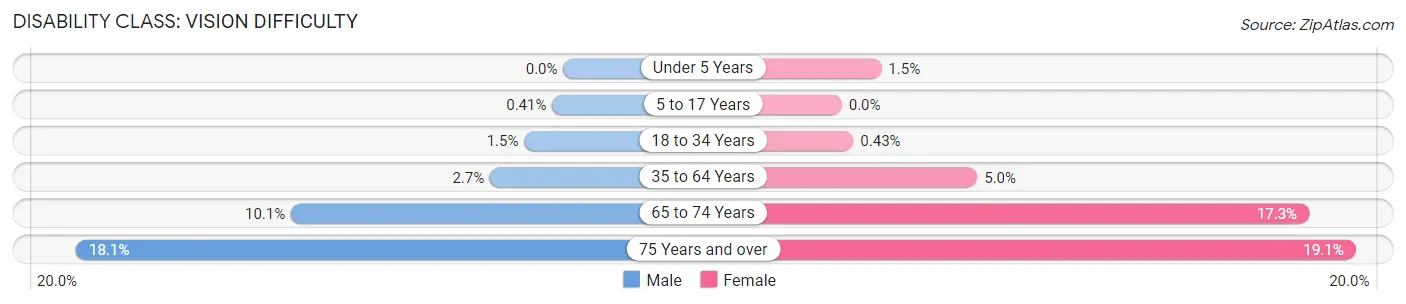
| Age Bracket | Male | Female |
| Under 5 Years | 0 (0.0%) | 14 (1.5%) |
| 5 to 17 Years | 14 (0.4%) | 0 (0.0%) |
| 18 to 34 Years | 47 (1.5%) | 11 (0.4%) |
| 35 to 64 Years | 117 (2.7%) | 207 (5.0%) |
| 65 to 74 Years | 62 (10.1%) | 107 (17.3%) |
| 75 Years and over | 55 (18.1%) | 94 (19.1%) |
Disability Class: Cognitive Difficulty
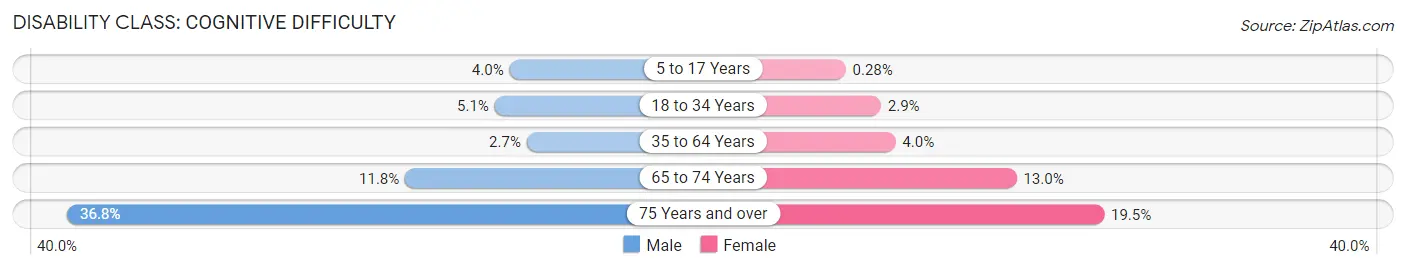
| Age Bracket | Male | Female |
| 5 to 17 Years | 135 (4.0%) | 9 (0.3%) |
| 18 to 34 Years | 165 (5.1%) | 75 (2.9%) |
| 35 to 64 Years | 117 (2.7%) | 164 (4.0%) |
| 65 to 74 Years | 72 (11.7%) | 80 (13.0%) |
| 75 Years and over | 112 (36.8%) | 96 (19.5%) |
Disability Class: Ambulatory Difficulty
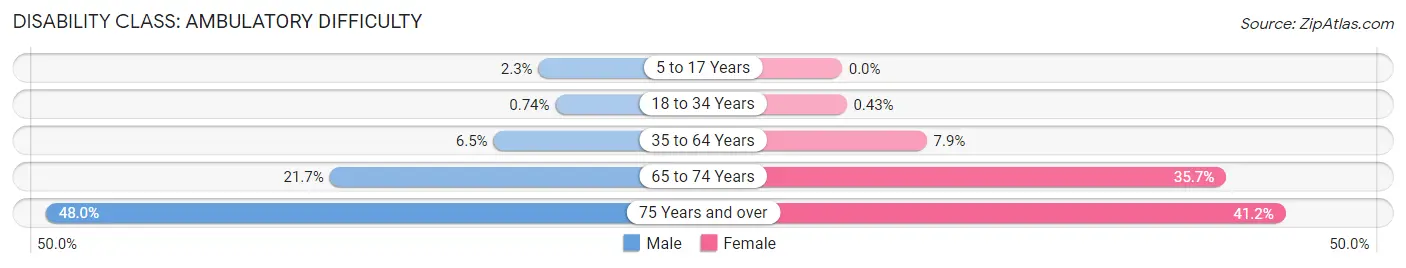
| Age Bracket | Male | Female |
| 5 to 17 Years | 78 (2.3%) | 0 (0.0%) |
| 18 to 34 Years | 24 (0.7%) | 11 (0.4%) |
| 35 to 64 Years | 279 (6.5%) | 324 (7.9%) |
| 65 to 74 Years | 133 (21.7%) | 220 (35.7%) |
| 75 Years and over | 146 (48.0%) | 203 (41.2%) |
Disability Class: Self-Care Difficulty
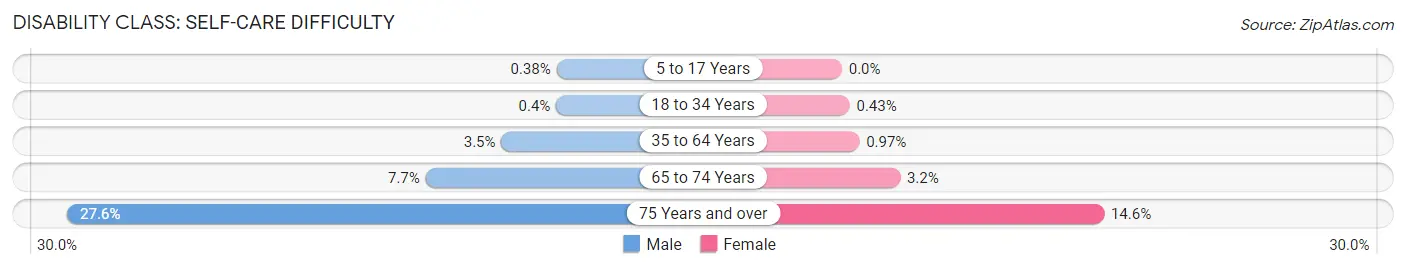
| Age Bracket | Male | Female |
| 5 to 17 Years | 13 (0.4%) | 0 (0.0%) |
| 18 to 34 Years | 13 (0.4%) | 11 (0.4%) |
| 35 to 64 Years | 148 (3.5%) | 40 (1.0%) |
| 65 to 74 Years | 47 (7.7%) | 20 (3.2%) |
| 75 Years and over | 84 (27.6%) | 72 (14.6%) |
Technology Access in Cloverleaf
Computing Device Access in Cloverleaf
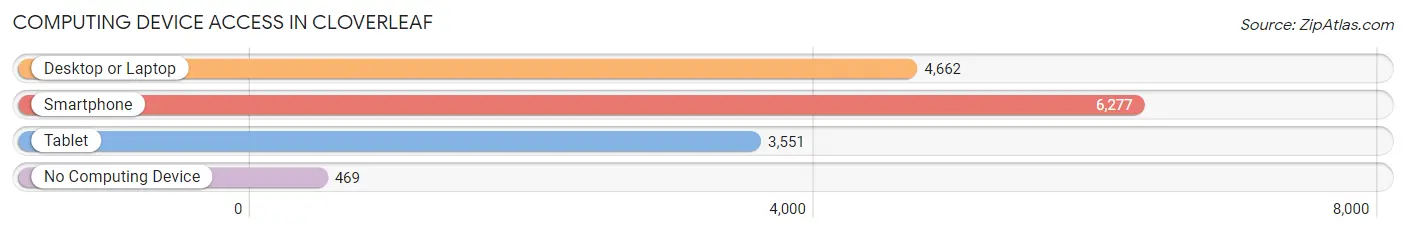
| Device Type | # Households | % Households |
| Desktop or Laptop | 4,662 | 66.7% |
| Smartphone | 6,277 | 89.8% |
| Tablet | 3,551 | 50.8% |
| No Computing Device | 469 | 6.7% |
| Total | 6,992 | 100.0% |
Internet Access in Cloverleaf
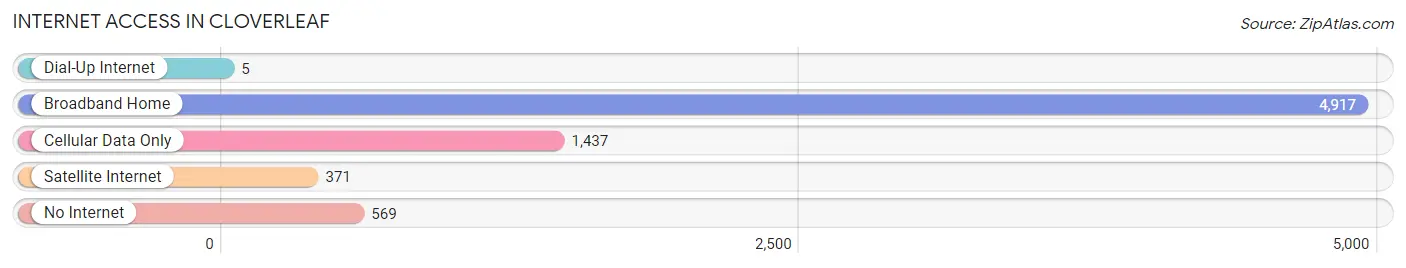
| Internet Type | # Households | % Households |
| Dial-Up Internet | 5 | 0.1% |
| Broadband Home | 4,917 | 70.3% |
| Cellular Data Only | 1,437 | 20.5% |
| Satellite Internet | 371 | 5.3% |
| No Internet | 569 | 8.1% |
| Total | 6,992 | 100.0% |
Cloverleaf Summary
Cloverleaf, Texas is a small unincorporated community located in Harris County, Texas. It is situated approximately 20 miles northeast of downtown Houston and is part of the Greater Houston metropolitan area. The community is bordered by the cities of Humble, Houston, and Crosby.
History
Cloverleaf was founded in the late 1800s by a group of German immigrants who settled in the area. The community was originally known as “Cloverleaf Station” and was a stop on the Houston and Great Northern Railroad. The railroad was built in 1873 and ran from Houston to Palestine, Texas. The railroad was later acquired by the Southern Pacific Railroad in 1883.
The community was officially incorporated in 1891 and was named after the cloverleaf shape of the railroad tracks. The town was home to a post office, a general store, a blacksmith shop, and a cotton gin. The town also had a school, which was built in 1892.
Geography
Cloverleaf is located in Harris County, Texas, approximately 20 miles northeast of downtown Houston. The community is bordered by the cities of Humble, Houston, and Crosby. The total area of Cloverleaf is approximately 1.5 square miles. The terrain is mostly flat with some rolling hills. The climate is humid subtropical with hot summers and mild winters.
Economy
Cloverleaf is primarily a residential community with no major industries or businesses. The majority of the population is employed in the nearby cities of Houston and Humble. The median household income in Cloverleaf is approximately $50,000.
Demographics
As of the 2010 census, the population of Cloverleaf was 2,845. The racial makeup of the community was 79.3% White, 11.2% African American, 0.7% Native American, 0.7% Asian, and 6.9% from other races. The median age of the population was 37.7 years.
Conclusion
Cloverleaf, Texas is a small unincorporated community located in Harris County, Texas. It is situated approximately 20 miles northeast of downtown Houston and is part of the Greater Houston metropolitan area. The community was founded in the late 1800s by a group of German immigrants and was officially incorporated in 1891. The total area of Cloverleaf is approximately 1.5 square miles and the terrain is mostly flat with some rolling hills. The climate is humid subtropical with hot summers and mild winters. Cloverleaf is primarily a residential community with no major industries or businesses. As of the 2010 census, the population of Cloverleaf was 2,845. The racial makeup of the community was 79.3% White, 11.2% African American, 0.7% Native American, 0.7% Asian, and 6.9% from other races. The median age of the population was 37.7 years.
Common Questions
What is Per Capita Income in Cloverleaf?
Per Capita income in Cloverleaf is $19,984.
What is the Median Family Income in Cloverleaf?
Median Family Income in Cloverleaf is $54,980.
What is the Median Household income in Cloverleaf?
Median Household Income in Cloverleaf is $53,762.
What is Income or Wage Gap in Cloverleaf?
Income or Wage Gap in Cloverleaf is 28.7%.
Women in Cloverleaf earn 71.3 cents for every dollar earned by a man.
What is Family Income Deficit in Cloverleaf?
Family Income Deficit in Cloverleaf is $10,068.
Families that are below poverty line in Cloverleaf earn $10,068 less on average than the poverty threshold level.
What is Inequality or Gini Index in Cloverleaf?
Inequality or Gini Index in Cloverleaf is 0.41.
What is the Total Population of Cloverleaf?
Total Population of Cloverleaf is 24,735.
What is the Total Male Population of Cloverleaf?
Total Male Population of Cloverleaf is 12,806.
What is the Total Female Population of Cloverleaf?
Total Female Population of Cloverleaf is 11,929.
What is the Ratio of Males per 100 Females in Cloverleaf?
There are 107.35 Males per 100 Females in Cloverleaf.
What is the Ratio of Females per 100 Males in Cloverleaf?
There are 93.15 Females per 100 Males in Cloverleaf.
What is the Median Population Age in Cloverleaf?
Median Population Age in Cloverleaf is 30.0 Years.
What is the Average Family Size in Cloverleaf
Average Family Size in Cloverleaf is 4.0 People.
What is the Average Household Size in Cloverleaf
Average Household Size in Cloverleaf is 3.5 People.
How Large is the Labor Force in Cloverleaf?
There are 10,958 People in the Labor Forcein in Cloverleaf.
What is the Percentage of People in the Labor Force in Cloverleaf?
63.0% of People are in the Labor Force in Cloverleaf.
What is the Unemployment Rate in Cloverleaf?
Unemployment Rate in Cloverleaf is 7.6%.