Texas City, TX Map & Demographics
Texas City Map
Texas City Overview
$31,361
PER CAPITA INCOME
$73,612
AVG FAMILY INCOME
$61,359
AVG HOUSEHOLD INCOME
30.4%
WAGE / INCOME GAP [ % ]
69.6¢/ $1
WAGE / INCOME GAP [ $ ]
0.46
INEQUALITY / GINI INDEX
53,084
TOTAL POPULATION
25,265
MALE POPULATION
27,819
FEMALE POPULATION
90.82
MALES / 100 FEMALES
110.11
FEMALES / 100 MALES
34.9
MEDIAN AGE
3.2
AVG FAMILY SIZE
2.5
AVG HOUSEHOLD SIZE
25,589
LABOR FORCE [ PEOPLE ]
62.6%
PERCENT IN LABOR FORCE
7.1%
UNEMPLOYMENT RATE
Income in Texas City
Income Overview in Texas City
Per Capita Income in Texas City is $31,361, while median incomes of families and households are $73,612 and $61,359 respectively.
| Characteristic | Number | Measure |
| Per Capita Income | 53,084 | $31,361 |
| Median Family Income | 13,368 | $73,612 |
| Mean Family Income | 13,368 | $94,854 |
| Median Household Income | 20,398 | $61,359 |
| Mean Household Income | 20,398 | $81,103 |
| Income Deficit | 13,368 | $0 |
| Wage / Income Gap (%) | 53,084 | 30.40% |
| Wage / Income Gap ($) | 53,084 | 69.60¢ per $1 |
| Gini / Inequality Index | 53,084 | 0.46 |
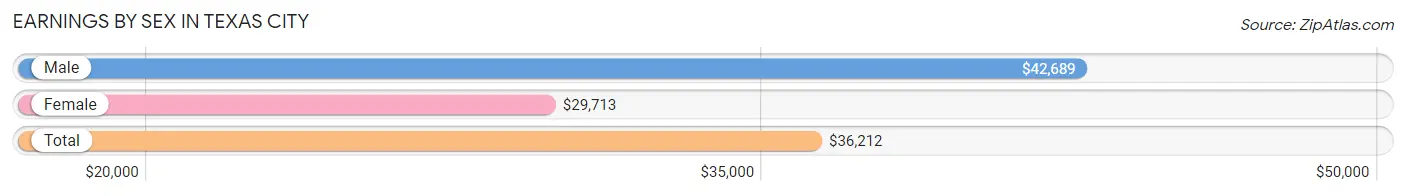
Earnings by Sex in Texas City
Average Earnings in Texas City are $36,212, $42,689 for men and $29,713 for women, a difference of 30.4%.
| Sex | Number | Average Earnings |
| Male | 13,929 (52.1%) | $42,689 |
| Female | 12,787 (47.9%) | $29,713 |
| Total | 26,716 (100.0%) | $36,212 |
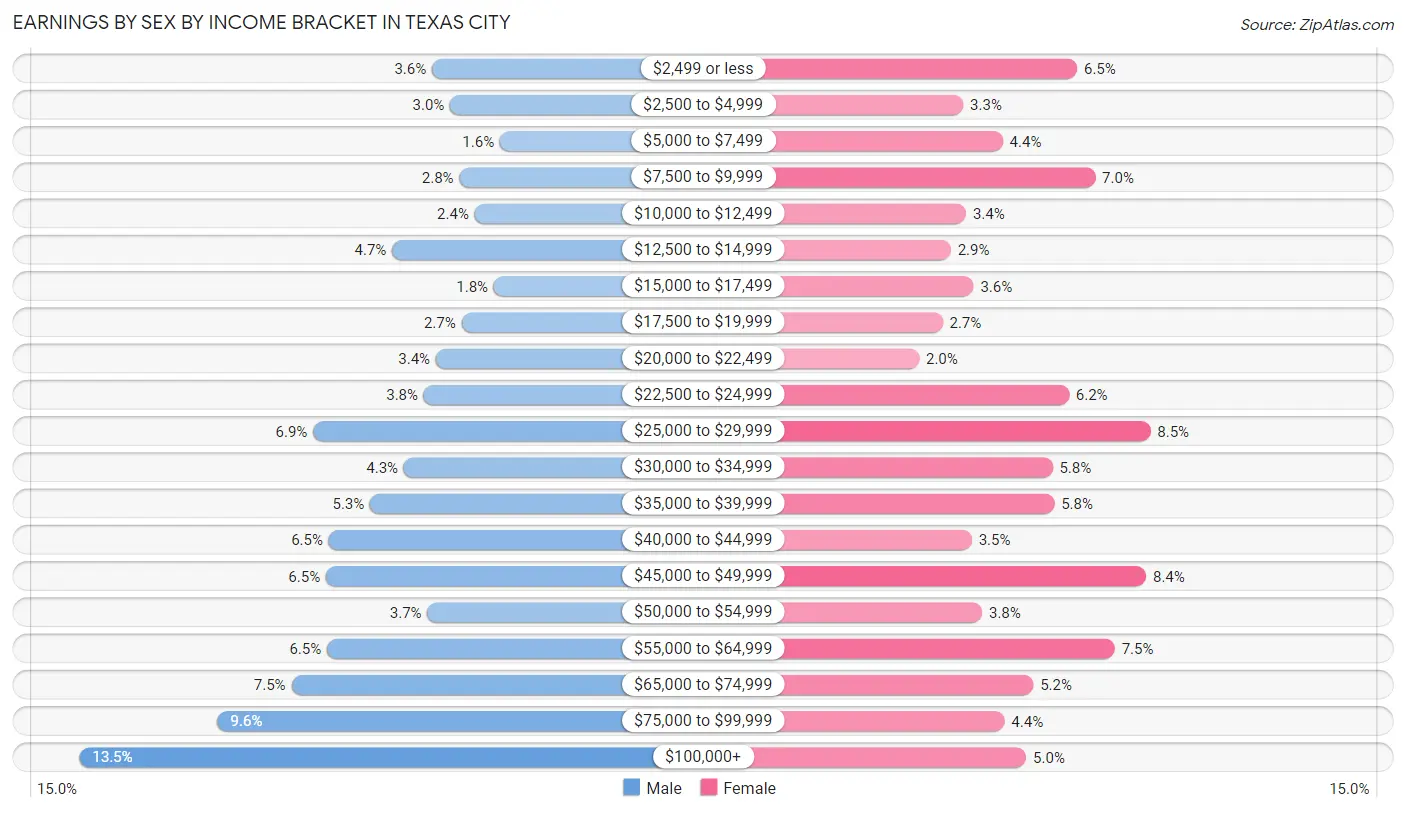
Earnings by Sex by Income Bracket in Texas City
The most common earnings brackets in Texas City are $100,000+ for men (1,875 | 13.5%) and $25,000 to $29,999 for women (1,091 | 8.5%).
| Income | Male | Female |
| $2,499 or less | 495 (3.5%) | 827 (6.5%) |
| $2,500 to $4,999 | 424 (3.0%) | 418 (3.3%) |
| $5,000 to $7,499 | 228 (1.6%) | 560 (4.4%) |
| $7,500 to $9,999 | 387 (2.8%) | 892 (7.0%) |
| $10,000 to $12,499 | 327 (2.4%) | 429 (3.4%) |
| $12,500 to $14,999 | 651 (4.7%) | 374 (2.9%) |
| $15,000 to $17,499 | 252 (1.8%) | 455 (3.6%) |
| $17,500 to $19,999 | 379 (2.7%) | 344 (2.7%) |
| $20,000 to $22,499 | 479 (3.4%) | 260 (2.0%) |
| $22,500 to $24,999 | 527 (3.8%) | 798 (6.2%) |
| $25,000 to $29,999 | 960 (6.9%) | 1,091 (8.5%) |
| $30,000 to $34,999 | 605 (4.3%) | 739 (5.8%) |
| $35,000 to $39,999 | 737 (5.3%) | 746 (5.8%) |
| $40,000 to $44,999 | 899 (6.5%) | 449 (3.5%) |
| $45,000 to $49,999 | 909 (6.5%) | 1,076 (8.4%) |
| $50,000 to $54,999 | 512 (3.7%) | 486 (3.8%) |
| $55,000 to $64,999 | 905 (6.5%) | 963 (7.5%) |
| $65,000 to $74,999 | 1,044 (7.5%) | 670 (5.2%) |
| $75,000 to $99,999 | 1,334 (9.6%) | 566 (4.4%) |
| $100,000+ | 1,875 (13.5%) | 644 (5.0%) |
| Total | 13,929 (100.0%) | 12,787 (100.0%) |
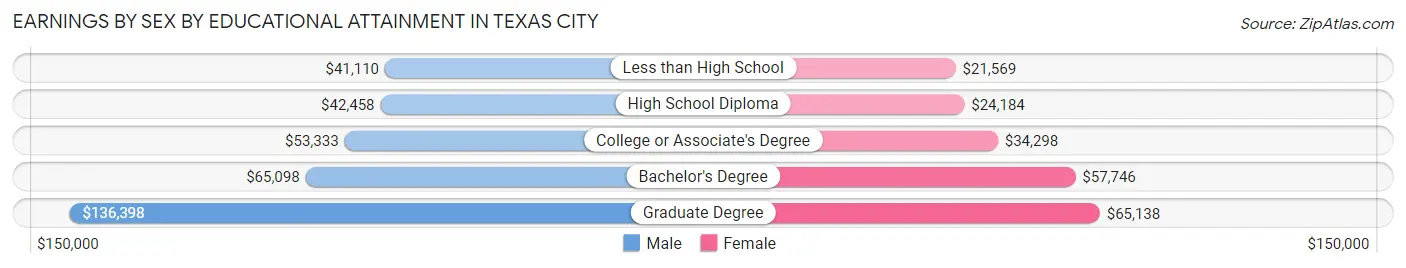
Earnings by Sex by Educational Attainment in Texas City
Average earnings in Texas City are $47,839 for men and $33,847 for women, a difference of 29.2%. Men with an educational attainment of graduate degree enjoy the highest average annual earnings of $136,398, while those with less than high school education earn the least with $41,110. Women with an educational attainment of graduate degree earn the most with the average annual earnings of $65,138, while those with less than high school education have the smallest earnings of $21,569.
| Educational Attainment | Male Income | Female Income |
| Less than High School | $41,110 | $21,569 |
| High School Diploma | $42,458 | $24,184 |
| College or Associate's Degree | $53,333 | $34,298 |
| Bachelor's Degree | $65,098 | $57,746 |
| Graduate Degree | $136,398 | $65,138 |
| Total | $47,839 | $33,847 |
Family Income in Texas City
Family Income Brackets in Texas City
According to the Texas City family income data, there are 2,633 families falling into the $100,000 to $149,999 income range, which is the most common income bracket and makes up 19.7% of all families. Conversely, the $10,000 to $14,999 income bracket is the least frequent group with only 495 families (3.7%) belonging to this category.
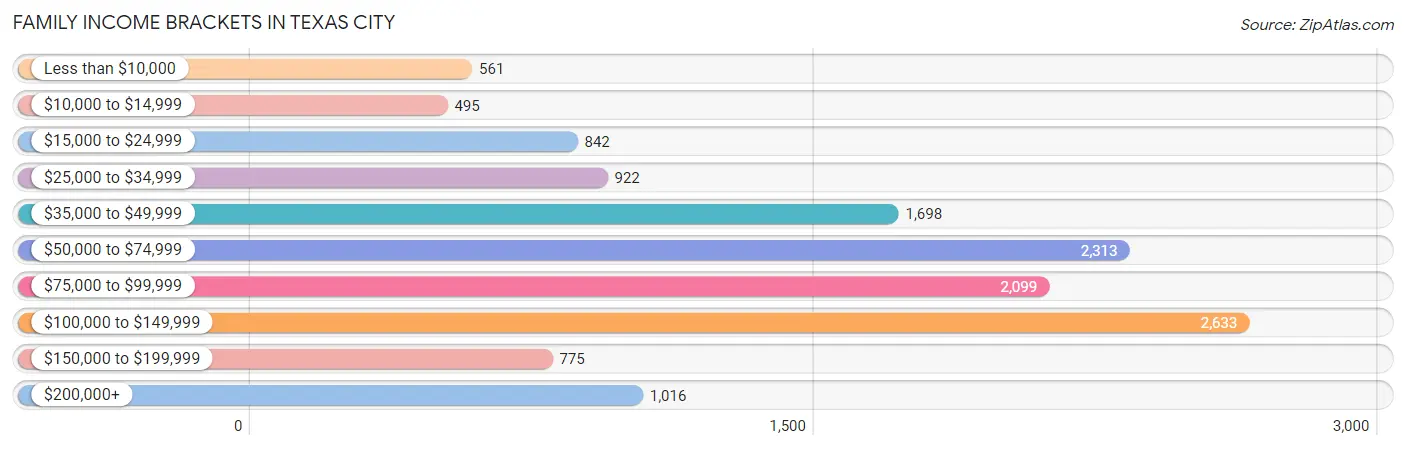
| Income Bracket | # Families | % Families |
| Less than $10,000 | 561 | 4.2% |
| $10,000 to $14,999 | 495 | 3.7% |
| $15,000 to $24,999 | 842 | 6.3% |
| $25,000 to $34,999 | 922 | 6.9% |
| $35,000 to $49,999 | 1,698 | 12.7% |
| $50,000 to $74,999 | 2,313 | 17.3% |
| $75,000 to $99,999 | 2,099 | 15.7% |
| $100,000 to $149,999 | 2,633 | 19.7% |
| $150,000 to $199,999 | 775 | 5.8% |
| $200,000+ | 1,016 | 7.6% |
Family Income by Famaliy Size in Texas City
5-person families (1,242 | 9.3%) account for the highest median family income in Texas City with $87,191 per family, while 2-person families (6,087 | 45.5%) have the highest median income of $35,864 per family member.
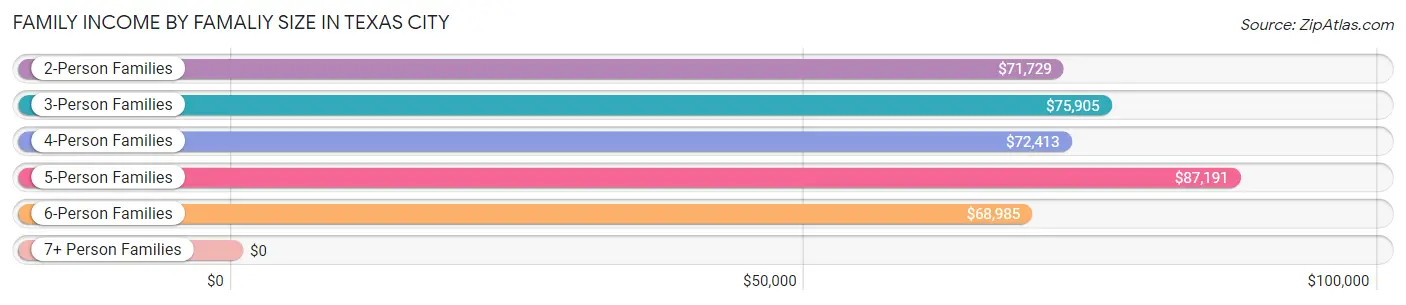
| Income Bracket | # Families | Median Income |
| 2-Person Families | 6,087 (45.5%) | $71,729 |
| 3-Person Families | 2,856 (21.4%) | $75,905 |
| 4-Person Families | 2,341 (17.5%) | $72,413 |
| 5-Person Families | 1,242 (9.3%) | $87,191 |
| 6-Person Families | 613 (4.6%) | $68,985 |
| 7+ Person Families | 229 (1.7%) | $0 |
| Total | 13,368 (100.0%) | $73,612 |
Family Income by Number of Earners in Texas City
The median family income in Texas City is $73,612, with families comprising 3+ earners (1,479) having the highest median family income of $122,525, while families with no earners (1,986) have the lowest median family income of $43,603, accounting for 11.1% and 14.9% of families, respectively.
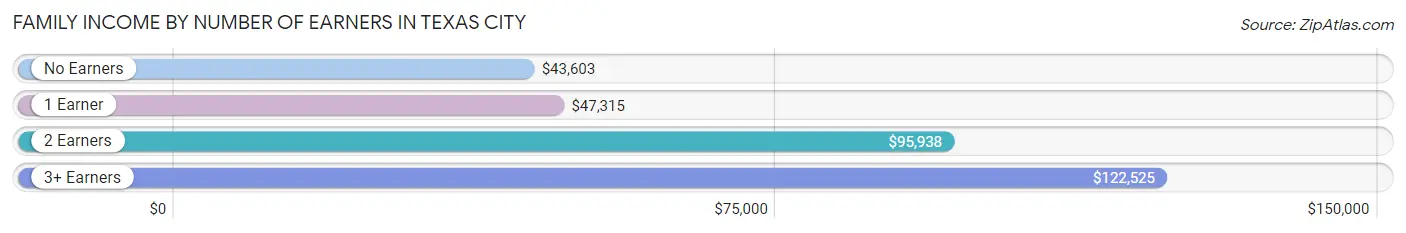
| Number of Earners | # Families | Median Income |
| No Earners | 1,986 (14.9%) | $43,603 |
| 1 Earner | 4,967 (37.2%) | $47,315 |
| 2 Earners | 4,936 (36.9%) | $95,938 |
| 3+ Earners | 1,479 (11.1%) | $122,525 |
| Total | 13,368 (100.0%) | $73,612 |
Household Income in Texas City
Household Income Brackets in Texas City
With 3,529 households falling in the category, the $50,000 to $74,999 income range is the most frequent in Texas City, accounting for 17.3% of all households. In contrast, only 836 households (4.1%) fall into the $150,000 to $199,999 income bracket, making it the least populous group.
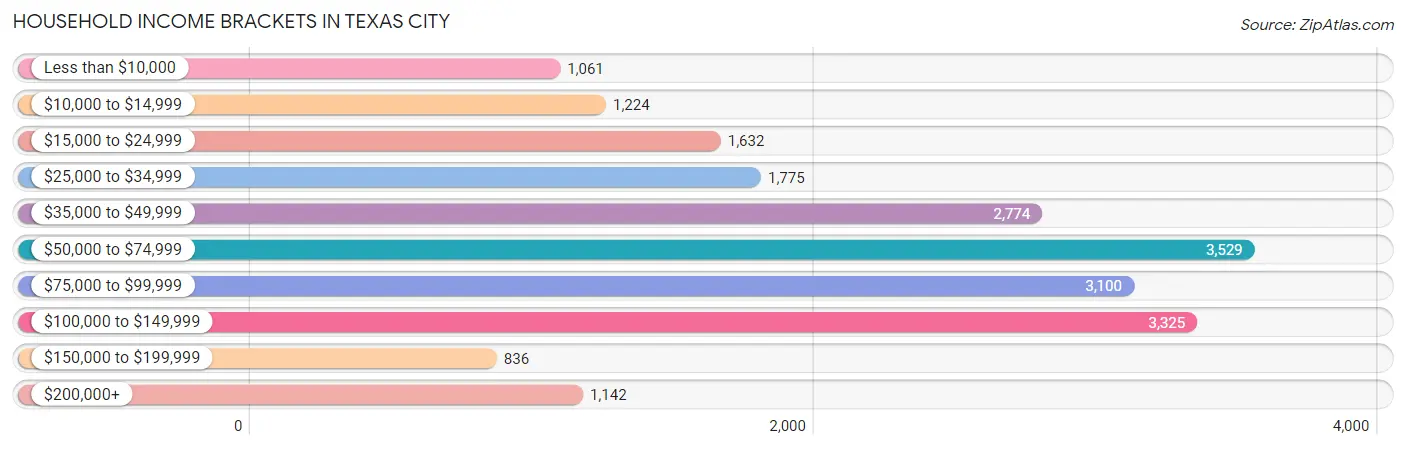
| Income Bracket | # Households | % Households |
| Less than $10,000 | 1,061 | 5.2% |
| $10,000 to $14,999 | 1,224 | 6.0% |
| $15,000 to $24,999 | 1,632 | 8.0% |
| $25,000 to $34,999 | 1,775 | 8.7% |
| $35,000 to $49,999 | 2,774 | 13.6% |
| $50,000 to $74,999 | 3,529 | 17.3% |
| $75,000 to $99,999 | 3,100 | 15.2% |
| $100,000 to $149,999 | 3,325 | 16.3% |
| $150,000 to $199,999 | 836 | 4.1% |
| $200,000+ | 1,142 | 5.6% |
Household Income by Householder Age in Texas City
The median household income in Texas City is $61,359, with the highest median household income of $66,383 found in the 25 to 44 years age bracket for the primary householder. A total of 6,609 households (32.4%) fall into this category. Meanwhile, the 65+ years age bracket for the primary householder has the lowest median household income of $53,072, with 5,182 households (25.4%) in this group.
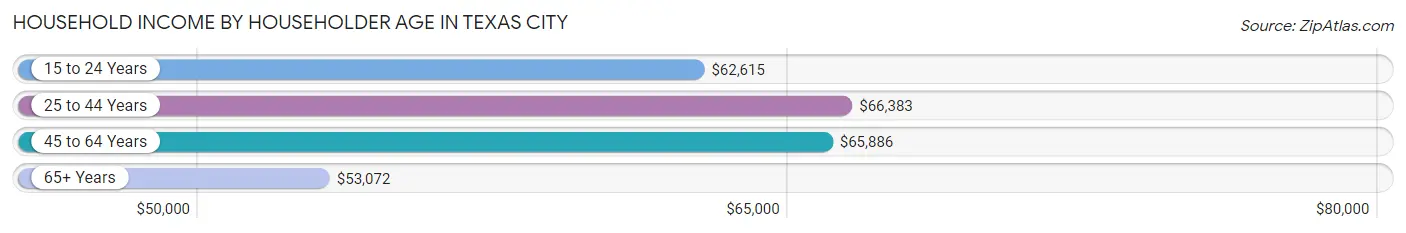
| Income Bracket | # Households | Median Income |
| 15 to 24 Years | 1,036 (5.1%) | $62,615 |
| 25 to 44 Years | 6,609 (32.4%) | $66,383 |
| 45 to 64 Years | 7,571 (37.1%) | $65,886 |
| 65+ Years | 5,182 (25.4%) | $53,072 |
| Total | 20,398 (100.0%) | $61,359 |
Poverty in Texas City
Income Below Poverty by Sex and Age in Texas City
With 13.8% poverty level for males and 16.9% for females among the residents of Texas City, 15 year old males and 6 to 11 year old females are the most vulnerable to poverty, with 101 males (37.6%) and 560 females (27.2%) in their respective age groups living below the poverty level.
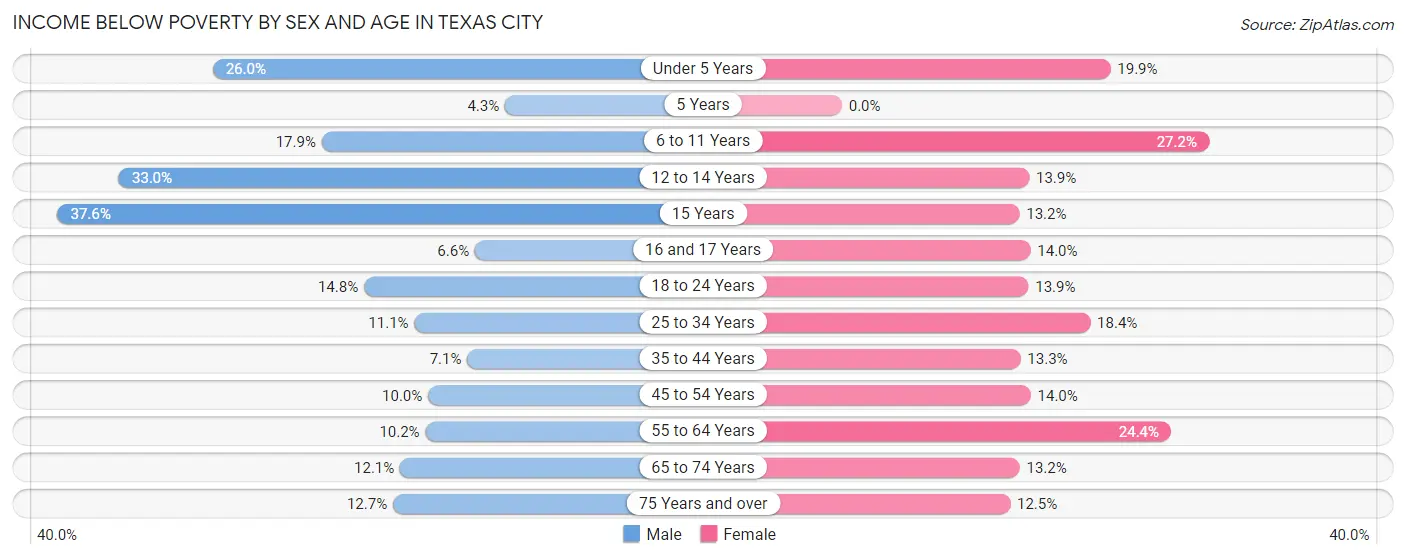
| Age Bracket | Male | Female |
| Under 5 Years | 497 (26.0%) | 358 (19.9%) |
| 5 Years | 11 (4.3%) | 0 (0.0%) |
| 6 to 11 Years | 440 (17.9%) | 560 (27.2%) |
| 12 to 14 Years | 359 (33.0%) | 169 (13.9%) |
| 15 Years | 101 (37.6%) | 102 (13.2%) |
| 16 and 17 Years | 44 (6.6%) | 106 (14.0%) |
| 18 to 24 Years | 365 (14.8%) | 315 (13.9%) |
| 25 to 34 Years | 465 (11.1%) | 715 (18.4%) |
| 35 to 44 Years | 197 (7.1%) | 432 (13.3%) |
| 45 to 54 Years | 249 (10.0%) | 427 (14.0%) |
| 55 to 64 Years | 313 (10.2%) | 816 (24.4%) |
| 65 to 74 Years | 260 (12.1%) | 348 (13.2%) |
| 75 Years and over | 150 (12.7%) | 211 (12.5%) |
| Total | 3,451 (13.8%) | 4,559 (16.9%) |
Income Above Poverty by Sex and Age in Texas City
According to the poverty statistics in Texas City, males aged 5 years and females aged 5 years are the age groups that are most secure financially, with 95.7% of males and 100.0% of females in these age groups living above the poverty line.
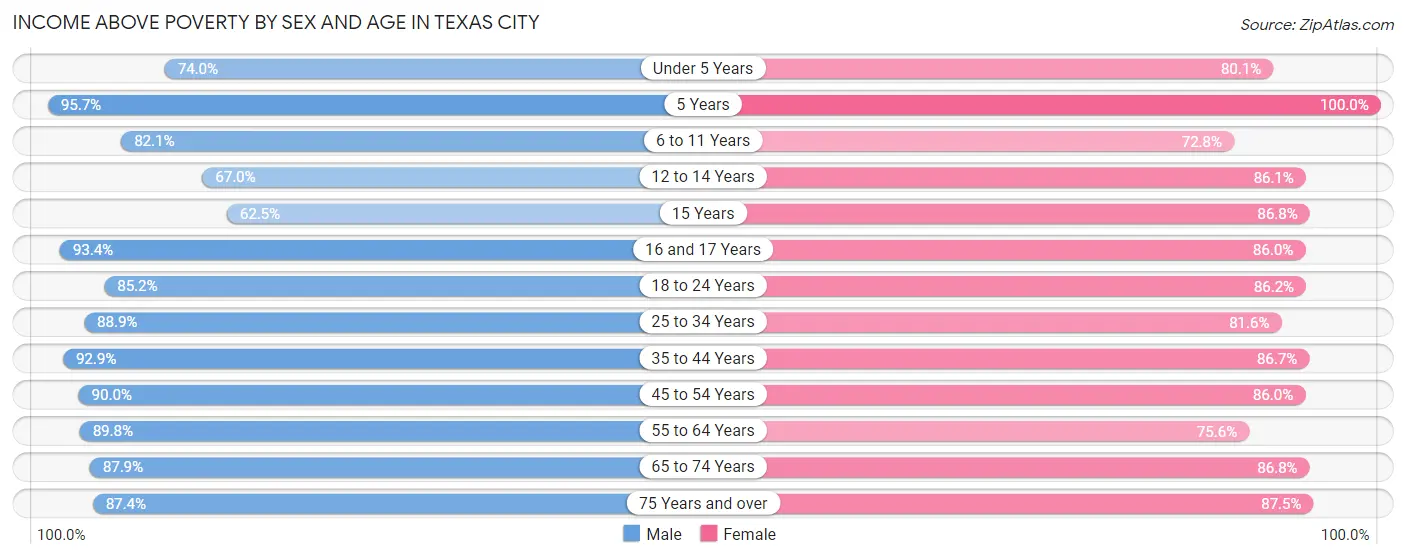
| Age Bracket | Male | Female |
| Under 5 Years | 1,412 (74.0%) | 1,437 (80.1%) |
| 5 Years | 243 (95.7%) | 201 (100.0%) |
| 6 to 11 Years | 2,012 (82.1%) | 1,496 (72.8%) |
| 12 to 14 Years | 729 (67.0%) | 1,047 (86.1%) |
| 15 Years | 168 (62.5%) | 672 (86.8%) |
| 16 and 17 Years | 627 (93.4%) | 651 (86.0%) |
| 18 to 24 Years | 2,102 (85.2%) | 1,960 (86.2%) |
| 25 to 34 Years | 3,739 (88.9%) | 3,163 (81.6%) |
| 35 to 44 Years | 2,566 (92.9%) | 2,827 (86.7%) |
| 45 to 54 Years | 2,232 (90.0%) | 2,618 (86.0%) |
| 55 to 64 Years | 2,743 (89.8%) | 2,524 (75.6%) |
| 65 to 74 Years | 1,886 (87.9%) | 2,288 (86.8%) |
| 75 Years and over | 1,036 (87.4%) | 1,478 (87.5%) |
| Total | 21,495 (86.2%) | 22,362 (83.1%) |
Income Below Poverty Among Married-Couple Families in Texas City
The poverty statistics for married-couple families in Texas City show that 7.4% or 625 of the total 8,423 families live below the poverty line. Families with 5 or more children have the highest poverty rate of 32.9%, comprising of 47 families. On the other hand, families with 1 or 2 children have the lowest poverty rate of 2.3%, which includes 54 families.
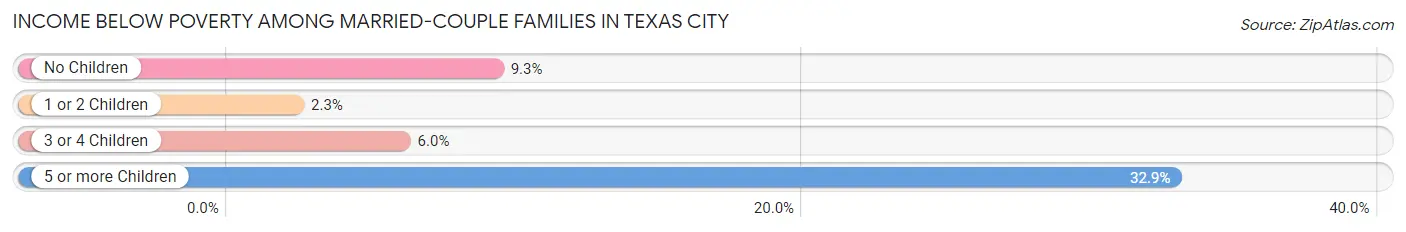
| Children | Above Poverty | Below Poverty |
| No Children | 4,690 (90.7%) | 478 (9.2%) |
| 1 or 2 Children | 2,293 (97.7%) | 54 (2.3%) |
| 3 or 4 Children | 719 (94.0%) | 46 (6.0%) |
| 5 or more Children | 96 (67.1%) | 47 (32.9%) |
| Total | 7,798 (92.6%) | 625 (7.4%) |
Income Below Poverty Among Single-Parent Households in Texas City
According to the poverty data in Texas City, 6.3% or 59 single-father households and 28.5% or 1,140 single-mother households are living below the poverty line. Among single-father households, those with 3 or 4 children have the highest poverty rate, with 59 households (64.8%) experiencing poverty. Likewise, among single-mother households, those with 3 or 4 children have the highest poverty rate, with 399 households (49.4%) falling below the poverty line.
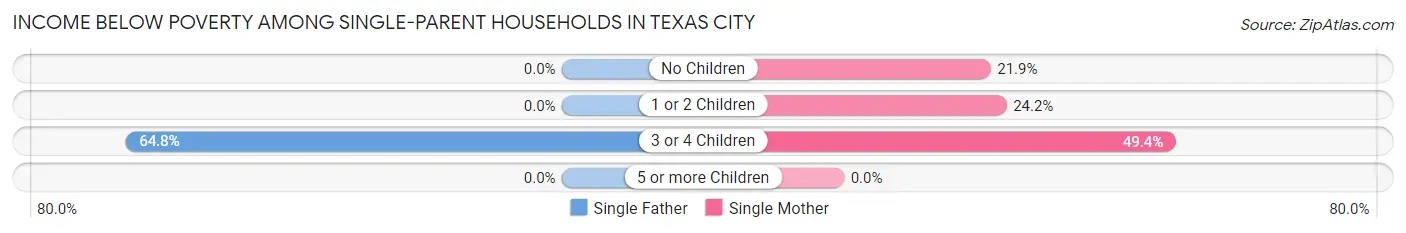
| Children | Single Father | Single Mother |
| No Children | 0 (0.0%) | 307 (21.8%) |
| 1 or 2 Children | 0 (0.0%) | 434 (24.2%) |
| 3 or 4 Children | 59 (64.8%) | 399 (49.4%) |
| 5 or more Children | 0 (0.0%) | 0 (0.0%) |
| Total | 59 (6.3%) | 1,140 (28.5%) |
Income Below Poverty Among Married-Couple vs Single-Parent Households in Texas City
The poverty data for Texas City shows that 625 of the married-couple family households (7.4%) and 1,199 of the single-parent households (24.2%) are living below the poverty level. Within the married-couple family households, those with 5 or more children have the highest poverty rate, with 47 households (32.9%) falling below the poverty line. Among the single-parent households, those with 3 or 4 children have the highest poverty rate, with 458 household (50.9%) living below poverty.
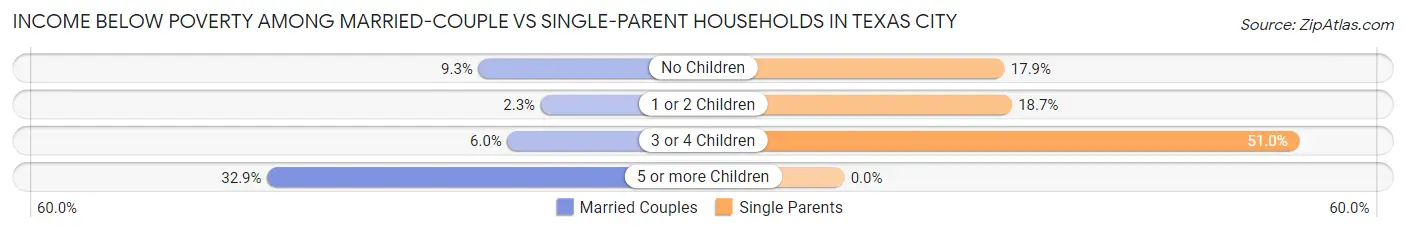
| Children | Married-Couple Families | Single-Parent Households |
| No Children | 478 (9.2%) | 307 (17.9%) |
| 1 or 2 Children | 54 (2.3%) | 434 (18.7%) |
| 3 or 4 Children | 46 (6.0%) | 458 (50.9%) |
| 5 or more Children | 47 (32.9%) | 0 (0.0%) |
| Total | 625 (7.4%) | 1,199 (24.2%) |
Race in Texas City
The most populous races in Texas City are White / Caucasian (27,411 | 51.6%), Hispanic or Latino (16,750 | 31.6%), and Black / African American (13,822 | 26.0%).
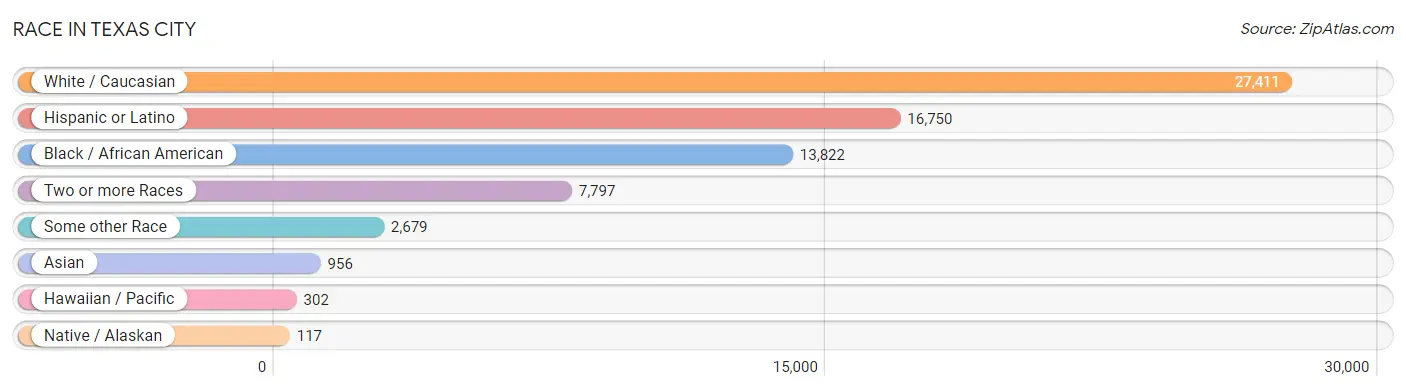
| Race | # Population | % Population |
| Asian | 956 | 1.8% |
| Black / African American | 13,822 | 26.0% |
| Hawaiian / Pacific | 302 | 0.6% |
| Hispanic or Latino | 16,750 | 31.6% |
| Native / Alaskan | 117 | 0.2% |
| White / Caucasian | 27,411 | 51.6% |
| Two or more Races | 7,797 | 14.7% |
| Some other Race | 2,679 | 5.1% |
| Total | 53,084 | 100.0% |
Ancestry in Texas City
The most populous ancestries reported in Texas City are Mexican (14,347 | 27.0%), German (4,495 | 8.5%), English (2,863 | 5.4%), Irish (2,785 | 5.2%), and American (1,288 | 2.4%), together accounting for 48.6% of all Texas City residents.
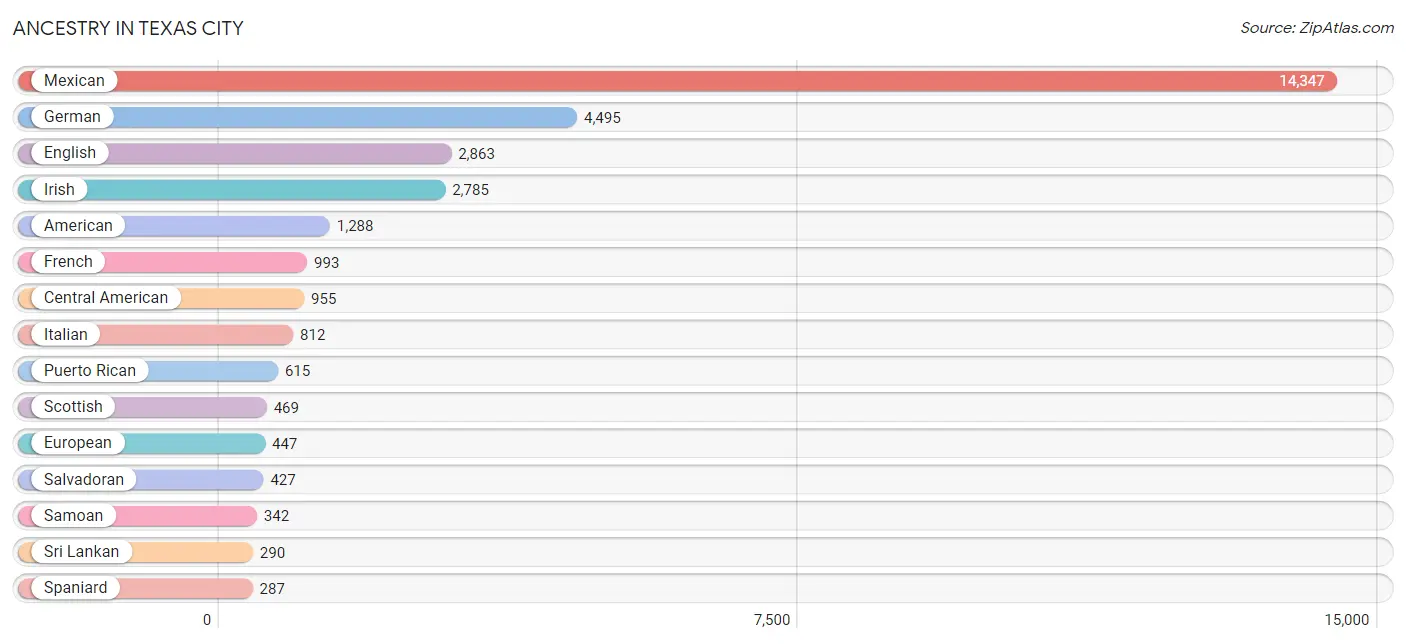
| Ancestry | # Population | % Population |
| African | 97 | 0.2% |
| Albanian | 64 | 0.1% |
| Alsatian | 13 | 0.0% |
| American | 1,288 | 2.4% |
| Apache | 32 | 0.1% |
| Arab | 21 | 0.0% |
| Argentinean | 42 | 0.1% |
| Austrian | 14 | 0.0% |
| Belgian | 16 | 0.0% |
| Belizean | 22 | 0.0% |
| Bhutanese | 94 | 0.2% |
| Blackfeet | 69 | 0.1% |
| British | 224 | 0.4% |
| Burmese | 33 | 0.1% |
| Cajun | 162 | 0.3% |
| Central American | 955 | 1.8% |
| Cherokee | 194 | 0.4% |
| Choctaw | 28 | 0.1% |
| Colombian | 37 | 0.1% |
| Comanche | 12 | 0.0% |
| Costa Rican | 4 | 0.0% |
| Croatian | 18 | 0.0% |
| Cuban | 52 | 0.1% |
| Czech | 258 | 0.5% |
| Czechoslovakian | 79 | 0.2% |
| Danish | 53 | 0.1% |
| Dutch | 272 | 0.5% |
| Dutch West Indian | 34 | 0.1% |
| Eastern European | 206 | 0.4% |
| Ecuadorian | 82 | 0.2% |
| English | 2,863 | 5.4% |
| European | 447 | 0.8% |
| Finnish | 64 | 0.1% |
| French | 993 | 1.9% |
| French Canadian | 19 | 0.0% |
| German | 4,495 | 8.5% |
| Greek | 197 | 0.4% |
| Guamanian / Chamorro | 16 | 0.0% |
| Guatemalan | 189 | 0.4% |
| Honduran | 200 | 0.4% |
| Hungarian | 68 | 0.1% |
| Indian (Asian) | 122 | 0.2% |
| Irish | 2,785 | 5.2% |
| Iroquois | 20 | 0.0% |
| Italian | 812 | 1.5% |
| Jamaican | 80 | 0.2% |
| Korean | 157 | 0.3% |
| Laotian | 84 | 0.2% |
| Lebanese | 21 | 0.0% |
| Lithuanian | 50 | 0.1% |
| Mexican | 14,347 | 27.0% |
| Mexican American Indian | 183 | 0.3% |
| Native Hawaiian | 23 | 0.0% |
| Nicaraguan | 135 | 0.3% |
| Nigerian | 108 | 0.2% |
| Norwegian | 200 | 0.4% |
| Pakistani | 33 | 0.1% |
| Peruvian | 13 | 0.0% |
| Polish | 235 | 0.4% |
| Portuguese | 15 | 0.0% |
| Puerto Rican | 615 | 1.2% |
| Romanian | 9 | 0.0% |
| Russian | 25 | 0.1% |
| Salvadoran | 427 | 0.8% |
| Samoan | 342 | 0.6% |
| Scandinavian | 31 | 0.1% |
| Scotch-Irish | 152 | 0.3% |
| Scottish | 469 | 0.9% |
| Sioux | 35 | 0.1% |
| Somali | 21 | 0.0% |
| South African | 40 | 0.1% |
| South American | 174 | 0.3% |
| Spaniard | 287 | 0.5% |
| Spanish | 136 | 0.3% |
| Sri Lankan | 290 | 0.5% |
| Subsaharan African | 266 | 0.5% |
| Swedish | 141 | 0.3% |
| Swiss | 56 | 0.1% |
| Thai | 162 | 0.3% |
| Welsh | 171 | 0.3% |
| Yaqui | 8 | 0.0% | View All 81 Rows |
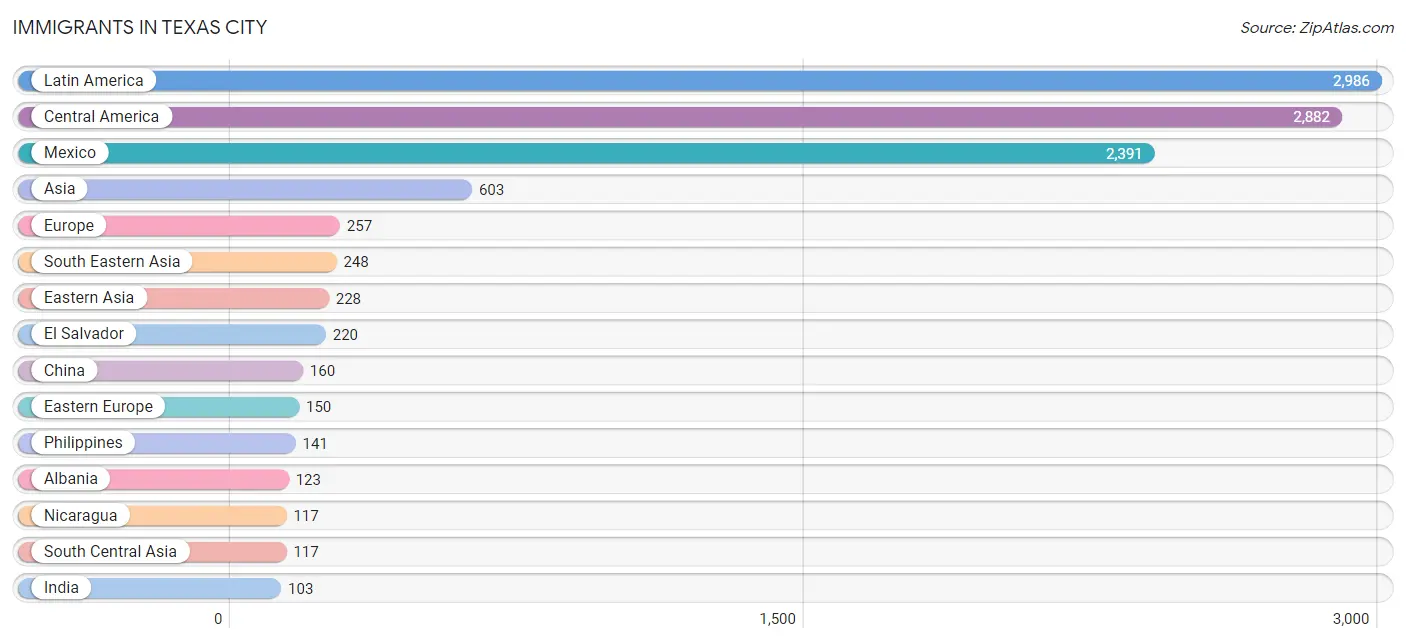
Immigrants in Texas City
The most numerous immigrant groups reported in Texas City came from Latin America (2,986 | 5.6%), Central America (2,882 | 5.4%), Mexico (2,391 | 4.5%), Asia (603 | 1.1%), and Europe (257 | 0.5%), together accounting for 17.2% of all Texas City residents.
| Immigration Origin | # Population | % Population |
| Africa | 70 | 0.1% |
| Albania | 123 | 0.2% |
| Asia | 603 | 1.1% |
| Barbados | 9 | 0.0% |
| Canada | 30 | 0.1% |
| Caribbean | 65 | 0.1% |
| Central America | 2,882 | 5.4% |
| China | 160 | 0.3% |
| Colombia | 26 | 0.1% |
| Costa Rica | 4 | 0.0% |
| Cuba | 52 | 0.1% |
| Czechoslovakia | 18 | 0.0% |
| Eastern Africa | 13 | 0.0% |
| Eastern Asia | 228 | 0.4% |
| Eastern Europe | 150 | 0.3% |
| El Salvador | 220 | 0.4% |
| Europe | 257 | 0.5% |
| France | 6 | 0.0% |
| Germany | 15 | 0.0% |
| Guatemala | 53 | 0.1% |
| Honduras | 89 | 0.2% |
| India | 103 | 0.2% |
| Indonesia | 48 | 0.1% |
| Ireland | 43 | 0.1% |
| Jamaica | 4 | 0.0% |
| Japan | 57 | 0.1% |
| Korea | 11 | 0.0% |
| Latin America | 2,986 | 5.6% |
| Lebanon | 10 | 0.0% |
| Mexico | 2,391 | 4.5% |
| Nicaragua | 117 | 0.2% |
| Nigeria | 26 | 0.1% |
| Northern Europe | 73 | 0.1% |
| Oceania | 84 | 0.2% |
| Pakistan | 14 | 0.0% |
| Peru | 13 | 0.0% |
| Philippines | 141 | 0.3% |
| Romania | 9 | 0.0% |
| Scotland | 8 | 0.0% |
| South Africa | 27 | 0.1% |
| South America | 39 | 0.1% |
| South Central Asia | 117 | 0.2% |
| South Eastern Asia | 248 | 0.5% |
| Southern Europe | 13 | 0.0% |
| Spain | 13 | 0.0% |
| Vietnam | 59 | 0.1% |
| Western Africa | 26 | 0.1% |
| Western Asia | 10 | 0.0% |
| Western Europe | 21 | 0.0% |
| Zimbabwe | 13 | 0.0% | View All 50 Rows |
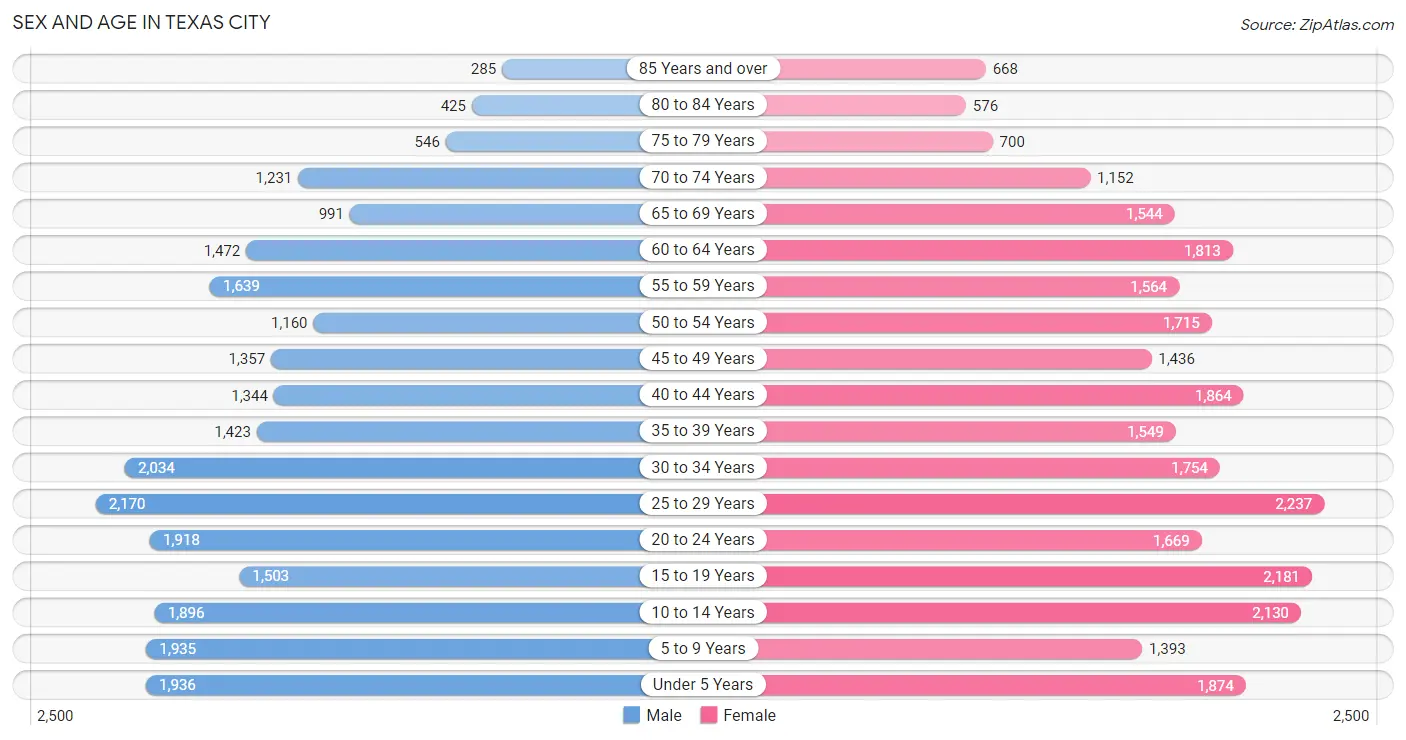
Sex and Age in Texas City
Sex and Age in Texas City
The most populous age groups in Texas City are 25 to 29 Years (2,170 | 8.6%) for men and 25 to 29 Years (2,237 | 8.0%) for women.
| Age Bracket | Male | Female |
| Under 5 Years | 1,936 (7.7%) | 1,874 (6.7%) |
| 5 to 9 Years | 1,935 (7.7%) | 1,393 (5.0%) |
| 10 to 14 Years | 1,896 (7.5%) | 2,130 (7.7%) |
| 15 to 19 Years | 1,503 (5.9%) | 2,181 (7.8%) |
| 20 to 24 Years | 1,918 (7.6%) | 1,669 (6.0%) |
| 25 to 29 Years | 2,170 (8.6%) | 2,237 (8.0%) |
| 30 to 34 Years | 2,034 (8.1%) | 1,754 (6.3%) |
| 35 to 39 Years | 1,423 (5.6%) | 1,549 (5.6%) |
| 40 to 44 Years | 1,344 (5.3%) | 1,864 (6.7%) |
| 45 to 49 Years | 1,357 (5.4%) | 1,436 (5.2%) |
| 50 to 54 Years | 1,160 (4.6%) | 1,715 (6.2%) |
| 55 to 59 Years | 1,639 (6.5%) | 1,564 (5.6%) |
| 60 to 64 Years | 1,472 (5.8%) | 1,813 (6.5%) |
| 65 to 69 Years | 991 (3.9%) | 1,544 (5.6%) |
| 70 to 74 Years | 1,231 (4.9%) | 1,152 (4.1%) |
| 75 to 79 Years | 546 (2.2%) | 700 (2.5%) |
| 80 to 84 Years | 425 (1.7%) | 576 (2.1%) |
| 85 Years and over | 285 (1.1%) | 668 (2.4%) |
| Total | 25,265 (100.0%) | 27,819 (100.0%) |
Families and Households in Texas City
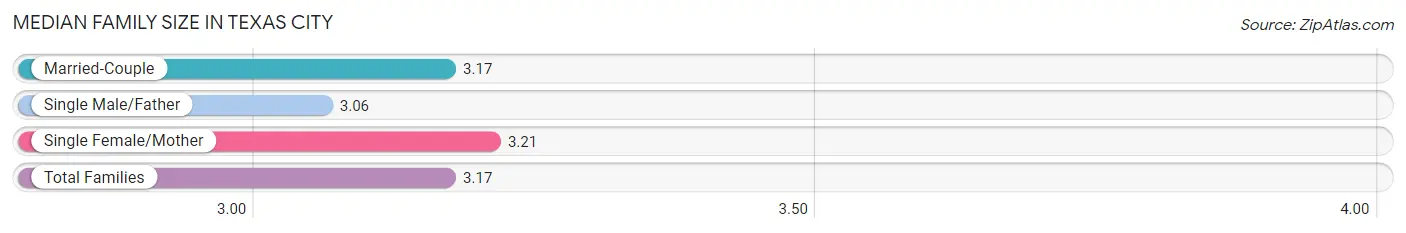
Median Family Size in Texas City
The median family size in Texas City is 3.17 persons per family, with single female/mother families (4,005 | 30.0%) accounting for the largest median family size of 3.21 persons per family. On the other hand, single male/father families (940 | 7.0%) represent the smallest median family size with 3.06 persons per family.
| Family Type | # Families | Family Size |
| Married-Couple | 8,423 (63.0%) | 3.17 |
| Single Male/Father | 940 (7.0%) | 3.06 |
| Single Female/Mother | 4,005 (30.0%) | 3.21 |
| Total Families | 13,368 (100.0%) | 3.17 |
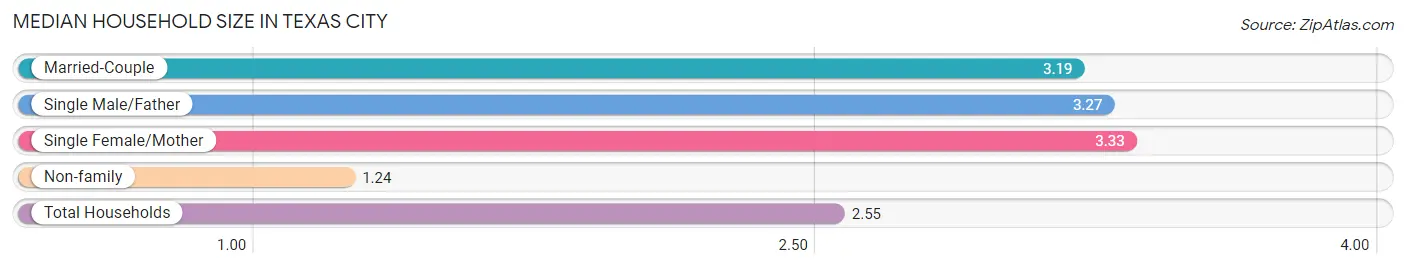
Median Household Size in Texas City
The median household size in Texas City is 2.55 persons per household, with single female/mother households (4,005 | 19.6%) accounting for the largest median household size of 3.33 persons per household. non-family households (7,030 | 34.5%) represent the smallest median household size with 1.24 persons per household.
| Household Type | # Households | Household Size |
| Married-Couple | 8,423 (41.3%) | 3.19 |
| Single Male/Father | 940 (4.6%) | 3.27 |
| Single Female/Mother | 4,005 (19.6%) | 3.33 |
| Non-family | 7,030 (34.5%) | 1.24 |
| Total Households | 20,398 (100.0%) | 2.55 |
Household Size by Marriage Status in Texas City
Out of a total of 20,398 households in Texas City, 13,368 (65.5%) are family households, while 7,030 (34.5%) are nonfamily households. The most numerous type of family households are 2-person households, comprising 5,726, and the most common type of nonfamily households are 1-person households, comprising 5,492.
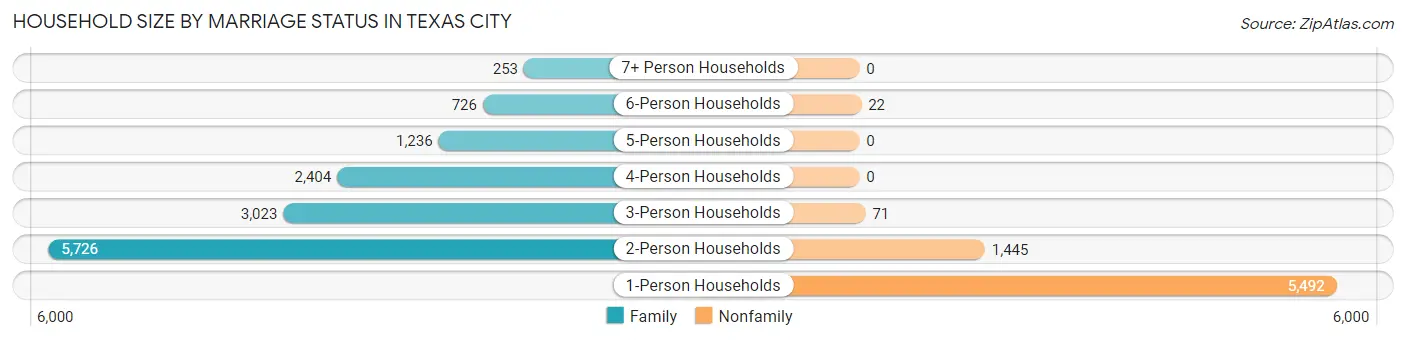
| Household Size | Family Households | Nonfamily Households |
| 1-Person Households | - | 5,492 (26.9%) |
| 2-Person Households | 5,726 (28.1%) | 1,445 (7.1%) |
| 3-Person Households | 3,023 (14.8%) | 71 (0.4%) |
| 4-Person Households | 2,404 (11.8%) | 0 (0.0%) |
| 5-Person Households | 1,236 (6.1%) | 0 (0.0%) |
| 6-Person Households | 726 (3.6%) | 22 (0.1%) |
| 7+ Person Households | 253 (1.2%) | 0 (0.0%) |
| Total | 13,368 (65.5%) | 7,030 (34.5%) |
Female Fertility in Texas City
Fertility by Age in Texas City
Average fertility rate in Texas City is 59.0 births per 1,000 women. Women in the age bracket of 20 to 34 years have the highest fertility rate with 118.0 births per 1,000 women. Women in the age bracket of 20 to 34 years acount for 86.1% of all women with births.
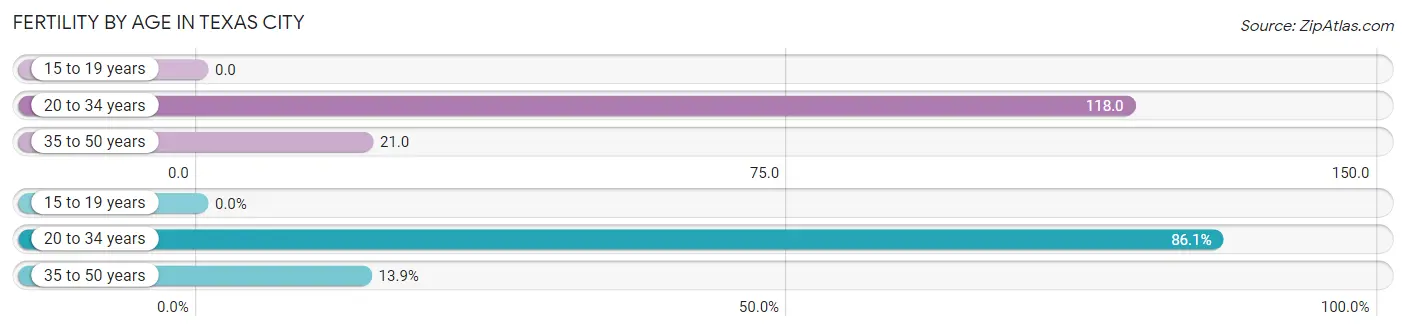
| Age Bracket | Women with Births | Births / 1,000 Women |
| 15 to 19 years | 0 (0.0%) | 0.0 |
| 20 to 34 years | 670 (86.1%) | 118.0 |
| 35 to 50 years | 108 (13.9%) | 21.0 |
| Total | 778 (100.0%) | 59.0 |
Fertility by Age by Marriage Status in Texas City
66.3% of women with births (778) in Texas City are married. The highest percentage of unmarried women with births falls into 20 to 34 years age bracket with 39.1% of them unmarried at the time of birth, while the lowest percentage of unmarried women with births belong to 35 to 50 years age bracket with 0.0% of them unmarried.
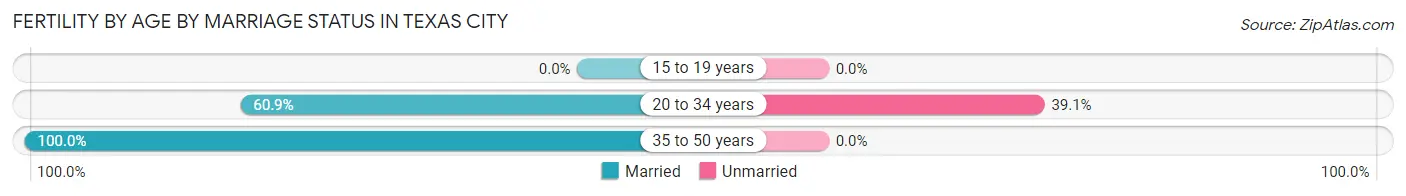
| Age Bracket | Married | Unmarried |
| 15 to 19 years | 0 (0.0%) | 0 (0.0%) |
| 20 to 34 years | 408 (60.9%) | 262 (39.1%) |
| 35 to 50 years | 108 (100.0%) | 0 (0.0%) |
| Total | 516 (66.3%) | 262 (33.7%) |
Fertility by Education in Texas City
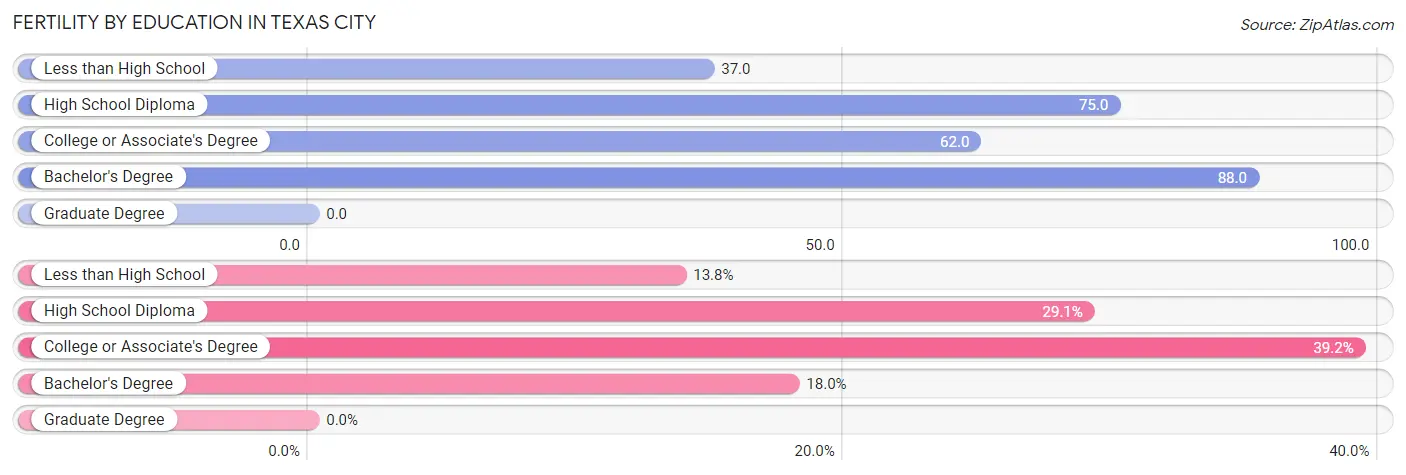
| Educational Attainment | Women with Births | Births / 1,000 Women |
| Less than High School | 107 (13.8%) | 37.0 |
| High School Diploma | 226 (29.0%) | 75.0 |
| College or Associate's Degree | 305 (39.2%) | 62.0 |
| Bachelor's Degree | 140 (18.0%) | 88.0 |
| Graduate Degree | 0 (0.0%) | 0.0 |
| Total | 778 (100.0%) | 59.0 |
Fertility by Education by Marriage Status in Texas City
33.7% of women with births in Texas City are unmarried. Women with the educational attainment of bachelor's degree are most likely to be married with 100.0% of them married at childbirth, while women with the educational attainment of high school diploma are least likely to be married with 47.3% of them unmarried at childbirth.
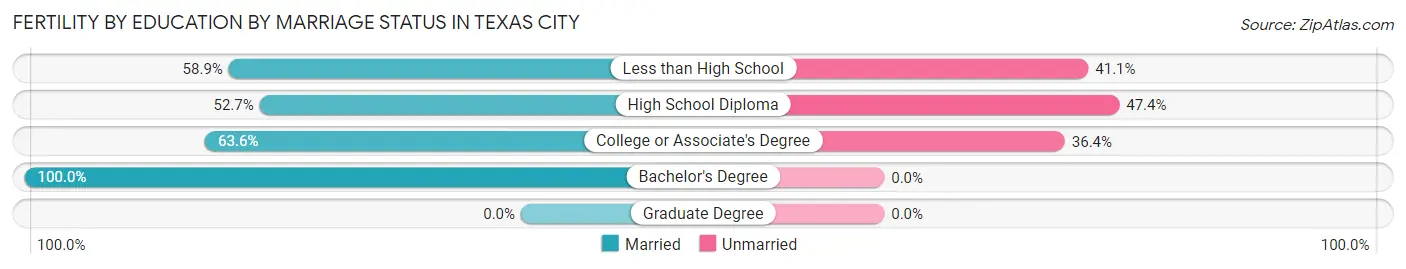
| Educational Attainment | Married | Unmarried |
| Less than High School | 63 (58.9%) | 44 (41.1%) |
| High School Diploma | 119 (52.6%) | 107 (47.3%) |
| College or Associate's Degree | 194 (63.6%) | 111 (36.4%) |
| Bachelor's Degree | 140 (100.0%) | 0 (0.0%) |
| Graduate Degree | 0 (0.0%) | 0 (0.0%) |
| Total | 516 (66.3%) | 262 (33.7%) |
Employment Characteristics in Texas City
Employment by Class of Employer in Texas City
Among the 23,075 employed individuals in Texas City, private company employees (15,923 | 69.0%), local government employees (2,539 | 11.0%), and state government employees (1,597 | 6.9%) make up the most common classes of employment.
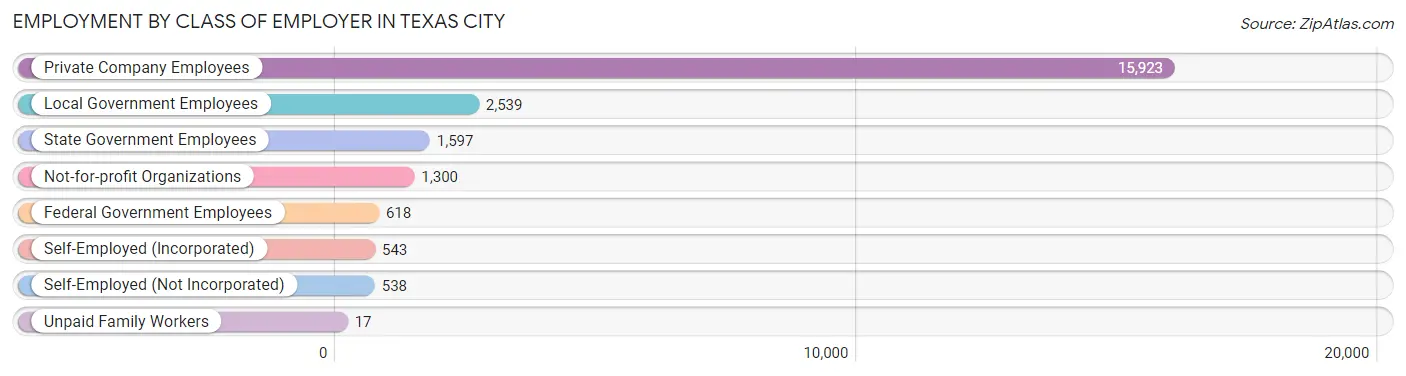
| Employer Class | # Employees | % Employees |
| Private Company Employees | 15,923 | 69.0% |
| Self-Employed (Incorporated) | 543 | 2.4% |
| Self-Employed (Not Incorporated) | 538 | 2.3% |
| Not-for-profit Organizations | 1,300 | 5.6% |
| Local Government Employees | 2,539 | 11.0% |
| State Government Employees | 1,597 | 6.9% |
| Federal Government Employees | 618 | 2.7% |
| Unpaid Family Workers | 17 | 0.1% |
| Total | 23,075 | 100.0% |
Employment Status by Age in Texas City
According to the labor force statistics for Texas City, out of the total population over 16 years of age (40,877), 62.6% or 25,589 individuals are in the labor force, with 7.1% or 1,817 of them unemployed. The age group with the highest labor force participation rate is 25 to 29 years, with 85.3% or 3,759 individuals in the labor force. Within the labor force, the 16 to 19 years age range has the highest percentage of unemployed individuals, with 20.2% or 186 of them being unemployed.
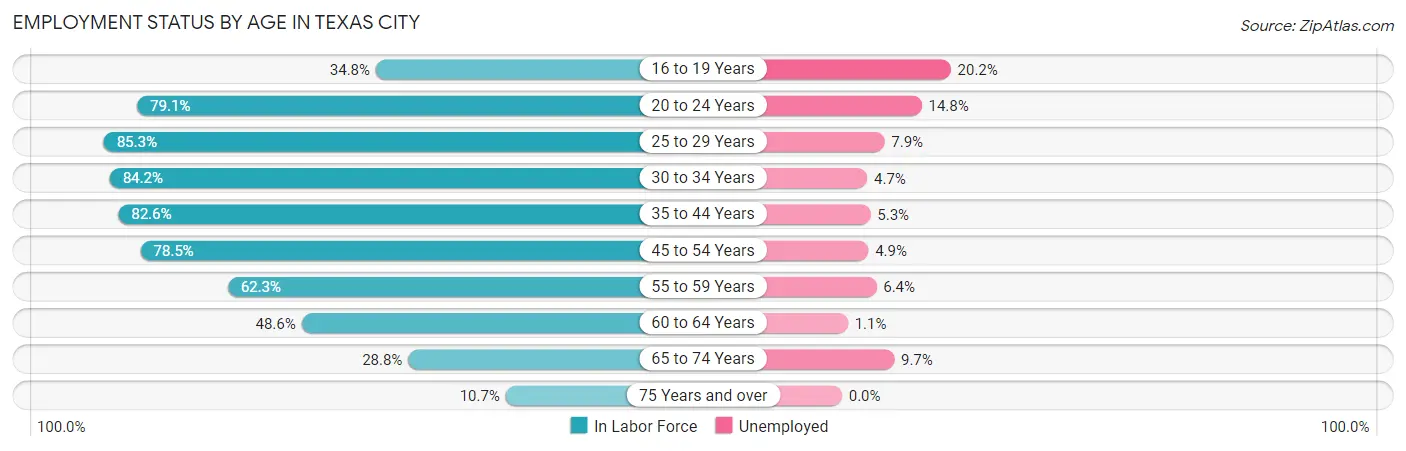
| Age Bracket | In Labor Force | Unemployed |
| 16 to 19 Years | 919 (34.8%) | 186 (20.2%) |
| 20 to 24 Years | 2,837 (79.1%) | 420 (14.8%) |
| 25 to 29 Years | 3,759 (85.3%) | 297 (7.9%) |
| 30 to 34 Years | 3,189 (84.2%) | 150 (4.7%) |
| 35 to 44 Years | 5,105 (82.6%) | 271 (5.3%) |
| 45 to 54 Years | 4,449 (78.5%) | 218 (4.9%) |
| 55 to 59 Years | 1,995 (62.3%) | 128 (6.4%) |
| 60 to 64 Years | 1,597 (48.6%) | 18 (1.1%) |
| 65 to 74 Years | 1,416 (28.8%) | 137 (9.7%) |
| 75 Years and over | 342 (10.7%) | 0 (0.0%) |
| Total | 25,589 (62.6%) | 1,817 (7.1%) |
Employment Status by Educational Attainment in Texas City
According to labor force statistics for Texas City, 75.7% of individuals (20,084) out of the total population between 25 and 64 years of age (26,531) are in the labor force, with 5.4% or 1,085 of them being unemployed. The group with the highest labor force participation rate are those with the educational attainment of bachelor's degree or higher, with 82.0% or 3,949 individuals in the labor force. Within the labor force, individuals with less than high school education have the highest percentage of unemployment, with 11.5% or 274 of them being unemployed.
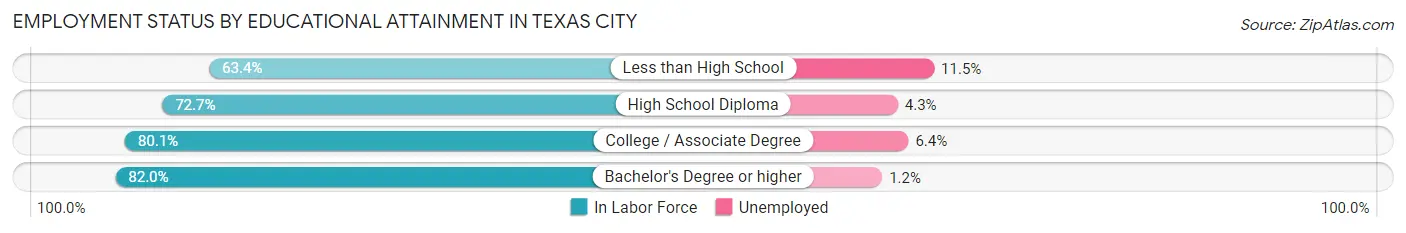
| Educational Attainment | In Labor Force | Unemployed |
| Less than High School | 2,381 (63.4%) | 432 (11.5%) |
| High School Diploma | 6,124 (72.7%) | 362 (4.3%) |
| College / Associate Degree | 7,638 (80.1%) | 610 (6.4%) |
| Bachelor's Degree or higher | 3,949 (82.0%) | 58 (1.2%) |
| Total | 20,084 (75.7%) | 1,433 (5.4%) |
Employment Occupations by Sex in Texas City
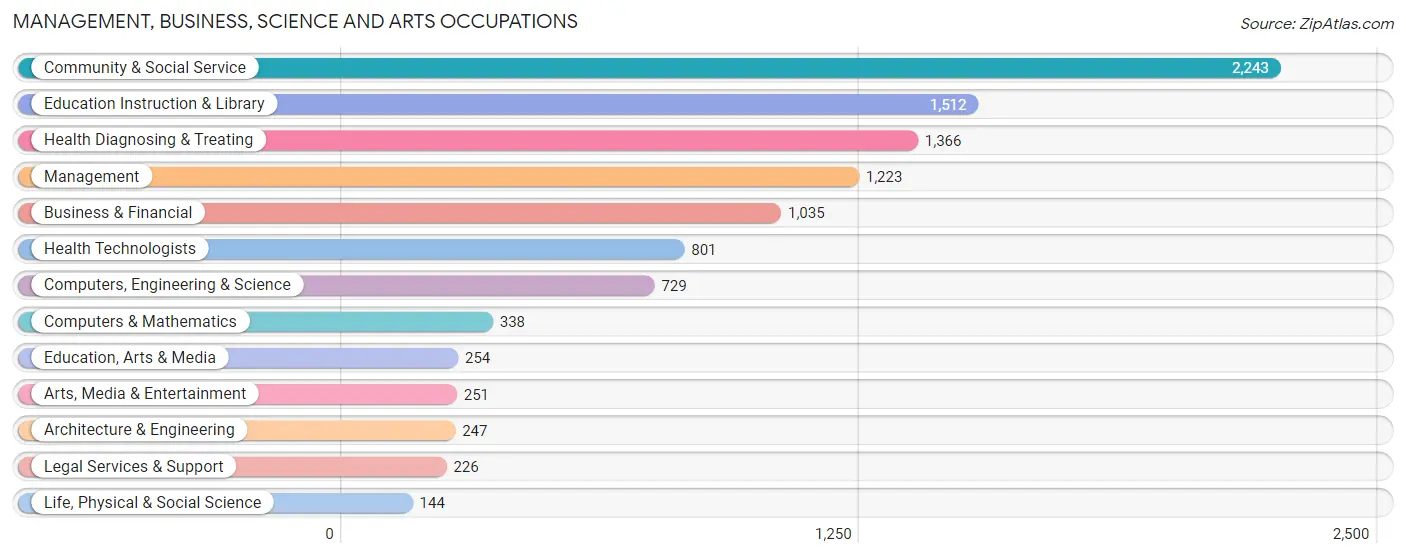
Management, Business, Science and Arts Occupations
The most common Management, Business, Science and Arts occupations in Texas City are Community & Social Service (2,243 | 9.5%), Education Instruction & Library (1,512 | 6.4%), Health Diagnosing & Treating (1,366 | 5.8%), Management (1,223 | 5.2%), and Business & Financial (1,035 | 4.4%).
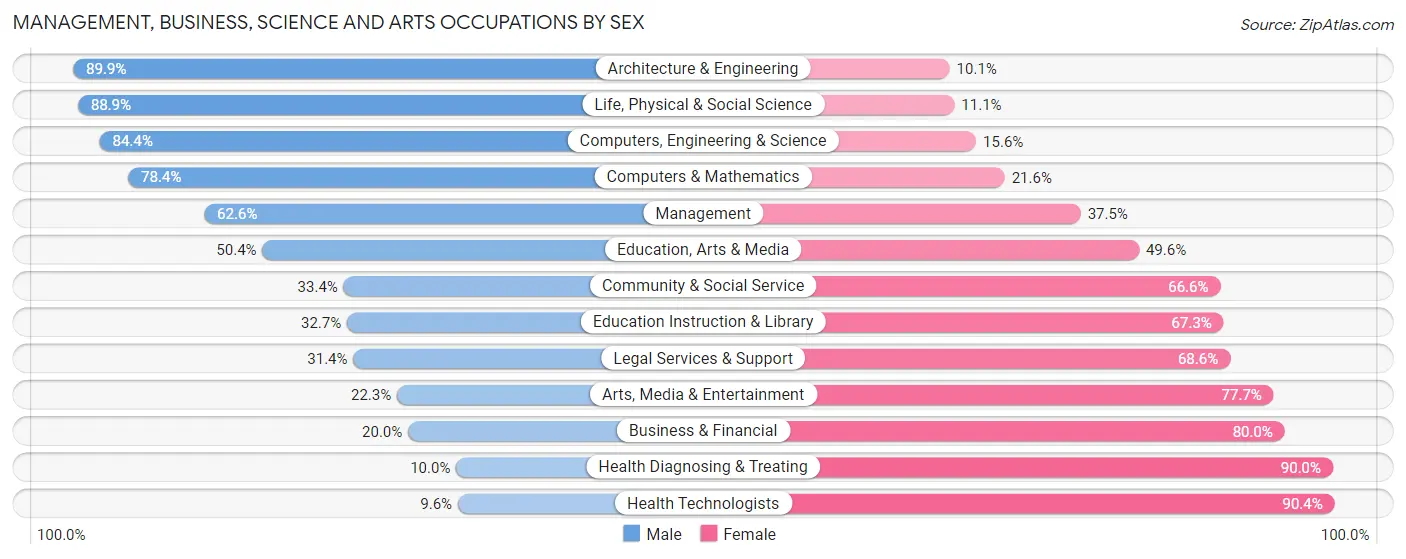
Management, Business, Science and Arts Occupations by Sex
Within the Management, Business, Science and Arts occupations in Texas City, the most male-oriented occupations are Architecture & Engineering (89.9%), Life, Physical & Social Science (88.9%), and Computers, Engineering & Science (84.4%), while the most female-oriented occupations are Health Technologists (90.4%), Health Diagnosing & Treating (90.0%), and Business & Financial (80.0%).
| Occupation | Male | Female |
| Management | 765 (62.5%) | 458 (37.4%) |
| Business & Financial | 207 (20.0%) | 828 (80.0%) |
| Computers, Engineering & Science | 615 (84.4%) | 114 (15.6%) |
| Computers & Mathematics | 265 (78.4%) | 73 (21.6%) |
| Architecture & Engineering | 222 (89.9%) | 25 (10.1%) |
| Life, Physical & Social Science | 128 (88.9%) | 16 (11.1%) |
| Community & Social Service | 750 (33.4%) | 1,493 (66.6%) |
| Education, Arts & Media | 128 (50.4%) | 126 (49.6%) |
| Legal Services & Support | 71 (31.4%) | 155 (68.6%) |
| Education Instruction & Library | 495 (32.7%) | 1,017 (67.3%) |
| Arts, Media & Entertainment | 56 (22.3%) | 195 (77.7%) |
| Health Diagnosing & Treating | 136 (10.0%) | 1,230 (90.0%) |
| Health Technologists | 77 (9.6%) | 724 (90.4%) |
| Total (Category) | 2,473 (37.5%) | 4,123 (62.5%) |
| Total (Overall) | 12,146 (51.6%) | 11,387 (48.4%) |
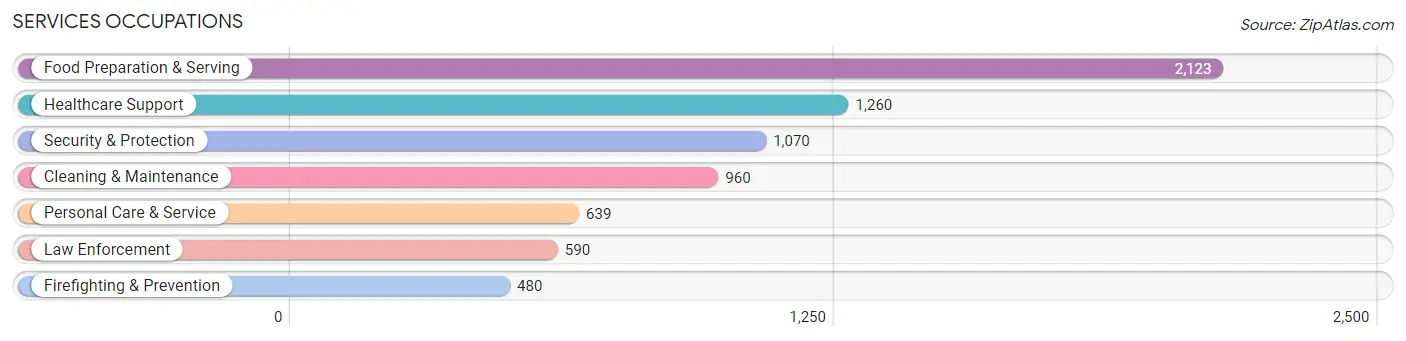
Services Occupations
The most common Services occupations in Texas City are Food Preparation & Serving (2,123 | 9.0%), Healthcare Support (1,260 | 5.3%), Security & Protection (1,070 | 4.5%), Cleaning & Maintenance (960 | 4.1%), and Personal Care & Service (639 | 2.7%).
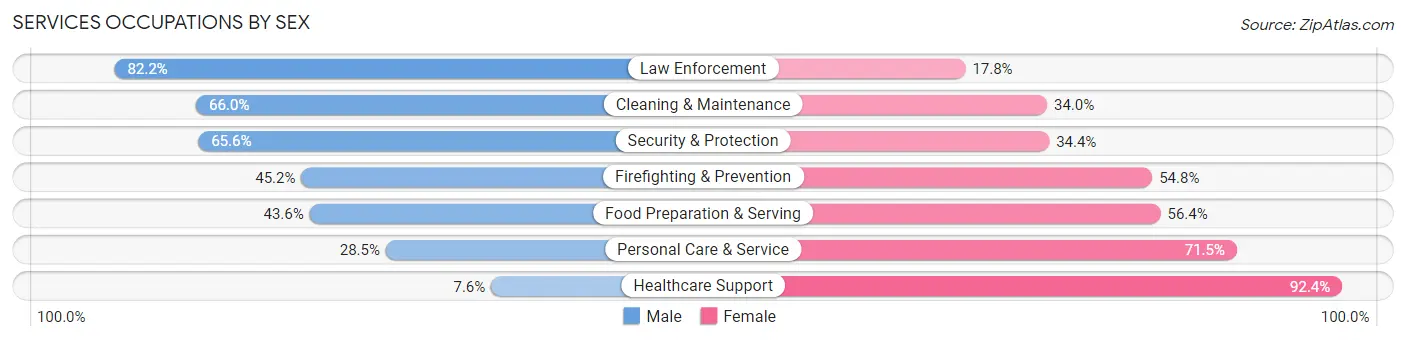
Services Occupations by Sex
Within the Services occupations in Texas City, the most male-oriented occupations are Law Enforcement (82.2%), Cleaning & Maintenance (66.0%), and Security & Protection (65.6%), while the most female-oriented occupations are Healthcare Support (92.4%), Personal Care & Service (71.5%), and Food Preparation & Serving (56.4%).
| Occupation | Male | Female |
| Healthcare Support | 96 (7.6%) | 1,164 (92.4%) |
| Security & Protection | 702 (65.6%) | 368 (34.4%) |
| Firefighting & Prevention | 217 (45.2%) | 263 (54.8%) |
| Law Enforcement | 485 (82.2%) | 105 (17.8%) |
| Food Preparation & Serving | 925 (43.6%) | 1,198 (56.4%) |
| Cleaning & Maintenance | 634 (66.0%) | 326 (34.0%) |
| Personal Care & Service | 182 (28.5%) | 457 (71.5%) |
| Total (Category) | 2,539 (41.9%) | 3,513 (58.1%) |
| Total (Overall) | 12,146 (51.6%) | 11,387 (48.4%) |
Sales and Office Occupations
The most common Sales and Office occupations in Texas City are Office & Administration (2,186 | 9.3%), and Sales & Related (2,179 | 9.3%).

Sales and Office Occupations by Sex
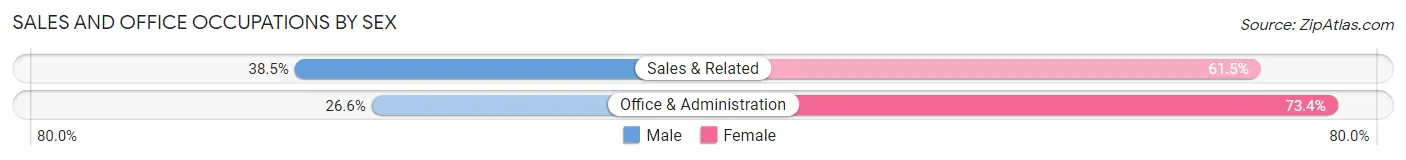
| Occupation | Male | Female |
| Sales & Related | 838 (38.5%) | 1,341 (61.5%) |
| Office & Administration | 582 (26.6%) | 1,604 (73.4%) |
| Total (Category) | 1,420 (32.5%) | 2,945 (67.5%) |
| Total (Overall) | 12,146 (51.6%) | 11,387 (48.4%) |
Natural Resources, Construction and Maintenance Occupations
The most common Natural Resources, Construction and Maintenance occupations in Texas City are Construction & Extraction (1,544 | 6.6%), Installation, Maintenance & Repair (1,183 | 5.0%), and Farming, Fishing & Forestry (89 | 0.4%).

Natural Resources, Construction and Maintenance Occupations by Sex
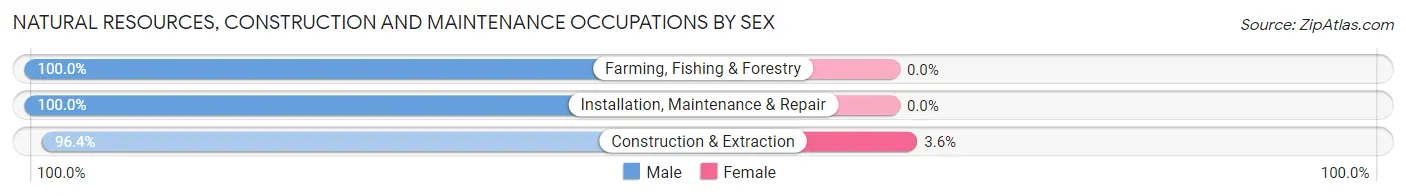
| Occupation | Male | Female |
| Farming, Fishing & Forestry | 89 (100.0%) | 0 (0.0%) |
| Construction & Extraction | 1,488 (96.4%) | 56 (3.6%) |
| Installation, Maintenance & Repair | 1,183 (100.0%) | 0 (0.0%) |
| Total (Category) | 2,760 (98.0%) | 56 (2.0%) |
| Total (Overall) | 12,146 (51.6%) | 11,387 (48.4%) |
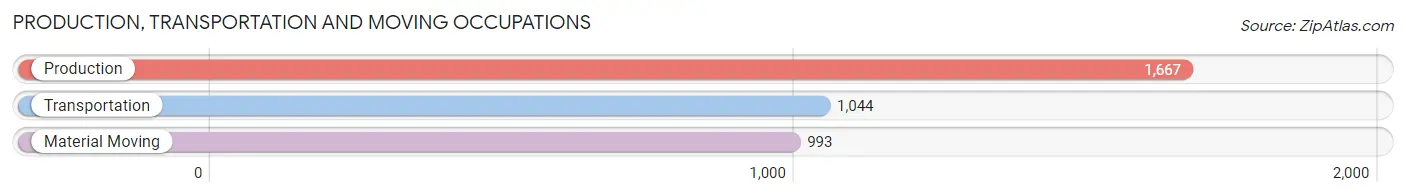
Production, Transportation and Moving Occupations
The most common Production, Transportation and Moving occupations in Texas City are Production (1,667 | 7.1%), Transportation (1,044 | 4.4%), and Material Moving (993 | 4.2%).
Production, Transportation and Moving Occupations by Sex
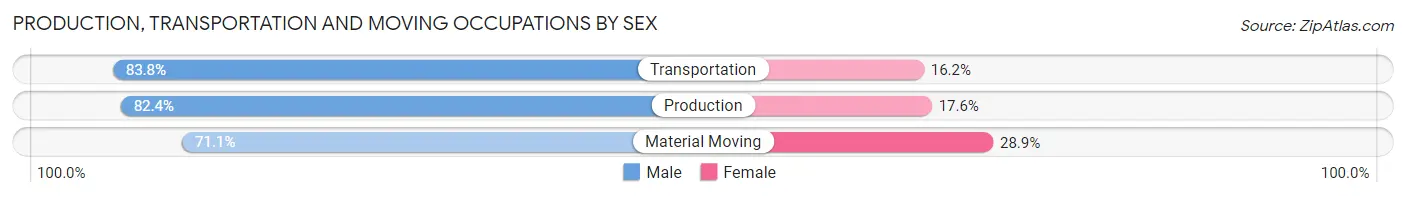
| Occupation | Male | Female |
| Production | 1,373 (82.4%) | 294 (17.6%) |
| Transportation | 875 (83.8%) | 169 (16.2%) |
| Material Moving | 706 (71.1%) | 287 (28.9%) |
| Total (Category) | 2,954 (79.7%) | 750 (20.3%) |
| Total (Overall) | 12,146 (51.6%) | 11,387 (48.4%) |
Employment Industries by Sex in Texas City
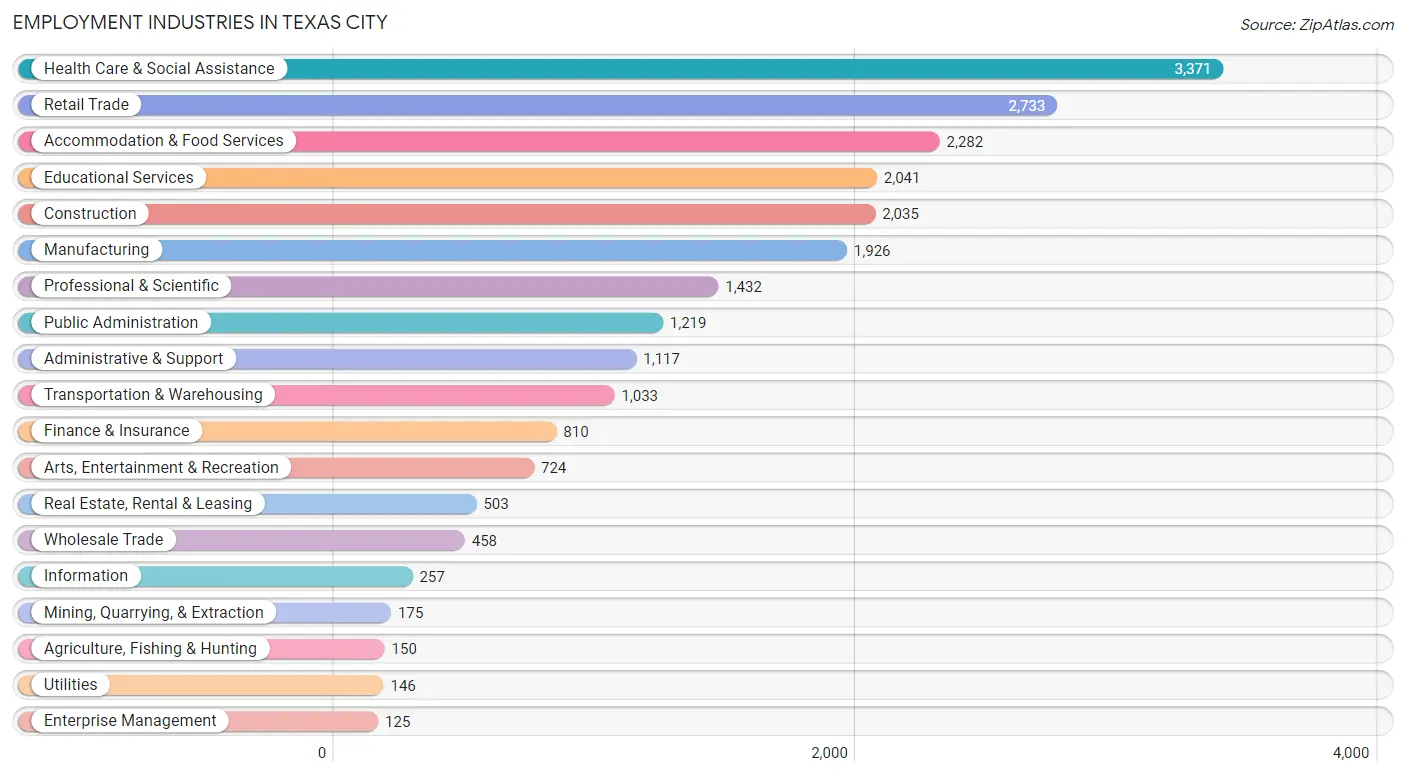
Employment Industries in Texas City
The major employment industries in Texas City include Health Care & Social Assistance (3,371 | 14.3%), Retail Trade (2,733 | 11.6%), Accommodation & Food Services (2,282 | 9.7%), Educational Services (2,041 | 8.7%), and Construction (2,035 | 8.6%).
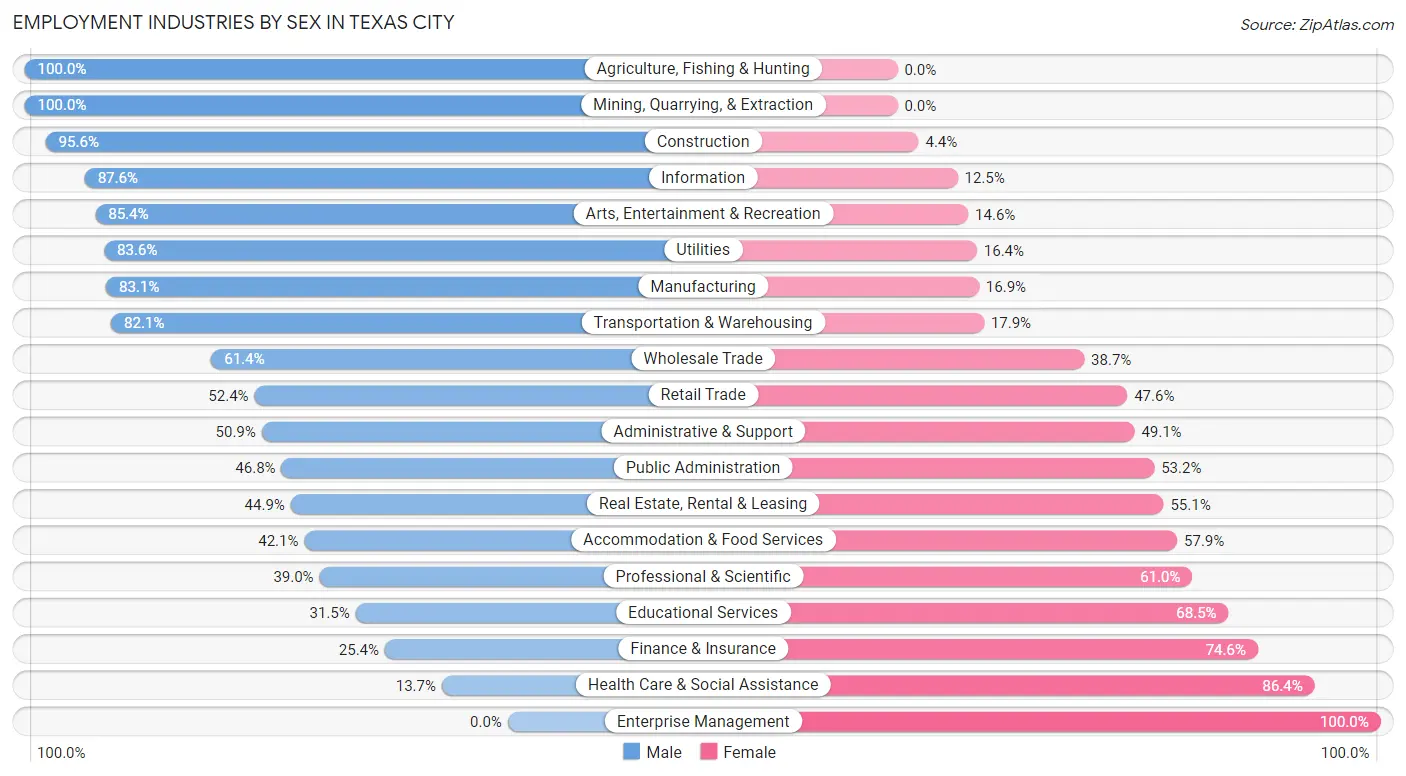
Employment Industries by Sex in Texas City
The Texas City industries that see more men than women are Agriculture, Fishing & Hunting (100.0%), Mining, Quarrying, & Extraction (100.0%), and Construction (95.6%), whereas the industries that tend to have a higher number of women are Enterprise Management (100.0%), Health Care & Social Assistance (86.4%), and Finance & Insurance (74.6%).
| Industry | Male | Female |
| Agriculture, Fishing & Hunting | 150 (100.0%) | 0 (0.0%) |
| Mining, Quarrying, & Extraction | 175 (100.0%) | 0 (0.0%) |
| Construction | 1,946 (95.6%) | 89 (4.4%) |
| Manufacturing | 1,601 (83.1%) | 325 (16.9%) |
| Wholesale Trade | 281 (61.4%) | 177 (38.7%) |
| Retail Trade | 1,433 (52.4%) | 1,300 (47.6%) |
| Transportation & Warehousing | 848 (82.1%) | 185 (17.9%) |
| Utilities | 122 (83.6%) | 24 (16.4%) |
| Information | 225 (87.5%) | 32 (12.4%) |
| Finance & Insurance | 206 (25.4%) | 604 (74.6%) |
| Real Estate, Rental & Leasing | 226 (44.9%) | 277 (55.1%) |
| Professional & Scientific | 558 (39.0%) | 874 (61.0%) |
| Enterprise Management | 0 (0.0%) | 125 (100.0%) |
| Administrative & Support | 569 (50.9%) | 548 (49.1%) |
| Educational Services | 643 (31.5%) | 1,398 (68.5%) |
| Health Care & Social Assistance | 460 (13.7%) | 2,911 (86.4%) |
| Arts, Entertainment & Recreation | 618 (85.4%) | 106 (14.6%) |
| Accommodation & Food Services | 961 (42.1%) | 1,321 (57.9%) |
| Public Administration | 571 (46.8%) | 648 (53.2%) |
| Total | 12,146 (51.6%) | 11,387 (48.4%) |
Education in Texas City
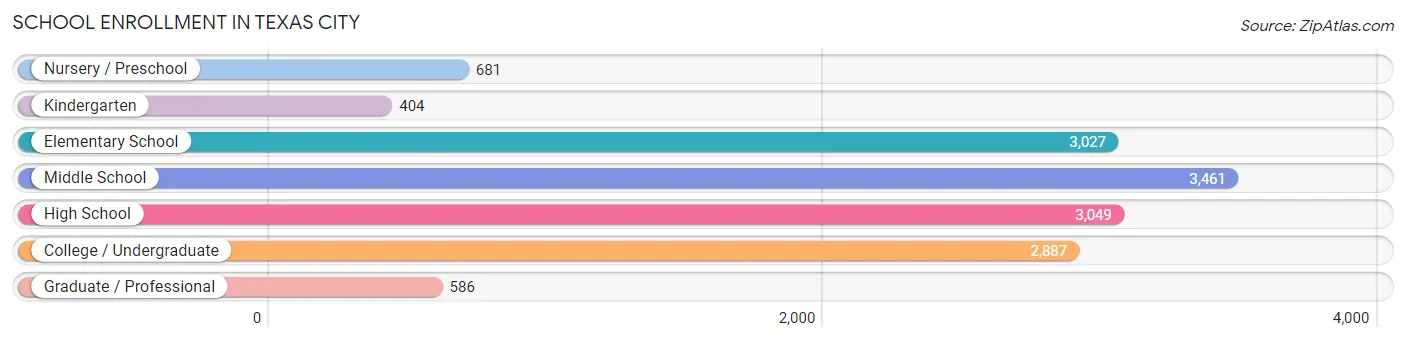
School Enrollment in Texas City
The most common levels of schooling among the 14,095 students in Texas City are middle school (3,461 | 24.5%), high school (3,049 | 21.6%), and elementary school (3,027 | 21.5%).
| School Level | # Students | % Students |
| Nursery / Preschool | 681 | 4.8% |
| Kindergarten | 404 | 2.9% |
| Elementary School | 3,027 | 21.5% |
| Middle School | 3,461 | 24.5% |
| High School | 3,049 | 21.6% |
| College / Undergraduate | 2,887 | 20.5% |
| Graduate / Professional | 586 | 4.2% |
| Total | 14,095 | 100.0% |
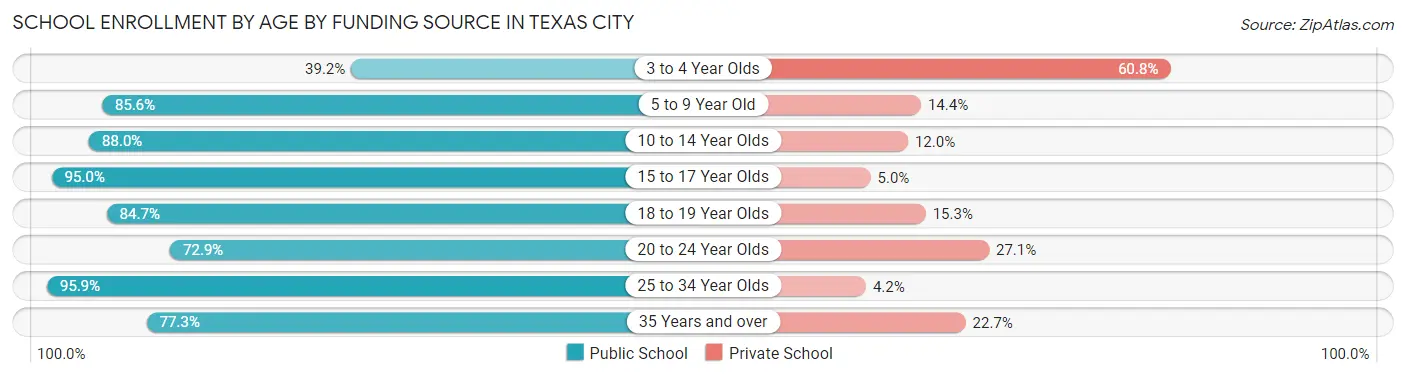
School Enrollment by Age by Funding Source in Texas City
Out of a total of 14,095 students who are enrolled in schools in Texas City, 2,185 (15.5%) attend a private institution, while the remaining 11,910 (84.5%) are enrolled in public schools. The age group of 3 to 4 year olds has the highest likelihood of being enrolled in private schools, with 388 (60.8% in the age bracket) enrolled. Conversely, the age group of 25 to 34 year olds has the lowest likelihood of being enrolled in a private school, with 786 (95.9% in the age bracket) attending a public institution.
| Age Bracket | Public School | Private School |
| 3 to 4 Year Olds | 250 (39.2%) | 388 (60.8%) |
| 5 to 9 Year Old | 2,722 (85.6%) | 458 (14.4%) |
| 10 to 14 Year Olds | 3,519 (88.0%) | 479 (12.0%) |
| 15 to 17 Year Olds | 2,220 (95.0%) | 117 (5.0%) |
| 18 to 19 Year Olds | 637 (84.7%) | 115 (15.3%) |
| 20 to 24 Year Olds | 945 (72.9%) | 351 (27.1%) |
| 25 to 34 Year Olds | 786 (95.9%) | 34 (4.2%) |
| 35 Years and over | 830 (77.3%) | 244 (22.7%) |
| Total | 11,910 (84.5%) | 2,185 (15.5%) |
Educational Attainment by Field of Study in Texas City
Business (1,199 | 17.5%), science & technology (1,066 | 15.6%), education (1,044 | 15.3%), arts & humanities (764 | 11.2%), and communications (420 | 6.1%) are the most common fields of study among 6,838 individuals in Texas City who have obtained a bachelor's degree or higher.
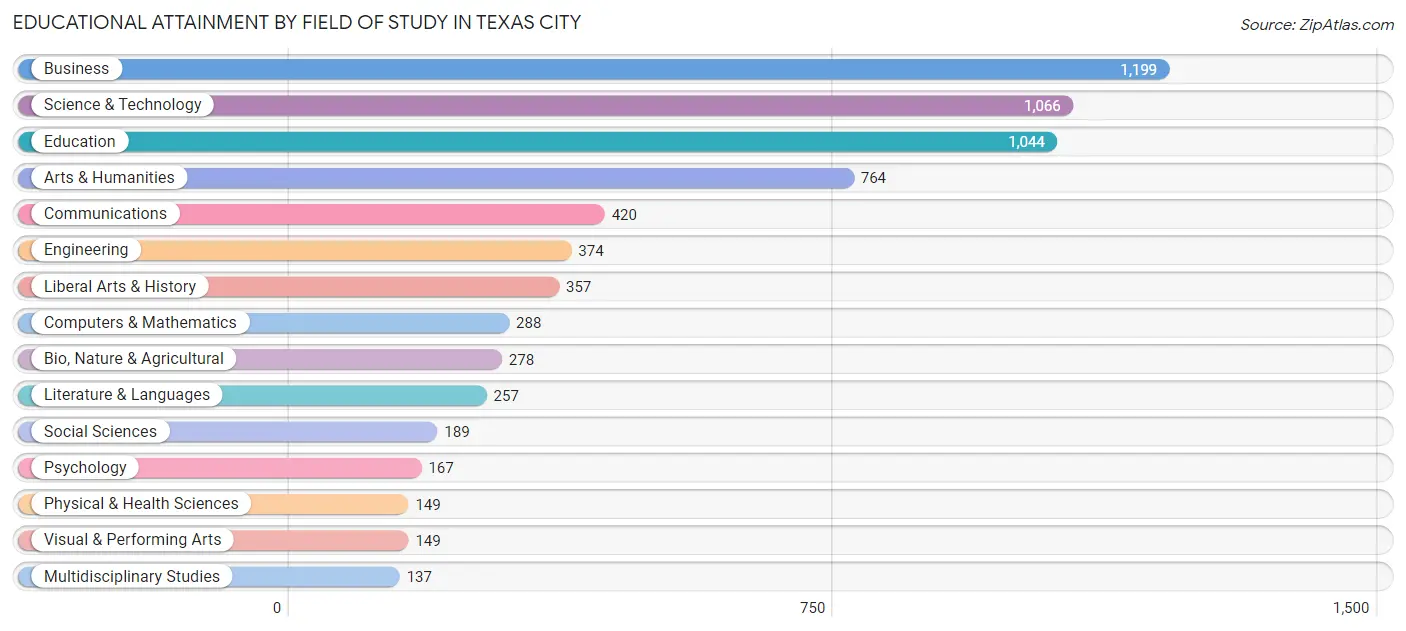
| Field of Study | # Graduates | % Graduates |
| Computers & Mathematics | 288 | 4.2% |
| Bio, Nature & Agricultural | 278 | 4.1% |
| Physical & Health Sciences | 149 | 2.2% |
| Psychology | 167 | 2.4% |
| Social Sciences | 189 | 2.8% |
| Engineering | 374 | 5.5% |
| Multidisciplinary Studies | 137 | 2.0% |
| Science & Technology | 1,066 | 15.6% |
| Business | 1,199 | 17.5% |
| Education | 1,044 | 15.3% |
| Literature & Languages | 257 | 3.8% |
| Liberal Arts & History | 357 | 5.2% |
| Visual & Performing Arts | 149 | 2.2% |
| Communications | 420 | 6.1% |
| Arts & Humanities | 764 | 11.2% |
| Total | 6,838 | 100.0% |
Transportation & Commute in Texas City
Vehicle Availability by Sex in Texas City
The most prevalent vehicle ownership categories in Texas City are males with 2 vehicles (5,166, accounting for 42.4%) and females with 2 vehicles (4,833, making up 47.5%).
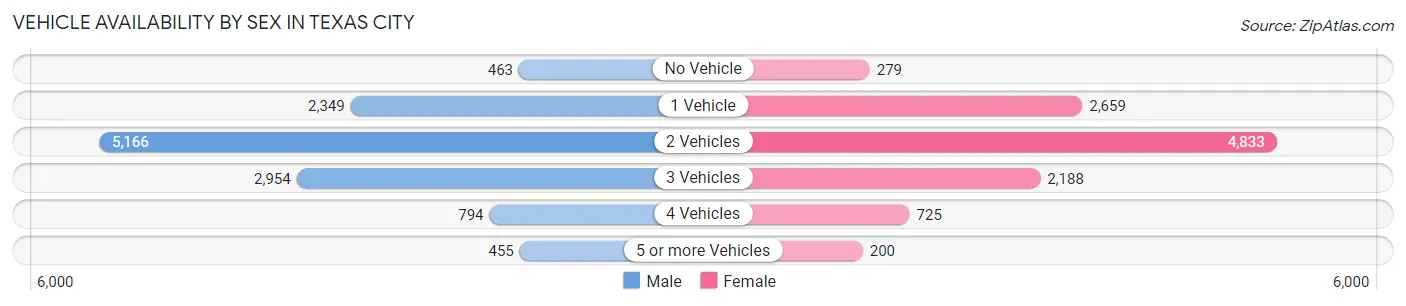
| Vehicles Available | Male | Female |
| No Vehicle | 463 (3.8%) | 279 (2.6%) |
| 1 Vehicle | 2,349 (19.3%) | 2,659 (24.4%) |
| 2 Vehicles | 5,166 (42.4%) | 4,833 (44.4%) |
| 3 Vehicles | 2,954 (24.2%) | 2,188 (20.1%) |
| 4 Vehicles | 794 (6.5%) | 725 (6.7%) |
| 5 or more Vehicles | 455 (3.7%) | 200 (1.8%) |
| Total | 12,181 (100.0%) | 10,884 (100.0%) |
Commute Time in Texas City
The most frequently occuring commute durations in Texas City are 15 to 19 minutes (3,989 commuters, 17.8%), 30 to 34 minutes (3,535 commuters, 15.8%), and 20 to 24 minutes (3,436 commuters, 15.3%).
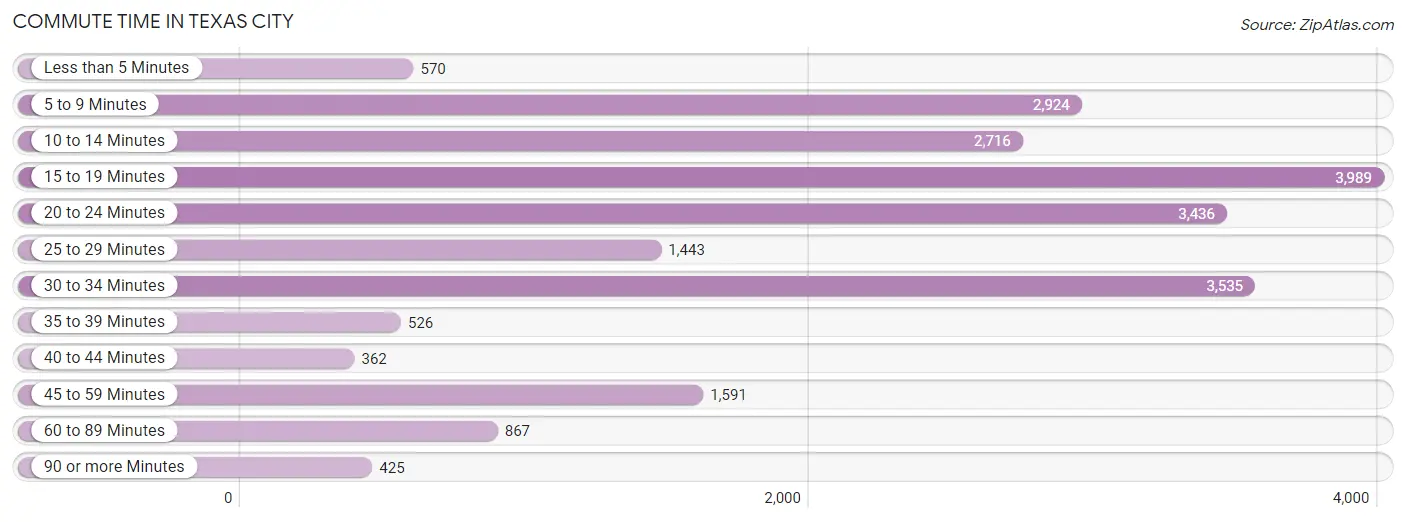
| Commute Time | # Commuters | % Commuters |
| Less than 5 Minutes | 570 | 2.5% |
| 5 to 9 Minutes | 2,924 | 13.1% |
| 10 to 14 Minutes | 2,716 | 12.1% |
| 15 to 19 Minutes | 3,989 | 17.8% |
| 20 to 24 Minutes | 3,436 | 15.3% |
| 25 to 29 Minutes | 1,443 | 6.5% |
| 30 to 34 Minutes | 3,535 | 15.8% |
| 35 to 39 Minutes | 526 | 2.4% |
| 40 to 44 Minutes | 362 | 1.6% |
| 45 to 59 Minutes | 1,591 | 7.1% |
| 60 to 89 Minutes | 867 | 3.9% |
| 90 or more Minutes | 425 | 1.9% |
Commute Time by Sex in Texas City
The most common commute times in Texas City are 20 to 24 minutes (2,110 commuters, 17.7%) for males and 30 to 34 minutes (2,018 commuters, 19.3%) for females.
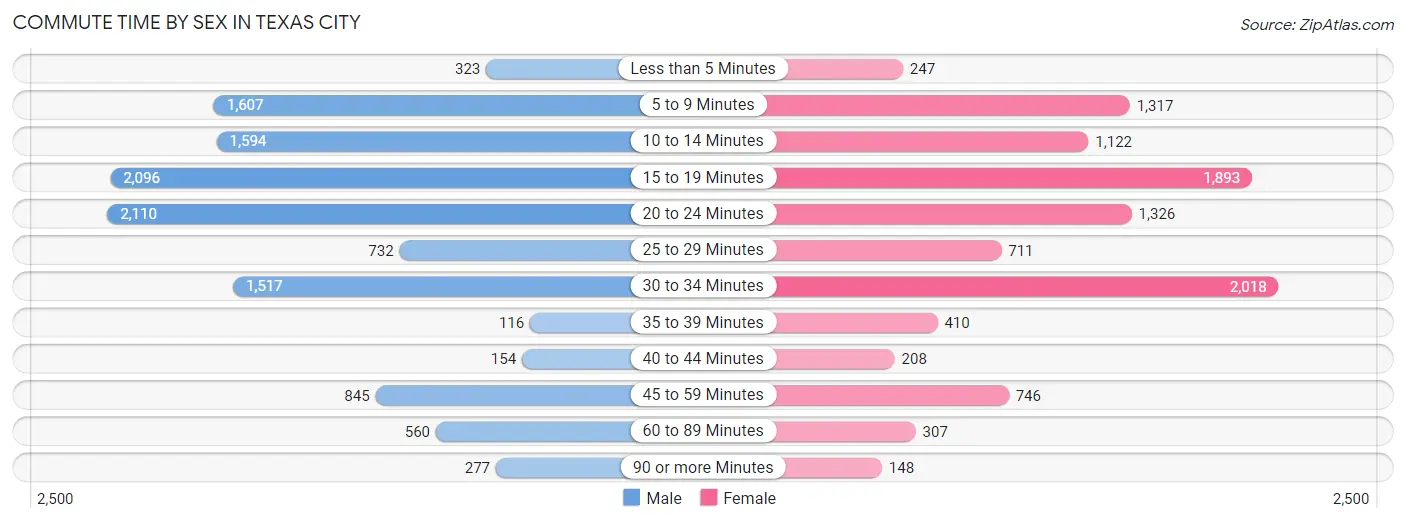
| Commute Time | Male | Female |
| Less than 5 Minutes | 323 (2.7%) | 247 (2.4%) |
| 5 to 9 Minutes | 1,607 (13.5%) | 1,317 (12.6%) |
| 10 to 14 Minutes | 1,594 (13.4%) | 1,122 (10.7%) |
| 15 to 19 Minutes | 2,096 (17.6%) | 1,893 (18.1%) |
| 20 to 24 Minutes | 2,110 (17.7%) | 1,326 (12.7%) |
| 25 to 29 Minutes | 732 (6.1%) | 711 (6.8%) |
| 30 to 34 Minutes | 1,517 (12.7%) | 2,018 (19.3%) |
| 35 to 39 Minutes | 116 (1.0%) | 410 (3.9%) |
| 40 to 44 Minutes | 154 (1.3%) | 208 (2.0%) |
| 45 to 59 Minutes | 845 (7.1%) | 746 (7.1%) |
| 60 to 89 Minutes | 560 (4.7%) | 307 (2.9%) |
| 90 or more Minutes | 277 (2.3%) | 148 (1.4%) |
Time of Departure to Work by Sex in Texas City
The most frequent times of departure to work in Texas City are 12:00 AM to 4:59 AM (1,902, 15.9%) for males and 4:00 PM to 11:59 PM (1,473, 14.1%) for females.
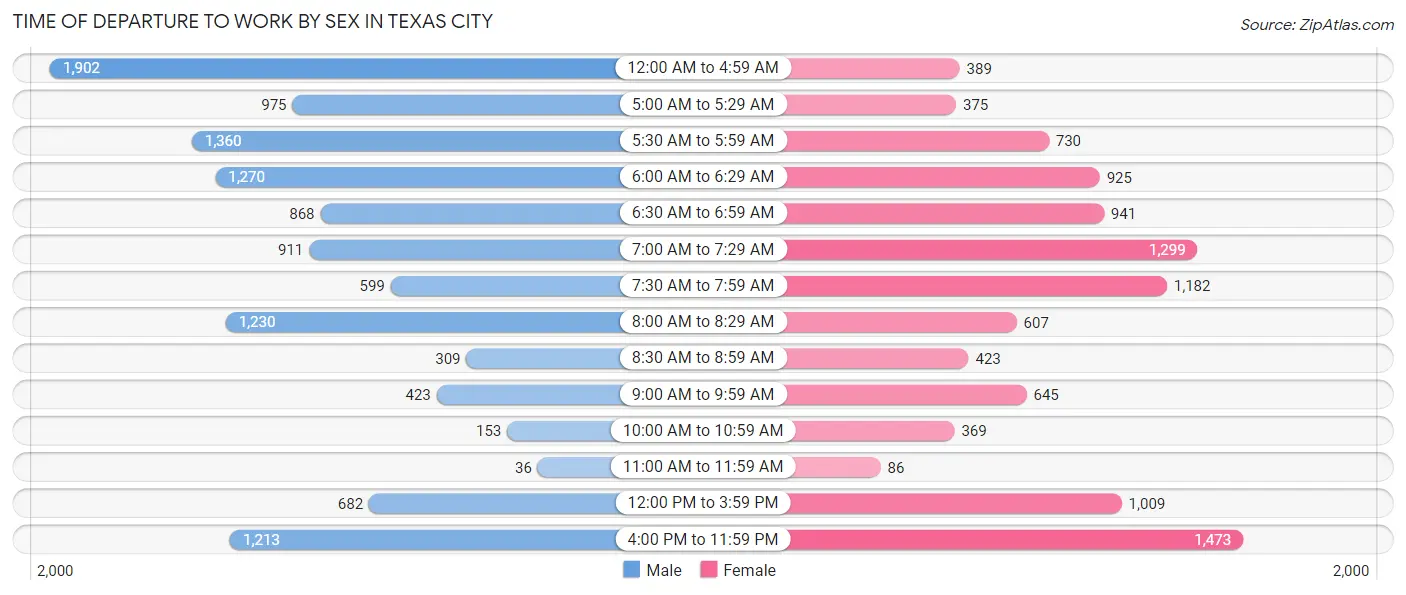
| Time of Departure | Male | Female |
| 12:00 AM to 4:59 AM | 1,902 (15.9%) | 389 (3.7%) |
| 5:00 AM to 5:29 AM | 975 (8.2%) | 375 (3.6%) |
| 5:30 AM to 5:59 AM | 1,360 (11.4%) | 730 (7.0%) |
| 6:00 AM to 6:29 AM | 1,270 (10.6%) | 925 (8.8%) |
| 6:30 AM to 6:59 AM | 868 (7.3%) | 941 (9.0%) |
| 7:00 AM to 7:29 AM | 911 (7.6%) | 1,299 (12.4%) |
| 7:30 AM to 7:59 AM | 599 (5.0%) | 1,182 (11.3%) |
| 8:00 AM to 8:29 AM | 1,230 (10.3%) | 607 (5.8%) |
| 8:30 AM to 8:59 AM | 309 (2.6%) | 423 (4.1%) |
| 9:00 AM to 9:59 AM | 423 (3.5%) | 645 (6.2%) |
| 10:00 AM to 10:59 AM | 153 (1.3%) | 369 (3.5%) |
| 11:00 AM to 11:59 AM | 36 (0.3%) | 86 (0.8%) |
| 12:00 PM to 3:59 PM | 682 (5.7%) | 1,009 (9.7%) |
| 4:00 PM to 11:59 PM | 1,213 (10.2%) | 1,473 (14.1%) |
| Total | 11,931 (100.0%) | 10,453 (100.0%) |
Housing Occupancy in Texas City
Occupancy by Ownership in Texas City
Of the total 20,398 dwellings in Texas City, owner-occupied units account for 11,308 (55.4%), while renter-occupied units make up 9,090 (44.6%).
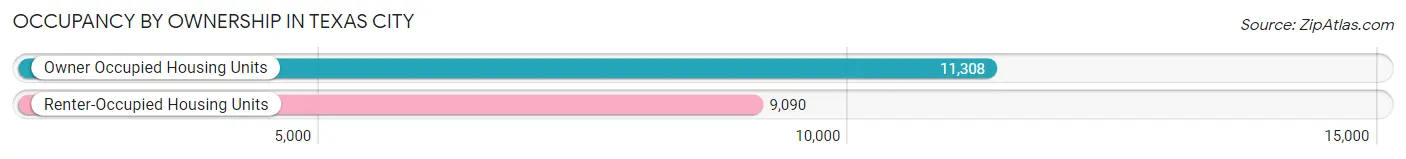
| Occupancy | # Housing Units | % Housing Units |
| Owner Occupied Housing Units | 11,308 | 55.4% |
| Renter-Occupied Housing Units | 9,090 | 44.6% |
| Total Occupied Housing Units | 20,398 | 100.0% |
Occupancy by Household Size in Texas City
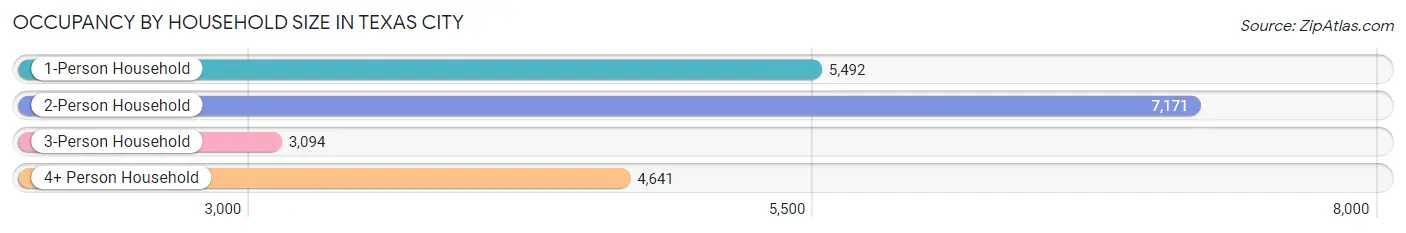
| Household Size | # Housing Units | % Housing Units |
| 1-Person Household | 5,492 | 26.9% |
| 2-Person Household | 7,171 | 35.2% |
| 3-Person Household | 3,094 | 15.2% |
| 4+ Person Household | 4,641 | 22.8% |
| Total Housing Units | 20,398 | 100.0% |
Occupancy by Ownership by Household Size in Texas City
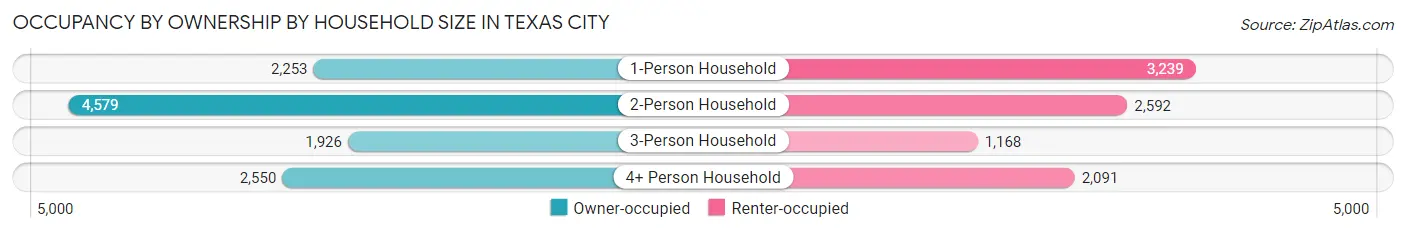
| Household Size | Owner-occupied | Renter-occupied |
| 1-Person Household | 2,253 (41.0%) | 3,239 (59.0%) |
| 2-Person Household | 4,579 (63.8%) | 2,592 (36.1%) |
| 3-Person Household | 1,926 (62.3%) | 1,168 (37.8%) |
| 4+ Person Household | 2,550 (54.9%) | 2,091 (45.1%) |
| Total Housing Units | 11,308 (55.4%) | 9,090 (44.6%) |
Occupancy by Educational Attainment in Texas City
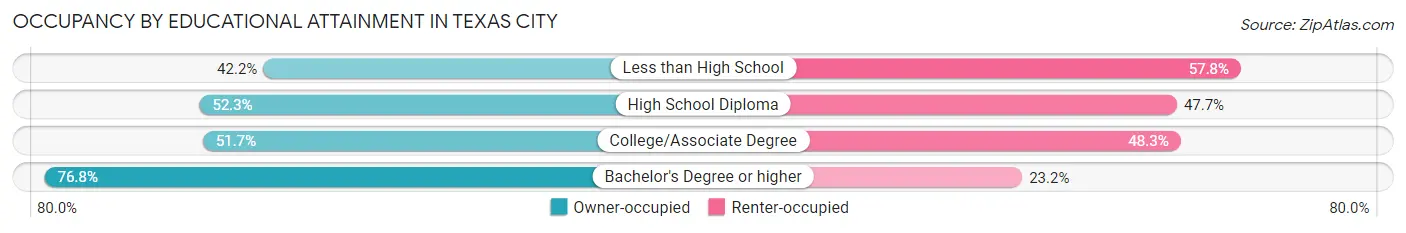
| Household Size | Owner-occupied | Renter-occupied |
| Less than High School | 1,057 (42.2%) | 1,450 (57.8%) |
| High School Diploma | 3,211 (52.3%) | 2,930 (47.7%) |
| College/Associate Degree | 4,099 (51.7%) | 3,823 (48.3%) |
| Bachelor's Degree or higher | 2,941 (76.8%) | 887 (23.2%) |
Occupancy by Age of Householder in Texas City
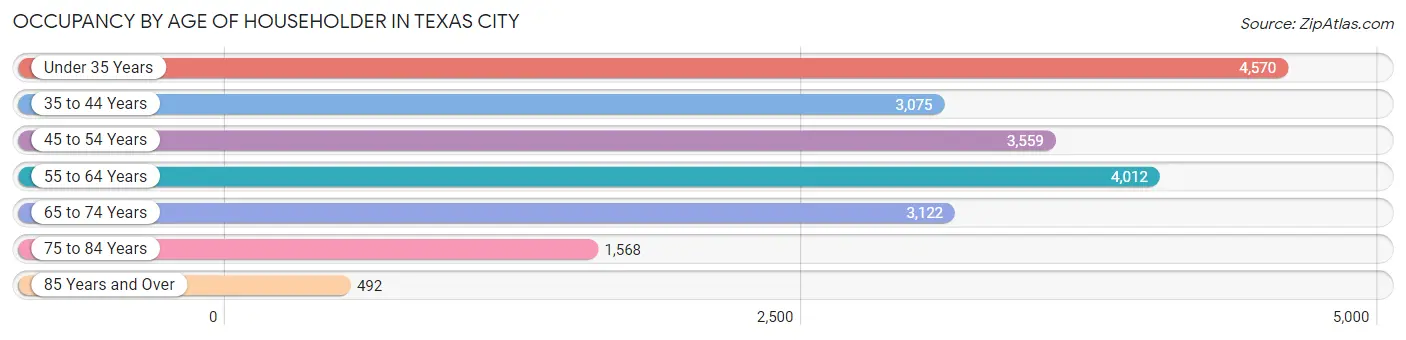
| Age Bracket | # Households | % Households |
| Under 35 Years | 4,570 | 22.4% |
| 35 to 44 Years | 3,075 | 15.1% |
| 45 to 54 Years | 3,559 | 17.4% |
| 55 to 64 Years | 4,012 | 19.7% |
| 65 to 74 Years | 3,122 | 15.3% |
| 75 to 84 Years | 1,568 | 7.7% |
| 85 Years and Over | 492 | 2.4% |
| Total | 20,398 | 100.0% |
Housing Finances in Texas City
Median Income by Occupancy in Texas City
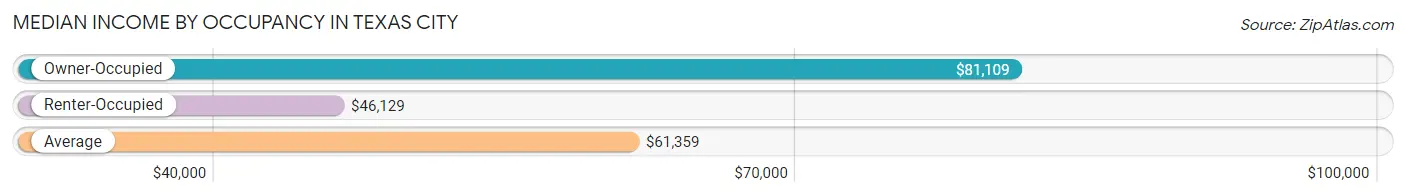
| Occupancy Type | # Households | Median Income |
| Owner-Occupied | 11,308 (55.4%) | $81,109 |
| Renter-Occupied | 9,090 (44.6%) | $46,129 |
| Average | 20,398 (100.0%) | $61,359 |
Occupancy by Householder Income Bracket in Texas City
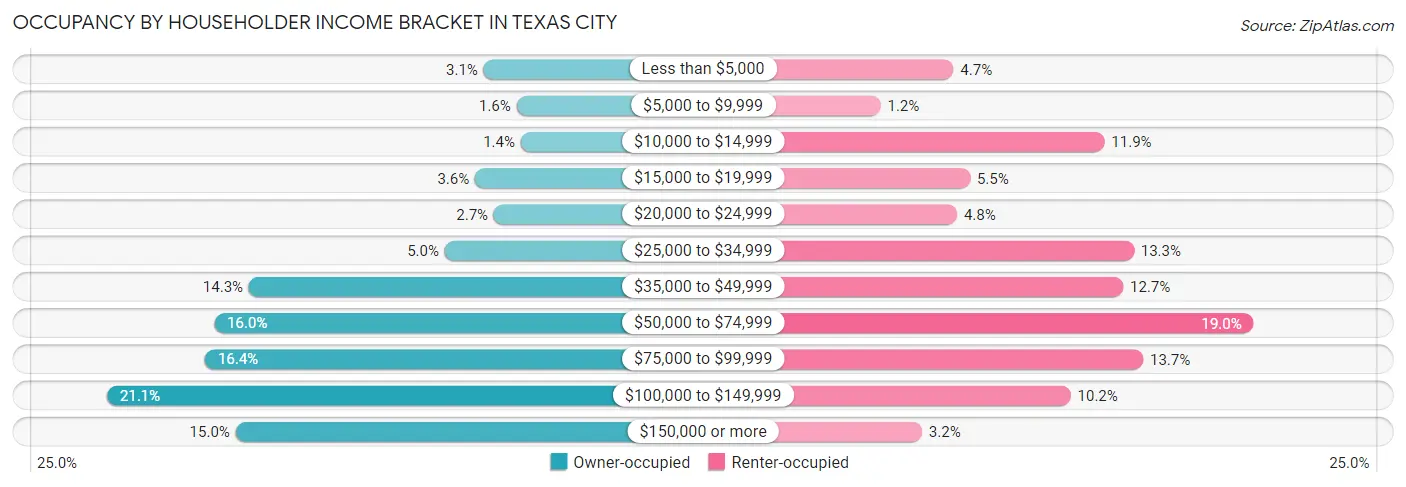
| Income Bracket | Owner-occupied | Renter-occupied |
| Less than $5,000 | 355 (3.1%) | 424 (4.7%) |
| $5,000 to $9,999 | 177 (1.6%) | 108 (1.2%) |
| $10,000 to $14,999 | 155 (1.4%) | 1,077 (11.8%) |
| $15,000 to $19,999 | 401 (3.5%) | 495 (5.4%) |
| $20,000 to $24,999 | 300 (2.6%) | 439 (4.8%) |
| $25,000 to $34,999 | 564 (5.0%) | 1,204 (13.3%) |
| $35,000 to $49,999 | 1,619 (14.3%) | 1,158 (12.7%) |
| $50,000 to $74,999 | 1,807 (16.0%) | 1,723 (19.0%) |
| $75,000 to $99,999 | 1,856 (16.4%) | 1,244 (13.7%) |
| $100,000 to $149,999 | 2,384 (21.1%) | 931 (10.2%) |
| $150,000 or more | 1,690 (14.9%) | 287 (3.2%) |
| Total | 11,308 (100.0%) | 9,090 (100.0%) |
Monthly Housing Cost Tiers in Texas City
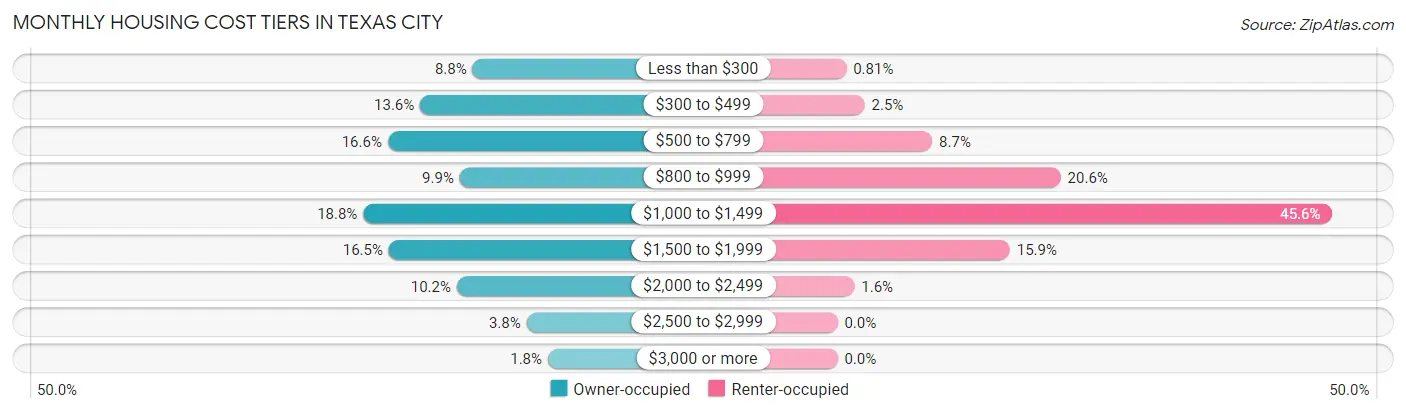
| Monthly Cost | Owner-occupied | Renter-occupied |
| Less than $300 | 991 (8.8%) | 74 (0.8%) |
| $300 to $499 | 1,537 (13.6%) | 227 (2.5%) |
| $500 to $799 | 1,874 (16.6%) | 793 (8.7%) |
| $800 to $999 | 1,124 (9.9%) | 1,868 (20.5%) |
| $1,000 to $1,499 | 2,129 (18.8%) | 4,141 (45.6%) |
| $1,500 to $1,999 | 1,862 (16.5%) | 1,443 (15.9%) |
| $2,000 to $2,499 | 1,155 (10.2%) | 142 (1.6%) |
| $2,500 to $2,999 | 429 (3.8%) | 0 (0.0%) |
| $3,000 or more | 207 (1.8%) | 0 (0.0%) |
| Total | 11,308 (100.0%) | 9,090 (100.0%) |
Physical Housing Characteristics in Texas City
Housing Structures in Texas City
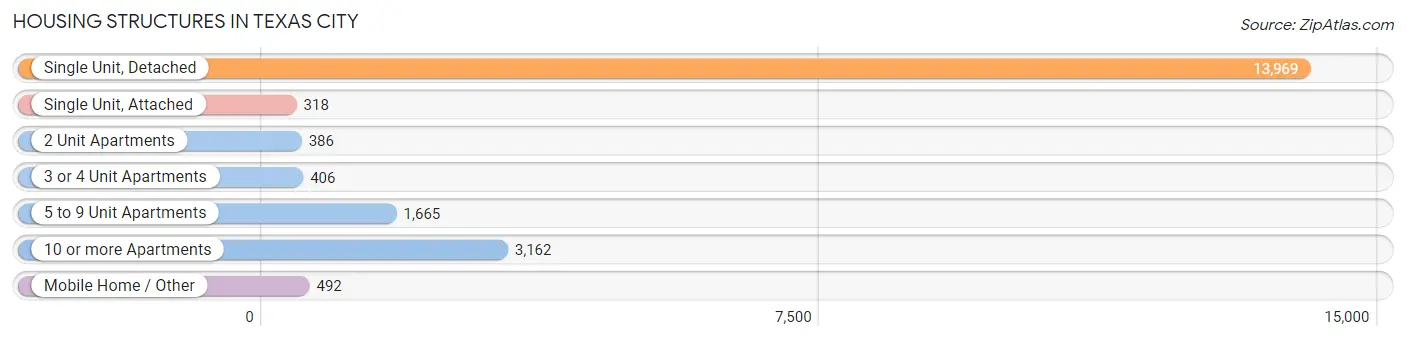
| Structure Type | # Housing Units | % Housing Units |
| Single Unit, Detached | 13,969 | 68.5% |
| Single Unit, Attached | 318 | 1.6% |
| 2 Unit Apartments | 386 | 1.9% |
| 3 or 4 Unit Apartments | 406 | 2.0% |
| 5 to 9 Unit Apartments | 1,665 | 8.2% |
| 10 or more Apartments | 3,162 | 15.5% |
| Mobile Home / Other | 492 | 2.4% |
| Total | 20,398 | 100.0% |
Housing Structures by Occupancy in Texas City
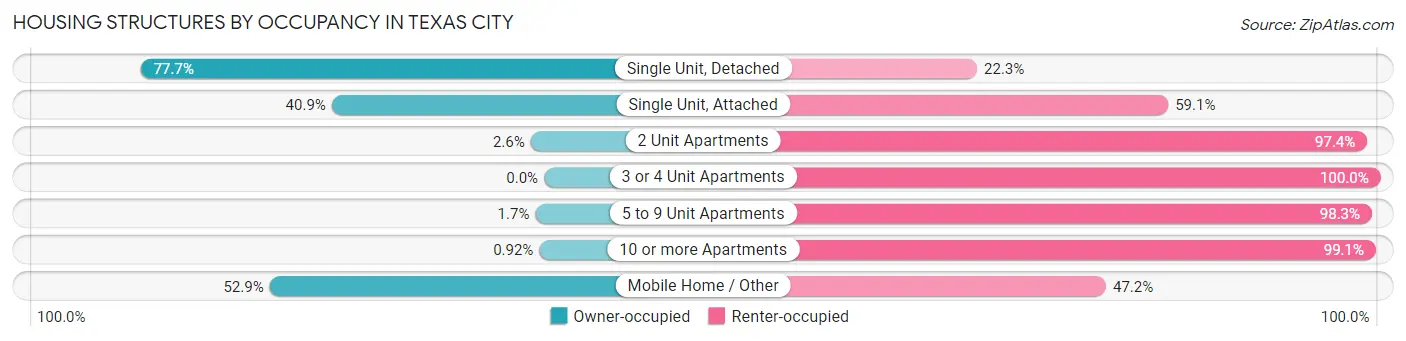
| Structure Type | Owner-occupied | Renter-occupied |
| Single Unit, Detached | 10,851 (77.7%) | 3,118 (22.3%) |
| Single Unit, Attached | 130 (40.9%) | 188 (59.1%) |
| 2 Unit Apartments | 10 (2.6%) | 376 (97.4%) |
| 3 or 4 Unit Apartments | 0 (0.0%) | 406 (100.0%) |
| 5 to 9 Unit Apartments | 28 (1.7%) | 1,637 (98.3%) |
| 10 or more Apartments | 29 (0.9%) | 3,133 (99.1%) |
| Mobile Home / Other | 260 (52.8%) | 232 (47.1%) |
| Total | 11,308 (55.4%) | 9,090 (44.6%) |
Housing Structures by Number of Rooms in Texas City
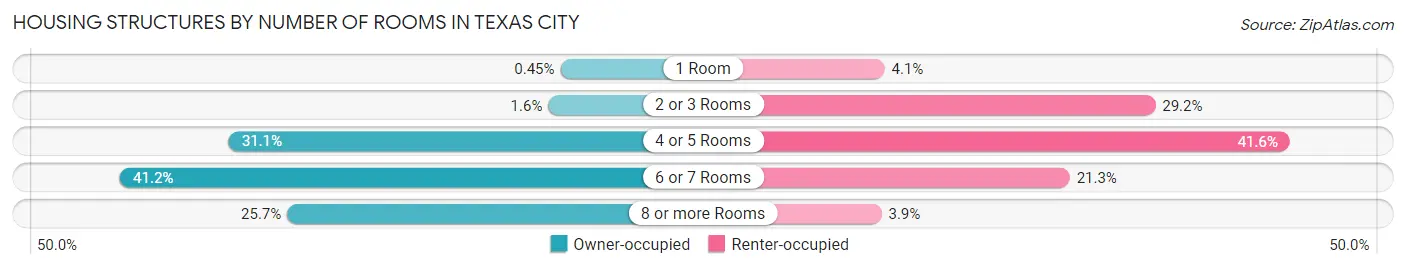
| Number of Rooms | Owner-occupied | Renter-occupied |
| 1 Room | 51 (0.4%) | 375 (4.1%) |
| 2 or 3 Rooms | 177 (1.6%) | 2,652 (29.2%) |
| 4 or 5 Rooms | 3,518 (31.1%) | 3,781 (41.6%) |
| 6 or 7 Rooms | 4,654 (41.2%) | 1,932 (21.2%) |
| 8 or more Rooms | 2,908 (25.7%) | 350 (3.8%) |
| Total | 11,308 (100.0%) | 9,090 (100.0%) |
Housing Structure by Heating Type in Texas City
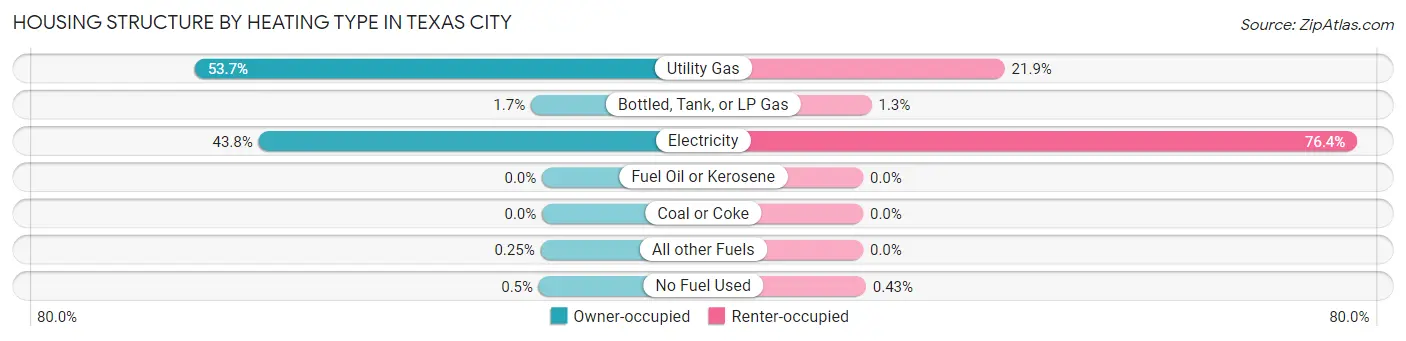
| Heating Type | Owner-occupied | Renter-occupied |
| Utility Gas | 6,072 (53.7%) | 1,990 (21.9%) |
| Bottled, Tank, or LP Gas | 195 (1.7%) | 119 (1.3%) |
| Electricity | 4,956 (43.8%) | 6,942 (76.4%) |
| Fuel Oil or Kerosene | 0 (0.0%) | 0 (0.0%) |
| Coal or Coke | 0 (0.0%) | 0 (0.0%) |
| All other Fuels | 28 (0.3%) | 0 (0.0%) |
| No Fuel Used | 57 (0.5%) | 39 (0.4%) |
| Total | 11,308 (100.0%) | 9,090 (100.0%) |
Household Vehicle Usage in Texas City
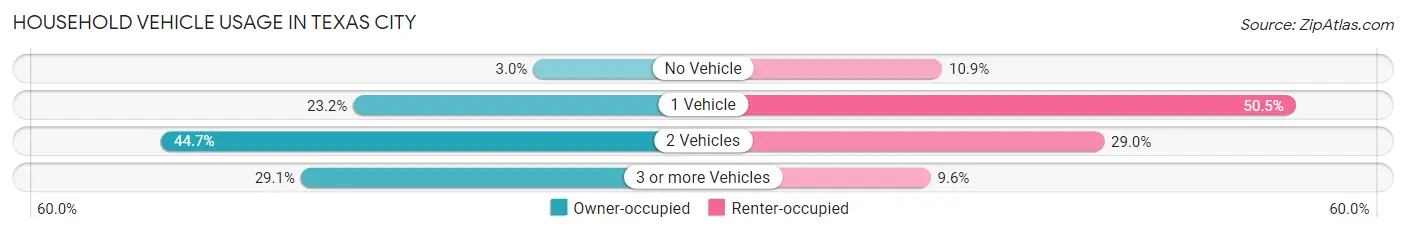
| Vehicles per Household | Owner-occupied | Renter-occupied |
| No Vehicle | 343 (3.0%) | 989 (10.9%) |
| 1 Vehicle | 2,623 (23.2%) | 4,589 (50.5%) |
| 2 Vehicles | 5,055 (44.7%) | 2,639 (29.0%) |
| 3 or more Vehicles | 3,287 (29.1%) | 873 (9.6%) |
| Total | 11,308 (100.0%) | 9,090 (100.0%) |
Real Estate & Mortgages in Texas City
Real Estate and Mortgage Overview in Texas City
| Characteristic | Without Mortgage | With Mortgage |
| Housing Units | 5,427 | 5,881 |
| Median Property Value | $154,200 | $178,800 |
| Median Household Income | $62,240 | $1,085 |
| Monthly Housing Costs | $533 | $207 |
| Real Estate Taxes | $1,806 | $149 |
Property Value by Mortgage Status in Texas City
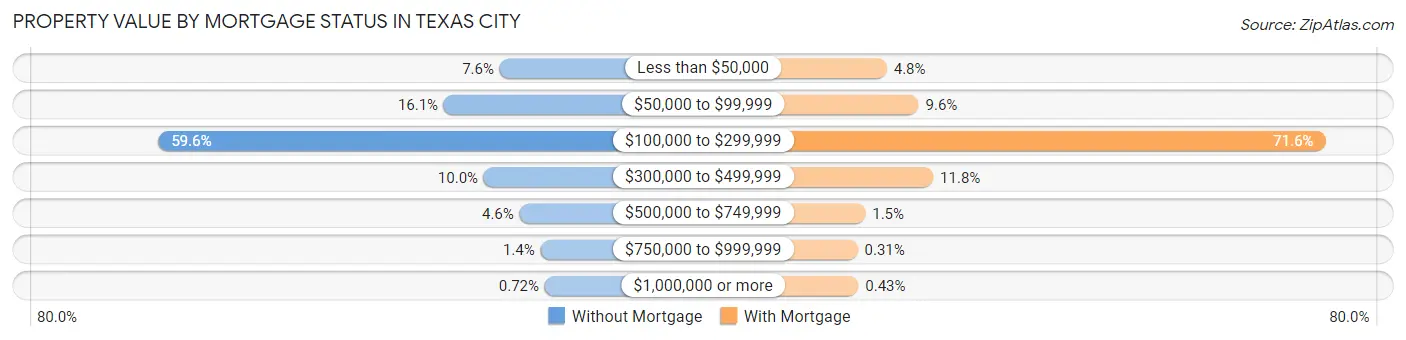
| Property Value | Without Mortgage | With Mortgage |
| Less than $50,000 | 412 (7.6%) | 280 (4.8%) |
| $50,000 to $99,999 | 874 (16.1%) | 565 (9.6%) |
| $100,000 to $299,999 | 3,236 (59.6%) | 4,210 (71.6%) |
| $300,000 to $499,999 | 543 (10.0%) | 696 (11.8%) |
| $500,000 to $749,999 | 248 (4.6%) | 87 (1.5%) |
| $750,000 to $999,999 | 75 (1.4%) | 18 (0.3%) |
| $1,000,000 or more | 39 (0.7%) | 25 (0.4%) |
| Total | 5,427 (100.0%) | 5,881 (100.0%) |
Household Income by Mortgage Status in Texas City
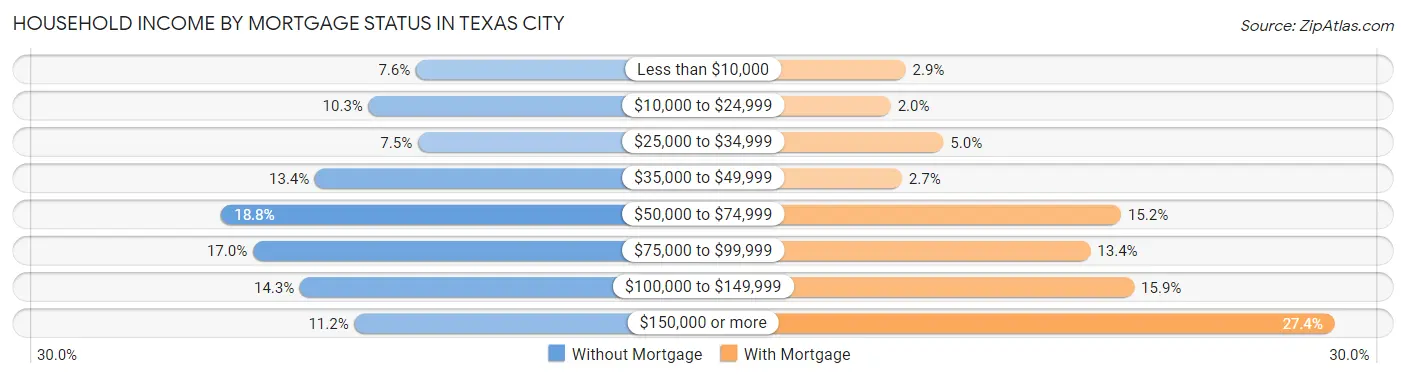
| Household Income | Without Mortgage | With Mortgage |
| Less than $10,000 | 414 (7.6%) | 168 (2.9%) |
| $10,000 to $24,999 | 561 (10.3%) | 118 (2.0%) |
| $25,000 to $34,999 | 408 (7.5%) | 295 (5.0%) |
| $35,000 to $49,999 | 727 (13.4%) | 156 (2.6%) |
| $50,000 to $74,999 | 1,018 (18.8%) | 892 (15.2%) |
| $75,000 to $99,999 | 920 (17.0%) | 789 (13.4%) |
| $100,000 to $149,999 | 774 (14.3%) | 936 (15.9%) |
| $150,000 or more | 605 (11.2%) | 1,610 (27.4%) |
| Total | 5,427 (100.0%) | 5,881 (100.0%) |
Property Value to Household Income Ratio in Texas City
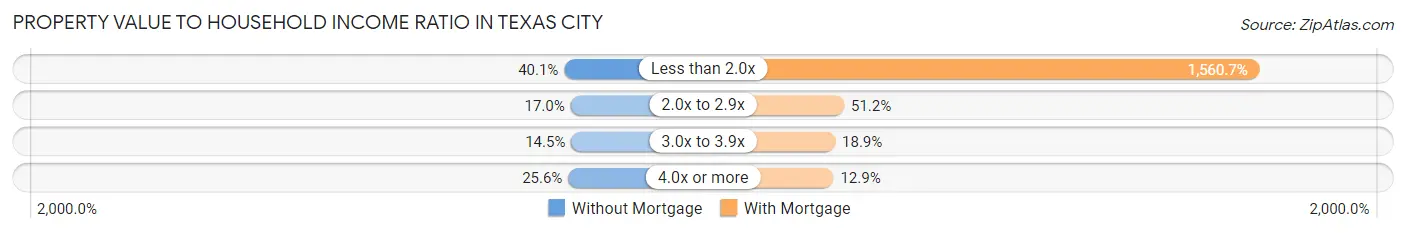
| Value-to-Income Ratio | Without Mortgage | With Mortgage |
| Less than 2.0x | 2,177 (40.1%) | 91,783 (1,560.7%) |
| 2.0x to 2.9x | 920 (17.0%) | 3,008 (51.1%) |
| 3.0x to 3.9x | 788 (14.5%) | 1,110 (18.9%) |
| 4.0x or more | 1,390 (25.6%) | 756 (12.9%) |
| Total | 5,427 (100.0%) | 5,881 (100.0%) |
Real Estate Taxes by Mortgage Status in Texas City
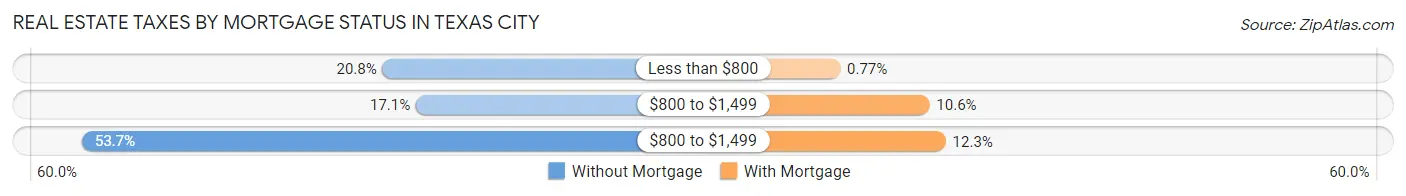
| Property Taxes | Without Mortgage | With Mortgage |
| Less than $800 | 1,127 (20.8%) | 45 (0.8%) |
| $800 to $1,499 | 928 (17.1%) | 621 (10.6%) |
| $800 to $1,499 | 2,916 (53.7%) | 726 (12.3%) |
| Total | 5,427 (100.0%) | 5,881 (100.0%) |
Health & Disability in Texas City
Health Insurance Coverage by Age in Texas City
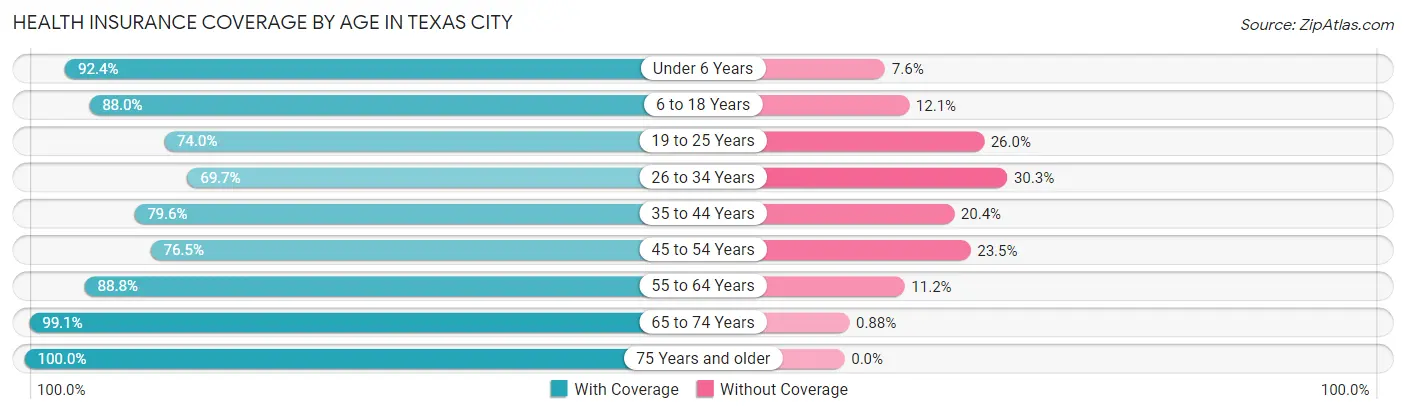
| Age Bracket | With Coverage | Without Coverage |
| Under 6 Years | 3,942 (92.4%) | 323 (7.6%) |
| 6 to 18 Years | 8,571 (87.9%) | 1,174 (12.0%) |
| 19 to 25 Years | 3,660 (74.0%) | 1,286 (26.0%) |
| 26 to 34 Years | 5,023 (69.7%) | 2,188 (30.3%) |
| 35 to 44 Years | 4,791 (79.6%) | 1,231 (20.4%) |
| 45 to 54 Years | 4,228 (76.5%) | 1,298 (23.5%) |
| 55 to 64 Years | 5,679 (88.8%) | 717 (11.2%) |
| 65 to 74 Years | 4,740 (99.1%) | 42 (0.9%) |
| 75 Years and older | 2,875 (100.0%) | 0 (0.0%) |
| Total | 43,509 (84.1%) | 8,259 (16.0%) |
Health Insurance Coverage by Citizenship Status in Texas City

| Citizenship Status | With Coverage | Without Coverage |
| Native Born | 3,942 (92.4%) | 323 (7.6%) |
| Foreign Born, Citizen | 8,571 (87.9%) | 1,174 (12.0%) |
| Foreign Born, not a Citizen | 3,660 (74.0%) | 1,286 (26.0%) |
Health Insurance Coverage by Household Income in Texas City
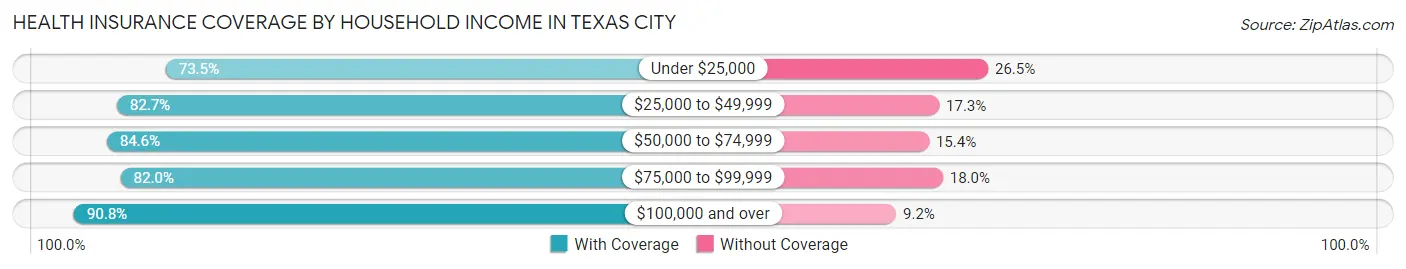
| Household Income | With Coverage | Without Coverage |
| Under $25,000 | 5,528 (73.5%) | 1,989 (26.5%) |
| $25,000 to $49,999 | 9,615 (82.7%) | 2,011 (17.3%) |
| $50,000 to $74,999 | 7,193 (84.6%) | 1,309 (15.4%) |
| $75,000 to $99,999 | 6,530 (82.0%) | 1,432 (18.0%) |
| $100,000 and over | 14,627 (90.8%) | 1,489 (9.2%) |
Public vs Private Health Insurance Coverage by Age in Texas City
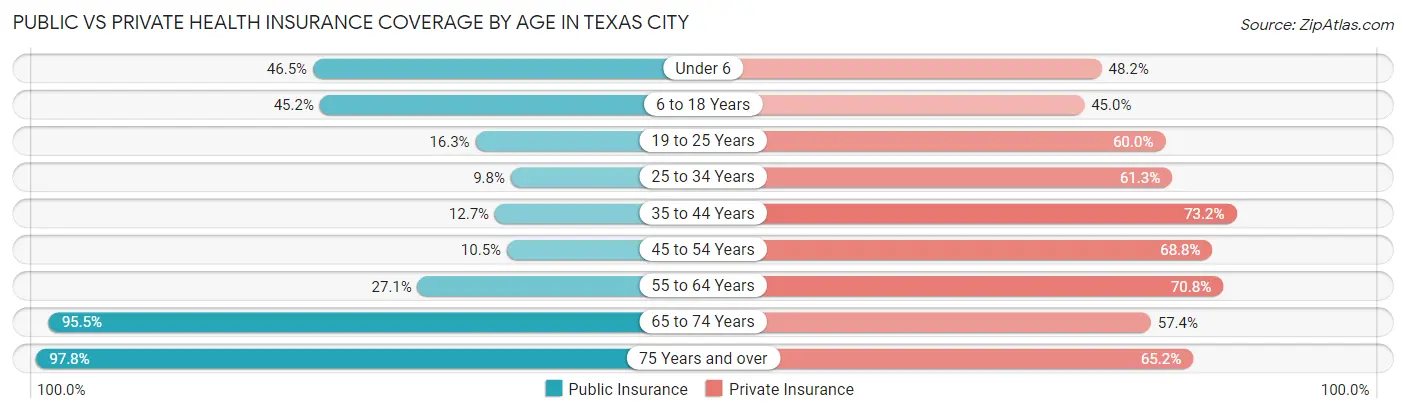
| Age Bracket | Public Insurance | Private Insurance |
| Under 6 | 1,983 (46.5%) | 2,056 (48.2%) |
| 6 to 18 Years | 4,407 (45.2%) | 4,385 (45.0%) |
| 19 to 25 Years | 807 (16.3%) | 2,969 (60.0%) |
| 25 to 34 Years | 704 (9.8%) | 4,420 (61.3%) |
| 35 to 44 Years | 765 (12.7%) | 4,409 (73.2%) |
| 45 to 54 Years | 579 (10.5%) | 3,800 (68.8%) |
| 55 to 64 Years | 1,730 (27.1%) | 4,525 (70.8%) |
| 65 to 74 Years | 4,568 (95.5%) | 2,743 (57.4%) |
| 75 Years and over | 2,812 (97.8%) | 1,874 (65.2%) |
| Total | 18,355 (35.5%) | 31,181 (60.2%) |
Disability Status by Sex by Age in Texas City
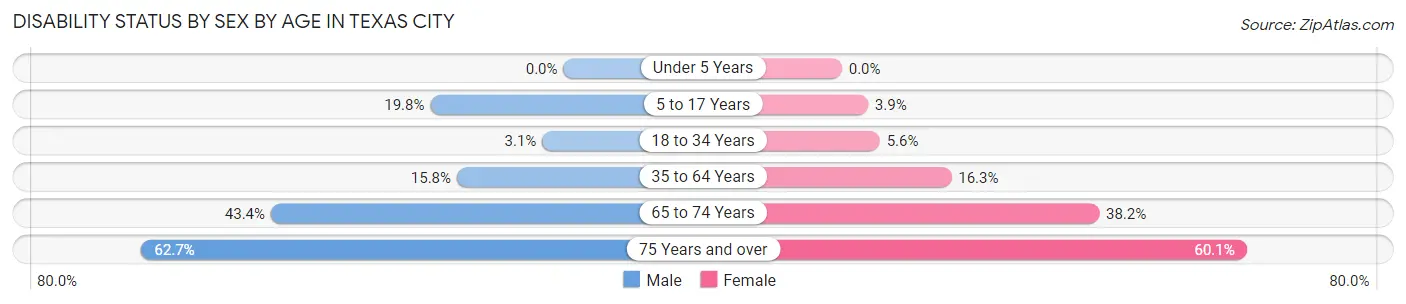
| Age Bracket | Male | Female |
| Under 5 Years | 0 (0.0%) | 0 (0.0%) |
| 5 to 17 Years | 941 (19.8%) | 196 (3.9%) |
| 18 to 34 Years | 204 (3.1%) | 340 (5.6%) |
| 35 to 64 Years | 1,312 (15.8%) | 1,568 (16.3%) |
| 65 to 74 Years | 932 (43.4%) | 1,007 (38.2%) |
| 75 Years and over | 743 (62.6%) | 1,015 (60.1%) |
Disability Class by Sex by Age in Texas City
Disability Class: Hearing Difficulty
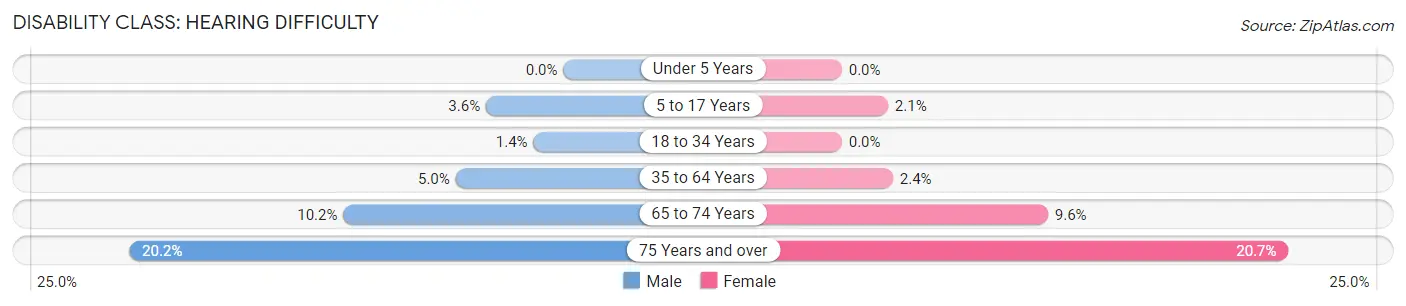
| Age Bracket | Male | Female |
| Under 5 Years | 0 (0.0%) | 0 (0.0%) |
| 5 to 17 Years | 171 (3.6%) | 108 (2.1%) |
| 18 to 34 Years | 90 (1.4%) | 0 (0.0%) |
| 35 to 64 Years | 415 (5.0%) | 229 (2.4%) |
| 65 to 74 Years | 219 (10.2%) | 252 (9.6%) |
| 75 Years and over | 239 (20.2%) | 350 (20.7%) |
Disability Class: Vision Difficulty
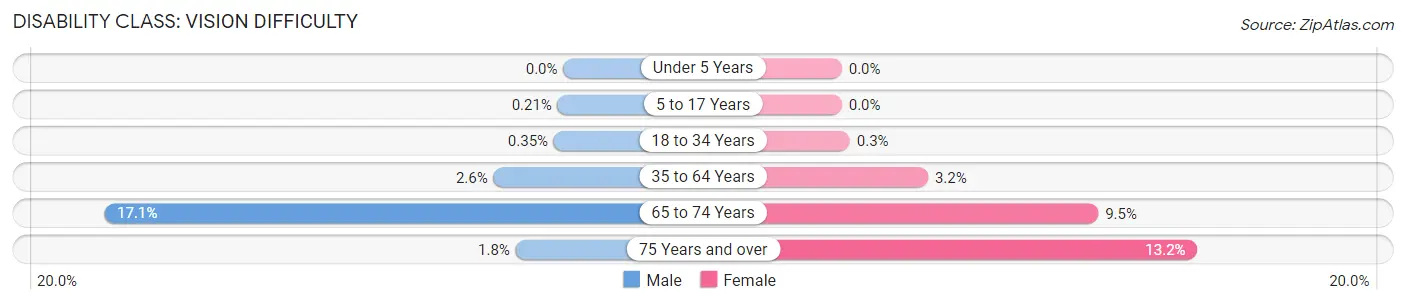
| Age Bracket | Male | Female |
| Under 5 Years | 0 (0.0%) | 0 (0.0%) |
| 5 to 17 Years | 10 (0.2%) | 0 (0.0%) |
| 18 to 34 Years | 23 (0.4%) | 18 (0.3%) |
| 35 to 64 Years | 215 (2.6%) | 309 (3.2%) |
| 65 to 74 Years | 366 (17.1%) | 251 (9.5%) |
| 75 Years and over | 21 (1.8%) | 223 (13.2%) |
Disability Class: Cognitive Difficulty
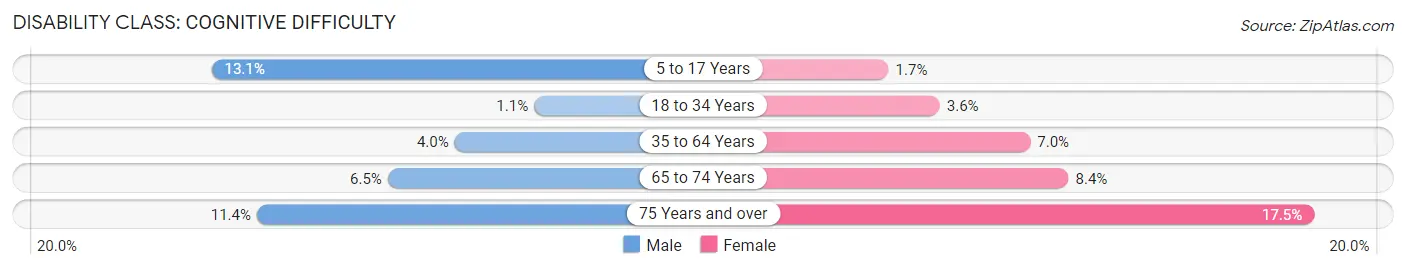
| Age Bracket | Male | Female |
| 5 to 17 Years | 622 (13.1%) | 88 (1.7%) |
| 18 to 34 Years | 71 (1.1%) | 220 (3.6%) |
| 35 to 64 Years | 335 (4.0%) | 675 (7.0%) |
| 65 to 74 Years | 140 (6.5%) | 222 (8.4%) |
| 75 Years and over | 135 (11.4%) | 296 (17.5%) |
Disability Class: Ambulatory Difficulty
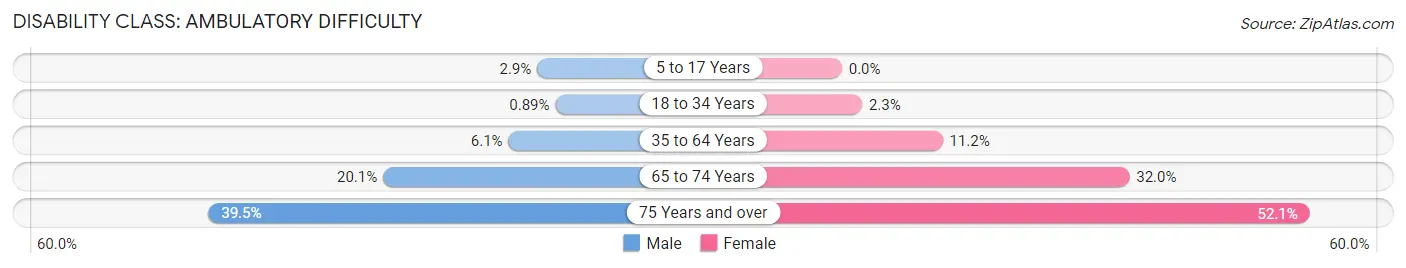
| Age Bracket | Male | Female |
| 5 to 17 Years | 139 (2.9%) | 0 (0.0%) |
| 18 to 34 Years | 58 (0.9%) | 136 (2.2%) |
| 35 to 64 Years | 508 (6.1%) | 1,082 (11.2%) |
| 65 to 74 Years | 431 (20.1%) | 844 (32.0%) |
| 75 Years and over | 469 (39.5%) | 880 (52.1%) |
Disability Class: Self-Care Difficulty
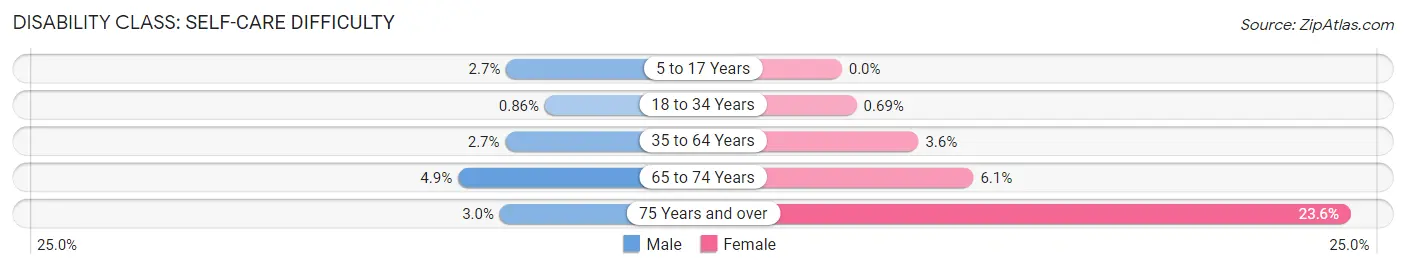
| Age Bracket | Male | Female |
| 5 to 17 Years | 126 (2.6%) | 0 (0.0%) |
| 18 to 34 Years | 56 (0.9%) | 42 (0.7%) |
| 35 to 64 Years | 223 (2.7%) | 343 (3.6%) |
| 65 to 74 Years | 105 (4.9%) | 161 (6.1%) |
| 75 Years and over | 35 (2.9%) | 399 (23.6%) |
Technology Access in Texas City
Computing Device Access in Texas City
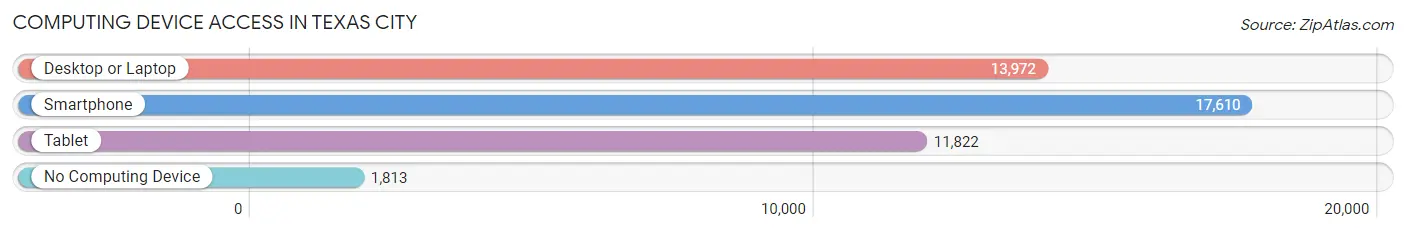
| Device Type | # Households | % Households |
| Desktop or Laptop | 13,972 | 68.5% |
| Smartphone | 17,610 | 86.3% |
| Tablet | 11,822 | 58.0% |
| No Computing Device | 1,813 | 8.9% |
| Total | 20,398 | 100.0% |
Internet Access in Texas City
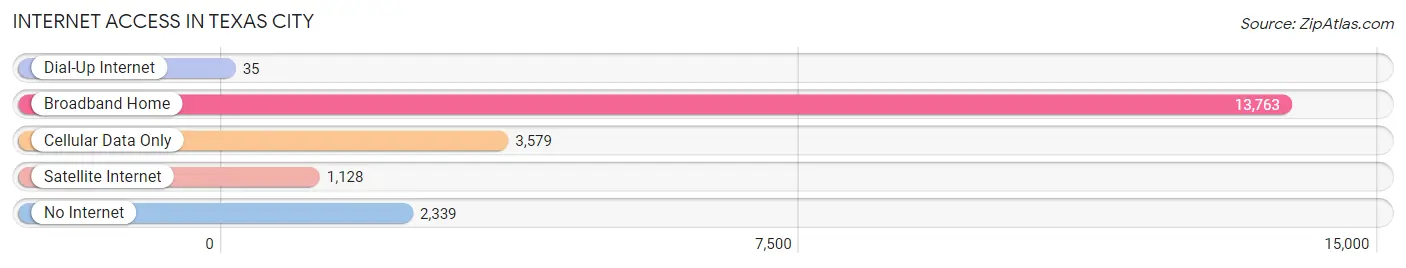
| Internet Type | # Households | % Households |
| Dial-Up Internet | 35 | 0.2% |
| Broadband Home | 13,763 | 67.5% |
| Cellular Data Only | 3,579 | 17.5% |
| Satellite Internet | 1,128 | 5.5% |
| No Internet | 2,339 | 11.5% |
| Total | 20,398 | 100.0% |
Texas City Summary
Texas City is a city located in Galveston County, Texas, United States, within the Houston–The Woodlands–Sugar Land metropolitan area. The city is located on the southwest shoreline of Galveston Bay, about 50 miles southeast of Houston. As of the 2010 U.S. Census, the city had a total population of 45,099, making it the third-largest city in Galveston County, behind League City and Galveston. It is a part of the Houston–The Woodlands–Sugar Land metropolitan area.
History
Texas City was founded in 1893 by real estate developer and state senator, William Lewis Moody, Jr. The city was originally planned as a resort community, and was named after the state of Texas. The city was incorporated in 1911, and by 1915, the city had a population of over 3,000.
In 1917, the Texas City Disaster occurred when two ships, the SS Grandcamp and the SS High Flyer, exploded in the harbor. The explosions killed at least 581 people and injured thousands more. The disaster was one of the largest industrial accidents in U.S. history.
In the 1940s, the city began to grow rapidly due to the expansion of the petrochemical industry. The city's population grew from 6,000 in 1940 to over 45,000 in 2000.
Geography
Texas City is located at 29°26′N 94°56′W (29.4333, -94.9333). It is situated on the southwest shoreline of Galveston Bay, about 50 miles southeast of Houston. The city has a total area of 24.2 square miles, of which 22.2 square miles is land and 2.0 square miles is water.
The city is bordered by the cities of La Marque to the north, Dickinson to the east, and Santa Fe to the south. The city is also bordered by Galveston Bay to the west.
Economy
Texas City is a major industrial center and port. The city is home to several major petrochemical and oil refining companies, including Valero Energy Corporation, Marathon Oil Corporation, and LyondellBasell. The city is also home to several major shipping companies, including Maersk Line, CMA CGM, and Hapag-Lloyd.
The city is also home to several major manufacturing companies, including Dow Chemical Company, BASF, and Air Liquide.
Demographics
As of the 2010 U.S. Census, the city had a total population of 45,099. The racial makeup of the city was 57.2% White, 24.3% African American, 0.7% Native American, 1.3% Asian, 0.1% Pacific Islander, 13.2% from other races, and 3.3% from two or more races. Hispanic or Latino of any race were 33.2% of the population.
The median income for a household in the city was $41,945, and the median income for a family was $50,919. The per capita income for the city was $20,945. About 17.2% of families and 20.7% of the population were below the poverty line, including 28.3% of those under age 18 and 11.2% of those age 65 or over.
Common Questions
What is Per Capita Income in Texas City?
Per Capita income in Texas City is $31,361.
What is the Median Family Income in Texas City?
Median Family Income in Texas City is $73,612.
What is the Median Household income in Texas City?
Median Household Income in Texas City is $61,359.
What is Income or Wage Gap in Texas City?
Income or Wage Gap in Texas City is 30.4%.
Women in Texas City earn 69.6 cents for every dollar earned by a man.
What is Inequality or Gini Index in Texas City?
Inequality or Gini Index in Texas City is 0.46.
What is the Total Population of Texas City?
Total Population of Texas City is 53,084.
What is the Total Male Population of Texas City?
Total Male Population of Texas City is 25,265.
What is the Total Female Population of Texas City?
Total Female Population of Texas City is 27,819.
What is the Ratio of Males per 100 Females in Texas City?
There are 90.82 Males per 100 Females in Texas City.
What is the Ratio of Females per 100 Males in Texas City?
There are 110.11 Females per 100 Males in Texas City.
What is the Median Population Age in Texas City?
Median Population Age in Texas City is 34.9 Years.
What is the Average Family Size in Texas City
Average Family Size in Texas City is 3.2 People.
What is the Average Household Size in Texas City
Average Household Size in Texas City is 2.5 People.
How Large is the Labor Force in Texas City?
There are 25,589 People in the Labor Forcein in Texas City.
What is the Percentage of People in the Labor Force in Texas City?
62.6% of People are in the Labor Force in Texas City.
What is the Unemployment Rate in Texas City?
Unemployment Rate in Texas City is 7.1%.