Plainview, TX Map & Demographics
Plainview Map
Plainview Overview
$24,171
PER CAPITA INCOME
$54,854
AVG FAMILY INCOME
$46,274
AVG HOUSEHOLD INCOME
46.5%
WAGE / INCOME GAP [ % ]
53.5¢/ $1
WAGE / INCOME GAP [ $ ]
0.46
INEQUALITY / GINI INDEX
20,113
TOTAL POPULATION
9,531
MALE POPULATION
10,582
FEMALE POPULATION
90.07
MALES / 100 FEMALES
111.03
FEMALES / 100 MALES
31.5
MEDIAN AGE
3.3
AVG FAMILY SIZE
2.8
AVG HOUSEHOLD SIZE
9,510
LABOR FORCE [ PEOPLE ]
64.1%
PERCENT IN LABOR FORCE
6.6%
UNEMPLOYMENT RATE
Plainview Area Codes
Income in Plainview
Income Overview in Plainview
Per Capita Income in Plainview is $24,171, while median incomes of families and households are $54,854 and $46,274 respectively.
| Characteristic | Number | Measure |
| Per Capita Income | 20,113 | $24,171 |
| Median Family Income | 5,110 | $54,854 |
| Mean Family Income | 5,110 | $72,667 |
| Median Household Income | 7,016 | $46,274 |
| Mean Household Income | 7,016 | $64,876 |
| Income Deficit | 5,110 | $0 |
| Wage / Income Gap (%) | 20,113 | 46.55% |
| Wage / Income Gap ($) | 20,113 | 53.45¢ per $1 |
| Gini / Inequality Index | 20,113 | 0.46 |
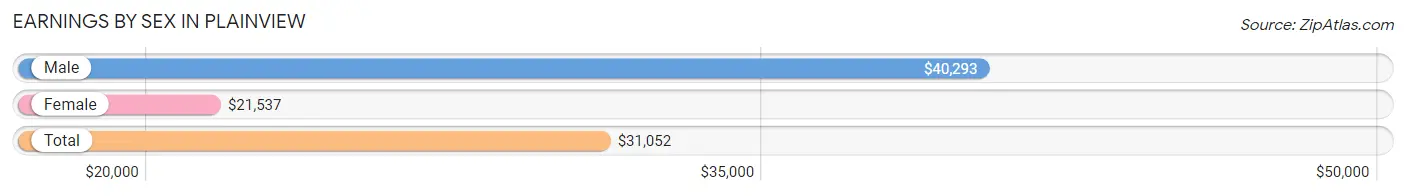
Earnings by Sex in Plainview
Average Earnings in Plainview are $31,052, $40,293 for men and $21,537 for women, a difference of 46.6%.
| Sex | Number | Average Earnings |
| Male | 5,227 (54.6%) | $40,293 |
| Female | 4,348 (45.4%) | $21,537 |
| Total | 9,575 (100.0%) | $31,052 |
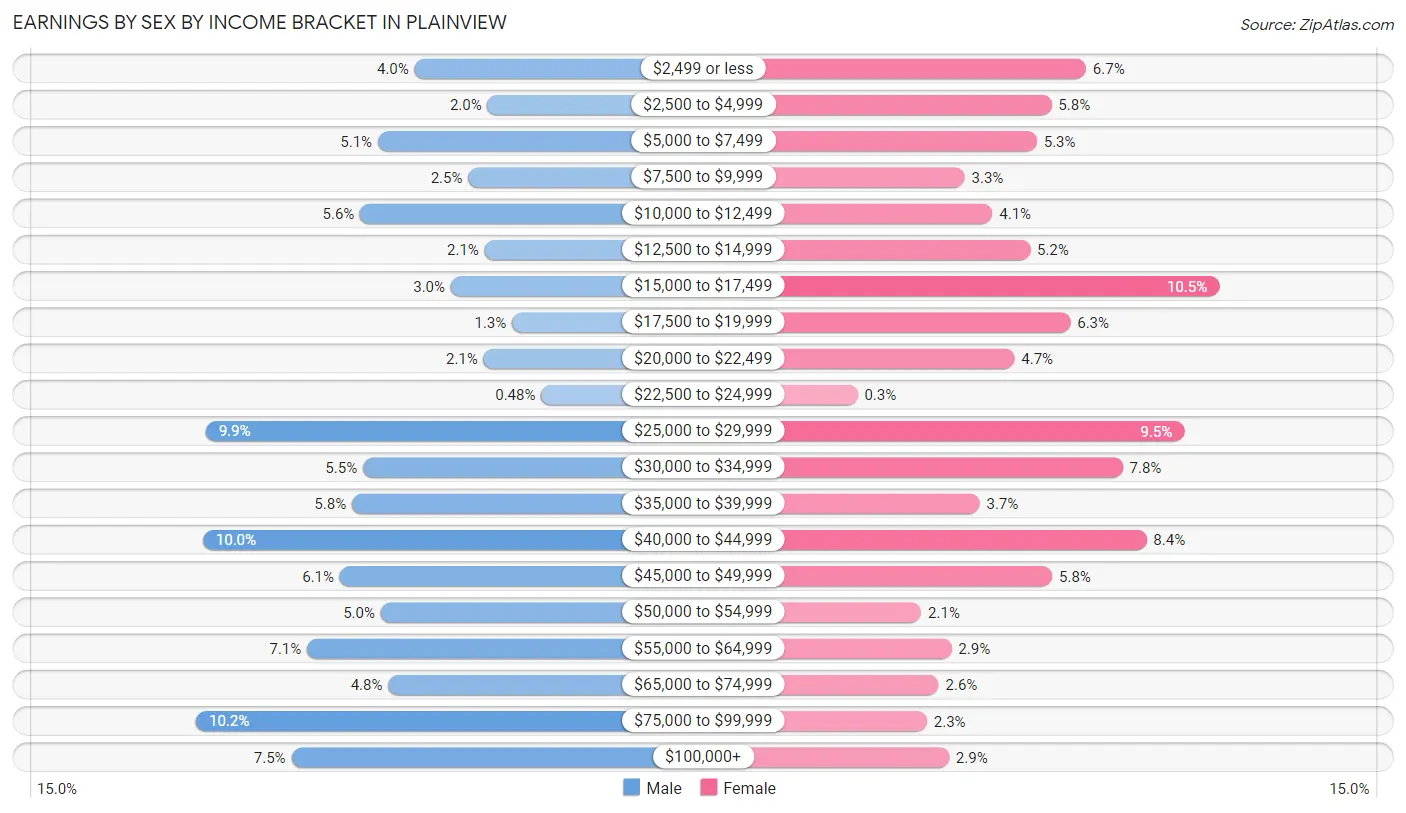
Earnings by Sex by Income Bracket in Plainview
The most common earnings brackets in Plainview are $75,000 to $99,999 for men (532 | 10.2%) and $15,000 to $17,499 for women (455 | 10.5%).
| Income | Male | Female |
| $2,499 or less | 211 (4.0%) | 292 (6.7%) |
| $2,500 to $4,999 | 104 (2.0%) | 250 (5.8%) |
| $5,000 to $7,499 | 265 (5.1%) | 232 (5.3%) |
| $7,500 to $9,999 | 132 (2.5%) | 144 (3.3%) |
| $10,000 to $12,499 | 291 (5.6%) | 178 (4.1%) |
| $12,500 to $14,999 | 108 (2.1%) | 224 (5.1%) |
| $15,000 to $17,499 | 158 (3.0%) | 455 (10.5%) |
| $17,500 to $19,999 | 68 (1.3%) | 273 (6.3%) |
| $20,000 to $22,499 | 110 (2.1%) | 205 (4.7%) |
| $22,500 to $24,999 | 25 (0.5%) | 13 (0.3%) |
| $25,000 to $29,999 | 518 (9.9%) | 412 (9.5%) |
| $30,000 to $34,999 | 287 (5.5%) | 337 (7.7%) |
| $35,000 to $39,999 | 303 (5.8%) | 162 (3.7%) |
| $40,000 to $44,999 | 522 (10.0%) | 366 (8.4%) |
| $45,000 to $49,999 | 321 (6.1%) | 251 (5.8%) |
| $50,000 to $54,999 | 261 (5.0%) | 91 (2.1%) |
| $55,000 to $64,999 | 369 (7.1%) | 128 (2.9%) |
| $65,000 to $74,999 | 250 (4.8%) | 112 (2.6%) |
| $75,000 to $99,999 | 532 (10.2%) | 98 (2.2%) |
| $100,000+ | 392 (7.5%) | 125 (2.9%) |
| Total | 5,227 (100.0%) | 4,348 (100.0%) |
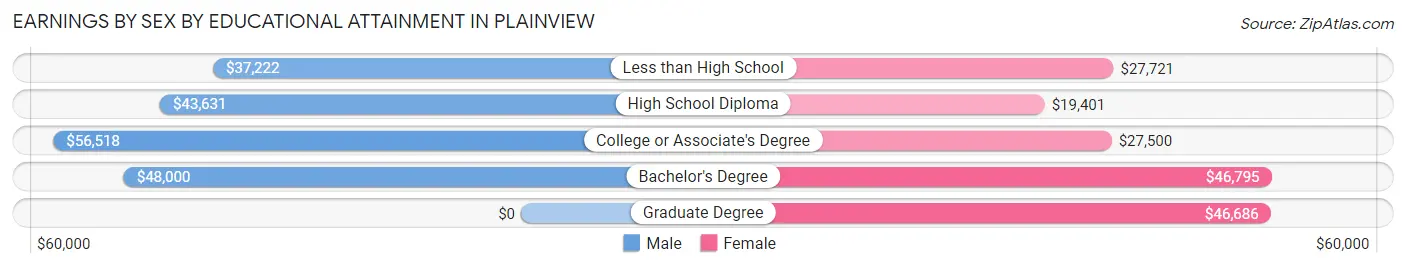
Earnings by Sex by Educational Attainment in Plainview
Average earnings in Plainview are $45,587 for men and $28,361 for women, a difference of 37.8%. Men with an educational attainment of college or associate's degree enjoy the highest average annual earnings of $56,518, while those with less than high school education earn the least with $37,222. Women with an educational attainment of bachelor's degree earn the most with the average annual earnings of $46,795, while those with high school diploma education have the smallest earnings of $19,401.
| Educational Attainment | Male Income | Female Income |
| Less than High School | $37,222 | $27,721 |
| High School Diploma | $43,631 | $19,401 |
| College or Associate's Degree | $56,518 | $27,500 |
| Bachelor's Degree | $48,000 | $46,795 |
| Graduate Degree | - | - |
| Total | $45,587 | $28,361 |
Family Income in Plainview
Family Income Brackets in Plainview
According to the Plainview family income data, there are 935 families falling into the $50,000 to $74,999 income range, which is the most common income bracket and makes up 18.3% of all families. Conversely, the $10,000 to $14,999 income bracket is the least frequent group with only 184 families (3.6%) belonging to this category.
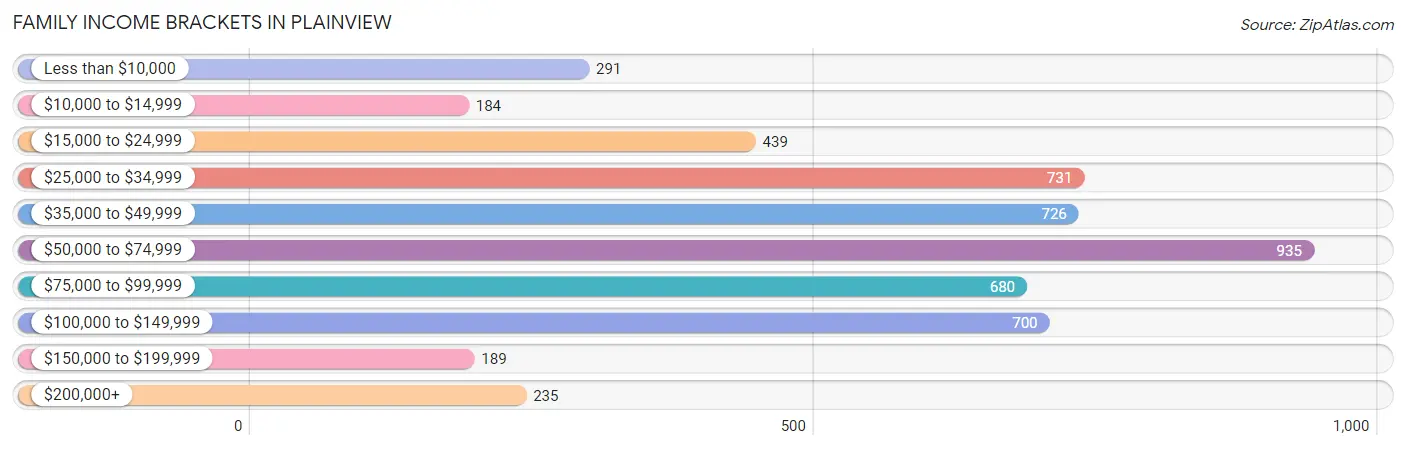
| Income Bracket | # Families | % Families |
| Less than $10,000 | 291 | 5.7% |
| $10,000 to $14,999 | 184 | 3.6% |
| $15,000 to $24,999 | 439 | 8.6% |
| $25,000 to $34,999 | 731 | 14.3% |
| $35,000 to $49,999 | 726 | 14.2% |
| $50,000 to $74,999 | 935 | 18.3% |
| $75,000 to $99,999 | 680 | 13.3% |
| $100,000 to $149,999 | 700 | 13.7% |
| $150,000 to $199,999 | 189 | 3.7% |
| $200,000+ | 235 | 4.6% |
Family Income by Famaliy Size in Plainview
6-person families (229 | 4.5%) account for the highest median family income in Plainview with $84,273 per family, while 2-person families (2,178 | 42.6%) have the highest median income of $25,022 per family member.
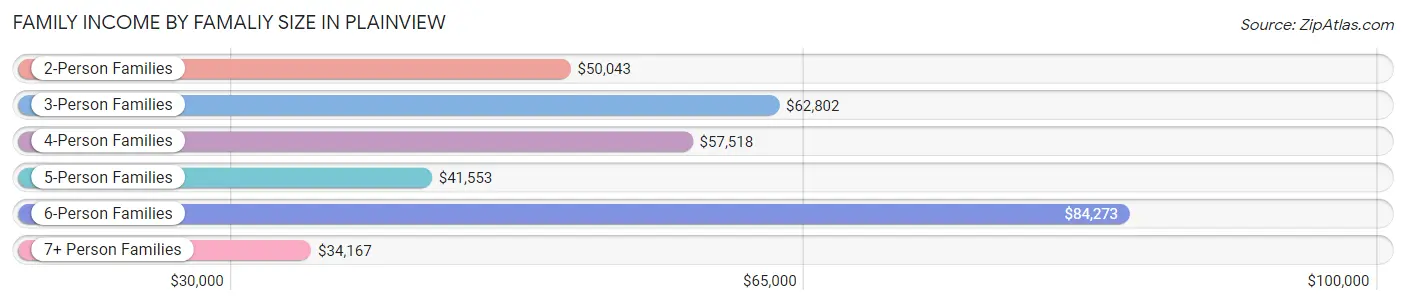
| Income Bracket | # Families | Median Income |
| 2-Person Families | 2,178 (42.6%) | $50,043 |
| 3-Person Families | 960 (18.8%) | $62,802 |
| 4-Person Families | 1,230 (24.1%) | $57,518 |
| 5-Person Families | 445 (8.7%) | $41,553 |
| 6-Person Families | 229 (4.5%) | $84,273 |
| 7+ Person Families | 68 (1.3%) | $34,167 |
| Total | 5,110 (100.0%) | $54,854 |
Family Income by Number of Earners in Plainview
The median family income in Plainview is $54,854, with families comprising 3+ earners (534) having the highest median family income of $102,109, while families with no earners (697) have the lowest median family income of $23,113, accounting for 10.4% and 13.6% of families, respectively.
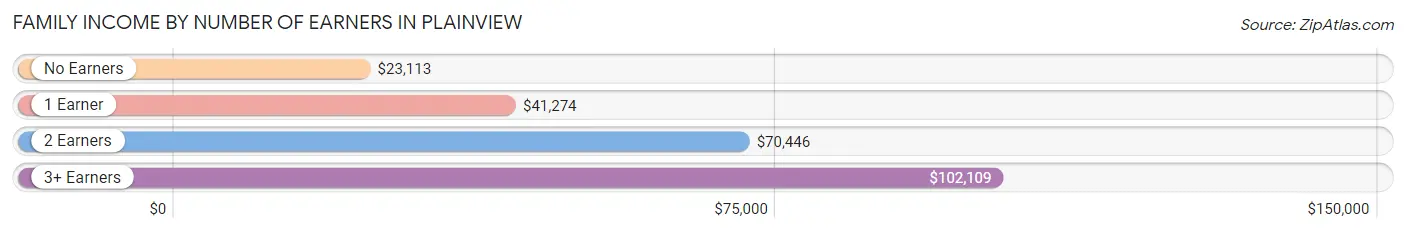
| Number of Earners | # Families | Median Income |
| No Earners | 697 (13.6%) | $23,113 |
| 1 Earner | 2,001 (39.2%) | $41,274 |
| 2 Earners | 1,878 (36.7%) | $70,446 |
| 3+ Earners | 534 (10.4%) | $102,109 |
| Total | 5,110 (100.0%) | $54,854 |
Household Income in Plainview
Household Income Brackets in Plainview
With 1,186 households falling in the category, the $50,000 to $74,999 income range is the most frequent in Plainview, accounting for 16.9% of all households. In contrast, only 210 households (3.0%) fall into the $150,000 to $199,999 income bracket, making it the least populous group.
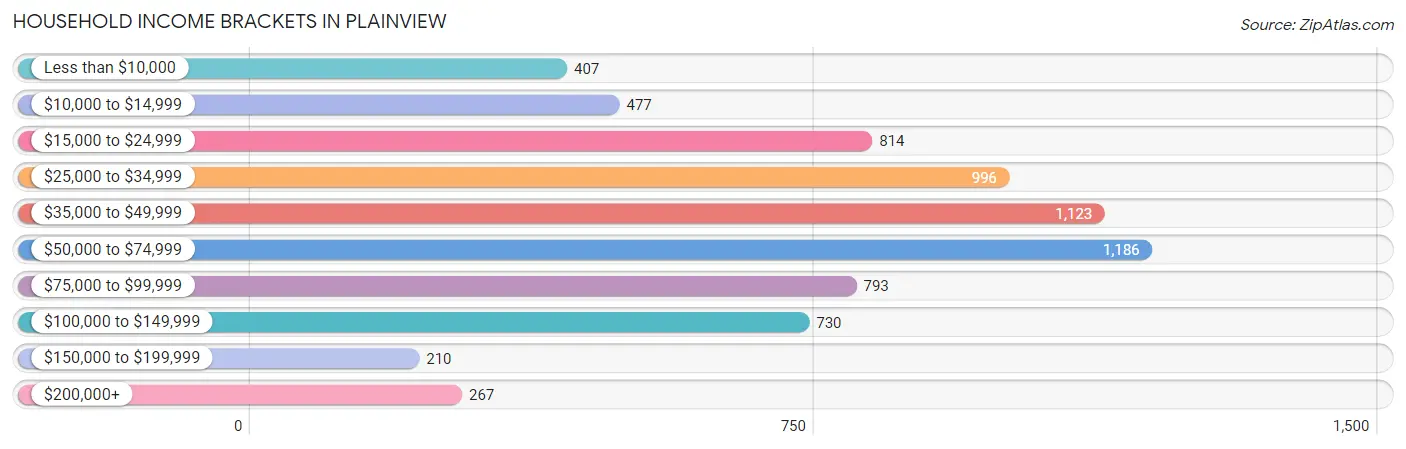
| Income Bracket | # Households | % Households |
| Less than $10,000 | 407 | 5.8% |
| $10,000 to $14,999 | 477 | 6.8% |
| $15,000 to $24,999 | 814 | 11.6% |
| $25,000 to $34,999 | 996 | 14.2% |
| $35,000 to $49,999 | 1,123 | 16.0% |
| $50,000 to $74,999 | 1,186 | 16.9% |
| $75,000 to $99,999 | 793 | 11.3% |
| $100,000 to $149,999 | 730 | 10.4% |
| $150,000 to $199,999 | 210 | 3.0% |
| $200,000+ | 267 | 3.8% |
Household Income by Householder Age in Plainview
The median household income in Plainview is $46,274, with the highest median household income of $59,441 found in the 45 to 64 years age bracket for the primary householder. A total of 2,384 households (34.0%) fall into this category. Meanwhile, the 65+ years age bracket for the primary householder has the lowest median household income of $28,832, with 1,793 households (25.6%) in this group.
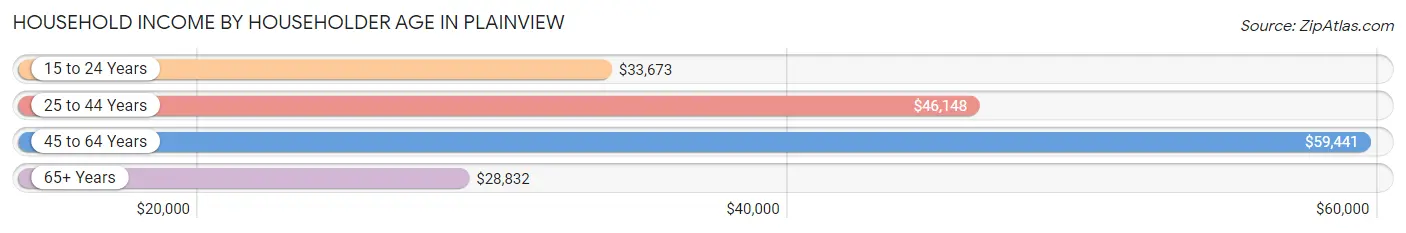
| Income Bracket | # Households | Median Income |
| 15 to 24 Years | 635 (9.0%) | $33,673 |
| 25 to 44 Years | 2,204 (31.4%) | $46,148 |
| 45 to 64 Years | 2,384 (34.0%) | $59,441 |
| 65+ Years | 1,793 (25.6%) | $28,832 |
| Total | 7,016 (100.0%) | $46,274 |
Poverty in Plainview
Income Below Poverty by Sex and Age in Plainview
With 16.8% poverty level for males and 25.9% for females among the residents of Plainview, 5 year old males and 15 year old females are the most vulnerable to poverty, with 69 males (100.0%) and 131 females (64.8%) in their respective age groups living below the poverty level.
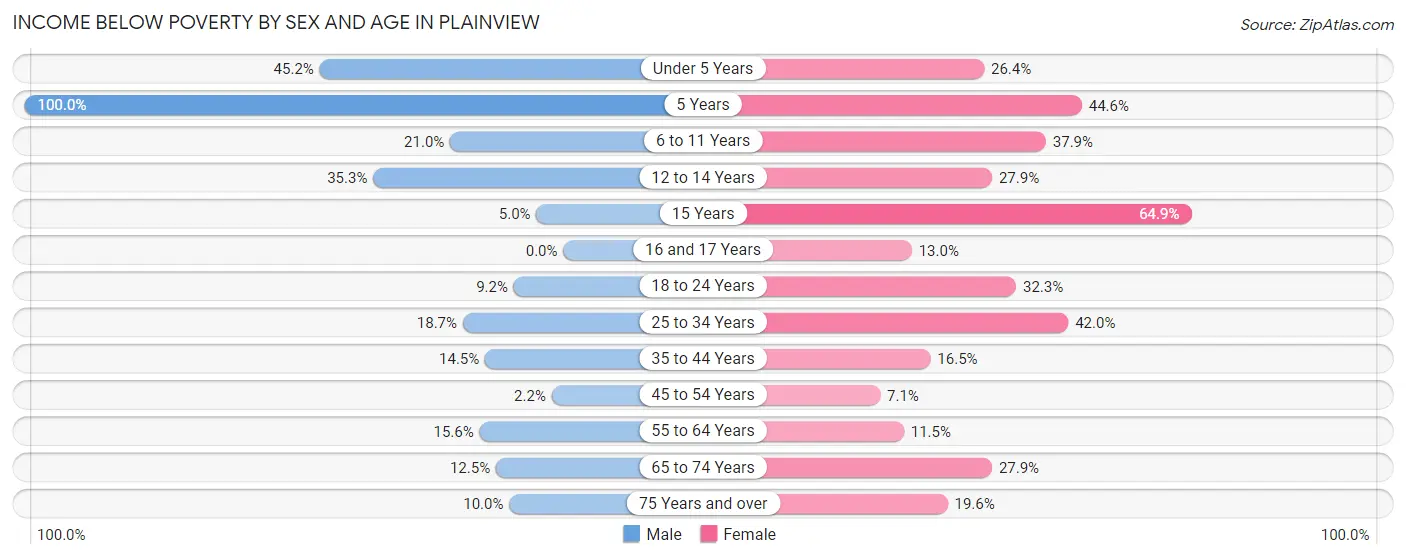
| Age Bracket | Male | Female |
| Under 5 Years | 289 (45.2%) | 179 (26.4%) |
| 5 Years | 69 (100.0%) | 49 (44.6%) |
| 6 to 11 Years | 187 (21.0%) | 511 (37.9%) |
| 12 to 14 Years | 210 (35.3%) | 145 (27.9%) |
| 15 Years | 11 (5.0%) | 131 (64.8%) |
| 16 and 17 Years | 0 (0.0%) | 34 (13.0%) |
| 18 to 24 Years | 117 (9.2%) | 369 (32.3%) |
| 25 to 34 Years | 205 (18.6%) | 485 (42.0%) |
| 35 to 44 Years | 159 (14.5%) | 200 (16.5%) |
| 45 to 54 Years | 22 (2.2%) | 84 (7.1%) |
| 55 to 64 Years | 139 (15.5%) | 106 (11.5%) |
| 65 to 74 Years | 80 (12.5%) | 233 (27.9%) |
| 75 Years and over | 49 (10.0%) | 139 (19.6%) |
| Total | 1,537 (16.8%) | 2,665 (25.9%) |
Income Above Poverty by Sex and Age in Plainview
According to the poverty statistics in Plainview, males aged 16 and 17 years and females aged 45 to 54 years are the age groups that are most secure financially, with 100.0% of males and 92.9% of females in these age groups living above the poverty line.
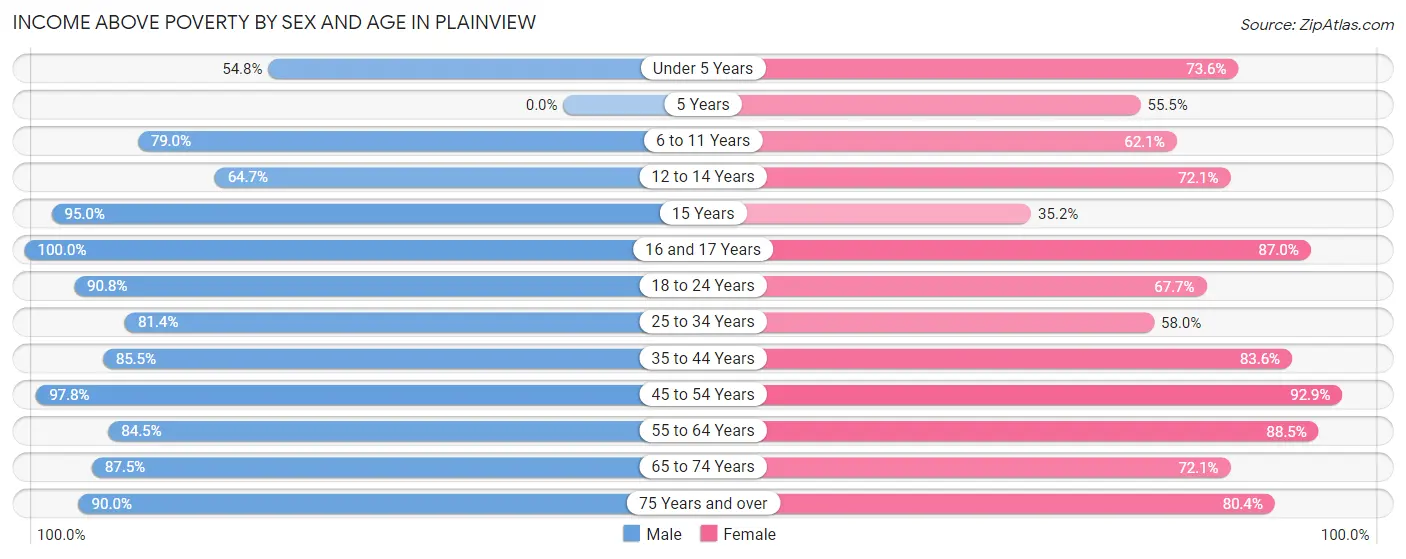
| Age Bracket | Male | Female |
| Under 5 Years | 350 (54.8%) | 499 (73.6%) |
| 5 Years | 0 (0.0%) | 61 (55.4%) |
| 6 to 11 Years | 703 (79.0%) | 838 (62.1%) |
| 12 to 14 Years | 385 (64.7%) | 375 (72.1%) |
| 15 Years | 209 (95.0%) | 71 (35.1%) |
| 16 and 17 Years | 244 (100.0%) | 228 (87.0%) |
| 18 to 24 Years | 1,155 (90.8%) | 772 (67.7%) |
| 25 to 34 Years | 894 (81.4%) | 669 (58.0%) |
| 35 to 44 Years | 936 (85.5%) | 1,016 (83.6%) |
| 45 to 54 Years | 998 (97.8%) | 1,097 (92.9%) |
| 55 to 64 Years | 755 (84.5%) | 816 (88.5%) |
| 65 to 74 Years | 560 (87.5%) | 603 (72.1%) |
| 75 Years and over | 439 (90.0%) | 569 (80.4%) |
| Total | 7,628 (83.2%) | 7,614 (74.1%) |
Income Below Poverty Among Married-Couple Families in Plainview
The poverty statistics for married-couple families in Plainview show that 7.7% or 248 of the total 3,214 families live below the poverty line. Families with 5 or more children have the highest poverty rate of 100.0%, comprising of 16 families. On the other hand, families with 3 or 4 children have the lowest poverty rate of 3.2%, which includes 13 families.
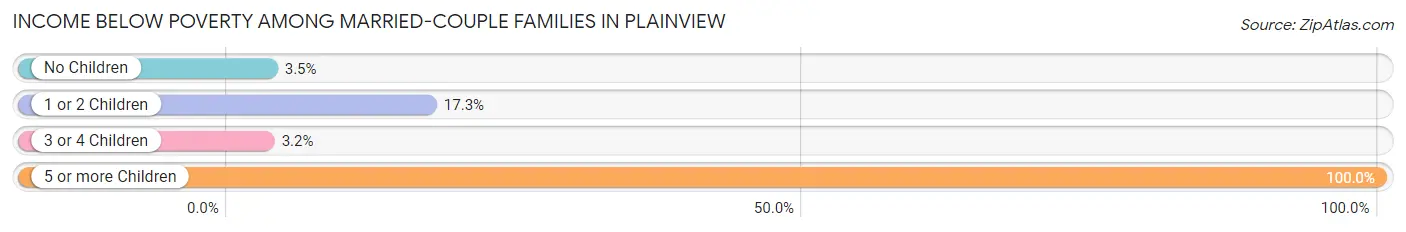
| Children | Above Poverty | Below Poverty |
| No Children | 1,841 (96.5%) | 66 (3.5%) |
| 1 or 2 Children | 731 (82.7%) | 153 (17.3%) |
| 3 or 4 Children | 394 (96.8%) | 13 (3.2%) |
| 5 or more Children | 0 (0.0%) | 16 (100.0%) |
| Total | 2,966 (92.3%) | 248 (7.7%) |
Income Below Poverty Among Single-Parent Households in Plainview
According to the poverty data in Plainview, 10.2% or 34 single-father households and 41.6% or 650 single-mother households are living below the poverty line. Among single-father households, those with no children have the highest poverty rate, with 7 households (13.2%) experiencing poverty. Likewise, among single-mother households, those with 3 or 4 children have the highest poverty rate, with 375 households (95.7%) falling below the poverty line.
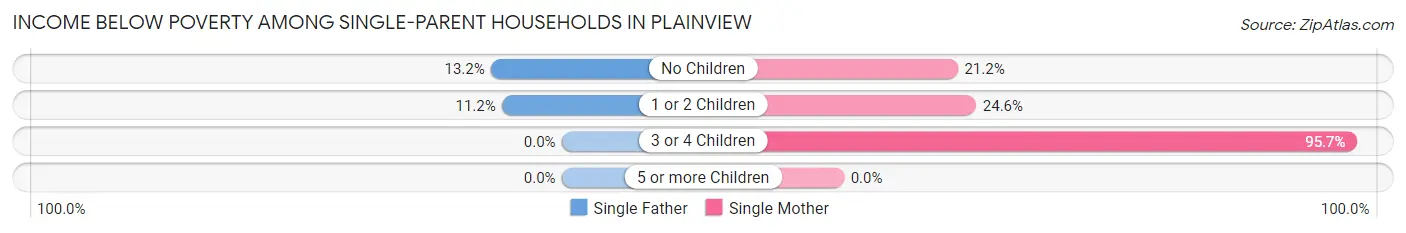
| Children | Single Father | Single Mother |
| No Children | 7 (13.2%) | 81 (21.2%) |
| 1 or 2 Children | 27 (11.2%) | 194 (24.6%) |
| 3 or 4 Children | 0 (0.0%) | 375 (95.7%) |
| 5 or more Children | 0 (0.0%) | 0 (0.0%) |
| Total | 34 (10.2%) | 650 (41.6%) |
Income Below Poverty Among Married-Couple vs Single-Parent Households in Plainview
The poverty data for Plainview shows that 248 of the married-couple family households (7.7%) and 684 of the single-parent households (36.1%) are living below the poverty level. Within the married-couple family households, those with 5 or more children have the highest poverty rate, with 16 households (100.0%) falling below the poverty line. Among the single-parent households, those with 3 or 4 children have the highest poverty rate, with 375 household (87.0%) living below poverty.
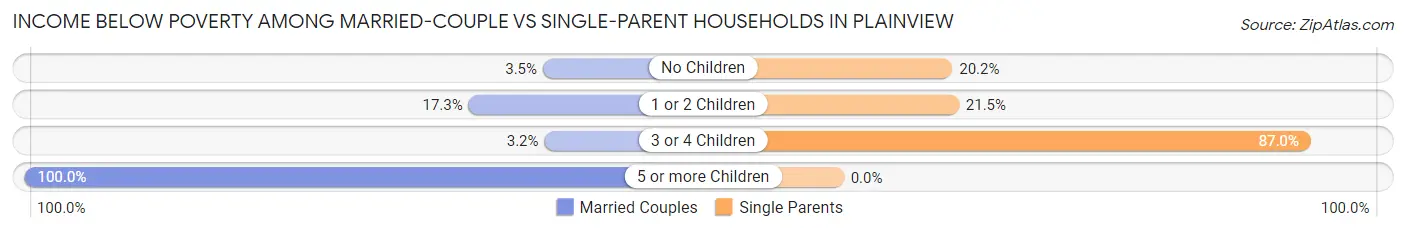
| Children | Married-Couple Families | Single-Parent Households |
| No Children | 66 (3.5%) | 88 (20.2%) |
| 1 or 2 Children | 153 (17.3%) | 221 (21.5%) |
| 3 or 4 Children | 13 (3.2%) | 375 (87.0%) |
| 5 or more Children | 16 (100.0%) | 0 (0.0%) |
| Total | 248 (7.7%) | 684 (36.1%) |
Race in Plainview
The most populous races in Plainview are Hispanic or Latino (13,377 | 66.5%), White / Caucasian (13,068 | 65.0%), and Two or more Races (3,894 | 19.4%).
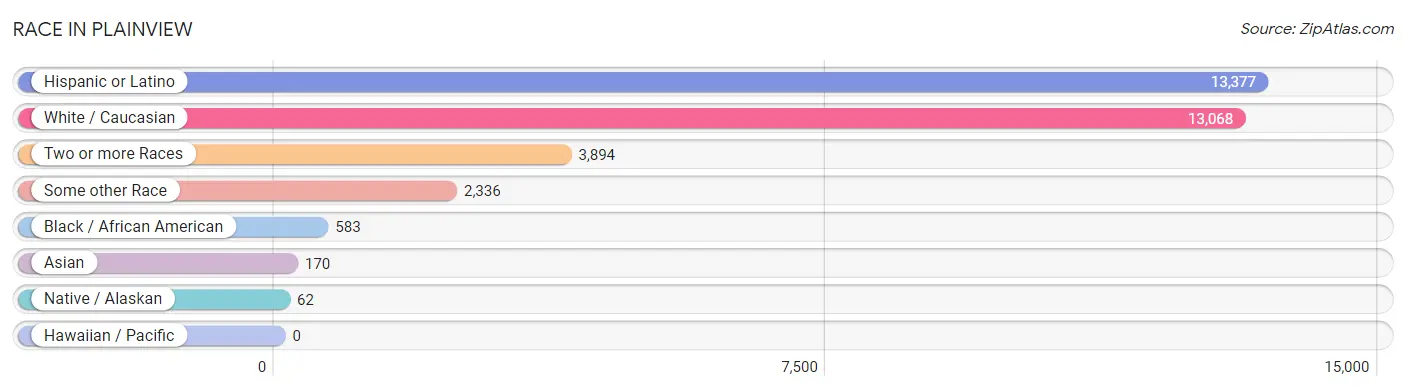
| Race | # Population | % Population |
| Asian | 170 | 0.9% |
| Black / African American | 583 | 2.9% |
| Hawaiian / Pacific | 0 | 0.0% |
| Hispanic or Latino | 13,377 | 66.5% |
| Native / Alaskan | 62 | 0.3% |
| White / Caucasian | 13,068 | 65.0% |
| Two or more Races | 3,894 | 19.4% |
| Some other Race | 2,336 | 11.6% |
| Total | 20,113 | 100.0% |
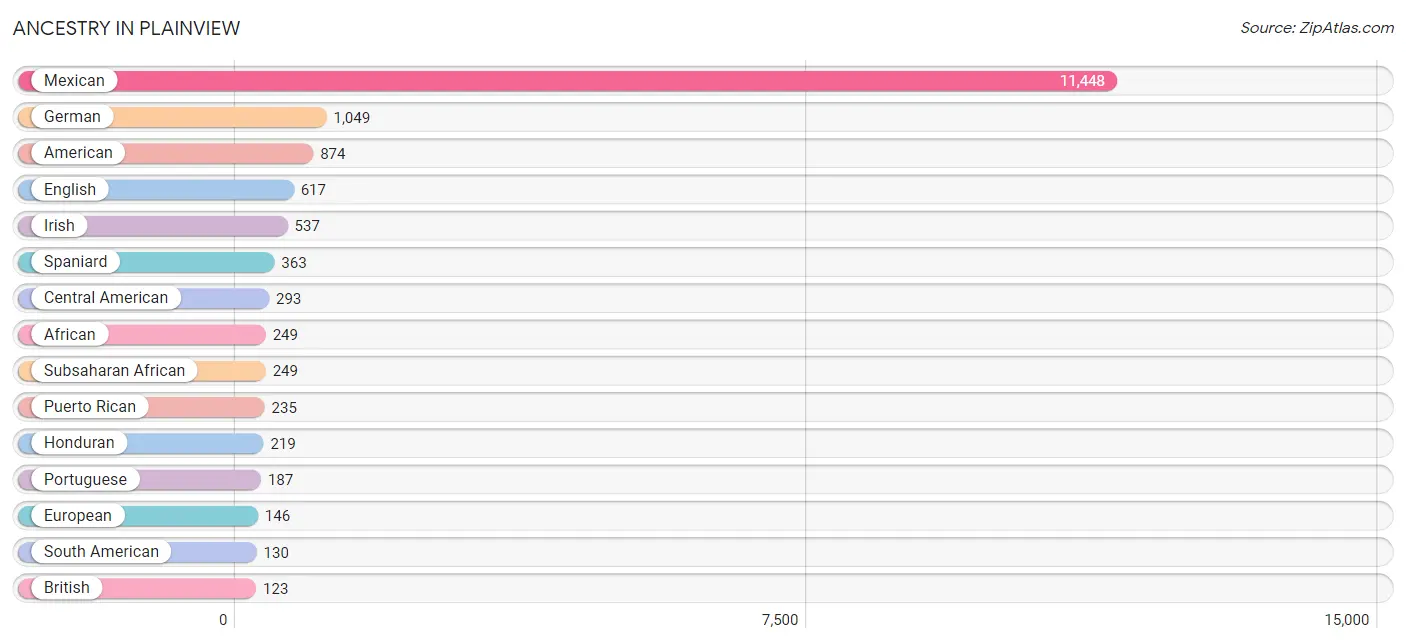
Ancestry in Plainview
The most populous ancestries reported in Plainview are Mexican (11,448 | 56.9%), German (1,049 | 5.2%), American (874 | 4.3%), English (617 | 3.1%), and Irish (537 | 2.7%), together accounting for 72.2% of all Plainview residents.
| Ancestry | # Population | % Population |
| African | 249 | 1.2% |
| American | 874 | 4.3% |
| Arab | 86 | 0.4% |
| Argentinean | 85 | 0.4% |
| Bhutanese | 3 | 0.0% |
| British | 123 | 0.6% |
| Burmese | 10 | 0.1% |
| Central American | 293 | 1.5% |
| Central American Indian | 28 | 0.1% |
| Cherokee | 41 | 0.2% |
| Chickasaw | 3 | 0.0% |
| Colombian | 45 | 0.2% |
| Comanche | 5 | 0.0% |
| Creek | 45 | 0.2% |
| Cuban | 7 | 0.0% |
| Czech | 18 | 0.1% |
| Dutch | 71 | 0.4% |
| Egyptian | 20 | 0.1% |
| English | 617 | 3.1% |
| European | 146 | 0.7% |
| French | 104 | 0.5% |
| German | 1,049 | 5.2% |
| Guatemalan | 21 | 0.1% |
| Haitian | 32 | 0.2% |
| Honduran | 219 | 1.1% |
| Hungarian | 9 | 0.0% |
| Indian (Asian) | 27 | 0.1% |
| Irish | 537 | 2.7% |
| Italian | 107 | 0.5% |
| Jamaican | 55 | 0.3% |
| Korean | 85 | 0.4% |
| Mexican | 11,448 | 56.9% |
| Mexican American Indian | 17 | 0.1% |
| Native Hawaiian | 34 | 0.2% |
| Navajo | 76 | 0.4% |
| Norwegian | 31 | 0.2% |
| Polish | 76 | 0.4% |
| Portuguese | 187 | 0.9% |
| Puerto Rican | 235 | 1.2% |
| Salvadoran | 53 | 0.3% |
| Scandinavian | 13 | 0.1% |
| Scotch-Irish | 34 | 0.2% |
| Scottish | 49 | 0.2% |
| Sioux | 5 | 0.0% |
| South American | 130 | 0.6% |
| Spaniard | 363 | 1.8% |
| Spanish | 60 | 0.3% |
| Sri Lankan | 6 | 0.0% |
| Subsaharan African | 249 | 1.2% |
| Swedish | 56 | 0.3% |
| Ukrainian | 16 | 0.1% |
| Welsh | 21 | 0.1% | View All 52 Rows |
Immigrants in Plainview
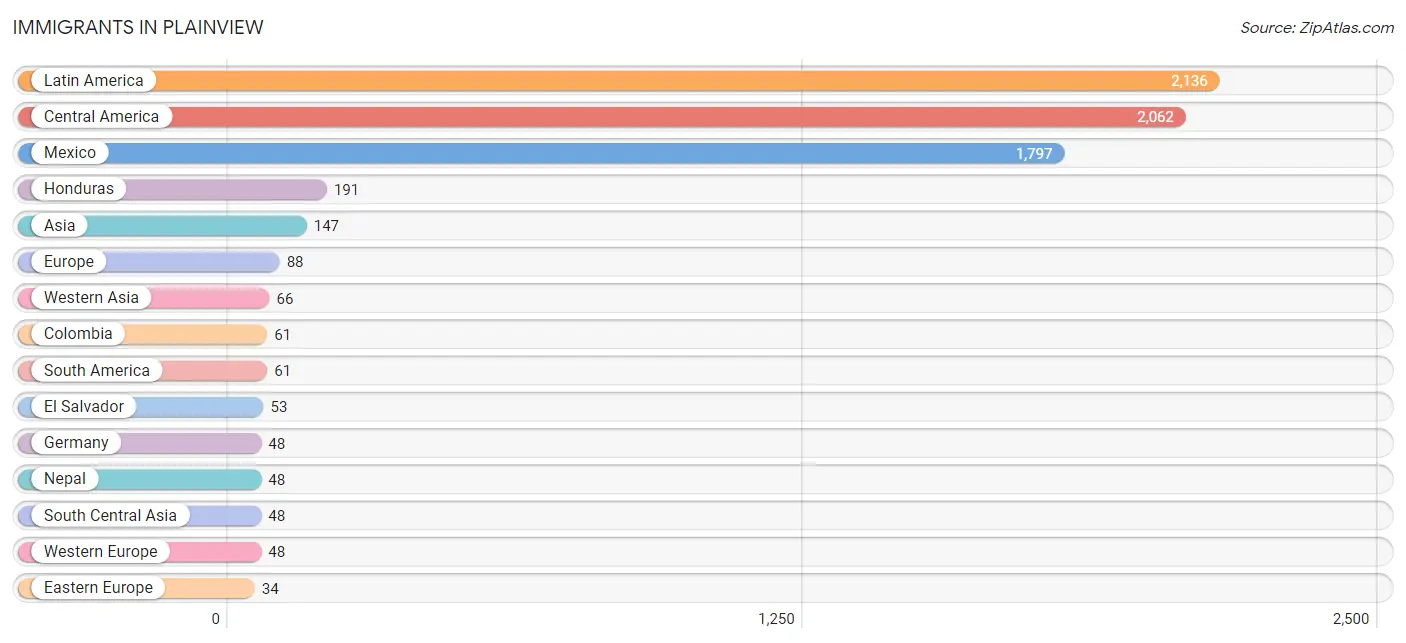
The most numerous immigrant groups reported in Plainview came from Latin America (2,136 | 10.6%), Central America (2,062 | 10.2%), Mexico (1,797 | 8.9%), Honduras (191 | 0.9%), and Asia (147 | 0.7%), together accounting for 31.5% of all Plainview residents.
| Immigration Origin | # Population | % Population |
| Asia | 147 | 0.7% |
| Caribbean | 13 | 0.1% |
| Central America | 2,062 | 10.2% |
| China | 13 | 0.1% |
| Colombia | 61 | 0.3% |
| Cuba | 7 | 0.0% |
| Eastern Asia | 23 | 0.1% |
| Eastern Europe | 34 | 0.2% |
| El Salvador | 53 | 0.3% |
| England | 3 | 0.0% |
| Europe | 88 | 0.4% |
| Germany | 48 | 0.2% |
| Guatemala | 21 | 0.1% |
| Honduras | 191 | 0.9% |
| Jamaica | 6 | 0.0% |
| Korea | 10 | 0.1% |
| Latin America | 2,136 | 10.6% |
| Mexico | 1,797 | 8.9% |
| Nepal | 48 | 0.2% |
| Northern Europe | 3 | 0.0% |
| Philippines | 10 | 0.1% |
| Poland | 34 | 0.2% |
| South America | 61 | 0.3% |
| South Central Asia | 48 | 0.2% |
| South Eastern Asia | 10 | 0.1% |
| Southern Europe | 3 | 0.0% |
| Spain | 3 | 0.0% |
| Western Asia | 66 | 0.3% |
| Western Europe | 48 | 0.2% | View All 29 Rows |
Sex and Age in Plainview
Sex and Age in Plainview
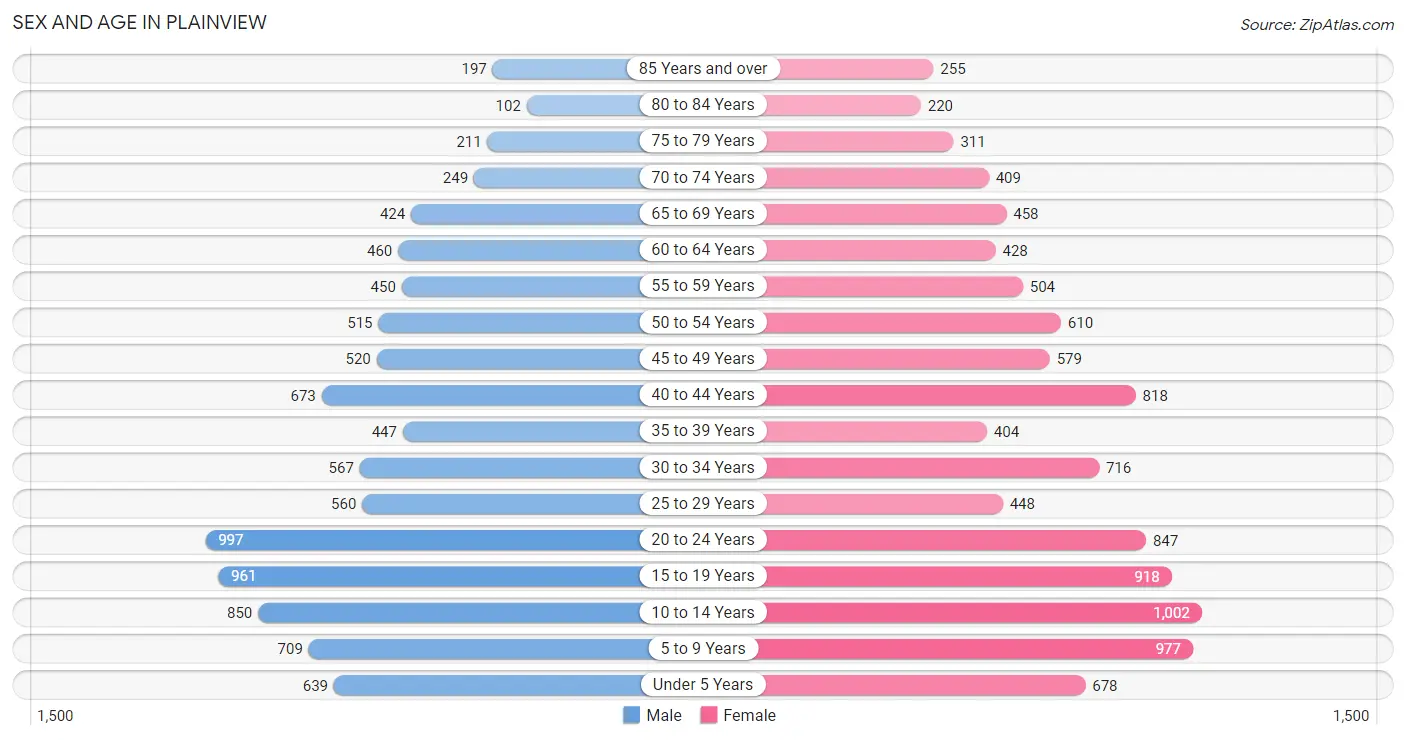
The most populous age groups in Plainview are 20 to 24 Years (997 | 10.5%) for men and 10 to 14 Years (1,002 | 9.5%) for women.
| Age Bracket | Male | Female |
| Under 5 Years | 639 (6.7%) | 678 (6.4%) |
| 5 to 9 Years | 709 (7.4%) | 977 (9.2%) |
| 10 to 14 Years | 850 (8.9%) | 1,002 (9.5%) |
| 15 to 19 Years | 961 (10.1%) | 918 (8.7%) |
| 20 to 24 Years | 997 (10.5%) | 847 (8.0%) |
| 25 to 29 Years | 560 (5.9%) | 448 (4.2%) |
| 30 to 34 Years | 567 (5.9%) | 716 (6.8%) |
| 35 to 39 Years | 447 (4.7%) | 404 (3.8%) |
| 40 to 44 Years | 673 (7.1%) | 818 (7.7%) |
| 45 to 49 Years | 520 (5.5%) | 579 (5.5%) |
| 50 to 54 Years | 515 (5.4%) | 610 (5.8%) |
| 55 to 59 Years | 450 (4.7%) | 504 (4.8%) |
| 60 to 64 Years | 460 (4.8%) | 428 (4.0%) |
| 65 to 69 Years | 424 (4.4%) | 458 (4.3%) |
| 70 to 74 Years | 249 (2.6%) | 409 (3.9%) |
| 75 to 79 Years | 211 (2.2%) | 311 (2.9%) |
| 80 to 84 Years | 102 (1.1%) | 220 (2.1%) |
| 85 Years and over | 197 (2.1%) | 255 (2.4%) |
| Total | 9,531 (100.0%) | 10,582 (100.0%) |
Families and Households in Plainview
Median Family Size in Plainview
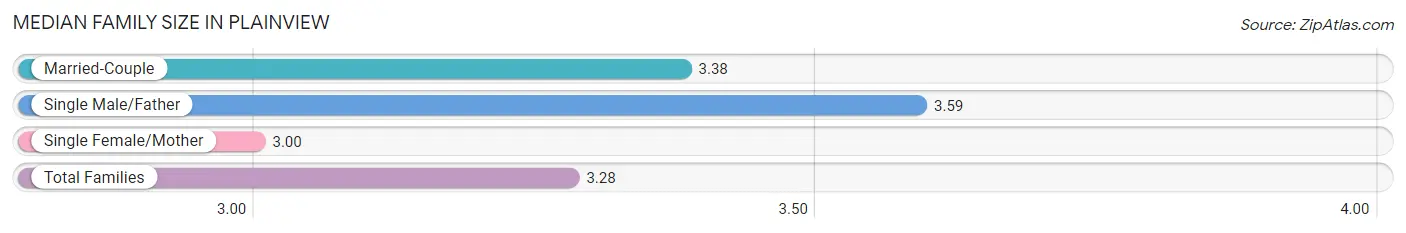
The median family size in Plainview is 3.28 persons per family, with single male/father families (334 | 6.5%) accounting for the largest median family size of 3.59 persons per family. On the other hand, single female/mother families (1,562 | 30.6%) represent the smallest median family size with 3.00 persons per family.
| Family Type | # Families | Family Size |
| Married-Couple | 3,214 (62.9%) | 3.38 |
| Single Male/Father | 334 (6.5%) | 3.59 |
| Single Female/Mother | 1,562 (30.6%) | 3.00 |
| Total Families | 5,110 (100.0%) | 3.28 |
Median Household Size in Plainview
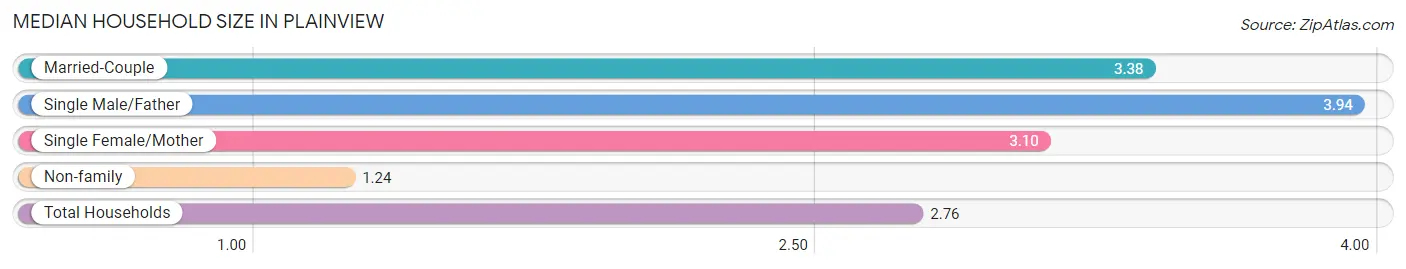
The median household size in Plainview is 2.76 persons per household, with single male/father households (334 | 4.8%) accounting for the largest median household size of 3.94 persons per household. non-family households (1,906 | 27.2%) represent the smallest median household size with 1.24 persons per household.
| Household Type | # Households | Household Size |
| Married-Couple | 3,214 (45.8%) | 3.38 |
| Single Male/Father | 334 (4.8%) | 3.94 |
| Single Female/Mother | 1,562 (22.3%) | 3.10 |
| Non-family | 1,906 (27.2%) | 1.24 |
| Total Households | 7,016 (100.0%) | 2.76 |
Household Size by Marriage Status in Plainview
Out of a total of 7,016 households in Plainview, 5,110 (72.8%) are family households, while 1,906 (27.2%) are nonfamily households. The most numerous type of family households are 2-person households, comprising 2,006, and the most common type of nonfamily households are 1-person households, comprising 1,651.
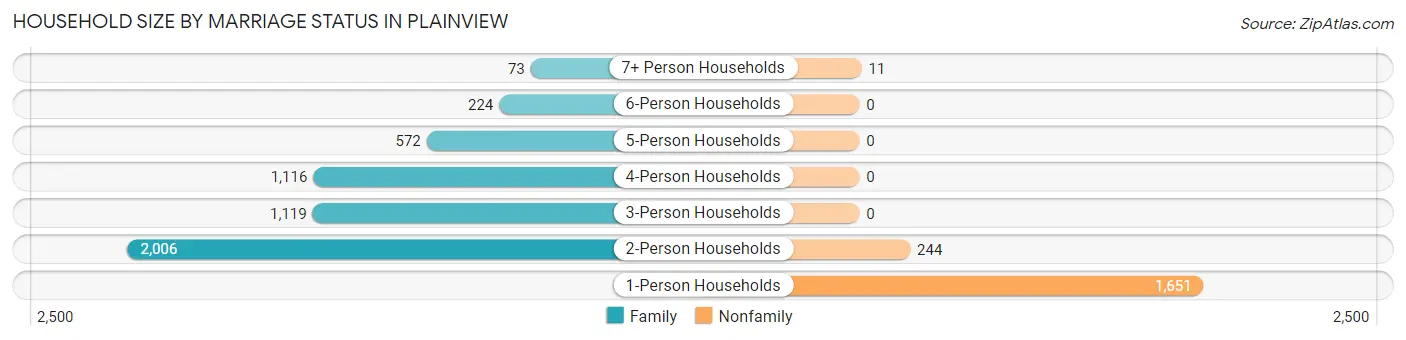
| Household Size | Family Households | Nonfamily Households |
| 1-Person Households | - | 1,651 (23.5%) |
| 2-Person Households | 2,006 (28.6%) | 244 (3.5%) |
| 3-Person Households | 1,119 (16.0%) | 0 (0.0%) |
| 4-Person Households | 1,116 (15.9%) | 0 (0.0%) |
| 5-Person Households | 572 (8.2%) | 0 (0.0%) |
| 6-Person Households | 224 (3.2%) | 0 (0.0%) |
| 7+ Person Households | 73 (1.0%) | 11 (0.2%) |
| Total | 5,110 (72.8%) | 1,906 (27.2%) |
Female Fertility in Plainview
Fertility by Age in Plainview
Average fertility rate in Plainview is 61.0 births per 1,000 women. Women in the age bracket of 20 to 34 years have the highest fertility rate with 117.0 births per 1,000 women. Women in the age bracket of 20 to 34 years acount for 80.2% of all women with births.
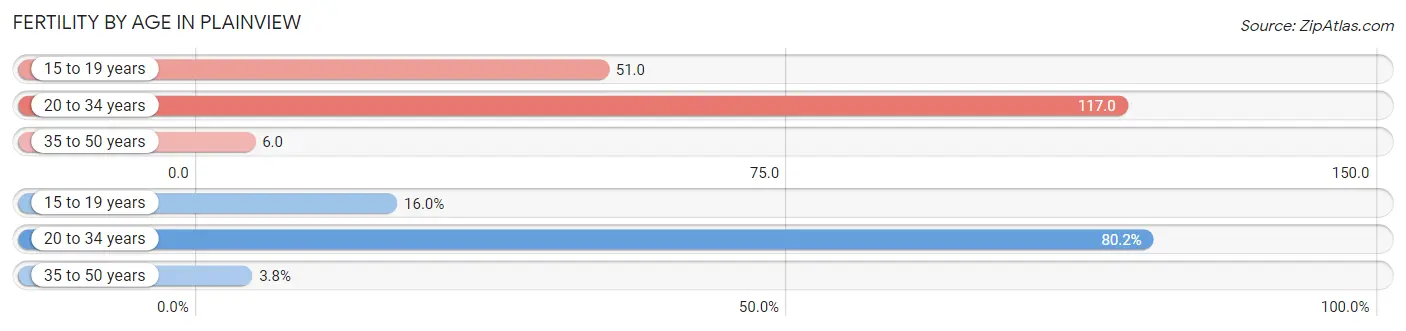
| Age Bracket | Women with Births | Births / 1,000 Women |
| 15 to 19 years | 47 (16.0%) | 51.0 |
| 20 to 34 years | 235 (80.2%) | 117.0 |
| 35 to 50 years | 11 (3.7%) | 6.0 |
| Total | 293 (100.0%) | 61.0 |
Fertility by Age by Marriage Status in Plainview
31.7% of women with births (293) in Plainview are married. The highest percentage of unmarried women with births falls into 20 to 34 years age bracket with 85.1% of them unmarried at the time of birth, while the lowest percentage of unmarried women with births belong to 15 to 19 years age bracket with 0.0% of them unmarried.
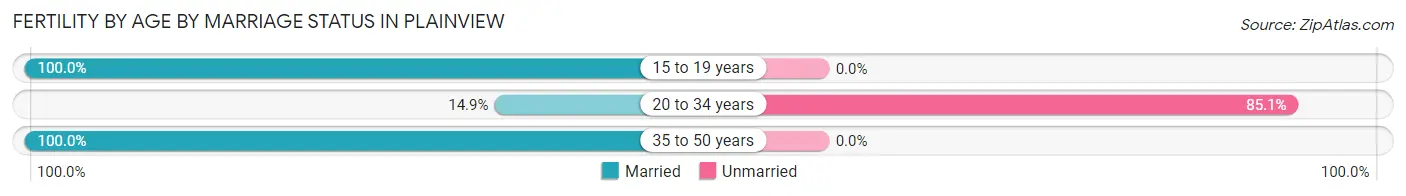
| Age Bracket | Married | Unmarried |
| 15 to 19 years | 47 (100.0%) | 0 (0.0%) |
| 20 to 34 years | 35 (14.9%) | 200 (85.1%) |
| 35 to 50 years | 11 (100.0%) | 0 (0.0%) |
| Total | 93 (31.7%) | 200 (68.3%) |
Fertility by Education in Plainview
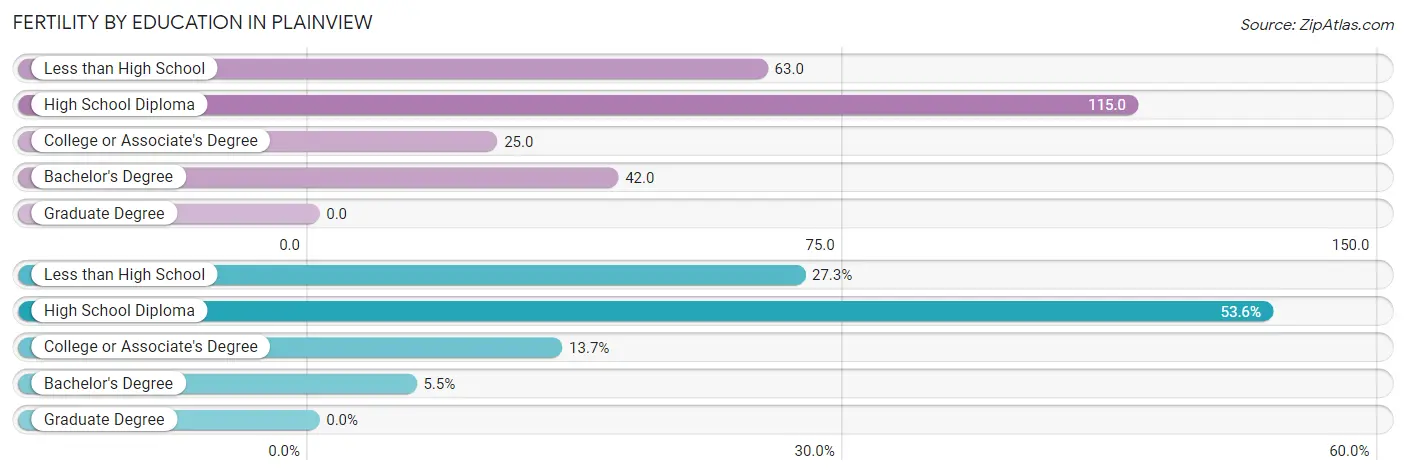
| Educational Attainment | Women with Births | Births / 1,000 Women |
| Less than High School | 80 (27.3%) | 63.0 |
| High School Diploma | 157 (53.6%) | 115.0 |
| College or Associate's Degree | 40 (13.7%) | 25.0 |
| Bachelor's Degree | 16 (5.5%) | 42.0 |
| Graduate Degree | 0 (0.0%) | 0.0 |
| Total | 293 (100.0%) | 61.0 |
Fertility by Education by Marriage Status in Plainview
68.3% of women with births in Plainview are unmarried. Women with the educational attainment of bachelor's degree are most likely to be married with 100.0% of them married at childbirth, while women with the educational attainment of less than high school are least likely to be married with 100.0% of them unmarried at childbirth.
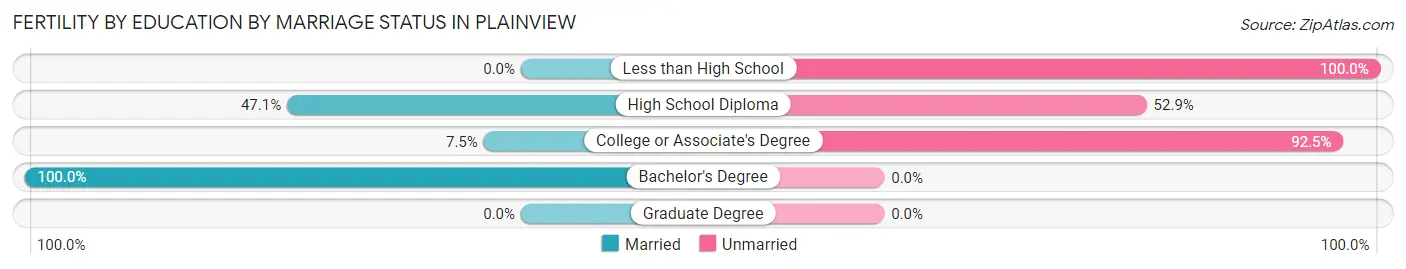
| Educational Attainment | Married | Unmarried |
| Less than High School | 0 (0.0%) | 80 (100.0%) |
| High School Diploma | 74 (47.1%) | 83 (52.9%) |
| College or Associate's Degree | 3 (7.5%) | 37 (92.5%) |
| Bachelor's Degree | 16 (100.0%) | 0 (0.0%) |
| Graduate Degree | 0 (0.0%) | 0 (0.0%) |
| Total | 93 (31.7%) | 200 (68.3%) |
Employment Characteristics in Plainview
Employment by Class of Employer in Plainview
Among the 8,737 employed individuals in Plainview, private company employees (6,030 | 69.0%), local government employees (831 | 9.5%), and state government employees (566 | 6.5%) make up the most common classes of employment.
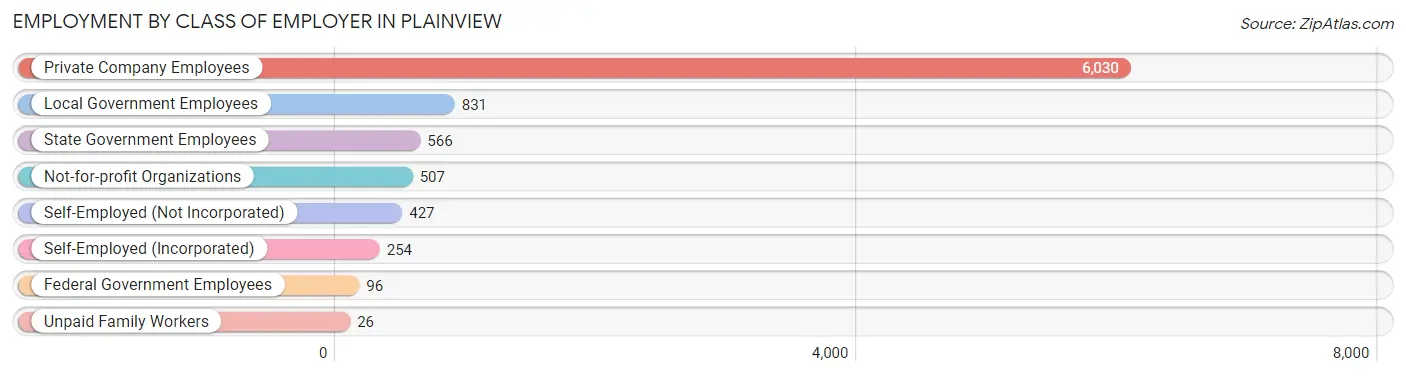
| Employer Class | # Employees | % Employees |
| Private Company Employees | 6,030 | 69.0% |
| Self-Employed (Incorporated) | 254 | 2.9% |
| Self-Employed (Not Incorporated) | 427 | 4.9% |
| Not-for-profit Organizations | 507 | 5.8% |
| Local Government Employees | 831 | 9.5% |
| State Government Employees | 566 | 6.5% |
| Federal Government Employees | 96 | 1.1% |
| Unpaid Family Workers | 26 | 0.3% |
| Total | 8,737 | 100.0% |
Employment Status by Age in Plainview
According to the labor force statistics for Plainview, out of the total population over 16 years of age (14,836), 64.1% or 9,510 individuals are in the labor force, with 6.6% or 628 of them unemployed. The age group with the highest labor force participation rate is 25 to 29 years, with 90.6% or 913 individuals in the labor force. Within the labor force, the 16 to 19 years age range has the highest percentage of unemployed individuals, with 26.8% or 198 of them being unemployed.
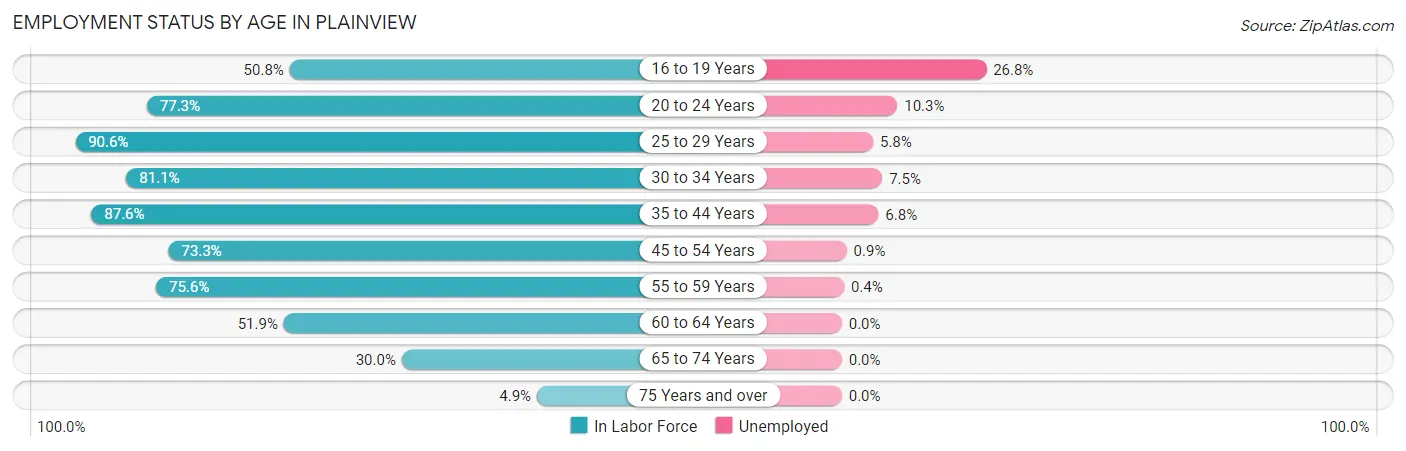
| Age Bracket | In Labor Force | Unemployed |
| 16 to 19 Years | 740 (50.8%) | 198 (26.8%) |
| 20 to 24 Years | 1,425 (77.3%) | 147 (10.3%) |
| 25 to 29 Years | 913 (90.6%) | 53 (5.8%) |
| 30 to 34 Years | 1,041 (81.1%) | 78 (7.5%) |
| 35 to 44 Years | 2,052 (87.6%) | 140 (6.8%) |
| 45 to 54 Years | 1,630 (73.3%) | 15 (0.9%) |
| 55 to 59 Years | 721 (75.6%) | 3 (0.4%) |
| 60 to 64 Years | 461 (51.9%) | 0 (0.0%) |
| 65 to 74 Years | 462 (30.0%) | 0 (0.0%) |
| 75 Years and over | 64 (4.9%) | 0 (0.0%) |
| Total | 9,510 (64.1%) | 628 (6.6%) |
Employment Status by Educational Attainment in Plainview
According to labor force statistics for Plainview, 78.4% of individuals (6,820) out of the total population between 25 and 64 years of age (8,699) are in the labor force, with 4.2% or 286 of them being unemployed. The group with the highest labor force participation rate are those with the educational attainment of bachelor's degree or higher, with 82.8% or 963 individuals in the labor force. Within the labor force, individuals with high school diploma education have the highest percentage of unemployment, with 7.0% or 161 of them being unemployed.
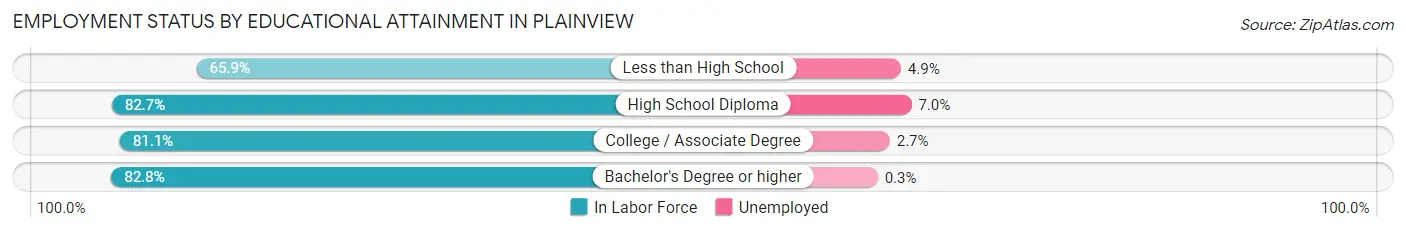
| Educational Attainment | In Labor Force | Unemployed |
| Less than High School | 1,317 (65.9%) | 98 (4.9%) |
| High School Diploma | 2,300 (82.7%) | 195 (7.0%) |
| College / Associate Degree | 2,235 (81.1%) | 74 (2.7%) |
| Bachelor's Degree or higher | 963 (82.8%) | 3 (0.3%) |
| Total | 6,820 (78.4%) | 365 (4.2%) |
Employment Occupations by Sex in Plainview
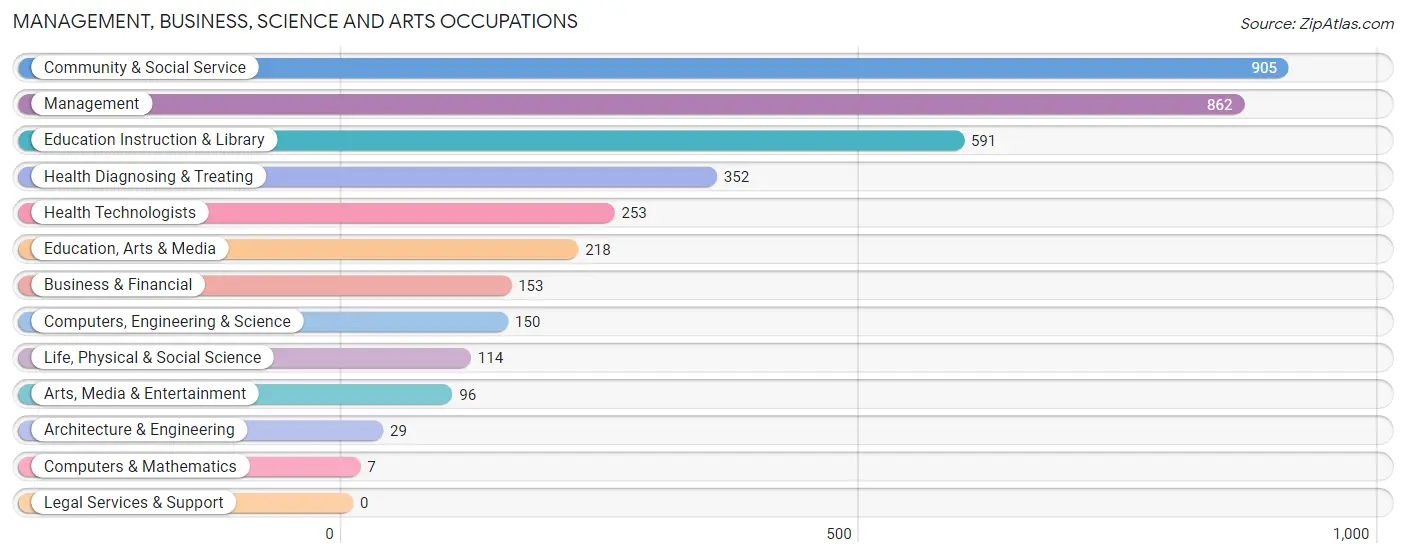
Management, Business, Science and Arts Occupations
The most common Management, Business, Science and Arts occupations in Plainview are Community & Social Service (905 | 10.2%), Management (862 | 9.7%), Education Instruction & Library (591 | 6.7%), Health Diagnosing & Treating (352 | 4.0%), and Health Technologists (253 | 2.9%).
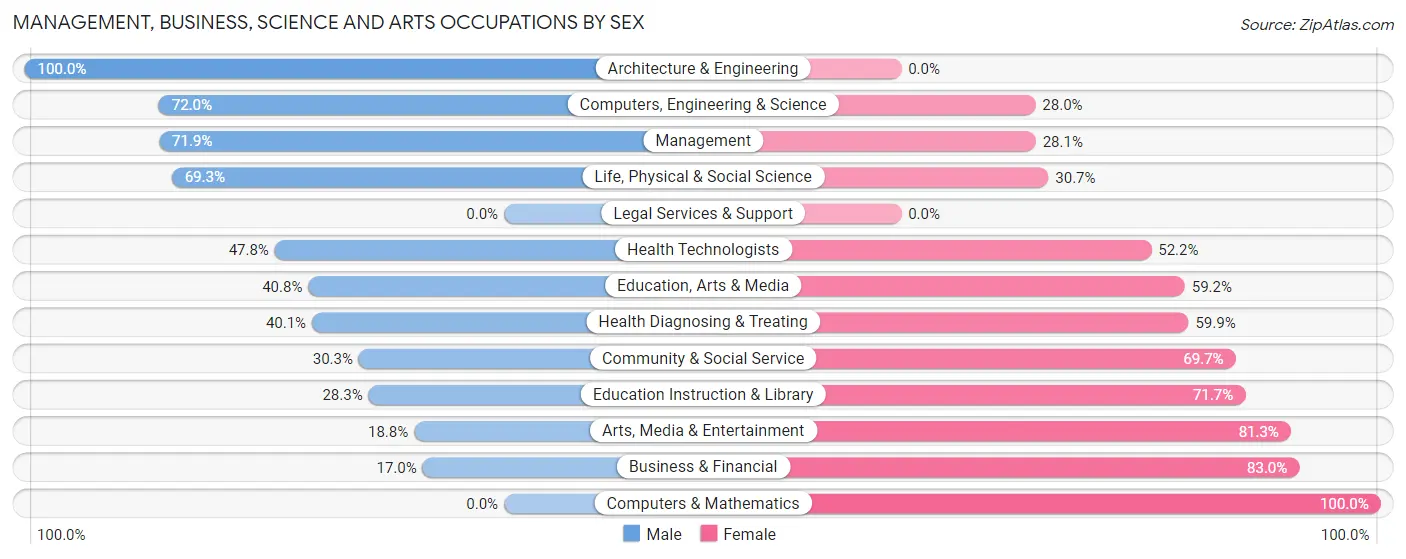
Management, Business, Science and Arts Occupations by Sex
Within the Management, Business, Science and Arts occupations in Plainview, the most male-oriented occupations are Architecture & Engineering (100.0%), Computers, Engineering & Science (72.0%), and Management (71.9%), while the most female-oriented occupations are Computers & Mathematics (100.0%), Business & Financial (83.0%), and Arts, Media & Entertainment (81.2%).
| Occupation | Male | Female |
| Management | 620 (71.9%) | 242 (28.1%) |
| Business & Financial | 26 (17.0%) | 127 (83.0%) |
| Computers, Engineering & Science | 108 (72.0%) | 42 (28.0%) |
| Computers & Mathematics | 0 (0.0%) | 7 (100.0%) |
| Architecture & Engineering | 29 (100.0%) | 0 (0.0%) |
| Life, Physical & Social Science | 79 (69.3%) | 35 (30.7%) |
| Community & Social Service | 274 (30.3%) | 631 (69.7%) |
| Education, Arts & Media | 89 (40.8%) | 129 (59.2%) |
| Legal Services & Support | 0 (0.0%) | 0 (0.0%) |
| Education Instruction & Library | 167 (28.3%) | 424 (71.7%) |
| Arts, Media & Entertainment | 18 (18.8%) | 78 (81.2%) |
| Health Diagnosing & Treating | 141 (40.1%) | 211 (59.9%) |
| Health Technologists | 121 (47.8%) | 132 (52.2%) |
| Total (Category) | 1,169 (48.3%) | 1,253 (51.7%) |
| Total (Overall) | 4,859 (54.8%) | 4,000 (45.2%) |
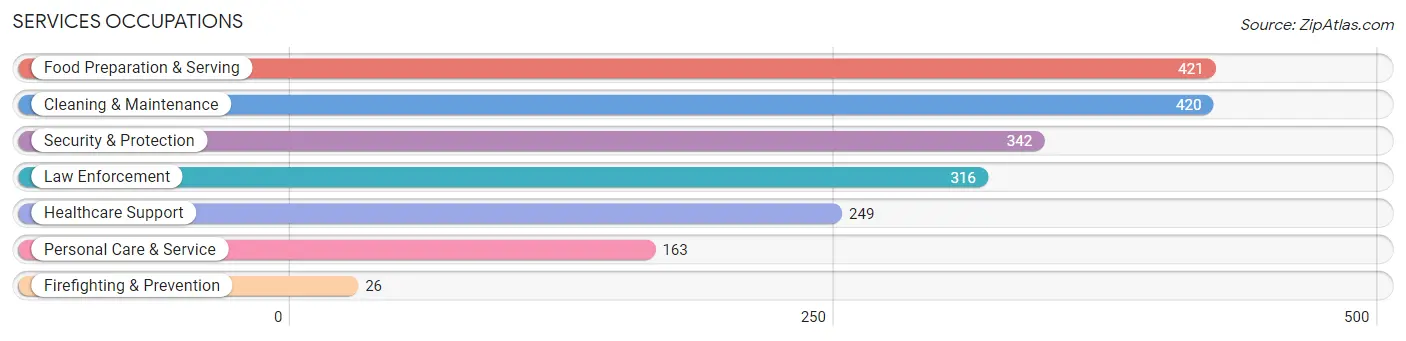
Services Occupations
The most common Services occupations in Plainview are Food Preparation & Serving (421 | 4.8%), Cleaning & Maintenance (420 | 4.7%), Security & Protection (342 | 3.9%), Law Enforcement (316 | 3.6%), and Healthcare Support (249 | 2.8%).
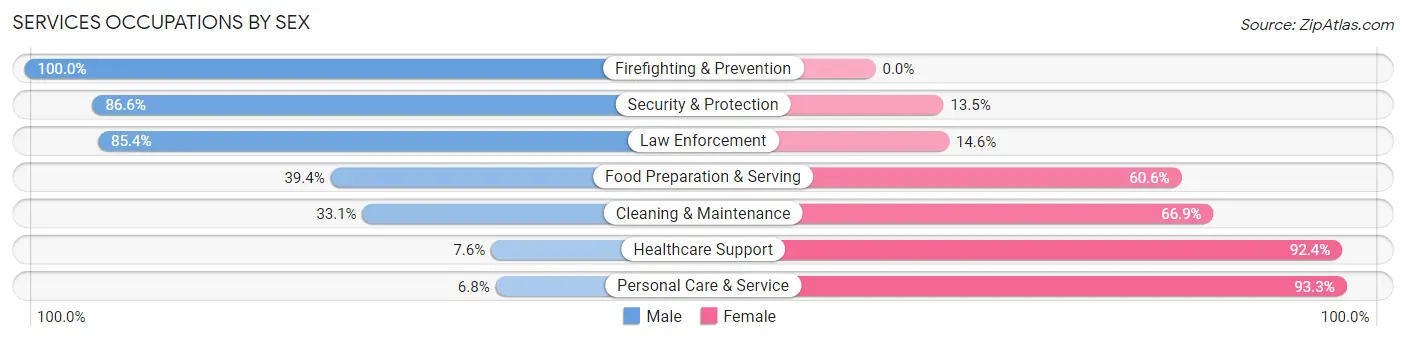
Services Occupations by Sex
Within the Services occupations in Plainview, the most male-oriented occupations are Firefighting & Prevention (100.0%), Security & Protection (86.6%), and Law Enforcement (85.4%), while the most female-oriented occupations are Personal Care & Service (93.2%), Healthcare Support (92.4%), and Cleaning & Maintenance (66.9%).
| Occupation | Male | Female |
| Healthcare Support | 19 (7.6%) | 230 (92.4%) |
| Security & Protection | 296 (86.6%) | 46 (13.5%) |
| Firefighting & Prevention | 26 (100.0%) | 0 (0.0%) |
| Law Enforcement | 270 (85.4%) | 46 (14.6%) |
| Food Preparation & Serving | 166 (39.4%) | 255 (60.6%) |
| Cleaning & Maintenance | 139 (33.1%) | 281 (66.9%) |
| Personal Care & Service | 11 (6.8%) | 152 (93.2%) |
| Total (Category) | 631 (39.6%) | 964 (60.4%) |
| Total (Overall) | 4,859 (54.8%) | 4,000 (45.2%) |
Sales and Office Occupations
The most common Sales and Office occupations in Plainview are Sales & Related (1,032 | 11.7%), and Office & Administration (918 | 10.4%).
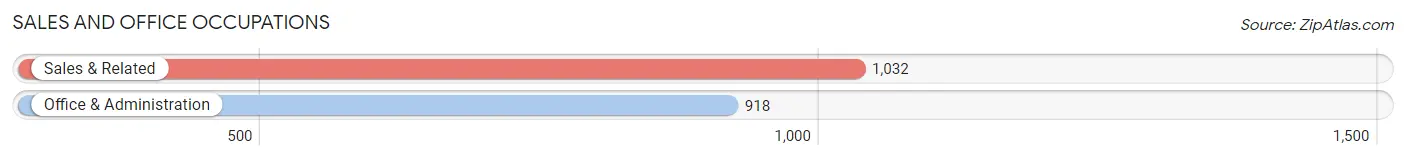
Sales and Office Occupations by Sex

| Occupation | Male | Female |
| Sales & Related | 418 (40.5%) | 614 (59.5%) |
| Office & Administration | 121 (13.2%) | 797 (86.8%) |
| Total (Category) | 539 (27.6%) | 1,411 (72.4%) |
| Total (Overall) | 4,859 (54.8%) | 4,000 (45.2%) |
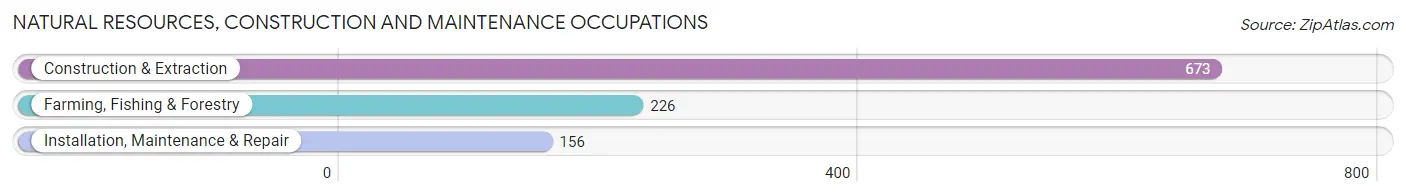
Natural Resources, Construction and Maintenance Occupations
The most common Natural Resources, Construction and Maintenance occupations in Plainview are Construction & Extraction (673 | 7.6%), Farming, Fishing & Forestry (226 | 2.5%), and Installation, Maintenance & Repair (156 | 1.8%).
Natural Resources, Construction and Maintenance Occupations by Sex
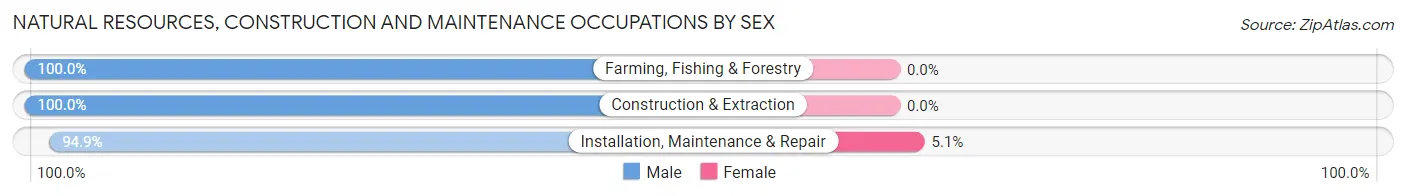
| Occupation | Male | Female |
| Farming, Fishing & Forestry | 226 (100.0%) | 0 (0.0%) |
| Construction & Extraction | 673 (100.0%) | 0 (0.0%) |
| Installation, Maintenance & Repair | 148 (94.9%) | 8 (5.1%) |
| Total (Category) | 1,047 (99.2%) | 8 (0.8%) |
| Total (Overall) | 4,859 (54.8%) | 4,000 (45.2%) |
Production, Transportation and Moving Occupations
The most common Production, Transportation and Moving occupations in Plainview are Material Moving (860 | 9.7%), Transportation (558 | 6.3%), and Production (419 | 4.7%).
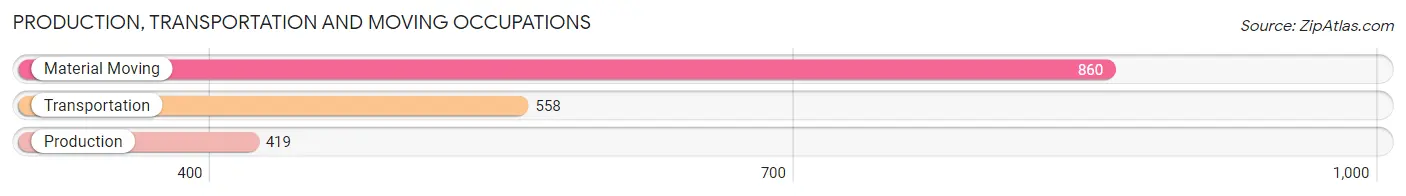
Production, Transportation and Moving Occupations by Sex
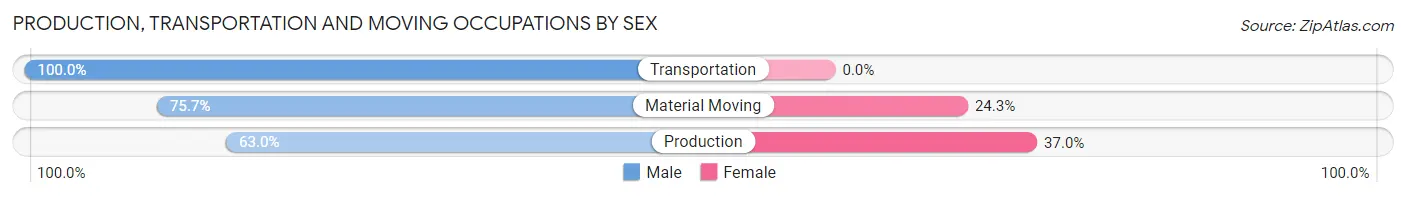
| Occupation | Male | Female |
| Production | 264 (63.0%) | 155 (37.0%) |
| Transportation | 558 (100.0%) | 0 (0.0%) |
| Material Moving | 651 (75.7%) | 209 (24.3%) |
| Total (Category) | 1,473 (80.2%) | 364 (19.8%) |
| Total (Overall) | 4,859 (54.8%) | 4,000 (45.2%) |
Employment Industries by Sex in Plainview
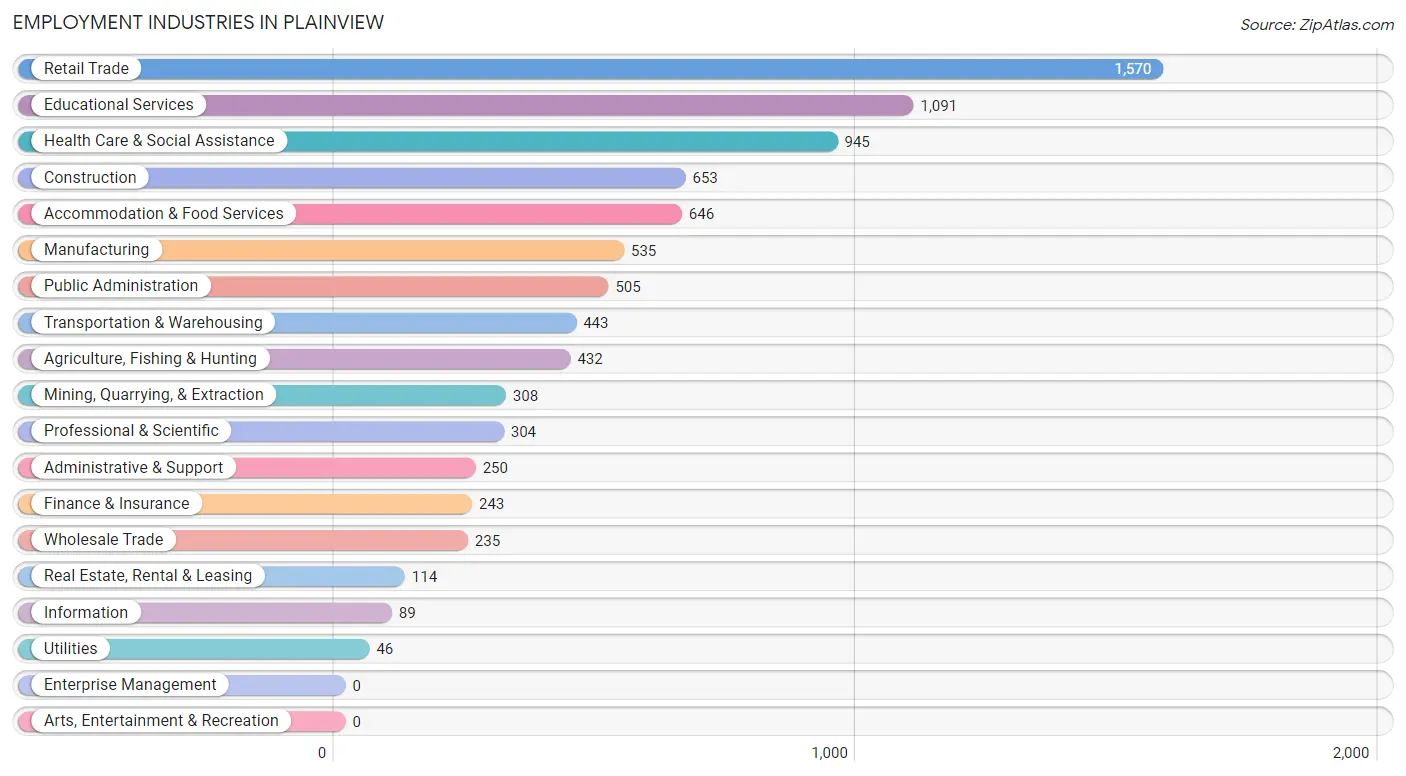
Employment Industries in Plainview
The major employment industries in Plainview include Retail Trade (1,570 | 17.7%), Educational Services (1,091 | 12.3%), Health Care & Social Assistance (945 | 10.7%), Construction (653 | 7.4%), and Accommodation & Food Services (646 | 7.3%).
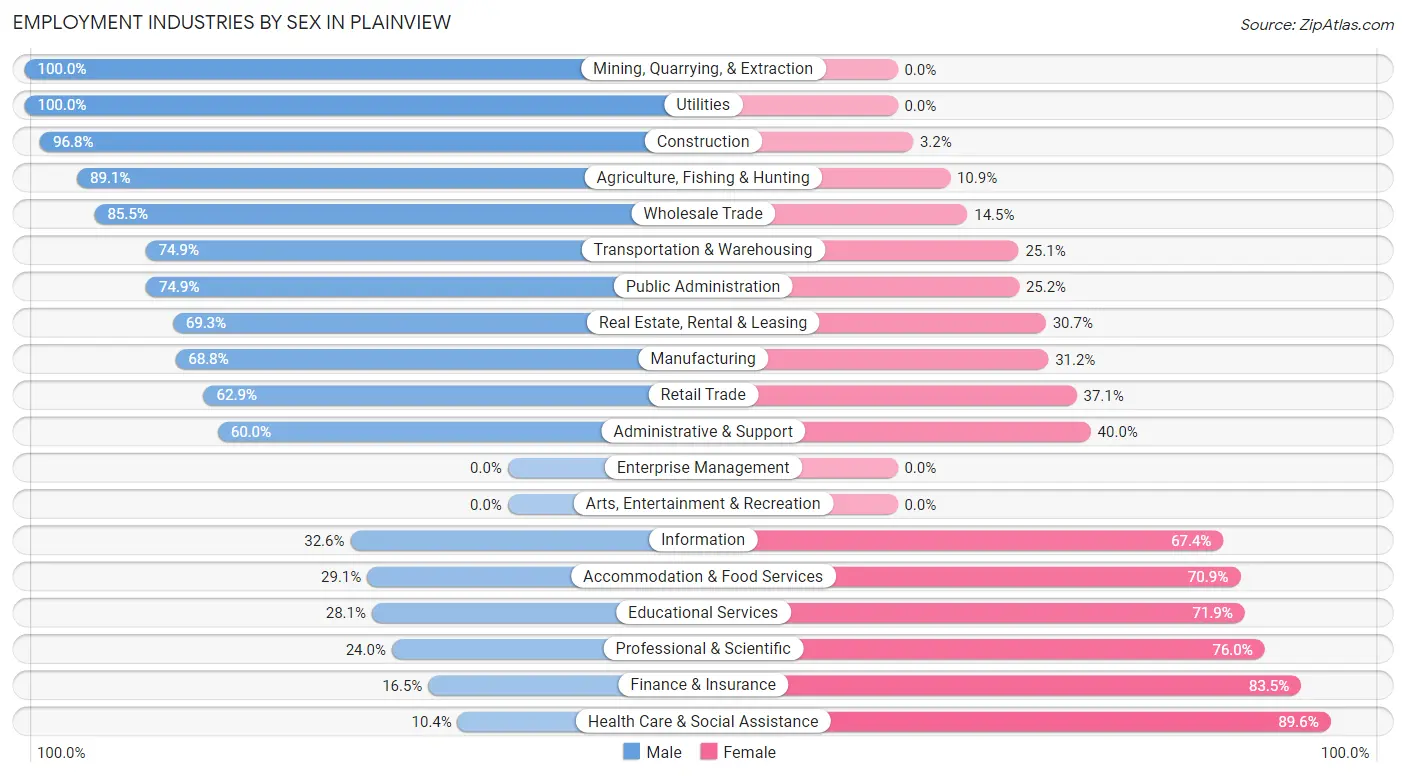
Employment Industries by Sex in Plainview
The Plainview industries that see more men than women are Mining, Quarrying, & Extraction (100.0%), Utilities (100.0%), and Construction (96.8%), whereas the industries that tend to have a higher number of women are Health Care & Social Assistance (89.6%), Finance & Insurance (83.5%), and Professional & Scientific (76.0%).
| Industry | Male | Female |
| Agriculture, Fishing & Hunting | 385 (89.1%) | 47 (10.9%) |
| Mining, Quarrying, & Extraction | 308 (100.0%) | 0 (0.0%) |
| Construction | 632 (96.8%) | 21 (3.2%) |
| Manufacturing | 368 (68.8%) | 167 (31.2%) |
| Wholesale Trade | 201 (85.5%) | 34 (14.5%) |
| Retail Trade | 988 (62.9%) | 582 (37.1%) |
| Transportation & Warehousing | 332 (74.9%) | 111 (25.1%) |
| Utilities | 46 (100.0%) | 0 (0.0%) |
| Information | 29 (32.6%) | 60 (67.4%) |
| Finance & Insurance | 40 (16.5%) | 203 (83.5%) |
| Real Estate, Rental & Leasing | 79 (69.3%) | 35 (30.7%) |
| Professional & Scientific | 73 (24.0%) | 231 (76.0%) |
| Enterprise Management | 0 (0.0%) | 0 (0.0%) |
| Administrative & Support | 150 (60.0%) | 100 (40.0%) |
| Educational Services | 307 (28.1%) | 784 (71.9%) |
| Health Care & Social Assistance | 98 (10.4%) | 847 (89.6%) |
| Arts, Entertainment & Recreation | 0 (0.0%) | 0 (0.0%) |
| Accommodation & Food Services | 188 (29.1%) | 458 (70.9%) |
| Public Administration | 378 (74.9%) | 127 (25.2%) |
| Total | 4,859 (54.8%) | 4,000 (45.2%) |
Education in Plainview
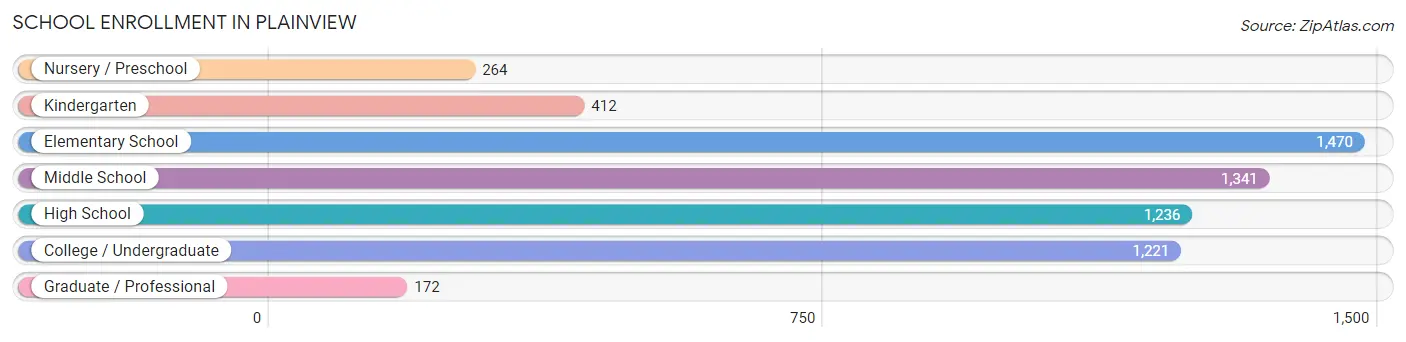
School Enrollment in Plainview
The most common levels of schooling among the 6,116 students in Plainview are elementary school (1,470 | 24.0%), middle school (1,341 | 21.9%), and high school (1,236 | 20.2%).
| School Level | # Students | % Students |
| Nursery / Preschool | 264 | 4.3% |
| Kindergarten | 412 | 6.7% |
| Elementary School | 1,470 | 24.0% |
| Middle School | 1,341 | 21.9% |
| High School | 1,236 | 20.2% |
| College / Undergraduate | 1,221 | 20.0% |
| Graduate / Professional | 172 | 2.8% |
| Total | 6,116 | 100.0% |
School Enrollment by Age by Funding Source in Plainview
Out of a total of 6,116 students who are enrolled in schools in Plainview, 1,058 (17.3%) attend a private institution, while the remaining 5,058 (82.7%) are enrolled in public schools. The age group of 20 to 24 year olds has the highest likelihood of being enrolled in private schools, with 301 (61.9% in the age bracket) enrolled. Conversely, the age group of 5 to 9 year old has the lowest likelihood of being enrolled in a private school, with 1,583 (95.9% in the age bracket) attending a public institution.
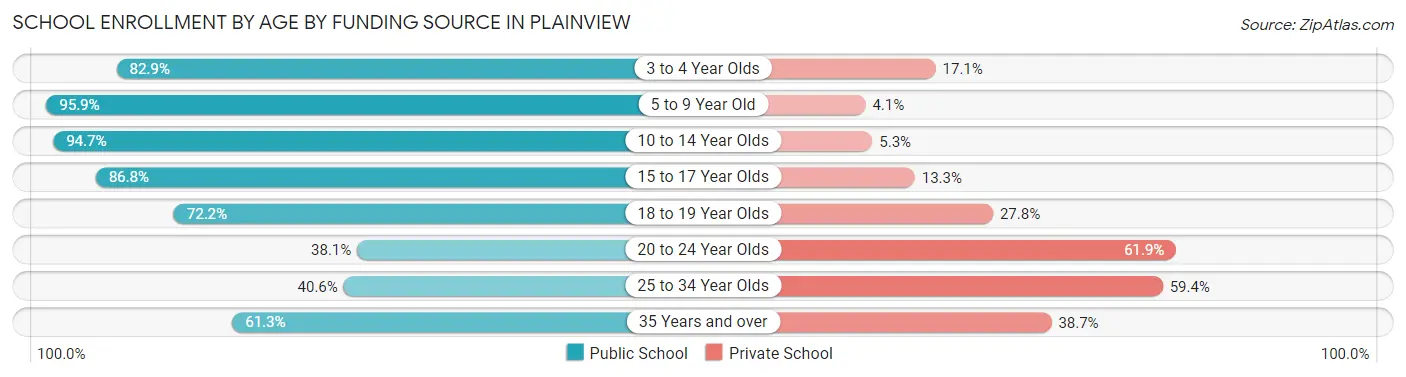
| Age Bracket | Public School | Private School |
| 3 to 4 Year Olds | 208 (82.9%) | 43 (17.1%) |
| 5 to 9 Year Old | 1,583 (95.9%) | 67 (4.1%) |
| 10 to 14 Year Olds | 1,703 (94.7%) | 96 (5.3%) |
| 15 to 17 Year Olds | 740 (86.8%) | 113 (13.3%) |
| 18 to 19 Year Olds | 340 (72.2%) | 131 (27.8%) |
| 20 to 24 Year Olds | 185 (38.1%) | 301 (61.9%) |
| 25 to 34 Year Olds | 140 (40.6%) | 205 (59.4%) |
| 35 Years and over | 160 (61.3%) | 101 (38.7%) |
| Total | 5,058 (82.7%) | 1,058 (17.3%) |
Educational Attainment by Field of Study in Plainview
Business (445 | 25.9%), education (317 | 18.5%), arts & humanities (183 | 10.7%), science & technology (115 | 6.7%), and social sciences (113 | 6.6%) are the most common fields of study among 1,716 individuals in Plainview who have obtained a bachelor's degree or higher.
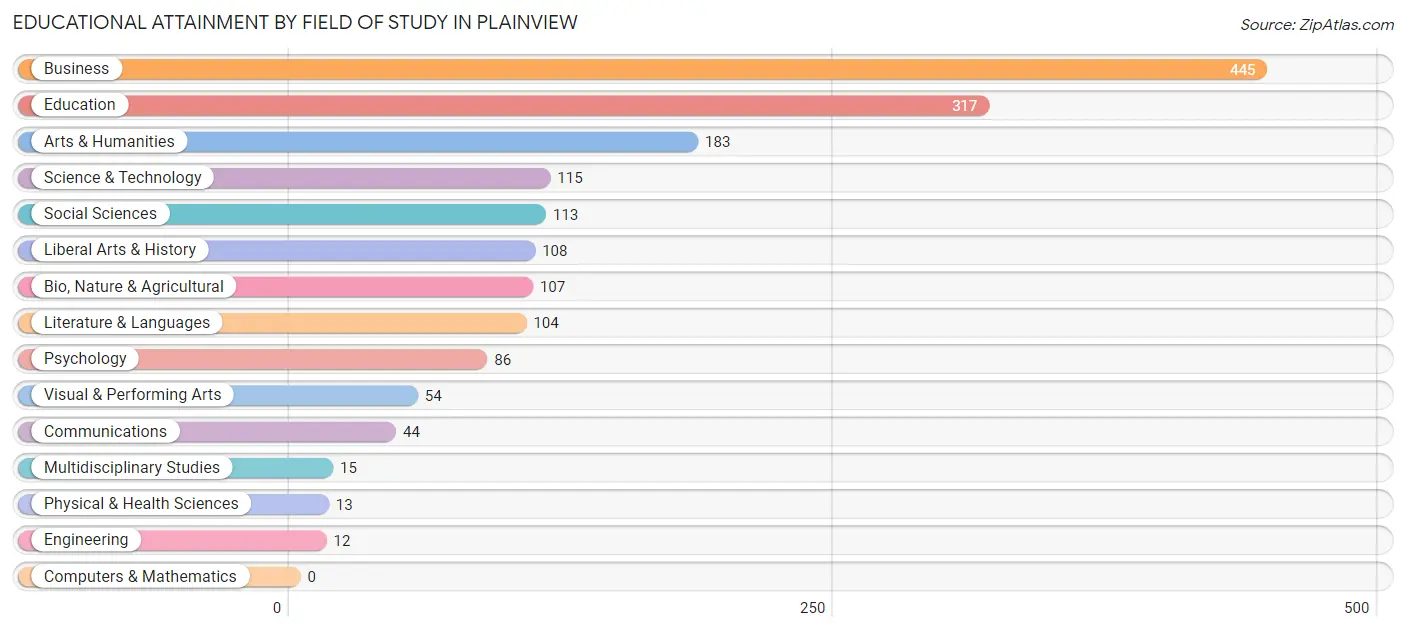
| Field of Study | # Graduates | % Graduates |
| Computers & Mathematics | 0 | 0.0% |
| Bio, Nature & Agricultural | 107 | 6.2% |
| Physical & Health Sciences | 13 | 0.8% |
| Psychology | 86 | 5.0% |
| Social Sciences | 113 | 6.6% |
| Engineering | 12 | 0.7% |
| Multidisciplinary Studies | 15 | 0.9% |
| Science & Technology | 115 | 6.7% |
| Business | 445 | 25.9% |
| Education | 317 | 18.5% |
| Literature & Languages | 104 | 6.1% |
| Liberal Arts & History | 108 | 6.3% |
| Visual & Performing Arts | 54 | 3.2% |
| Communications | 44 | 2.6% |
| Arts & Humanities | 183 | 10.7% |
| Total | 1,716 | 100.0% |
Transportation & Commute in Plainview
Vehicle Availability by Sex in Plainview
The most prevalent vehicle ownership categories in Plainview are males with 2 vehicles (2,065, accounting for 43.6%) and females with 2 vehicles (1,774, making up 53.1%).
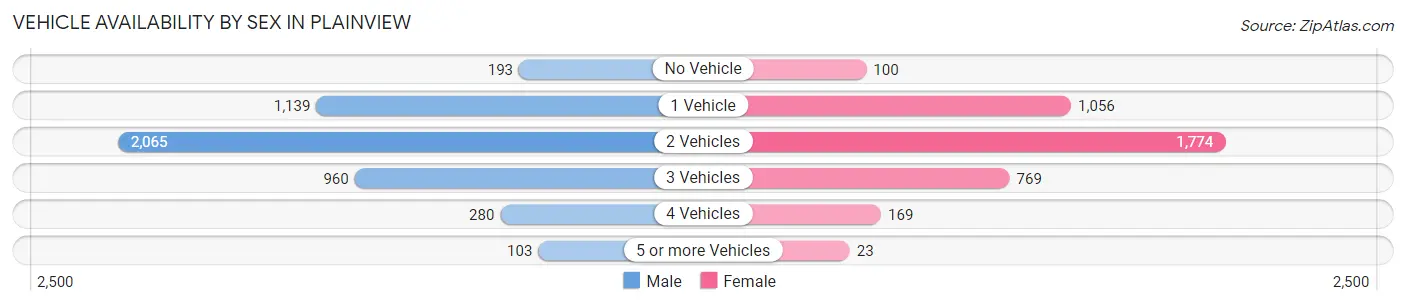
| Vehicles Available | Male | Female |
| No Vehicle | 193 (4.1%) | 100 (2.6%) |
| 1 Vehicle | 1,139 (24.0%) | 1,056 (27.1%) |
| 2 Vehicles | 2,065 (43.6%) | 1,774 (45.6%) |
| 3 Vehicles | 960 (20.3%) | 769 (19.8%) |
| 4 Vehicles | 280 (5.9%) | 169 (4.3%) |
| 5 or more Vehicles | 103 (2.2%) | 23 (0.6%) |
| Total | 4,740 (100.0%) | 3,891 (100.0%) |
Commute Time in Plainview
The most frequently occuring commute durations in Plainview are 5 to 9 minutes (2,535 commuters, 29.7%), 10 to 14 minutes (1,889 commuters, 22.1%), and 15 to 19 minutes (1,312 commuters, 15.4%).
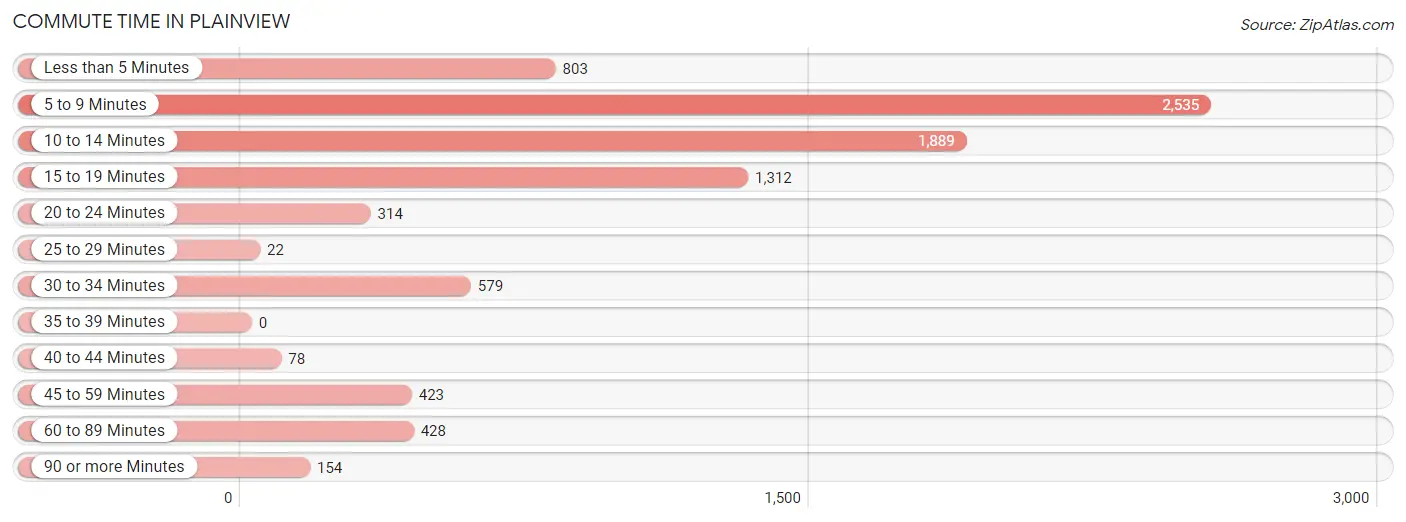
| Commute Time | # Commuters | % Commuters |
| Less than 5 Minutes | 803 | 9.4% |
| 5 to 9 Minutes | 2,535 | 29.7% |
| 10 to 14 Minutes | 1,889 | 22.1% |
| 15 to 19 Minutes | 1,312 | 15.4% |
| 20 to 24 Minutes | 314 | 3.7% |
| 25 to 29 Minutes | 22 | 0.3% |
| 30 to 34 Minutes | 579 | 6.8% |
| 35 to 39 Minutes | 0 | 0.0% |
| 40 to 44 Minutes | 78 | 0.9% |
| 45 to 59 Minutes | 423 | 5.0% |
| 60 to 89 Minutes | 428 | 5.0% |
| 90 or more Minutes | 154 | 1.8% |
Commute Time by Sex in Plainview
The most common commute times in Plainview are 5 to 9 minutes (1,066 commuters, 22.9%) for males and 5 to 9 minutes (1,469 commuters, 37.8%) for females.
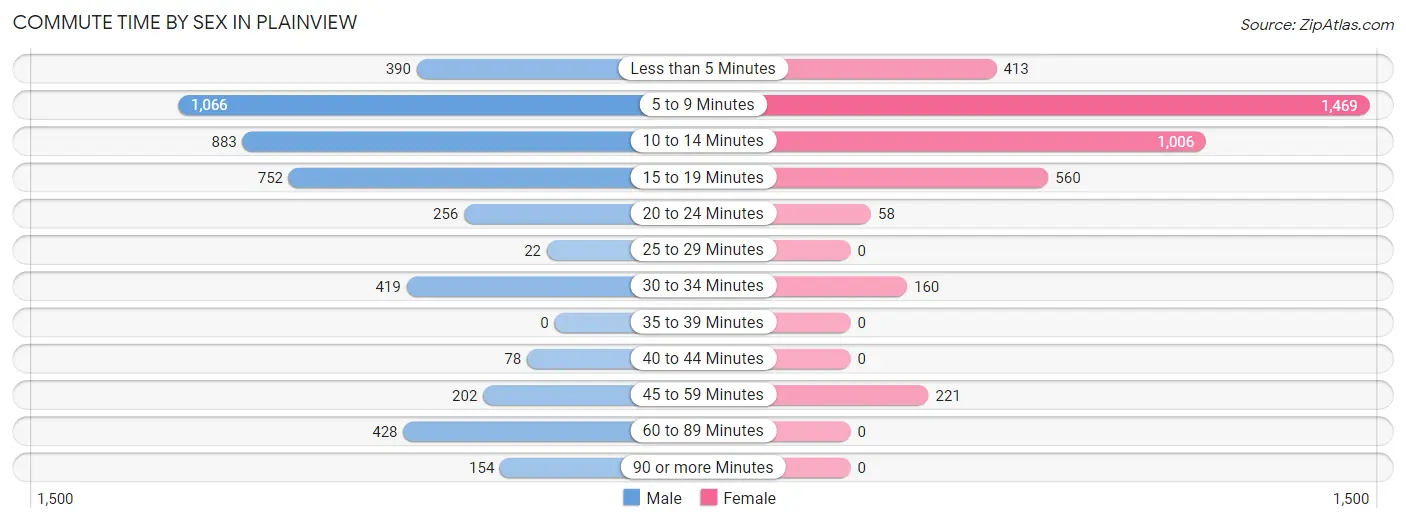
| Commute Time | Male | Female |
| Less than 5 Minutes | 390 (8.4%) | 413 (10.6%) |
| 5 to 9 Minutes | 1,066 (22.9%) | 1,469 (37.8%) |
| 10 to 14 Minutes | 883 (19.0%) | 1,006 (25.9%) |
| 15 to 19 Minutes | 752 (16.2%) | 560 (14.4%) |
| 20 to 24 Minutes | 256 (5.5%) | 58 (1.5%) |
| 25 to 29 Minutes | 22 (0.5%) | 0 (0.0%) |
| 30 to 34 Minutes | 419 (9.0%) | 160 (4.1%) |
| 35 to 39 Minutes | 0 (0.0%) | 0 (0.0%) |
| 40 to 44 Minutes | 78 (1.7%) | 0 (0.0%) |
| 45 to 59 Minutes | 202 (4.3%) | 221 (5.7%) |
| 60 to 89 Minutes | 428 (9.2%) | 0 (0.0%) |
| 90 or more Minutes | 154 (3.3%) | 0 (0.0%) |
Time of Departure to Work by Sex in Plainview
The most frequent times of departure to work in Plainview are 7:00 AM to 7:29 AM (749, 16.1%) for males and 7:30 AM to 7:59 AM (603, 15.5%) for females.
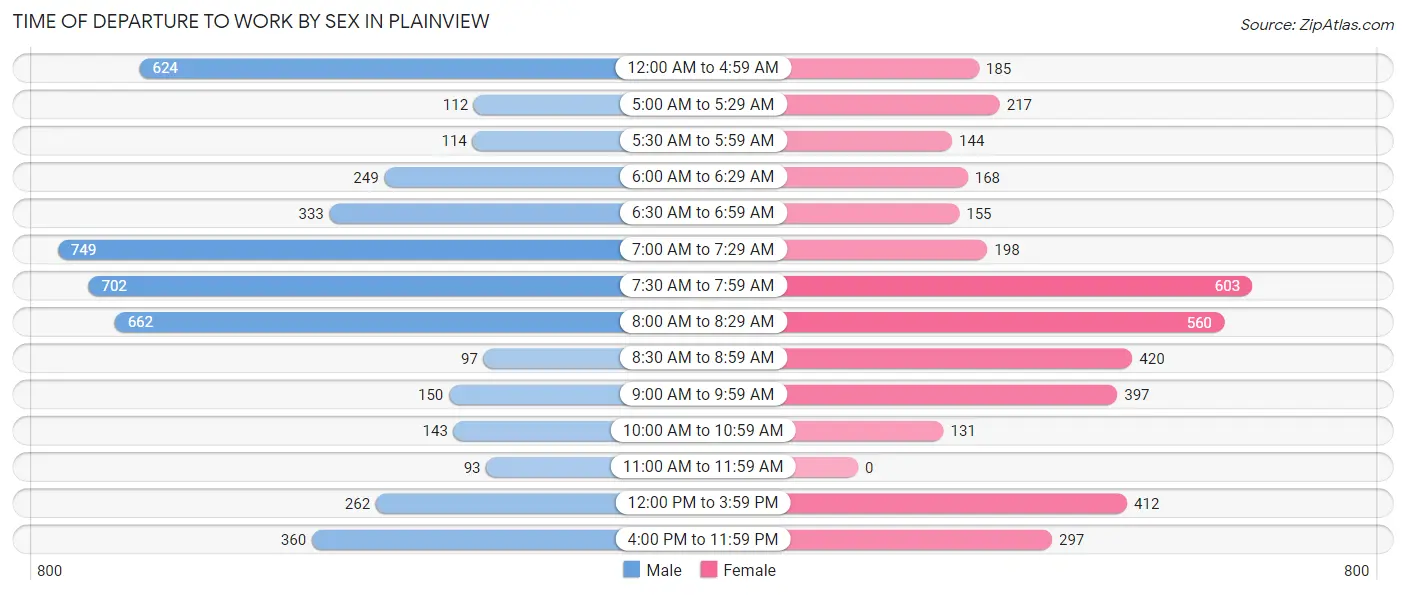
| Time of Departure | Male | Female |
| 12:00 AM to 4:59 AM | 624 (13.4%) | 185 (4.8%) |
| 5:00 AM to 5:29 AM | 112 (2.4%) | 217 (5.6%) |
| 5:30 AM to 5:59 AM | 114 (2.5%) | 144 (3.7%) |
| 6:00 AM to 6:29 AM | 249 (5.3%) | 168 (4.3%) |
| 6:30 AM to 6:59 AM | 333 (7.2%) | 155 (4.0%) |
| 7:00 AM to 7:29 AM | 749 (16.1%) | 198 (5.1%) |
| 7:30 AM to 7:59 AM | 702 (15.1%) | 603 (15.5%) |
| 8:00 AM to 8:29 AM | 662 (14.2%) | 560 (14.4%) |
| 8:30 AM to 8:59 AM | 97 (2.1%) | 420 (10.8%) |
| 9:00 AM to 9:59 AM | 150 (3.2%) | 397 (10.2%) |
| 10:00 AM to 10:59 AM | 143 (3.1%) | 131 (3.4%) |
| 11:00 AM to 11:59 AM | 93 (2.0%) | 0 (0.0%) |
| 12:00 PM to 3:59 PM | 262 (5.6%) | 412 (10.6%) |
| 4:00 PM to 11:59 PM | 360 (7.7%) | 297 (7.6%) |
| Total | 4,650 (100.0%) | 3,887 (100.0%) |
Housing Occupancy in Plainview
Occupancy by Ownership in Plainview
Of the total 7,016 dwellings in Plainview, owner-occupied units account for 3,687 (52.5%), while renter-occupied units make up 3,329 (47.4%).
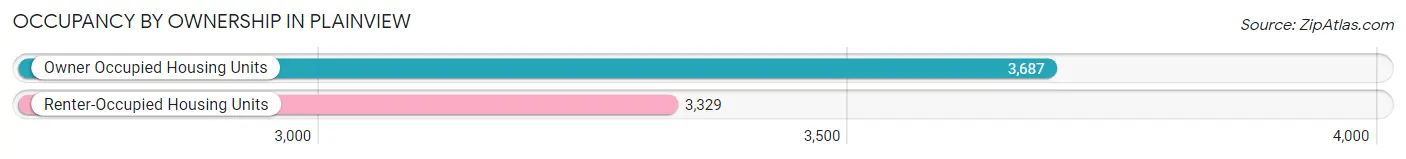
| Occupancy | # Housing Units | % Housing Units |
| Owner Occupied Housing Units | 3,687 | 52.5% |
| Renter-Occupied Housing Units | 3,329 | 47.4% |
| Total Occupied Housing Units | 7,016 | 100.0% |
Occupancy by Household Size in Plainview
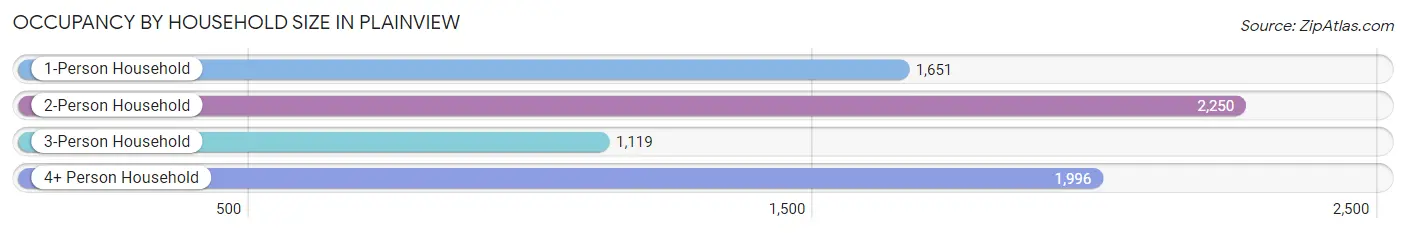
| Household Size | # Housing Units | % Housing Units |
| 1-Person Household | 1,651 | 23.5% |
| 2-Person Household | 2,250 | 32.1% |
| 3-Person Household | 1,119 | 16.0% |
| 4+ Person Household | 1,996 | 28.4% |
| Total Housing Units | 7,016 | 100.0% |
Occupancy by Ownership by Household Size in Plainview
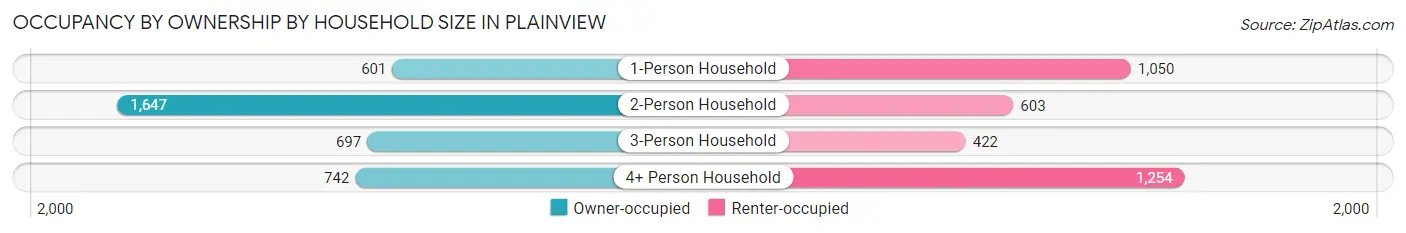
| Household Size | Owner-occupied | Renter-occupied |
| 1-Person Household | 601 (36.4%) | 1,050 (63.6%) |
| 2-Person Household | 1,647 (73.2%) | 603 (26.8%) |
| 3-Person Household | 697 (62.3%) | 422 (37.7%) |
| 4+ Person Household | 742 (37.2%) | 1,254 (62.8%) |
| Total Housing Units | 3,687 (52.5%) | 3,329 (47.4%) |
Occupancy by Educational Attainment in Plainview
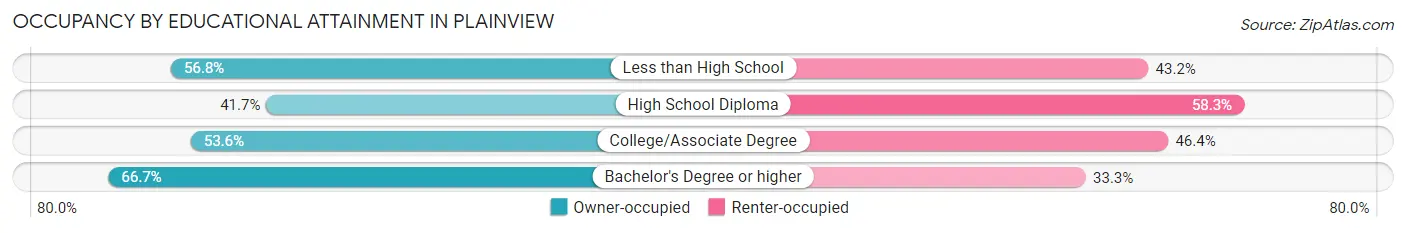
| Household Size | Owner-occupied | Renter-occupied |
| Less than High School | 993 (56.8%) | 756 (43.2%) |
| High School Diploma | 903 (41.7%) | 1,264 (58.3%) |
| College/Associate Degree | 1,136 (53.6%) | 982 (46.4%) |
| Bachelor's Degree or higher | 655 (66.7%) | 327 (33.3%) |
Occupancy by Age of Householder in Plainview
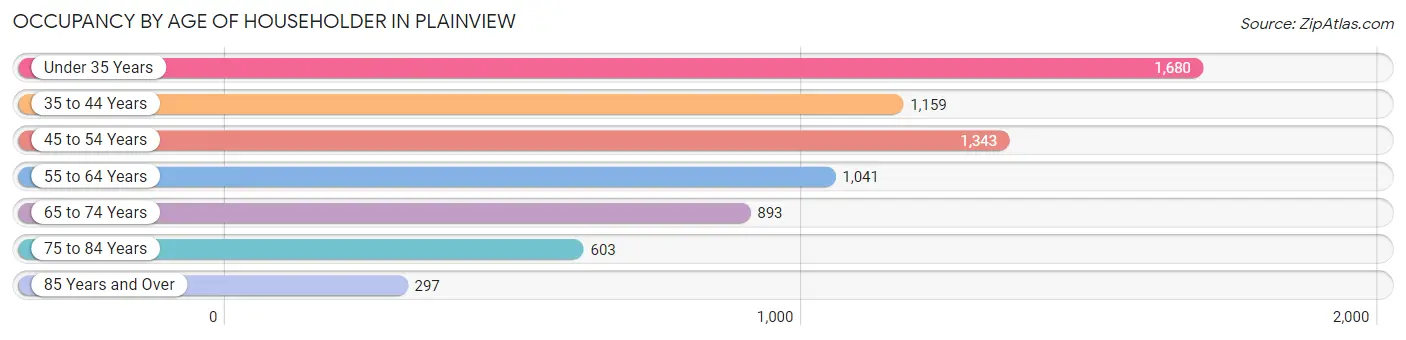
| Age Bracket | # Households | % Households |
| Under 35 Years | 1,680 | 23.9% |
| 35 to 44 Years | 1,159 | 16.5% |
| 45 to 54 Years | 1,343 | 19.1% |
| 55 to 64 Years | 1,041 | 14.8% |
| 65 to 74 Years | 893 | 12.7% |
| 75 to 84 Years | 603 | 8.6% |
| 85 Years and Over | 297 | 4.2% |
| Total | 7,016 | 100.0% |
Housing Finances in Plainview
Median Income by Occupancy in Plainview
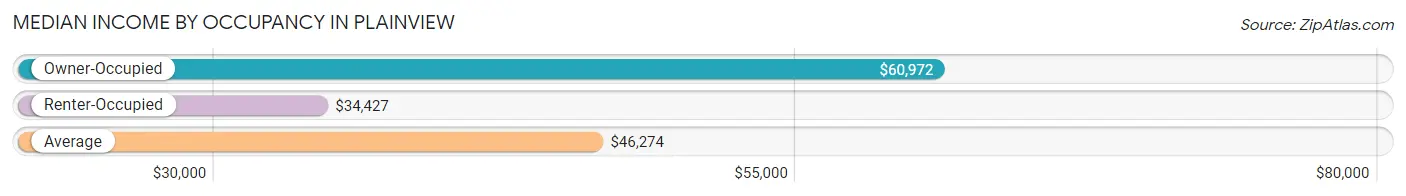
| Occupancy Type | # Households | Median Income |
| Owner-Occupied | 3,687 (52.5%) | $60,972 |
| Renter-Occupied | 3,329 (47.4%) | $34,427 |
| Average | 7,016 (100.0%) | $46,274 |
Occupancy by Householder Income Bracket in Plainview
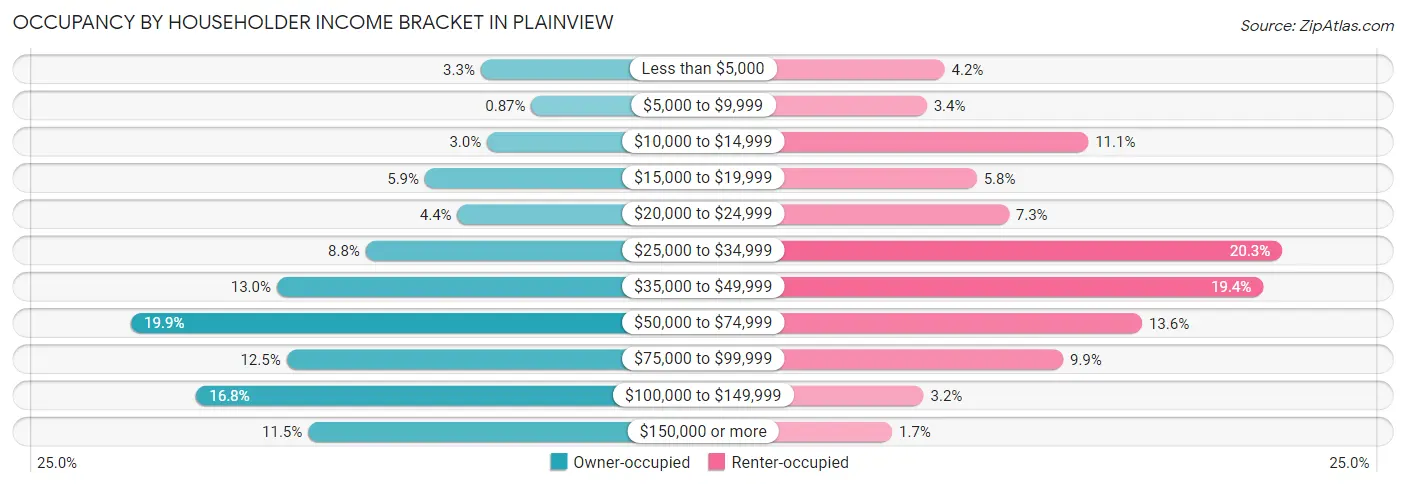
| Income Bracket | Owner-occupied | Renter-occupied |
| Less than $5,000 | 121 (3.3%) | 141 (4.2%) |
| $5,000 to $9,999 | 32 (0.9%) | 113 (3.4%) |
| $10,000 to $14,999 | 110 (3.0%) | 369 (11.1%) |
| $15,000 to $19,999 | 219 (5.9%) | 192 (5.8%) |
| $20,000 to $24,999 | 162 (4.4%) | 243 (7.3%) |
| $25,000 to $34,999 | 323 (8.8%) | 676 (20.3%) |
| $35,000 to $49,999 | 479 (13.0%) | 646 (19.4%) |
| $50,000 to $74,999 | 735 (19.9%) | 454 (13.6%) |
| $75,000 to $99,999 | 462 (12.5%) | 329 (9.9%) |
| $100,000 to $149,999 | 620 (16.8%) | 108 (3.2%) |
| $150,000 or more | 424 (11.5%) | 58 (1.7%) |
| Total | 3,687 (100.0%) | 3,329 (100.0%) |
Monthly Housing Cost Tiers in Plainview
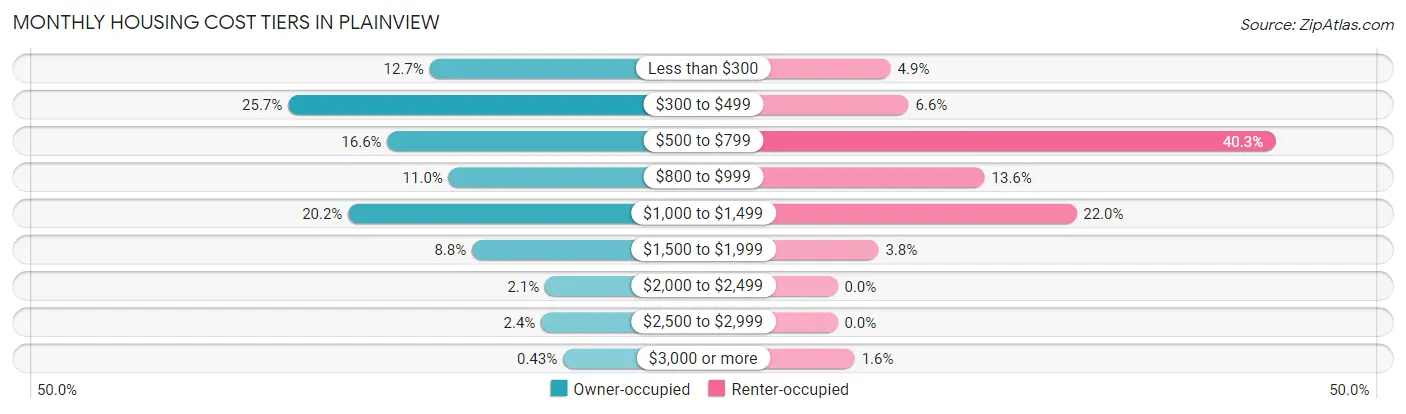
| Monthly Cost | Owner-occupied | Renter-occupied |
| Less than $300 | 469 (12.7%) | 163 (4.9%) |
| $300 to $499 | 949 (25.7%) | 218 (6.6%) |
| $500 to $799 | 612 (16.6%) | 1,341 (40.3%) |
| $800 to $999 | 404 (11.0%) | 451 (13.6%) |
| $1,000 to $1,499 | 745 (20.2%) | 732 (22.0%) |
| $1,500 to $1,999 | 325 (8.8%) | 126 (3.8%) |
| $2,000 to $2,499 | 77 (2.1%) | 0 (0.0%) |
| $2,500 to $2,999 | 90 (2.4%) | 0 (0.0%) |
| $3,000 or more | 16 (0.4%) | 53 (1.6%) |
| Total | 3,687 (100.0%) | 3,329 (100.0%) |
Physical Housing Characteristics in Plainview
Housing Structures in Plainview
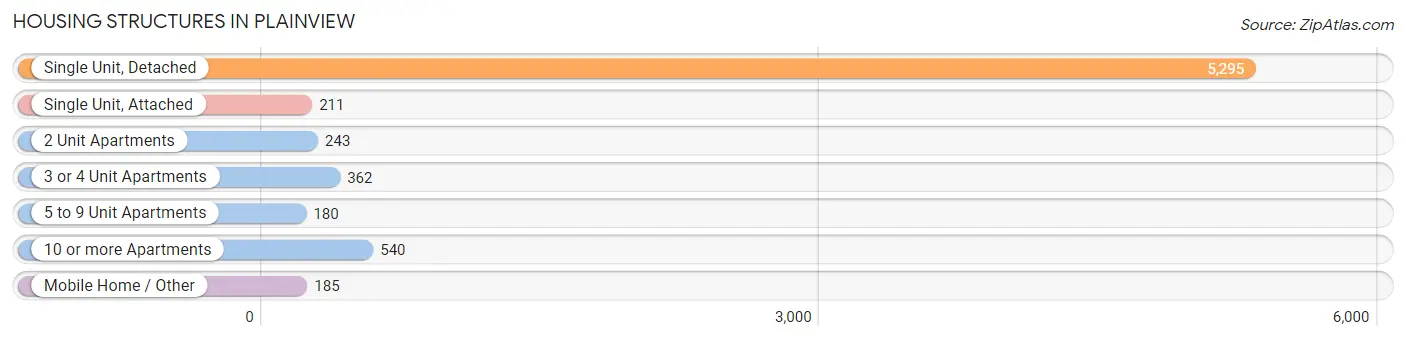
| Structure Type | # Housing Units | % Housing Units |
| Single Unit, Detached | 5,295 | 75.5% |
| Single Unit, Attached | 211 | 3.0% |
| 2 Unit Apartments | 243 | 3.5% |
| 3 or 4 Unit Apartments | 362 | 5.2% |
| 5 to 9 Unit Apartments | 180 | 2.6% |
| 10 or more Apartments | 540 | 7.7% |
| Mobile Home / Other | 185 | 2.6% |
| Total | 7,016 | 100.0% |
Housing Structures by Occupancy in Plainview
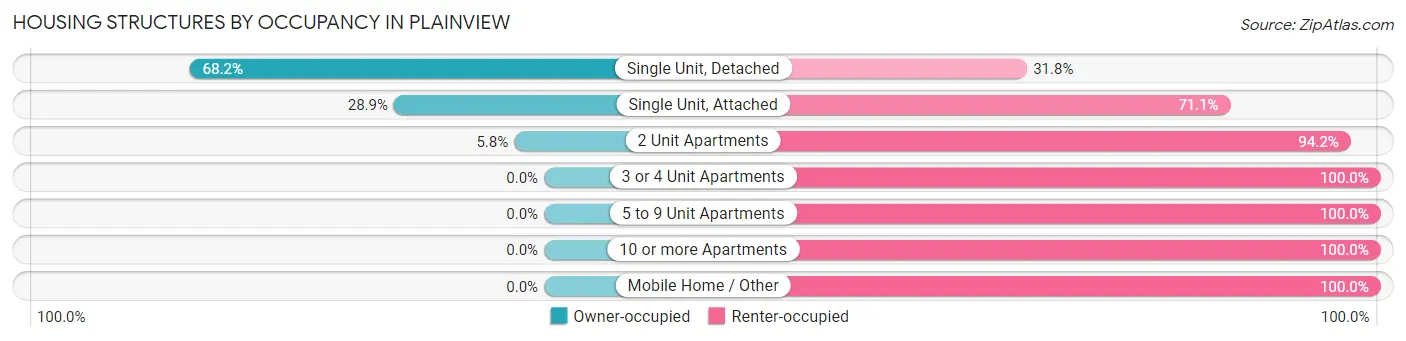
| Structure Type | Owner-occupied | Renter-occupied |
| Single Unit, Detached | 3,612 (68.2%) | 1,683 (31.8%) |
| Single Unit, Attached | 61 (28.9%) | 150 (71.1%) |
| 2 Unit Apartments | 14 (5.8%) | 229 (94.2%) |
| 3 or 4 Unit Apartments | 0 (0.0%) | 362 (100.0%) |
| 5 to 9 Unit Apartments | 0 (0.0%) | 180 (100.0%) |
| 10 or more Apartments | 0 (0.0%) | 540 (100.0%) |
| Mobile Home / Other | 0 (0.0%) | 185 (100.0%) |
| Total | 3,687 (52.5%) | 3,329 (47.4%) |
Housing Structures by Number of Rooms in Plainview
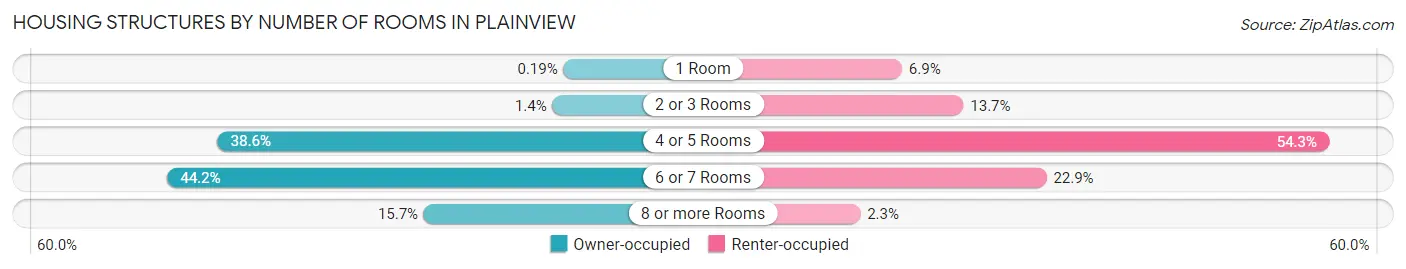
| Number of Rooms | Owner-occupied | Renter-occupied |
| 1 Room | 7 (0.2%) | 229 (6.9%) |
| 2 or 3 Rooms | 52 (1.4%) | 456 (13.7%) |
| 4 or 5 Rooms | 1,422 (38.6%) | 1,806 (54.2%) |
| 6 or 7 Rooms | 1,628 (44.2%) | 763 (22.9%) |
| 8 or more Rooms | 578 (15.7%) | 75 (2.2%) |
| Total | 3,687 (100.0%) | 3,329 (100.0%) |
Housing Structure by Heating Type in Plainview
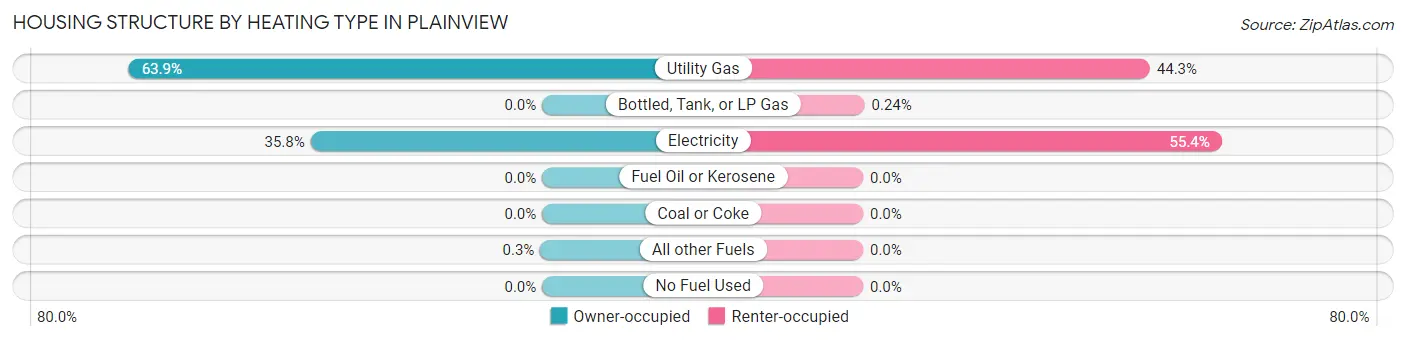
| Heating Type | Owner-occupied | Renter-occupied |
| Utility Gas | 2,356 (63.9%) | 1,476 (44.3%) |
| Bottled, Tank, or LP Gas | 0 (0.0%) | 8 (0.2%) |
| Electricity | 1,320 (35.8%) | 1,845 (55.4%) |
| Fuel Oil or Kerosene | 0 (0.0%) | 0 (0.0%) |
| Coal or Coke | 0 (0.0%) | 0 (0.0%) |
| All other Fuels | 11 (0.3%) | 0 (0.0%) |
| No Fuel Used | 0 (0.0%) | 0 (0.0%) |
| Total | 3,687 (100.0%) | 3,329 (100.0%) |
Household Vehicle Usage in Plainview
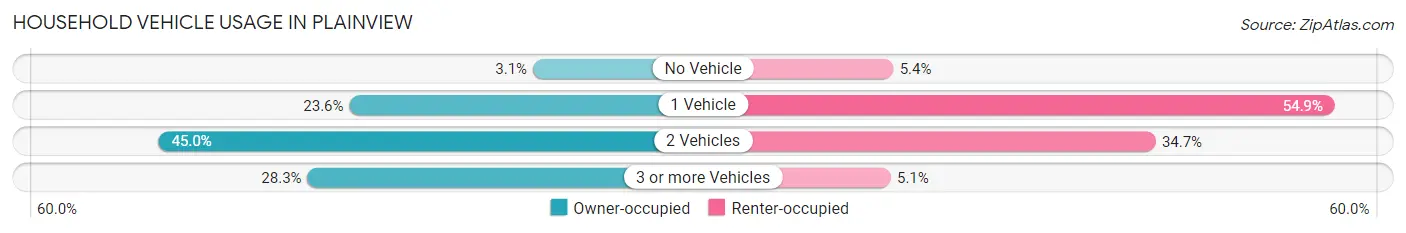
| Vehicles per Household | Owner-occupied | Renter-occupied |
| No Vehicle | 113 (3.1%) | 178 (5.3%) |
| 1 Vehicle | 871 (23.6%) | 1,827 (54.9%) |
| 2 Vehicles | 1,659 (45.0%) | 1,156 (34.7%) |
| 3 or more Vehicles | 1,044 (28.3%) | 168 (5.1%) |
| Total | 3,687 (100.0%) | 3,329 (100.0%) |
Real Estate & Mortgages in Plainview
Real Estate and Mortgage Overview in Plainview
| Characteristic | Without Mortgage | With Mortgage |
| Housing Units | 2,144 | 1,543 |
| Median Property Value | $80,800 | $125,300 |
| Median Household Income | $50,950 | $280 |
| Monthly Housing Costs | $418 | $7 |
| Real Estate Taxes | $1,187 | $0 |
Property Value by Mortgage Status in Plainview
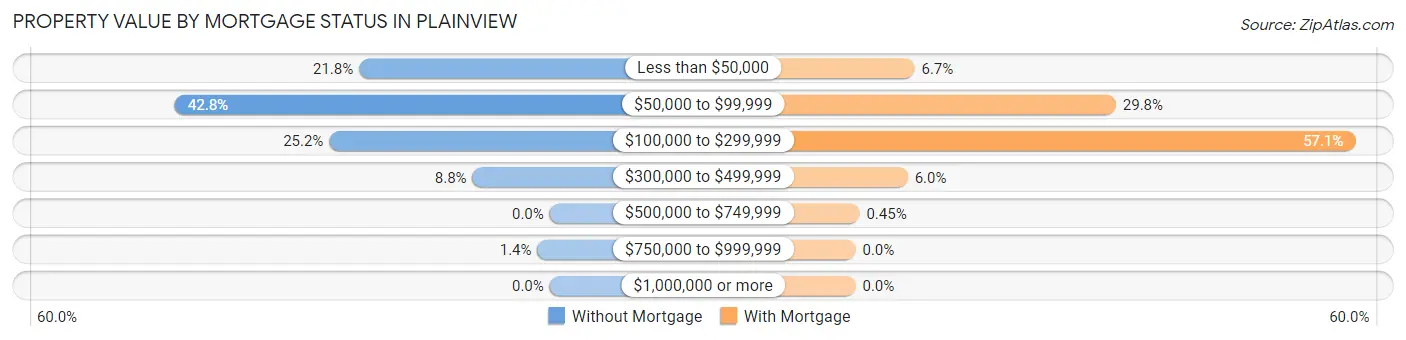
| Property Value | Without Mortgage | With Mortgage |
| Less than $50,000 | 467 (21.8%) | 104 (6.7%) |
| $50,000 to $99,999 | 918 (42.8%) | 459 (29.7%) |
| $100,000 to $299,999 | 540 (25.2%) | 881 (57.1%) |
| $300,000 to $499,999 | 189 (8.8%) | 92 (6.0%) |
| $500,000 to $749,999 | 0 (0.0%) | 7 (0.4%) |
| $750,000 to $999,999 | 30 (1.4%) | 0 (0.0%) |
| $1,000,000 or more | 0 (0.0%) | 0 (0.0%) |
| Total | 2,144 (100.0%) | 1,543 (100.0%) |
Household Income by Mortgage Status in Plainview
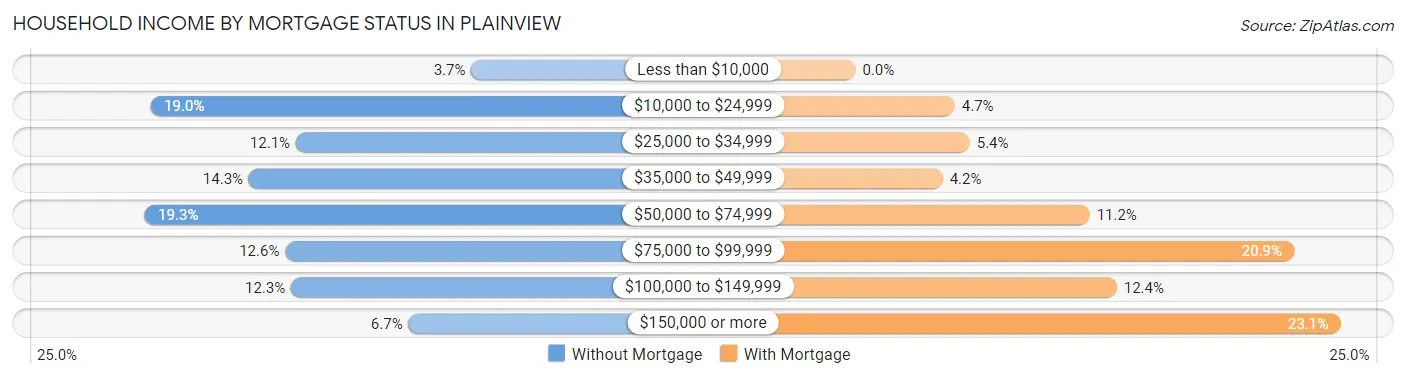
| Household Income | Without Mortgage | With Mortgage |
| Less than $10,000 | 80 (3.7%) | 0 (0.0%) |
| $10,000 to $24,999 | 407 (19.0%) | 73 (4.7%) |
| $25,000 to $34,999 | 259 (12.1%) | 84 (5.4%) |
| $35,000 to $49,999 | 307 (14.3%) | 64 (4.2%) |
| $50,000 to $74,999 | 413 (19.3%) | 172 (11.2%) |
| $75,000 to $99,999 | 270 (12.6%) | 322 (20.9%) |
| $100,000 to $149,999 | 264 (12.3%) | 192 (12.4%) |
| $150,000 or more | 144 (6.7%) | 356 (23.1%) |
| Total | 2,144 (100.0%) | 1,543 (100.0%) |
Property Value to Household Income Ratio in Plainview
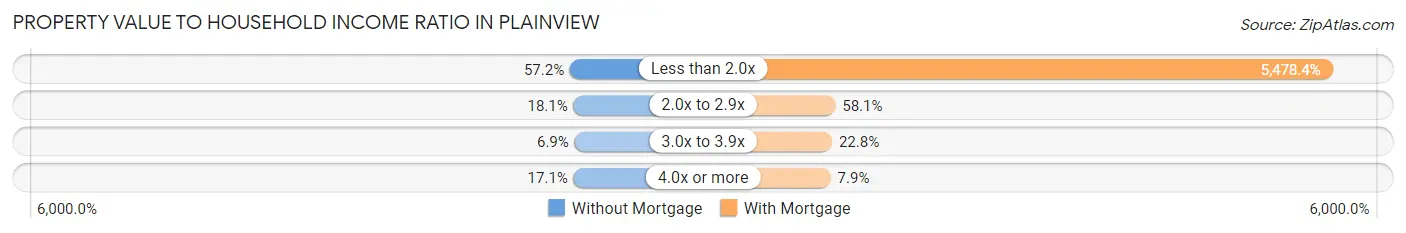
| Value-to-Income Ratio | Without Mortgage | With Mortgage |
| Less than 2.0x | 1,226 (57.2%) | 84,531 (5,478.3%) |
| 2.0x to 2.9x | 389 (18.1%) | 897 (58.1%) |
| 3.0x to 3.9x | 148 (6.9%) | 351 (22.8%) |
| 4.0x or more | 367 (17.1%) | 122 (7.9%) |
| Total | 2,144 (100.0%) | 1,543 (100.0%) |
Real Estate Taxes by Mortgage Status in Plainview
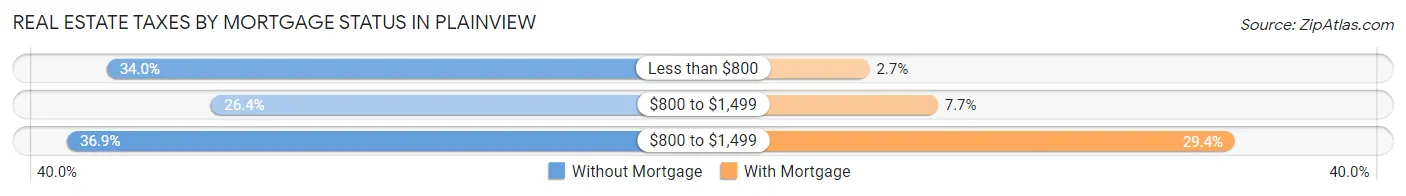
| Property Taxes | Without Mortgage | With Mortgage |
| Less than $800 | 729 (34.0%) | 41 (2.7%) |
| $800 to $1,499 | 565 (26.4%) | 118 (7.6%) |
| $800 to $1,499 | 791 (36.9%) | 453 (29.4%) |
| Total | 2,144 (100.0%) | 1,543 (100.0%) |
Health & Disability in Plainview
Health Insurance Coverage by Age in Plainview
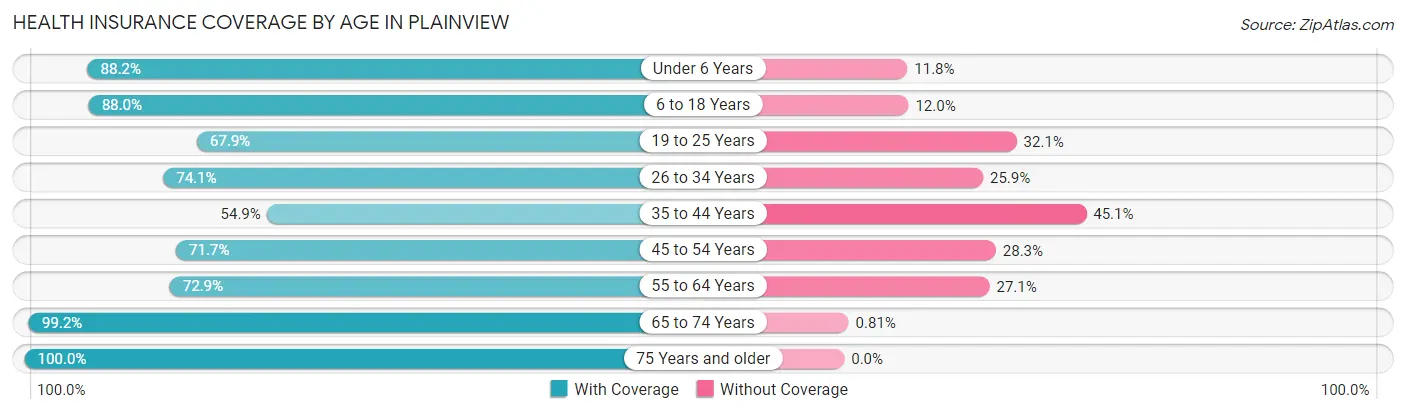
| Age Bracket | With Coverage | Without Coverage |
| Under 6 Years | 1,320 (88.2%) | 176 (11.8%) |
| 6 to 18 Years | 4,148 (88.0%) | 564 (12.0%) |
| 19 to 25 Years | 1,765 (67.9%) | 836 (32.1%) |
| 26 to 34 Years | 1,467 (74.1%) | 512 (25.9%) |
| 35 to 44 Years | 1,268 (54.9%) | 1,043 (45.1%) |
| 45 to 54 Years | 1,579 (71.7%) | 622 (28.3%) |
| 55 to 64 Years | 1,324 (72.9%) | 492 (27.1%) |
| 65 to 74 Years | 1,464 (99.2%) | 12 (0.8%) |
| 75 Years and older | 1,196 (100.0%) | 0 (0.0%) |
| Total | 15,531 (78.5%) | 4,257 (21.5%) |
Health Insurance Coverage by Citizenship Status in Plainview

| Citizenship Status | With Coverage | Without Coverage |
| Native Born | 1,320 (88.2%) | 176 (11.8%) |
| Foreign Born, Citizen | 4,148 (88.0%) | 564 (12.0%) |
| Foreign Born, not a Citizen | 1,765 (67.9%) | 836 (32.1%) |
Health Insurance Coverage by Household Income in Plainview
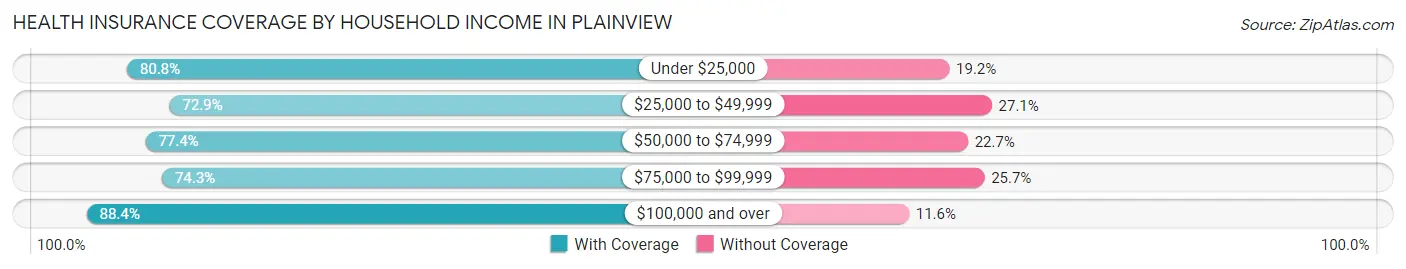
| Household Income | With Coverage | Without Coverage |
| Under $25,000 | 2,715 (80.8%) | 644 (19.2%) |
| $25,000 to $49,999 | 4,050 (72.9%) | 1,508 (27.1%) |
| $50,000 to $74,999 | 3,047 (77.3%) | 892 (22.7%) |
| $75,000 to $99,999 | 2,037 (74.3%) | 706 (25.7%) |
| $100,000 and over | 3,336 (88.4%) | 438 (11.6%) |
Public vs Private Health Insurance Coverage by Age in Plainview
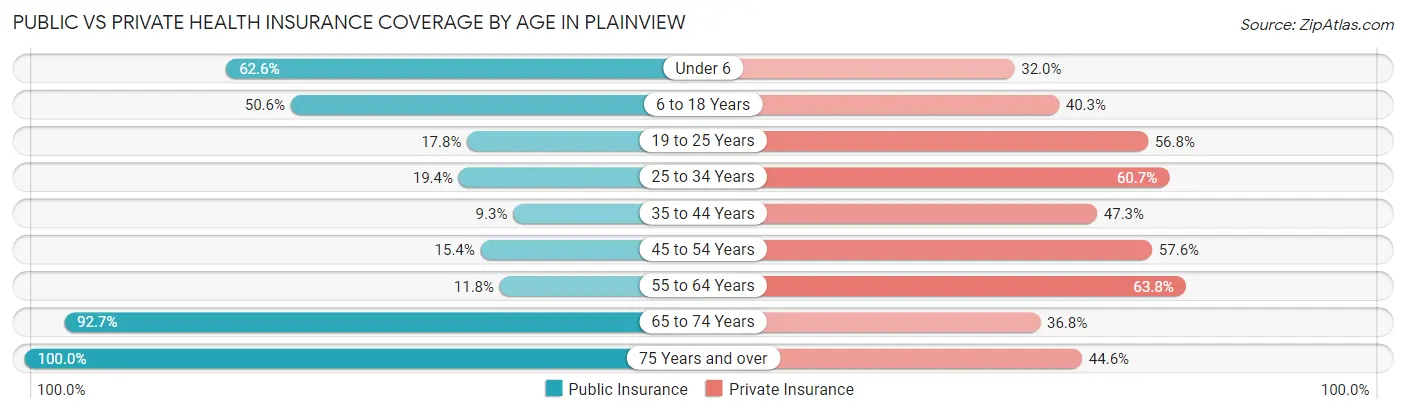
| Age Bracket | Public Insurance | Private Insurance |
| Under 6 | 936 (62.6%) | 479 (32.0%) |
| 6 to 18 Years | 2,384 (50.6%) | 1,898 (40.3%) |
| 19 to 25 Years | 464 (17.8%) | 1,477 (56.8%) |
| 25 to 34 Years | 384 (19.4%) | 1,202 (60.7%) |
| 35 to 44 Years | 215 (9.3%) | 1,094 (47.3%) |
| 45 to 54 Years | 338 (15.4%) | 1,267 (57.6%) |
| 55 to 64 Years | 214 (11.8%) | 1,159 (63.8%) |
| 65 to 74 Years | 1,368 (92.7%) | 543 (36.8%) |
| 75 Years and over | 1,196 (100.0%) | 533 (44.6%) |
| Total | 7,499 (37.9%) | 9,652 (48.8%) |
Disability Status by Sex by Age in Plainview
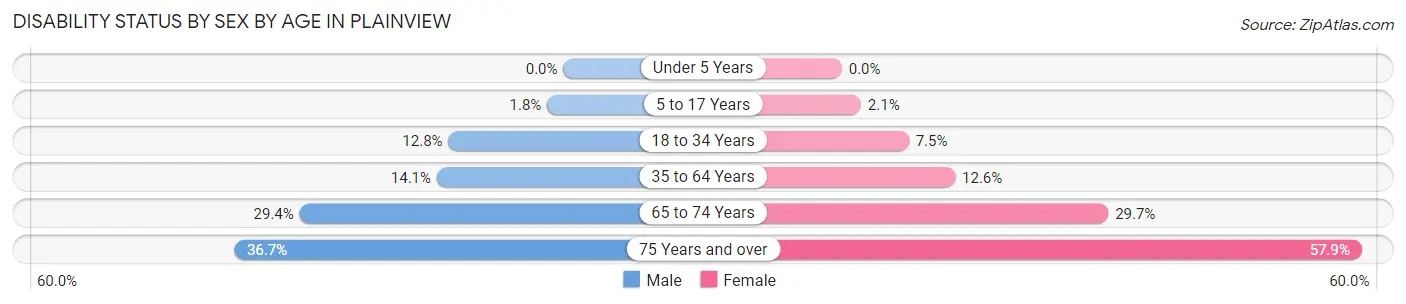
| Age Bracket | Male | Female |
| Under 5 Years | 0 (0.0%) | 0 (0.0%) |
| 5 to 17 Years | 37 (1.8%) | 52 (2.1%) |
| 18 to 34 Years | 322 (12.8%) | 183 (7.4%) |
| 35 to 64 Years | 424 (14.1%) | 419 (12.6%) |
| 65 to 74 Years | 188 (29.4%) | 248 (29.7%) |
| 75 Years and over | 179 (36.7%) | 410 (57.9%) |
Disability Class by Sex by Age in Plainview
Disability Class: Hearing Difficulty
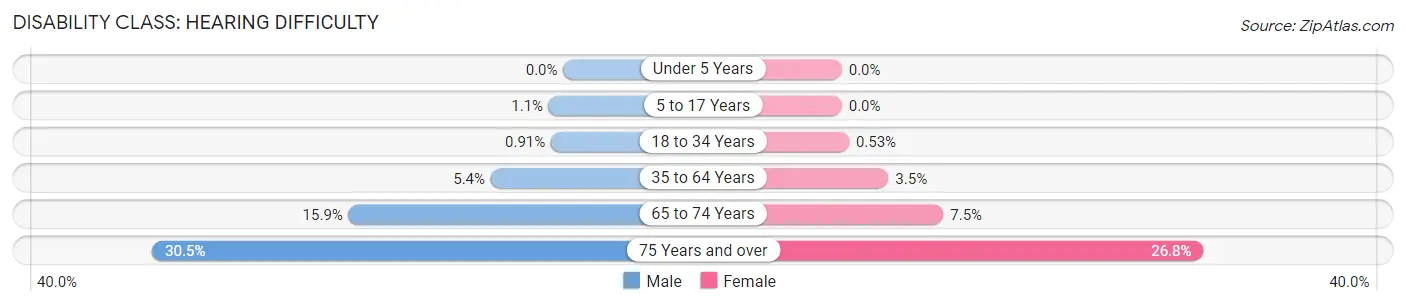
| Age Bracket | Male | Female |
| Under 5 Years | 0 (0.0%) | 0 (0.0%) |
| 5 to 17 Years | 22 (1.1%) | 0 (0.0%) |
| 18 to 34 Years | 23 (0.9%) | 13 (0.5%) |
| 35 to 64 Years | 162 (5.4%) | 115 (3.5%) |
| 65 to 74 Years | 102 (15.9%) | 63 (7.5%) |
| 75 Years and over | 149 (30.5%) | 190 (26.8%) |
Disability Class: Vision Difficulty
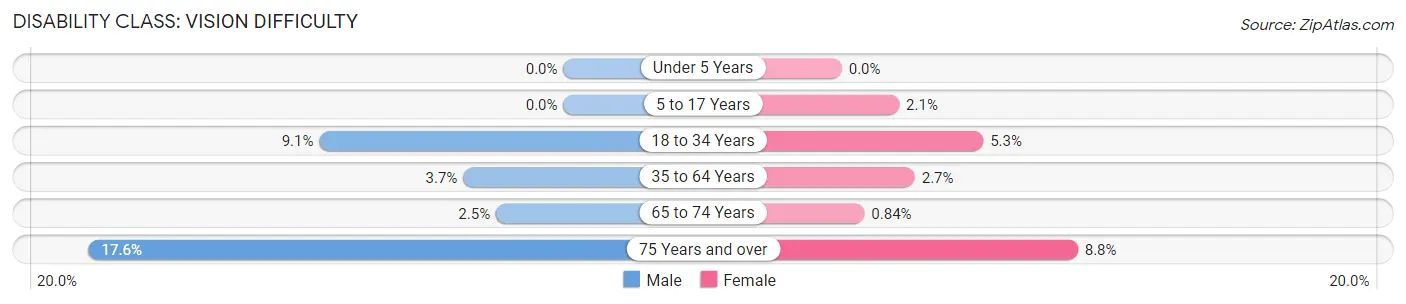
| Age Bracket | Male | Female |
| Under 5 Years | 0 (0.0%) | 0 (0.0%) |
| 5 to 17 Years | 0 (0.0%) | 52 (2.1%) |
| 18 to 34 Years | 228 (9.1%) | 129 (5.2%) |
| 35 to 64 Years | 112 (3.7%) | 90 (2.7%) |
| 65 to 74 Years | 16 (2.5%) | 7 (0.8%) |
| 75 Years and over | 86 (17.6%) | 62 (8.8%) |
Disability Class: Cognitive Difficulty
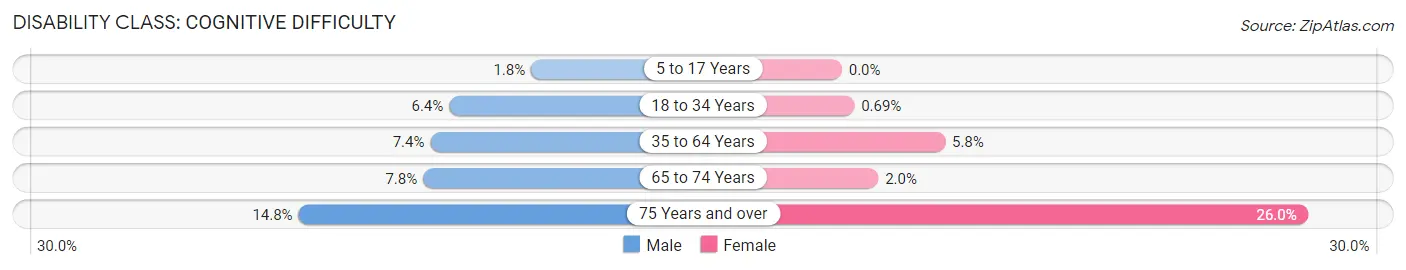
| Age Bracket | Male | Female |
| 5 to 17 Years | 37 (1.8%) | 0 (0.0%) |
| 18 to 34 Years | 160 (6.4%) | 17 (0.7%) |
| 35 to 64 Years | 223 (7.4%) | 191 (5.8%) |
| 65 to 74 Years | 50 (7.8%) | 17 (2.0%) |
| 75 Years and over | 72 (14.7%) | 184 (26.0%) |
Disability Class: Ambulatory Difficulty
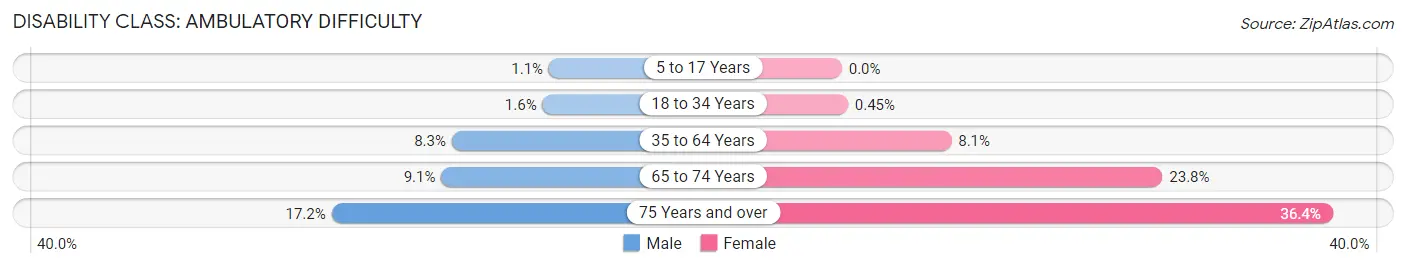
| Age Bracket | Male | Female |
| 5 to 17 Years | 22 (1.1%) | 0 (0.0%) |
| 18 to 34 Years | 39 (1.5%) | 11 (0.4%) |
| 35 to 64 Years | 249 (8.3%) | 270 (8.1%) |
| 65 to 74 Years | 58 (9.1%) | 199 (23.8%) |
| 75 Years and over | 84 (17.2%) | 258 (36.4%) |
Disability Class: Self-Care Difficulty
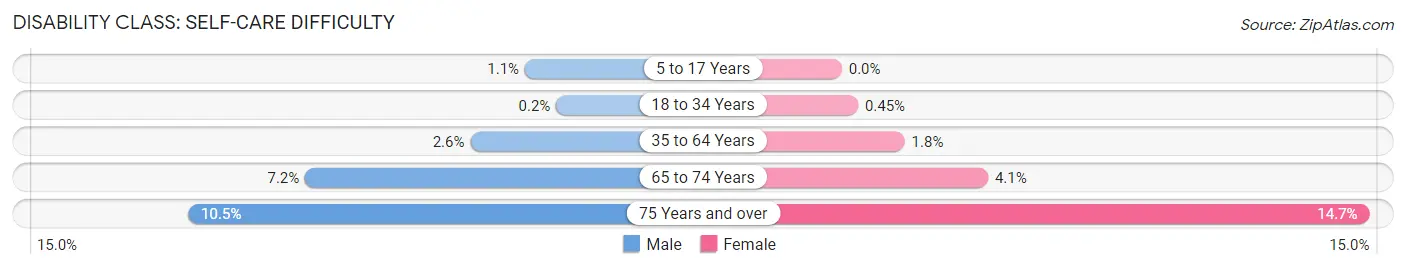
| Age Bracket | Male | Female |
| 5 to 17 Years | 22 (1.1%) | 0 (0.0%) |
| 18 to 34 Years | 5 (0.2%) | 11 (0.4%) |
| 35 to 64 Years | 78 (2.6%) | 58 (1.8%) |
| 65 to 74 Years | 46 (7.2%) | 34 (4.1%) |
| 75 Years and over | 51 (10.4%) | 104 (14.7%) |
Technology Access in Plainview
Computing Device Access in Plainview
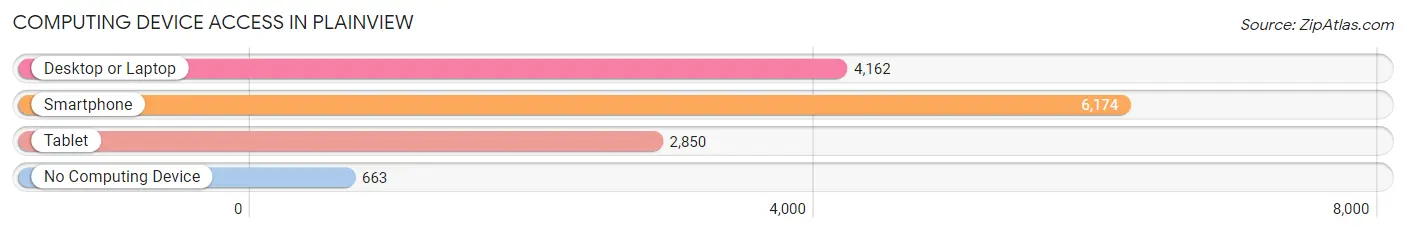
| Device Type | # Households | % Households |
| Desktop or Laptop | 4,162 | 59.3% |
| Smartphone | 6,174 | 88.0% |
| Tablet | 2,850 | 40.6% |
| No Computing Device | 663 | 9.5% |
| Total | 7,016 | 100.0% |
Internet Access in Plainview
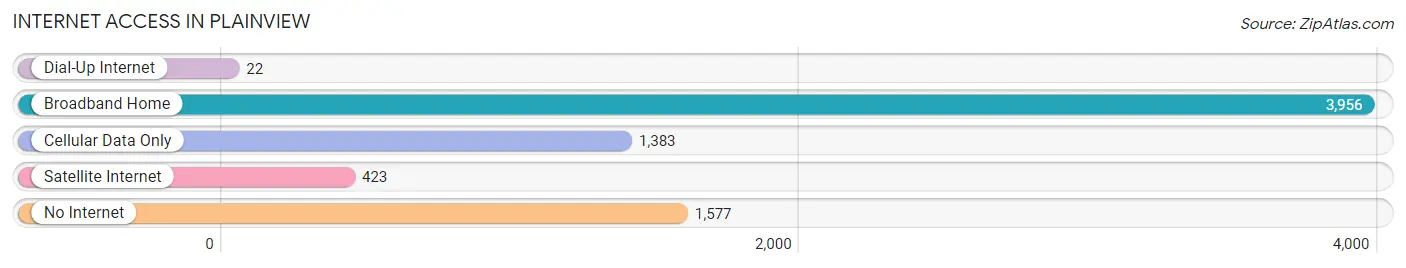
| Internet Type | # Households | % Households |
| Dial-Up Internet | 22 | 0.3% |
| Broadband Home | 3,956 | 56.4% |
| Cellular Data Only | 1,383 | 19.7% |
| Satellite Internet | 423 | 6.0% |
| No Internet | 1,577 | 22.5% |
| Total | 7,016 | 100.0% |
Plainview Summary
Plainview, Texas is a city located in Hale County, Texas, United States. The population was 22,194 at the 2010 census. It is the county seat of Hale County and is located in the Llano Estacado region of the state.
History
The area around Plainview was first settled in the late 1880s. The town was founded in 1888 when the Santa Fe Railroad built a line through the area. The town was named after a nearby spring, which was called Plain View. The town was incorporated in 1906 and by 1910 had a population of 1,200.
Geography
Plainview is located in the Llano Estacado region of Texas. It is situated at the intersection of U.S. Highway 70 and State Highway 194. The city is located approximately 25 miles south of Lubbock and 100 miles north of Amarillo. The elevation of Plainview is 3,400 feet above sea level.
The climate in Plainview is semi-arid, with hot summers and mild winters. The average annual temperature is 64°F, with an average high of 91°F in July and an average low of 33°F in January. The average annual precipitation is 19.5 inches.
Economy
The economy of Plainview is largely based on agriculture and manufacturing. The city is home to several large food processing plants, including Cargill, Pilgrim’s Pride, and Tyson Foods. The city is also home to several large retail stores, including Walmart, Lowe’s, and Home Depot.
The city is also home to Wayland Baptist University, a private, four-year university. The university has an enrollment of approximately 4,000 students and offers a variety of degree programs.
Demographics
As of the 2010 census, the population of Plainview was 22,194. The racial makeup of the city was 68.3% White, 1.3% African American, 0.7% Native American, 0.7% Asian, 0.1% Pacific Islander, and 28.9% from other races. Hispanic or Latino of any race were 57.2% of the population.
The median income for a household in Plainview was $31,945, and the median income for a family was $37,945. The per capita income for the city was $17,845. About 19.2% of families and 22.7% of the population were below the poverty line, including 33.2% of those under age 18 and 11.7% of those age 65 or over.
Conclusion
Plainview, Texas is a city located in Hale County, Texas, United States. The city is home to several large food processing plants, retail stores, and Wayland Baptist University. The population of Plainview was 22,194 at the 2010 census, with a median income for a household of $31,945. The city has a semi-arid climate, with hot summers and mild winters.
Common Questions
What is Per Capita Income in Plainview?
Per Capita income in Plainview is $24,171.
What is the Median Family Income in Plainview?
Median Family Income in Plainview is $54,854.
What is the Median Household income in Plainview?
Median Household Income in Plainview is $46,274.
What is Income or Wage Gap in Plainview?
Income or Wage Gap in Plainview is 46.5%.
Women in Plainview earn 53.5 cents for every dollar earned by a man.
What is Inequality or Gini Index in Plainview?
Inequality or Gini Index in Plainview is 0.46.
What is the Total Population of Plainview?
Total Population of Plainview is 20,113.
What is the Total Male Population of Plainview?
Total Male Population of Plainview is 9,531.
What is the Total Female Population of Plainview?
Total Female Population of Plainview is 10,582.
What is the Ratio of Males per 100 Females in Plainview?
There are 90.07 Males per 100 Females in Plainview.
What is the Ratio of Females per 100 Males in Plainview?
There are 111.03 Females per 100 Males in Plainview.
What is the Median Population Age in Plainview?
Median Population Age in Plainview is 31.5 Years.
What is the Average Family Size in Plainview
Average Family Size in Plainview is 3.3 People.
What is the Average Household Size in Plainview
Average Household Size in Plainview is 2.8 People.
How Large is the Labor Force in Plainview?
There are 9,510 People in the Labor Forcein in Plainview.
What is the Percentage of People in the Labor Force in Plainview?
64.1% of People are in the Labor Force in Plainview.
What is the Unemployment Rate in Plainview?
Unemployment Rate in Plainview is 6.6%.