Deer Park, TX Map & Demographics
Deer Park Map
Deer Park Overview
$37,440
PER CAPITA INCOME
$106,429
AVG FAMILY INCOME
$89,219
AVG HOUSEHOLD INCOME
53.8%
WAGE / INCOME GAP [ % ]
46.2¢/ $1
WAGE / INCOME GAP [ $ ]
0.40
INEQUALITY / GINI INDEX
34,046
TOTAL POPULATION
17,015
MALE POPULATION
17,031
FEMALE POPULATION
99.91
MALES / 100 FEMALES
100.09
FEMALES / 100 MALES
36.8
MEDIAN AGE
3.4
AVG FAMILY SIZE
3.0
AVG HOUSEHOLD SIZE
16,848
LABOR FORCE [ PEOPLE ]
63.4%
PERCENT IN LABOR FORCE
4.9%
UNEMPLOYMENT RATE
Deer Park Zip Codes
Income in Deer Park
Income Overview in Deer Park
Per Capita Income in Deer Park is $37,440, while median incomes of families and households are $106,429 and $89,219 respectively.
| Characteristic | Number | Measure |
| Per Capita Income | 34,046 | $37,440 |
| Median Family Income | 8,818 | $106,429 |
| Mean Family Income | 8,818 | $120,905 |
| Median Household Income | 11,496 | $89,219 |
| Mean Household Income | 11,496 | $108,773 |
| Income Deficit | 8,818 | $0 |
| Wage / Income Gap (%) | 34,046 | 53.77% |
| Wage / Income Gap ($) | 34,046 | 46.23¢ per $1 |
| Gini / Inequality Index | 34,046 | 0.40 |
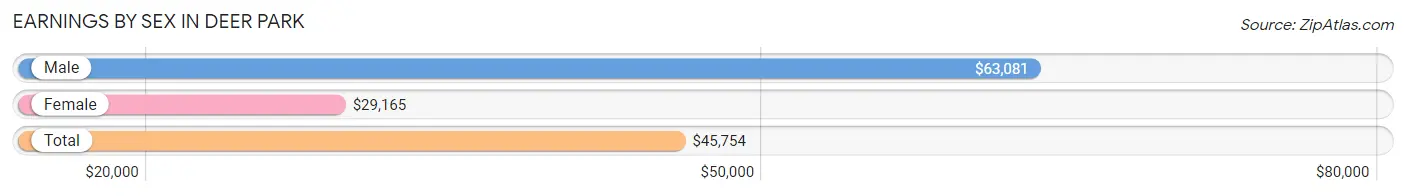
Earnings by Sex in Deer Park
Average Earnings in Deer Park are $45,754, $63,081 for men and $29,165 for women, a difference of 53.8%.
| Sex | Number | Average Earnings |
| Male | 9,213 (52.3%) | $63,081 |
| Female | 8,409 (47.7%) | $29,165 |
| Total | 17,622 (100.0%) | $45,754 |
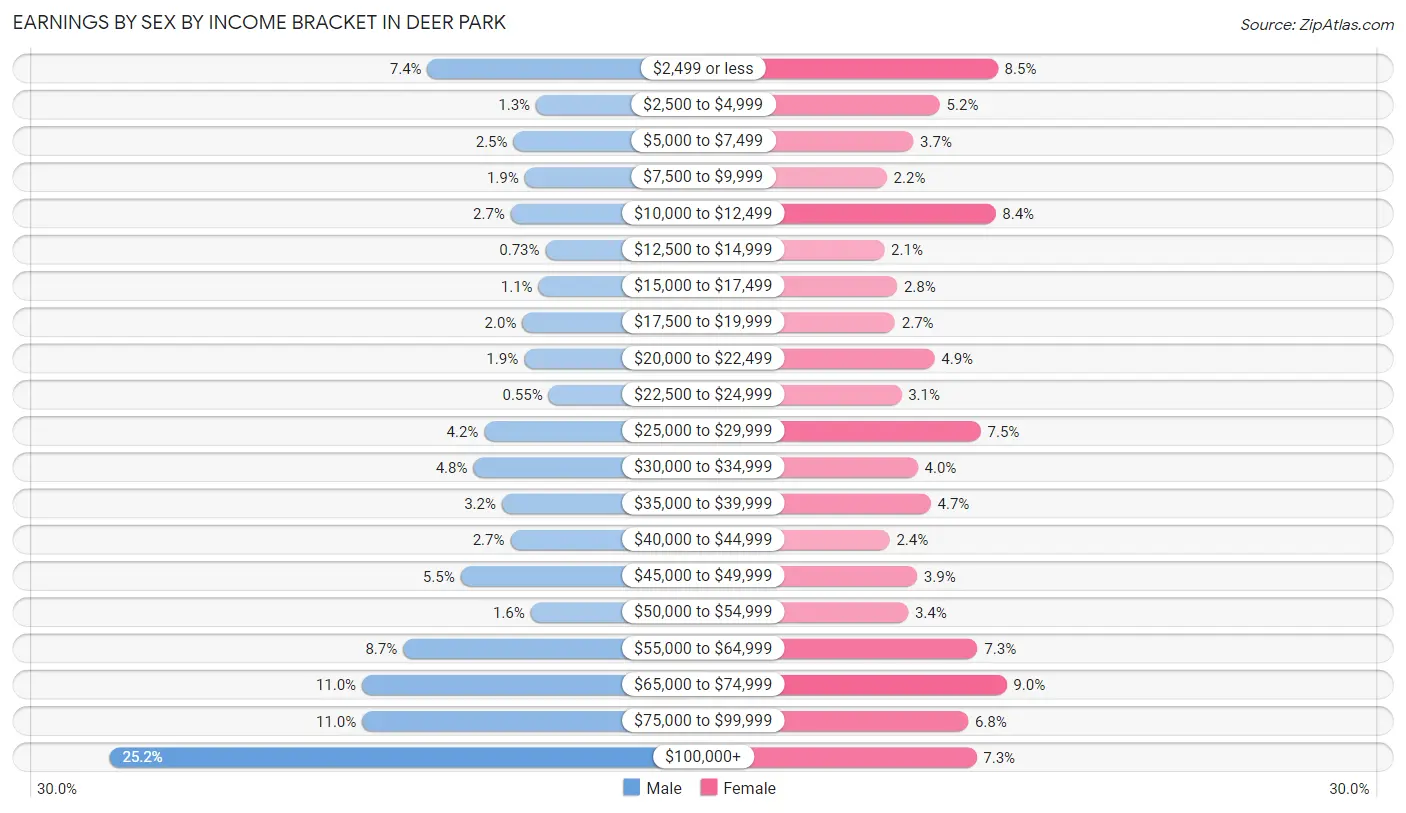
Earnings by Sex by Income Bracket in Deer Park
The most common earnings brackets in Deer Park are $100,000+ for men (2,324 | 25.2%) and $65,000 to $74,999 for women (754 | 9.0%).
| Income | Male | Female |
| $2,499 or less | 678 (7.4%) | 713 (8.5%) |
| $2,500 to $4,999 | 116 (1.3%) | 439 (5.2%) |
| $5,000 to $7,499 | 233 (2.5%) | 314 (3.7%) |
| $7,500 to $9,999 | 175 (1.9%) | 188 (2.2%) |
| $10,000 to $12,499 | 247 (2.7%) | 702 (8.4%) |
| $12,500 to $14,999 | 67 (0.7%) | 177 (2.1%) |
| $15,000 to $17,499 | 103 (1.1%) | 237 (2.8%) |
| $17,500 to $19,999 | 187 (2.0%) | 227 (2.7%) |
| $20,000 to $22,499 | 178 (1.9%) | 414 (4.9%) |
| $22,500 to $24,999 | 51 (0.5%) | 257 (3.1%) |
| $25,000 to $29,999 | 384 (4.2%) | 632 (7.5%) |
| $30,000 to $34,999 | 440 (4.8%) | 335 (4.0%) |
| $35,000 to $39,999 | 293 (3.2%) | 396 (4.7%) |
| $40,000 to $44,999 | 249 (2.7%) | 202 (2.4%) |
| $45,000 to $49,999 | 507 (5.5%) | 331 (3.9%) |
| $50,000 to $54,999 | 144 (1.6%) | 289 (3.4%) |
| $55,000 to $64,999 | 804 (8.7%) | 617 (7.3%) |
| $65,000 to $74,999 | 1,017 (11.0%) | 754 (9.0%) |
| $75,000 to $99,999 | 1,016 (11.0%) | 573 (6.8%) |
| $100,000+ | 2,324 (25.2%) | 612 (7.3%) |
| Total | 9,213 (100.0%) | 8,409 (100.0%) |
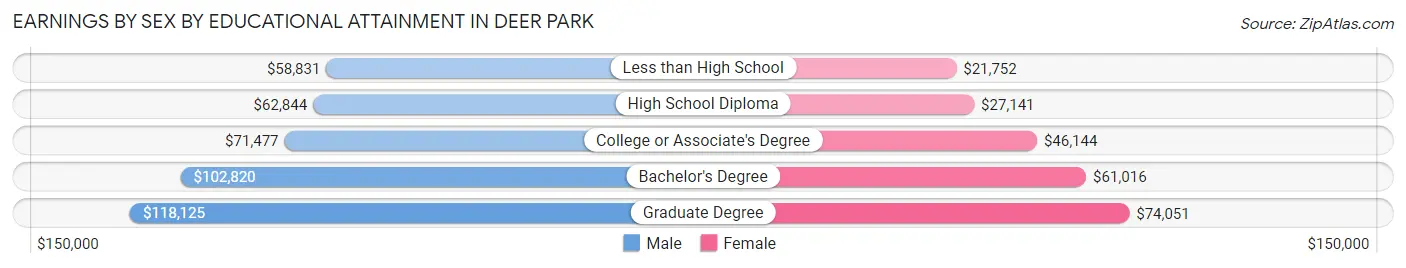
Earnings by Sex by Educational Attainment in Deer Park
Average earnings in Deer Park are $68,349 for men and $42,648 for women, a difference of 37.6%. Men with an educational attainment of graduate degree enjoy the highest average annual earnings of $118,125, while those with less than high school education earn the least with $58,831. Women with an educational attainment of graduate degree earn the most with the average annual earnings of $74,051, while those with less than high school education have the smallest earnings of $21,752.
| Educational Attainment | Male Income | Female Income |
| Less than High School | $58,831 | $21,752 |
| High School Diploma | $62,844 | $27,141 |
| College or Associate's Degree | $71,477 | $46,144 |
| Bachelor's Degree | $102,820 | $61,016 |
| Graduate Degree | $118,125 | $74,051 |
| Total | $68,349 | $42,648 |
Family Income in Deer Park
Family Income Brackets in Deer Park
According to the Deer Park family income data, there are 2,363 families falling into the $100,000 to $149,999 income range, which is the most common income bracket and makes up 26.8% of all families. Conversely, the $10,000 to $14,999 income bracket is the least frequent group with only 35 families (0.4%) belonging to this category.
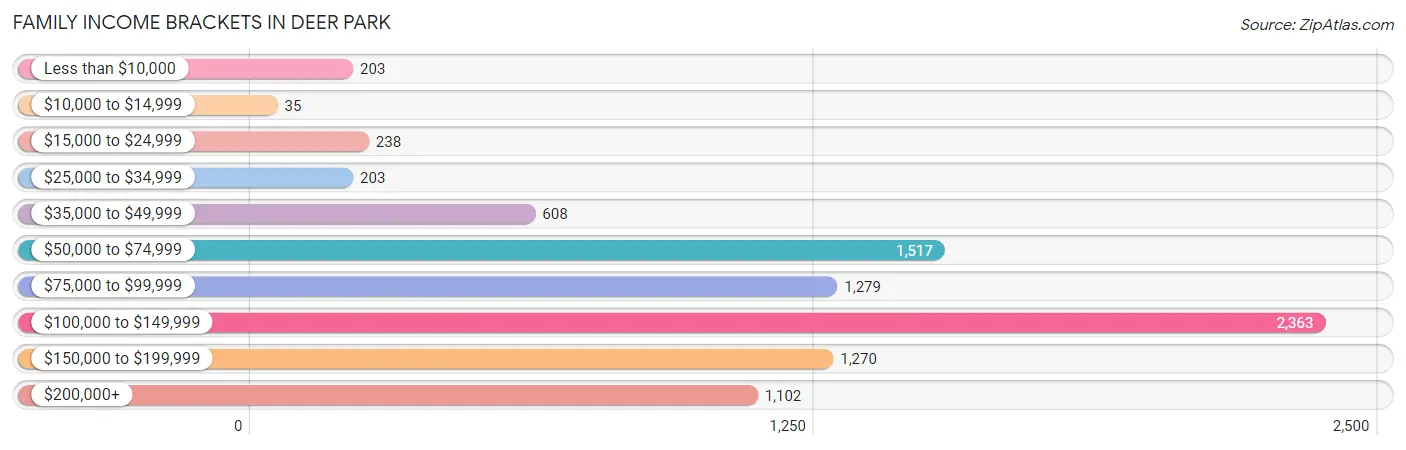
| Income Bracket | # Families | % Families |
| Less than $10,000 | 203 | 2.3% |
| $10,000 to $14,999 | 35 | 0.4% |
| $15,000 to $24,999 | 238 | 2.7% |
| $25,000 to $34,999 | 203 | 2.3% |
| $35,000 to $49,999 | 608 | 6.9% |
| $50,000 to $74,999 | 1,517 | 17.2% |
| $75,000 to $99,999 | 1,279 | 14.5% |
| $100,000 to $149,999 | 2,363 | 26.8% |
| $150,000 to $199,999 | 1,270 | 14.4% |
| $200,000+ | 1,102 | 12.5% |
Family Income by Famaliy Size in Deer Park
4-person families (2,080 | 23.6%) account for the highest median family income in Deer Park with $127,877 per family, while 2-person families (3,314 | 37.6%) have the highest median income of $45,114 per family member.
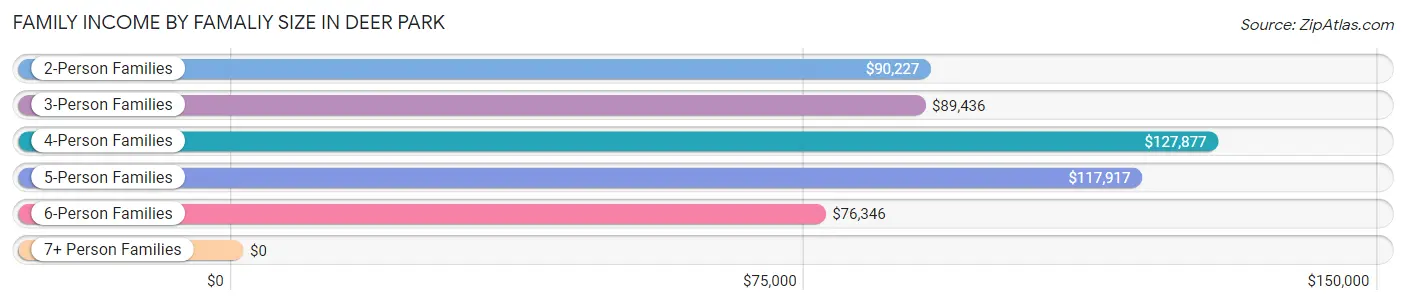
| Income Bracket | # Families | Median Income |
| 2-Person Families | 3,314 (37.6%) | $90,227 |
| 3-Person Families | 1,947 (22.1%) | $89,436 |
| 4-Person Families | 2,080 (23.6%) | $127,877 |
| 5-Person Families | 986 (11.2%) | $117,917 |
| 6-Person Families | 368 (4.2%) | $76,346 |
| 7+ Person Families | 123 (1.4%) | $0 |
| Total | 8,818 (100.0%) | $106,429 |
Family Income by Number of Earners in Deer Park
The median family income in Deer Park is $106,429, with families comprising 3+ earners (1,678) having the highest median family income of $167,900, while families with no earners (991) have the lowest median family income of $52,775, accounting for 19.0% and 11.2% of families, respectively.
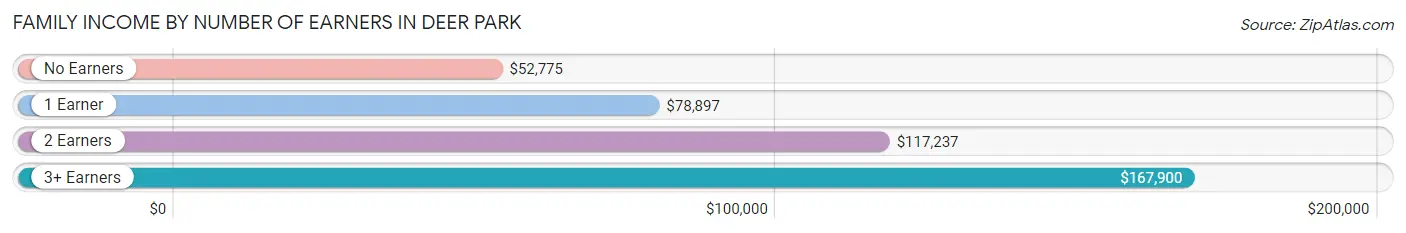
| Number of Earners | # Families | Median Income |
| No Earners | 991 (11.2%) | $52,775 |
| 1 Earner | 2,617 (29.7%) | $78,897 |
| 2 Earners | 3,532 (40.1%) | $117,237 |
| 3+ Earners | 1,678 (19.0%) | $167,900 |
| Total | 8,818 (100.0%) | $106,429 |
Household Income in Deer Park
Household Income Brackets in Deer Park
With 2,644 households falling in the category, the $100,000 to $149,999 income range is the most frequent in Deer Park, accounting for 23.0% of all households. In contrast, only 241 households (2.1%) fall into the less than $10,000 income bracket, making it the least populous group.
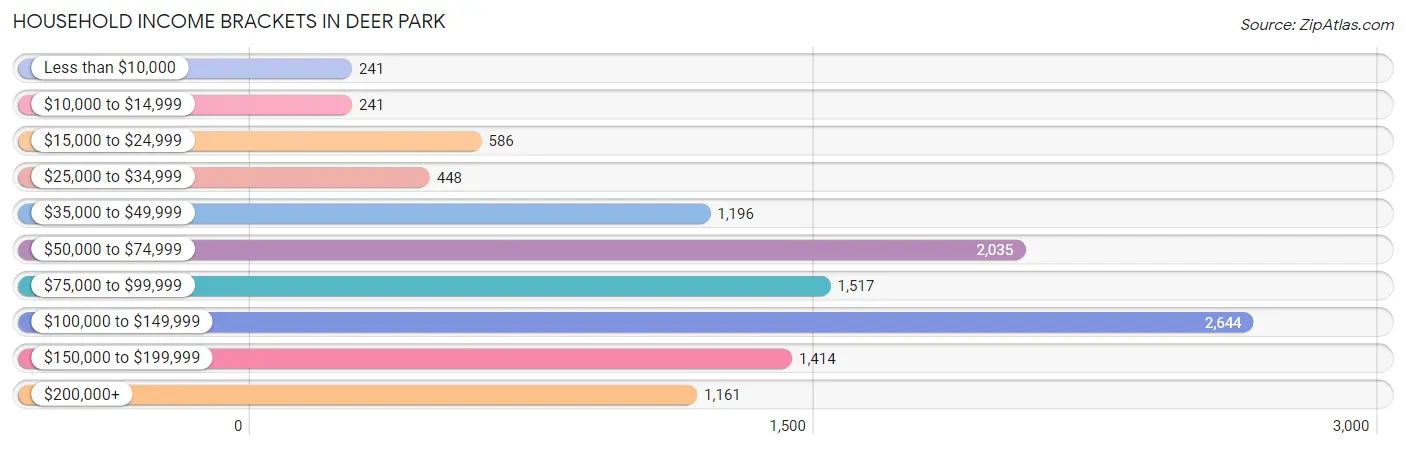
| Income Bracket | # Households | % Households |
| Less than $10,000 | 241 | 2.1% |
| $10,000 to $14,999 | 241 | 2.1% |
| $15,000 to $24,999 | 586 | 5.1% |
| $25,000 to $34,999 | 448 | 3.9% |
| $35,000 to $49,999 | 1,196 | 10.4% |
| $50,000 to $74,999 | 2,035 | 17.7% |
| $75,000 to $99,999 | 1,517 | 13.2% |
| $100,000 to $149,999 | 2,644 | 23.0% |
| $150,000 to $199,999 | 1,414 | 12.3% |
| $200,000+ | 1,161 | 10.1% |
Household Income by Householder Age in Deer Park
The median household income in Deer Park is $89,219, with the highest median household income of $116,446 found in the 45 to 64 years age bracket for the primary householder. A total of 4,166 households (36.2%) fall into this category. Meanwhile, the 65+ years age bracket for the primary householder has the lowest median household income of $56,089, with 3,341 households (29.1%) in this group.
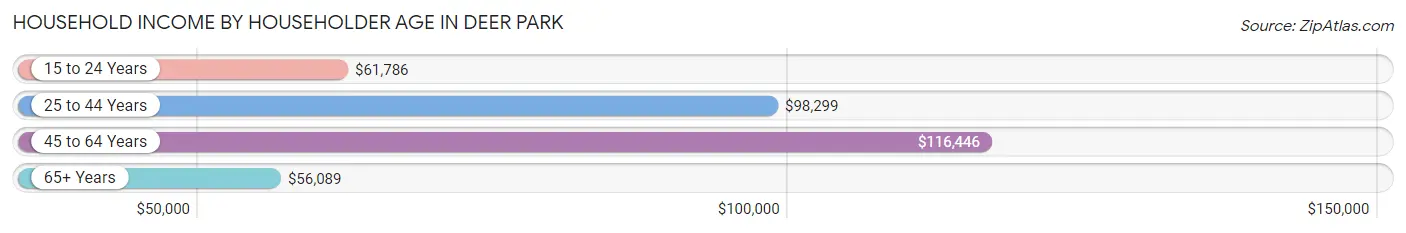
| Income Bracket | # Households | Median Income |
| 15 to 24 Years | 448 (3.9%) | $61,786 |
| 25 to 44 Years | 3,541 (30.8%) | $98,299 |
| 45 to 64 Years | 4,166 (36.2%) | $116,446 |
| 65+ Years | 3,341 (29.1%) | $56,089 |
| Total | 11,496 (100.0%) | $89,219 |
Poverty in Deer Park
Income Below Poverty by Sex and Age in Deer Park
With 6.8% poverty level for males and 7.9% for females among the residents of Deer Park, 5 year old males and 5 year old females are the most vulnerable to poverty, with 97 males (38.3%) and 32 females (28.8%) in their respective age groups living below the poverty level.
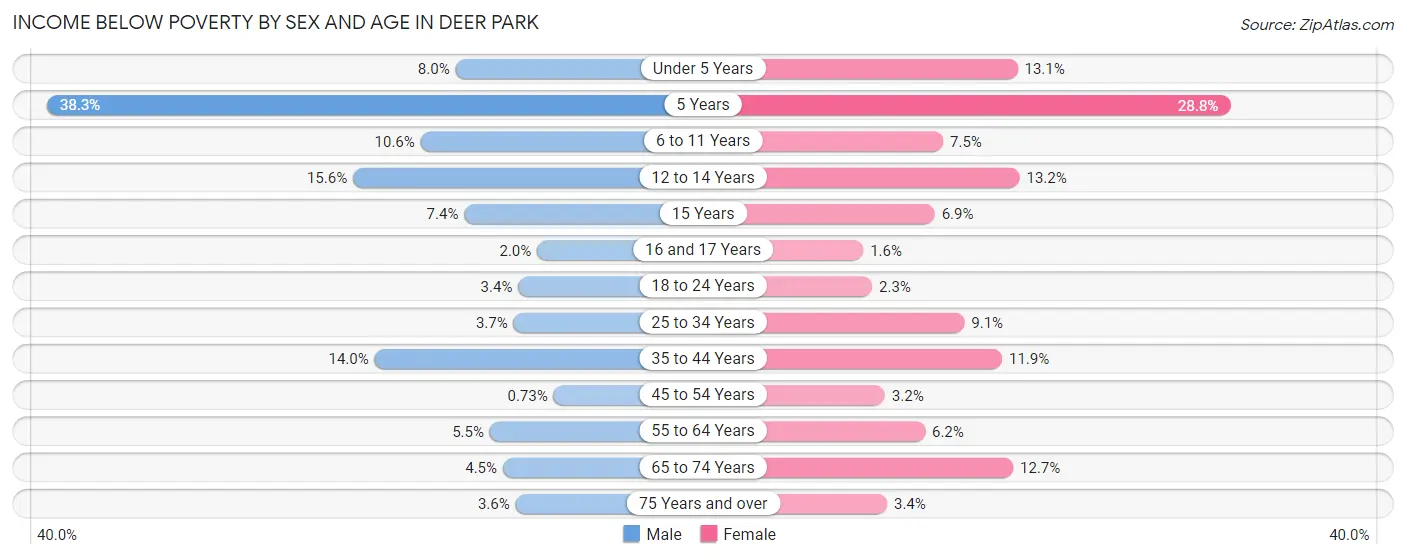
| Age Bracket | Male | Female |
| Under 5 Years | 94 (8.0%) | 125 (13.1%) |
| 5 Years | 97 (38.3%) | 32 (28.8%) |
| 6 to 11 Years | 170 (10.6%) | 90 (7.5%) |
| 12 to 14 Years | 112 (15.6%) | 104 (13.2%) |
| 15 Years | 17 (7.4%) | 22 (6.9%) |
| 16 and 17 Years | 12 (1.9%) | 10 (1.6%) |
| 18 to 24 Years | 65 (3.4%) | 43 (2.2%) |
| 25 to 34 Years | 65 (3.7%) | 169 (9.1%) |
| 35 to 44 Years | 295 (14.0%) | 304 (11.9%) |
| 45 to 54 Years | 15 (0.7%) | 59 (3.2%) |
| 55 to 64 Years | 106 (5.5%) | 118 (6.2%) |
| 65 to 74 Years | 73 (4.5%) | 215 (12.7%) |
| 75 Years and over | 31 (3.5%) | 39 (3.4%) |
| Total | 1,152 (6.8%) | 1,330 (7.9%) |
Income Above Poverty by Sex and Age in Deer Park
According to the poverty statistics in Deer Park, males aged 45 to 54 years and females aged 16 and 17 years are the age groups that are most secure financially, with 99.3% of males and 98.4% of females in these age groups living above the poverty line.
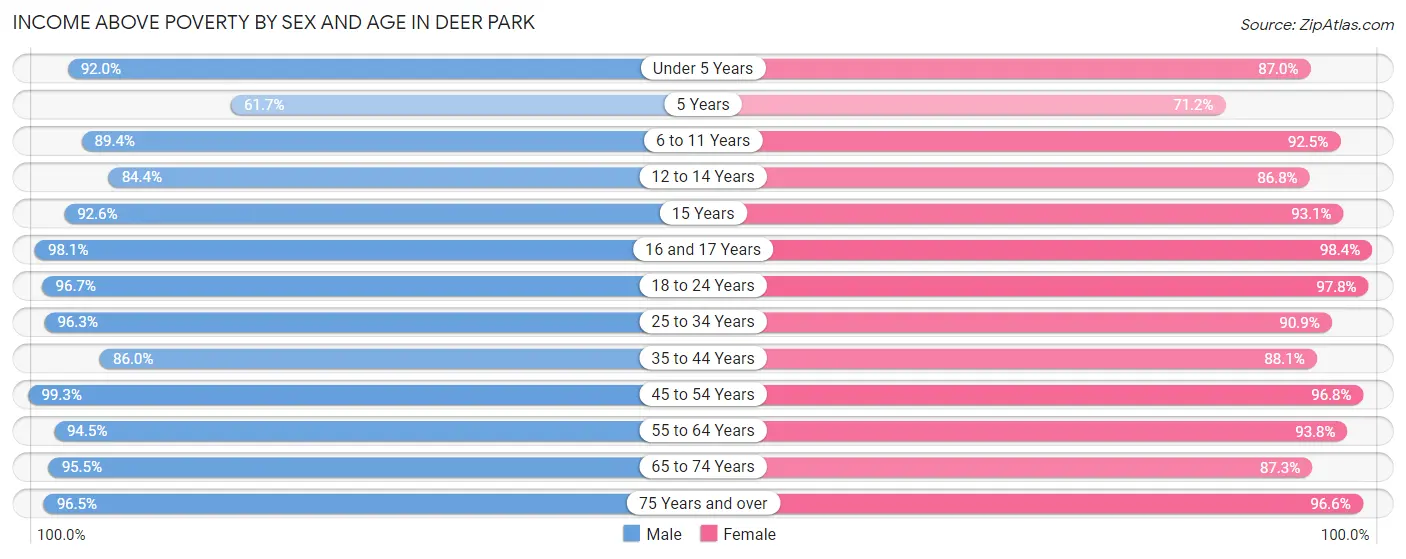
| Age Bracket | Male | Female |
| Under 5 Years | 1,079 (92.0%) | 833 (87.0%) |
| 5 Years | 156 (61.7%) | 79 (71.2%) |
| 6 to 11 Years | 1,434 (89.4%) | 1,107 (92.5%) |
| 12 to 14 Years | 605 (84.4%) | 684 (86.8%) |
| 15 Years | 214 (92.6%) | 297 (93.1%) |
| 16 and 17 Years | 604 (98.1%) | 618 (98.4%) |
| 18 to 24 Years | 1,876 (96.7%) | 1,872 (97.8%) |
| 25 to 34 Years | 1,694 (96.3%) | 1,689 (90.9%) |
| 35 to 44 Years | 1,809 (86.0%) | 2,250 (88.1%) |
| 45 to 54 Years | 2,048 (99.3%) | 1,782 (96.8%) |
| 55 to 64 Years | 1,835 (94.5%) | 1,790 (93.8%) |
| 65 to 74 Years | 1,554 (95.5%) | 1,475 (87.3%) |
| 75 Years and over | 842 (96.5%) | 1,122 (96.6%) |
| Total | 15,750 (93.2%) | 15,598 (92.1%) |
Income Below Poverty Among Married-Couple Families in Deer Park
The poverty statistics for married-couple families in Deer Park show that 2.2% or 154 of the total 6,908 families live below the poverty line. Families with 3 or 4 children have the highest poverty rate of 9.4%, comprising of 54 families. On the other hand, families with 5 or more children have the lowest poverty rate of 0.0%, which includes 0 families.
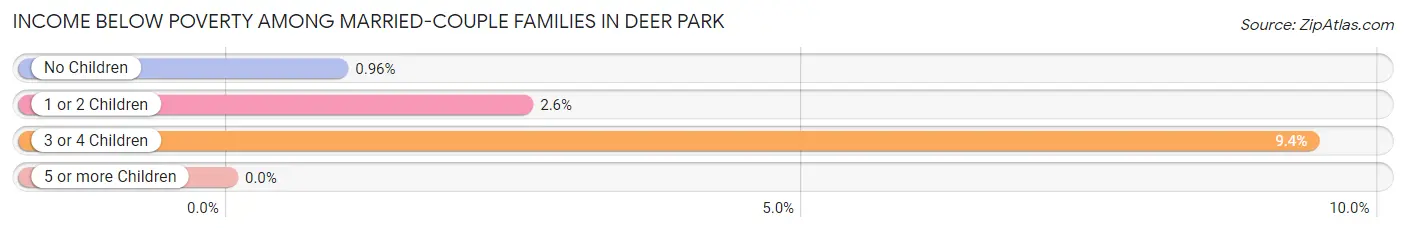
| Children | Above Poverty | Below Poverty |
| No Children | 3,812 (99.0%) | 37 (1.0%) |
| 1 or 2 Children | 2,386 (97.4%) | 63 (2.6%) |
| 3 or 4 Children | 520 (90.6%) | 54 (9.4%) |
| 5 or more Children | 36 (100.0%) | 0 (0.0%) |
| Total | 6,754 (97.8%) | 154 (2.2%) |
Income Below Poverty Among Single-Parent Households in Deer Park
According to the poverty data in Deer Park, 6.1% or 24 single-father households and 17.5% or 266 single-mother households are living below the poverty line. Among single-father households, those with no children have the highest poverty rate, with 24 households (29.3%) experiencing poverty. Likewise, among single-mother households, those with 3 or 4 children have the highest poverty rate, with 63 households (81.8%) falling below the poverty line.
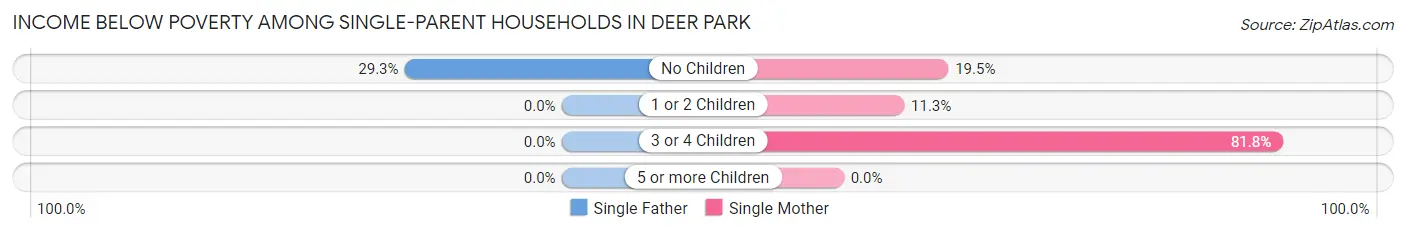
| Children | Single Father | Single Mother |
| No Children | 24 (29.3%) | 97 (19.5%) |
| 1 or 2 Children | 0 (0.0%) | 106 (11.3%) |
| 3 or 4 Children | 0 (0.0%) | 63 (81.8%) |
| 5 or more Children | 0 (0.0%) | 0 (0.0%) |
| Total | 24 (6.1%) | 266 (17.5%) |
Income Below Poverty Among Married-Couple vs Single-Parent Households in Deer Park
The poverty data for Deer Park shows that 154 of the married-couple family households (2.2%) and 290 of the single-parent households (15.2%) are living below the poverty level. Within the married-couple family households, those with 3 or 4 children have the highest poverty rate, with 54 households (9.4%) falling below the poverty line. Among the single-parent households, those with 3 or 4 children have the highest poverty rate, with 63 household (31.8%) living below poverty.
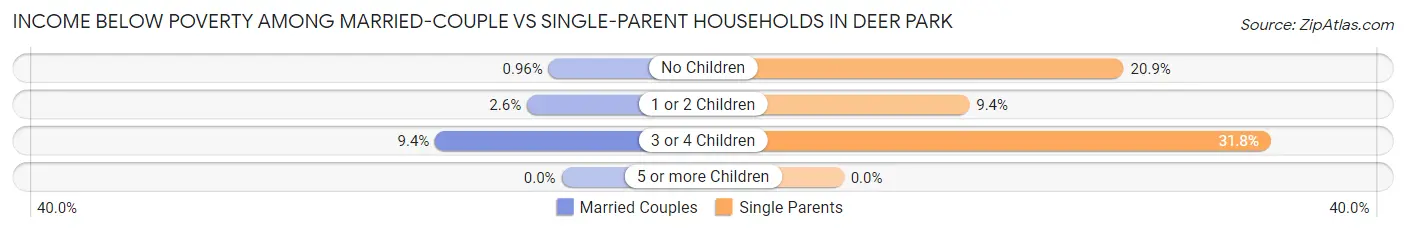
| Children | Married-Couple Families | Single-Parent Households |
| No Children | 37 (1.0%) | 121 (20.9%) |
| 1 or 2 Children | 63 (2.6%) | 106 (9.4%) |
| 3 or 4 Children | 54 (9.4%) | 63 (31.8%) |
| 5 or more Children | 0 (0.0%) | 0 (0.0%) |
| Total | 154 (2.2%) | 290 (15.2%) |
Race in Deer Park
The most populous races in Deer Park are White / Caucasian (25,405 | 74.6%), Hispanic or Latino (14,159 | 41.6%), and Two or more Races (5,135 | 15.1%).
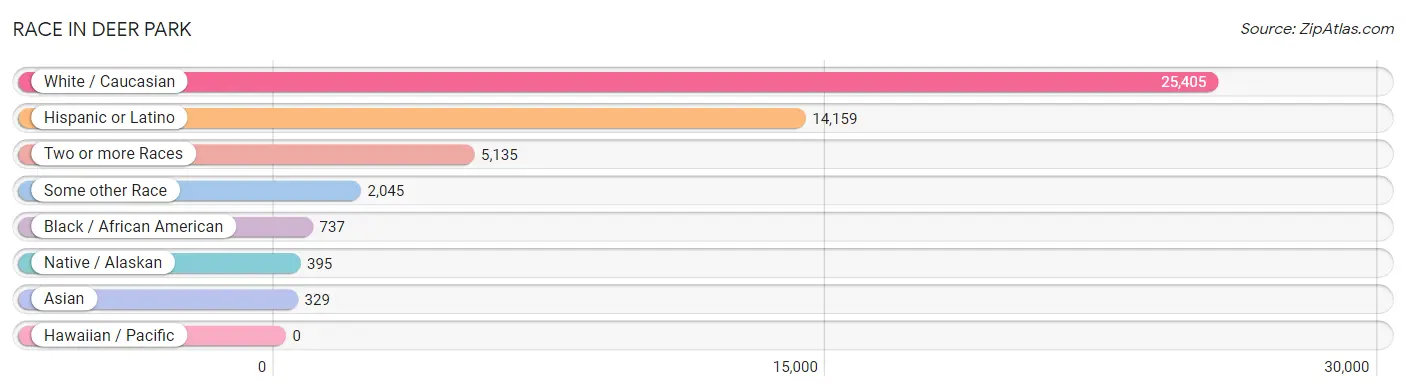
| Race | # Population | % Population |
| Asian | 329 | 1.0% |
| Black / African American | 737 | 2.2% |
| Hawaiian / Pacific | 0 | 0.0% |
| Hispanic or Latino | 14,159 | 41.6% |
| Native / Alaskan | 395 | 1.2% |
| White / Caucasian | 25,405 | 74.6% |
| Two or more Races | 5,135 | 15.1% |
| Some other Race | 2,045 | 6.0% |
| Total | 34,046 | 100.0% |
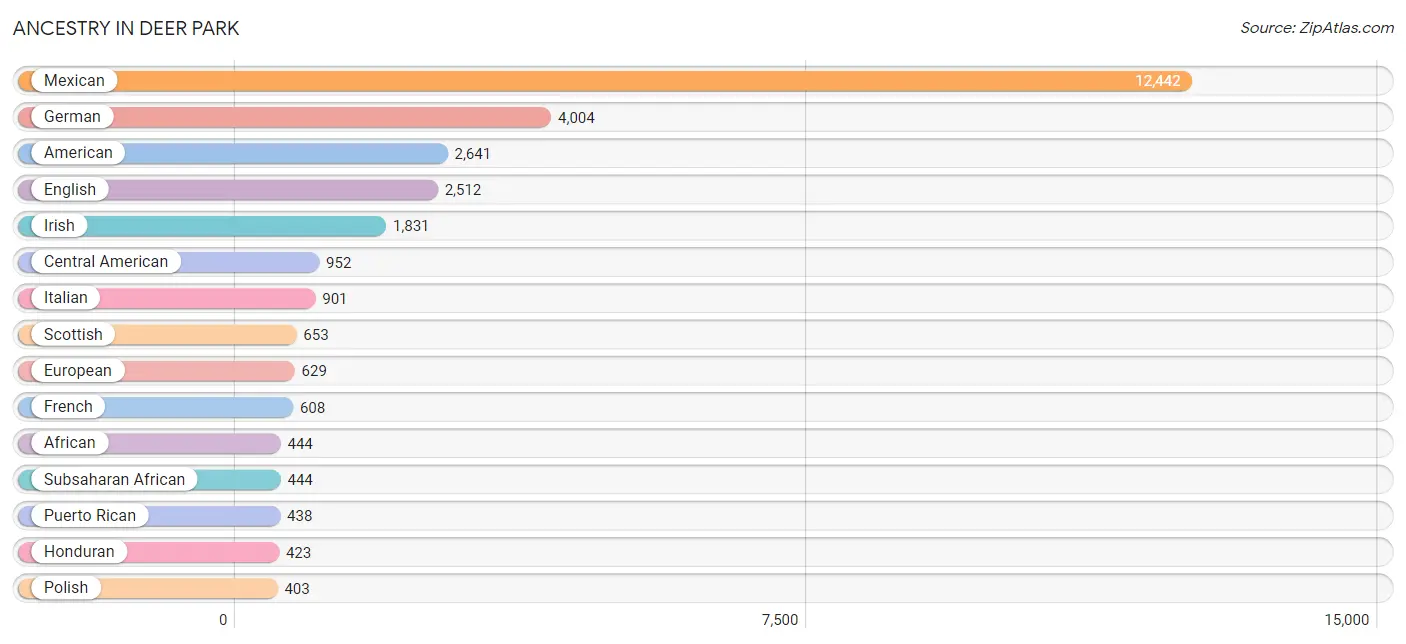
Ancestry in Deer Park
The most populous ancestries reported in Deer Park are Mexican (12,442 | 36.5%), German (4,004 | 11.8%), American (2,641 | 7.8%), English (2,512 | 7.4%), and Irish (1,831 | 5.4%), together accounting for 68.8% of all Deer Park residents.
| Ancestry | # Population | % Population |
| African | 444 | 1.3% |
| American | 2,641 | 7.8% |
| Arab | 67 | 0.2% |
| Austrian | 41 | 0.1% |
| Bhutanese | 34 | 0.1% |
| British | 108 | 0.3% |
| Burmese | 17 | 0.1% |
| Cajun | 12 | 0.0% |
| Canadian | 30 | 0.1% |
| Central American | 952 | 2.8% |
| Central American Indian | 10 | 0.0% |
| Cherokee | 105 | 0.3% |
| Choctaw | 10 | 0.0% |
| Colombian | 9 | 0.0% |
| Costa Rican | 51 | 0.2% |
| Cuban | 108 | 0.3% |
| Czech | 137 | 0.4% |
| Czechoslovakian | 8 | 0.0% |
| Danish | 32 | 0.1% |
| Dutch | 302 | 0.9% |
| Dutch West Indian | 139 | 0.4% |
| Ecuadorian | 32 | 0.1% |
| English | 2,512 | 7.4% |
| European | 629 | 1.8% |
| French | 608 | 1.8% |
| French Canadian | 110 | 0.3% |
| German | 4,004 | 11.8% |
| German Russian | 15 | 0.0% |
| Guatemalan | 42 | 0.1% |
| Haitian | 13 | 0.0% |
| Honduran | 423 | 1.2% |
| Hungarian | 38 | 0.1% |
| Indian (Asian) | 38 | 0.1% |
| Irish | 1,831 | 5.4% |
| Italian | 901 | 2.6% |
| Korean | 162 | 0.5% |
| Mexican | 12,442 | 36.5% |
| Mexican American Indian | 367 | 1.1% |
| Nicaraguan | 47 | 0.1% |
| Norwegian | 223 | 0.6% |
| Osage | 13 | 0.0% |
| Palestinian | 67 | 0.2% |
| Peruvian | 45 | 0.1% |
| Polish | 403 | 1.2% |
| Puerto Rican | 438 | 1.3% |
| Russian | 8 | 0.0% |
| Salvadoran | 389 | 1.1% |
| Samoan | 6 | 0.0% |
| Scandinavian | 136 | 0.4% |
| Scotch-Irish | 266 | 0.8% |
| Scottish | 653 | 1.9% |
| Slavic | 50 | 0.2% |
| South American | 86 | 0.3% |
| South American Indian | 58 | 0.2% |
| Spaniard | 41 | 0.1% |
| Spanish | 20 | 0.1% |
| Sri Lankan | 58 | 0.2% |
| Subsaharan African | 444 | 1.3% |
| Swedish | 49 | 0.1% |
| Swiss | 82 | 0.2% |
| Thai | 56 | 0.2% |
| Welsh | 102 | 0.3% | View All 62 Rows |
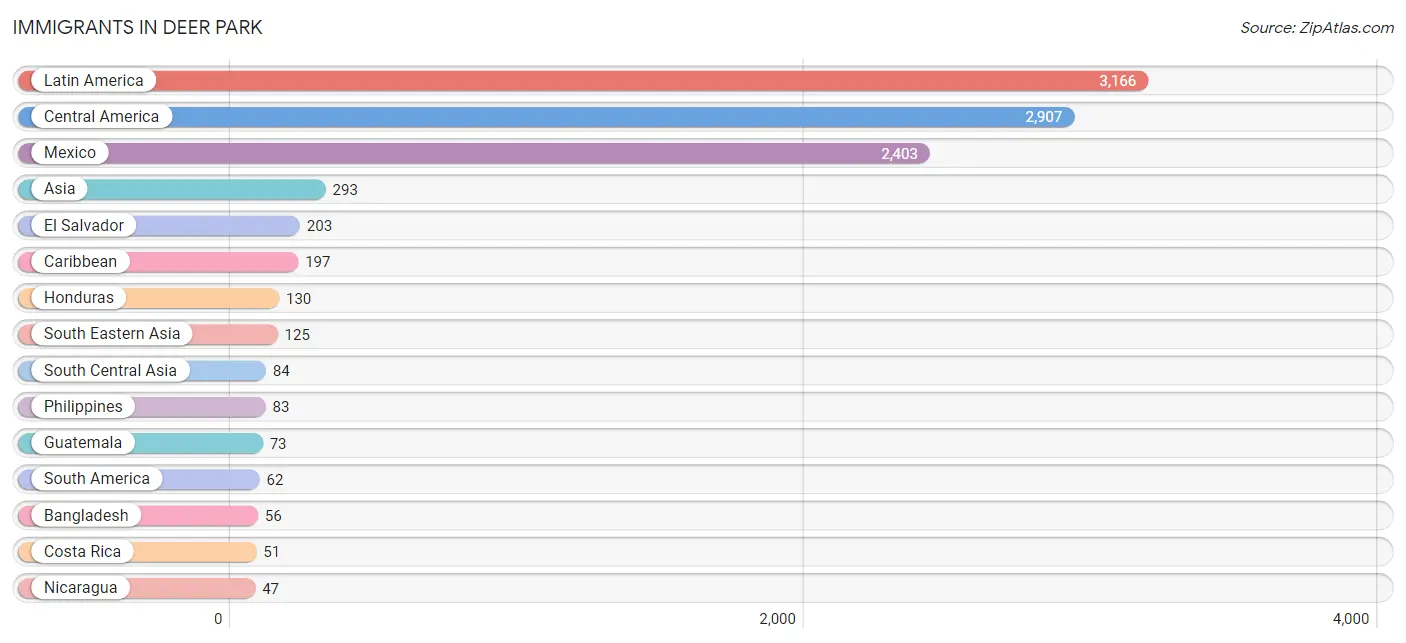
Immigrants in Deer Park
The most numerous immigrant groups reported in Deer Park came from Latin America (3,166 | 9.3%), Central America (2,907 | 8.5%), Mexico (2,403 | 7.1%), Asia (293 | 0.9%), and El Salvador (203 | 0.6%), together accounting for 26.4% of all Deer Park residents.
| Immigration Origin | # Population | % Population |
| Asia | 293 | 0.9% |
| Bangladesh | 56 | 0.2% |
| Canada | 46 | 0.1% |
| Caribbean | 197 | 0.6% |
| Central America | 2,907 | 8.5% |
| China | 30 | 0.1% |
| Colombia | 9 | 0.0% |
| Costa Rica | 51 | 0.2% |
| Cuba | 46 | 0.1% |
| Eastern Asia | 30 | 0.1% |
| Ecuador | 22 | 0.1% |
| El Salvador | 203 | 0.6% |
| Europe | 26 | 0.1% |
| Germany | 11 | 0.0% |
| Guatemala | 73 | 0.2% |
| Haiti | 12 | 0.0% |
| Honduras | 130 | 0.4% |
| Jordan | 13 | 0.0% |
| Latin America | 3,166 | 9.3% |
| Lebanon | 11 | 0.0% |
| Mexico | 2,403 | 7.1% |
| Nicaragua | 47 | 0.1% |
| Northern Europe | 15 | 0.0% |
| Pakistan | 28 | 0.1% |
| Peru | 31 | 0.1% |
| Philippines | 83 | 0.2% |
| South America | 62 | 0.2% |
| South Central Asia | 84 | 0.3% |
| South Eastern Asia | 125 | 0.4% |
| Vietnam | 42 | 0.1% |
| Western Asia | 24 | 0.1% |
| Western Europe | 11 | 0.0% | View All 32 Rows |
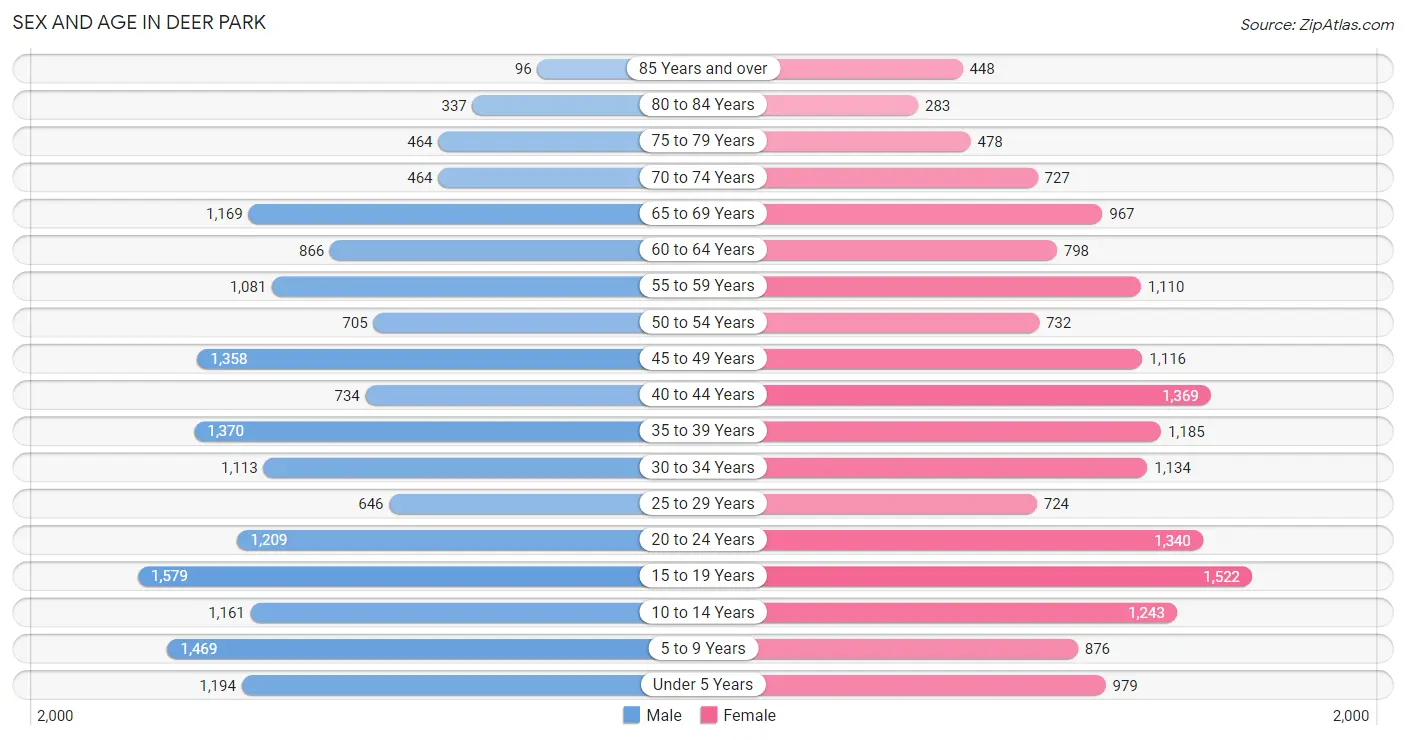
Sex and Age in Deer Park
Sex and Age in Deer Park
The most populous age groups in Deer Park are 15 to 19 Years (1,579 | 9.3%) for men and 15 to 19 Years (1,522 | 8.9%) for women.
| Age Bracket | Male | Female |
| Under 5 Years | 1,194 (7.0%) | 979 (5.8%) |
| 5 to 9 Years | 1,469 (8.6%) | 876 (5.1%) |
| 10 to 14 Years | 1,161 (6.8%) | 1,243 (7.3%) |
| 15 to 19 Years | 1,579 (9.3%) | 1,522 (8.9%) |
| 20 to 24 Years | 1,209 (7.1%) | 1,340 (7.9%) |
| 25 to 29 Years | 646 (3.8%) | 724 (4.3%) |
| 30 to 34 Years | 1,113 (6.5%) | 1,134 (6.7%) |
| 35 to 39 Years | 1,370 (8.1%) | 1,185 (7.0%) |
| 40 to 44 Years | 734 (4.3%) | 1,369 (8.0%) |
| 45 to 49 Years | 1,358 (8.0%) | 1,116 (6.6%) |
| 50 to 54 Years | 705 (4.1%) | 732 (4.3%) |
| 55 to 59 Years | 1,081 (6.4%) | 1,110 (6.5%) |
| 60 to 64 Years | 866 (5.1%) | 798 (4.7%) |
| 65 to 69 Years | 1,169 (6.9%) | 967 (5.7%) |
| 70 to 74 Years | 464 (2.7%) | 727 (4.3%) |
| 75 to 79 Years | 464 (2.7%) | 478 (2.8%) |
| 80 to 84 Years | 337 (2.0%) | 283 (1.7%) |
| 85 Years and over | 96 (0.6%) | 448 (2.6%) |
| Total | 17,015 (100.0%) | 17,031 (100.0%) |
Families and Households in Deer Park
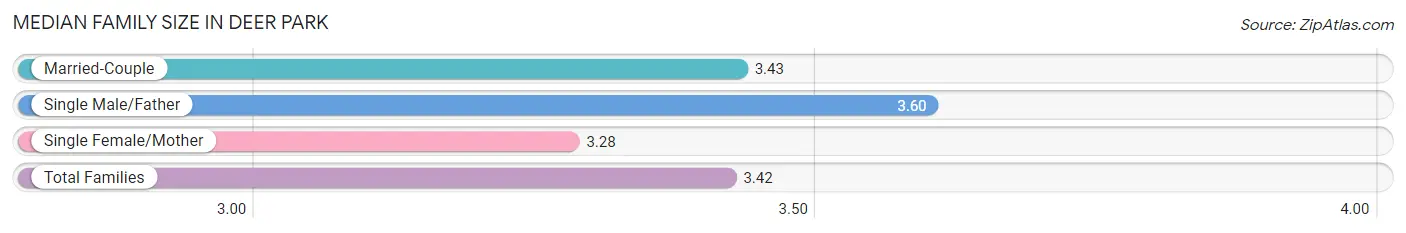
Median Family Size in Deer Park
The median family size in Deer Park is 3.42 persons per family, with single male/father families (394 | 4.5%) accounting for the largest median family size of 3.6 persons per family. On the other hand, single female/mother families (1,516 | 17.2%) represent the smallest median family size with 3.28 persons per family.
| Family Type | # Families | Family Size |
| Married-Couple | 6,908 (78.3%) | 3.43 |
| Single Male/Father | 394 (4.5%) | 3.60 |
| Single Female/Mother | 1,516 (17.2%) | 3.28 |
| Total Families | 8,818 (100.0%) | 3.42 |
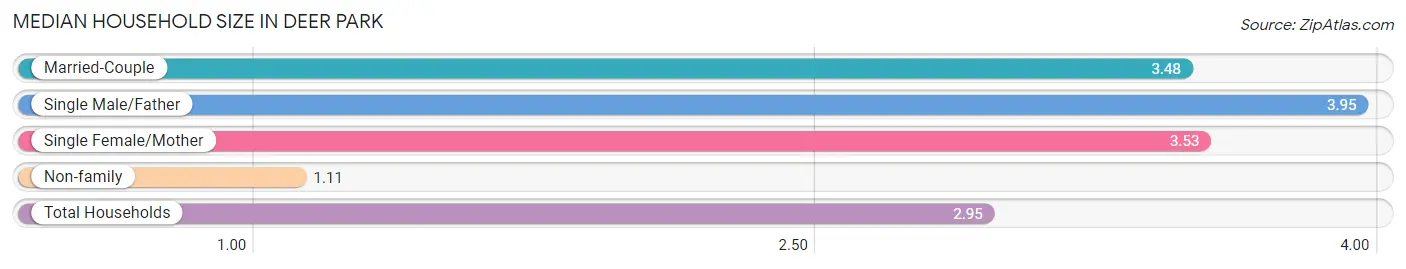
Median Household Size in Deer Park
The median household size in Deer Park is 2.95 persons per household, with single male/father households (394 | 3.4%) accounting for the largest median household size of 3.95 persons per household. non-family households (2,678 | 23.3%) represent the smallest median household size with 1.11 persons per household.
| Household Type | # Households | Household Size |
| Married-Couple | 6,908 (60.1%) | 3.48 |
| Single Male/Father | 394 (3.4%) | 3.95 |
| Single Female/Mother | 1,516 (13.2%) | 3.53 |
| Non-family | 2,678 (23.3%) | 1.11 |
| Total Households | 11,496 (100.0%) | 2.95 |
Household Size by Marriage Status in Deer Park
Out of a total of 11,496 households in Deer Park, 8,818 (76.7%) are family households, while 2,678 (23.3%) are nonfamily households. The most numerous type of family households are 2-person households, comprising 3,163, and the most common type of nonfamily households are 1-person households, comprising 2,421.
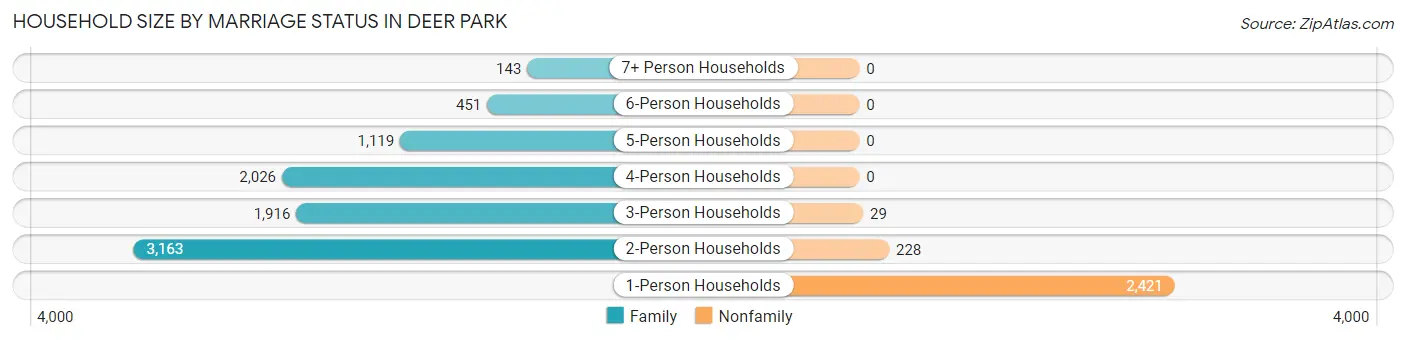
| Household Size | Family Households | Nonfamily Households |
| 1-Person Households | - | 2,421 (21.1%) |
| 2-Person Households | 3,163 (27.5%) | 228 (2.0%) |
| 3-Person Households | 1,916 (16.7%) | 29 (0.3%) |
| 4-Person Households | 2,026 (17.6%) | 0 (0.0%) |
| 5-Person Households | 1,119 (9.7%) | 0 (0.0%) |
| 6-Person Households | 451 (3.9%) | 0 (0.0%) |
| 7+ Person Households | 143 (1.2%) | 0 (0.0%) |
| Total | 8,818 (76.7%) | 2,678 (23.3%) |
Female Fertility in Deer Park
Fertility by Age in Deer Park
Average fertility rate in Deer Park is 32.0 births per 1,000 women. Women in the age bracket of 20 to 34 years have the highest fertility rate with 58.0 births per 1,000 women. Women in the age bracket of 20 to 34 years acount for 68.1% of all women with births.
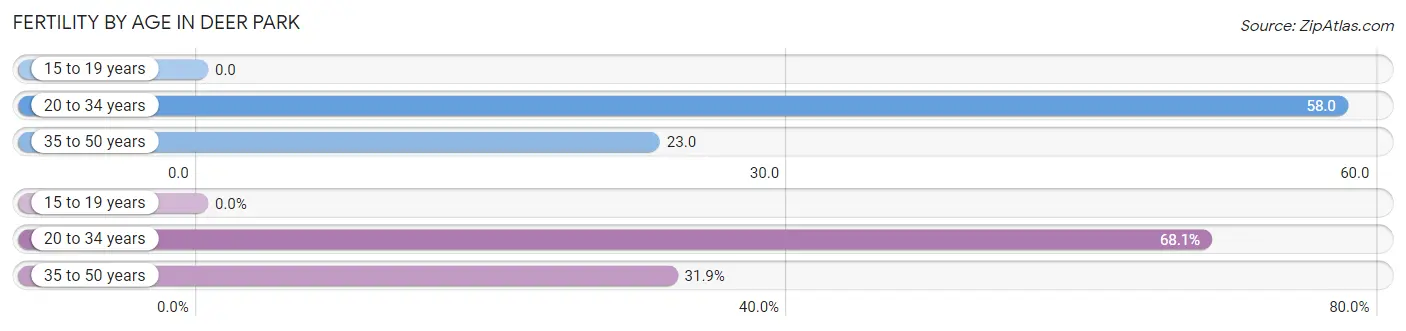
| Age Bracket | Women with Births | Births / 1,000 Women |
| 15 to 19 years | 0 (0.0%) | 0.0 |
| 20 to 34 years | 186 (68.1%) | 58.0 |
| 35 to 50 years | 87 (31.9%) | 23.0 |
| Total | 273 (100.0%) | 32.0 |
Fertility by Age by Marriage Status in Deer Park
59.0% of women with births (273) in Deer Park are married. The highest percentage of unmarried women with births falls into 35 to 50 years age bracket with 80.5% of them unmarried at the time of birth, while the lowest percentage of unmarried women with births belong to 20 to 34 years age bracket with 22.6% of them unmarried.
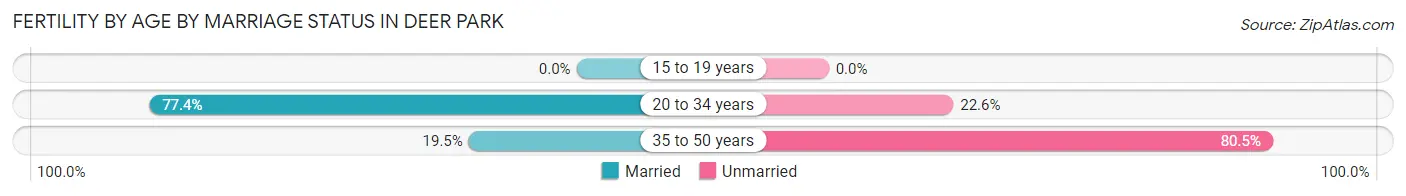
| Age Bracket | Married | Unmarried |
| 15 to 19 years | 0 (0.0%) | 0 (0.0%) |
| 20 to 34 years | 144 (77.4%) | 42 (22.6%) |
| 35 to 50 years | 17 (19.5%) | 70 (80.5%) |
| Total | 161 (59.0%) | 112 (41.0%) |
Fertility by Education in Deer Park
Average fertility rate in Deer Park is 32.0 births per 1,000 women. Women with the education attainment of graduate degree have the highest fertility rate of 60.0 births per 1,000 women, while women with the education attainment of college or associate's degree have the lowest fertility at 26.0 births per 1,000 women. Women with the education attainment of college or associate's degree represent 32.6% of all women with births.
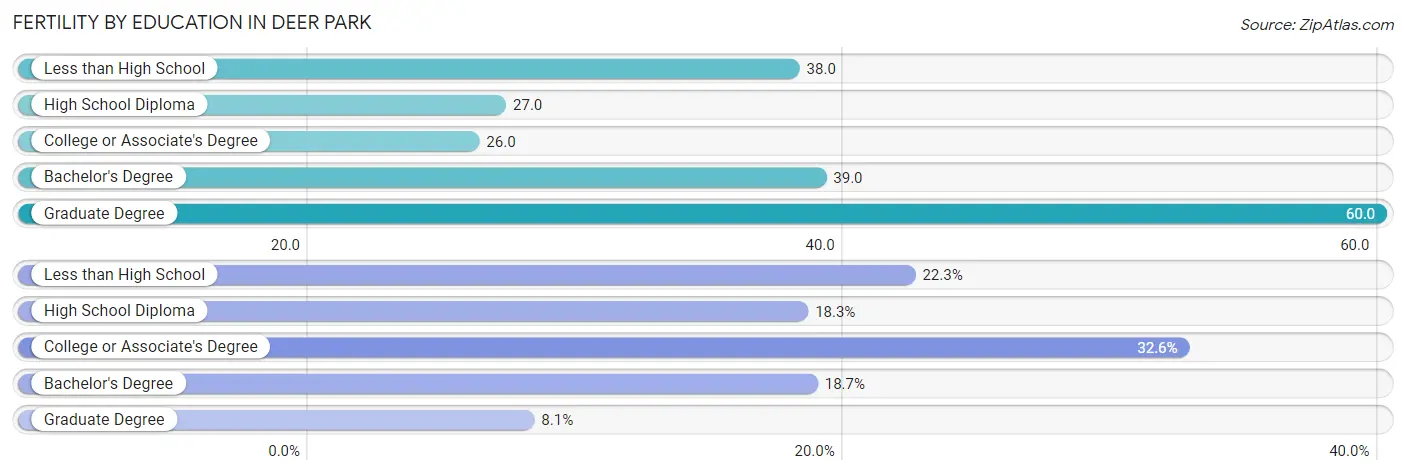
| Educational Attainment | Women with Births | Births / 1,000 Women |
| Less than High School | 61 (22.3%) | 38.0 |
| High School Diploma | 50 (18.3%) | 27.0 |
| College or Associate's Degree | 89 (32.6%) | 26.0 |
| Bachelor's Degree | 51 (18.7%) | 39.0 |
| Graduate Degree | 22 (8.1%) | 60.0 |
| Total | 273 (100.0%) | 32.0 |
Fertility by Education by Marriage Status in Deer Park
41.0% of women with births in Deer Park are unmarried. Women with the educational attainment of bachelor's degree are most likely to be married with 100.0% of them married at childbirth, while women with the educational attainment of less than high school are least likely to be married with 100.0% of them unmarried at childbirth.
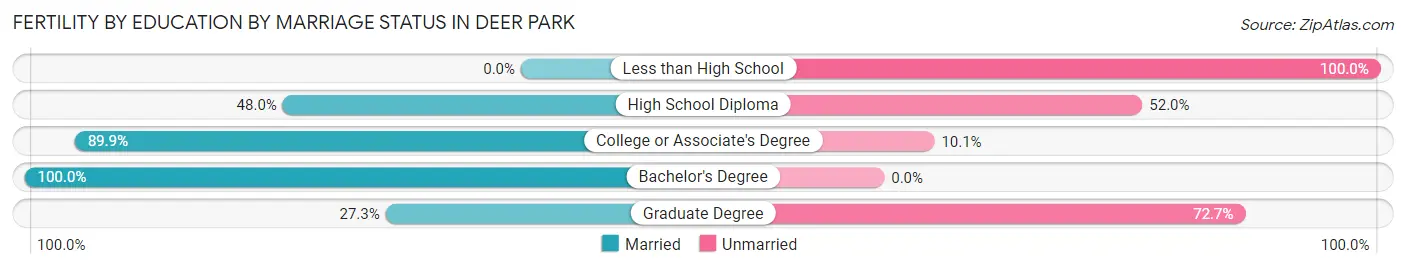
| Educational Attainment | Married | Unmarried |
| Less than High School | 0 (0.0%) | 61 (100.0%) |
| High School Diploma | 24 (48.0%) | 26 (52.0%) |
| College or Associate's Degree | 80 (89.9%) | 9 (10.1%) |
| Bachelor's Degree | 51 (100.0%) | 0 (0.0%) |
| Graduate Degree | 6 (27.3%) | 16 (72.7%) |
| Total | 161 (59.0%) | 112 (41.0%) |
Employment Characteristics in Deer Park
Employment by Class of Employer in Deer Park
Among the 15,632 employed individuals in Deer Park, private company employees (11,326 | 72.5%), local government employees (1,619 | 10.4%), and not-for-profit organizations (955 | 6.1%) make up the most common classes of employment.
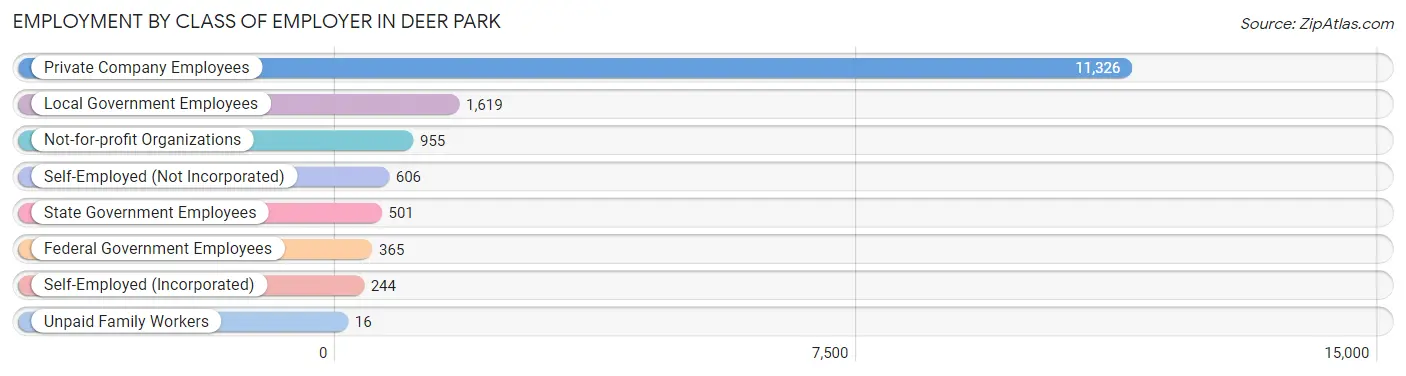
| Employer Class | # Employees | % Employees |
| Private Company Employees | 11,326 | 72.5% |
| Self-Employed (Incorporated) | 244 | 1.6% |
| Self-Employed (Not Incorporated) | 606 | 3.9% |
| Not-for-profit Organizations | 955 | 6.1% |
| Local Government Employees | 1,619 | 10.4% |
| State Government Employees | 501 | 3.2% |
| Federal Government Employees | 365 | 2.3% |
| Unpaid Family Workers | 16 | 0.1% |
| Total | 15,632 | 100.0% |
Employment Status by Age in Deer Park
According to the labor force statistics for Deer Park, out of the total population over 16 years of age (26,574), 63.4% or 16,848 individuals are in the labor force, with 4.9% or 826 of them unemployed. The age group with the highest labor force participation rate is 25 to 29 years, with 92.6% or 1,269 individuals in the labor force. Within the labor force, the 75 years and over age range has the highest percentage of unemployed individuals, with 58.3% or 28 of them being unemployed.
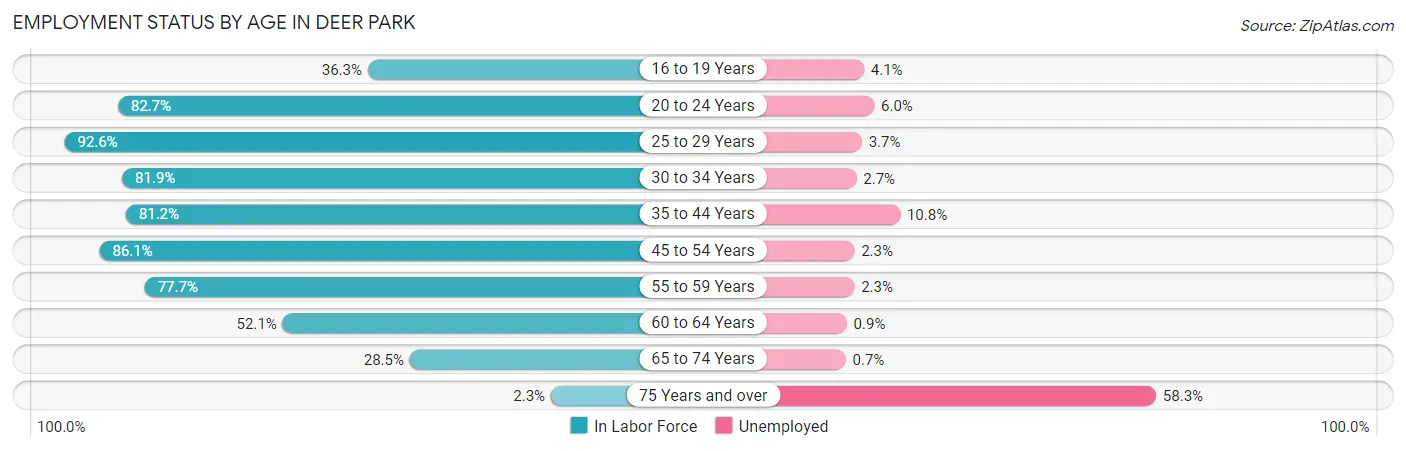
| Age Bracket | In Labor Force | Unemployed |
| 16 to 19 Years | 926 (36.3%) | 38 (4.1%) |
| 20 to 24 Years | 2,108 (82.7%) | 126 (6.0%) |
| 25 to 29 Years | 1,269 (92.6%) | 47 (3.7%) |
| 30 to 34 Years | 1,840 (81.9%) | 50 (2.7%) |
| 35 to 44 Years | 3,782 (81.2%) | 408 (10.8%) |
| 45 to 54 Years | 3,367 (86.1%) | 77 (2.3%) |
| 55 to 59 Years | 1,702 (77.7%) | 39 (2.3%) |
| 60 to 64 Years | 867 (52.1%) | 8 (0.9%) |
| 65 to 74 Years | 948 (28.5%) | 7 (0.7%) |
| 75 Years and over | 48 (2.3%) | 28 (58.3%) |
| Total | 16,848 (63.4%) | 826 (4.9%) |
Employment Status by Educational Attainment in Deer Park
According to labor force statistics for Deer Park, 80.0% of individuals (12,833) out of the total population between 25 and 64 years of age (16,041) are in the labor force, with 4.9% or 629 of them being unemployed. The group with the highest labor force participation rate are those with the educational attainment of bachelor's degree or higher, with 89.3% or 3,376 individuals in the labor force. Within the labor force, individuals with less than high school education have the highest percentage of unemployment, with 8.0% or 103 of them being unemployed.
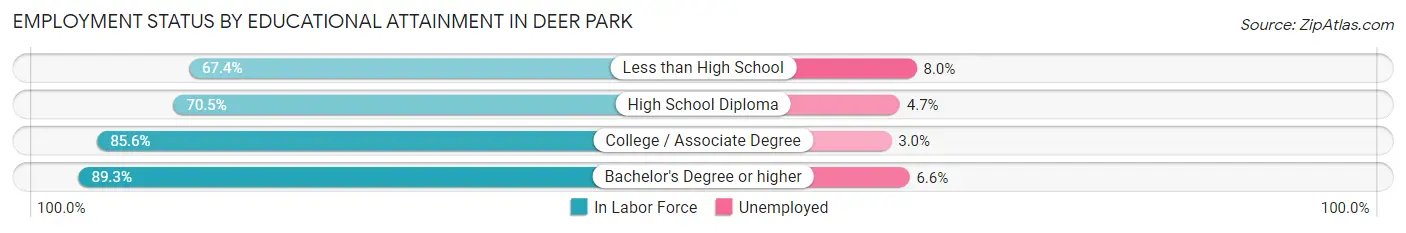
| Educational Attainment | In Labor Force | Unemployed |
| Less than High School | 1,283 (67.4%) | 152 (8.0%) |
| High School Diploma | 3,247 (70.5%) | 216 (4.7%) |
| College / Associate Degree | 4,922 (85.6%) | 172 (3.0%) |
| Bachelor's Degree or higher | 3,376 (89.3%) | 250 (6.6%) |
| Total | 12,833 (80.0%) | 786 (4.9%) |
Employment Occupations by Sex in Deer Park
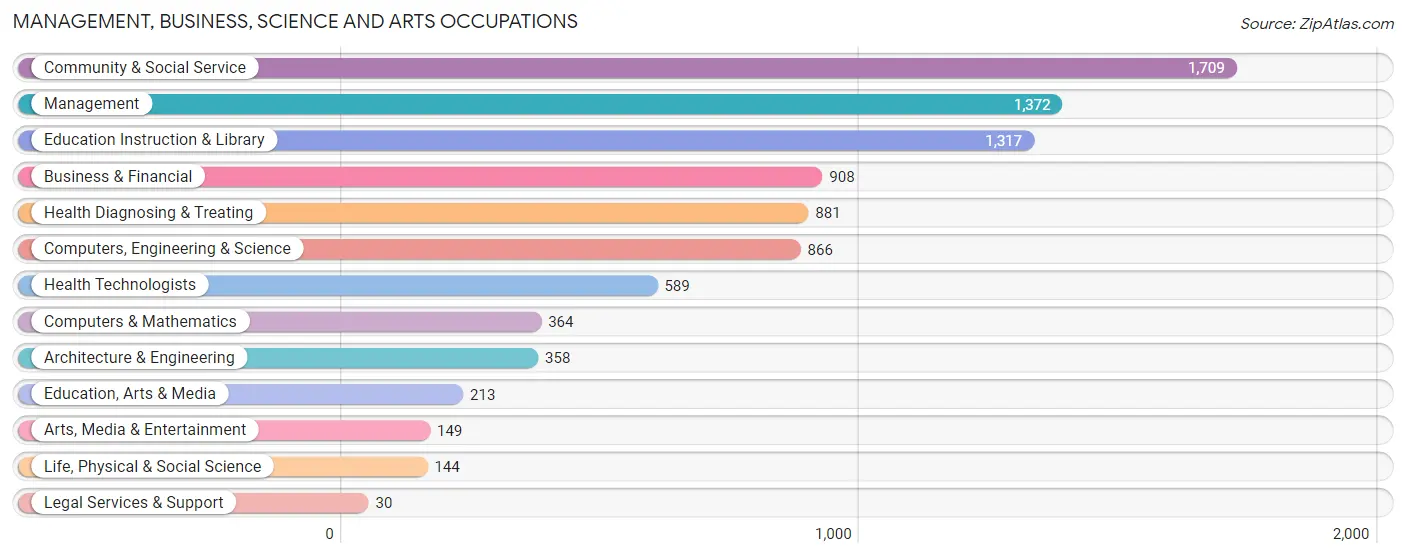
Management, Business, Science and Arts Occupations
The most common Management, Business, Science and Arts occupations in Deer Park are Community & Social Service (1,709 | 10.8%), Management (1,372 | 8.6%), Education Instruction & Library (1,317 | 8.3%), Business & Financial (908 | 5.7%), and Health Diagnosing & Treating (881 | 5.5%).
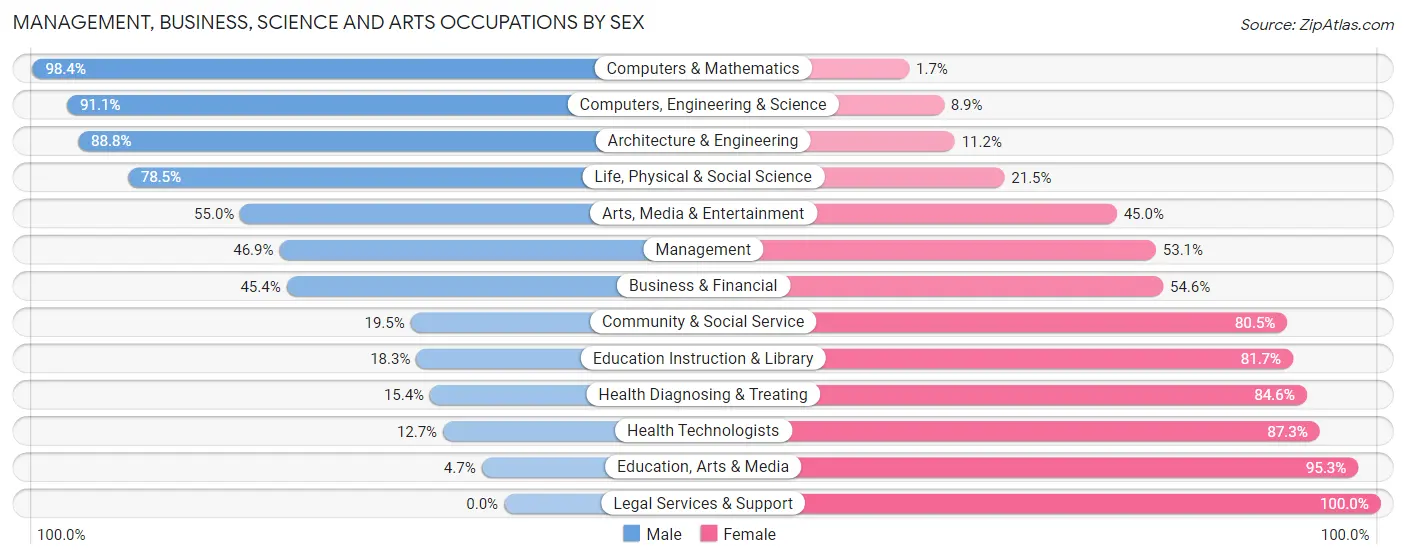
Management, Business, Science and Arts Occupations by Sex
Within the Management, Business, Science and Arts occupations in Deer Park, the most male-oriented occupations are Computers & Mathematics (98.4%), Computers, Engineering & Science (91.1%), and Architecture & Engineering (88.8%), while the most female-oriented occupations are Legal Services & Support (100.0%), Education, Arts & Media (95.3%), and Health Technologists (87.3%).
| Occupation | Male | Female |
| Management | 643 (46.9%) | 729 (53.1%) |
| Business & Financial | 412 (45.4%) | 496 (54.6%) |
| Computers, Engineering & Science | 789 (91.1%) | 77 (8.9%) |
| Computers & Mathematics | 358 (98.4%) | 6 (1.7%) |
| Architecture & Engineering | 318 (88.8%) | 40 (11.2%) |
| Life, Physical & Social Science | 113 (78.5%) | 31 (21.5%) |
| Community & Social Service | 333 (19.5%) | 1,376 (80.5%) |
| Education, Arts & Media | 10 (4.7%) | 203 (95.3%) |
| Legal Services & Support | 0 (0.0%) | 30 (100.0%) |
| Education Instruction & Library | 241 (18.3%) | 1,076 (81.7%) |
| Arts, Media & Entertainment | 82 (55.0%) | 67 (45.0%) |
| Health Diagnosing & Treating | 136 (15.4%) | 745 (84.6%) |
| Health Technologists | 75 (12.7%) | 514 (87.3%) |
| Total (Category) | 2,313 (40.3%) | 3,423 (59.7%) |
| Total (Overall) | 8,462 (53.2%) | 7,428 (46.8%) |
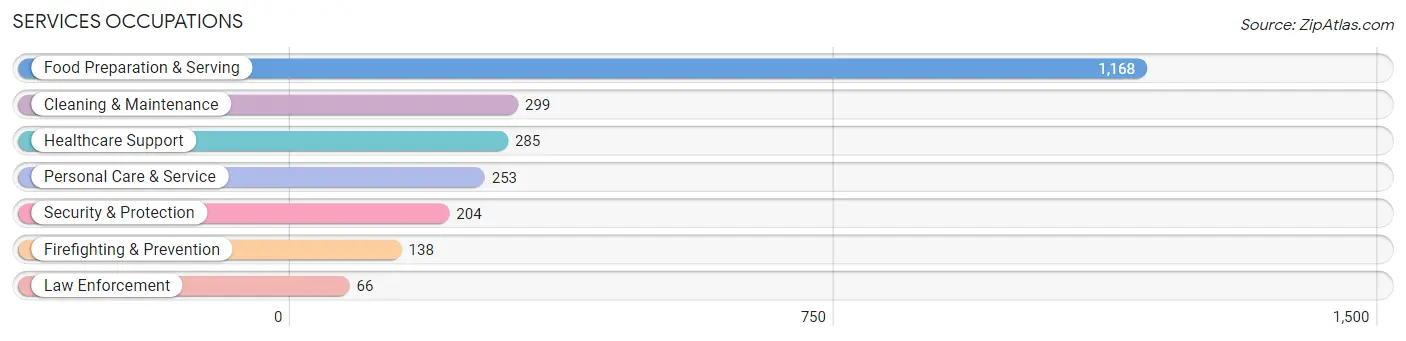
Services Occupations
The most common Services occupations in Deer Park are Food Preparation & Serving (1,168 | 7.3%), Cleaning & Maintenance (299 | 1.9%), Healthcare Support (285 | 1.8%), Personal Care & Service (253 | 1.6%), and Security & Protection (204 | 1.3%).
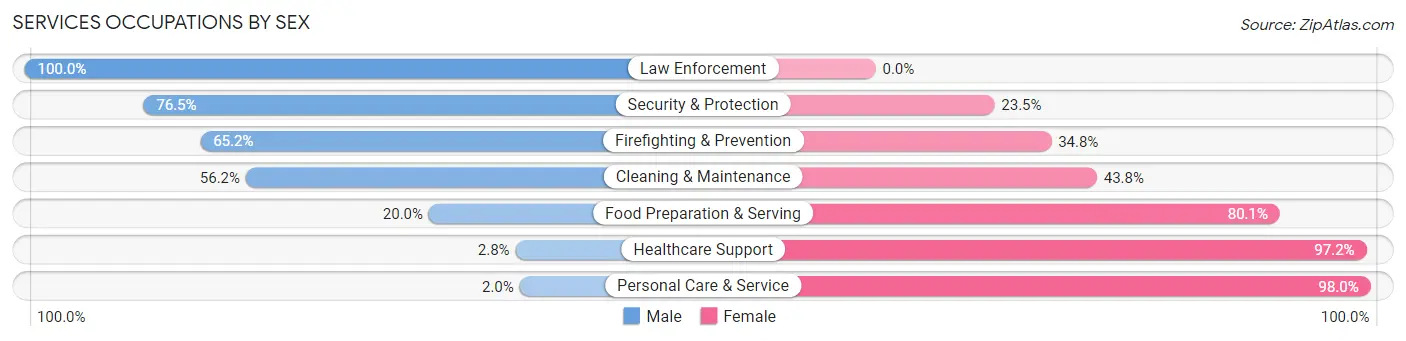
Services Occupations by Sex
Within the Services occupations in Deer Park, the most male-oriented occupations are Law Enforcement (100.0%), Security & Protection (76.5%), and Firefighting & Prevention (65.2%), while the most female-oriented occupations are Personal Care & Service (98.0%), Healthcare Support (97.2%), and Food Preparation & Serving (80.0%).
| Occupation | Male | Female |
| Healthcare Support | 8 (2.8%) | 277 (97.2%) |
| Security & Protection | 156 (76.5%) | 48 (23.5%) |
| Firefighting & Prevention | 90 (65.2%) | 48 (34.8%) |
| Law Enforcement | 66 (100.0%) | 0 (0.0%) |
| Food Preparation & Serving | 233 (20.0%) | 935 (80.0%) |
| Cleaning & Maintenance | 168 (56.2%) | 131 (43.8%) |
| Personal Care & Service | 5 (2.0%) | 248 (98.0%) |
| Total (Category) | 570 (25.8%) | 1,639 (74.2%) |
| Total (Overall) | 8,462 (53.2%) | 7,428 (46.8%) |
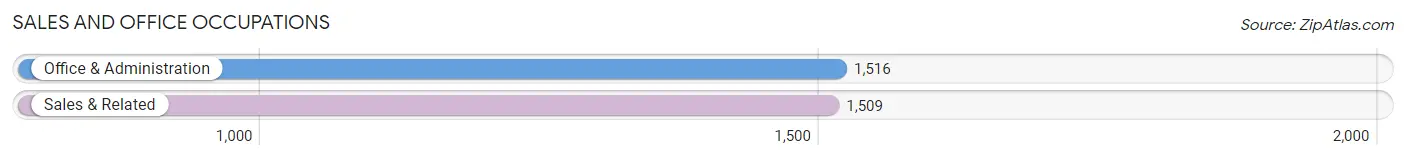
Sales and Office Occupations
The most common Sales and Office occupations in Deer Park are Office & Administration (1,516 | 9.5%), and Sales & Related (1,509 | 9.5%).
Sales and Office Occupations by Sex
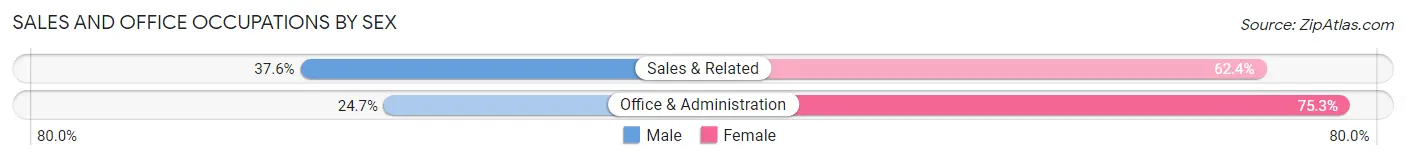
| Occupation | Male | Female |
| Sales & Related | 567 (37.6%) | 942 (62.4%) |
| Office & Administration | 375 (24.7%) | 1,141 (75.3%) |
| Total (Category) | 942 (31.1%) | 2,083 (68.9%) |
| Total (Overall) | 8,462 (53.2%) | 7,428 (46.8%) |
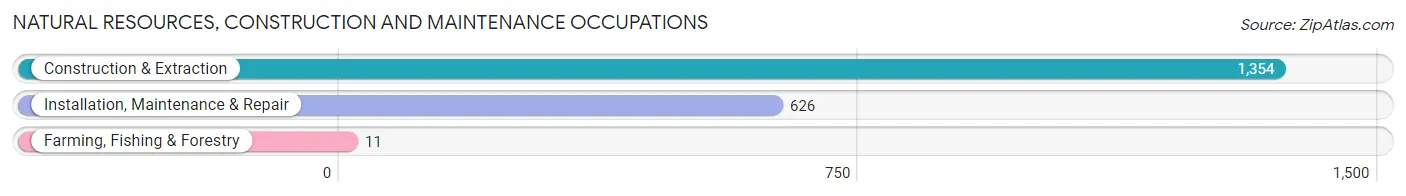
Natural Resources, Construction and Maintenance Occupations
The most common Natural Resources, Construction and Maintenance occupations in Deer Park are Construction & Extraction (1,354 | 8.5%), Installation, Maintenance & Repair (626 | 3.9%), and Farming, Fishing & Forestry (11 | 0.1%).
Natural Resources, Construction and Maintenance Occupations by Sex
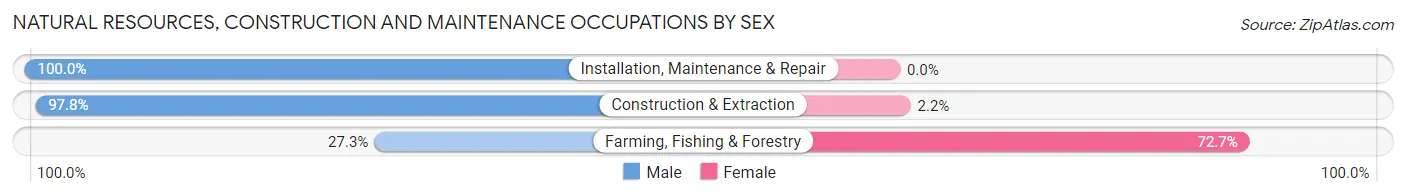
| Occupation | Male | Female |
| Farming, Fishing & Forestry | 3 (27.3%) | 8 (72.7%) |
| Construction & Extraction | 1,324 (97.8%) | 30 (2.2%) |
| Installation, Maintenance & Repair | 626 (100.0%) | 0 (0.0%) |
| Total (Category) | 1,953 (98.1%) | 38 (1.9%) |
| Total (Overall) | 8,462 (53.2%) | 7,428 (46.8%) |
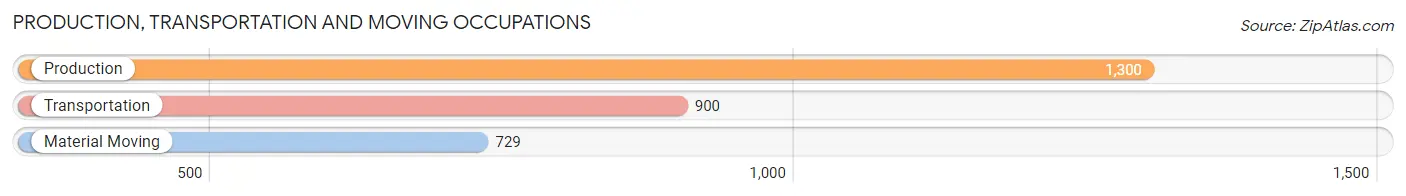
Production, Transportation and Moving Occupations
The most common Production, Transportation and Moving occupations in Deer Park are Production (1,300 | 8.2%), Transportation (900 | 5.7%), and Material Moving (729 | 4.6%).
Production, Transportation and Moving Occupations by Sex
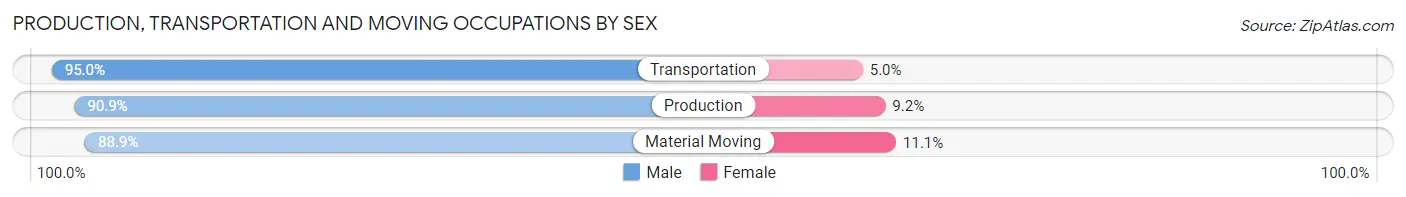
| Occupation | Male | Female |
| Production | 1,181 (90.8%) | 119 (9.1%) |
| Transportation | 855 (95.0%) | 45 (5.0%) |
| Material Moving | 648 (88.9%) | 81 (11.1%) |
| Total (Category) | 2,684 (91.6%) | 245 (8.4%) |
| Total (Overall) | 8,462 (53.2%) | 7,428 (46.8%) |
Employment Industries by Sex in Deer Park
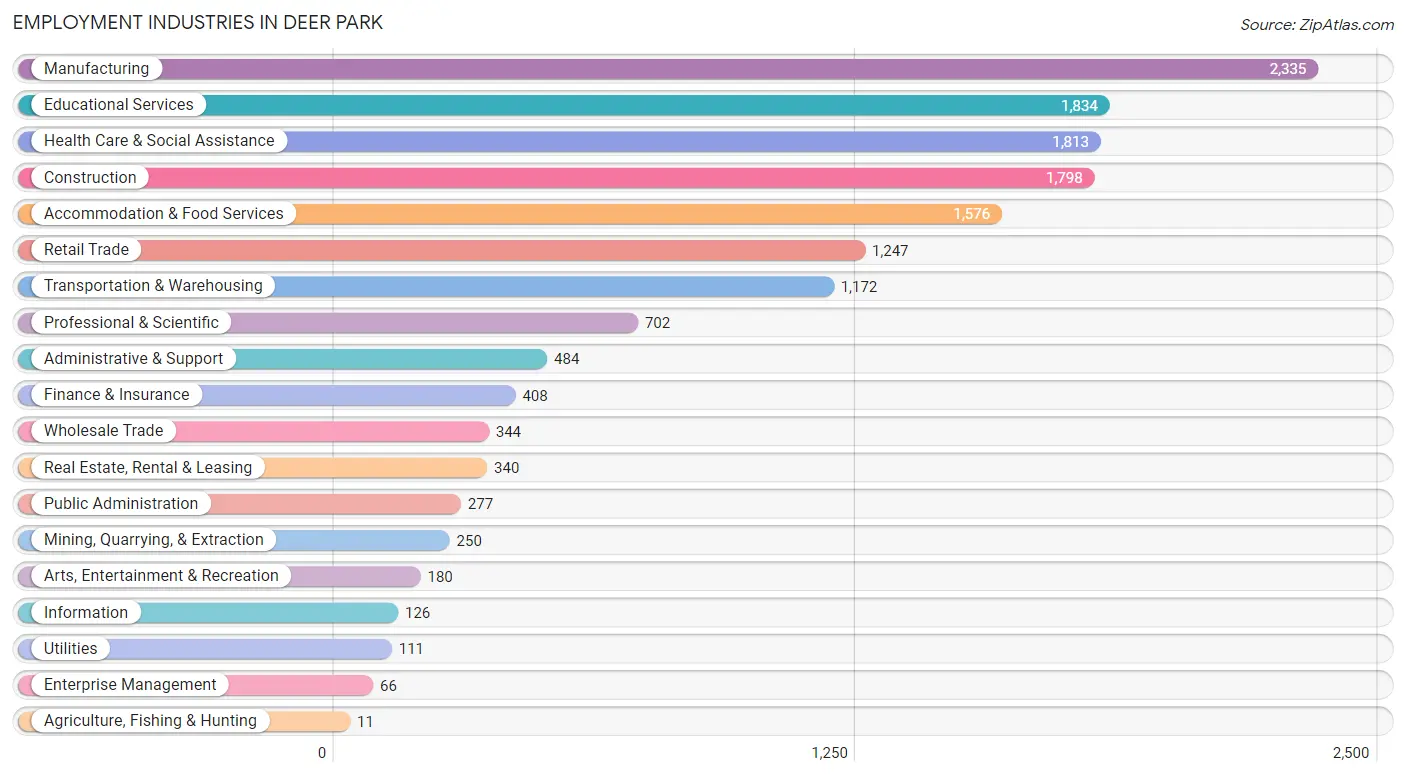
Employment Industries in Deer Park
The major employment industries in Deer Park include Manufacturing (2,335 | 14.7%), Educational Services (1,834 | 11.5%), Health Care & Social Assistance (1,813 | 11.4%), Construction (1,798 | 11.3%), and Accommodation & Food Services (1,576 | 9.9%).
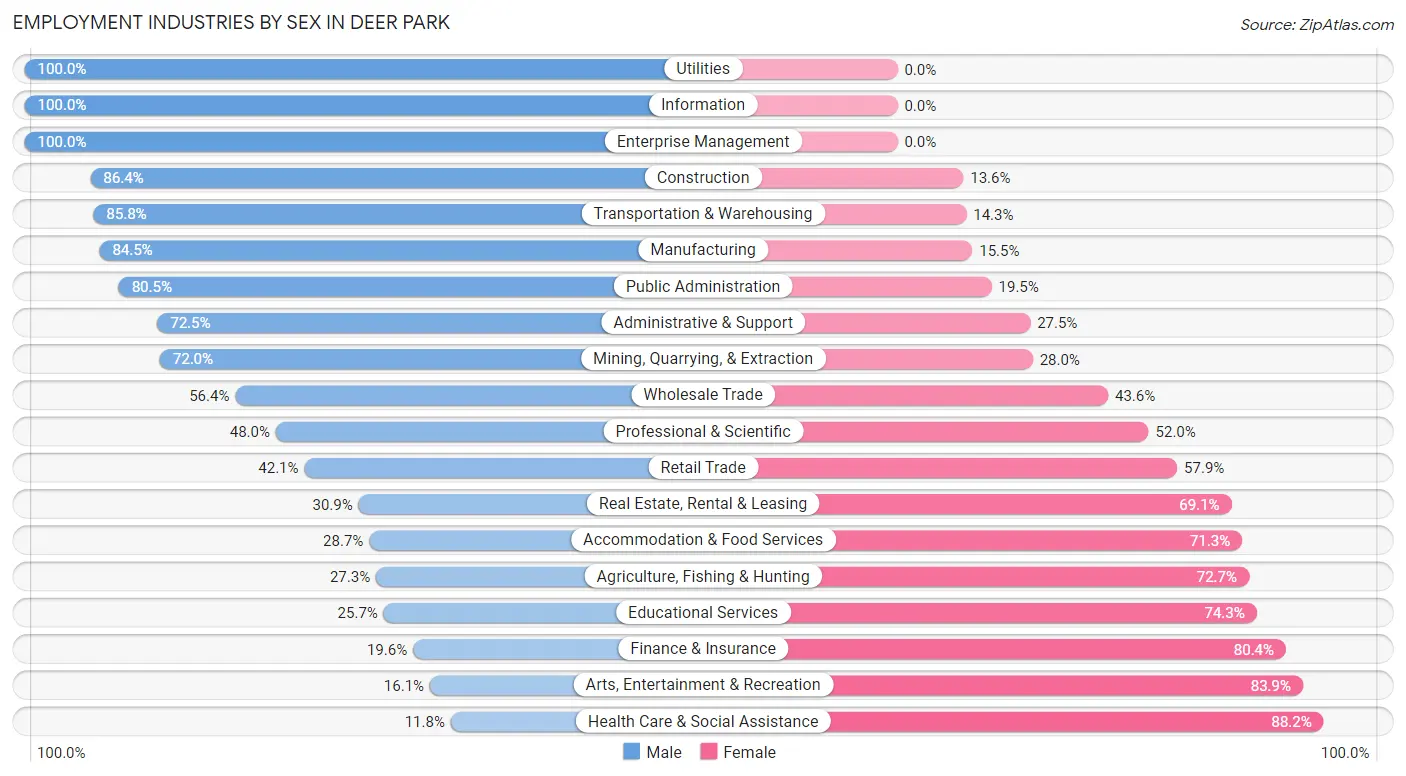
Employment Industries by Sex in Deer Park
The Deer Park industries that see more men than women are Utilities (100.0%), Information (100.0%), and Enterprise Management (100.0%), whereas the industries that tend to have a higher number of women are Health Care & Social Assistance (88.2%), Arts, Entertainment & Recreation (83.9%), and Finance & Insurance (80.4%).
| Industry | Male | Female |
| Agriculture, Fishing & Hunting | 3 (27.3%) | 8 (72.7%) |
| Mining, Quarrying, & Extraction | 180 (72.0%) | 70 (28.0%) |
| Construction | 1,553 (86.4%) | 245 (13.6%) |
| Manufacturing | 1,973 (84.5%) | 362 (15.5%) |
| Wholesale Trade | 194 (56.4%) | 150 (43.6%) |
| Retail Trade | 525 (42.1%) | 722 (57.9%) |
| Transportation & Warehousing | 1,005 (85.8%) | 167 (14.2%) |
| Utilities | 111 (100.0%) | 0 (0.0%) |
| Information | 126 (100.0%) | 0 (0.0%) |
| Finance & Insurance | 80 (19.6%) | 328 (80.4%) |
| Real Estate, Rental & Leasing | 105 (30.9%) | 235 (69.1%) |
| Professional & Scientific | 337 (48.0%) | 365 (52.0%) |
| Enterprise Management | 66 (100.0%) | 0 (0.0%) |
| Administrative & Support | 351 (72.5%) | 133 (27.5%) |
| Educational Services | 471 (25.7%) | 1,363 (74.3%) |
| Health Care & Social Assistance | 214 (11.8%) | 1,599 (88.2%) |
| Arts, Entertainment & Recreation | 29 (16.1%) | 151 (83.9%) |
| Accommodation & Food Services | 452 (28.7%) | 1,124 (71.3%) |
| Public Administration | 223 (80.5%) | 54 (19.5%) |
| Total | 8,462 (53.2%) | 7,428 (46.8%) |
Education in Deer Park
School Enrollment in Deer Park
The most common levels of schooling among the 9,642 students in Deer Park are college / undergraduate (2,425 | 25.2%), high school (2,115 | 21.9%), and middle school (2,043 | 21.2%).
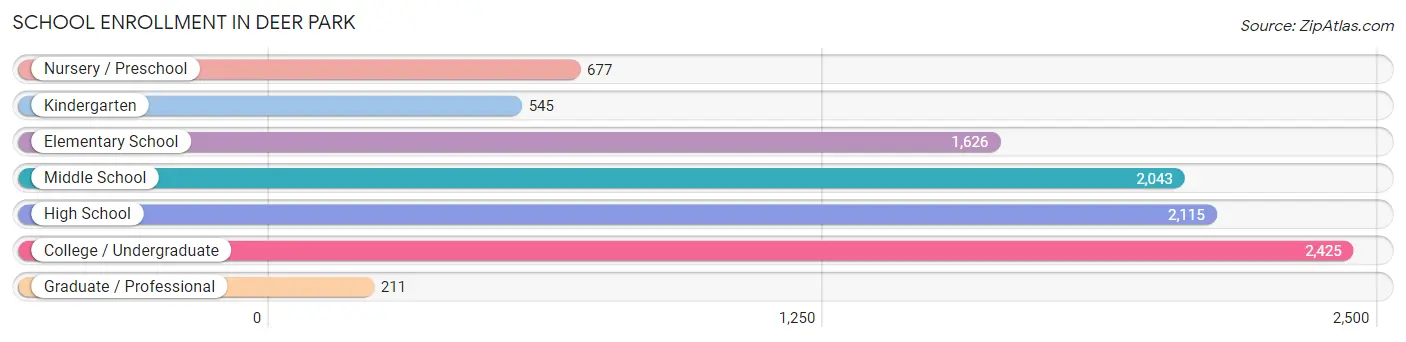
| School Level | # Students | % Students |
| Nursery / Preschool | 677 | 7.0% |
| Kindergarten | 545 | 5.7% |
| Elementary School | 1,626 | 16.9% |
| Middle School | 2,043 | 21.2% |
| High School | 2,115 | 21.9% |
| College / Undergraduate | 2,425 | 25.2% |
| Graduate / Professional | 211 | 2.2% |
| Total | 9,642 | 100.0% |
School Enrollment by Age by Funding Source in Deer Park
Out of a total of 9,642 students who are enrolled in schools in Deer Park, 665 (6.9%) attend a private institution, while the remaining 8,977 (93.1%) are enrolled in public schools. The age group of 3 to 4 year olds has the highest likelihood of being enrolled in private schools, with 107 (19.6% in the age bracket) enrolled. Conversely, the age group of 10 to 14 year olds has the lowest likelihood of being enrolled in a private school, with 2,316 (96.8% in the age bracket) attending a public institution.
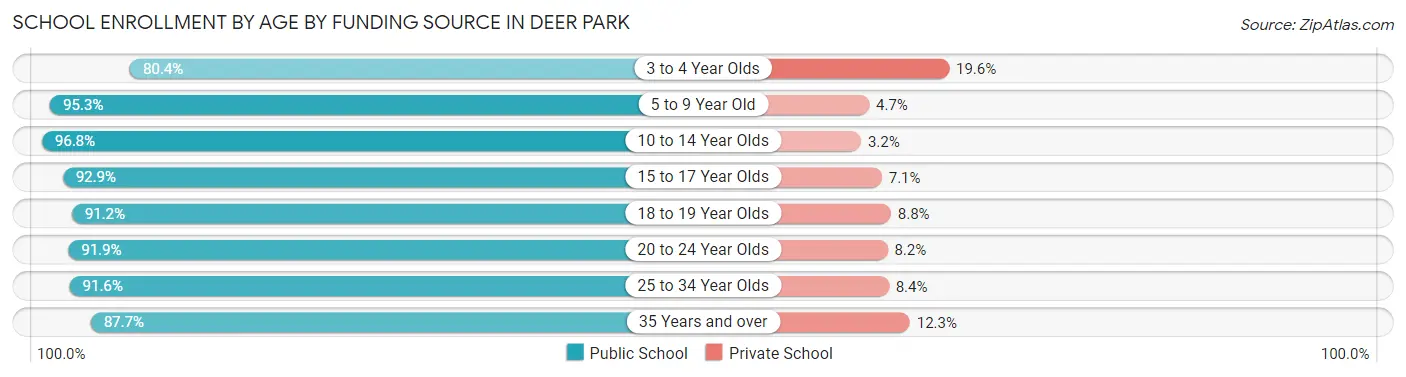
| Age Bracket | Public School | Private School |
| 3 to 4 Year Olds | 438 (80.4%) | 107 (19.6%) |
| 5 to 9 Year Old | 2,008 (95.3%) | 100 (4.7%) |
| 10 to 14 Year Olds | 2,316 (96.8%) | 77 (3.2%) |
| 15 to 17 Year Olds | 1,584 (92.9%) | 121 (7.1%) |
| 18 to 19 Year Olds | 1,017 (91.2%) | 98 (8.8%) |
| 20 to 24 Year Olds | 913 (91.8%) | 81 (8.2%) |
| 25 to 34 Year Olds | 404 (91.6%) | 37 (8.4%) |
| 35 Years and over | 299 (87.7%) | 42 (12.3%) |
| Total | 8,977 (93.1%) | 665 (6.9%) |
Educational Attainment by Field of Study in Deer Park
Education (1,148 | 20.6%), business (1,026 | 18.4%), science & technology (661 | 11.9%), arts & humanities (399 | 7.2%), and engineering (368 | 6.6%) are the most common fields of study among 5,567 individuals in Deer Park who have obtained a bachelor's degree or higher.
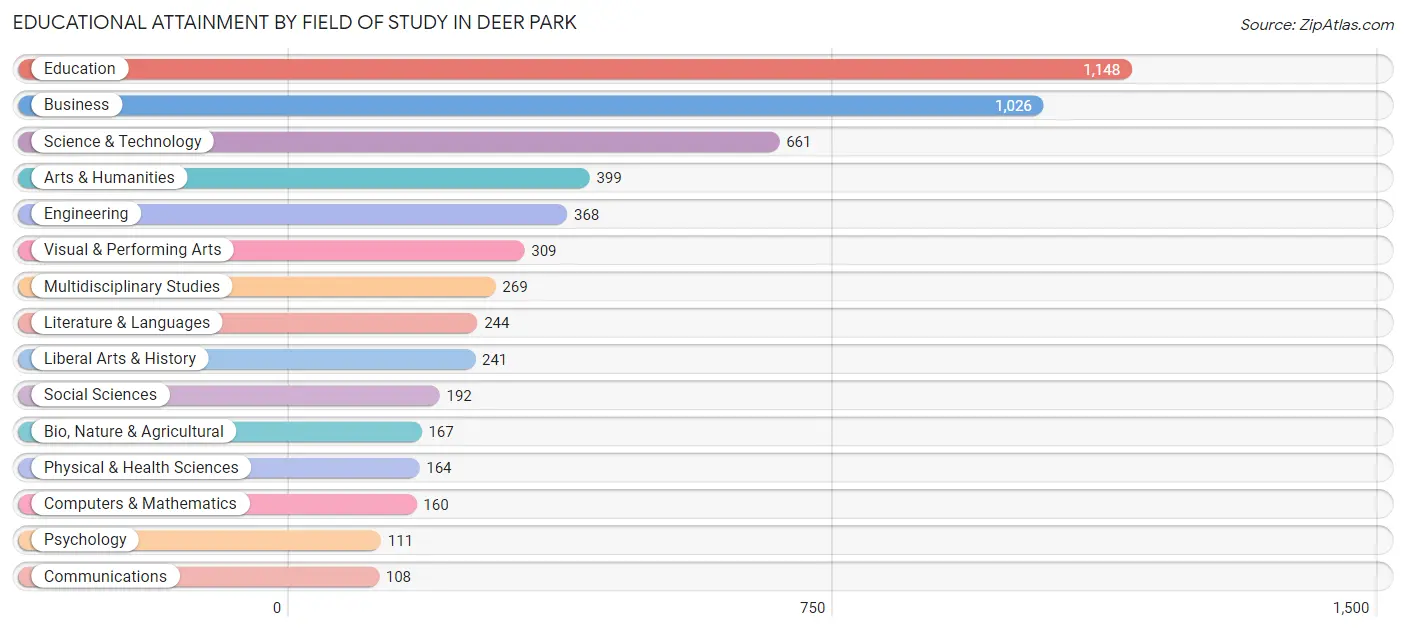
| Field of Study | # Graduates | % Graduates |
| Computers & Mathematics | 160 | 2.9% |
| Bio, Nature & Agricultural | 167 | 3.0% |
| Physical & Health Sciences | 164 | 2.9% |
| Psychology | 111 | 2.0% |
| Social Sciences | 192 | 3.5% |
| Engineering | 368 | 6.6% |
| Multidisciplinary Studies | 269 | 4.8% |
| Science & Technology | 661 | 11.9% |
| Business | 1,026 | 18.4% |
| Education | 1,148 | 20.6% |
| Literature & Languages | 244 | 4.4% |
| Liberal Arts & History | 241 | 4.3% |
| Visual & Performing Arts | 309 | 5.6% |
| Communications | 108 | 1.9% |
| Arts & Humanities | 399 | 7.2% |
| Total | 5,567 | 100.0% |
Transportation & Commute in Deer Park
Vehicle Availability by Sex in Deer Park
The most prevalent vehicle ownership categories in Deer Park are males with 2 vehicles (3,145, accounting for 37.3%) and females with 2 vehicles (2,961, making up 43.8%).
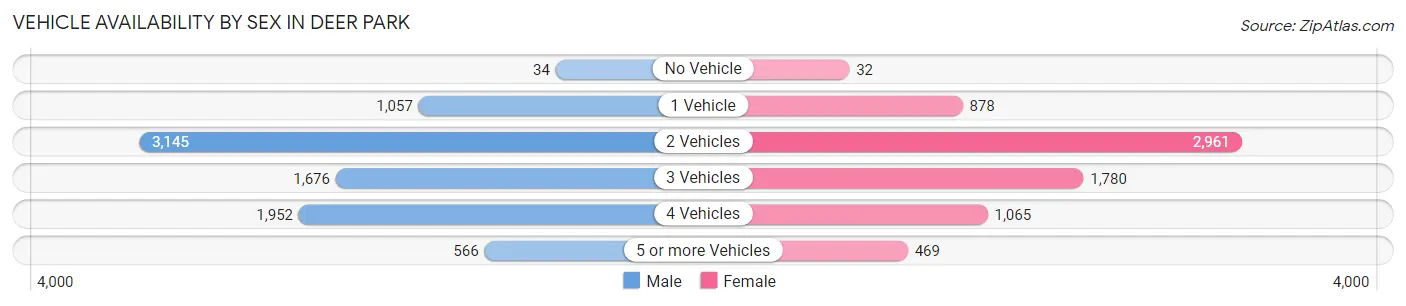
| Vehicles Available | Male | Female |
| No Vehicle | 34 (0.4%) | 32 (0.4%) |
| 1 Vehicle | 1,057 (12.5%) | 878 (12.2%) |
| 2 Vehicles | 3,145 (37.3%) | 2,961 (41.2%) |
| 3 Vehicles | 1,676 (19.9%) | 1,780 (24.8%) |
| 4 Vehicles | 1,952 (23.2%) | 1,065 (14.8%) |
| 5 or more Vehicles | 566 (6.7%) | 469 (6.5%) |
| Total | 8,430 (100.0%) | 7,185 (100.0%) |
Commute Time in Deer Park
The most frequently occuring commute durations in Deer Park are 20 to 24 minutes (2,498 commuters, 17.0%), 15 to 19 minutes (2,361 commuters, 16.1%), and 30 to 34 minutes (2,258 commuters, 15.4%).
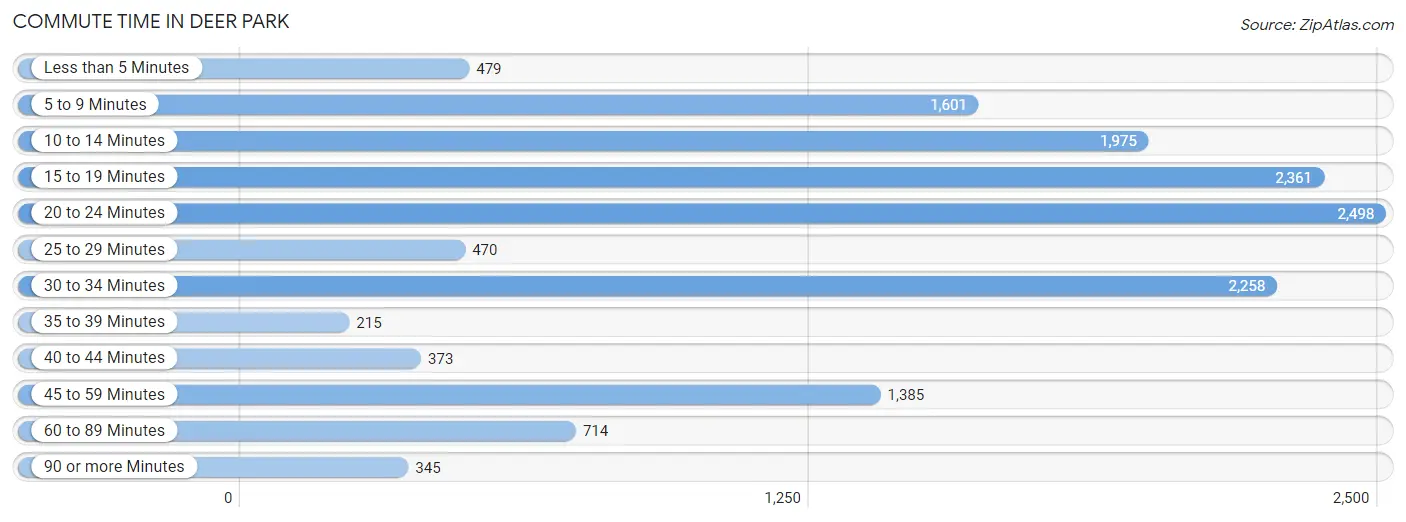
| Commute Time | # Commuters | % Commuters |
| Less than 5 Minutes | 479 | 3.3% |
| 5 to 9 Minutes | 1,601 | 10.9% |
| 10 to 14 Minutes | 1,975 | 13.5% |
| 15 to 19 Minutes | 2,361 | 16.1% |
| 20 to 24 Minutes | 2,498 | 17.0% |
| 25 to 29 Minutes | 470 | 3.2% |
| 30 to 34 Minutes | 2,258 | 15.4% |
| 35 to 39 Minutes | 215 | 1.5% |
| 40 to 44 Minutes | 373 | 2.5% |
| 45 to 59 Minutes | 1,385 | 9.4% |
| 60 to 89 Minutes | 714 | 4.9% |
| 90 or more Minutes | 345 | 2.4% |
Commute Time by Sex in Deer Park
The most common commute times in Deer Park are 20 to 24 minutes (1,340 commuters, 17.0%) for males and 20 to 24 minutes (1,158 commuters, 17.0%) for females.
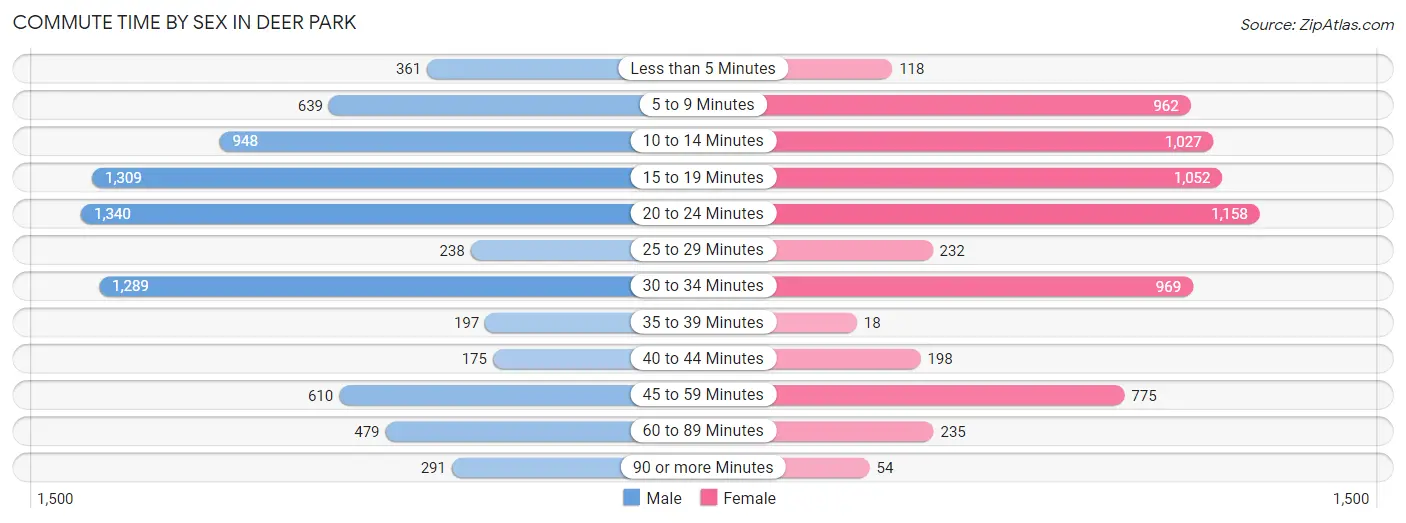
| Commute Time | Male | Female |
| Less than 5 Minutes | 361 (4.6%) | 118 (1.7%) |
| 5 to 9 Minutes | 639 (8.1%) | 962 (14.1%) |
| 10 to 14 Minutes | 948 (12.0%) | 1,027 (15.1%) |
| 15 to 19 Minutes | 1,309 (16.6%) | 1,052 (15.5%) |
| 20 to 24 Minutes | 1,340 (17.0%) | 1,158 (17.0%) |
| 25 to 29 Minutes | 238 (3.0%) | 232 (3.4%) |
| 30 to 34 Minutes | 1,289 (16.4%) | 969 (14.2%) |
| 35 to 39 Minutes | 197 (2.5%) | 18 (0.3%) |
| 40 to 44 Minutes | 175 (2.2%) | 198 (2.9%) |
| 45 to 59 Minutes | 610 (7.7%) | 775 (11.4%) |
| 60 to 89 Minutes | 479 (6.1%) | 235 (3.5%) |
| 90 or more Minutes | 291 (3.7%) | 54 (0.8%) |
Time of Departure to Work by Sex in Deer Park
The most frequent times of departure to work in Deer Park are 5:00 AM to 5:29 AM (1,212, 15.4%) for males and 7:00 AM to 7:29 AM (1,180, 17.4%) for females.
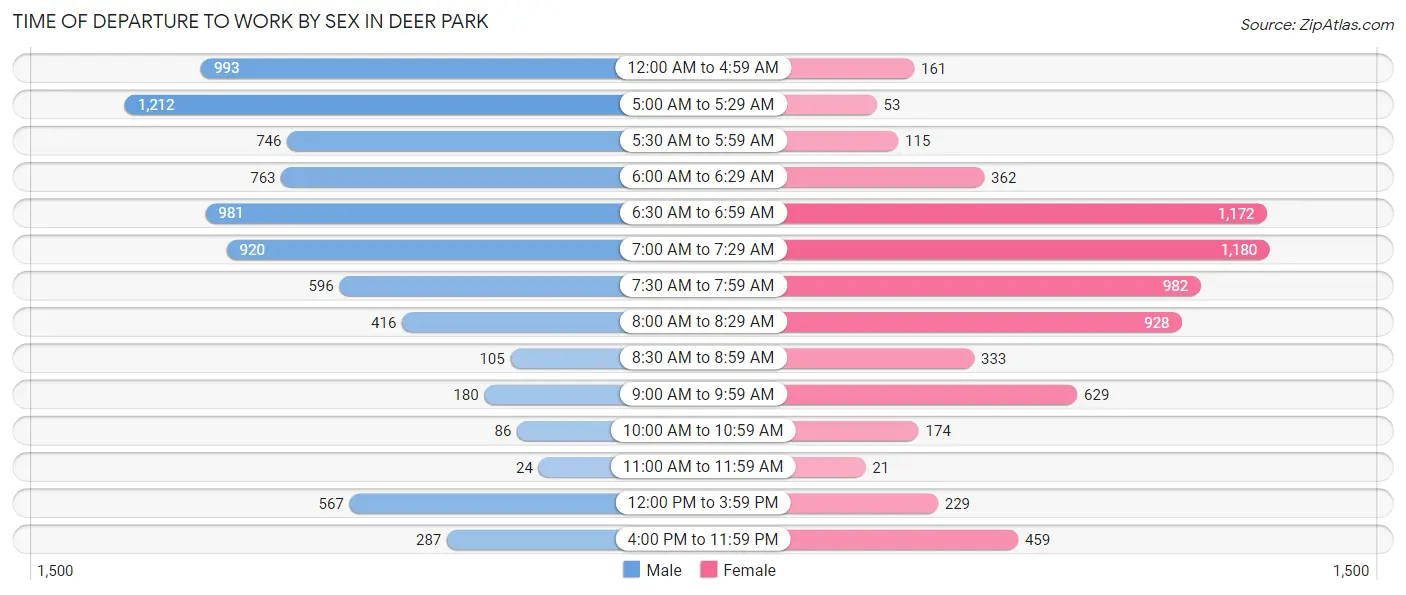
| Time of Departure | Male | Female |
| 12:00 AM to 4:59 AM | 993 (12.6%) | 161 (2.4%) |
| 5:00 AM to 5:29 AM | 1,212 (15.4%) | 53 (0.8%) |
| 5:30 AM to 5:59 AM | 746 (9.5%) | 115 (1.7%) |
| 6:00 AM to 6:29 AM | 763 (9.7%) | 362 (5.3%) |
| 6:30 AM to 6:59 AM | 981 (12.5%) | 1,172 (17.2%) |
| 7:00 AM to 7:29 AM | 920 (11.7%) | 1,180 (17.4%) |
| 7:30 AM to 7:59 AM | 596 (7.6%) | 982 (14.4%) |
| 8:00 AM to 8:29 AM | 416 (5.3%) | 928 (13.7%) |
| 8:30 AM to 8:59 AM | 105 (1.3%) | 333 (4.9%) |
| 9:00 AM to 9:59 AM | 180 (2.3%) | 629 (9.2%) |
| 10:00 AM to 10:59 AM | 86 (1.1%) | 174 (2.6%) |
| 11:00 AM to 11:59 AM | 24 (0.3%) | 21 (0.3%) |
| 12:00 PM to 3:59 PM | 567 (7.2%) | 229 (3.4%) |
| 4:00 PM to 11:59 PM | 287 (3.6%) | 459 (6.8%) |
| Total | 7,876 (100.0%) | 6,798 (100.0%) |
Housing Occupancy in Deer Park
Occupancy by Ownership in Deer Park
Of the total 11,496 dwellings in Deer Park, owner-occupied units account for 8,807 (76.6%), while renter-occupied units make up 2,689 (23.4%).
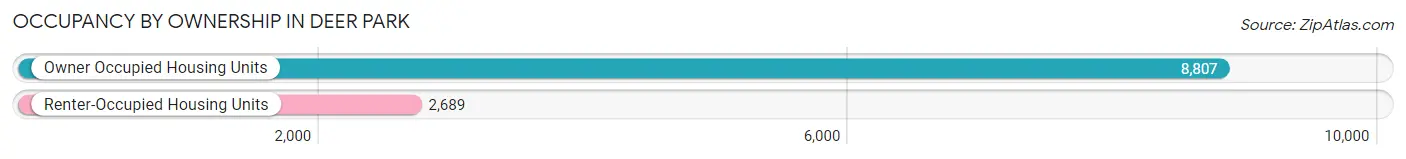
| Occupancy | # Housing Units | % Housing Units |
| Owner Occupied Housing Units | 8,807 | 76.6% |
| Renter-Occupied Housing Units | 2,689 | 23.4% |
| Total Occupied Housing Units | 11,496 | 100.0% |
Occupancy by Household Size in Deer Park
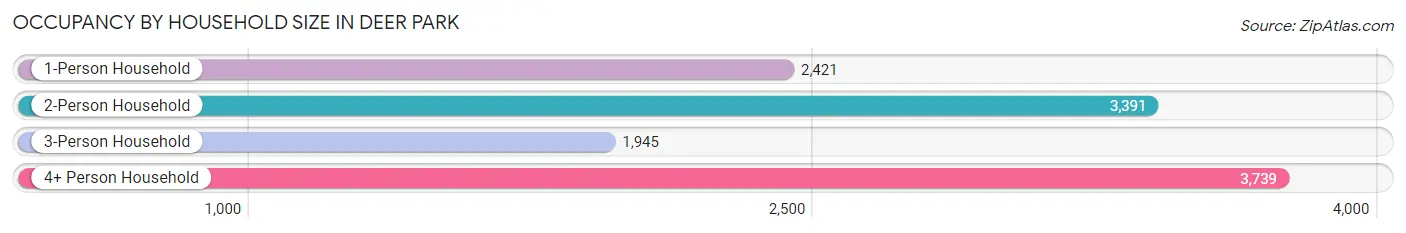
| Household Size | # Housing Units | % Housing Units |
| 1-Person Household | 2,421 | 21.1% |
| 2-Person Household | 3,391 | 29.5% |
| 3-Person Household | 1,945 | 16.9% |
| 4+ Person Household | 3,739 | 32.5% |
| Total Housing Units | 11,496 | 100.0% |
Occupancy by Ownership by Household Size in Deer Park
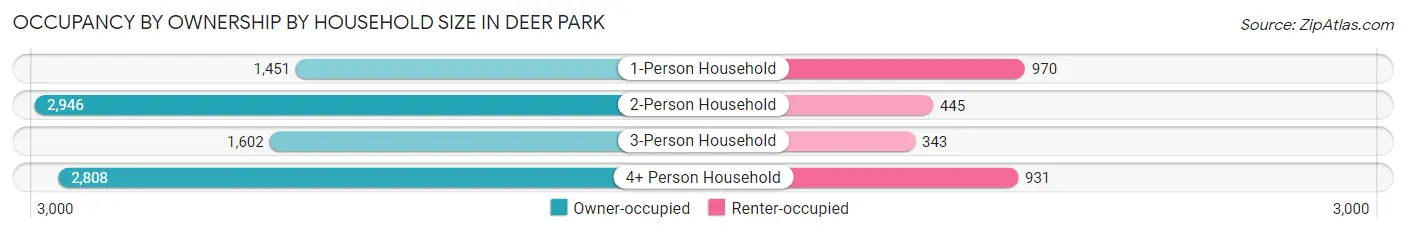
| Household Size | Owner-occupied | Renter-occupied |
| 1-Person Household | 1,451 (59.9%) | 970 (40.1%) |
| 2-Person Household | 2,946 (86.9%) | 445 (13.1%) |
| 3-Person Household | 1,602 (82.4%) | 343 (17.6%) |
| 4+ Person Household | 2,808 (75.1%) | 931 (24.9%) |
| Total Housing Units | 8,807 (76.6%) | 2,689 (23.4%) |
Occupancy by Educational Attainment in Deer Park
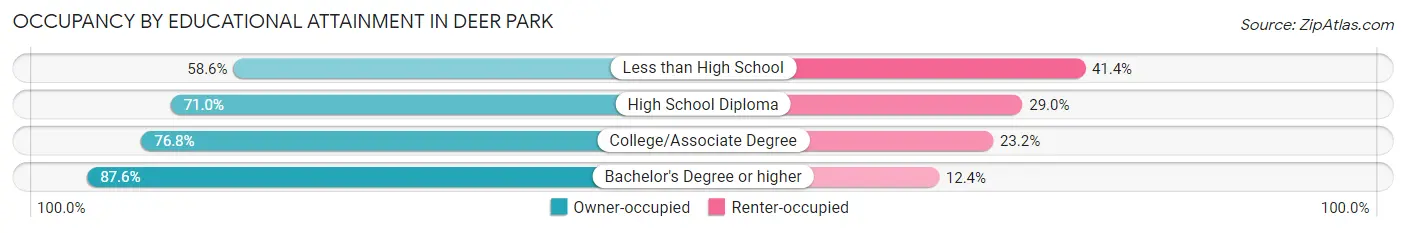
| Household Size | Owner-occupied | Renter-occupied |
| Less than High School | 616 (58.6%) | 435 (41.4%) |
| High School Diploma | 2,079 (71.0%) | 848 (29.0%) |
| College/Associate Degree | 3,378 (76.8%) | 1,018 (23.2%) |
| Bachelor's Degree or higher | 2,734 (87.6%) | 388 (12.4%) |
Occupancy by Age of Householder in Deer Park
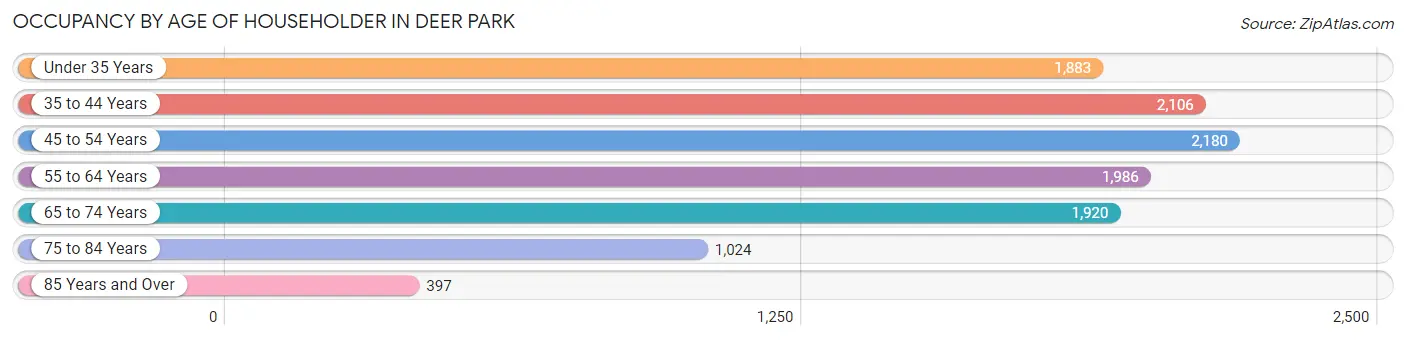
| Age Bracket | # Households | % Households |
| Under 35 Years | 1,883 | 16.4% |
| 35 to 44 Years | 2,106 | 18.3% |
| 45 to 54 Years | 2,180 | 19.0% |
| 55 to 64 Years | 1,986 | 17.3% |
| 65 to 74 Years | 1,920 | 16.7% |
| 75 to 84 Years | 1,024 | 8.9% |
| 85 Years and Over | 397 | 3.5% |
| Total | 11,496 | 100.0% |
Housing Finances in Deer Park
Median Income by Occupancy in Deer Park
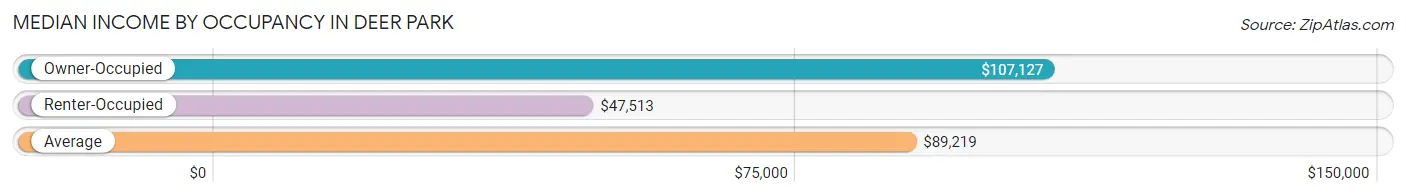
| Occupancy Type | # Households | Median Income |
| Owner-Occupied | 8,807 (76.6%) | $107,127 |
| Renter-Occupied | 2,689 (23.4%) | $47,513 |
| Average | 11,496 (100.0%) | $89,219 |
Occupancy by Householder Income Bracket in Deer Park
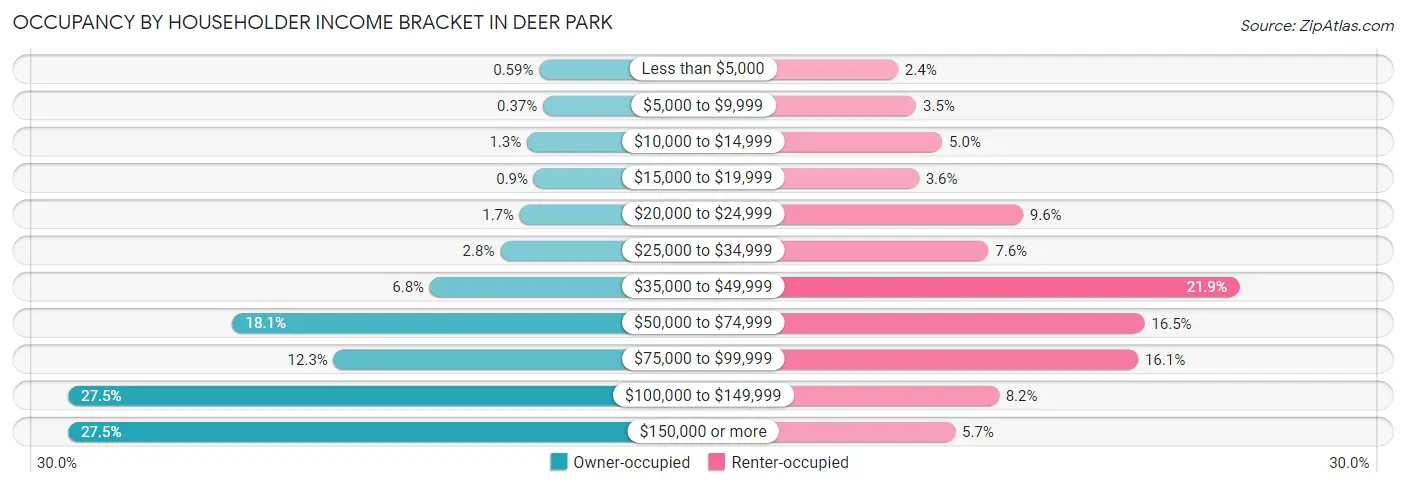
| Income Bracket | Owner-occupied | Renter-occupied |
| Less than $5,000 | 52 (0.6%) | 65 (2.4%) |
| $5,000 to $9,999 | 33 (0.4%) | 93 (3.5%) |
| $10,000 to $14,999 | 114 (1.3%) | 133 (5.0%) |
| $15,000 to $19,999 | 79 (0.9%) | 97 (3.6%) |
| $20,000 to $24,999 | 150 (1.7%) | 257 (9.6%) |
| $25,000 to $34,999 | 248 (2.8%) | 204 (7.6%) |
| $35,000 to $49,999 | 602 (6.8%) | 589 (21.9%) |
| $50,000 to $74,999 | 1,595 (18.1%) | 444 (16.5%) |
| $75,000 to $99,999 | 1,087 (12.3%) | 434 (16.1%) |
| $100,000 to $149,999 | 2,423 (27.5%) | 220 (8.2%) |
| $150,000 or more | 2,424 (27.5%) | 153 (5.7%) |
| Total | 8,807 (100.0%) | 2,689 (100.0%) |
Monthly Housing Cost Tiers in Deer Park
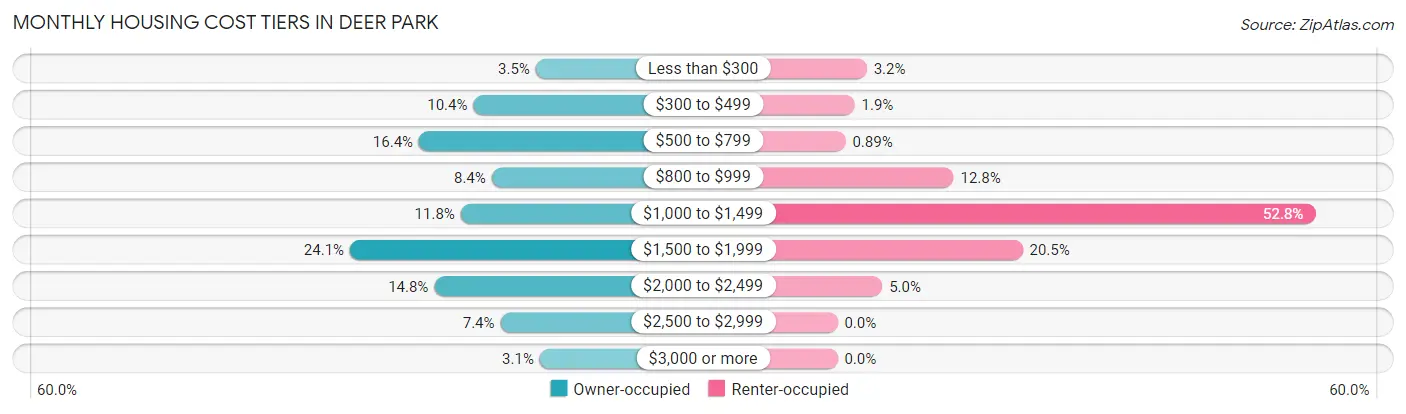
| Monthly Cost | Owner-occupied | Renter-occupied |
| Less than $300 | 312 (3.5%) | 87 (3.2%) |
| $300 to $499 | 919 (10.4%) | 51 (1.9%) |
| $500 to $799 | 1,448 (16.4%) | 24 (0.9%) |
| $800 to $999 | 741 (8.4%) | 345 (12.8%) |
| $1,000 to $1,499 | 1,042 (11.8%) | 1,419 (52.8%) |
| $1,500 to $1,999 | 2,119 (24.1%) | 550 (20.4%) |
| $2,000 to $2,499 | 1,299 (14.7%) | 133 (5.0%) |
| $2,500 to $2,999 | 655 (7.4%) | 0 (0.0%) |
| $3,000 or more | 272 (3.1%) | 0 (0.0%) |
| Total | 8,807 (100.0%) | 2,689 (100.0%) |
Physical Housing Characteristics in Deer Park
Housing Structures in Deer Park
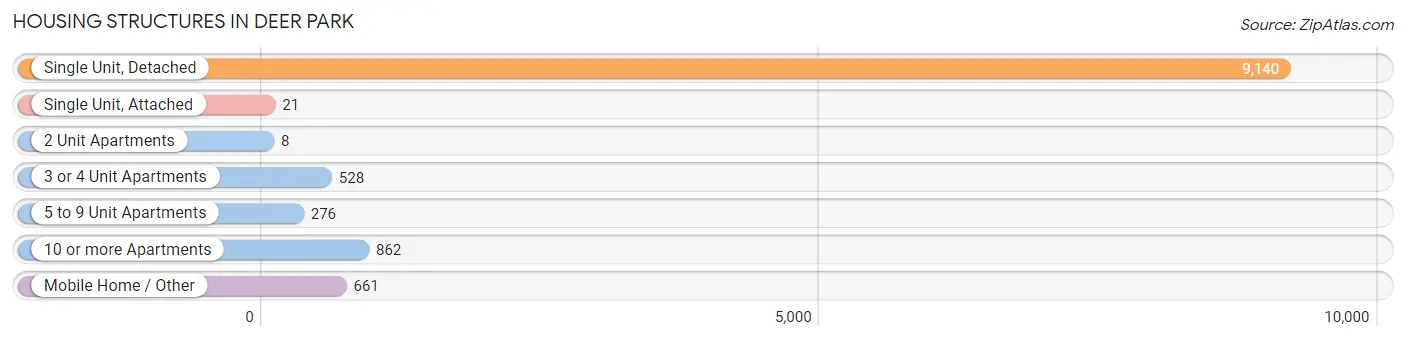
| Structure Type | # Housing Units | % Housing Units |
| Single Unit, Detached | 9,140 | 79.5% |
| Single Unit, Attached | 21 | 0.2% |
| 2 Unit Apartments | 8 | 0.1% |
| 3 or 4 Unit Apartments | 528 | 4.6% |
| 5 to 9 Unit Apartments | 276 | 2.4% |
| 10 or more Apartments | 862 | 7.5% |
| Mobile Home / Other | 661 | 5.8% |
| Total | 11,496 | 100.0% |
Housing Structures by Occupancy in Deer Park
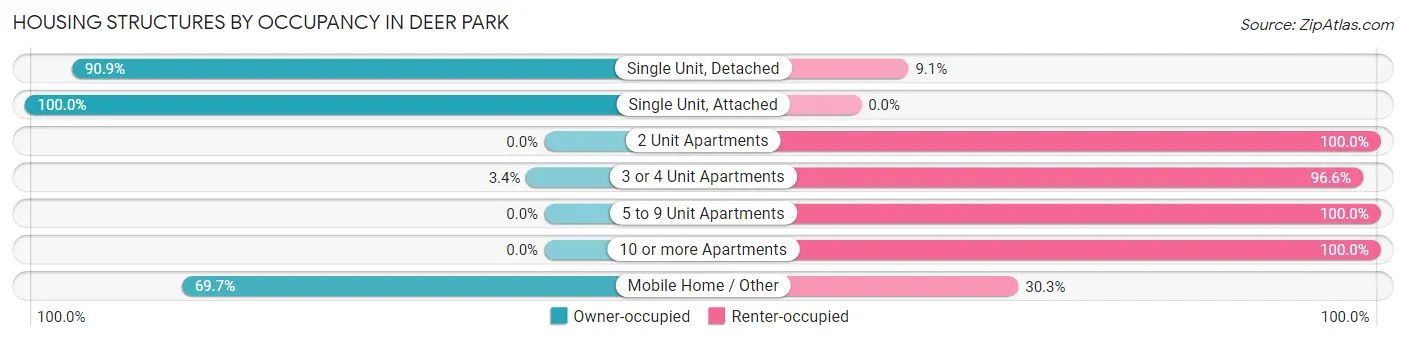
| Structure Type | Owner-occupied | Renter-occupied |
| Single Unit, Detached | 8,307 (90.9%) | 833 (9.1%) |
| Single Unit, Attached | 21 (100.0%) | 0 (0.0%) |
| 2 Unit Apartments | 0 (0.0%) | 8 (100.0%) |
| 3 or 4 Unit Apartments | 18 (3.4%) | 510 (96.6%) |
| 5 to 9 Unit Apartments | 0 (0.0%) | 276 (100.0%) |
| 10 or more Apartments | 0 (0.0%) | 862 (100.0%) |
| Mobile Home / Other | 461 (69.7%) | 200 (30.3%) |
| Total | 8,807 (76.6%) | 2,689 (23.4%) |
Housing Structures by Number of Rooms in Deer Park
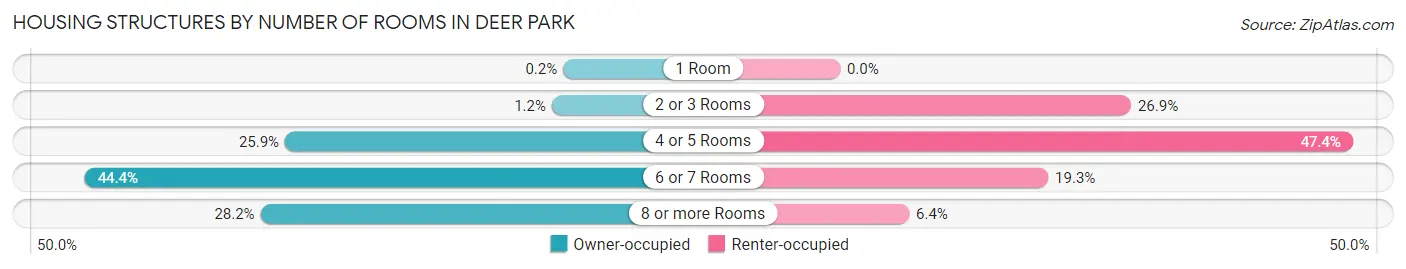
| Number of Rooms | Owner-occupied | Renter-occupied |
| 1 Room | 18 (0.2%) | 0 (0.0%) |
| 2 or 3 Rooms | 109 (1.2%) | 724 (26.9%) |
| 4 or 5 Rooms | 2,283 (25.9%) | 1,275 (47.4%) |
| 6 or 7 Rooms | 3,914 (44.4%) | 518 (19.3%) |
| 8 or more Rooms | 2,483 (28.2%) | 172 (6.4%) |
| Total | 8,807 (100.0%) | 2,689 (100.0%) |
Housing Structure by Heating Type in Deer Park
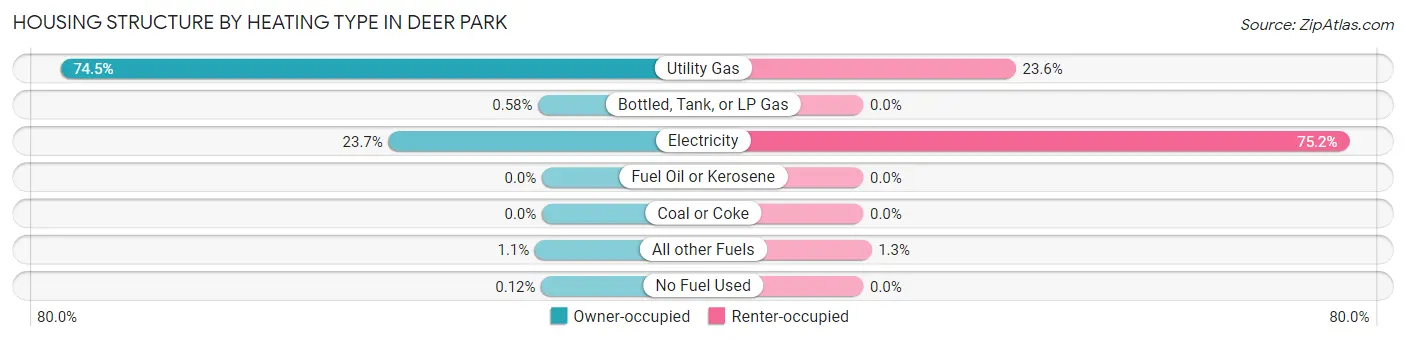
| Heating Type | Owner-occupied | Renter-occupied |
| Utility Gas | 6,560 (74.5%) | 634 (23.6%) |
| Bottled, Tank, or LP Gas | 51 (0.6%) | 0 (0.0%) |
| Electricity | 2,090 (23.7%) | 2,021 (75.2%) |
| Fuel Oil or Kerosene | 0 (0.0%) | 0 (0.0%) |
| Coal or Coke | 0 (0.0%) | 0 (0.0%) |
| All other Fuels | 95 (1.1%) | 34 (1.3%) |
| No Fuel Used | 11 (0.1%) | 0 (0.0%) |
| Total | 8,807 (100.0%) | 2,689 (100.0%) |
Household Vehicle Usage in Deer Park
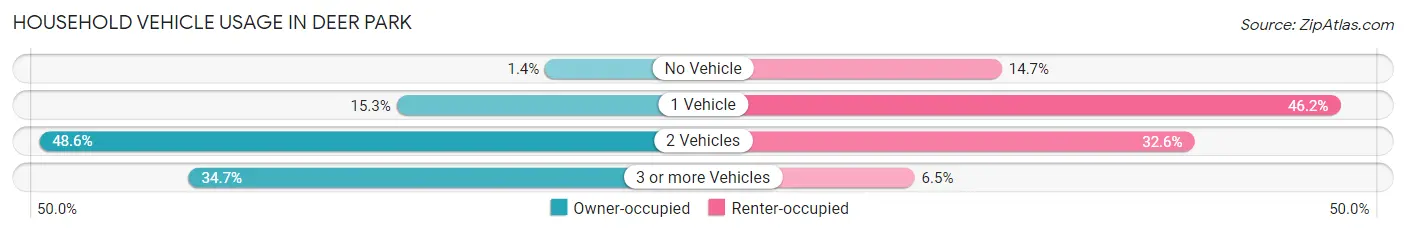
| Vehicles per Household | Owner-occupied | Renter-occupied |
| No Vehicle | 124 (1.4%) | 394 (14.6%) |
| 1 Vehicle | 1,346 (15.3%) | 1,243 (46.2%) |
| 2 Vehicles | 4,283 (48.6%) | 877 (32.6%) |
| 3 or more Vehicles | 3,054 (34.7%) | 175 (6.5%) |
| Total | 8,807 (100.0%) | 2,689 (100.0%) |
Real Estate & Mortgages in Deer Park
Real Estate and Mortgage Overview in Deer Park
| Characteristic | Without Mortgage | With Mortgage |
| Housing Units | 3,507 | 5,300 |
| Median Property Value | $197,700 | $238,500 |
| Median Household Income | $88,057 | $1,693 |
| Monthly Housing Costs | $655 | $272 |
| Real Estate Taxes | $2,512 | $301 |
Property Value by Mortgage Status in Deer Park
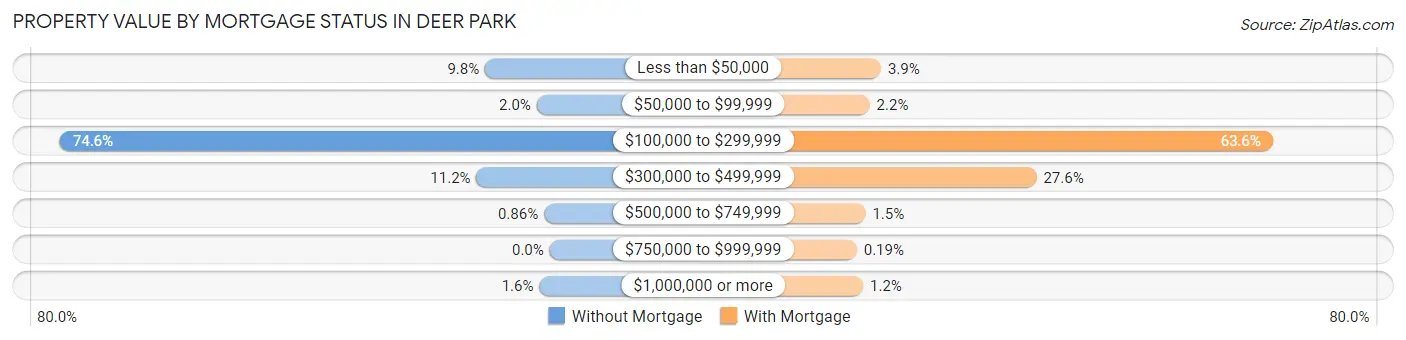
| Property Value | Without Mortgage | With Mortgage |
| Less than $50,000 | 345 (9.8%) | 205 (3.9%) |
| $50,000 to $99,999 | 69 (2.0%) | 114 (2.1%) |
| $100,000 to $299,999 | 2,617 (74.6%) | 3,369 (63.6%) |
| $300,000 to $499,999 | 391 (11.2%) | 1,461 (27.6%) |
| $500,000 to $749,999 | 30 (0.9%) | 80 (1.5%) |
| $750,000 to $999,999 | 0 (0.0%) | 10 (0.2%) |
| $1,000,000 or more | 55 (1.6%) | 61 (1.1%) |
| Total | 3,507 (100.0%) | 5,300 (100.0%) |
Household Income by Mortgage Status in Deer Park
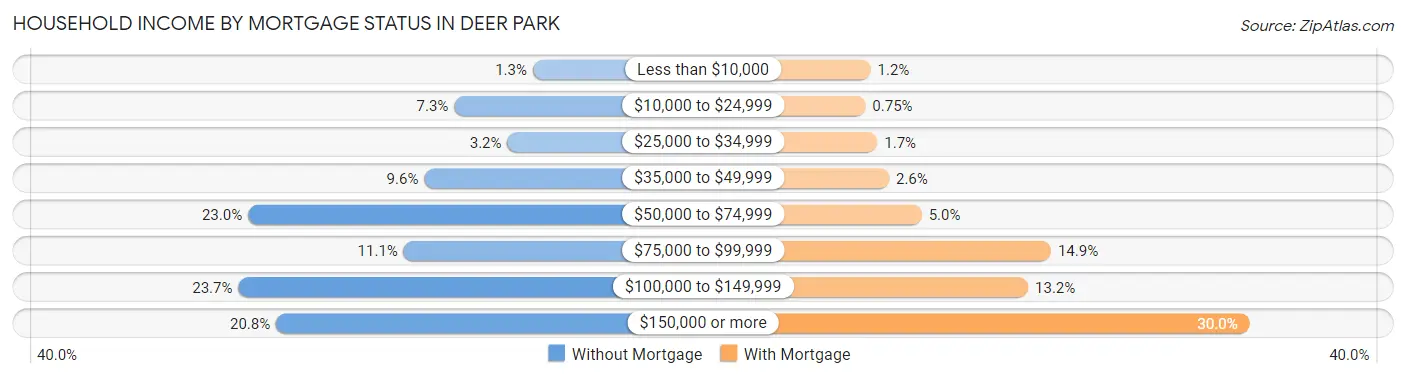
| Household Income | Without Mortgage | With Mortgage |
| Less than $10,000 | 45 (1.3%) | 61 (1.1%) |
| $10,000 to $24,999 | 255 (7.3%) | 40 (0.7%) |
| $25,000 to $34,999 | 113 (3.2%) | 88 (1.7%) |
| $35,000 to $49,999 | 335 (9.6%) | 135 (2.5%) |
| $50,000 to $74,999 | 806 (23.0%) | 267 (5.0%) |
| $75,000 to $99,999 | 390 (11.1%) | 789 (14.9%) |
| $100,000 to $149,999 | 832 (23.7%) | 697 (13.2%) |
| $150,000 or more | 731 (20.8%) | 1,591 (30.0%) |
| Total | 3,507 (100.0%) | 5,300 (100.0%) |
Property Value to Household Income Ratio in Deer Park
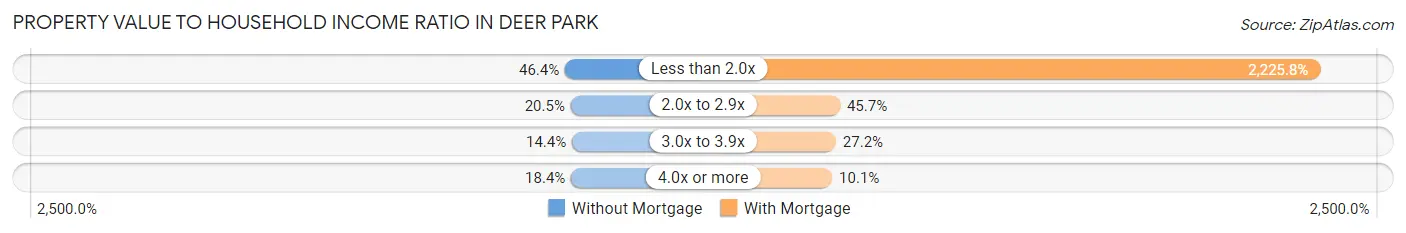
| Value-to-Income Ratio | Without Mortgage | With Mortgage |
| Less than 2.0x | 1,626 (46.4%) | 117,969 (2,225.8%) |
| 2.0x to 2.9x | 718 (20.5%) | 2,422 (45.7%) |
| 3.0x to 3.9x | 504 (14.4%) | 1,441 (27.2%) |
| 4.0x or more | 645 (18.4%) | 536 (10.1%) |
| Total | 3,507 (100.0%) | 5,300 (100.0%) |
Real Estate Taxes by Mortgage Status in Deer Park
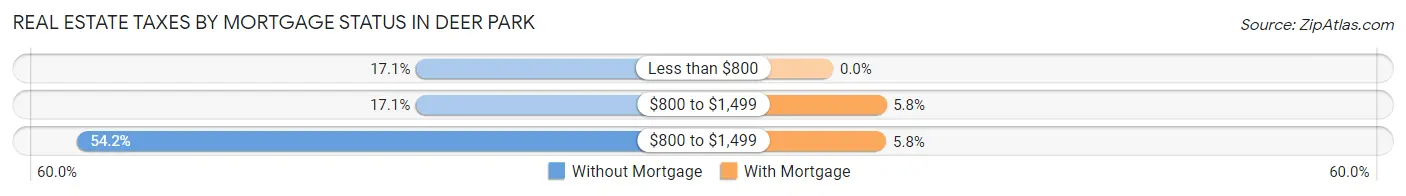
| Property Taxes | Without Mortgage | With Mortgage |
| Less than $800 | 599 (17.1%) | 0 (0.0%) |
| $800 to $1,499 | 600 (17.1%) | 309 (5.8%) |
| $800 to $1,499 | 1,901 (54.2%) | 308 (5.8%) |
| Total | 3,507 (100.0%) | 5,300 (100.0%) |
Health & Disability in Deer Park
Health Insurance Coverage by Age in Deer Park
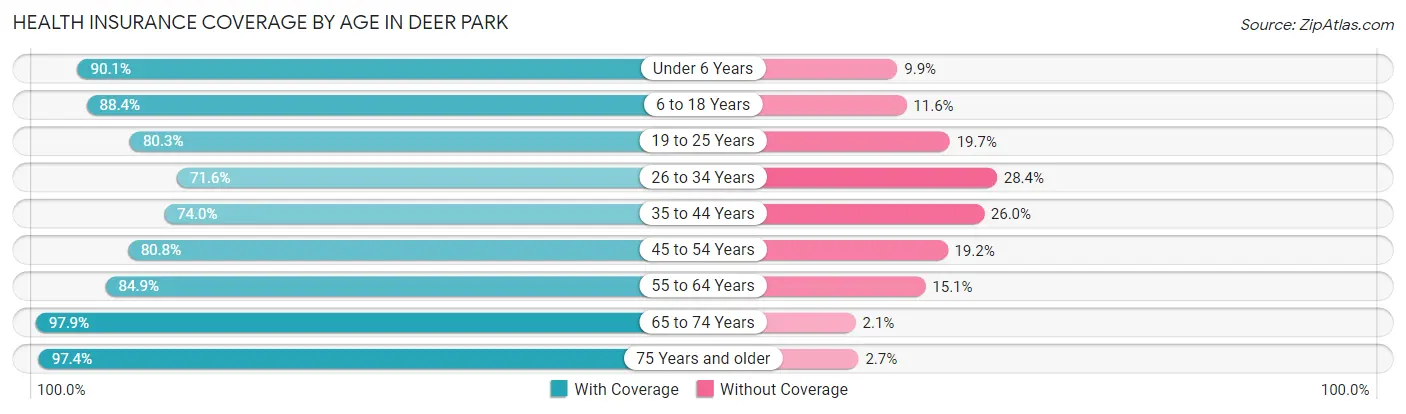
| Age Bracket | With Coverage | Without Coverage |
| Under 6 Years | 2,286 (90.1%) | 251 (9.9%) |
| 6 to 18 Years | 5,771 (88.4%) | 756 (11.6%) |
| 19 to 25 Years | 2,925 (80.3%) | 716 (19.7%) |
| 26 to 34 Years | 2,388 (71.6%) | 949 (28.4%) |
| 35 to 44 Years | 3,446 (74.0%) | 1,212 (26.0%) |
| 45 to 54 Years | 3,153 (80.8%) | 751 (19.2%) |
| 55 to 64 Years | 3,267 (84.9%) | 582 (15.1%) |
| 65 to 74 Years | 3,247 (97.9%) | 70 (2.1%) |
| 75 Years and older | 1,980 (97.4%) | 54 (2.6%) |
| Total | 28,463 (84.2%) | 5,341 (15.8%) |
Health Insurance Coverage by Citizenship Status in Deer Park
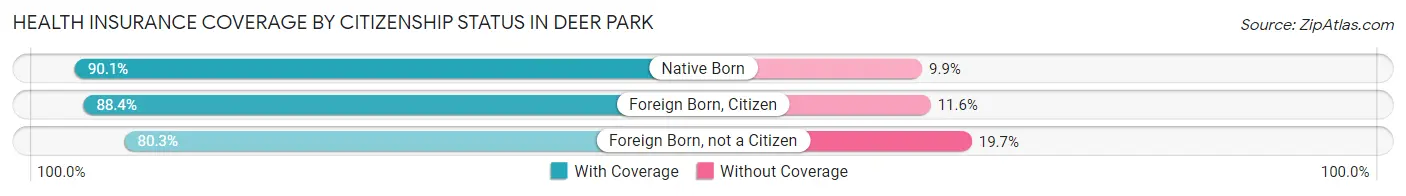
| Citizenship Status | With Coverage | Without Coverage |
| Native Born | 2,286 (90.1%) | 251 (9.9%) |
| Foreign Born, Citizen | 5,771 (88.4%) | 756 (11.6%) |
| Foreign Born, not a Citizen | 2,925 (80.3%) | 716 (19.7%) |
Health Insurance Coverage by Household Income in Deer Park
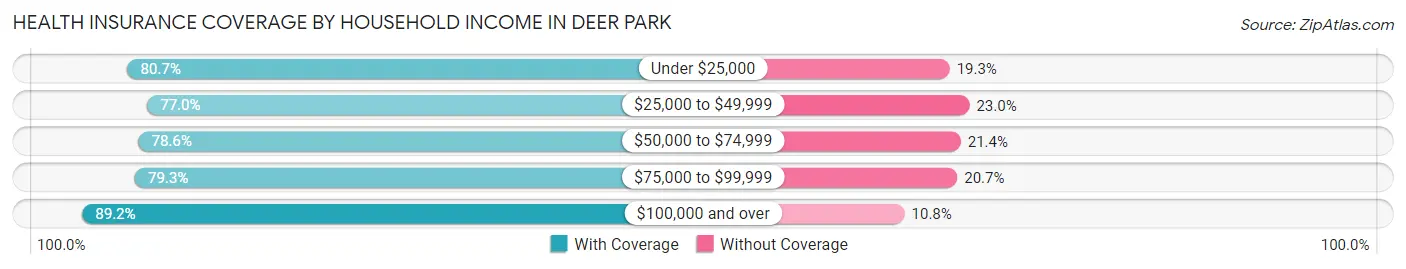
| Household Income | With Coverage | Without Coverage |
| Under $25,000 | 1,591 (80.7%) | 380 (19.3%) |
| $25,000 to $49,999 | 2,737 (77.0%) | 817 (23.0%) |
| $50,000 to $74,999 | 3,931 (78.6%) | 1,068 (21.4%) |
| $75,000 to $99,999 | 4,351 (79.3%) | 1,136 (20.7%) |
| $100,000 and over | 15,811 (89.2%) | 1,920 (10.8%) |
Public vs Private Health Insurance Coverage by Age in Deer Park
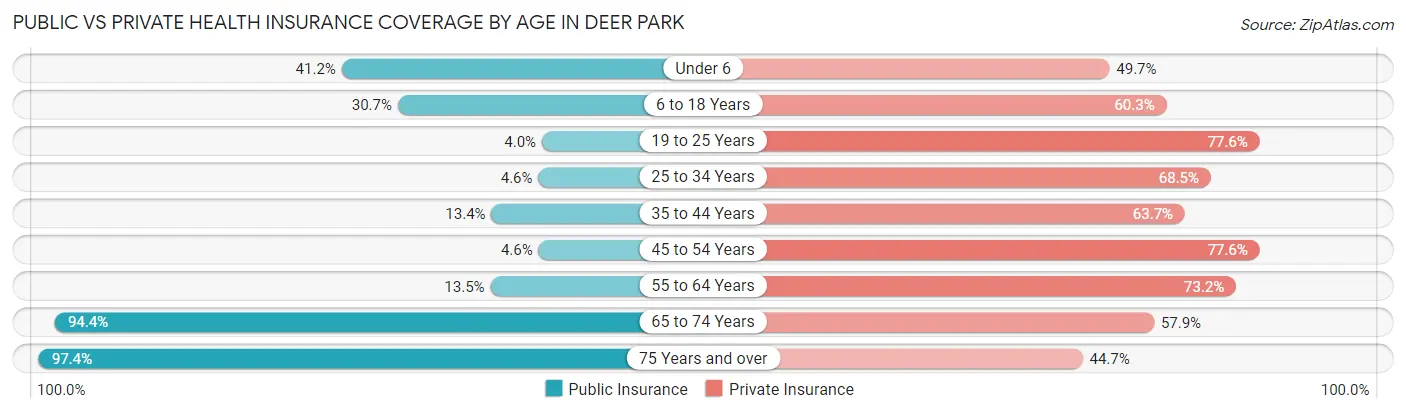
| Age Bracket | Public Insurance | Private Insurance |
| Under 6 | 1,044 (41.1%) | 1,260 (49.7%) |
| 6 to 18 Years | 2,006 (30.7%) | 3,933 (60.3%) |
| 19 to 25 Years | 145 (4.0%) | 2,824 (77.6%) |
| 25 to 34 Years | 155 (4.6%) | 2,286 (68.5%) |
| 35 to 44 Years | 622 (13.4%) | 2,966 (63.7%) |
| 45 to 54 Years | 180 (4.6%) | 3,028 (77.6%) |
| 55 to 64 Years | 521 (13.5%) | 2,817 (73.2%) |
| 65 to 74 Years | 3,130 (94.4%) | 1,922 (57.9%) |
| 75 Years and over | 1,980 (97.4%) | 909 (44.7%) |
| Total | 9,783 (28.9%) | 21,945 (64.9%) |
Disability Status by Sex by Age in Deer Park
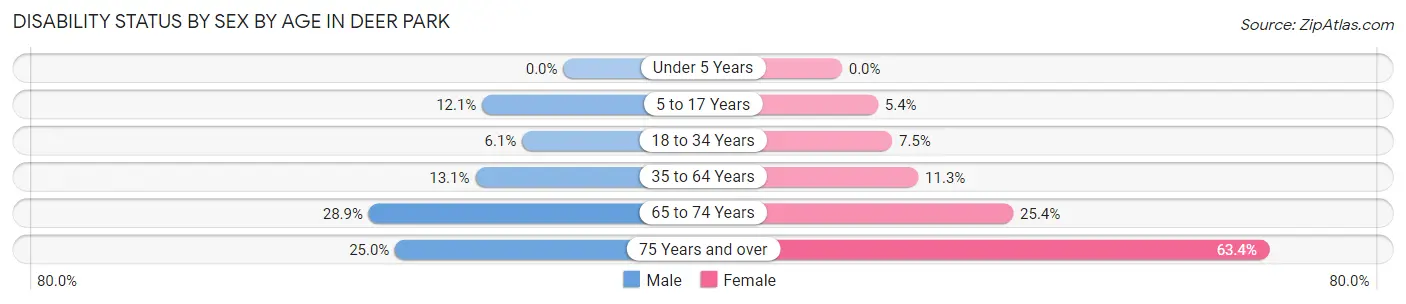
| Age Bracket | Male | Female |
| Under 5 Years | 0 (0.0%) | 0 (0.0%) |
| 5 to 17 Years | 419 (12.0%) | 164 (5.3%) |
| 18 to 34 Years | 217 (6.1%) | 282 (7.5%) |
| 35 to 64 Years | 799 (13.1%) | 715 (11.3%) |
| 65 to 74 Years | 470 (28.9%) | 430 (25.4%) |
| 75 Years and over | 218 (25.0%) | 736 (63.4%) |
Disability Class by Sex by Age in Deer Park
Disability Class: Hearing Difficulty
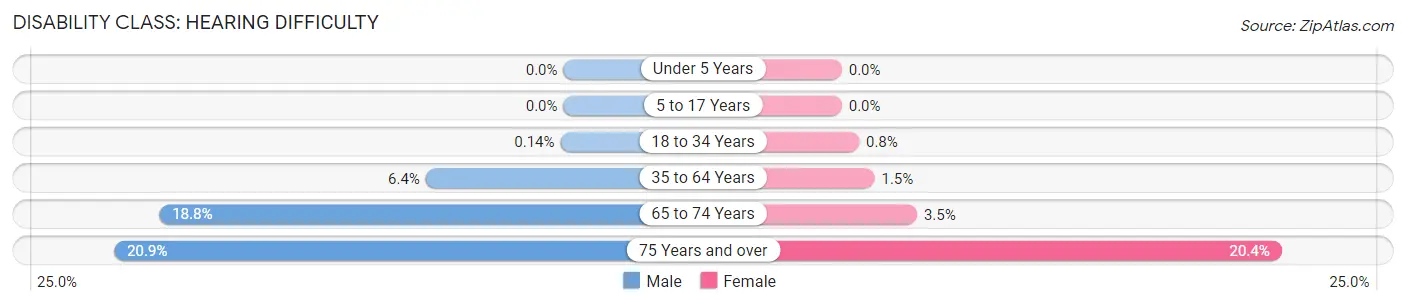
| Age Bracket | Male | Female |
| Under 5 Years | 0 (0.0%) | 0 (0.0%) |
| 5 to 17 Years | 0 (0.0%) | 0 (0.0%) |
| 18 to 34 Years | 5 (0.1%) | 30 (0.8%) |
| 35 to 64 Years | 390 (6.4%) | 96 (1.5%) |
| 65 to 74 Years | 305 (18.8%) | 59 (3.5%) |
| 75 Years and over | 182 (20.8%) | 237 (20.4%) |
Disability Class: Vision Difficulty
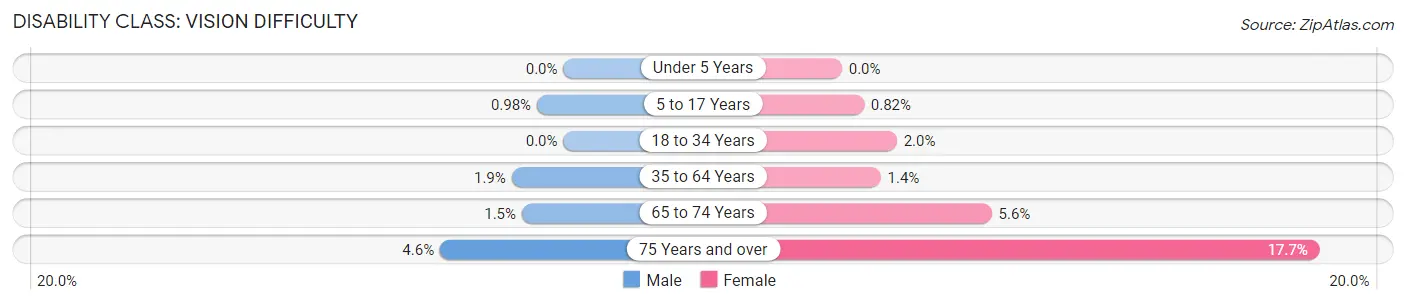
| Age Bracket | Male | Female |
| Under 5 Years | 0 (0.0%) | 0 (0.0%) |
| 5 to 17 Years | 34 (1.0%) | 25 (0.8%) |
| 18 to 34 Years | 0 (0.0%) | 77 (2.0%) |
| 35 to 64 Years | 117 (1.9%) | 91 (1.4%) |
| 65 to 74 Years | 25 (1.5%) | 94 (5.6%) |
| 75 Years and over | 40 (4.6%) | 206 (17.7%) |
Disability Class: Cognitive Difficulty
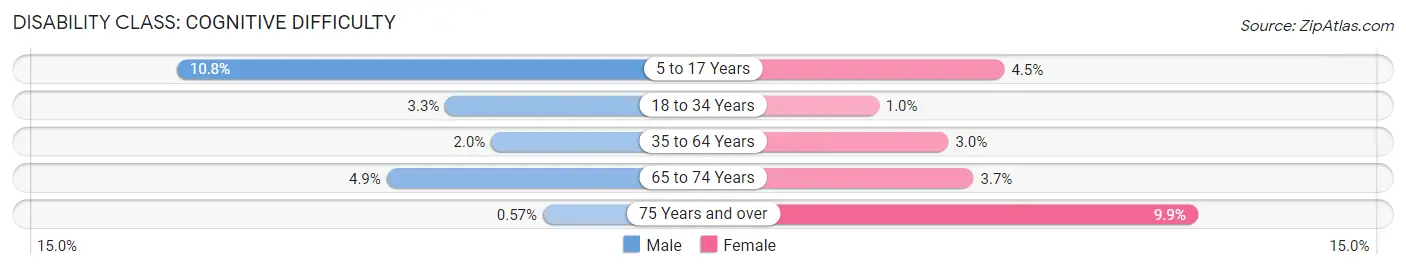
| Age Bracket | Male | Female |
| 5 to 17 Years | 374 (10.8%) | 139 (4.5%) |
| 18 to 34 Years | 117 (3.3%) | 39 (1.0%) |
| 35 to 64 Years | 123 (2.0%) | 187 (3.0%) |
| 65 to 74 Years | 80 (4.9%) | 62 (3.7%) |
| 75 Years and over | 5 (0.6%) | 115 (9.9%) |
Disability Class: Ambulatory Difficulty
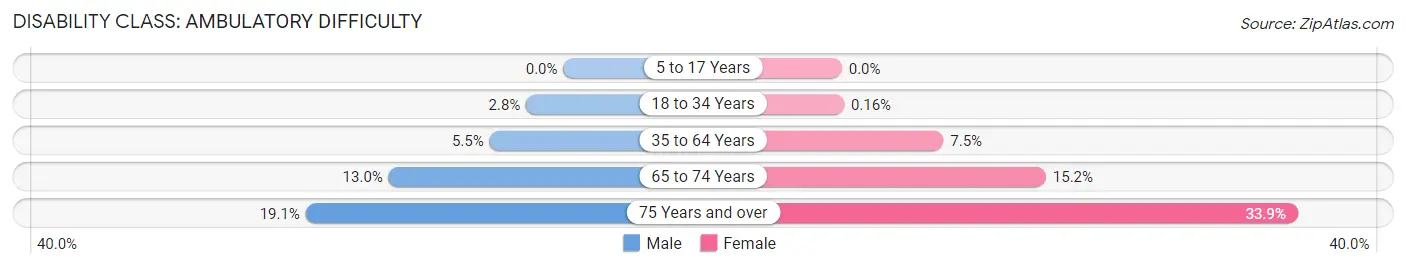
| Age Bracket | Male | Female |
| 5 to 17 Years | 0 (0.0%) | 0 (0.0%) |
| 18 to 34 Years | 98 (2.8%) | 6 (0.2%) |
| 35 to 64 Years | 335 (5.5%) | 475 (7.5%) |
| 65 to 74 Years | 211 (13.0%) | 256 (15.1%) |
| 75 Years and over | 167 (19.1%) | 393 (33.9%) |
Disability Class: Self-Care Difficulty
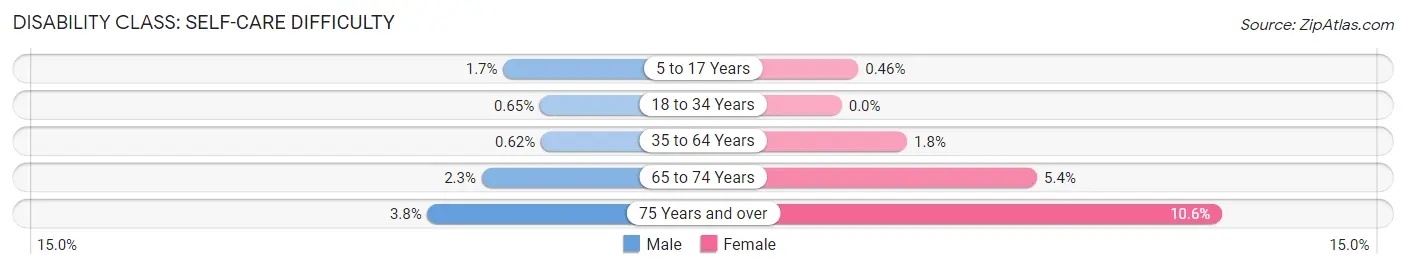
| Age Bracket | Male | Female |
| 5 to 17 Years | 58 (1.7%) | 14 (0.5%) |
| 18 to 34 Years | 23 (0.6%) | 0 (0.0%) |
| 35 to 64 Years | 38 (0.6%) | 115 (1.8%) |
| 65 to 74 Years | 37 (2.3%) | 92 (5.4%) |
| 75 Years and over | 33 (3.8%) | 123 (10.6%) |
Technology Access in Deer Park
Computing Device Access in Deer Park
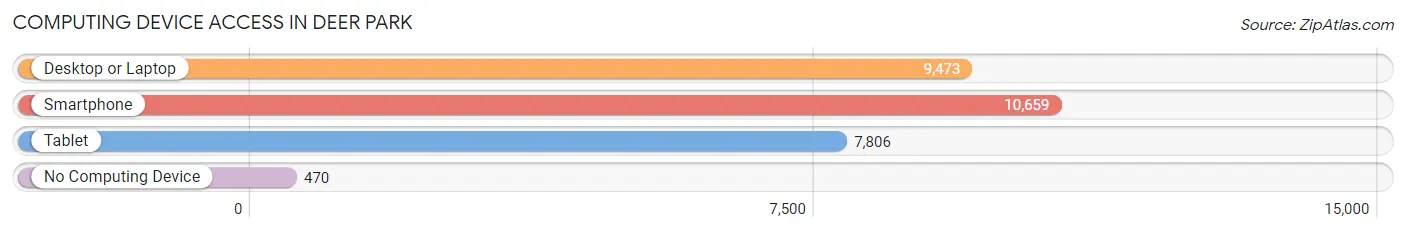
| Device Type | # Households | % Households |
| Desktop or Laptop | 9,473 | 82.4% |
| Smartphone | 10,659 | 92.7% |
| Tablet | 7,806 | 67.9% |
| No Computing Device | 470 | 4.1% |
| Total | 11,496 | 100.0% |
Internet Access in Deer Park
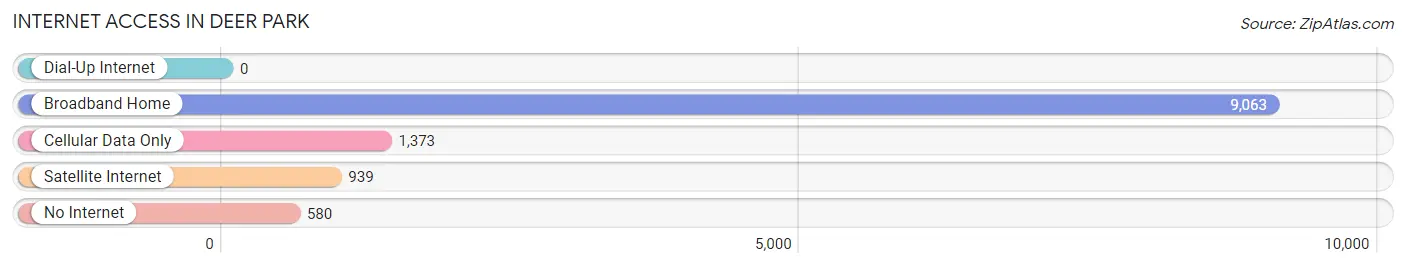
| Internet Type | # Households | % Households |
| Dial-Up Internet | 0 | 0.0% |
| Broadband Home | 9,063 | 78.8% |
| Cellular Data Only | 1,373 | 11.9% |
| Satellite Internet | 939 | 8.2% |
| No Internet | 580 | 5.1% |
| Total | 11,496 | 100.0% |
Deer Park Summary
Deer Park is a city located in Harris County, Texas, United States. The city is located in the Houston–The Woodlands–Sugar Land metropolitan area and is part of the Greater Houston area. As of the 2010 census, the city had a population of 32,010.
History
Deer Park was founded in 1892 by Simeon Henry West, who named the town after a nearby park that was home to a large number of deer. The town was incorporated in 1948 and has since grown to become a major suburb of Houston.
Geography
Deer Park is located at 29°41'17" North, 95°7'45" West (29.688, -95.129). It is situated in the southeastern part of Harris County, approximately 20 miles east of downtown Houston. The city has a total area of 14.6 square miles, of which 14.3 square miles is land and 0.3 square miles is water.
Economy
Deer Park is home to a number of major industries, including oil refining, petrochemical production, and manufacturing. The city is home to the largest oil refinery in the United States, the Shell Oil Company Deer Park Refinery. Other major employers in the city include Chevron Phillips Chemical Company, BASF Corporation, and Dow Chemical Company.
Demographics
As of the 2010 census, there were 32,010 people, 11,845 households, and 8,541 families residing in the city. The population density was 2,231.3 people per square mile. The racial makeup of the city was 77.2% White, 8.2% African American, 0.6% Native American, 2.2% Asian, 0.1% Pacific Islander, 9.2% from other races, and 2.6% from two or more races. Hispanic or Latino of any race were 24.2% of the population.
The median income for a household in the city was $54,945, and the median income for a family was $63,945. The per capita income for the city was $25,945. About 8.2% of families and 10.3% of the population were below the poverty line, including 14.2% of those under age 18 and 6.2% of those age 65 or over.
Conclusion
Deer Park is a city located in Harris County, Texas, United States. The city is located in the Houston–The Woodlands–Sugar Land metropolitan area and is part of the Greater Houston area. As of the 2010 census, the city had a population of 32,010. Deer Park was founded in 1892 by Simeon Henry West, and has since grown to become a major suburb of Houston. The city is home to a number of major industries, including oil refining, petrochemical production, and manufacturing. The racial makeup of the city was 77.2% White, 8.2% African American, 0.6% Native American, 2.2% Asian, 0.1% Pacific Islander, 9.2% from other races, and 2.6% from two or more races. The median income for a household in the city was $54,945, and the median income for a family was $63,945. Deer Park is a vibrant city with a diverse population and a strong economy.
Common Questions
What is Per Capita Income in Deer Park?
Per Capita income in Deer Park is $37,440.
What is the Median Family Income in Deer Park?
Median Family Income in Deer Park is $106,429.
What is the Median Household income in Deer Park?
Median Household Income in Deer Park is $89,219.
What is Income or Wage Gap in Deer Park?
Income or Wage Gap in Deer Park is 53.8%.
Women in Deer Park earn 46.2 cents for every dollar earned by a man.
What is Inequality or Gini Index in Deer Park?
Inequality or Gini Index in Deer Park is 0.40.
What is the Total Population of Deer Park?
Total Population of Deer Park is 34,046.
What is the Total Male Population of Deer Park?
Total Male Population of Deer Park is 17,015.
What is the Total Female Population of Deer Park?
Total Female Population of Deer Park is 17,031.
What is the Ratio of Males per 100 Females in Deer Park?
There are 99.91 Males per 100 Females in Deer Park.
What is the Ratio of Females per 100 Males in Deer Park?
There are 100.09 Females per 100 Males in Deer Park.
What is the Median Population Age in Deer Park?
Median Population Age in Deer Park is 36.8 Years.
What is the Average Family Size in Deer Park
Average Family Size in Deer Park is 3.4 People.
What is the Average Household Size in Deer Park
Average Household Size in Deer Park is 3.0 People.
How Large is the Labor Force in Deer Park?
There are 16,848 People in the Labor Forcein in Deer Park.
What is the Percentage of People in the Labor Force in Deer Park?
63.4% of People are in the Labor Force in Deer Park.
What is the Unemployment Rate in Deer Park?
Unemployment Rate in Deer Park is 4.9%.