Hidalgo, TX Map & Demographics
Hidalgo Map
Hidalgo Overview
$16,964
PER CAPITA INCOME
$47,246
AVG FAMILY INCOME
$45,919
AVG HOUSEHOLD INCOME
38.1%
WAGE / INCOME GAP [ % ]
61.9¢/ $1
WAGE / INCOME GAP [ $ ]
0.42
INEQUALITY / GINI INDEX
14,075
TOTAL POPULATION
7,247
MALE POPULATION
6,828
FEMALE POPULATION
106.14
MALES / 100 FEMALES
94.22
FEMALES / 100 MALES
28.8
MEDIAN AGE
4.1
AVG FAMILY SIZE
3.8
AVG HOUSEHOLD SIZE
6,599
LABOR FORCE [ PEOPLE ]
65.1%
PERCENT IN LABOR FORCE
7.8%
UNEMPLOYMENT RATE
Hidalgo Zip Codes
Hidalgo Area Codes
Income in Hidalgo
Income Overview in Hidalgo
Per Capita Income in Hidalgo is $16,964, while median incomes of families and households are $47,246 and $45,919 respectively.
| Characteristic | Number | Measure |
| Per Capita Income | 14,075 | $16,964 |
| Median Family Income | 3,275 | $47,246 |
| Mean Family Income | 3,275 | $62,195 |
| Median Household Income | 3,705 | $45,919 |
| Mean Household Income | 3,705 | $59,707 |
| Income Deficit | 3,275 | $0 |
| Wage / Income Gap (%) | 14,075 | 38.10% |
| Wage / Income Gap ($) | 14,075 | 61.90¢ per $1 |
| Gini / Inequality Index | 14,075 | 0.42 |
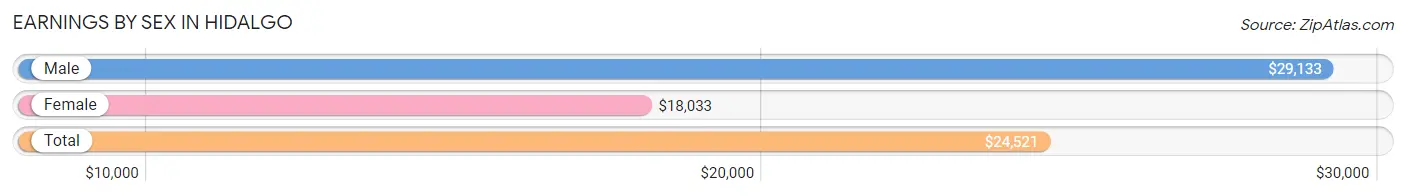
Earnings by Sex in Hidalgo
Average Earnings in Hidalgo are $24,521, $29,133 for men and $18,033 for women, a difference of 38.1%.
| Sex | Number | Average Earnings |
| Male | 3,828 (58.9%) | $29,133 |
| Female | 2,667 (41.1%) | $18,033 |
| Total | 6,495 (100.0%) | $24,521 |
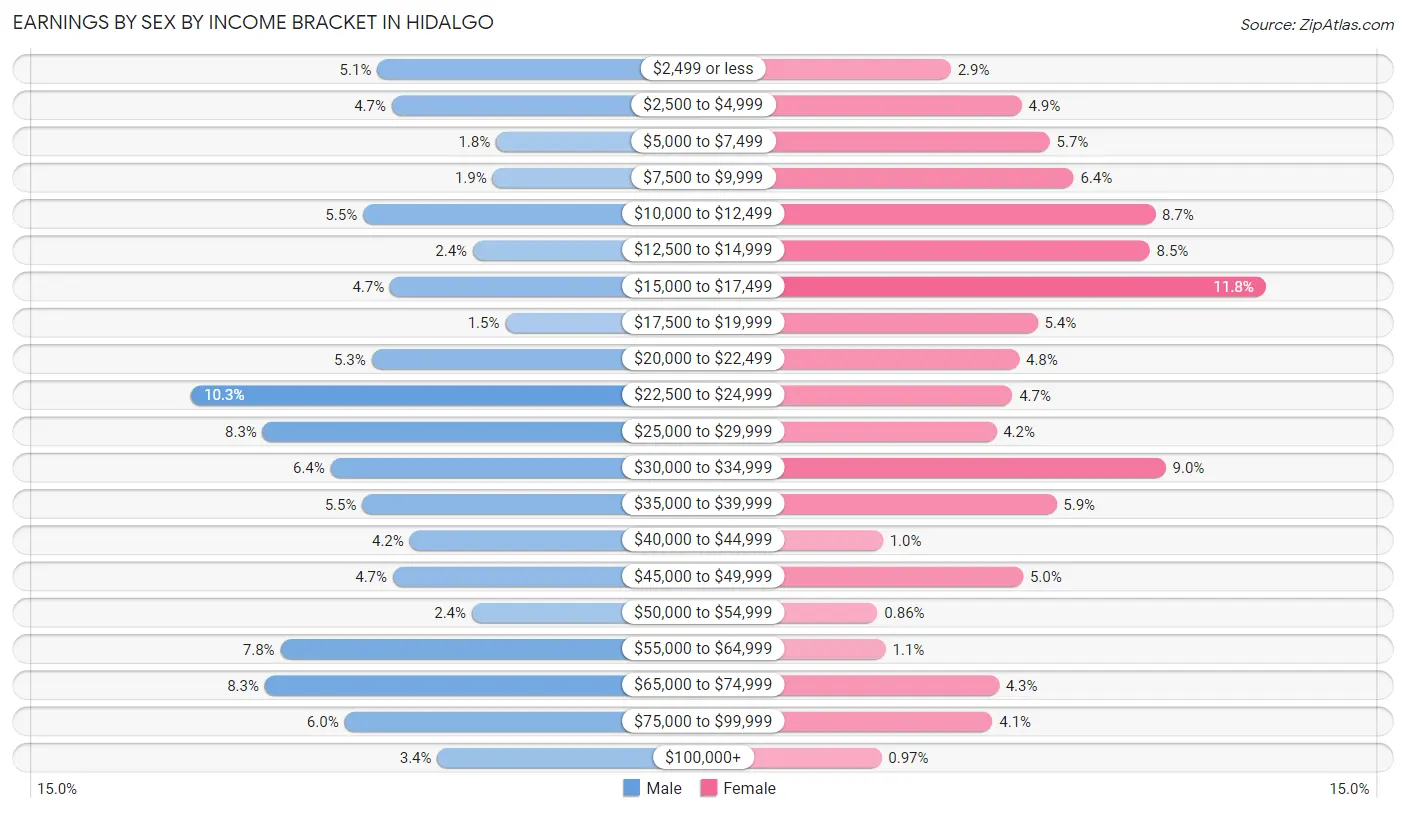
Earnings by Sex by Income Bracket in Hidalgo
The most common earnings brackets in Hidalgo are $22,500 to $24,999 for men (395 | 10.3%) and $15,000 to $17,499 for women (314 | 11.8%).
| Income | Male | Female |
| $2,499 or less | 195 (5.1%) | 78 (2.9%) |
| $2,500 to $4,999 | 179 (4.7%) | 131 (4.9%) |
| $5,000 to $7,499 | 67 (1.8%) | 152 (5.7%) |
| $7,500 to $9,999 | 71 (1.8%) | 170 (6.4%) |
| $10,000 to $12,499 | 210 (5.5%) | 231 (8.7%) |
| $12,500 to $14,999 | 92 (2.4%) | 227 (8.5%) |
| $15,000 to $17,499 | 181 (4.7%) | 314 (11.8%) |
| $17,500 to $19,999 | 57 (1.5%) | 143 (5.4%) |
| $20,000 to $22,499 | 201 (5.2%) | 129 (4.8%) |
| $22,500 to $24,999 | 395 (10.3%) | 124 (4.6%) |
| $25,000 to $29,999 | 318 (8.3%) | 112 (4.2%) |
| $30,000 to $34,999 | 245 (6.4%) | 239 (9.0%) |
| $35,000 to $39,999 | 211 (5.5%) | 157 (5.9%) |
| $40,000 to $44,999 | 160 (4.2%) | 27 (1.0%) |
| $45,000 to $49,999 | 178 (4.6%) | 132 (5.0%) |
| $50,000 to $54,999 | 93 (2.4%) | 23 (0.9%) |
| $55,000 to $64,999 | 299 (7.8%) | 29 (1.1%) |
| $65,000 to $74,999 | 316 (8.3%) | 114 (4.3%) |
| $75,000 to $99,999 | 230 (6.0%) | 109 (4.1%) |
| $100,000+ | 130 (3.4%) | 26 (1.0%) |
| Total | 3,828 (100.0%) | 2,667 (100.0%) |
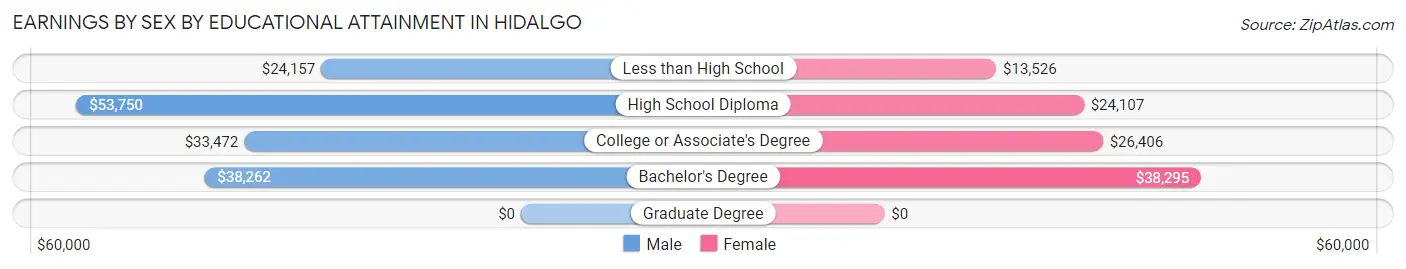
Earnings by Sex by Educational Attainment in Hidalgo
Average earnings in Hidalgo are $34,498 for men and $21,579 for women, a difference of 37.4%. Men with an educational attainment of high school diploma enjoy the highest average annual earnings of $53,750, while those with less than high school education earn the least with $24,157. Women with an educational attainment of bachelor's degree earn the most with the average annual earnings of $38,295, while those with less than high school education have the smallest earnings of $13,526.
| Educational Attainment | Male Income | Female Income |
| Less than High School | $24,157 | $13,526 |
| High School Diploma | $53,750 | $24,107 |
| College or Associate's Degree | $33,472 | $26,406 |
| Bachelor's Degree | $38,262 | $38,295 |
| Graduate Degree | - | - |
| Total | $34,498 | $21,579 |
Family Income in Hidalgo
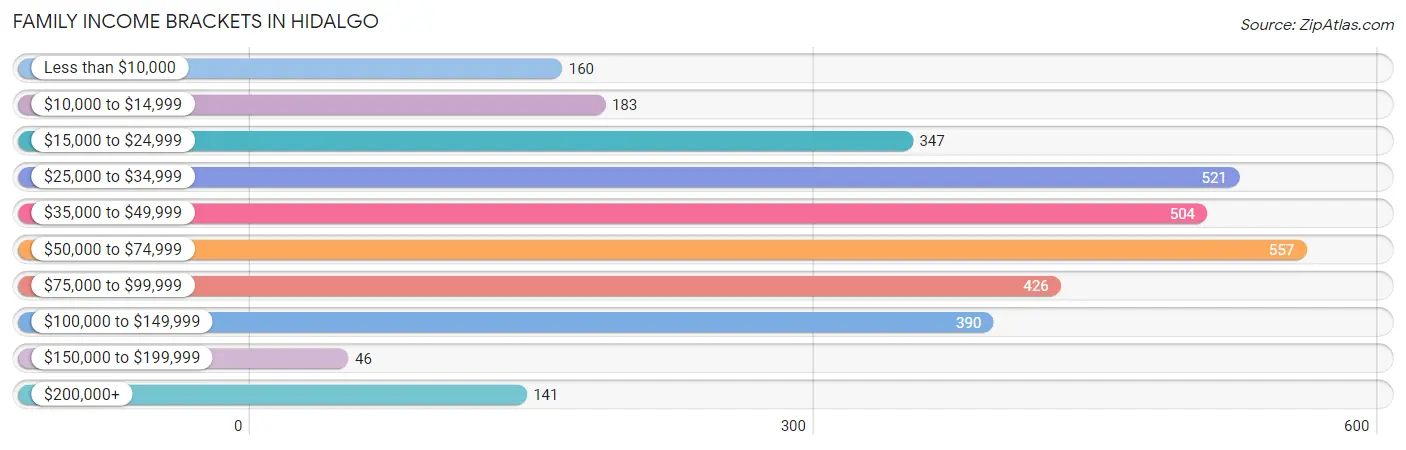
Family Income Brackets in Hidalgo
According to the Hidalgo family income data, there are 557 families falling into the $50,000 to $74,999 income range, which is the most common income bracket and makes up 17.0% of all families. Conversely, the $150,000 to $199,999 income bracket is the least frequent group with only 46 families (1.4%) belonging to this category.
| Income Bracket | # Families | % Families |
| Less than $10,000 | 160 | 4.9% |
| $10,000 to $14,999 | 183 | 5.6% |
| $15,000 to $24,999 | 347 | 10.6% |
| $25,000 to $34,999 | 521 | 15.9% |
| $35,000 to $49,999 | 504 | 15.4% |
| $50,000 to $74,999 | 557 | 17.0% |
| $75,000 to $99,999 | 426 | 13.0% |
| $100,000 to $149,999 | 390 | 11.9% |
| $150,000 to $199,999 | 46 | 1.4% |
| $200,000+ | 141 | 4.3% |
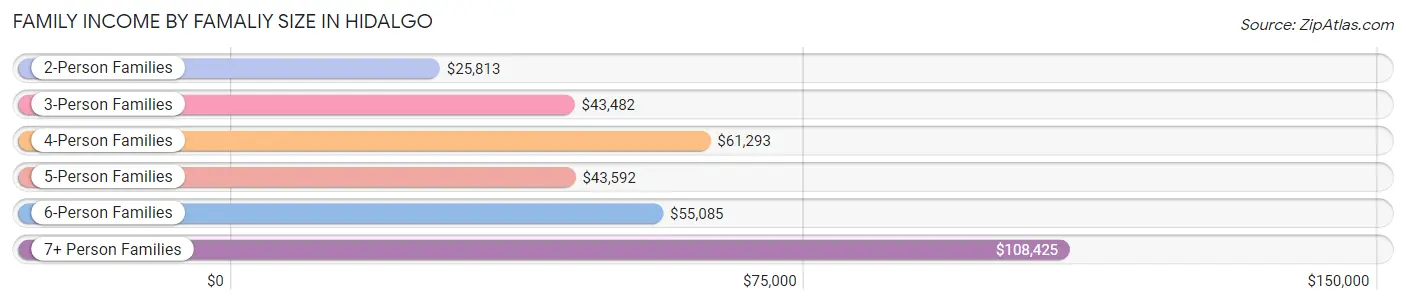
Family Income by Famaliy Size in Hidalgo
7+ person families (170 | 5.2%) account for the highest median family income in Hidalgo with $108,425 per family, while 7+ person families (170 | 5.2%) have the highest median income of $15,489 per family member.
| Income Bracket | # Families | Median Income |
| 2-Person Families | 783 (23.9%) | $25,813 |
| 3-Person Families | 668 (20.4%) | $43,482 |
| 4-Person Families | 690 (21.1%) | $61,293 |
| 5-Person Families | 564 (17.2%) | $43,592 |
| 6-Person Families | 400 (12.2%) | $55,085 |
| 7+ Person Families | 170 (5.2%) | $108,425 |
| Total | 3,275 (100.0%) | $47,246 |
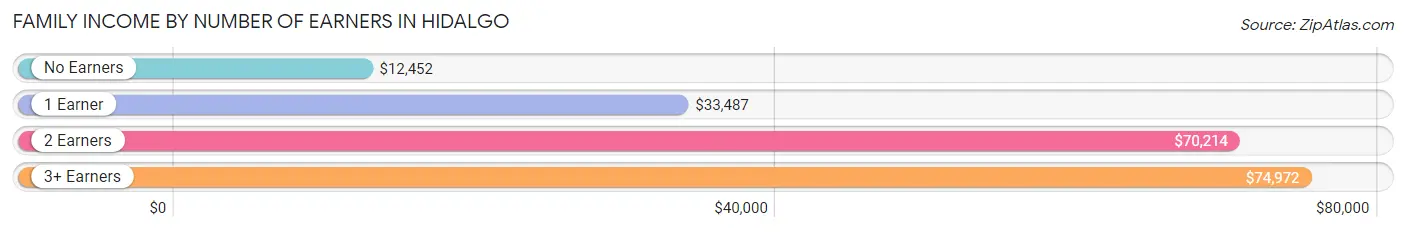
Family Income by Number of Earners in Hidalgo
The median family income in Hidalgo is $47,246, with families comprising 3+ earners (629) having the highest median family income of $74,972, while families with no earners (300) have the lowest median family income of $12,452, accounting for 19.2% and 9.2% of families, respectively.
| Number of Earners | # Families | Median Income |
| No Earners | 300 (9.2%) | $12,452 |
| 1 Earner | 1,100 (33.6%) | $33,487 |
| 2 Earners | 1,246 (38.1%) | $70,214 |
| 3+ Earners | 629 (19.2%) | $74,972 |
| Total | 3,275 (100.0%) | $47,246 |
Household Income in Hidalgo
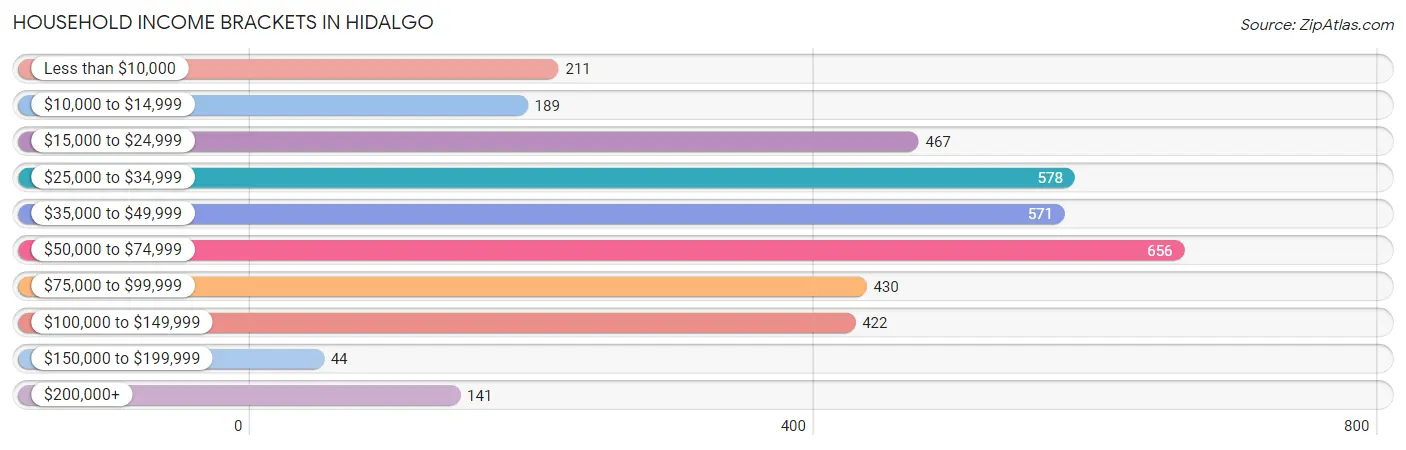
Household Income Brackets in Hidalgo
With 656 households falling in the category, the $50,000 to $74,999 income range is the most frequent in Hidalgo, accounting for 17.7% of all households. In contrast, only 44 households (1.2%) fall into the $150,000 to $199,999 income bracket, making it the least populous group.
| Income Bracket | # Households | % Households |
| Less than $10,000 | 211 | 5.7% |
| $10,000 to $14,999 | 189 | 5.1% |
| $15,000 to $24,999 | 467 | 12.6% |
| $25,000 to $34,999 | 578 | 15.6% |
| $35,000 to $49,999 | 571 | 15.4% |
| $50,000 to $74,999 | 656 | 17.7% |
| $75,000 to $99,999 | 430 | 11.6% |
| $100,000 to $149,999 | 422 | 11.4% |
| $150,000 to $199,999 | 44 | 1.2% |
| $200,000+ | 141 | 3.8% |
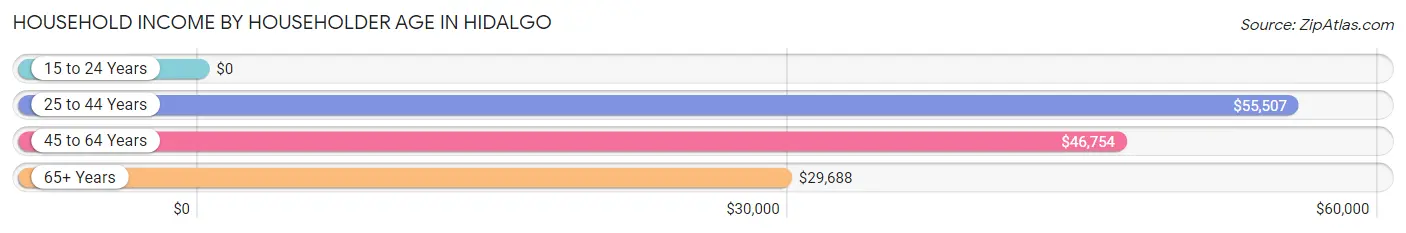
Household Income by Householder Age in Hidalgo
The median household income in Hidalgo is $45,919, with the highest median household income of $55,507 found in the 25 to 44 years age bracket for the primary householder. A total of 1,523 households (41.1%) fall into this category. Meanwhile, the 15 to 24 years age bracket for the primary householder has the lowest median household income of $0, with 30 households (0.8%) in this group.
| Income Bracket | # Households | Median Income |
| 15 to 24 Years | 30 (0.8%) | $0 |
| 25 to 44 Years | 1,523 (41.1%) | $55,507 |
| 45 to 64 Years | 1,454 (39.2%) | $46,754 |
| 65+ Years | 698 (18.8%) | $29,688 |
| Total | 3,705 (100.0%) | $45,919 |
Poverty in Hidalgo
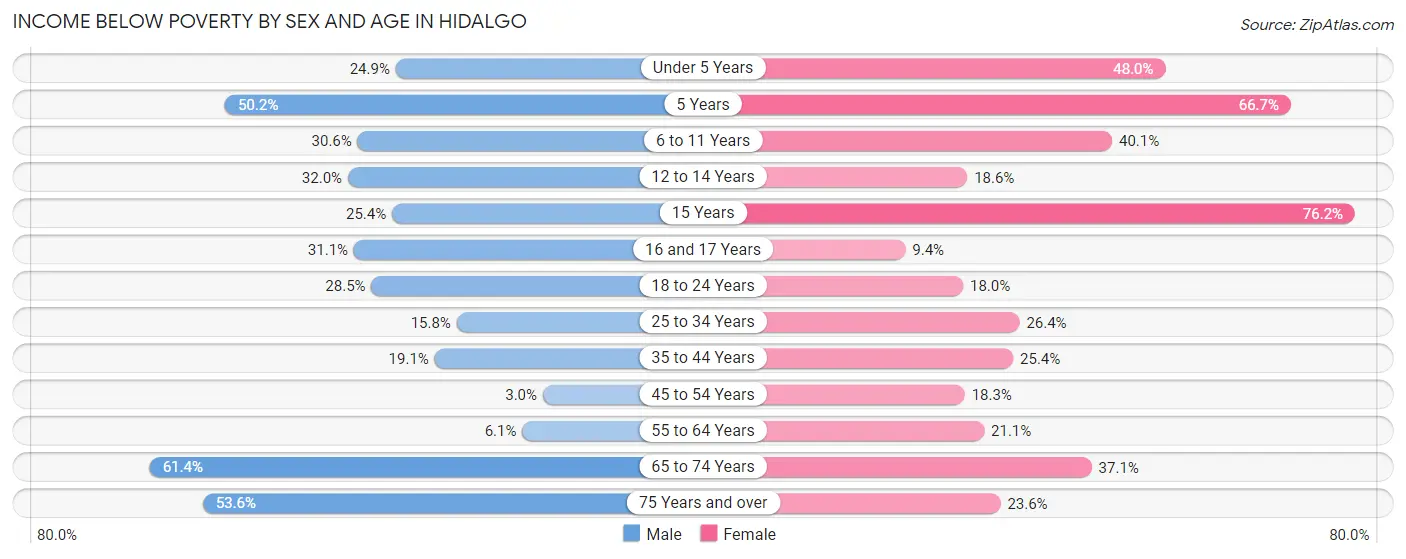
Income Below Poverty by Sex and Age in Hidalgo
With 27.1% poverty level for males and 26.8% for females among the residents of Hidalgo, 65 to 74 year old males and 15 year old females are the most vulnerable to poverty, with 363 males (61.4%) and 16 females (76.2%) in their respective age groups living below the poverty level.
| Age Bracket | Male | Female |
| Under 5 Years | 171 (24.9%) | 196 (48.0%) |
| 5 Years | 105 (50.2%) | 72 (66.7%) |
| 6 to 11 Years | 296 (30.5%) | 248 (40.1%) |
| 12 to 14 Years | 135 (32.0%) | 54 (18.6%) |
| 15 Years | 43 (25.4%) | 16 (76.2%) |
| 16 and 17 Years | 65 (31.1%) | 17 (9.4%) |
| 18 to 24 Years | 224 (28.5%) | 189 (18.0%) |
| 25 to 34 Years | 173 (15.8%) | 272 (26.4%) |
| 35 to 44 Years | 158 (19.1%) | 189 (25.4%) |
| 45 to 54 Years | 13 (3.0%) | 154 (18.2%) |
| 55 to 64 Years | 31 (6.1%) | 161 (21.1%) |
| 65 to 74 Years | 363 (61.4%) | 207 (37.1%) |
| 75 Years and over | 181 (53.5%) | 45 (23.6%) |
| Total | 1,958 (27.1%) | 1,820 (26.8%) |
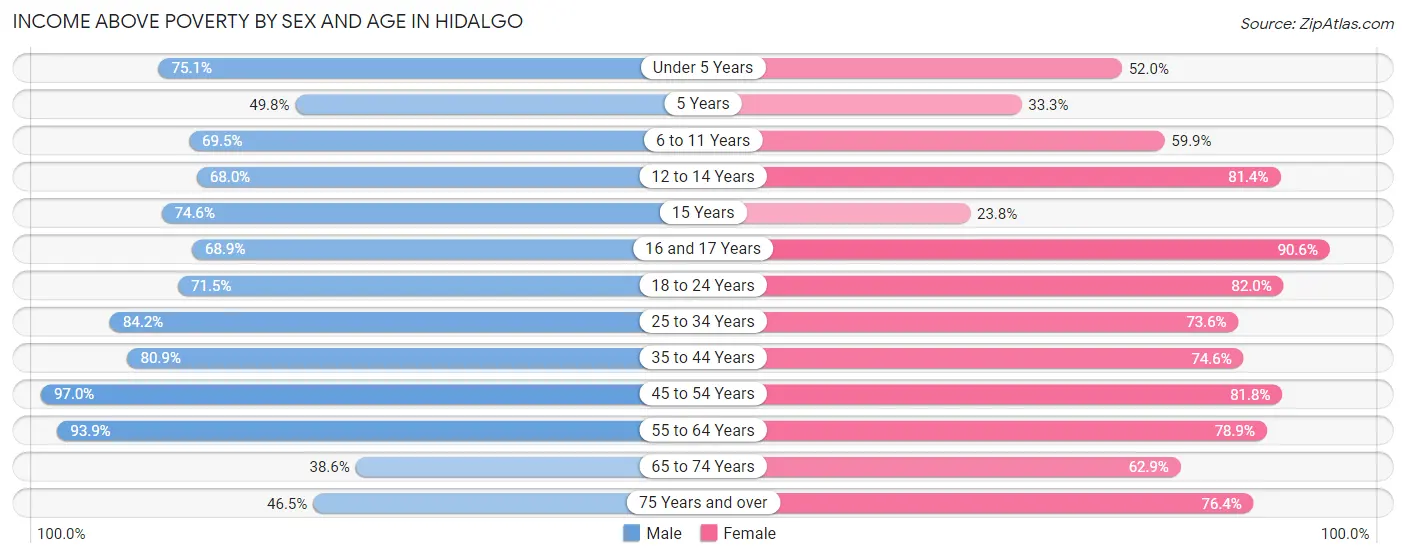
Income Above Poverty by Sex and Age in Hidalgo
According to the poverty statistics in Hidalgo, males aged 45 to 54 years and females aged 16 and 17 years are the age groups that are most secure financially, with 97.0% of males and 90.6% of females in these age groups living above the poverty line.
| Age Bracket | Male | Female |
| Under 5 Years | 516 (75.1%) | 212 (52.0%) |
| 5 Years | 104 (49.8%) | 36 (33.3%) |
| 6 to 11 Years | 673 (69.5%) | 370 (59.9%) |
| 12 to 14 Years | 287 (68.0%) | 236 (81.4%) |
| 15 Years | 126 (74.6%) | 5 (23.8%) |
| 16 and 17 Years | 144 (68.9%) | 163 (90.6%) |
| 18 to 24 Years | 562 (71.5%) | 861 (82.0%) |
| 25 to 34 Years | 919 (84.2%) | 759 (73.6%) |
| 35 to 44 Years | 669 (80.9%) | 554 (74.6%) |
| 45 to 54 Years | 414 (97.0%) | 690 (81.8%) |
| 55 to 64 Years | 477 (93.9%) | 601 (78.9%) |
| 65 to 74 Years | 228 (38.6%) | 351 (62.9%) |
| 75 Years and over | 157 (46.5%) | 146 (76.4%) |
| Total | 5,276 (72.9%) | 4,984 (73.3%) |
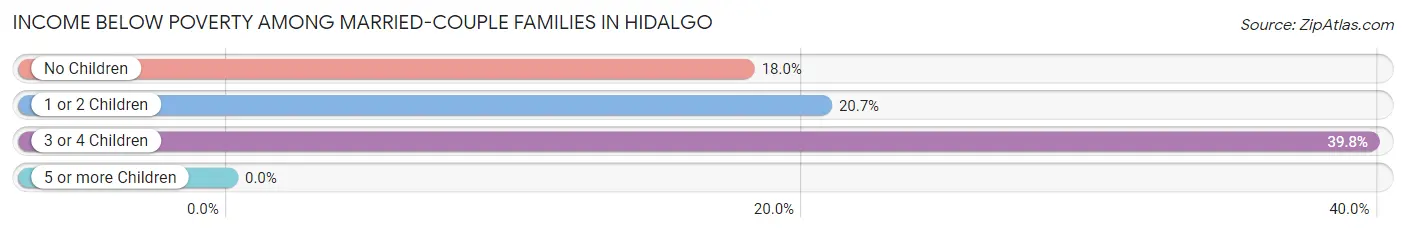
Income Below Poverty Among Married-Couple Families in Hidalgo
The poverty statistics for married-couple families in Hidalgo show that 22.5% or 455 of the total 2,019 families live below the poverty line. Families with 3 or 4 children have the highest poverty rate of 39.8%, comprising of 126 families. On the other hand, families with 5 or more children have the lowest poverty rate of 0.0%, which includes 0 families.
| Children | Above Poverty | Below Poverty |
| No Children | 556 (82.0%) | 122 (18.0%) |
| 1 or 2 Children | 794 (79.3%) | 207 (20.7%) |
| 3 or 4 Children | 191 (60.3%) | 126 (39.8%) |
| 5 or more Children | 23 (100.0%) | 0 (0.0%) |
| Total | 1,564 (77.5%) | 455 (22.5%) |
Income Below Poverty Among Single-Parent Households in Hidalgo
According to the poverty data in Hidalgo, 20.3% or 54 single-father households and 37.5% or 371 single-mother households are living below the poverty line. Among single-father households, those with no children have the highest poverty rate, with 31 households (33.0%) experiencing poverty. Likewise, among single-mother households, those with 5 or more children have the highest poverty rate, with 15 households (100.0%) falling below the poverty line.
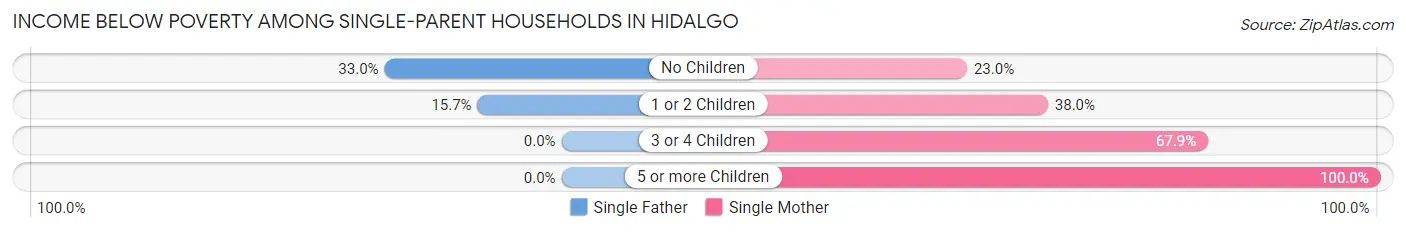
| Children | Single Father | Single Mother |
| No Children | 31 (33.0%) | 85 (23.0%) |
| 1 or 2 Children | 23 (15.7%) | 178 (38.0%) |
| 3 or 4 Children | 0 (0.0%) | 93 (67.9%) |
| 5 or more Children | 0 (0.0%) | 15 (100.0%) |
| Total | 54 (20.3%) | 371 (37.5%) |
Income Below Poverty Among Married-Couple vs Single-Parent Households in Hidalgo
The poverty data for Hidalgo shows that 455 of the married-couple family households (22.5%) and 425 of the single-parent households (33.8%) are living below the poverty level. Within the married-couple family households, those with 3 or 4 children have the highest poverty rate, with 126 households (39.8%) falling below the poverty line. Among the single-parent households, those with 5 or more children have the highest poverty rate, with 15 household (100.0%) living below poverty.
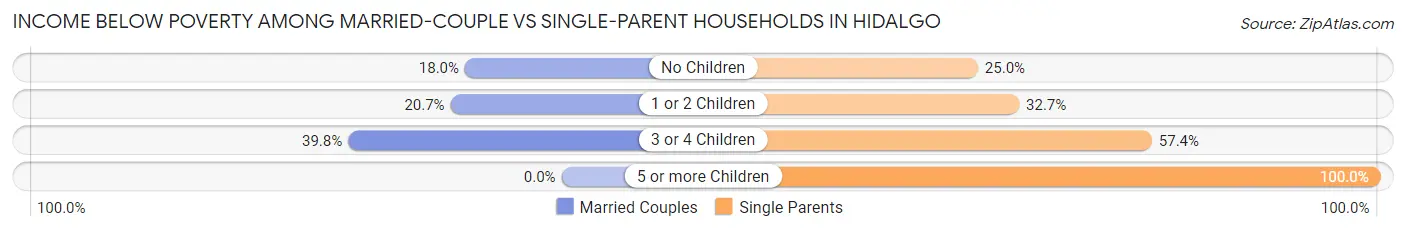
| Children | Married-Couple Families | Single-Parent Households |
| No Children | 122 (18.0%) | 116 (25.0%) |
| 1 or 2 Children | 207 (20.7%) | 201 (32.7%) |
| 3 or 4 Children | 126 (39.8%) | 93 (57.4%) |
| 5 or more Children | 0 (0.0%) | 15 (100.0%) |
| Total | 455 (22.5%) | 425 (33.8%) |
Race in Hidalgo
The most populous races in Hidalgo are Hispanic or Latino (13,970 | 99.3%), Some other Race (5,799 | 41.2%), and Two or more Races (4,355 | 30.9%).
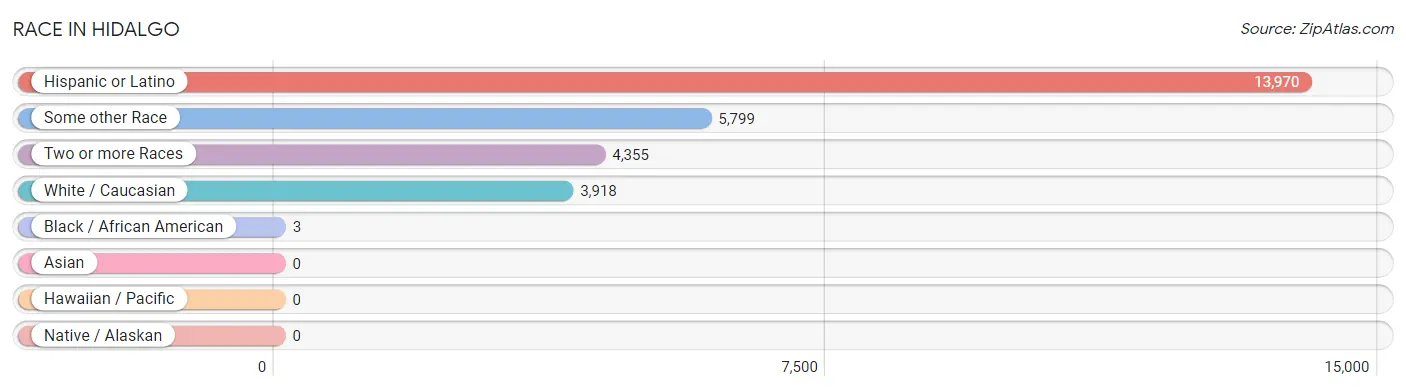
| Race | # Population | % Population |
| Asian | 0 | 0.0% |
| Black / African American | 3 | 0.0% |
| Hawaiian / Pacific | 0 | 0.0% |
| Hispanic or Latino | 13,970 | 99.3% |
| Native / Alaskan | 0 | 0.0% |
| White / Caucasian | 3,918 | 27.8% |
| Two or more Races | 4,355 | 30.9% |
| Some other Race | 5,799 | 41.2% |
| Total | 14,075 | 100.0% |
Ancestry in Hidalgo
The most populous ancestries reported in Hidalgo are Mexican (13,271 | 94.3%), Central American (399 | 2.8%), Honduran (335 | 2.4%), American (115 | 0.8%), and Italian (79 | 0.6%), together accounting for 100.9% of all Hidalgo residents.
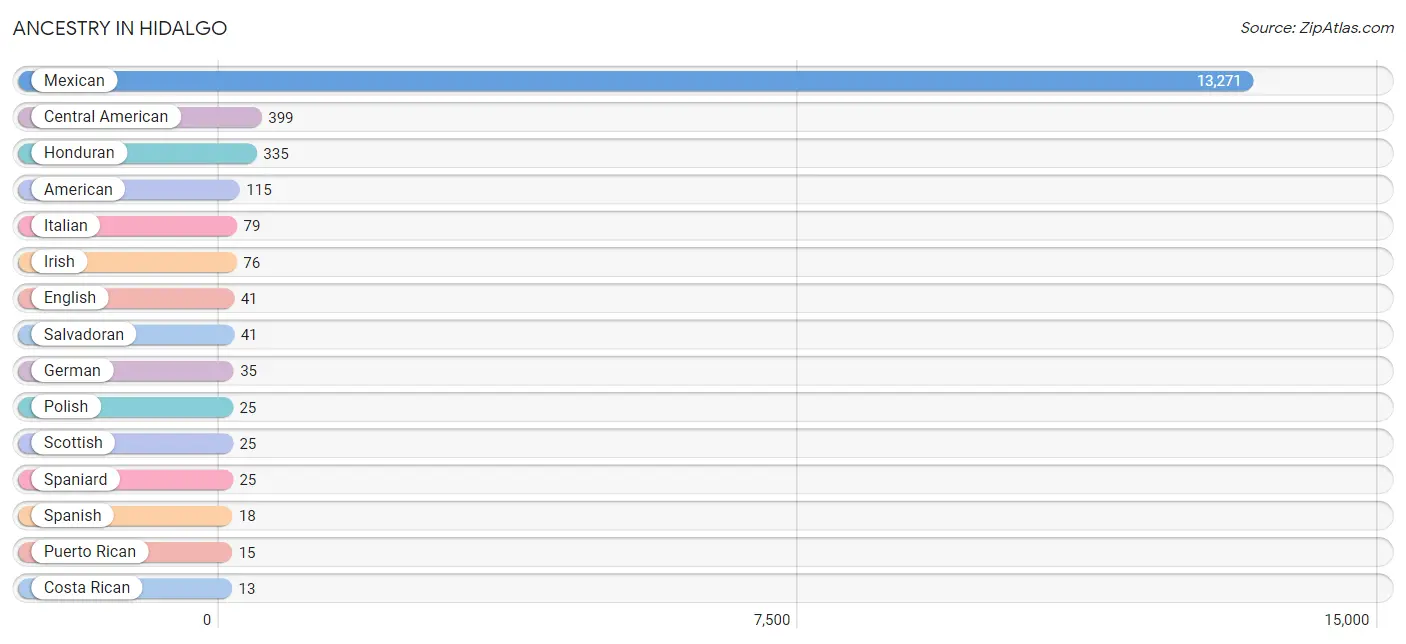
| Ancestry | # Population | % Population |
| American | 115 | 0.8% |
| Central American | 399 | 2.8% |
| Costa Rican | 13 | 0.1% |
| Ecuadorian | 7 | 0.1% |
| English | 41 | 0.3% |
| French | 8 | 0.1% |
| German | 35 | 0.3% |
| Honduran | 335 | 2.4% |
| Irish | 76 | 0.5% |
| Italian | 79 | 0.6% |
| Mexican | 13,271 | 94.3% |
| Nicaraguan | 10 | 0.1% |
| Polish | 25 | 0.2% |
| Puerto Rican | 15 | 0.1% |
| Salvadoran | 41 | 0.3% |
| Scottish | 25 | 0.2% |
| South American | 7 | 0.1% |
| Spaniard | 25 | 0.2% |
| Spanish | 18 | 0.1% | View All 19 Rows |
Immigrants in Hidalgo
The most numerous immigrant groups reported in Hidalgo came from Latin America (5,364 | 38.1%), Central America (5,357 | 38.1%), Mexico (4,956 | 35.2%), Honduras (270 | 1.9%), and El Salvador (108 | 0.8%), together accounting for 114.1% of all Hidalgo residents.
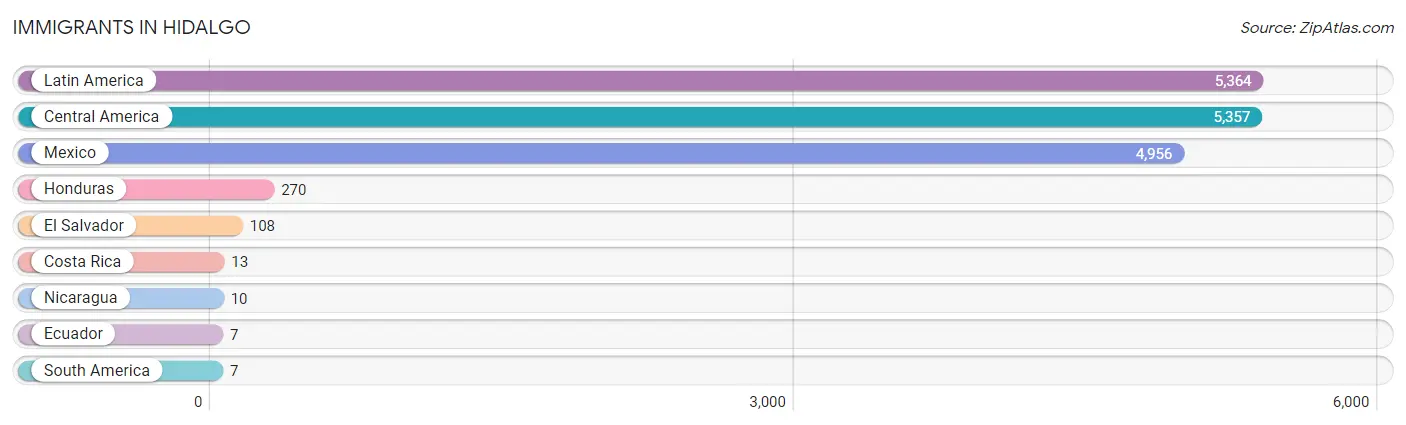
| Immigration Origin | # Population | % Population |
| Central America | 5,357 | 38.1% |
| Costa Rica | 13 | 0.1% |
| Ecuador | 7 | 0.1% |
| El Salvador | 108 | 0.8% |
| Honduras | 270 | 1.9% |
| Latin America | 5,364 | 38.1% |
| Mexico | 4,956 | 35.2% |
| Nicaragua | 10 | 0.1% |
| South America | 7 | 0.1% | View All 9 Rows |
Sex and Age in Hidalgo
Sex and Age in Hidalgo
The most populous age groups in Hidalgo are 5 to 9 Years (971 | 13.4%) for men and 20 to 24 Years (697 | 10.2%) for women.
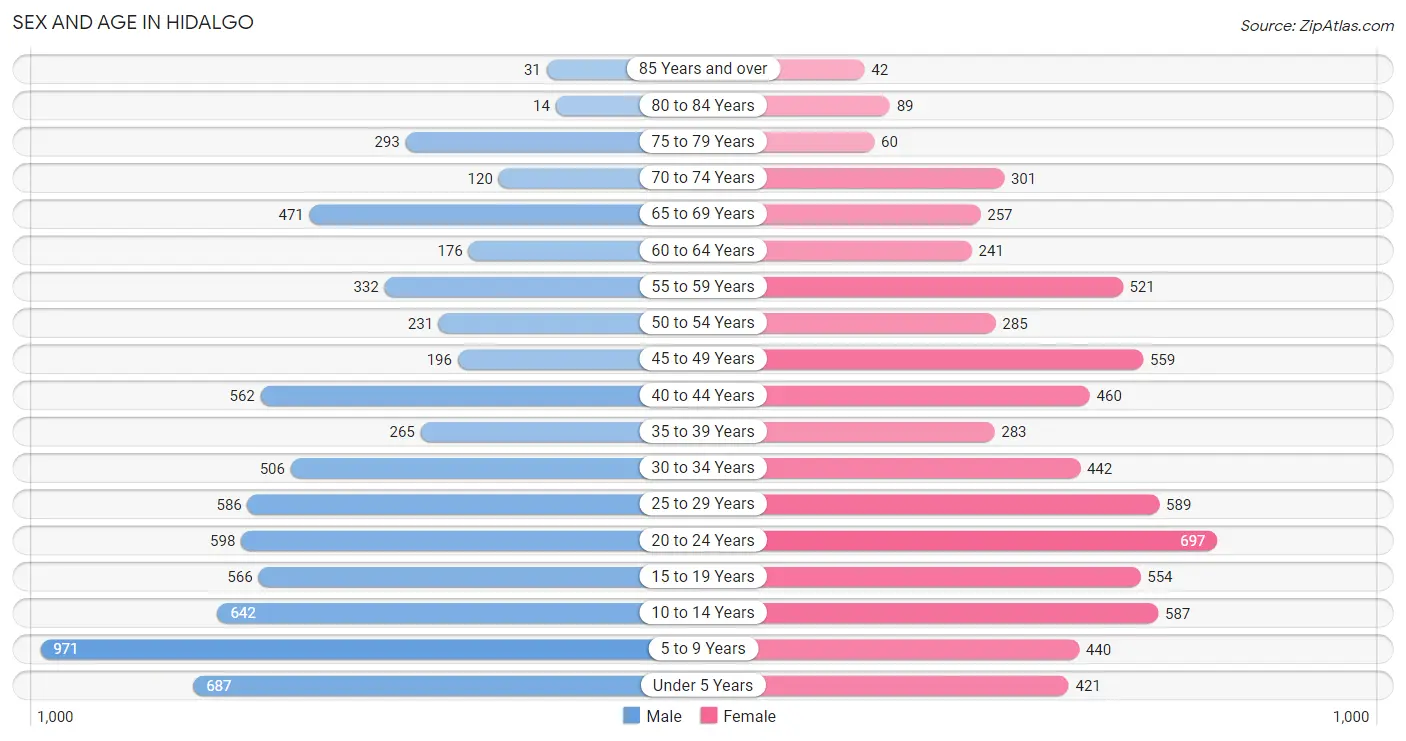
| Age Bracket | Male | Female |
| Under 5 Years | 687 (9.5%) | 421 (6.2%) |
| 5 to 9 Years | 971 (13.4%) | 440 (6.4%) |
| 10 to 14 Years | 642 (8.9%) | 587 (8.6%) |
| 15 to 19 Years | 566 (7.8%) | 554 (8.1%) |
| 20 to 24 Years | 598 (8.3%) | 697 (10.2%) |
| 25 to 29 Years | 586 (8.1%) | 589 (8.6%) |
| 30 to 34 Years | 506 (7.0%) | 442 (6.5%) |
| 35 to 39 Years | 265 (3.7%) | 283 (4.1%) |
| 40 to 44 Years | 562 (7.7%) | 460 (6.7%) |
| 45 to 49 Years | 196 (2.7%) | 559 (8.2%) |
| 50 to 54 Years | 231 (3.2%) | 285 (4.2%) |
| 55 to 59 Years | 332 (4.6%) | 521 (7.6%) |
| 60 to 64 Years | 176 (2.4%) | 241 (3.5%) |
| 65 to 69 Years | 471 (6.5%) | 257 (3.8%) |
| 70 to 74 Years | 120 (1.7%) | 301 (4.4%) |
| 75 to 79 Years | 293 (4.0%) | 60 (0.9%) |
| 80 to 84 Years | 14 (0.2%) | 89 (1.3%) |
| 85 Years and over | 31 (0.4%) | 42 (0.6%) |
| Total | 7,247 (100.0%) | 6,828 (100.0%) |
Families and Households in Hidalgo
Median Family Size in Hidalgo
The median family size in Hidalgo is 4.10 persons per family, with married-couple families (2,019 | 61.7%) accounting for the largest median family size of 4.38 persons per family. On the other hand, single female/mother families (990 | 30.2%) represent the smallest median family size with 3.57 persons per family.
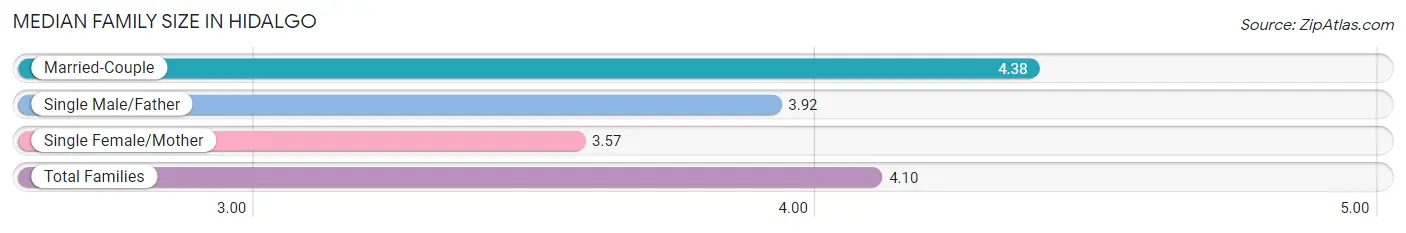
| Family Type | # Families | Family Size |
| Married-Couple | 2,019 (61.7%) | 4.38 |
| Single Male/Father | 266 (8.1%) | 3.92 |
| Single Female/Mother | 990 (30.2%) | 3.57 |
| Total Families | 3,275 (100.0%) | 4.10 |
Median Household Size in Hidalgo
The median household size in Hidalgo is 3.80 persons per household, with married-couple households (2,019 | 54.5%) accounting for the largest median household size of 4.38 persons per household. non-family households (430 | 11.6%) represent the smallest median household size with 1.14 persons per household.
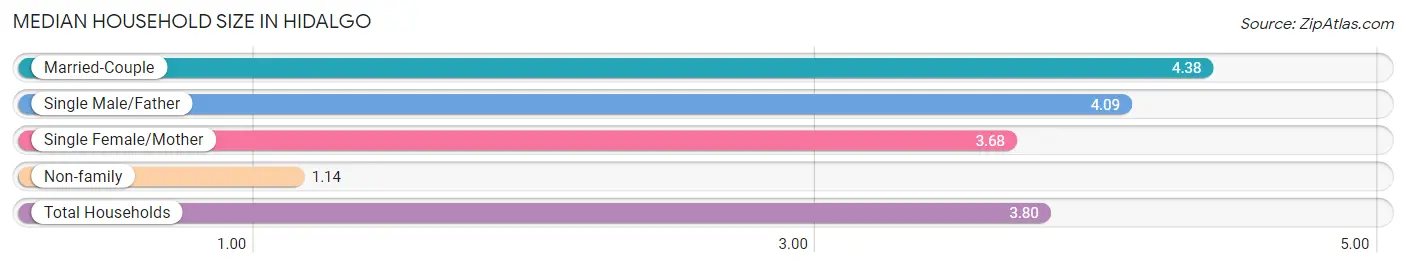
| Household Type | # Households | Household Size |
| Married-Couple | 2,019 (54.5%) | 4.38 |
| Single Male/Father | 266 (7.2%) | 4.09 |
| Single Female/Mother | 990 (26.7%) | 3.68 |
| Non-family | 430 (11.6%) | 1.14 |
| Total Households | 3,705 (100.0%) | 3.80 |
Household Size by Marriage Status in Hidalgo
Out of a total of 3,705 households in Hidalgo, 3,275 (88.4%) are family households, while 430 (11.6%) are nonfamily households. The most numerous type of family households are 3-person households, comprising 732, and the most common type of nonfamily households are 1-person households, comprising 385.
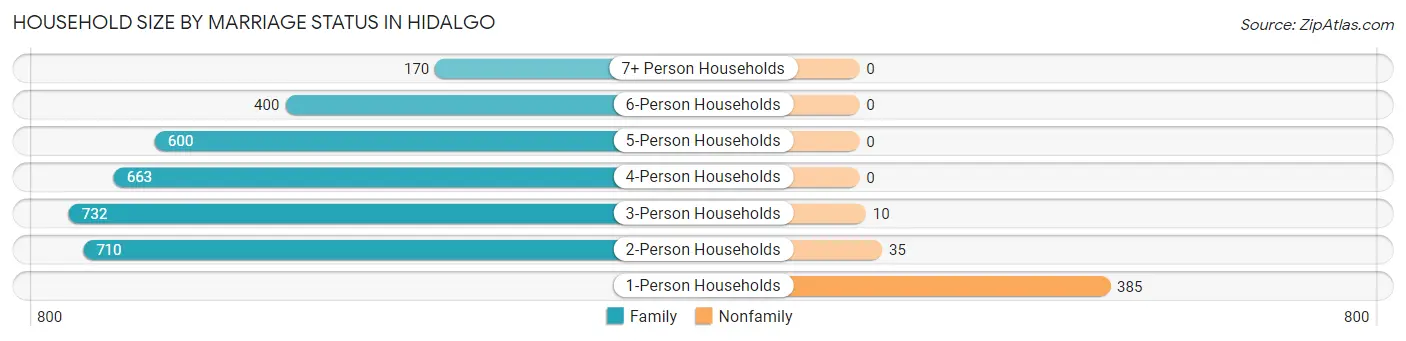
| Household Size | Family Households | Nonfamily Households |
| 1-Person Households | - | 385 (10.4%) |
| 2-Person Households | 710 (19.2%) | 35 (0.9%) |
| 3-Person Households | 732 (19.8%) | 10 (0.3%) |
| 4-Person Households | 663 (17.9%) | 0 (0.0%) |
| 5-Person Households | 600 (16.2%) | 0 (0.0%) |
| 6-Person Households | 400 (10.8%) | 0 (0.0%) |
| 7+ Person Households | 170 (4.6%) | 0 (0.0%) |
| Total | 3,275 (88.4%) | 430 (11.6%) |
Female Fertility in Hidalgo
Fertility by Age in Hidalgo
Average fertility rate in Hidalgo is 13.0 births per 1,000 women. Women in the age bracket of 20 to 34 years have the highest fertility rate with 19.0 births per 1,000 women. Women in the age bracket of 20 to 34 years acount for 68.1% of all women with births.
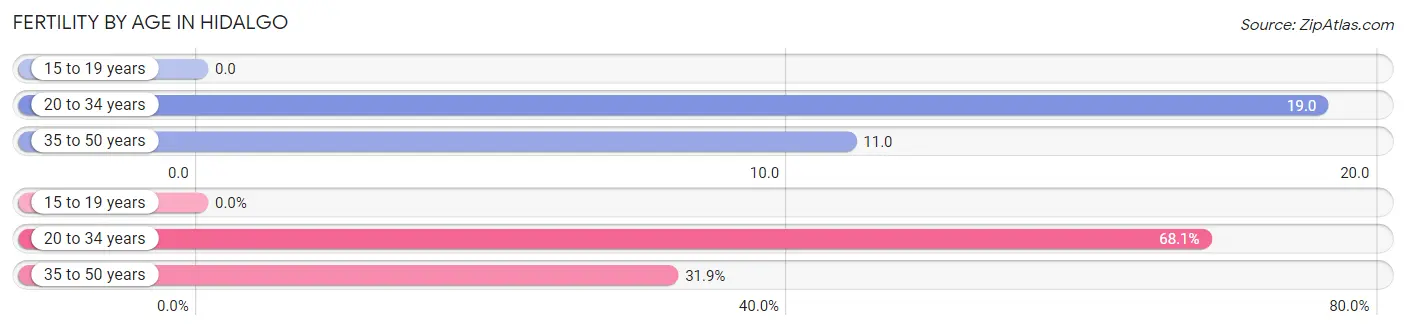
| Age Bracket | Women with Births | Births / 1,000 Women |
| 15 to 19 years | 0 (0.0%) | 0.0 |
| 20 to 34 years | 32 (68.1%) | 19.0 |
| 35 to 50 years | 15 (31.9%) | 11.0 |
| Total | 47 (100.0%) | 13.0 |
Fertility by Age by Marriage Status in Hidalgo
68.1% of women with births (47) in Hidalgo are married. The highest percentage of unmarried women with births falls into 35 to 50 years age bracket with 100.0% of them unmarried at the time of birth, while the lowest percentage of unmarried women with births belong to 20 to 34 years age bracket with 0.0% of them unmarried.
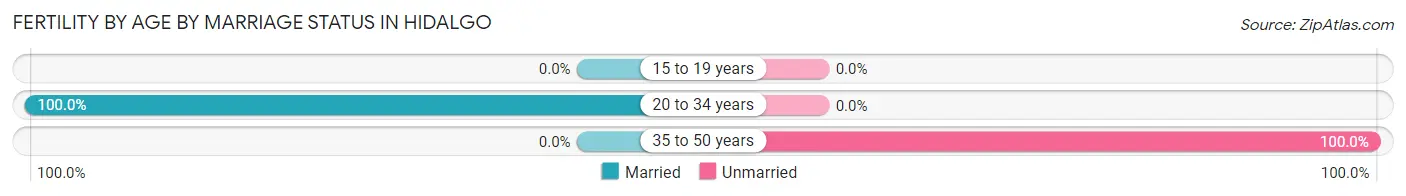
| Age Bracket | Married | Unmarried |
| 15 to 19 years | 0 (0.0%) | 0 (0.0%) |
| 20 to 34 years | 32 (100.0%) | 0 (0.0%) |
| 35 to 50 years | 0 (0.0%) | 15 (100.0%) |
| Total | 32 (68.1%) | 15 (31.9%) |
Fertility by Education in Hidalgo
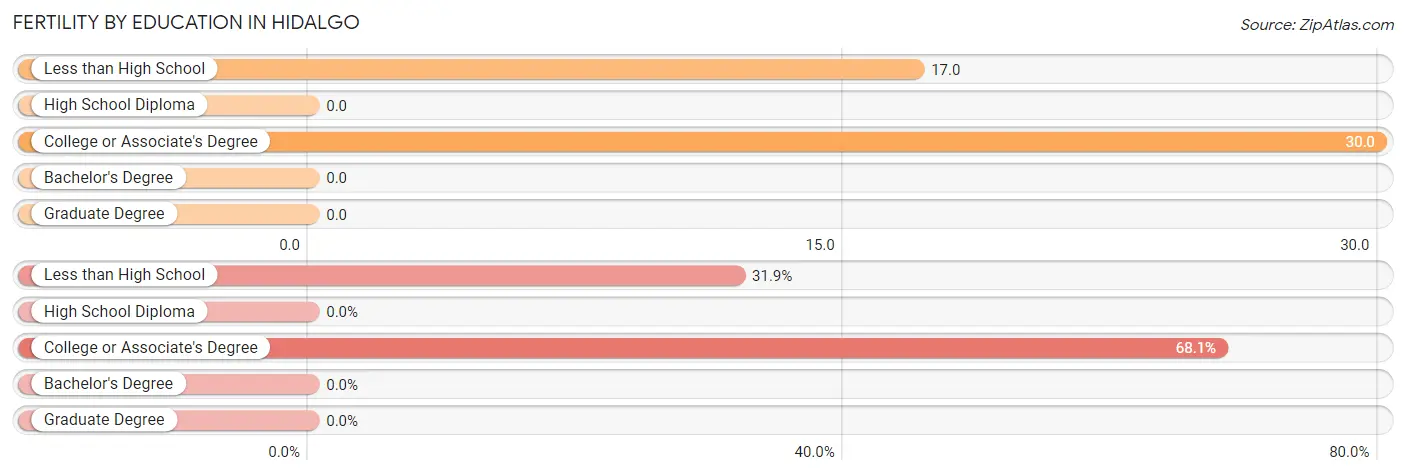
| Educational Attainment | Women with Births | Births / 1,000 Women |
| Less than High School | 15 (31.9%) | 17.0 |
| High School Diploma | 0 (0.0%) | 0.0 |
| College or Associate's Degree | 32 (68.1%) | 30.0 |
| Bachelor's Degree | 0 (0.0%) | 0.0 |
| Graduate Degree | 0 (0.0%) | 0.0 |
| Total | 47 (100.0%) | 13.0 |
Fertility by Education by Marriage Status in Hidalgo
31.9% of women with births in Hidalgo are unmarried. Women with the educational attainment of college or associate's degree are most likely to be married with 100.0% of them married at childbirth, while women with the educational attainment of less than high school are least likely to be married with 100.0% of them unmarried at childbirth.
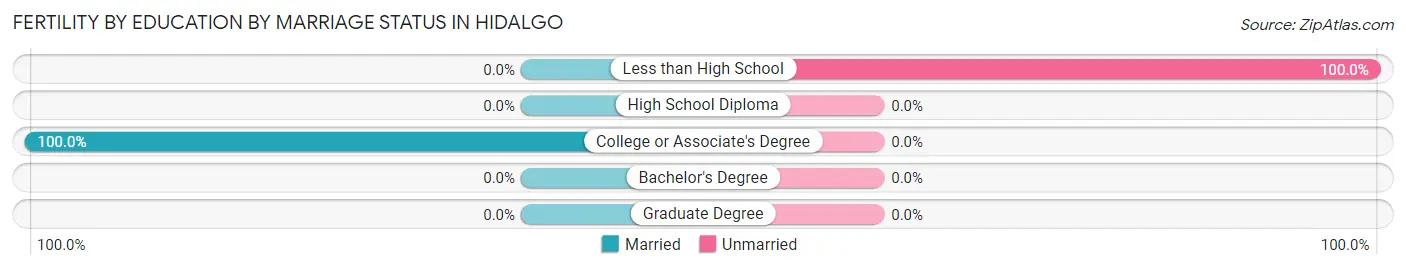
| Educational Attainment | Married | Unmarried |
| Less than High School | 0 (0.0%) | 15 (100.0%) |
| High School Diploma | 0 (0.0%) | 0 (0.0%) |
| College or Associate's Degree | 32 (100.0%) | 0 (0.0%) |
| Bachelor's Degree | 0 (0.0%) | 0 (0.0%) |
| Graduate Degree | 0 (0.0%) | 0 (0.0%) |
| Total | 32 (68.1%) | 15 (31.9%) |
Employment Characteristics in Hidalgo
Employment by Class of Employer in Hidalgo
Among the 6,014 employed individuals in Hidalgo, private company employees (3,845 | 63.9%), state government employees (776 | 12.9%), and self-employed (not incorporated) (646 | 10.7%) make up the most common classes of employment.
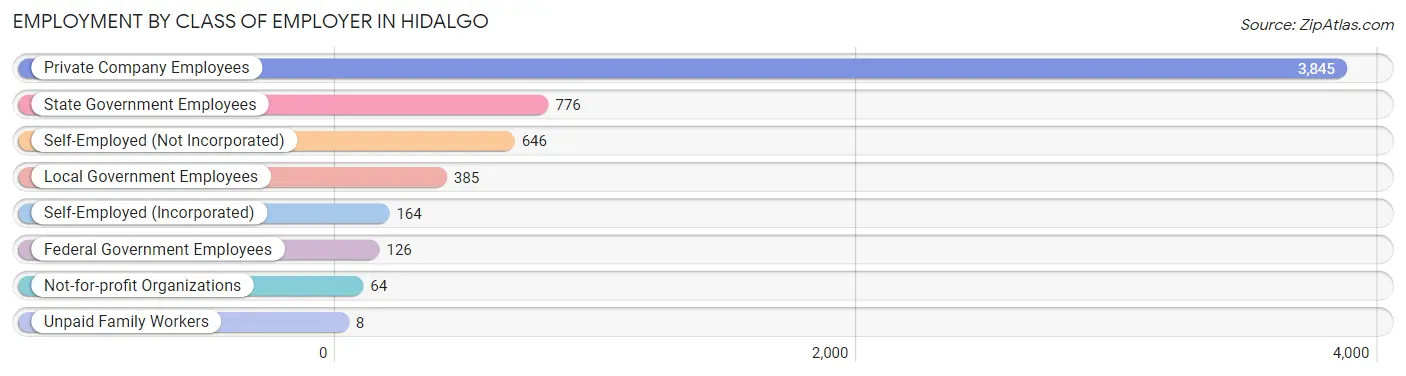
| Employer Class | # Employees | % Employees |
| Private Company Employees | 3,845 | 63.9% |
| Self-Employed (Incorporated) | 164 | 2.7% |
| Self-Employed (Not Incorporated) | 646 | 10.7% |
| Not-for-profit Organizations | 64 | 1.1% |
| Local Government Employees | 385 | 6.4% |
| State Government Employees | 776 | 12.9% |
| Federal Government Employees | 126 | 2.1% |
| Unpaid Family Workers | 8 | 0.1% |
| Total | 6,014 | 100.0% |
Employment Status by Age in Hidalgo
According to the labor force statistics for Hidalgo, out of the total population over 16 years of age (10,137), 65.1% or 6,599 individuals are in the labor force, with 7.8% or 515 of them unemployed. The age group with the highest labor force participation rate is 25 to 29 years, with 86.0% or 1,010 individuals in the labor force. Within the labor force, the 16 to 19 years age range has the highest percentage of unemployed individuals, with 26.9% or 59 of them being unemployed.
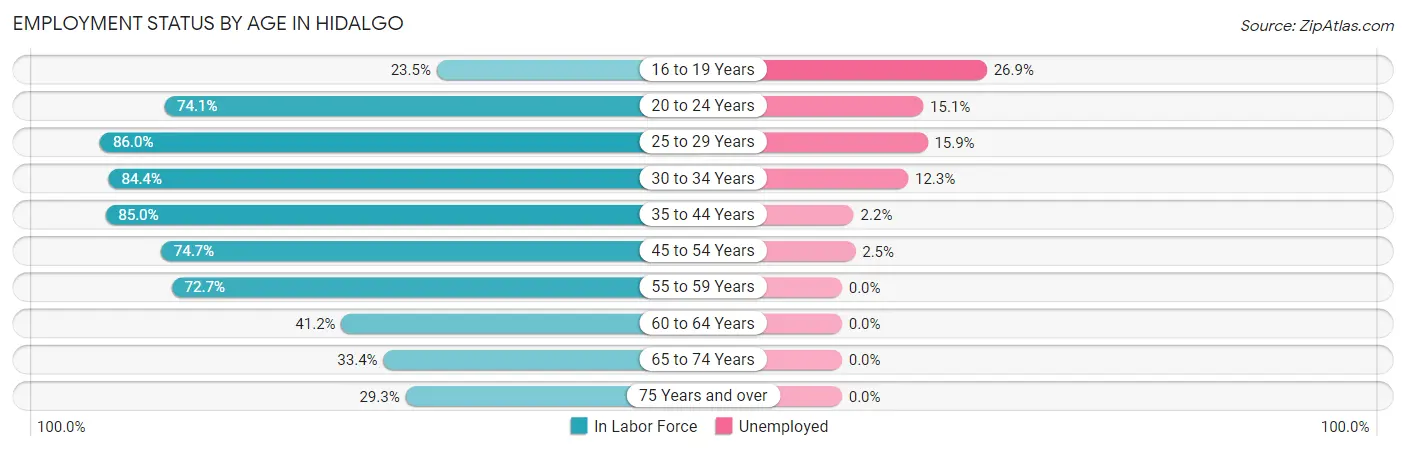
| Age Bracket | In Labor Force | Unemployed |
| 16 to 19 Years | 219 (23.5%) | 59 (26.9%) |
| 20 to 24 Years | 960 (74.1%) | 145 (15.1%) |
| 25 to 29 Years | 1,010 (86.0%) | 161 (15.9%) |
| 30 to 34 Years | 800 (84.4%) | 98 (12.3%) |
| 35 to 44 Years | 1,334 (85.0%) | 29 (2.2%) |
| 45 to 54 Years | 949 (74.7%) | 24 (2.5%) |
| 55 to 59 Years | 620 (72.7%) | 0 (0.0%) |
| 60 to 64 Years | 172 (41.2%) | 0 (0.0%) |
| 65 to 74 Years | 384 (33.4%) | 0 (0.0%) |
| 75 Years and over | 155 (29.3%) | 0 (0.0%) |
| Total | 6,599 (65.1%) | 515 (7.8%) |
Employment Status by Educational Attainment in Hidalgo
According to labor force statistics for Hidalgo, 78.4% of individuals (4,887) out of the total population between 25 and 64 years of age (6,234) are in the labor force, with 6.4% or 313 of them being unemployed. The group with the highest labor force participation rate are those with the educational attainment of college / associate degree, with 86.9% or 1,569 individuals in the labor force. Within the labor force, individuals with high school diploma education have the highest percentage of unemployment, with 8.9% or 109 of them being unemployed.
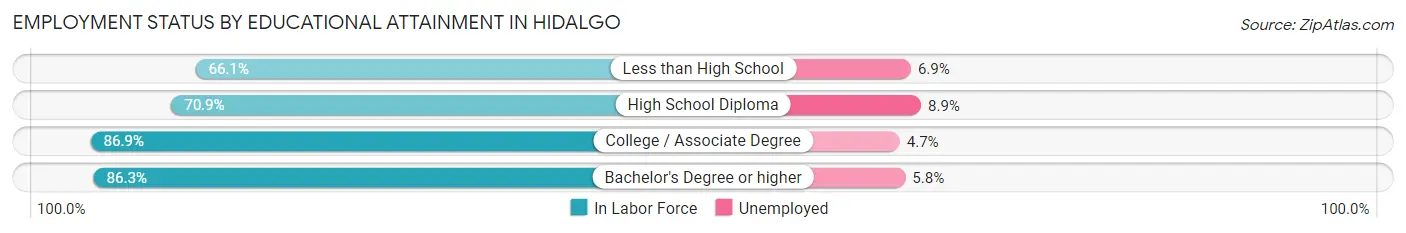
| Educational Attainment | In Labor Force | Unemployed |
| Less than High School | 778 (66.1%) | 81 (6.9%) |
| High School Diploma | 1,222 (70.9%) | 153 (8.9%) |
| College / Associate Degree | 1,569 (86.9%) | 85 (4.7%) |
| Bachelor's Degree or higher | 1,319 (86.3%) | 89 (5.8%) |
| Total | 4,887 (78.4%) | 399 (6.4%) |
Employment Occupations by Sex in Hidalgo
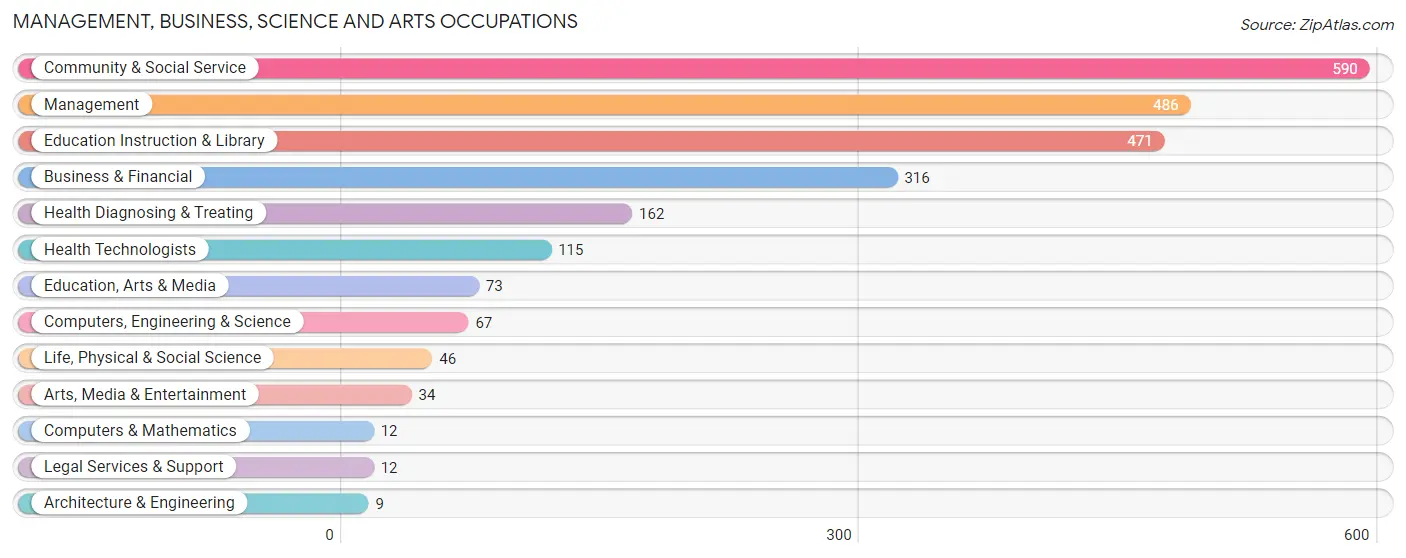
Management, Business, Science and Arts Occupations
The most common Management, Business, Science and Arts occupations in Hidalgo are Community & Social Service (590 | 9.7%), Management (486 | 8.0%), Education Instruction & Library (471 | 7.7%), Business & Financial (316 | 5.2%), and Health Diagnosing & Treating (162 | 2.7%).
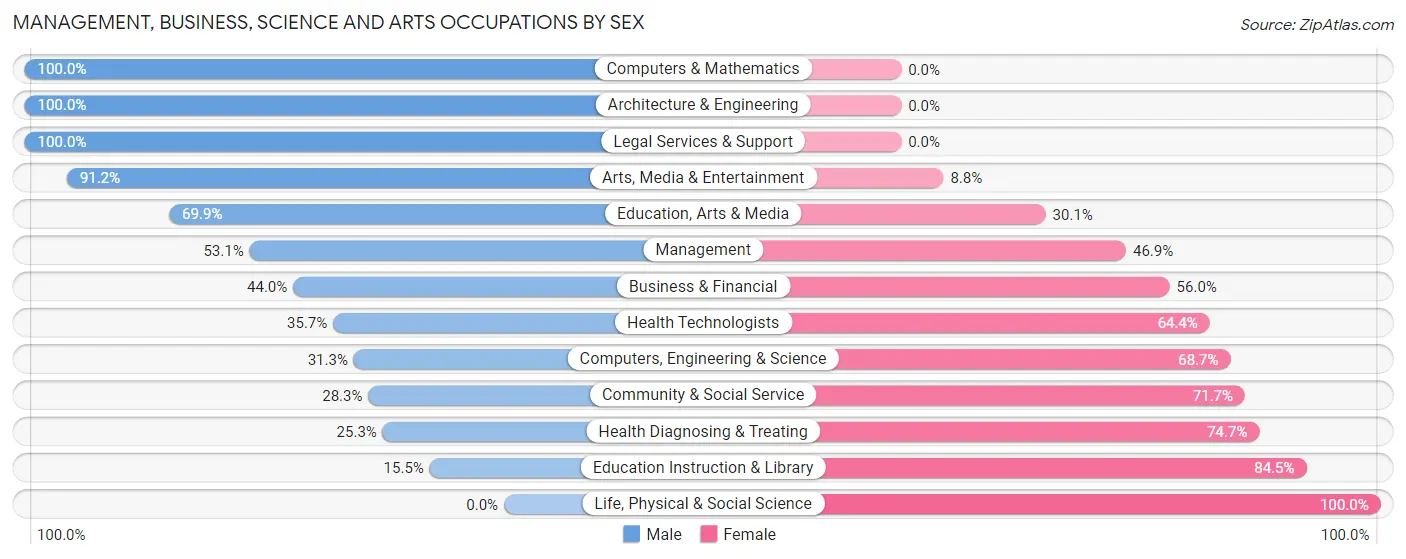
Management, Business, Science and Arts Occupations by Sex
Within the Management, Business, Science and Arts occupations in Hidalgo, the most male-oriented occupations are Computers & Mathematics (100.0%), Architecture & Engineering (100.0%), and Legal Services & Support (100.0%), while the most female-oriented occupations are Life, Physical & Social Science (100.0%), Education Instruction & Library (84.5%), and Health Diagnosing & Treating (74.7%).
| Occupation | Male | Female |
| Management | 258 (53.1%) | 228 (46.9%) |
| Business & Financial | 139 (44.0%) | 177 (56.0%) |
| Computers, Engineering & Science | 21 (31.3%) | 46 (68.7%) |
| Computers & Mathematics | 12 (100.0%) | 0 (0.0%) |
| Architecture & Engineering | 9 (100.0%) | 0 (0.0%) |
| Life, Physical & Social Science | 0 (0.0%) | 46 (100.0%) |
| Community & Social Service | 167 (28.3%) | 423 (71.7%) |
| Education, Arts & Media | 51 (69.9%) | 22 (30.1%) |
| Legal Services & Support | 12 (100.0%) | 0 (0.0%) |
| Education Instruction & Library | 73 (15.5%) | 398 (84.5%) |
| Arts, Media & Entertainment | 31 (91.2%) | 3 (8.8%) |
| Health Diagnosing & Treating | 41 (25.3%) | 121 (74.7%) |
| Health Technologists | 41 (35.6%) | 74 (64.3%) |
| Total (Category) | 626 (38.6%) | 995 (61.4%) |
| Total (Overall) | 3,578 (58.8%) | 2,510 (41.2%) |
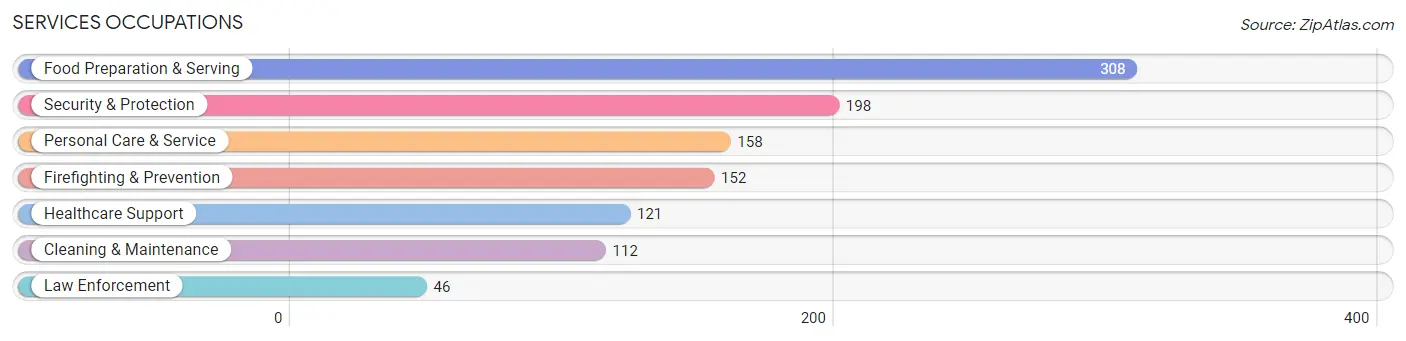
Services Occupations
The most common Services occupations in Hidalgo are Food Preparation & Serving (308 | 5.1%), Security & Protection (198 | 3.3%), Personal Care & Service (158 | 2.6%), Firefighting & Prevention (152 | 2.5%), and Healthcare Support (121 | 2.0%).
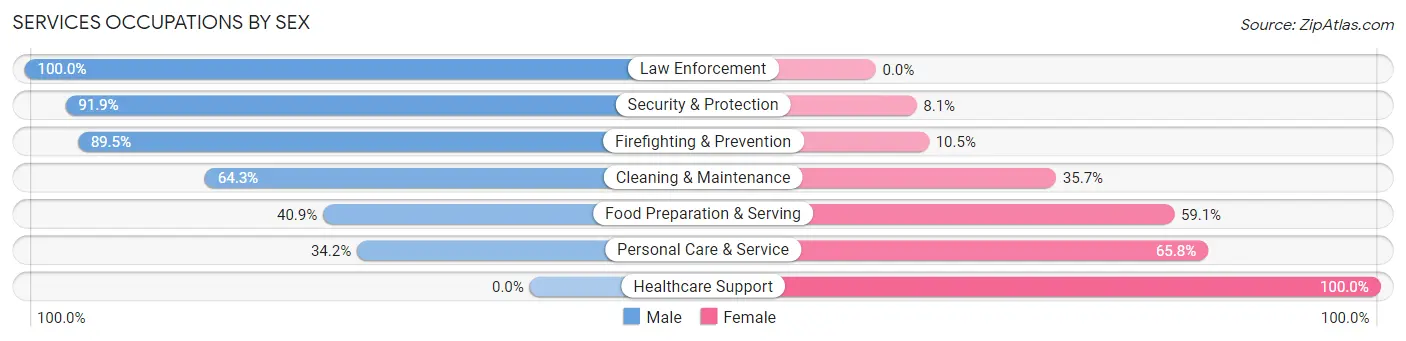
Services Occupations by Sex
Within the Services occupations in Hidalgo, the most male-oriented occupations are Law Enforcement (100.0%), Security & Protection (91.9%), and Firefighting & Prevention (89.5%), while the most female-oriented occupations are Healthcare Support (100.0%), Personal Care & Service (65.8%), and Food Preparation & Serving (59.1%).
| Occupation | Male | Female |
| Healthcare Support | 0 (0.0%) | 121 (100.0%) |
| Security & Protection | 182 (91.9%) | 16 (8.1%) |
| Firefighting & Prevention | 136 (89.5%) | 16 (10.5%) |
| Law Enforcement | 46 (100.0%) | 0 (0.0%) |
| Food Preparation & Serving | 126 (40.9%) | 182 (59.1%) |
| Cleaning & Maintenance | 72 (64.3%) | 40 (35.7%) |
| Personal Care & Service | 54 (34.2%) | 104 (65.8%) |
| Total (Category) | 434 (48.4%) | 463 (51.6%) |
| Total (Overall) | 3,578 (58.8%) | 2,510 (41.2%) |
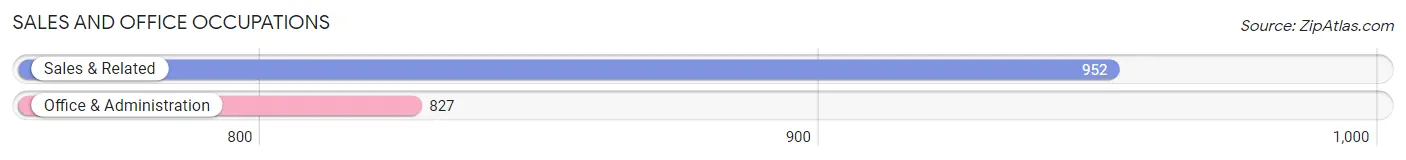
Sales and Office Occupations
The most common Sales and Office occupations in Hidalgo are Sales & Related (952 | 15.6%), and Office & Administration (827 | 13.6%).
Sales and Office Occupations by Sex
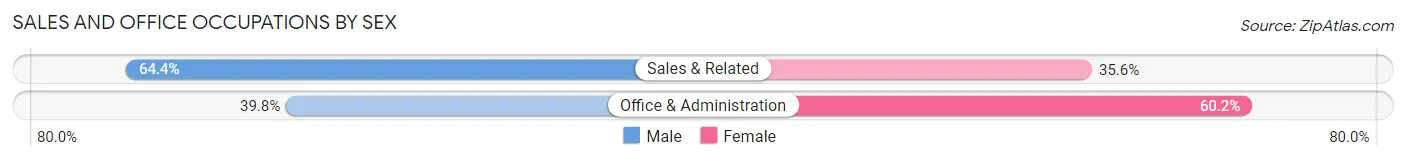
| Occupation | Male | Female |
| Sales & Related | 613 (64.4%) | 339 (35.6%) |
| Office & Administration | 329 (39.8%) | 498 (60.2%) |
| Total (Category) | 942 (52.9%) | 837 (47.0%) |
| Total (Overall) | 3,578 (58.8%) | 2,510 (41.2%) |
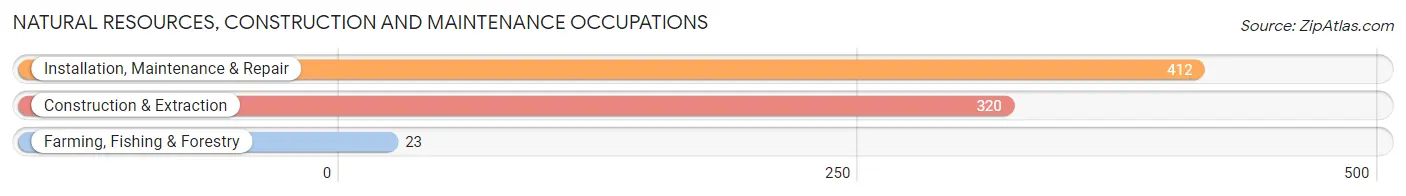
Natural Resources, Construction and Maintenance Occupations
The most common Natural Resources, Construction and Maintenance occupations in Hidalgo are Installation, Maintenance & Repair (412 | 6.8%), Construction & Extraction (320 | 5.3%), and Farming, Fishing & Forestry (23 | 0.4%).
Natural Resources, Construction and Maintenance Occupations by Sex
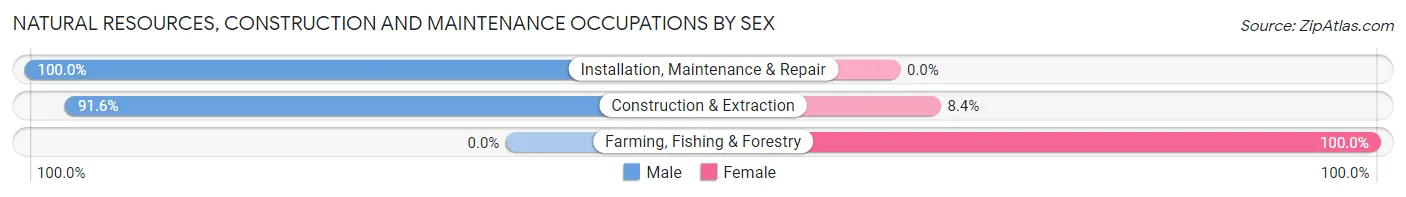
| Occupation | Male | Female |
| Farming, Fishing & Forestry | 0 (0.0%) | 23 (100.0%) |
| Construction & Extraction | 293 (91.6%) | 27 (8.4%) |
| Installation, Maintenance & Repair | 412 (100.0%) | 0 (0.0%) |
| Total (Category) | 705 (93.4%) | 50 (6.6%) |
| Total (Overall) | 3,578 (58.8%) | 2,510 (41.2%) |
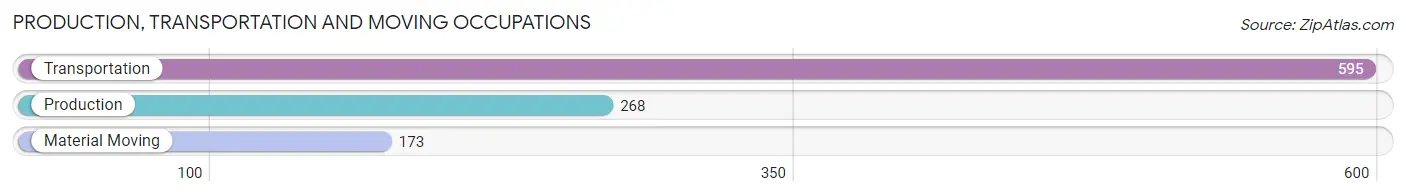
Production, Transportation and Moving Occupations
The most common Production, Transportation and Moving occupations in Hidalgo are Transportation (595 | 9.8%), Production (268 | 4.4%), and Material Moving (173 | 2.8%).
Production, Transportation and Moving Occupations by Sex
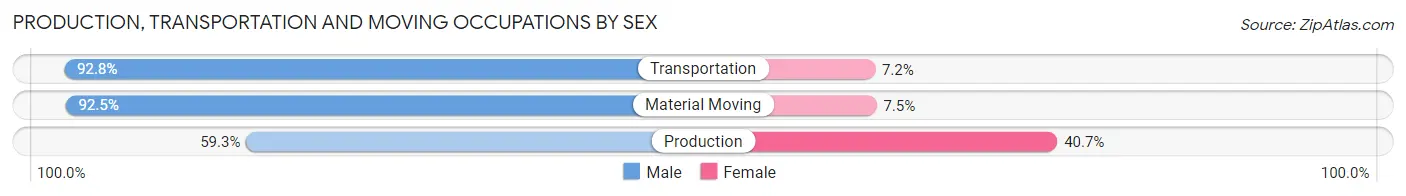
| Occupation | Male | Female |
| Production | 159 (59.3%) | 109 (40.7%) |
| Transportation | 552 (92.8%) | 43 (7.2%) |
| Material Moving | 160 (92.5%) | 13 (7.5%) |
| Total (Category) | 871 (84.1%) | 165 (15.9%) |
| Total (Overall) | 3,578 (58.8%) | 2,510 (41.2%) |
Employment Industries by Sex in Hidalgo
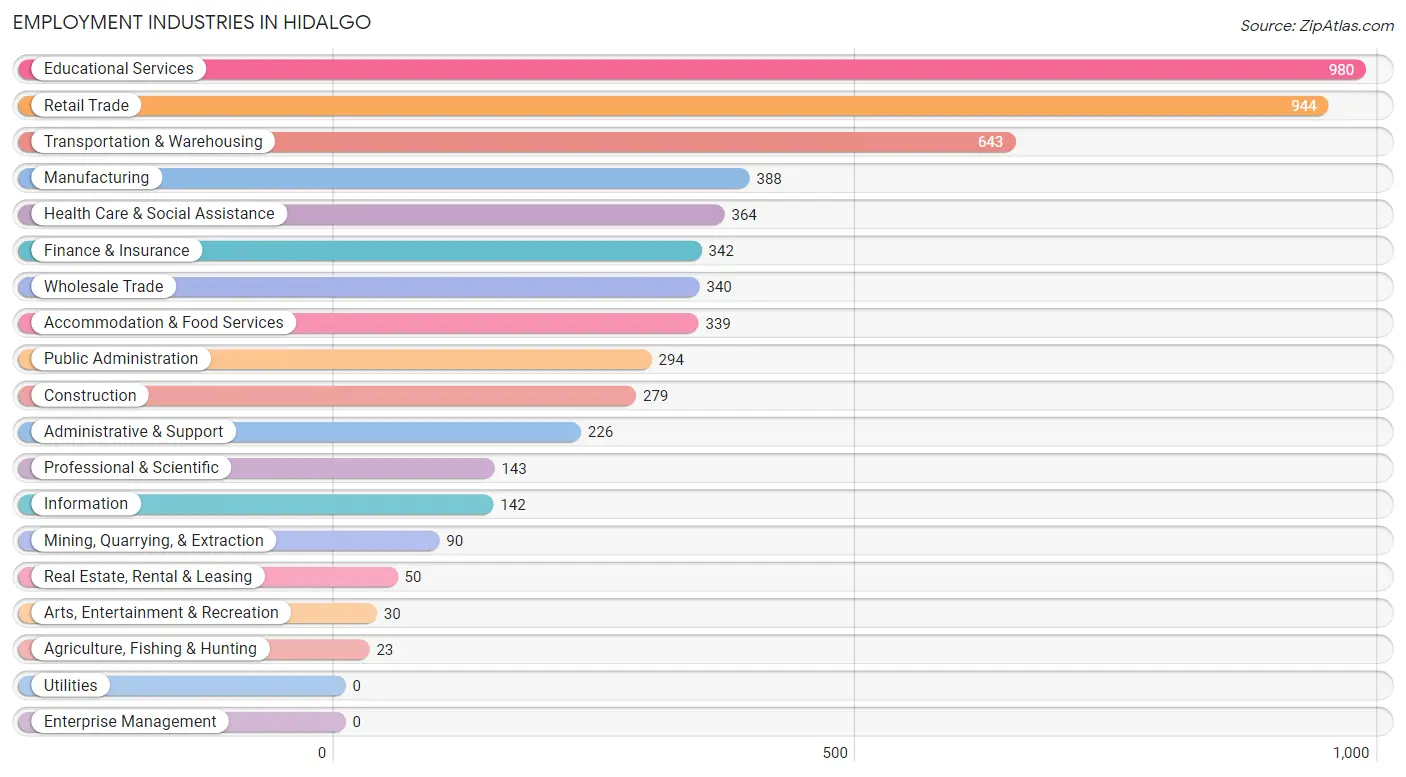
Employment Industries in Hidalgo
The major employment industries in Hidalgo include Educational Services (980 | 16.1%), Retail Trade (944 | 15.5%), Transportation & Warehousing (643 | 10.6%), Manufacturing (388 | 6.4%), and Health Care & Social Assistance (364 | 6.0%).
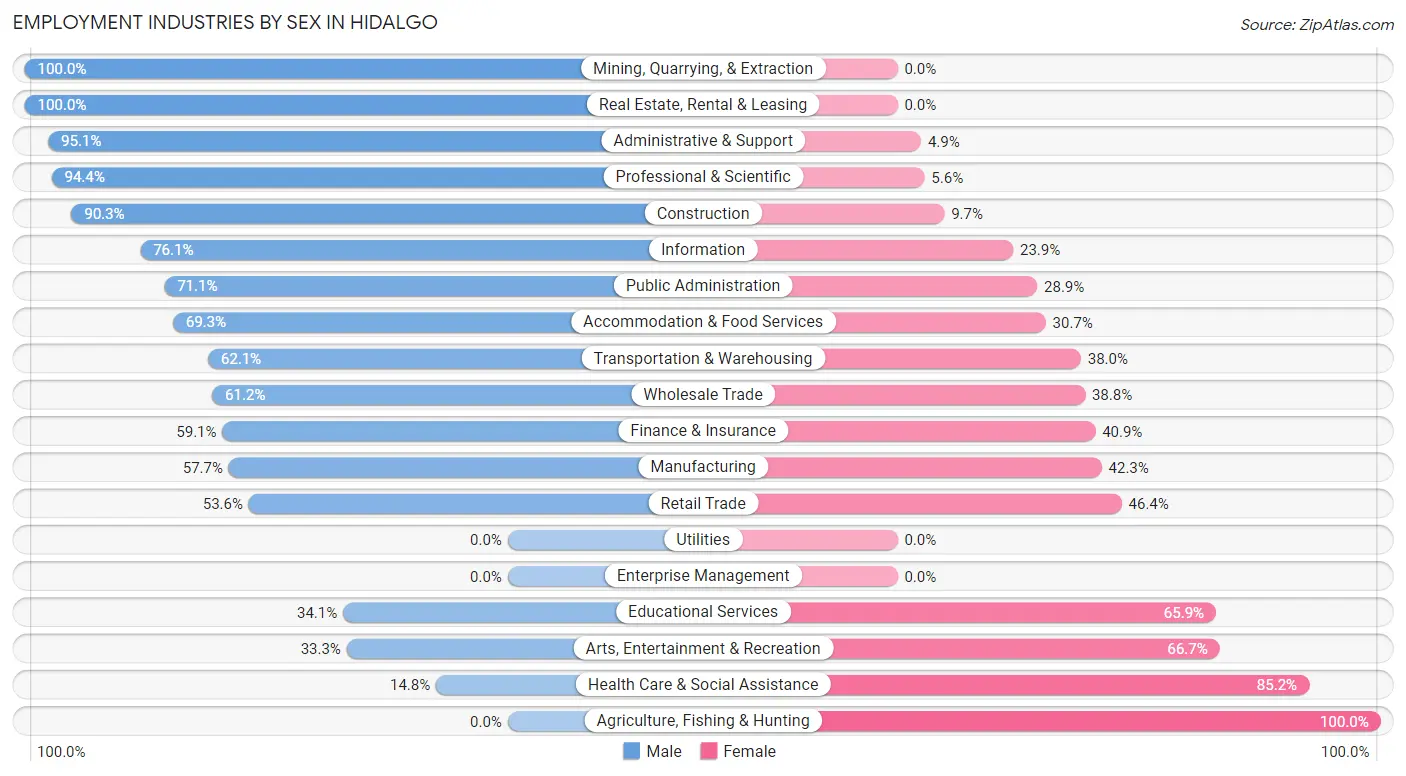
Employment Industries by Sex in Hidalgo
The Hidalgo industries that see more men than women are Mining, Quarrying, & Extraction (100.0%), Real Estate, Rental & Leasing (100.0%), and Administrative & Support (95.1%), whereas the industries that tend to have a higher number of women are Agriculture, Fishing & Hunting (100.0%), Health Care & Social Assistance (85.2%), and Arts, Entertainment & Recreation (66.7%).
| Industry | Male | Female |
| Agriculture, Fishing & Hunting | 0 (0.0%) | 23 (100.0%) |
| Mining, Quarrying, & Extraction | 90 (100.0%) | 0 (0.0%) |
| Construction | 252 (90.3%) | 27 (9.7%) |
| Manufacturing | 224 (57.7%) | 164 (42.3%) |
| Wholesale Trade | 208 (61.2%) | 132 (38.8%) |
| Retail Trade | 506 (53.6%) | 438 (46.4%) |
| Transportation & Warehousing | 399 (62.1%) | 244 (38.0%) |
| Utilities | 0 (0.0%) | 0 (0.0%) |
| Information | 108 (76.1%) | 34 (23.9%) |
| Finance & Insurance | 202 (59.1%) | 140 (40.9%) |
| Real Estate, Rental & Leasing | 50 (100.0%) | 0 (0.0%) |
| Professional & Scientific | 135 (94.4%) | 8 (5.6%) |
| Enterprise Management | 0 (0.0%) | 0 (0.0%) |
| Administrative & Support | 215 (95.1%) | 11 (4.9%) |
| Educational Services | 334 (34.1%) | 646 (65.9%) |
| Health Care & Social Assistance | 54 (14.8%) | 310 (85.2%) |
| Arts, Entertainment & Recreation | 10 (33.3%) | 20 (66.7%) |
| Accommodation & Food Services | 235 (69.3%) | 104 (30.7%) |
| Public Administration | 209 (71.1%) | 85 (28.9%) |
| Total | 3,578 (58.8%) | 2,510 (41.2%) |
Education in Hidalgo
School Enrollment in Hidalgo
The most common levels of schooling among the 4,610 students in Hidalgo are elementary school (1,126 | 24.4%), middle school (1,030 | 22.3%), and high school (749 | 16.3%).
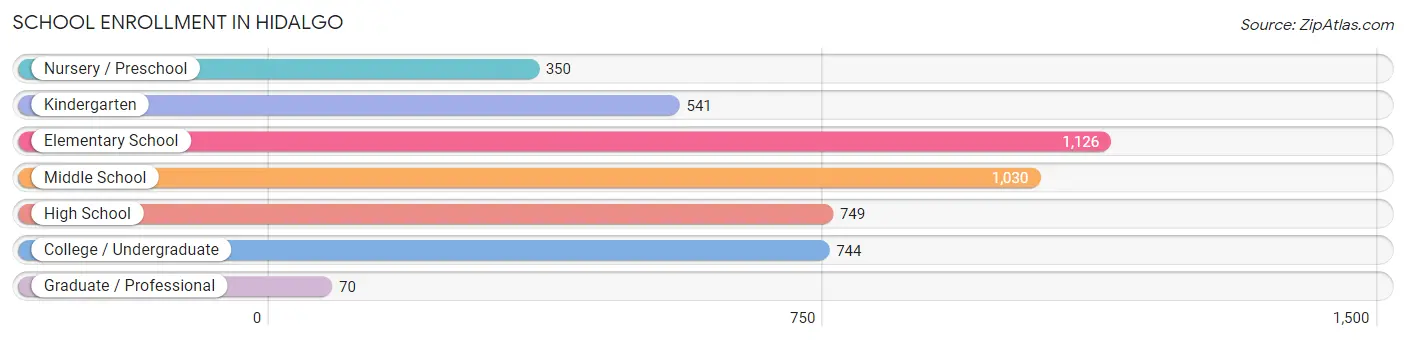
| School Level | # Students | % Students |
| Nursery / Preschool | 350 | 7.6% |
| Kindergarten | 541 | 11.7% |
| Elementary School | 1,126 | 24.4% |
| Middle School | 1,030 | 22.3% |
| High School | 749 | 16.3% |
| College / Undergraduate | 744 | 16.1% |
| Graduate / Professional | 70 | 1.5% |
| Total | 4,610 | 100.0% |
School Enrollment by Age by Funding Source in Hidalgo
Out of a total of 4,610 students who are enrolled in schools in Hidalgo, 138 (3.0%) attend a private institution, while the remaining 4,472 (97.0%) are enrolled in public schools. The age group of 35 years and over has the highest likelihood of being enrolled in private schools, with 16 (100.0% in the age bracket) enrolled. Conversely, the age group of 5 to 9 year old has the lowest likelihood of being enrolled in a private school, with 1,375 (100.0% in the age bracket) attending a public institution.
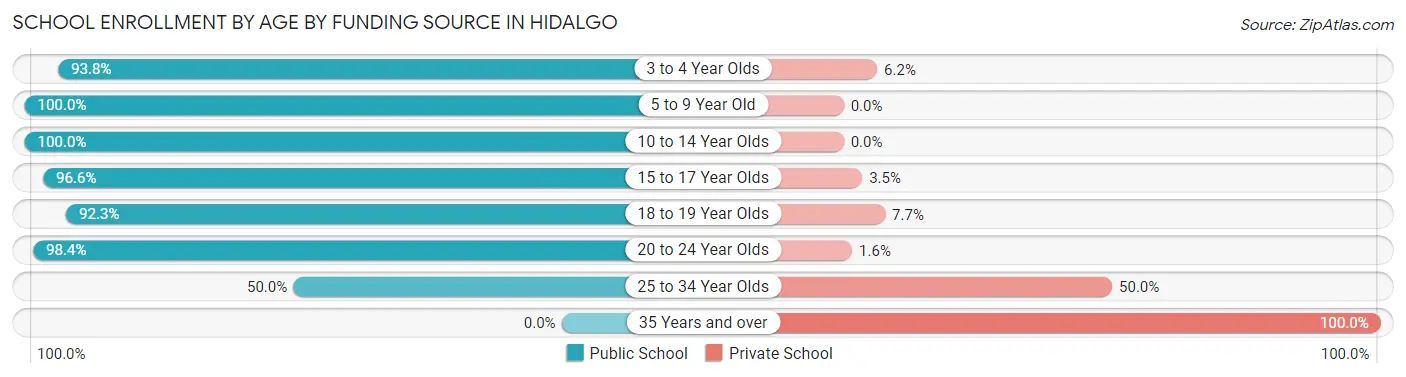
| Age Bracket | Public School | Private School |
| 3 to 4 Year Olds | 421 (93.8%) | 28 (6.2%) |
| 5 to 9 Year Old | 1,375 (100.0%) | 0 (0.0%) |
| 10 to 14 Year Olds | 1,229 (100.0%) | 0 (0.0%) |
| 15 to 17 Year Olds | 559 (96.6%) | 20 (3.5%) |
| 18 to 19 Year Olds | 418 (92.3%) | 35 (7.7%) |
| 20 to 24 Year Olds | 436 (98.4%) | 7 (1.6%) |
| 25 to 34 Year Olds | 33 (50.0%) | 33 (50.0%) |
| 35 Years and over | 0 (0.0%) | 16 (100.0%) |
| Total | 4,472 (97.0%) | 138 (3.0%) |
Educational Attainment by Field of Study in Hidalgo
Business (624 | 36.3%), education (236 | 13.7%), engineering (193 | 11.2%), psychology (98 | 5.7%), and social sciences (95 | 5.5%) are the most common fields of study among 1,721 individuals in Hidalgo who have obtained a bachelor's degree or higher.
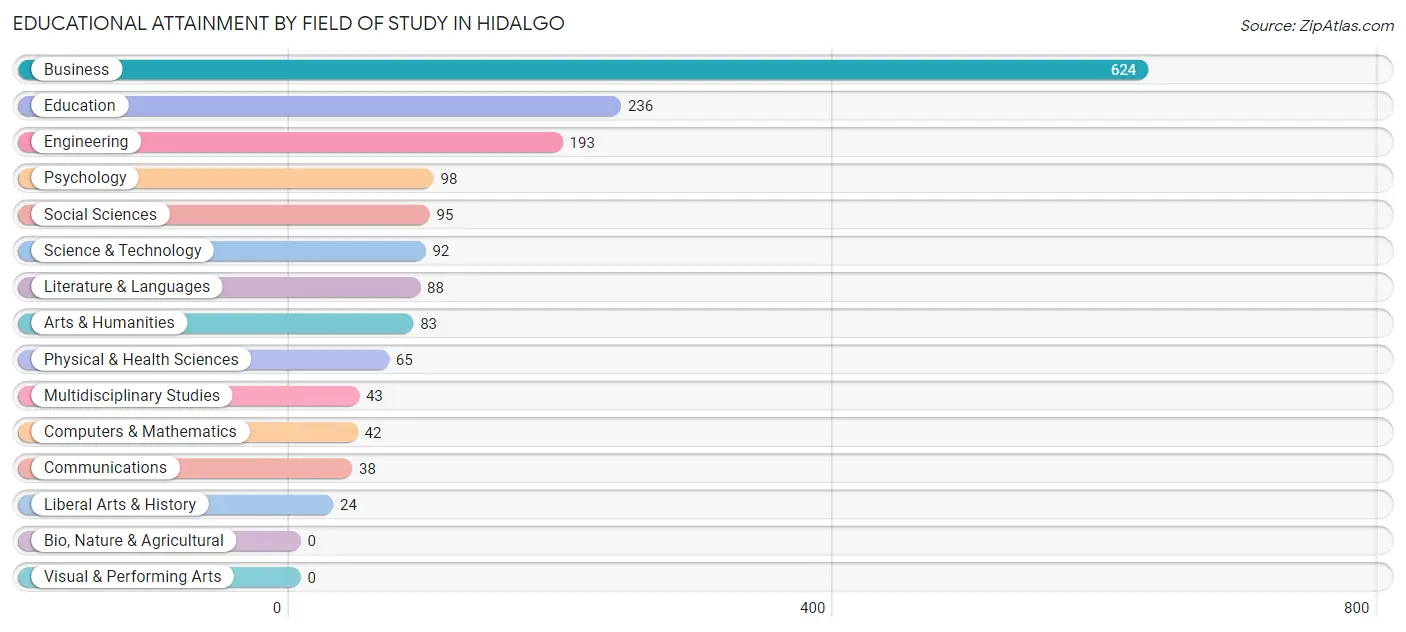
| Field of Study | # Graduates | % Graduates |
| Computers & Mathematics | 42 | 2.4% |
| Bio, Nature & Agricultural | 0 | 0.0% |
| Physical & Health Sciences | 65 | 3.8% |
| Psychology | 98 | 5.7% |
| Social Sciences | 95 | 5.5% |
| Engineering | 193 | 11.2% |
| Multidisciplinary Studies | 43 | 2.5% |
| Science & Technology | 92 | 5.3% |
| Business | 624 | 36.3% |
| Education | 236 | 13.7% |
| Literature & Languages | 88 | 5.1% |
| Liberal Arts & History | 24 | 1.4% |
| Visual & Performing Arts | 0 | 0.0% |
| Communications | 38 | 2.2% |
| Arts & Humanities | 83 | 4.8% |
| Total | 1,721 | 100.0% |
Transportation & Commute in Hidalgo
Vehicle Availability by Sex in Hidalgo
The most prevalent vehicle ownership categories in Hidalgo are males with 2 vehicles (1,297, accounting for 37.0%) and females with 2 vehicles (766, making up 51.8%).
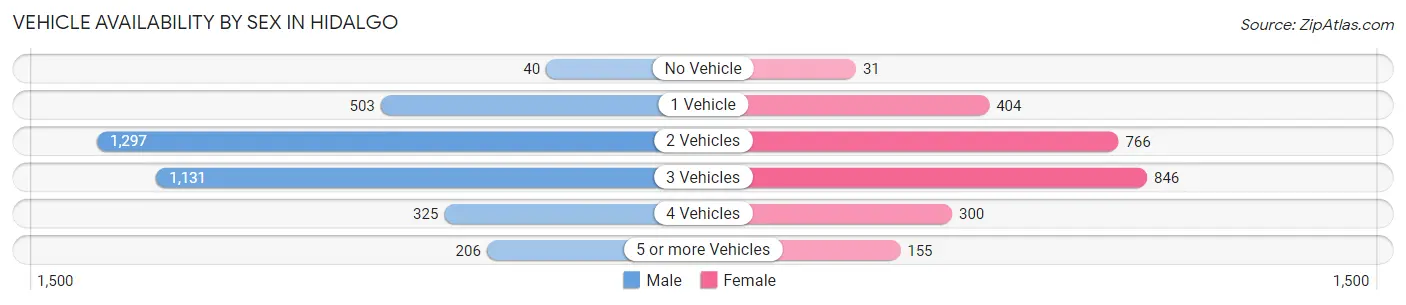
| Vehicles Available | Male | Female |
| No Vehicle | 40 (1.1%) | 31 (1.2%) |
| 1 Vehicle | 503 (14.4%) | 404 (16.2%) |
| 2 Vehicles | 1,297 (37.0%) | 766 (30.6%) |
| 3 Vehicles | 1,131 (32.3%) | 846 (33.8%) |
| 4 Vehicles | 325 (9.3%) | 300 (12.0%) |
| 5 or more Vehicles | 206 (5.9%) | 155 (6.2%) |
| Total | 3,502 (100.0%) | 2,502 (100.0%) |
Commute Time in Hidalgo
The most frequently occuring commute durations in Hidalgo are 10 to 14 minutes (1,194 commuters, 21.1%), 15 to 19 minutes (1,008 commuters, 17.8%), and 20 to 24 minutes (932 commuters, 16.5%).
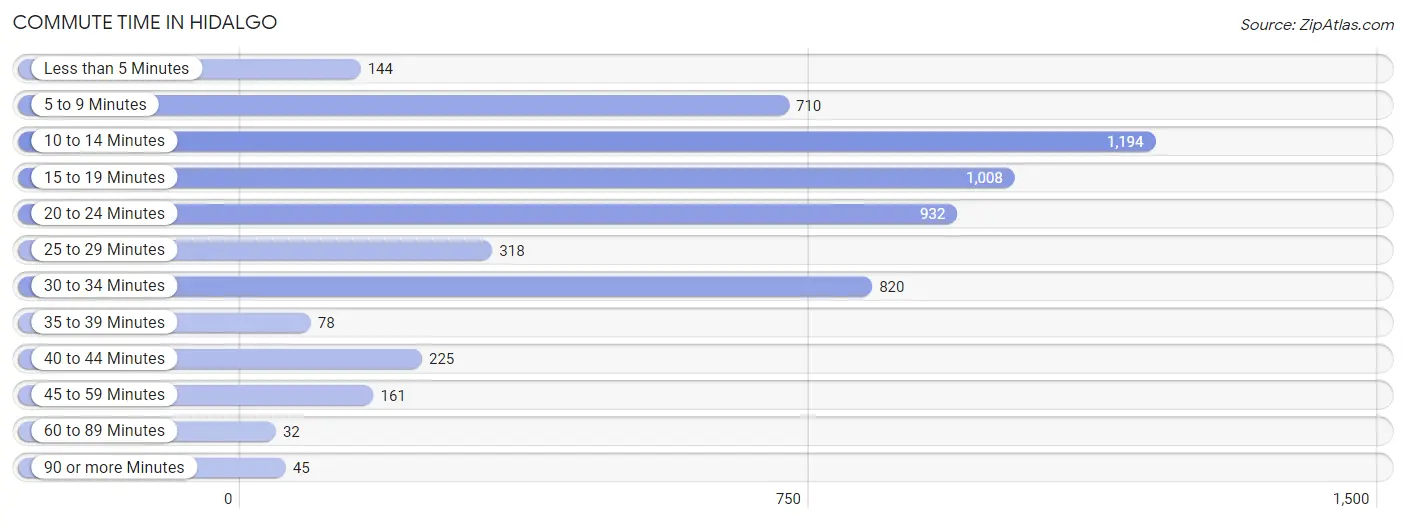
| Commute Time | # Commuters | % Commuters |
| Less than 5 Minutes | 144 | 2.5% |
| 5 to 9 Minutes | 710 | 12.5% |
| 10 to 14 Minutes | 1,194 | 21.1% |
| 15 to 19 Minutes | 1,008 | 17.8% |
| 20 to 24 Minutes | 932 | 16.5% |
| 25 to 29 Minutes | 318 | 5.6% |
| 30 to 34 Minutes | 820 | 14.5% |
| 35 to 39 Minutes | 78 | 1.4% |
| 40 to 44 Minutes | 225 | 4.0% |
| 45 to 59 Minutes | 161 | 2.8% |
| 60 to 89 Minutes | 32 | 0.6% |
| 90 or more Minutes | 45 | 0.8% |
Commute Time by Sex in Hidalgo
The most common commute times in Hidalgo are 10 to 14 minutes (851 commuters, 25.7%) for males and 15 to 19 minutes (455 commuters, 19.3%) for females.
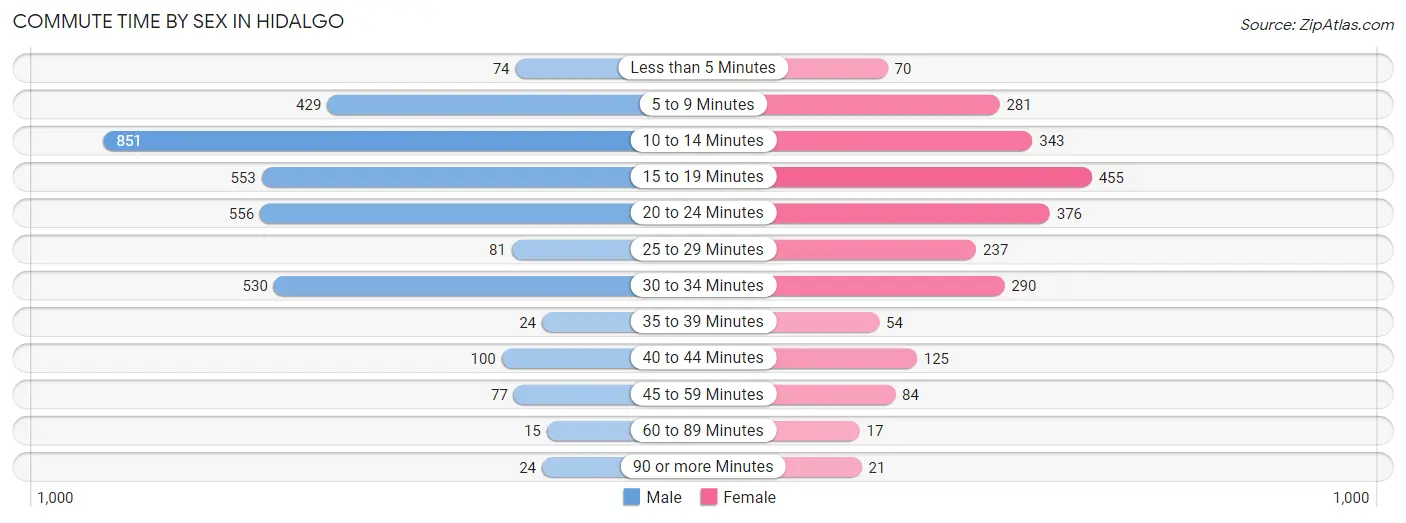
| Commute Time | Male | Female |
| Less than 5 Minutes | 74 (2.2%) | 70 (3.0%) |
| 5 to 9 Minutes | 429 (13.0%) | 281 (11.9%) |
| 10 to 14 Minutes | 851 (25.7%) | 343 (14.6%) |
| 15 to 19 Minutes | 553 (16.7%) | 455 (19.3%) |
| 20 to 24 Minutes | 556 (16.8%) | 376 (16.0%) |
| 25 to 29 Minutes | 81 (2.4%) | 237 (10.1%) |
| 30 to 34 Minutes | 530 (16.0%) | 290 (12.3%) |
| 35 to 39 Minutes | 24 (0.7%) | 54 (2.3%) |
| 40 to 44 Minutes | 100 (3.0%) | 125 (5.3%) |
| 45 to 59 Minutes | 77 (2.3%) | 84 (3.6%) |
| 60 to 89 Minutes | 15 (0.4%) | 17 (0.7%) |
| 90 or more Minutes | 24 (0.7%) | 21 (0.9%) |
Time of Departure to Work by Sex in Hidalgo
The most frequent times of departure to work in Hidalgo are 7:30 AM to 7:59 AM (1,162, 35.1%) for males and 7:00 AM to 7:29 AM (607, 25.8%) for females.
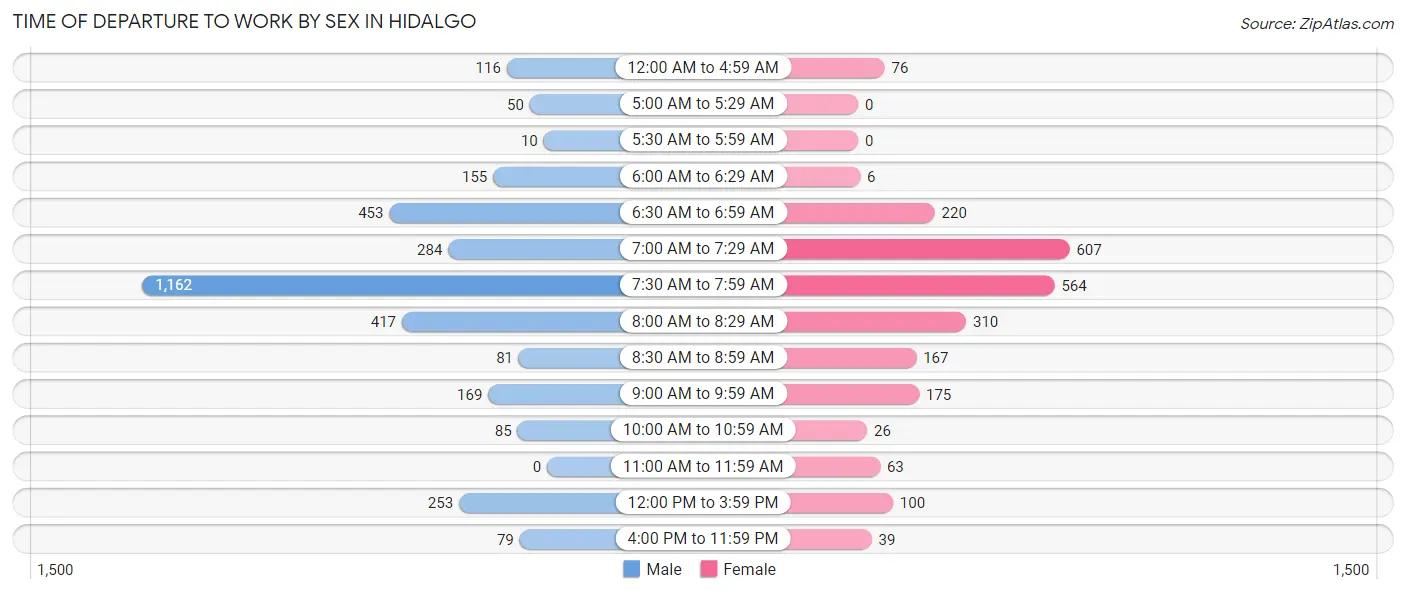
| Time of Departure | Male | Female |
| 12:00 AM to 4:59 AM | 116 (3.5%) | 76 (3.2%) |
| 5:00 AM to 5:29 AM | 50 (1.5%) | 0 (0.0%) |
| 5:30 AM to 5:59 AM | 10 (0.3%) | 0 (0.0%) |
| 6:00 AM to 6:29 AM | 155 (4.7%) | 6 (0.3%) |
| 6:30 AM to 6:59 AM | 453 (13.7%) | 220 (9.3%) |
| 7:00 AM to 7:29 AM | 284 (8.6%) | 607 (25.8%) |
| 7:30 AM to 7:59 AM | 1,162 (35.1%) | 564 (24.0%) |
| 8:00 AM to 8:29 AM | 417 (12.6%) | 310 (13.2%) |
| 8:30 AM to 8:59 AM | 81 (2.4%) | 167 (7.1%) |
| 9:00 AM to 9:59 AM | 169 (5.1%) | 175 (7.4%) |
| 10:00 AM to 10:59 AM | 85 (2.6%) | 26 (1.1%) |
| 11:00 AM to 11:59 AM | 0 (0.0%) | 63 (2.7%) |
| 12:00 PM to 3:59 PM | 253 (7.6%) | 100 (4.3%) |
| 4:00 PM to 11:59 PM | 79 (2.4%) | 39 (1.7%) |
| Total | 3,314 (100.0%) | 2,353 (100.0%) |
Housing Occupancy in Hidalgo
Occupancy by Ownership in Hidalgo
Of the total 3,705 dwellings in Hidalgo, owner-occupied units account for 2,800 (75.6%), while renter-occupied units make up 905 (24.4%).
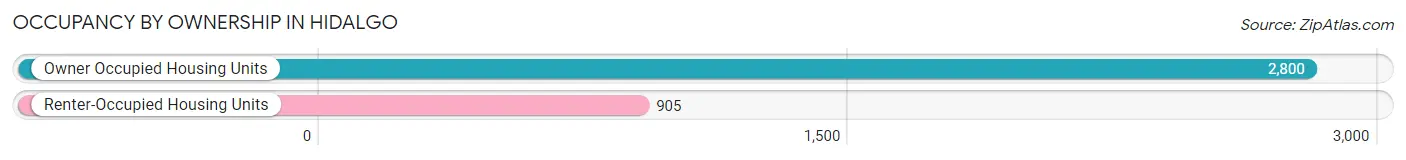
| Occupancy | # Housing Units | % Housing Units |
| Owner Occupied Housing Units | 2,800 | 75.6% |
| Renter-Occupied Housing Units | 905 | 24.4% |
| Total Occupied Housing Units | 3,705 | 100.0% |
Occupancy by Household Size in Hidalgo
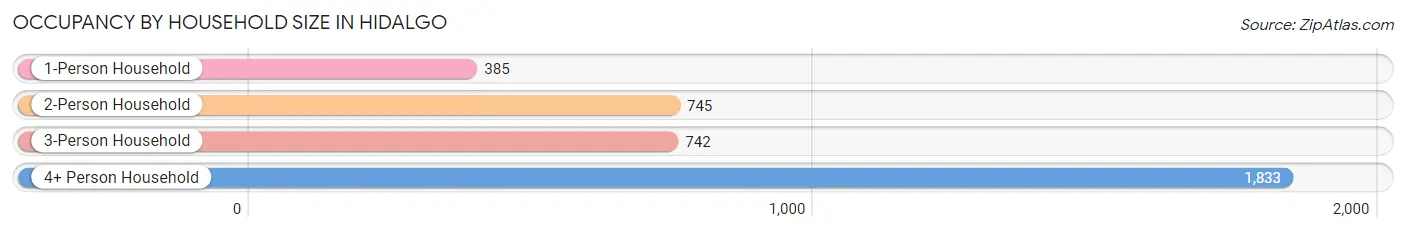
| Household Size | # Housing Units | % Housing Units |
| 1-Person Household | 385 | 10.4% |
| 2-Person Household | 745 | 20.1% |
| 3-Person Household | 742 | 20.0% |
| 4+ Person Household | 1,833 | 49.5% |
| Total Housing Units | 3,705 | 100.0% |
Occupancy by Ownership by Household Size in Hidalgo
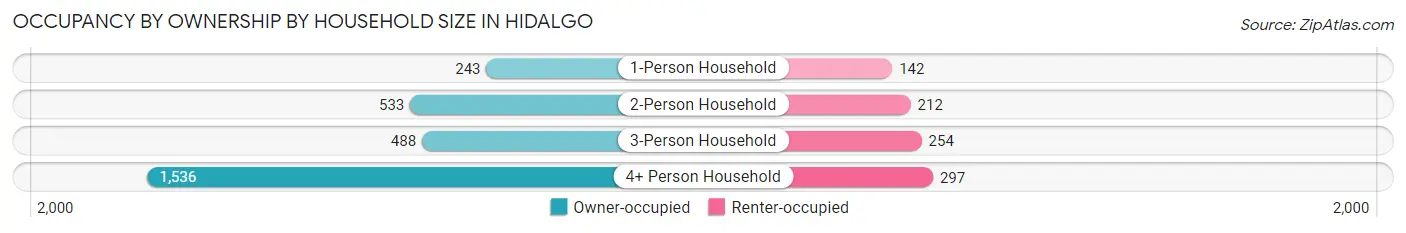
| Household Size | Owner-occupied | Renter-occupied |
| 1-Person Household | 243 (63.1%) | 142 (36.9%) |
| 2-Person Household | 533 (71.5%) | 212 (28.5%) |
| 3-Person Household | 488 (65.8%) | 254 (34.2%) |
| 4+ Person Household | 1,536 (83.8%) | 297 (16.2%) |
| Total Housing Units | 2,800 (75.6%) | 905 (24.4%) |
Occupancy by Educational Attainment in Hidalgo
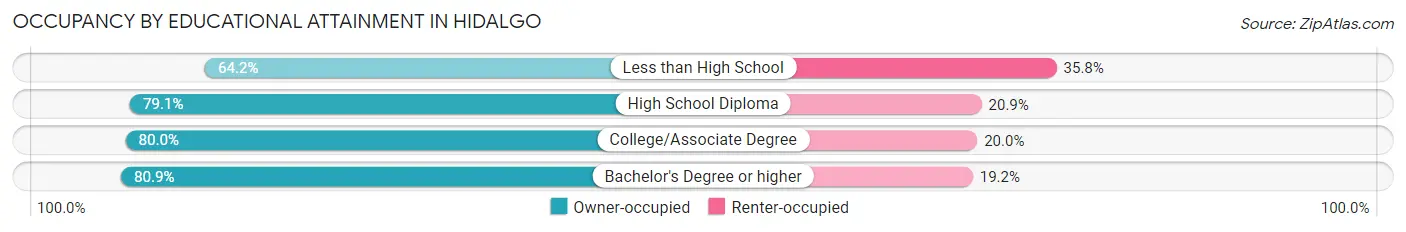
| Household Size | Owner-occupied | Renter-occupied |
| Less than High School | 657 (64.2%) | 366 (35.8%) |
| High School Diploma | 719 (79.1%) | 190 (20.9%) |
| College/Associate Degree | 854 (80.0%) | 214 (20.0%) |
| Bachelor's Degree or higher | 570 (80.8%) | 135 (19.2%) |
Occupancy by Age of Householder in Hidalgo
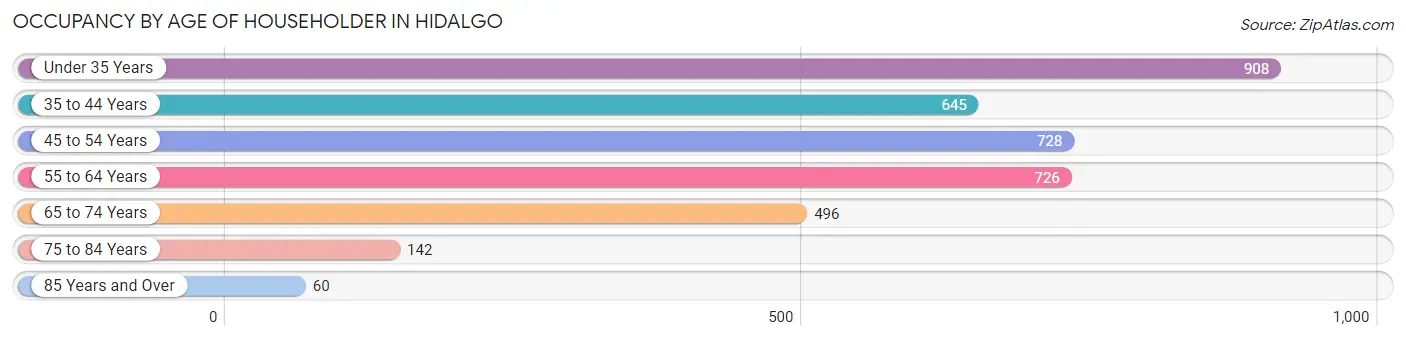
| Age Bracket | # Households | % Households |
| Under 35 Years | 908 | 24.5% |
| 35 to 44 Years | 645 | 17.4% |
| 45 to 54 Years | 728 | 19.7% |
| 55 to 64 Years | 726 | 19.6% |
| 65 to 74 Years | 496 | 13.4% |
| 75 to 84 Years | 142 | 3.8% |
| 85 Years and Over | 60 | 1.6% |
| Total | 3,705 | 100.0% |
Housing Finances in Hidalgo
Median Income by Occupancy in Hidalgo
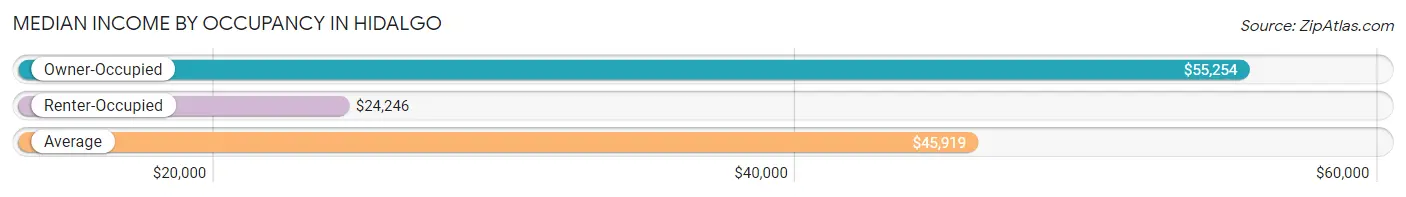
| Occupancy Type | # Households | Median Income |
| Owner-Occupied | 2,800 (75.6%) | $55,254 |
| Renter-Occupied | 905 (24.4%) | $24,246 |
| Average | 3,705 (100.0%) | $45,919 |
Occupancy by Householder Income Bracket in Hidalgo
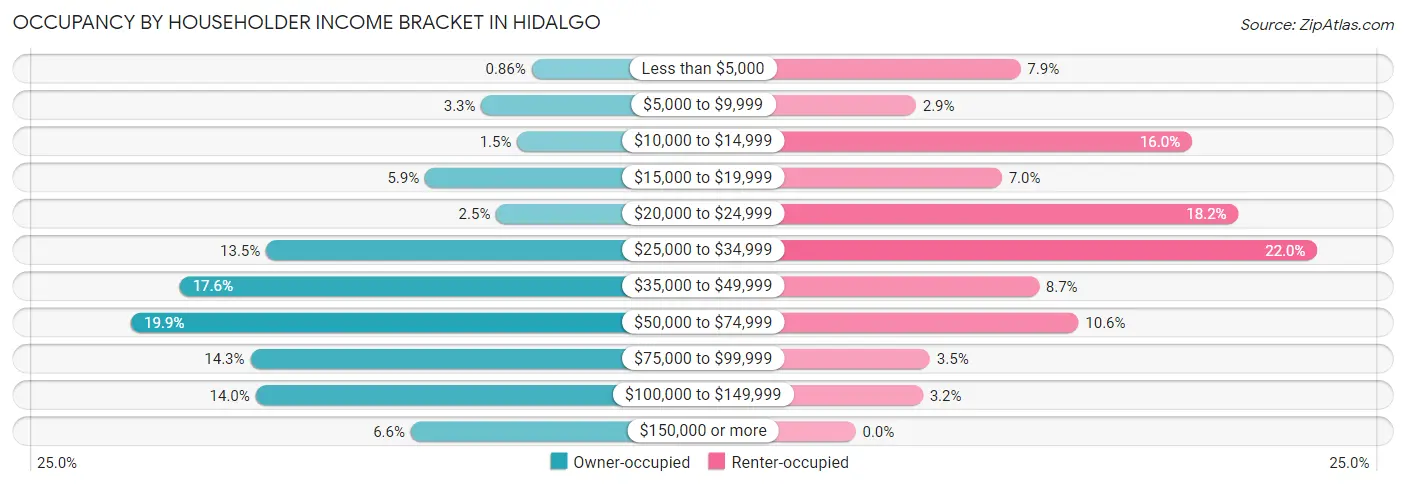
| Income Bracket | Owner-occupied | Renter-occupied |
| Less than $5,000 | 24 (0.9%) | 71 (7.9%) |
| $5,000 to $9,999 | 91 (3.3%) | 26 (2.9%) |
| $10,000 to $14,999 | 43 (1.5%) | 145 (16.0%) |
| $15,000 to $19,999 | 166 (5.9%) | 63 (7.0%) |
| $20,000 to $24,999 | 71 (2.5%) | 165 (18.2%) |
| $25,000 to $34,999 | 378 (13.5%) | 199 (22.0%) |
| $35,000 to $49,999 | 493 (17.6%) | 79 (8.7%) |
| $50,000 to $74,999 | 558 (19.9%) | 96 (10.6%) |
| $75,000 to $99,999 | 399 (14.2%) | 32 (3.5%) |
| $100,000 to $149,999 | 392 (14.0%) | 29 (3.2%) |
| $150,000 or more | 185 (6.6%) | 0 (0.0%) |
| Total | 2,800 (100.0%) | 905 (100.0%) |
Monthly Housing Cost Tiers in Hidalgo
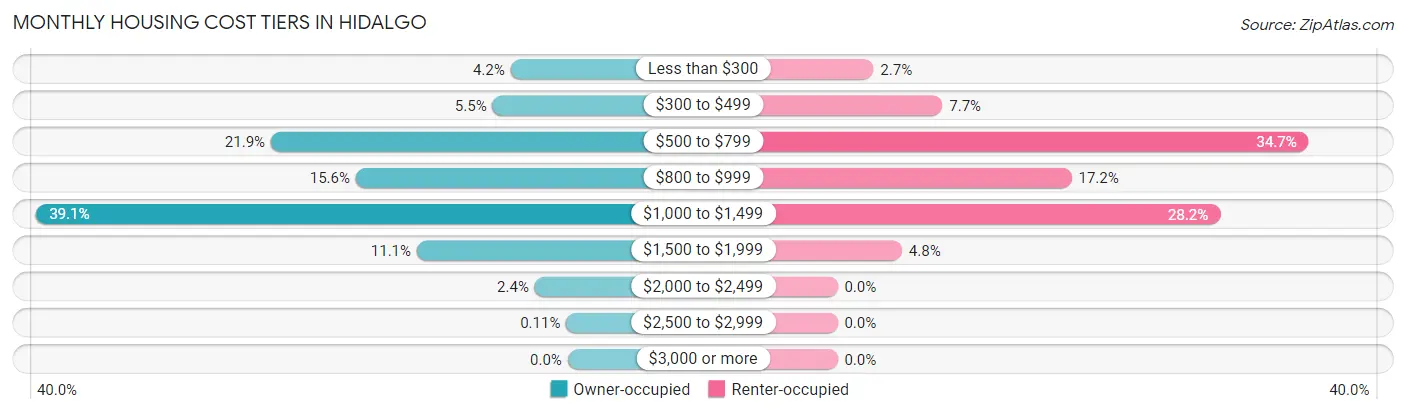
| Monthly Cost | Owner-occupied | Renter-occupied |
| Less than $300 | 118 (4.2%) | 24 (2.6%) |
| $300 to $499 | 155 (5.5%) | 70 (7.7%) |
| $500 to $799 | 612 (21.9%) | 314 (34.7%) |
| $800 to $999 | 437 (15.6%) | 156 (17.2%) |
| $1,000 to $1,499 | 1,096 (39.1%) | 255 (28.2%) |
| $1,500 to $1,999 | 311 (11.1%) | 43 (4.8%) |
| $2,000 to $2,499 | 68 (2.4%) | 0 (0.0%) |
| $2,500 to $2,999 | 3 (0.1%) | 0 (0.0%) |
| $3,000 or more | 0 (0.0%) | 0 (0.0%) |
| Total | 2,800 (100.0%) | 905 (100.0%) |
Physical Housing Characteristics in Hidalgo
Housing Structures in Hidalgo
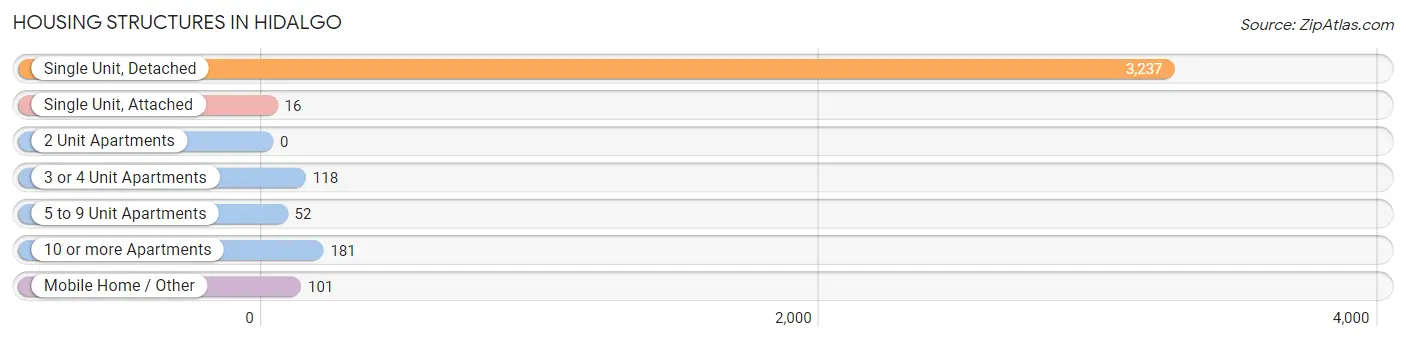
| Structure Type | # Housing Units | % Housing Units |
| Single Unit, Detached | 3,237 | 87.4% |
| Single Unit, Attached | 16 | 0.4% |
| 2 Unit Apartments | 0 | 0.0% |
| 3 or 4 Unit Apartments | 118 | 3.2% |
| 5 to 9 Unit Apartments | 52 | 1.4% |
| 10 or more Apartments | 181 | 4.9% |
| Mobile Home / Other | 101 | 2.7% |
| Total | 3,705 | 100.0% |
Housing Structures by Occupancy in Hidalgo
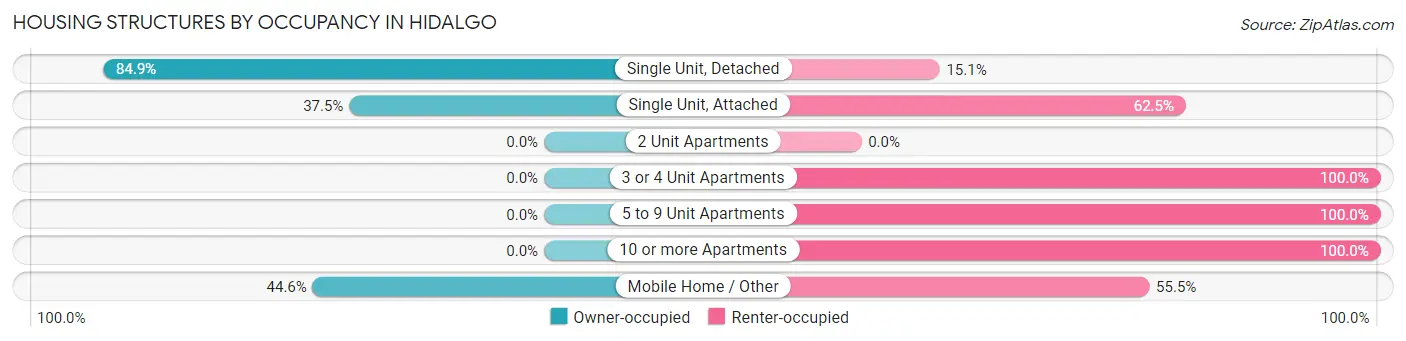
| Structure Type | Owner-occupied | Renter-occupied |
| Single Unit, Detached | 2,749 (84.9%) | 488 (15.1%) |
| Single Unit, Attached | 6 (37.5%) | 10 (62.5%) |
| 2 Unit Apartments | 0 (0.0%) | 0 (0.0%) |
| 3 or 4 Unit Apartments | 0 (0.0%) | 118 (100.0%) |
| 5 to 9 Unit Apartments | 0 (0.0%) | 52 (100.0%) |
| 10 or more Apartments | 0 (0.0%) | 181 (100.0%) |
| Mobile Home / Other | 45 (44.6%) | 56 (55.4%) |
| Total | 2,800 (75.6%) | 905 (24.4%) |
Housing Structures by Number of Rooms in Hidalgo
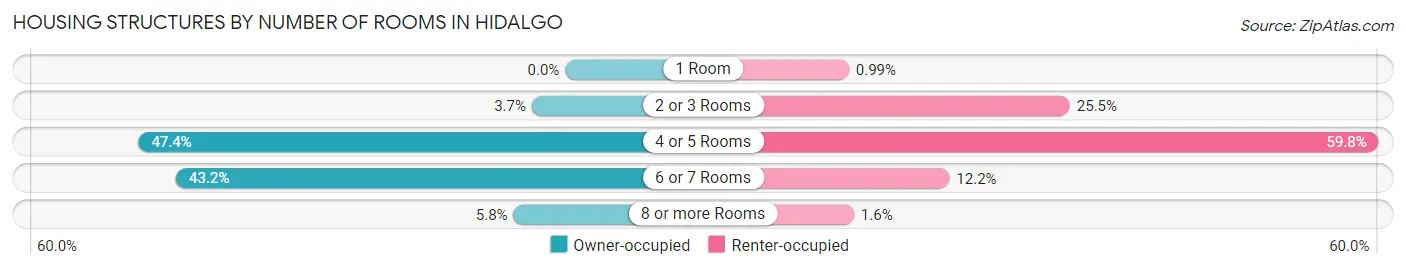
| Number of Rooms | Owner-occupied | Renter-occupied |
| 1 Room | 0 (0.0%) | 9 (1.0%) |
| 2 or 3 Rooms | 104 (3.7%) | 231 (25.5%) |
| 4 or 5 Rooms | 1,326 (47.4%) | 541 (59.8%) |
| 6 or 7 Rooms | 1,209 (43.2%) | 110 (12.1%) |
| 8 or more Rooms | 161 (5.8%) | 14 (1.5%) |
| Total | 2,800 (100.0%) | 905 (100.0%) |
Housing Structure by Heating Type in Hidalgo
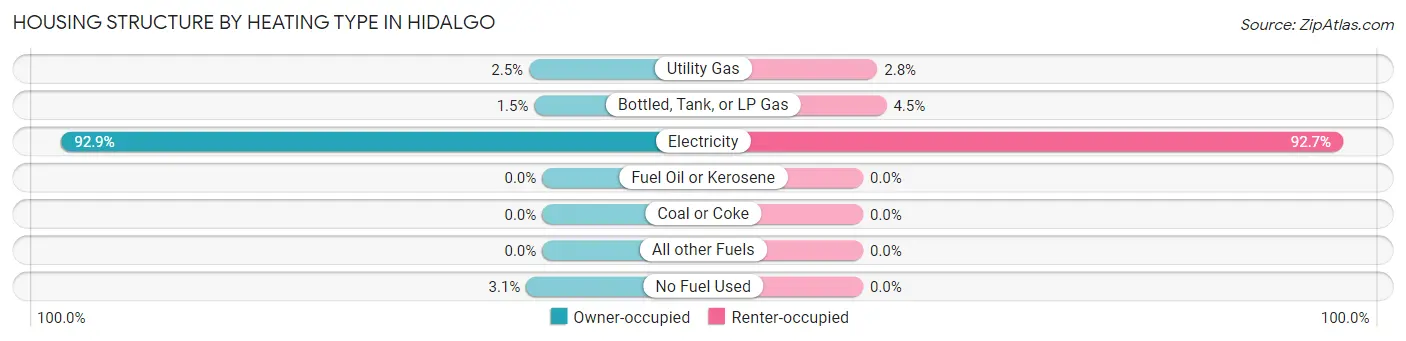
| Heating Type | Owner-occupied | Renter-occupied |
| Utility Gas | 71 (2.5%) | 25 (2.8%) |
| Bottled, Tank, or LP Gas | 42 (1.5%) | 41 (4.5%) |
| Electricity | 2,601 (92.9%) | 839 (92.7%) |
| Fuel Oil or Kerosene | 0 (0.0%) | 0 (0.0%) |
| Coal or Coke | 0 (0.0%) | 0 (0.0%) |
| All other Fuels | 0 (0.0%) | 0 (0.0%) |
| No Fuel Used | 86 (3.1%) | 0 (0.0%) |
| Total | 2,800 (100.0%) | 905 (100.0%) |
Household Vehicle Usage in Hidalgo
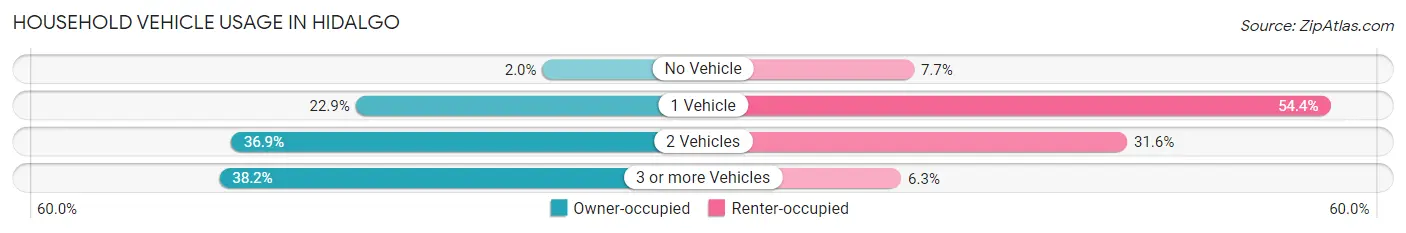
| Vehicles per Household | Owner-occupied | Renter-occupied |
| No Vehicle | 56 (2.0%) | 70 (7.7%) |
| 1 Vehicle | 642 (22.9%) | 492 (54.4%) |
| 2 Vehicles | 1,033 (36.9%) | 286 (31.6%) |
| 3 or more Vehicles | 1,069 (38.2%) | 57 (6.3%) |
| Total | 2,800 (100.0%) | 905 (100.0%) |
Real Estate & Mortgages in Hidalgo
Real Estate and Mortgage Overview in Hidalgo
| Characteristic | Without Mortgage | With Mortgage |
| Housing Units | 876 | 1,924 |
| Median Property Value | $146,400 | $135,300 |
| Median Household Income | $55,585 | $99 |
| Monthly Housing Costs | $605 | $0 |
| Real Estate Taxes | $3,375 | $69 |
Property Value by Mortgage Status in Hidalgo
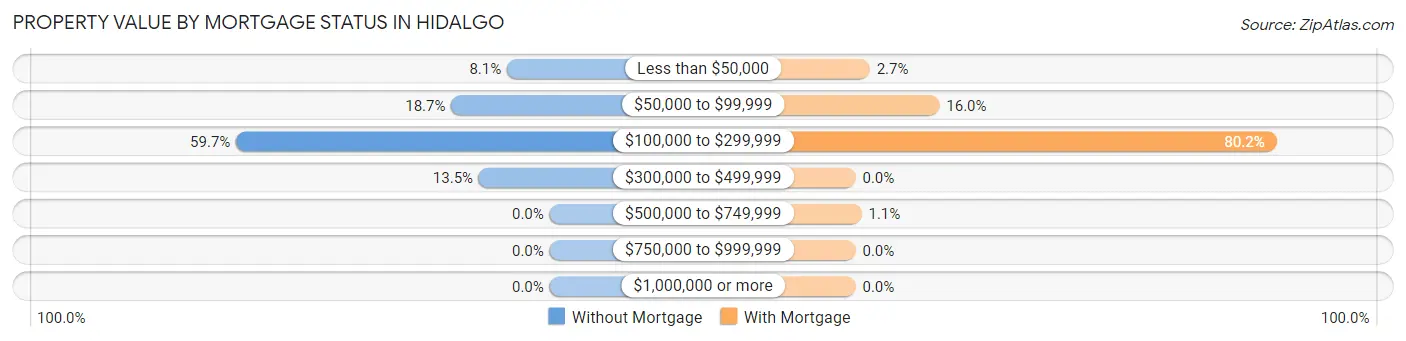
| Property Value | Without Mortgage | With Mortgage |
| Less than $50,000 | 71 (8.1%) | 52 (2.7%) |
| $50,000 to $99,999 | 164 (18.7%) | 307 (16.0%) |
| $100,000 to $299,999 | 523 (59.7%) | 1,543 (80.2%) |
| $300,000 to $499,999 | 118 (13.5%) | 0 (0.0%) |
| $500,000 to $749,999 | 0 (0.0%) | 22 (1.1%) |
| $750,000 to $999,999 | 0 (0.0%) | 0 (0.0%) |
| $1,000,000 or more | 0 (0.0%) | 0 (0.0%) |
| Total | 876 (100.0%) | 1,924 (100.0%) |
Household Income by Mortgage Status in Hidalgo
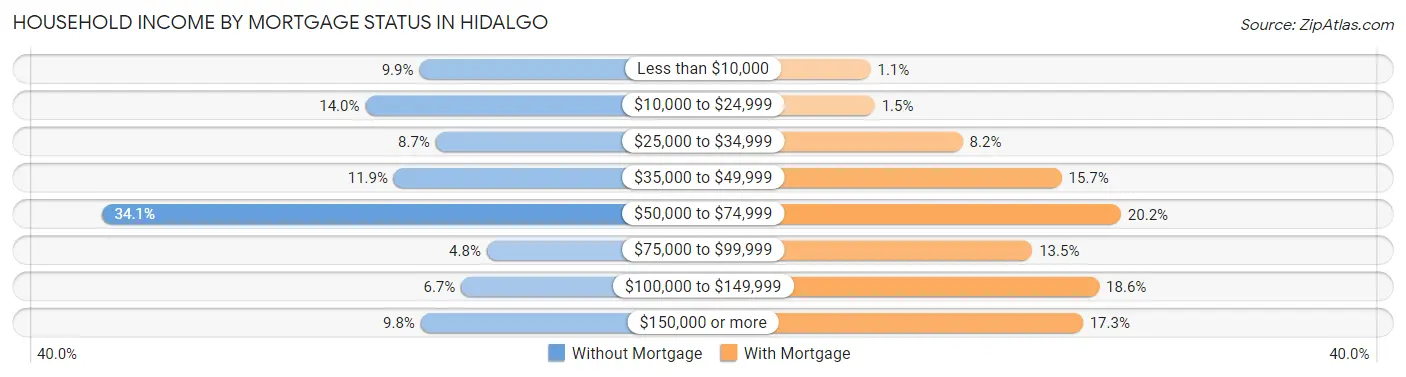
| Household Income | Without Mortgage | With Mortgage |
| Less than $10,000 | 87 (9.9%) | 22 (1.1%) |
| $10,000 to $24,999 | 123 (14.0%) | 28 (1.5%) |
| $25,000 to $34,999 | 76 (8.7%) | 157 (8.2%) |
| $35,000 to $49,999 | 104 (11.9%) | 302 (15.7%) |
| $50,000 to $74,999 | 299 (34.1%) | 389 (20.2%) |
| $75,000 to $99,999 | 42 (4.8%) | 259 (13.5%) |
| $100,000 to $149,999 | 59 (6.7%) | 357 (18.6%) |
| $150,000 or more | 86 (9.8%) | 333 (17.3%) |
| Total | 876 (100.0%) | 1,924 (100.0%) |
Property Value to Household Income Ratio in Hidalgo
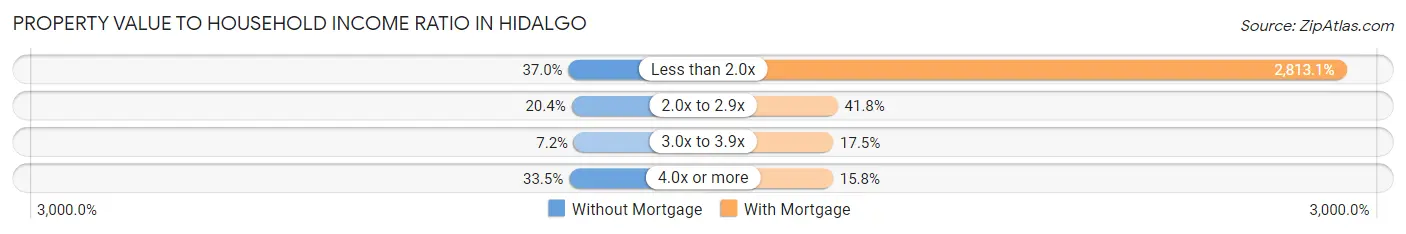
| Value-to-Income Ratio | Without Mortgage | With Mortgage |
| Less than 2.0x | 324 (37.0%) | 54,123 (2,813.1%) |
| 2.0x to 2.9x | 179 (20.4%) | 805 (41.8%) |
| 3.0x to 3.9x | 63 (7.2%) | 336 (17.5%) |
| 4.0x or more | 293 (33.5%) | 303 (15.8%) |
| Total | 876 (100.0%) | 1,924 (100.0%) |
Real Estate Taxes by Mortgage Status in Hidalgo
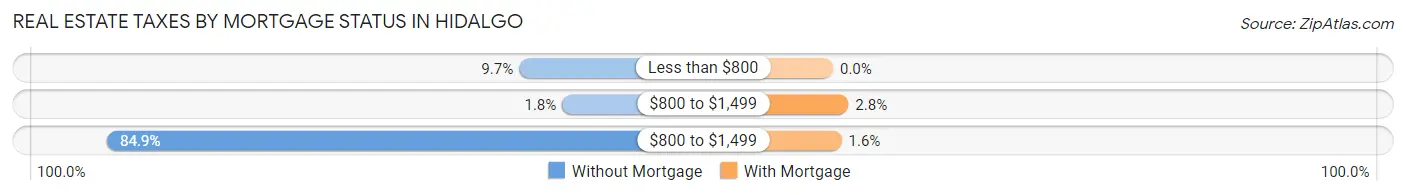
| Property Taxes | Without Mortgage | With Mortgage |
| Less than $800 | 85 (9.7%) | 0 (0.0%) |
| $800 to $1,499 | 16 (1.8%) | 54 (2.8%) |
| $800 to $1,499 | 744 (84.9%) | 30 (1.6%) |
| Total | 876 (100.0%) | 1,924 (100.0%) |
Health & Disability in Hidalgo
Health Insurance Coverage by Age in Hidalgo
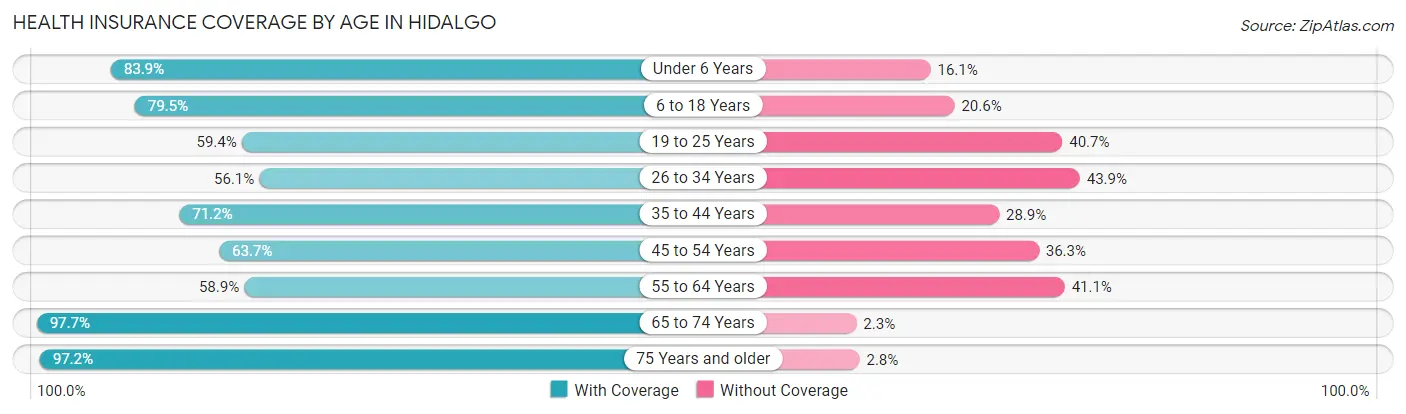
| Age Bracket | With Coverage | Without Coverage |
| Under 6 Years | 1,205 (83.9%) | 231 (16.1%) |
| 6 to 18 Years | 2,494 (79.4%) | 645 (20.5%) |
| 19 to 25 Years | 1,016 (59.4%) | 696 (40.6%) |
| 26 to 34 Years | 1,121 (56.1%) | 878 (43.9%) |
| 35 to 44 Years | 1,117 (71.2%) | 453 (28.8%) |
| 45 to 54 Years | 810 (63.7%) | 461 (36.3%) |
| 55 to 64 Years | 748 (58.9%) | 522 (41.1%) |
| 65 to 74 Years | 1,123 (97.7%) | 26 (2.3%) |
| 75 Years and older | 514 (97.2%) | 15 (2.8%) |
| Total | 10,148 (72.1%) | 3,927 (27.9%) |
Health Insurance Coverage by Citizenship Status in Hidalgo
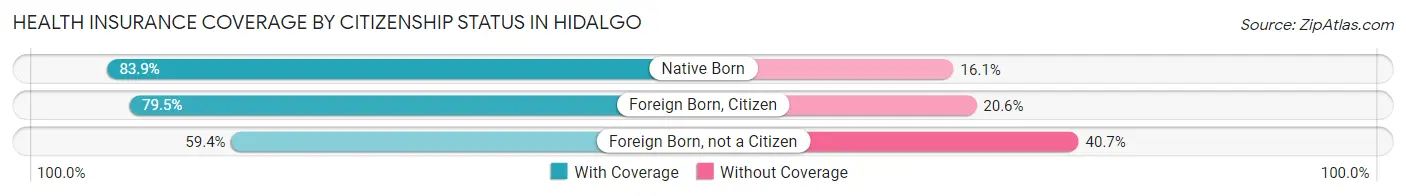
| Citizenship Status | With Coverage | Without Coverage |
| Native Born | 1,205 (83.9%) | 231 (16.1%) |
| Foreign Born, Citizen | 2,494 (79.4%) | 645 (20.5%) |
| Foreign Born, not a Citizen | 1,016 (59.4%) | 696 (40.6%) |
Health Insurance Coverage by Household Income in Hidalgo
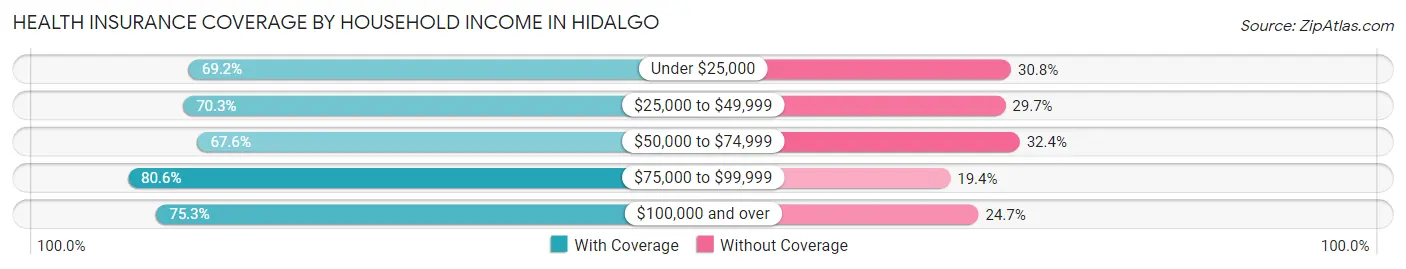
| Household Income | With Coverage | Without Coverage |
| Under $25,000 | 1,592 (69.2%) | 708 (30.8%) |
| $25,000 to $49,999 | 3,107 (70.3%) | 1,314 (29.7%) |
| $50,000 to $74,999 | 1,665 (67.6%) | 798 (32.4%) |
| $75,000 to $99,999 | 1,513 (80.6%) | 364 (19.4%) |
| $100,000 and over | 2,261 (75.3%) | 741 (24.7%) |
Public vs Private Health Insurance Coverage by Age in Hidalgo
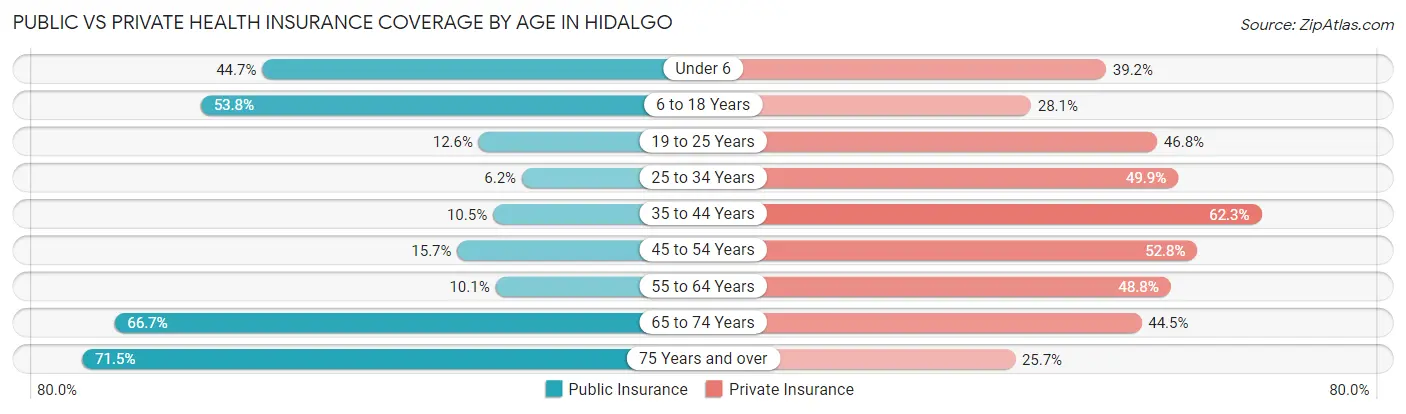
| Age Bracket | Public Insurance | Private Insurance |
| Under 6 | 642 (44.7%) | 563 (39.2%) |
| 6 to 18 Years | 1,690 (53.8%) | 881 (28.1%) |
| 19 to 25 Years | 215 (12.6%) | 801 (46.8%) |
| 25 to 34 Years | 123 (6.1%) | 998 (49.9%) |
| 35 to 44 Years | 164 (10.4%) | 978 (62.3%) |
| 45 to 54 Years | 200 (15.7%) | 671 (52.8%) |
| 55 to 64 Years | 128 (10.1%) | 620 (48.8%) |
| 65 to 74 Years | 766 (66.7%) | 511 (44.5%) |
| 75 Years and over | 378 (71.5%) | 136 (25.7%) |
| Total | 4,306 (30.6%) | 6,159 (43.8%) |
Disability Status by Sex by Age in Hidalgo
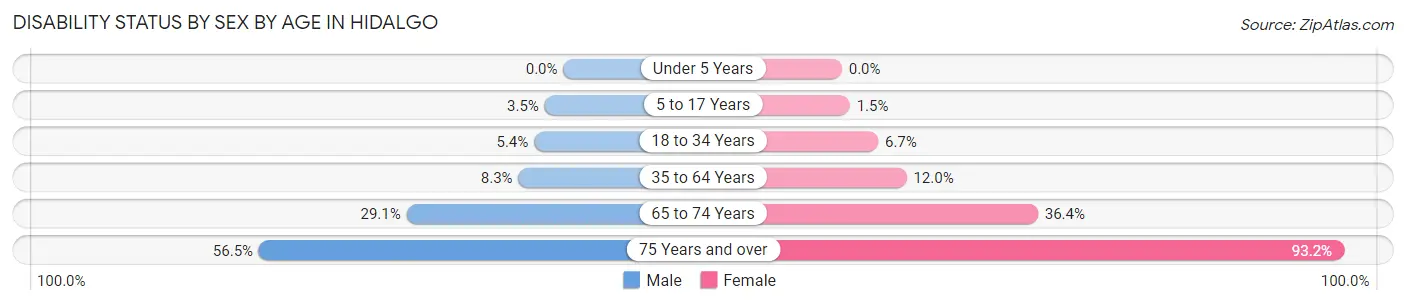
| Age Bracket | Male | Female |
| Under 5 Years | 0 (0.0%) | 0 (0.0%) |
| 5 to 17 Years | 69 (3.5%) | 18 (1.5%) |
| 18 to 34 Years | 102 (5.4%) | 140 (6.7%) |
| 35 to 64 Years | 147 (8.3%) | 282 (12.0%) |
| 65 to 74 Years | 172 (29.1%) | 203 (36.4%) |
| 75 Years and over | 191 (56.5%) | 178 (93.2%) |
Disability Class by Sex by Age in Hidalgo
Disability Class: Hearing Difficulty
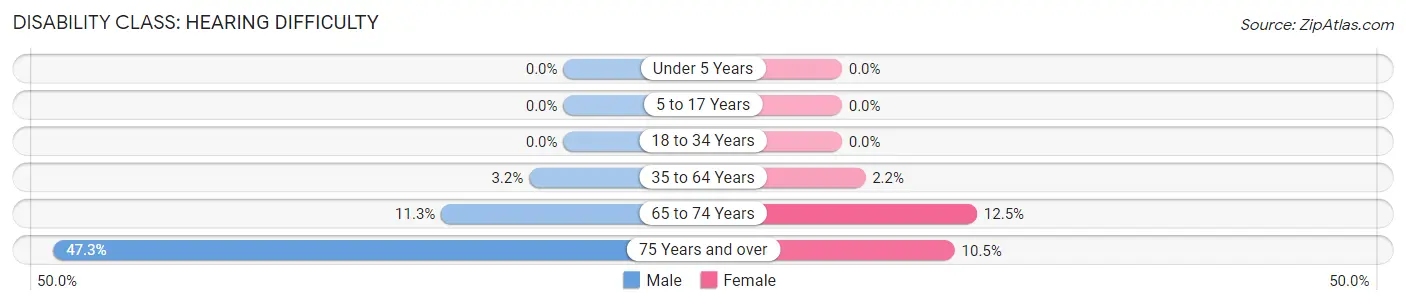
| Age Bracket | Male | Female |
| Under 5 Years | 0 (0.0%) | 0 (0.0%) |
| 5 to 17 Years | 0 (0.0%) | 0 (0.0%) |
| 18 to 34 Years | 0 (0.0%) | 0 (0.0%) |
| 35 to 64 Years | 56 (3.2%) | 51 (2.2%) |
| 65 to 74 Years | 67 (11.3%) | 70 (12.5%) |
| 75 Years and over | 160 (47.3%) | 20 (10.5%) |
Disability Class: Vision Difficulty
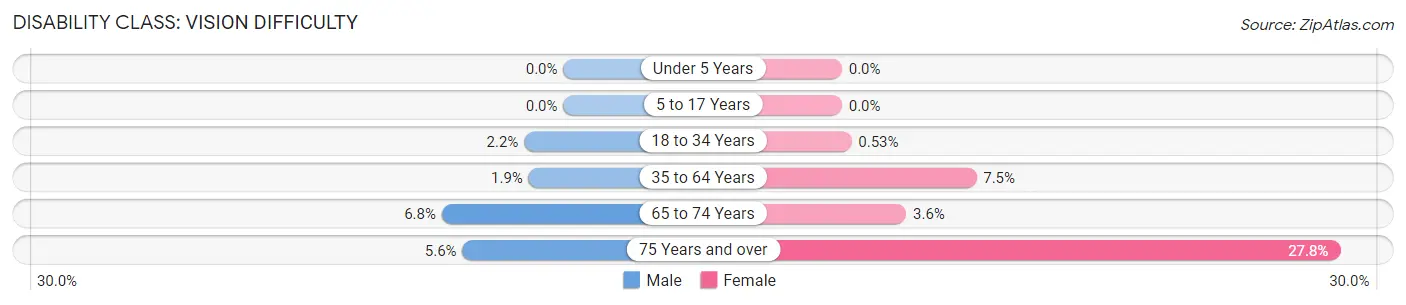
| Age Bracket | Male | Female |
| Under 5 Years | 0 (0.0%) | 0 (0.0%) |
| 5 to 17 Years | 0 (0.0%) | 0 (0.0%) |
| 18 to 34 Years | 41 (2.2%) | 11 (0.5%) |
| 35 to 64 Years | 34 (1.9%) | 176 (7.5%) |
| 65 to 74 Years | 40 (6.8%) | 20 (3.6%) |
| 75 Years and over | 19 (5.6%) | 53 (27.8%) |
Disability Class: Cognitive Difficulty
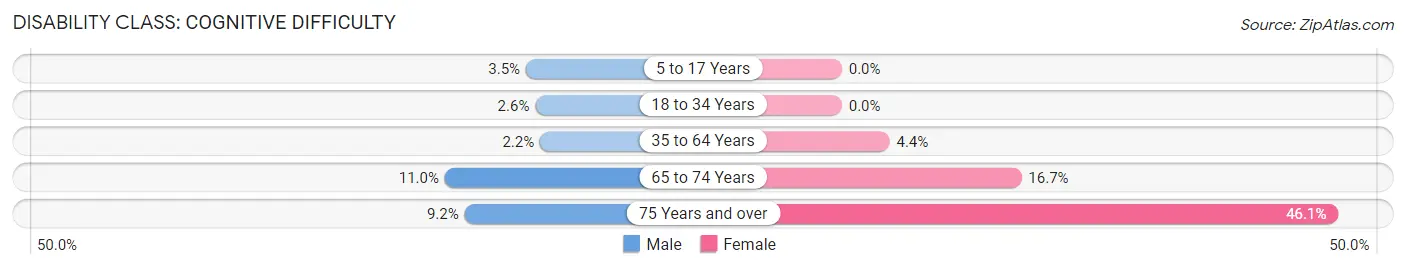
| Age Bracket | Male | Female |
| 5 to 17 Years | 69 (3.5%) | 0 (0.0%) |
| 18 to 34 Years | 49 (2.6%) | 0 (0.0%) |
| 35 to 64 Years | 38 (2.2%) | 104 (4.4%) |
| 65 to 74 Years | 65 (11.0%) | 93 (16.7%) |
| 75 Years and over | 31 (9.2%) | 88 (46.1%) |
Disability Class: Ambulatory Difficulty
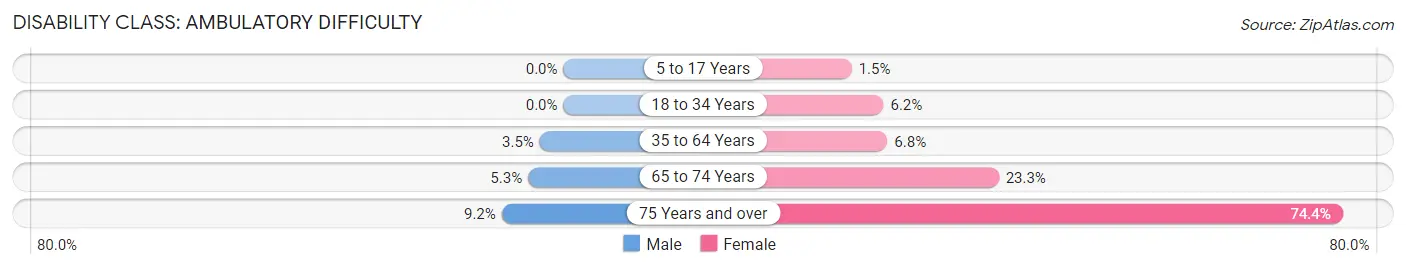
| Age Bracket | Male | Female |
| 5 to 17 Years | 0 (0.0%) | 18 (1.5%) |
| 18 to 34 Years | 0 (0.0%) | 129 (6.2%) |
| 35 to 64 Years | 62 (3.5%) | 159 (6.8%) |
| 65 to 74 Years | 31 (5.2%) | 130 (23.3%) |
| 75 Years and over | 31 (9.2%) | 142 (74.4%) |
Disability Class: Self-Care Difficulty
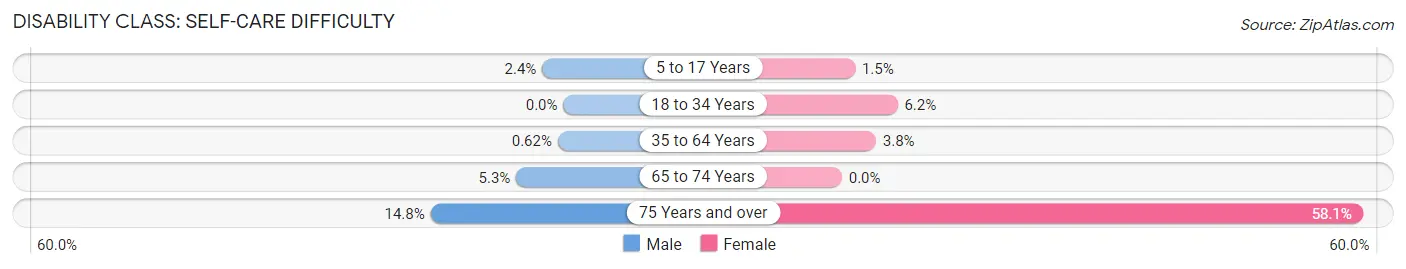
| Age Bracket | Male | Female |
| 5 to 17 Years | 47 (2.4%) | 18 (1.5%) |
| 18 to 34 Years | 0 (0.0%) | 129 (6.2%) |
| 35 to 64 Years | 11 (0.6%) | 89 (3.8%) |
| 65 to 74 Years | 31 (5.2%) | 0 (0.0%) |
| 75 Years and over | 50 (14.8%) | 111 (58.1%) |
Technology Access in Hidalgo
Computing Device Access in Hidalgo
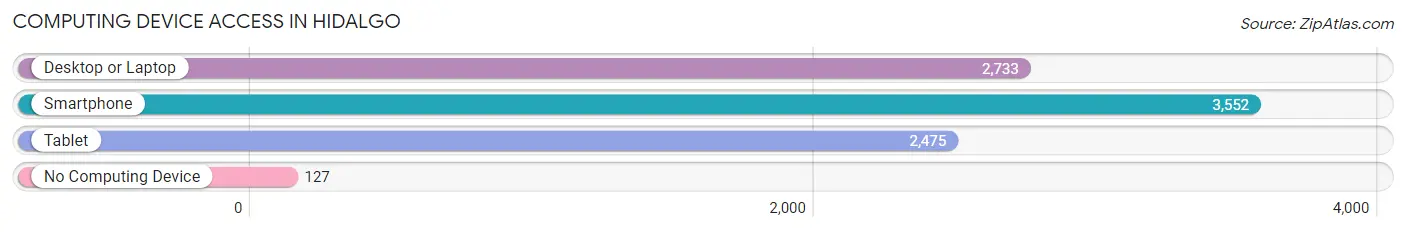
| Device Type | # Households | % Households |
| Desktop or Laptop | 2,733 | 73.8% |
| Smartphone | 3,552 | 95.9% |
| Tablet | 2,475 | 66.8% |
| No Computing Device | 127 | 3.4% |
| Total | 3,705 | 100.0% |
Internet Access in Hidalgo
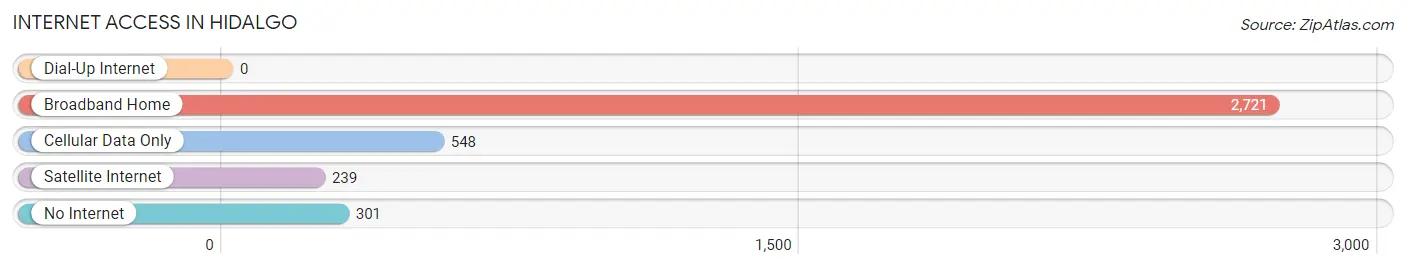
| Internet Type | # Households | % Households |
| Dial-Up Internet | 0 | 0.0% |
| Broadband Home | 2,721 | 73.4% |
| Cellular Data Only | 548 | 14.8% |
| Satellite Internet | 239 | 6.5% |
| No Internet | 301 | 8.1% |
| Total | 3,705 | 100.0% |
Hidalgo Summary
Hidalgo, Texas is a city located in Hidalgo County, Texas, United States. It is located on the Rio Grande, just south of McAllen, Texas. The city is part of the McAllen–Edinburg–Mission and Reynosa–McAllen metropolitan areas. As of the 2010 census, the city population was 11,198.
History
Hidalgo was founded in 1908 by John Closner, a rancher and businessman from San Antonio. Closner named the city after Miguel Hidalgo y Costilla, the Mexican priest who is credited with starting the Mexican War of Independence. The city was incorporated in 1910 and was the first city in Hidalgo County.
In the early 1900s, Hidalgo was a small farming community. The economy was based on cotton, corn, and sorghum. The city was also home to a number of small businesses, including a general store, a blacksmith shop, and a livery stable.
In the 1920s, the economy began to diversify as the city became a major center for the production of citrus fruits. The city also became a popular tourist destination, with many visitors coming to enjoy the warm climate and the nearby beaches.
In the 1950s, the economy shifted again as the city became a major center for the production of oil and gas. The city also became a major center for the production of steel and aluminum.
In the 1970s, the economy shifted again as the city became a major center for the production of electronics and computer components. The city also became a major center for the production of medical equipment.
Geography
Hidalgo is located in the Rio Grande Valley of South Texas, about 10 miles (16 km) south of McAllen. The city is located at the intersection of U.S. Route 281 and State Highway 107.
The city has a total area of 4 2 square miles 10 8 km2 all of it land
Economy
Hidalgo’s economy is largely based on agriculture, manufacturing, and tourism. The city is home to a number of large agricultural operations, including citrus, cotton, and vegetable farms. The city is also home to a number of manufacturing plants, including those that produce electronics, medical equipment, and steel and aluminum products.
The city is also a popular tourist destination, with many visitors coming to enjoy the warm climate and the nearby beaches. The city is home to a number of attractions, including the Hidalgo County Historical Museum, the Hidalgo County Courthouse, and the Hidalgo County Fairgrounds.
Demographics
As of the 2010 census, there were 11,198 people, 3,717 households, and 2,845 families residing in the city. The population density was 2,664.3 people per square mile (1,027.2/km2). There were 4,072 housing units at an average density of 972.2 per square mile (375.3/km2). The racial makeup of the city was 77.2% White, 0.7% African American, 0.4% Native American, 0.2% Asian, 0.1% Pacific Islander, 19.3% from other races, and 2.1% from two or more races. Hispanic or Latino of any race were 97.2% of the population.
There were 3,717 households, out of which 41.2% had children under the age of 18 living with them, 54.2% were married couples living together, 17.2% had a female householder with no husband present, and 22.2% were non-families. 18.7% of all households were made up of individuals, and 8.2% had someone living alone who was 65 years of age or older. The average household size was 3.00 and the average family size was 3.45.
In the city, the population was spread out, with 30.7% under the age of 18, 10.2% from 18 to 24, 28.2% from 25 to 44, 19.3% from 45 to 64, and 11.6% who were 65 years of age or older. The median age was 31 years. For every 100 females, there were 93.2 males. For every 100 females age 18 and over, there were 88.7 males.
The median income for a household in the city was $25,938, and the median income for a family was $27,917. Males had a median income of $25,938 versus $17,917 for females. The per capita income for the city was $10,945. About 24.2% of families and 27.2% of the population were below the poverty line, including 36.2% of those under age 18 and 24.2% of those age 65 or over.
Common Questions
What is Per Capita Income in Hidalgo?
Per Capita income in Hidalgo is $16,964.
What is the Median Family Income in Hidalgo?
Median Family Income in Hidalgo is $47,246.
What is the Median Household income in Hidalgo?
Median Household Income in Hidalgo is $45,919.
What is Income or Wage Gap in Hidalgo?
Income or Wage Gap in Hidalgo is 38.1%.
Women in Hidalgo earn 61.9 cents for every dollar earned by a man.
What is Inequality or Gini Index in Hidalgo?
Inequality or Gini Index in Hidalgo is 0.42.
What is the Total Population of Hidalgo?
Total Population of Hidalgo is 14,075.
What is the Total Male Population of Hidalgo?
Total Male Population of Hidalgo is 7,247.
What is the Total Female Population of Hidalgo?
Total Female Population of Hidalgo is 6,828.
What is the Ratio of Males per 100 Females in Hidalgo?
There are 106.14 Males per 100 Females in Hidalgo.
What is the Ratio of Females per 100 Males in Hidalgo?
There are 94.22 Females per 100 Males in Hidalgo.
What is the Median Population Age in Hidalgo?
Median Population Age in Hidalgo is 28.8 Years.
What is the Average Family Size in Hidalgo
Average Family Size in Hidalgo is 4.1 People.
What is the Average Household Size in Hidalgo
Average Household Size in Hidalgo is 3.8 People.
How Large is the Labor Force in Hidalgo?
There are 6,599 People in the Labor Forcein in Hidalgo.
What is the Percentage of People in the Labor Force in Hidalgo?
65.1% of People are in the Labor Force in Hidalgo.
What is the Unemployment Rate in Hidalgo?
Unemployment Rate in Hidalgo is 7.8%.