Longview, TX Map & Demographics
Longview Map
Longview Overview
$32,366
PER CAPITA INCOME
$71,347
AVG FAMILY INCOME
$61,003
AVG HOUSEHOLD INCOME
36.6%
WAGE / INCOME GAP [ % ]
63.4¢/ $1
WAGE / INCOME GAP [ $ ]
$10,851
FAMILY INCOME DEFICIT
0.46
INEQUALITY / GINI INDEX
82,176
TOTAL POPULATION
40,181
MALE POPULATION
41,995
FEMALE POPULATION
95.68
MALES / 100 FEMALES
104.51
FEMALES / 100 MALES
35.1
MEDIAN AGE
3.1
AVG FAMILY SIZE
2.4
AVG HOUSEHOLD SIZE
39,958
LABOR FORCE [ PEOPLE ]
62.1%
PERCENT IN LABOR FORCE
3.5%
UNEMPLOYMENT RATE
Income in Longview
Income Overview in Longview
Per Capita Income in Longview is $32,366, while median incomes of families and households are $71,347 and $61,003 respectively.
| Characteristic | Number | Measure |
| Per Capita Income | 82,176 | $32,366 |
| Median Family Income | 20,022 | $71,347 |
| Mean Family Income | 20,022 | $96,029 |
| Median Household Income | 32,169 | $61,003 |
| Mean Household Income | 32,169 | $81,485 |
| Income Deficit | 20,022 | $10,851 |
| Wage / Income Gap (%) | 82,176 | 36.57% |
| Wage / Income Gap ($) | 82,176 | 63.43¢ per $1 |
| Gini / Inequality Index | 82,176 | 0.46 |
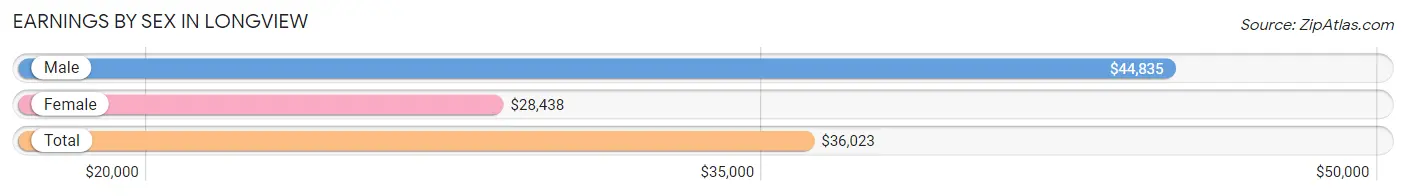
Earnings by Sex in Longview
Average Earnings in Longview are $36,023, $44,835 for men and $28,438 for women, a difference of 36.6%.
| Sex | Number | Average Earnings |
| Male | 22,357 (51.5%) | $44,835 |
| Female | 21,022 (48.5%) | $28,438 |
| Total | 43,379 (100.0%) | $36,023 |
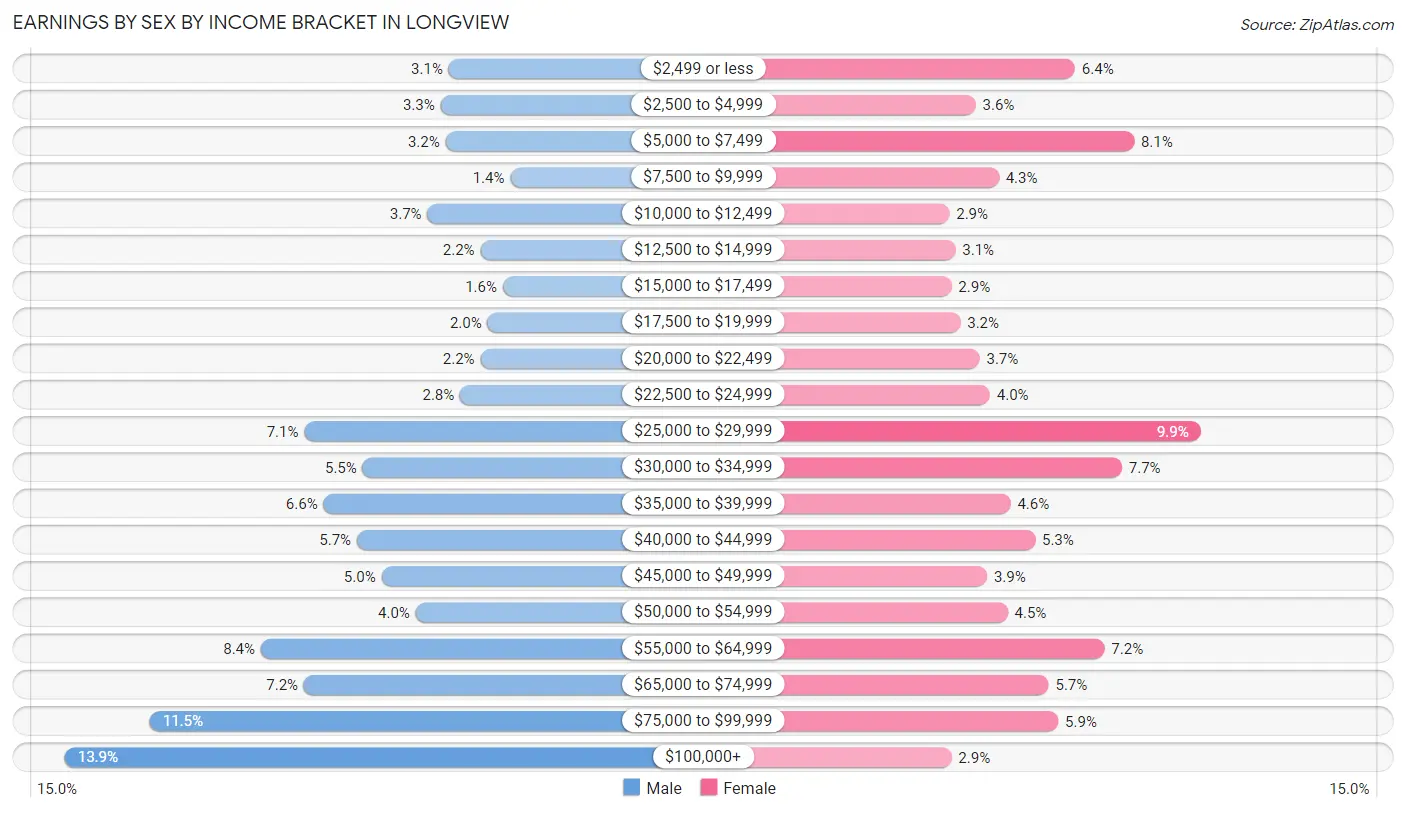
Earnings by Sex by Income Bracket in Longview
The most common earnings brackets in Longview are $100,000+ for men (3,101 | 13.9%) and $25,000 to $29,999 for women (2,089 | 9.9%).
| Income | Male | Female |
| $2,499 or less | 688 (3.1%) | 1,348 (6.4%) |
| $2,500 to $4,999 | 739 (3.3%) | 761 (3.6%) |
| $5,000 to $7,499 | 708 (3.2%) | 1,697 (8.1%) |
| $7,500 to $9,999 | 302 (1.3%) | 897 (4.3%) |
| $10,000 to $12,499 | 822 (3.7%) | 605 (2.9%) |
| $12,500 to $14,999 | 489 (2.2%) | 642 (3.0%) |
| $15,000 to $17,499 | 349 (1.6%) | 617 (2.9%) |
| $17,500 to $19,999 | 444 (2.0%) | 670 (3.2%) |
| $20,000 to $22,499 | 490 (2.2%) | 785 (3.7%) |
| $22,500 to $24,999 | 617 (2.8%) | 846 (4.0%) |
| $25,000 to $29,999 | 1,597 (7.1%) | 2,089 (9.9%) |
| $30,000 to $34,999 | 1,229 (5.5%) | 1,624 (7.7%) |
| $35,000 to $39,999 | 1,475 (6.6%) | 968 (4.6%) |
| $40,000 to $44,999 | 1,265 (5.7%) | 1,112 (5.3%) |
| $45,000 to $49,999 | 1,111 (5.0%) | 829 (3.9%) |
| $50,000 to $54,999 | 897 (4.0%) | 951 (4.5%) |
| $55,000 to $64,999 | 1,868 (8.4%) | 1,523 (7.2%) |
| $65,000 to $74,999 | 1,599 (7.1%) | 1,191 (5.7%) |
| $75,000 to $99,999 | 2,567 (11.5%) | 1,249 (5.9%) |
| $100,000+ | 3,101 (13.9%) | 618 (2.9%) |
| Total | 22,357 (100.0%) | 21,022 (100.0%) |
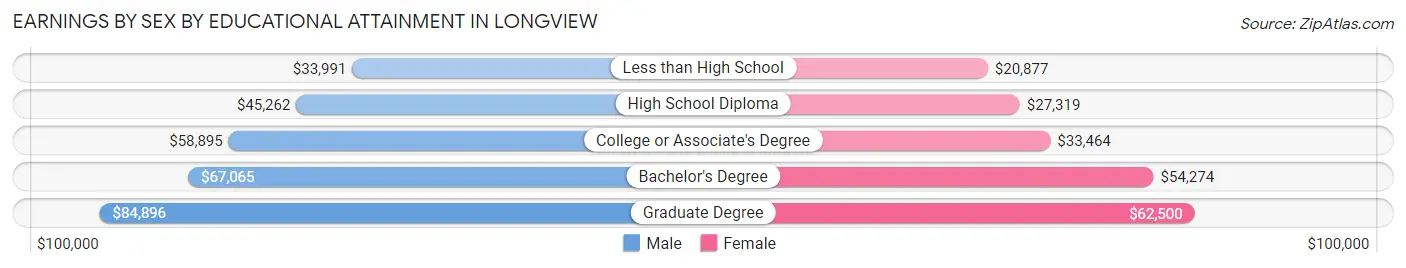
Earnings by Sex by Educational Attainment in Longview
Average earnings in Longview are $53,308 for men and $33,777 for women, a difference of 36.6%. Men with an educational attainment of graduate degree enjoy the highest average annual earnings of $84,896, while those with less than high school education earn the least with $33,991. Women with an educational attainment of graduate degree earn the most with the average annual earnings of $62,500, while those with less than high school education have the smallest earnings of $20,877.
| Educational Attainment | Male Income | Female Income |
| Less than High School | $33,991 | $20,877 |
| High School Diploma | $45,262 | $27,319 |
| College or Associate's Degree | $58,895 | $33,464 |
| Bachelor's Degree | $67,065 | $54,274 |
| Graduate Degree | $84,896 | $62,500 |
| Total | $53,308 | $33,777 |
Family Income in Longview
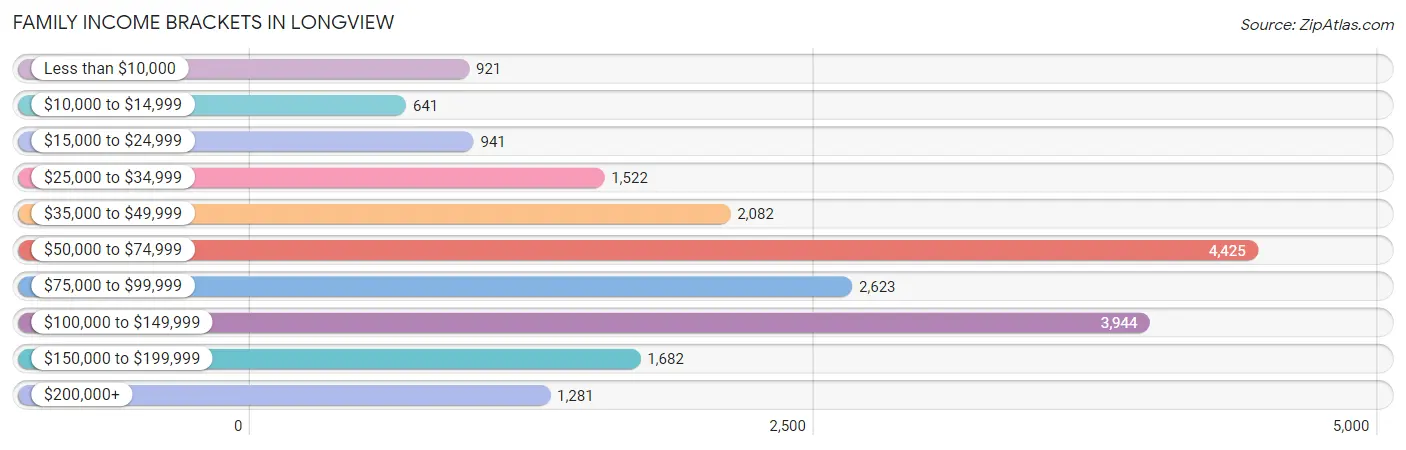
Family Income Brackets in Longview
According to the Longview family income data, there are 4,425 families falling into the $50,000 to $74,999 income range, which is the most common income bracket and makes up 22.1% of all families. Conversely, the $10,000 to $14,999 income bracket is the least frequent group with only 641 families (3.2%) belonging to this category.
| Income Bracket | # Families | % Families |
| Less than $10,000 | 921 | 4.6% |
| $10,000 to $14,999 | 641 | 3.2% |
| $15,000 to $24,999 | 941 | 4.7% |
| $25,000 to $34,999 | 1,522 | 7.6% |
| $35,000 to $49,999 | 2,082 | 10.4% |
| $50,000 to $74,999 | 4,425 | 22.1% |
| $75,000 to $99,999 | 2,623 | 13.1% |
| $100,000 to $149,999 | 3,944 | 19.7% |
| $150,000 to $199,999 | 1,682 | 8.4% |
| $200,000+ | 1,281 | 6.4% |
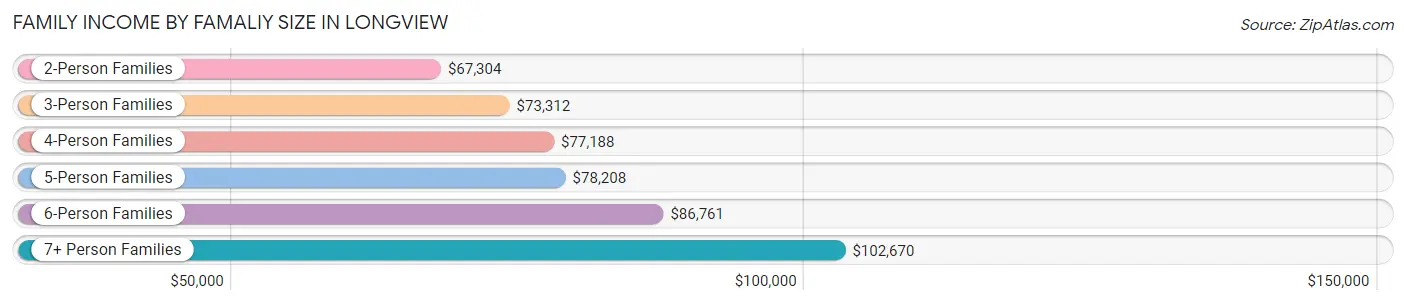
Family Income by Famaliy Size in Longview
7+ person families (376 | 1.9%) account for the highest median family income in Longview with $102,670 per family, while 2-person families (9,222 | 46.1%) have the highest median income of $33,652 per family member.
| Income Bracket | # Families | Median Income |
| 2-Person Families | 9,222 (46.1%) | $67,304 |
| 3-Person Families | 4,728 (23.6%) | $73,312 |
| 4-Person Families | 3,695 (18.4%) | $77,188 |
| 5-Person Families | 1,363 (6.8%) | $78,208 |
| 6-Person Families | 638 (3.2%) | $86,761 |
| 7+ Person Families | 376 (1.9%) | $102,670 |
| Total | 20,022 (100.0%) | $71,347 |
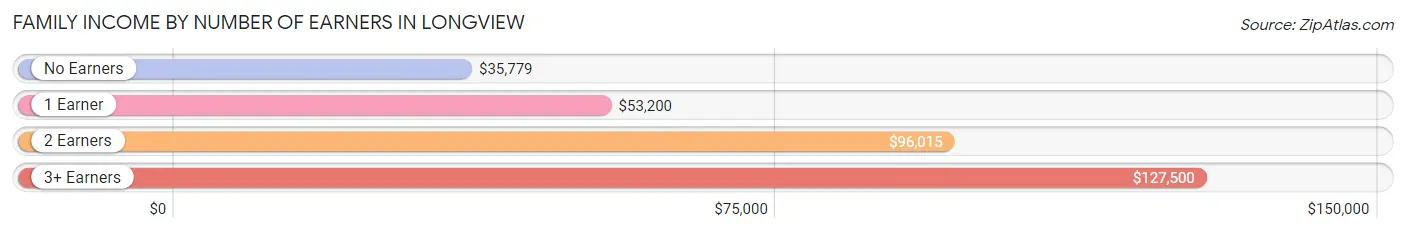
Family Income by Number of Earners in Longview
The median family income in Longview is $71,347, with families comprising 3+ earners (2,374) having the highest median family income of $127,500, while families with no earners (2,429) have the lowest median family income of $35,779, accounting for 11.9% and 12.1% of families, respectively.
| Number of Earners | # Families | Median Income |
| No Earners | 2,429 (12.1%) | $35,779 |
| 1 Earner | 7,706 (38.5%) | $53,200 |
| 2 Earners | 7,513 (37.5%) | $96,015 |
| 3+ Earners | 2,374 (11.9%) | $127,500 |
| Total | 20,022 (100.0%) | $71,347 |
Household Income in Longview
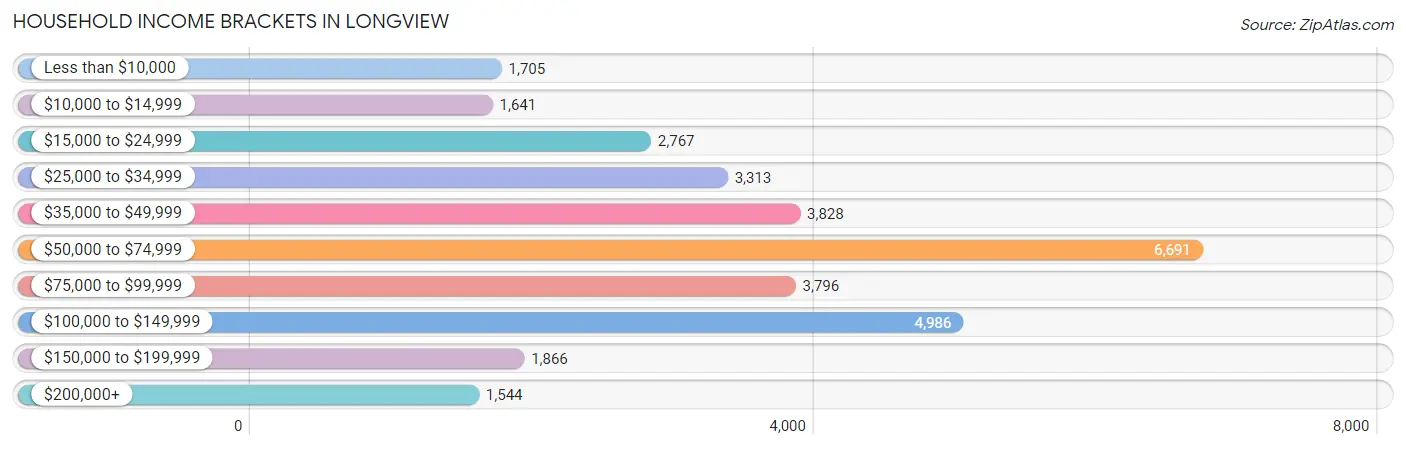
Household Income Brackets in Longview
With 6,691 households falling in the category, the $50,000 to $74,999 income range is the most frequent in Longview, accounting for 20.8% of all households. In contrast, only 1,544 households (4.8%) fall into the $200,000+ income bracket, making it the least populous group.
| Income Bracket | # Households | % Households |
| Less than $10,000 | 1,705 | 5.3% |
| $10,000 to $14,999 | 1,641 | 5.1% |
| $15,000 to $24,999 | 2,767 | 8.6% |
| $25,000 to $34,999 | 3,313 | 10.3% |
| $35,000 to $49,999 | 3,828 | 11.9% |
| $50,000 to $74,999 | 6,691 | 20.8% |
| $75,000 to $99,999 | 3,796 | 11.8% |
| $100,000 to $149,999 | 4,986 | 15.5% |
| $150,000 to $199,999 | 1,866 | 5.8% |
| $200,000+ | 1,544 | 4.8% |
Household Income by Householder Age in Longview
The median household income in Longview is $61,003, with the highest median household income of $71,273 found in the 45 to 64 years age bracket for the primary householder. A total of 11,096 households (34.5%) fall into this category. Meanwhile, the 15 to 24 years age bracket for the primary householder has the lowest median household income of $35,147, with 1,936 households (6.0%) in this group.
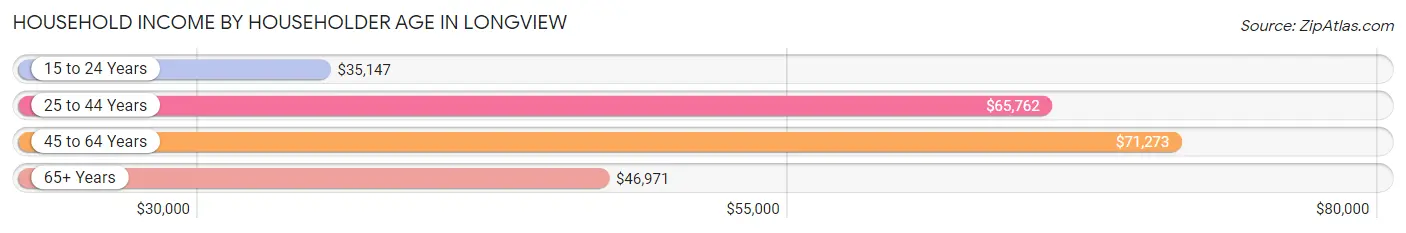
| Income Bracket | # Households | Median Income |
| 15 to 24 Years | 1,936 (6.0%) | $35,147 |
| 25 to 44 Years | 11,163 (34.7%) | $65,762 |
| 45 to 64 Years | 11,096 (34.5%) | $71,273 |
| 65+ Years | 7,974 (24.8%) | $46,971 |
| Total | 32,169 (100.0%) | $61,003 |
Poverty in Longview
Income Below Poverty by Sex and Age in Longview
With 15.0% poverty level for males and 19.1% for females among the residents of Longview, under 5 year old males and 5 year old females are the most vulnerable to poverty, with 910 males (32.4%) and 241 females (34.2%) in their respective age groups living below the poverty level.
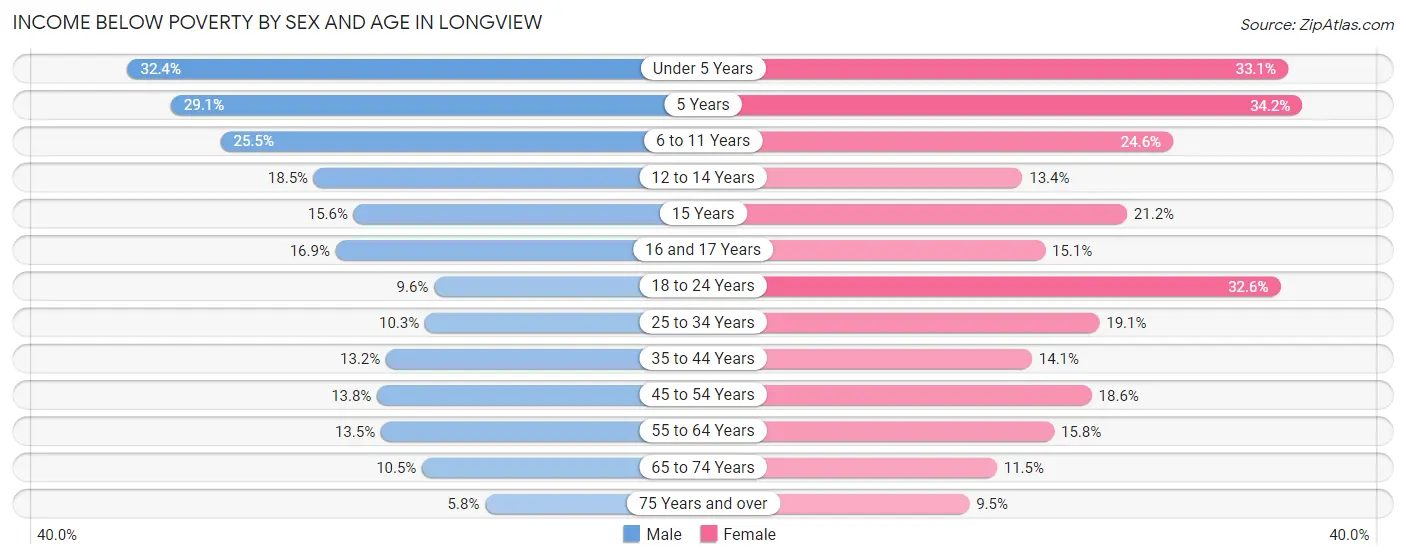
| Age Bracket | Male | Female |
| Under 5 Years | 910 (32.4%) | 797 (33.1%) |
| 5 Years | 139 (29.1%) | 241 (34.2%) |
| 6 to 11 Years | 799 (25.5%) | 793 (24.6%) |
| 12 to 14 Years | 327 (18.5%) | 247 (13.4%) |
| 15 Years | 129 (15.6%) | 98 (21.2%) |
| 16 and 17 Years | 195 (16.9%) | 180 (15.1%) |
| 18 to 24 Years | 354 (9.6%) | 1,274 (32.6%) |
| 25 to 34 Years | 586 (10.3%) | 1,143 (19.1%) |
| 35 to 44 Years | 629 (13.2%) | 676 (14.1%) |
| 45 to 54 Years | 567 (13.8%) | 838 (18.5%) |
| 55 to 64 Years | 625 (13.5%) | 780 (15.8%) |
| 65 to 74 Years | 360 (10.5%) | 454 (11.5%) |
| 75 Years and over | 97 (5.8%) | 285 (9.5%) |
| Total | 5,717 (15.0%) | 7,806 (19.1%) |
Income Above Poverty by Sex and Age in Longview
According to the poverty statistics in Longview, males aged 75 years and over and females aged 75 years and over are the age groups that are most secure financially, with 94.2% of males and 90.5% of females in these age groups living above the poverty line.
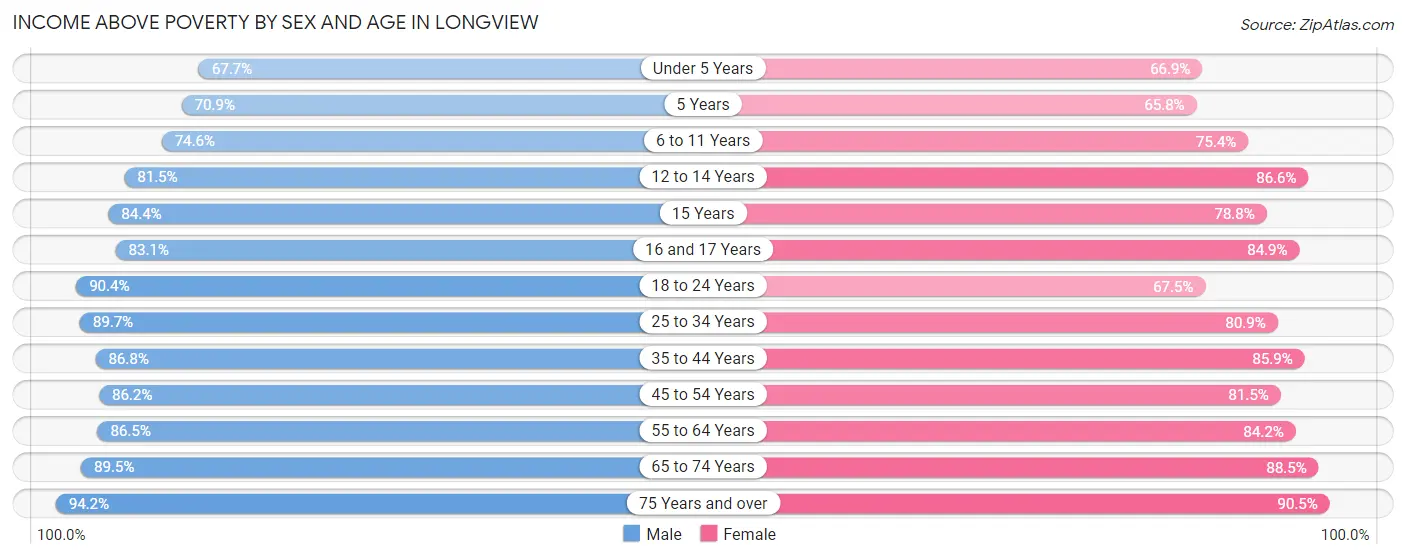
| Age Bracket | Male | Female |
| Under 5 Years | 1,903 (67.6%) | 1,610 (66.9%) |
| 5 Years | 338 (70.9%) | 464 (65.8%) |
| 6 to 11 Years | 2,340 (74.6%) | 2,433 (75.4%) |
| 12 to 14 Years | 1,439 (81.5%) | 1,596 (86.6%) |
| 15 Years | 700 (84.4%) | 365 (78.8%) |
| 16 and 17 Years | 959 (83.1%) | 1,013 (84.9%) |
| 18 to 24 Years | 3,336 (90.4%) | 2,640 (67.4%) |
| 25 to 34 Years | 5,120 (89.7%) | 4,834 (80.9%) |
| 35 to 44 Years | 4,149 (86.8%) | 4,114 (85.9%) |
| 45 to 54 Years | 3,535 (86.2%) | 3,679 (81.5%) |
| 55 to 64 Years | 3,990 (86.5%) | 4,168 (84.2%) |
| 65 to 74 Years | 3,076 (89.5%) | 3,490 (88.5%) |
| 75 Years and over | 1,576 (94.2%) | 2,728 (90.5%) |
| Total | 32,461 (85.0%) | 33,134 (80.9%) |
Income Below Poverty Among Married-Couple Families in Longview
The poverty statistics for married-couple families in Longview show that 5.5% or 744 of the total 13,456 families live below the poverty line. Families with 5 or more children have the highest poverty rate of 19.7%, comprising of 24 families. On the other hand, families with no children have the lowest poverty rate of 2.6%, which includes 201 families.
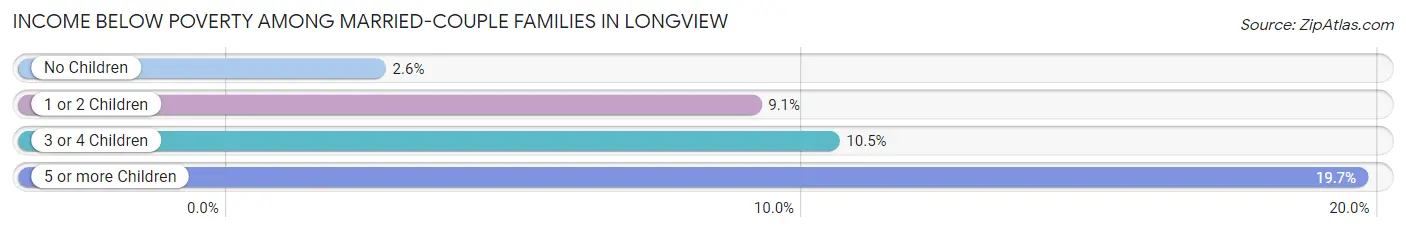
| Children | Above Poverty | Below Poverty |
| No Children | 7,630 (97.4%) | 201 (2.6%) |
| 1 or 2 Children | 3,830 (90.9%) | 384 (9.1%) |
| 3 or 4 Children | 1,154 (89.5%) | 135 (10.5%) |
| 5 or more Children | 98 (80.3%) | 24 (19.7%) |
| Total | 12,712 (94.5%) | 744 (5.5%) |
Income Below Poverty Among Single-Parent Households in Longview
According to the poverty data in Longview, 10.8% or 152 single-father households and 32.0% or 1,651 single-mother households are living below the poverty line. Among single-father households, those with 5 or more children have the highest poverty rate, with 29 households (100.0%) experiencing poverty. Likewise, among single-mother households, those with 5 or more children have the highest poverty rate, with 30 households (100.0%) falling below the poverty line.
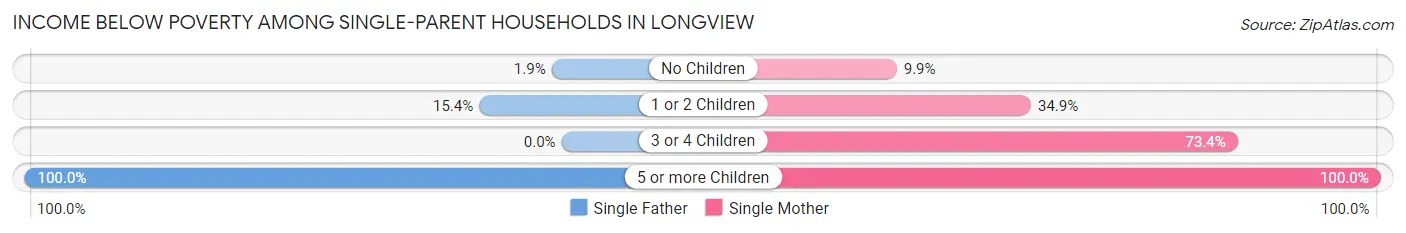
| Children | Single Father | Single Mother |
| No Children | 8 (1.9%) | 130 (9.9%) |
| 1 or 2 Children | 115 (15.3%) | 1,188 (34.9%) |
| 3 or 4 Children | 0 (0.0%) | 303 (73.4%) |
| 5 or more Children | 29 (100.0%) | 30 (100.0%) |
| Total | 152 (10.8%) | 1,651 (32.0%) |
Income Below Poverty Among Married-Couple vs Single-Parent Households in Longview
The poverty data for Longview shows that 744 of the married-couple family households (5.5%) and 1,803 of the single-parent households (27.5%) are living below the poverty level. Within the married-couple family households, those with 5 or more children have the highest poverty rate, with 24 households (19.7%) falling below the poverty line. Among the single-parent households, those with 5 or more children have the highest poverty rate, with 59 household (100.0%) living below poverty.
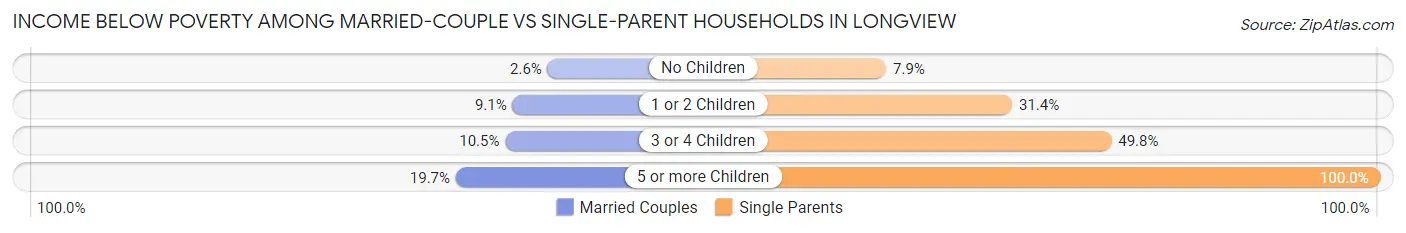
| Children | Married-Couple Families | Single-Parent Households |
| No Children | 201 (2.6%) | 138 (7.9%) |
| 1 or 2 Children | 384 (9.1%) | 1,303 (31.4%) |
| 3 or 4 Children | 135 (10.5%) | 303 (49.8%) |
| 5 or more Children | 24 (19.7%) | 59 (100.0%) |
| Total | 744 (5.5%) | 1,803 (27.5%) |
Race in Longview
The most populous races in Longview are White / Caucasian (50,895 | 61.9%), Black / African American (17,970 | 21.9%), and Hispanic or Latino (16,778 | 20.4%).
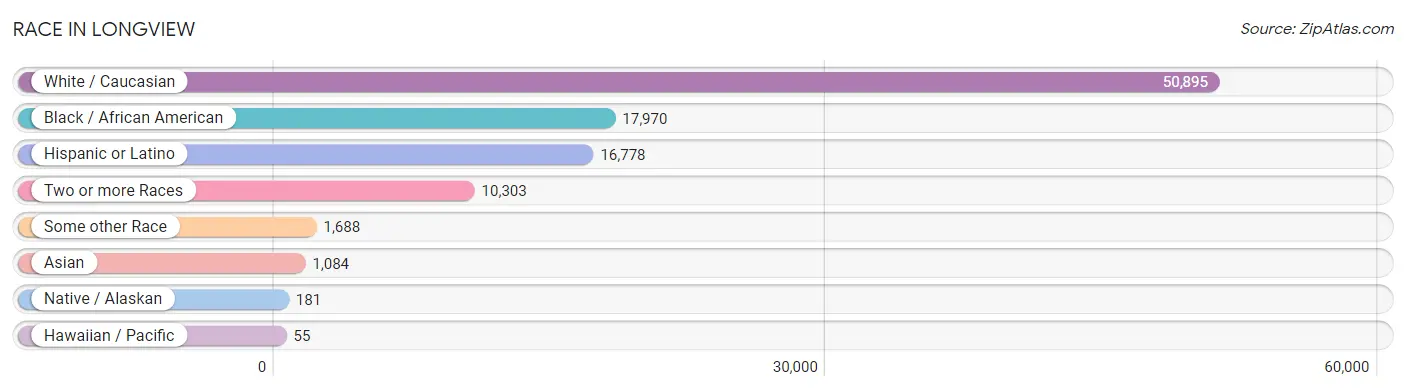
| Race | # Population | % Population |
| Asian | 1,084 | 1.3% |
| Black / African American | 17,970 | 21.9% |
| Hawaiian / Pacific | 55 | 0.1% |
| Hispanic or Latino | 16,778 | 20.4% |
| Native / Alaskan | 181 | 0.2% |
| White / Caucasian | 50,895 | 61.9% |
| Two or more Races | 10,303 | 12.5% |
| Some other Race | 1,688 | 2.1% |
| Total | 82,176 | 100.0% |
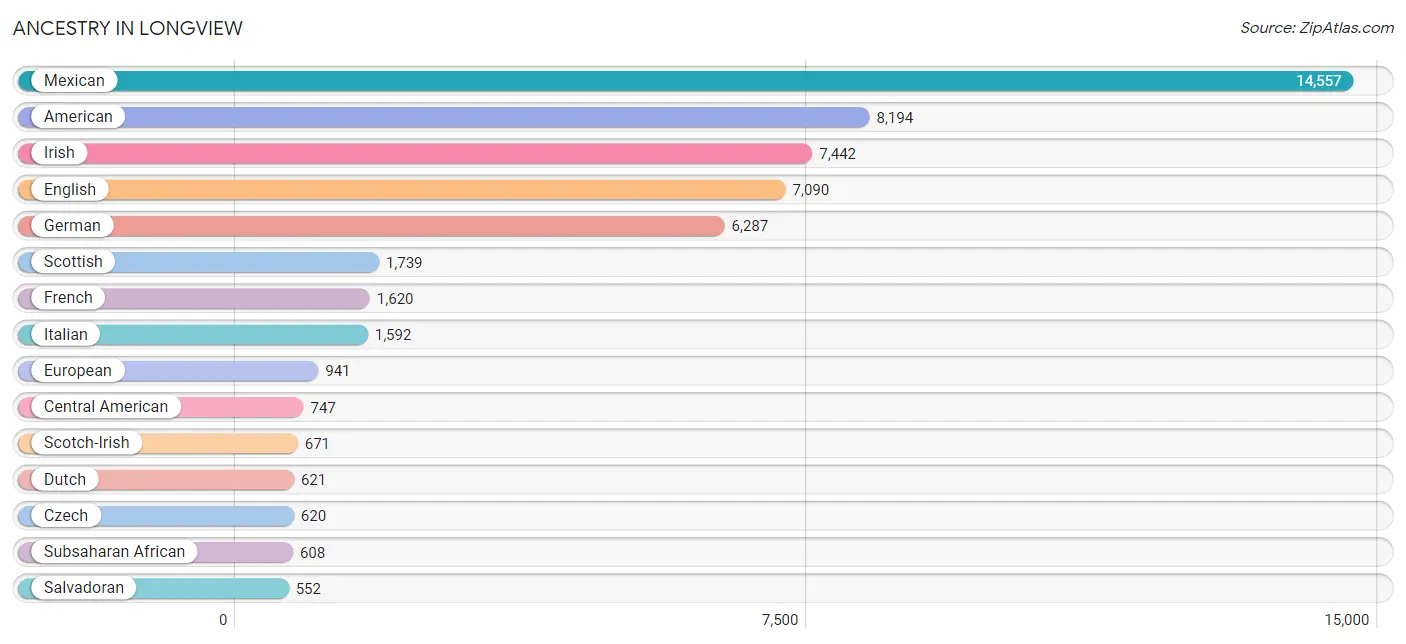
Ancestry in Longview
The most populous ancestries reported in Longview are Mexican (14,557 | 17.7%), American (8,194 | 10.0%), Irish (7,442 | 9.1%), English (7,090 | 8.6%), and German (6,287 | 7.6%), together accounting for 53.0% of all Longview residents.
| Ancestry | # Population | % Population |
| African | 428 | 0.5% |
| Albanian | 4 | 0.0% |
| American | 8,194 | 10.0% |
| Apache | 18 | 0.0% |
| Arab | 361 | 0.4% |
| Armenian | 38 | 0.1% |
| Australian | 15 | 0.0% |
| Austrian | 78 | 0.1% |
| Belgian | 14 | 0.0% |
| Bhutanese | 81 | 0.1% |
| Blackfeet | 66 | 0.1% |
| Brazilian | 68 | 0.1% |
| British | 471 | 0.6% |
| Burmese | 172 | 0.2% |
| Cambodian | 75 | 0.1% |
| Canadian | 63 | 0.1% |
| Central American | 747 | 0.9% |
| Central American Indian | 102 | 0.1% |
| Cherokee | 113 | 0.1% |
| Chickasaw | 5 | 0.0% |
| Chippewa | 2 | 0.0% |
| Choctaw | 25 | 0.0% |
| Colombian | 190 | 0.2% |
| Comanche | 12 | 0.0% |
| Costa Rican | 13 | 0.0% |
| Croatian | 26 | 0.0% |
| Crow | 45 | 0.1% |
| Cuban | 93 | 0.1% |
| Czech | 620 | 0.7% |
| Czechoslovakian | 22 | 0.0% |
| Danish | 163 | 0.2% |
| Dutch | 621 | 0.8% |
| Eastern European | 59 | 0.1% |
| Ecuadorian | 79 | 0.1% |
| English | 7,090 | 8.6% |
| European | 941 | 1.1% |
| Finnish | 7 | 0.0% |
| French | 1,620 | 2.0% |
| French Canadian | 231 | 0.3% |
| German | 6,287 | 7.6% |
| Greek | 43 | 0.1% |
| Guamanian / Chamorro | 50 | 0.1% |
| Guatemalan | 86 | 0.1% |
| Haitian | 10 | 0.0% |
| Honduran | 43 | 0.1% |
| Hungarian | 12 | 0.0% |
| Icelander | 6 | 0.0% |
| Indian (Asian) | 144 | 0.2% |
| Iranian | 28 | 0.0% |
| Irish | 7,442 | 9.1% |
| Italian | 1,592 | 1.9% |
| Jamaican | 36 | 0.0% |
| Japanese | 102 | 0.1% |
| Kenyan | 26 | 0.0% |
| Korean | 275 | 0.3% |
| Lebanese | 42 | 0.1% |
| Lithuanian | 27 | 0.0% |
| Lumbee | 5 | 0.0% |
| Luxembourger | 8 | 0.0% |
| Mexican | 14,557 | 17.7% |
| Mexican American Indian | 37 | 0.1% |
| Mongolian | 34 | 0.0% |
| Native Hawaiian | 53 | 0.1% |
| Navajo | 221 | 0.3% |
| Nicaraguan | 19 | 0.0% |
| Nigerian | 131 | 0.2% |
| Northern European | 38 | 0.1% |
| Norwegian | 286 | 0.4% |
| Pakistani | 112 | 0.1% |
| Palestinian | 138 | 0.2% |
| Panamanian | 34 | 0.0% |
| Peruvian | 16 | 0.0% |
| Polish | 466 | 0.6% |
| Portuguese | 34 | 0.0% |
| Puerto Rican | 356 | 0.4% |
| Romanian | 27 | 0.0% |
| Russian | 131 | 0.2% |
| Salvadoran | 552 | 0.7% |
| Samoan | 50 | 0.1% |
| Scandinavian | 217 | 0.3% |
| Scotch-Irish | 671 | 0.8% |
| Scottish | 1,739 | 2.1% |
| Serbian | 20 | 0.0% |
| Sioux | 22 | 0.0% |
| Slovak | 21 | 0.0% |
| Slovene | 18 | 0.0% |
| South American | 314 | 0.4% |
| Spaniard | 45 | 0.1% |
| Spanish | 238 | 0.3% |
| Sri Lankan | 218 | 0.3% |
| Subsaharan African | 608 | 0.7% |
| Swedish | 279 | 0.3% |
| Swiss | 49 | 0.1% |
| Thai | 173 | 0.2% |
| Turkish | 152 | 0.2% |
| Ukrainian | 8 | 0.0% |
| Venezuelan | 29 | 0.0% |
| Welsh | 365 | 0.4% |
| West Indian | 10 | 0.0% | View All 99 Rows |
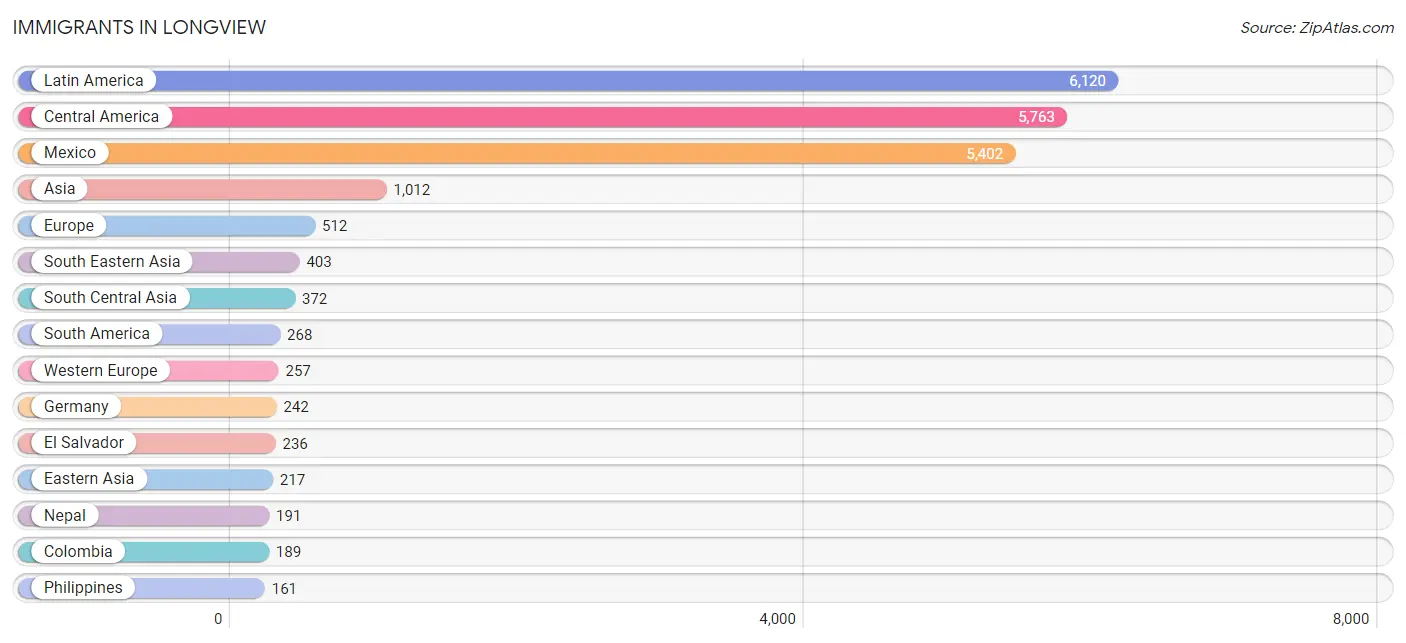
Immigrants in Longview
The most numerous immigrant groups reported in Longview came from Latin America (6,120 | 7.4%), Central America (5,763 | 7.0%), Mexico (5,402 | 6.6%), Asia (1,012 | 1.2%), and Europe (512 | 0.6%), together accounting for 22.9% of all Longview residents.
| Immigration Origin | # Population | % Population |
| Africa | 150 | 0.2% |
| Albania | 1 | 0.0% |
| Asia | 1,012 | 1.2% |
| Australia | 12 | 0.0% |
| Bangladesh | 40 | 0.1% |
| Bolivia | 3 | 0.0% |
| Brazil | 18 | 0.0% |
| Cambodia | 52 | 0.1% |
| Cameroon | 16 | 0.0% |
| Canada | 136 | 0.2% |
| Caribbean | 89 | 0.1% |
| Central America | 5,763 | 7.0% |
| China | 59 | 0.1% |
| Colombia | 189 | 0.2% |
| Costa Rica | 13 | 0.0% |
| Cuba | 63 | 0.1% |
| Denmark | 27 | 0.0% |
| Eastern Africa | 26 | 0.0% |
| Eastern Asia | 217 | 0.3% |
| Eastern Europe | 141 | 0.2% |
| Ecuador | 42 | 0.1% |
| El Salvador | 236 | 0.3% |
| England | 38 | 0.1% |
| Europe | 512 | 0.6% |
| Germany | 242 | 0.3% |
| Honduras | 43 | 0.1% |
| Hong Kong | 11 | 0.0% |
| India | 58 | 0.1% |
| Iran | 28 | 0.0% |
| Italy | 4 | 0.0% |
| Jamaica | 26 | 0.0% |
| Japan | 18 | 0.0% |
| Kenya | 26 | 0.0% |
| Korea | 65 | 0.1% |
| Latin America | 6,120 | 7.4% |
| Lithuania | 27 | 0.0% |
| Malaysia | 18 | 0.0% |
| Mexico | 5,402 | 6.6% |
| Middle Africa | 16 | 0.0% |
| Nepal | 191 | 0.2% |
| Netherlands | 15 | 0.0% |
| Nigeria | 105 | 0.1% |
| Northern Europe | 72 | 0.1% |
| Oceania | 12 | 0.0% |
| Pakistan | 35 | 0.0% |
| Panama | 69 | 0.1% |
| Philippines | 161 | 0.2% |
| Poland | 37 | 0.1% |
| Romania | 7 | 0.0% |
| Russia | 15 | 0.0% |
| Serbia | 46 | 0.1% |
| South Africa | 3 | 0.0% |
| South America | 268 | 0.3% |
| South Central Asia | 372 | 0.4% |
| South Eastern Asia | 403 | 0.5% |
| Southern Europe | 42 | 0.1% |
| Spain | 38 | 0.1% |
| Taiwan | 14 | 0.0% |
| Thailand | 26 | 0.0% |
| Ukraine | 8 | 0.0% |
| Venezuela | 16 | 0.0% |
| Vietnam | 146 | 0.2% |
| Western Africa | 105 | 0.1% |
| Western Europe | 257 | 0.3% | View All 64 Rows |
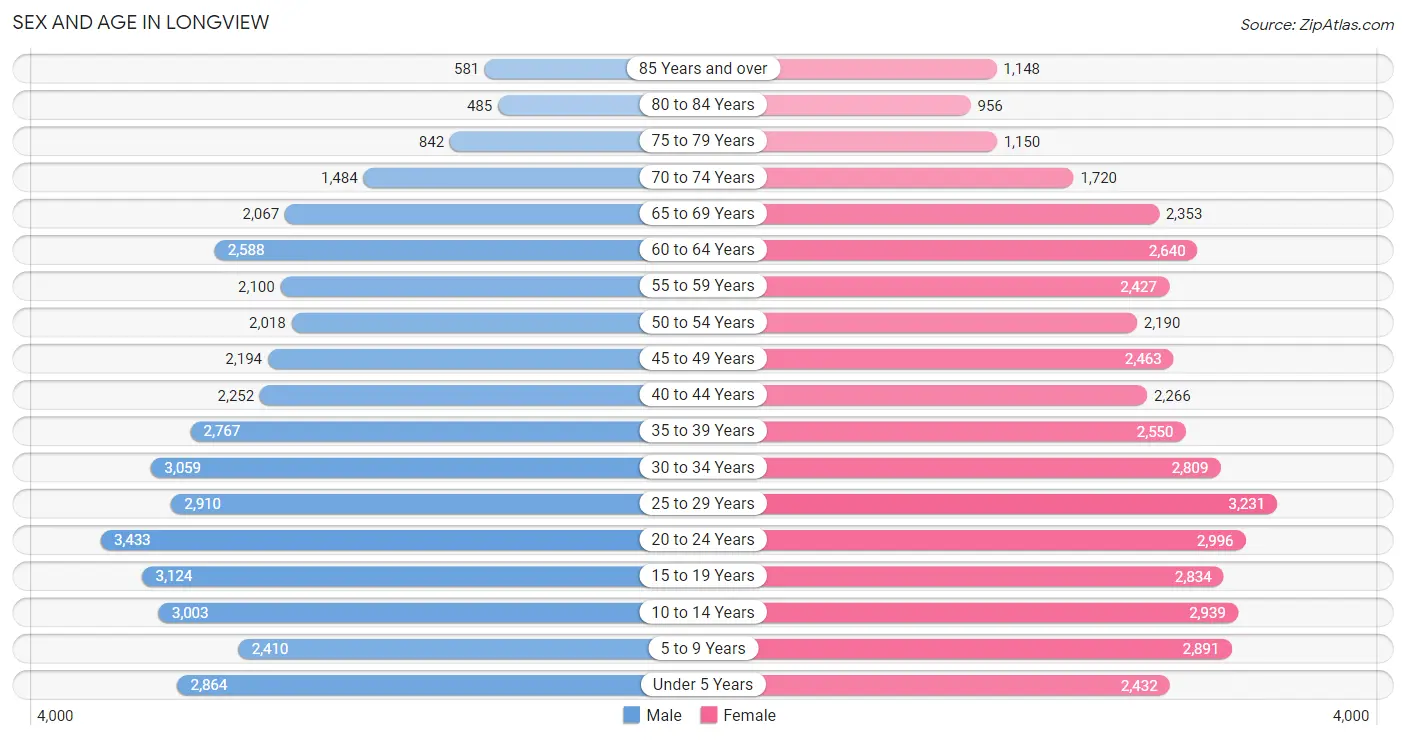
Sex and Age in Longview
Sex and Age in Longview
The most populous age groups in Longview are 20 to 24 Years (3,433 | 8.5%) for men and 25 to 29 Years (3,231 | 7.7%) for women.
| Age Bracket | Male | Female |
| Under 5 Years | 2,864 (7.1%) | 2,432 (5.8%) |
| 5 to 9 Years | 2,410 (6.0%) | 2,891 (6.9%) |
| 10 to 14 Years | 3,003 (7.5%) | 2,939 (7.0%) |
| 15 to 19 Years | 3,124 (7.8%) | 2,834 (6.8%) |
| 20 to 24 Years | 3,433 (8.5%) | 2,996 (7.1%) |
| 25 to 29 Years | 2,910 (7.2%) | 3,231 (7.7%) |
| 30 to 34 Years | 3,059 (7.6%) | 2,809 (6.7%) |
| 35 to 39 Years | 2,767 (6.9%) | 2,550 (6.1%) |
| 40 to 44 Years | 2,252 (5.6%) | 2,266 (5.4%) |
| 45 to 49 Years | 2,194 (5.5%) | 2,463 (5.9%) |
| 50 to 54 Years | 2,018 (5.0%) | 2,190 (5.2%) |
| 55 to 59 Years | 2,100 (5.2%) | 2,427 (5.8%) |
| 60 to 64 Years | 2,588 (6.4%) | 2,640 (6.3%) |
| 65 to 69 Years | 2,067 (5.1%) | 2,353 (5.6%) |
| 70 to 74 Years | 1,484 (3.7%) | 1,720 (4.1%) |
| 75 to 79 Years | 842 (2.1%) | 1,150 (2.7%) |
| 80 to 84 Years | 485 (1.2%) | 956 (2.3%) |
| 85 Years and over | 581 (1.5%) | 1,148 (2.7%) |
| Total | 40,181 (100.0%) | 41,995 (100.0%) |
Families and Households in Longview
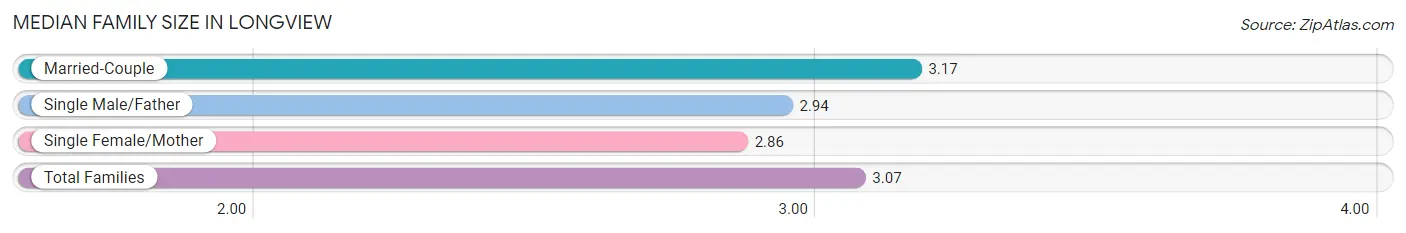
Median Family Size in Longview
The median family size in Longview is 3.07 persons per family, with married-couple families (13,456 | 67.2%) accounting for the largest median family size of 3.17 persons per family. On the other hand, single female/mother families (5,162 | 25.8%) represent the smallest median family size with 2.86 persons per family.
| Family Type | # Families | Family Size |
| Married-Couple | 13,456 (67.2%) | 3.17 |
| Single Male/Father | 1,404 (7.0%) | 2.94 |
| Single Female/Mother | 5,162 (25.8%) | 2.86 |
| Total Families | 20,022 (100.0%) | 3.07 |
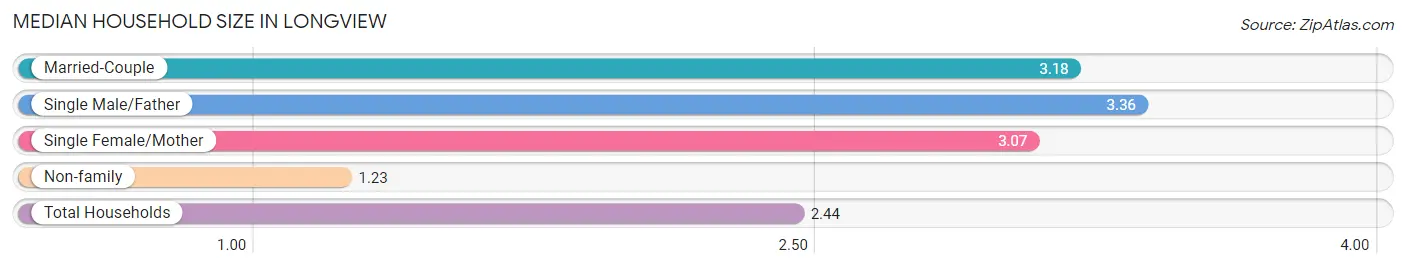
Median Household Size in Longview
The median household size in Longview is 2.44 persons per household, with single male/father households (1,404 | 4.4%) accounting for the largest median household size of 3.36 persons per household. non-family households (12,147 | 37.8%) represent the smallest median household size with 1.23 persons per household.
| Household Type | # Households | Household Size |
| Married-Couple | 13,456 (41.8%) | 3.18 |
| Single Male/Father | 1,404 (4.4%) | 3.36 |
| Single Female/Mother | 5,162 (16.1%) | 3.07 |
| Non-family | 12,147 (37.8%) | 1.23 |
| Total Households | 32,169 (100.0%) | 2.44 |
Household Size by Marriage Status in Longview
Out of a total of 32,169 households in Longview, 20,022 (62.2%) are family households, while 12,147 (37.8%) are nonfamily households. The most numerous type of family households are 2-person households, comprising 8,627, and the most common type of nonfamily households are 1-person households, comprising 9,769.
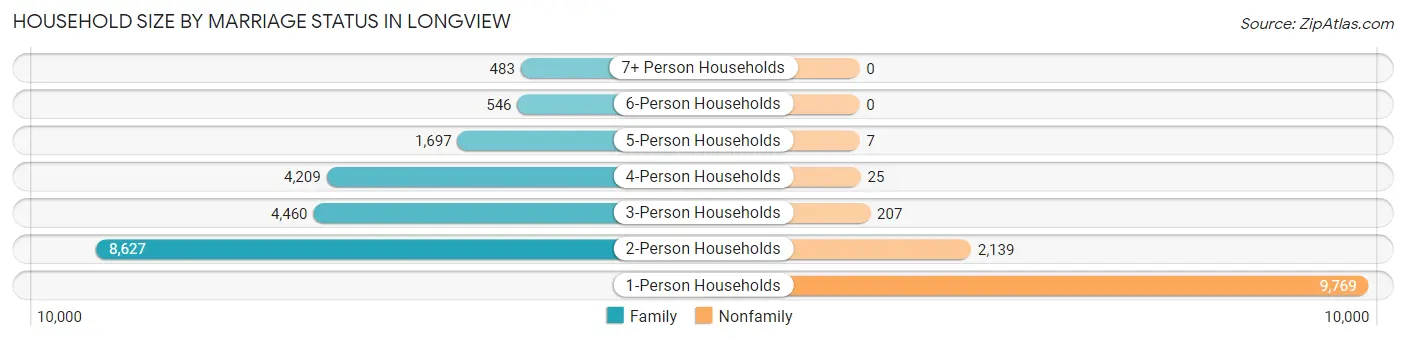
| Household Size | Family Households | Nonfamily Households |
| 1-Person Households | - | 9,769 (30.4%) |
| 2-Person Households | 8,627 (26.8%) | 2,139 (6.7%) |
| 3-Person Households | 4,460 (13.9%) | 207 (0.6%) |
| 4-Person Households | 4,209 (13.1%) | 25 (0.1%) |
| 5-Person Households | 1,697 (5.3%) | 7 (0.0%) |
| 6-Person Households | 546 (1.7%) | 0 (0.0%) |
| 7+ Person Households | 483 (1.5%) | 0 (0.0%) |
| Total | 20,022 (62.2%) | 12,147 (37.8%) |
Female Fertility in Longview
Fertility by Age in Longview
Average fertility rate in Longview is 45.0 births per 1,000 women. Women in the age bracket of 20 to 34 years have the highest fertility rate with 82.0 births per 1,000 women. Women in the age bracket of 20 to 34 years acount for 84.6% of all women with births.
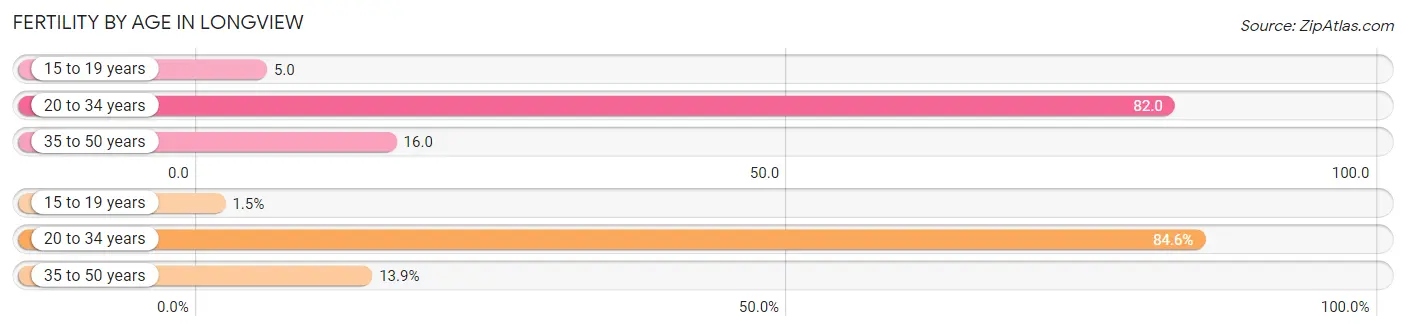
| Age Bracket | Women with Births | Births / 1,000 Women |
| 15 to 19 years | 13 (1.5%) | 5.0 |
| 20 to 34 years | 741 (84.6%) | 82.0 |
| 35 to 50 years | 122 (13.9%) | 16.0 |
| Total | 876 (100.0%) | 45.0 |
Fertility by Age by Marriage Status in Longview
49.2% of women with births (876) in Longview are married. The highest percentage of unmarried women with births falls into 15 to 19 years age bracket with 100.0% of them unmarried at the time of birth, while the lowest percentage of unmarried women with births belong to 35 to 50 years age bracket with 47.5% of them unmarried.
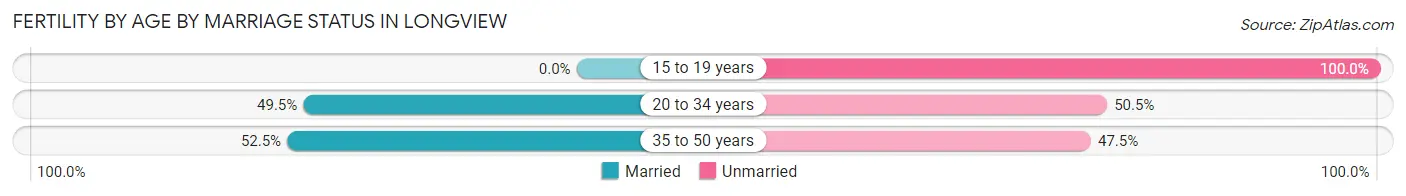
| Age Bracket | Married | Unmarried |
| 15 to 19 years | 0 (0.0%) | 13 (100.0%) |
| 20 to 34 years | 367 (49.5%) | 374 (50.5%) |
| 35 to 50 years | 64 (52.5%) | 58 (47.5%) |
| Total | 431 (49.2%) | 445 (50.8%) |
Fertility by Education in Longview
Average fertility rate in Longview is 45.0 births per 1,000 women. Women with the education attainment of graduate degree have the highest fertility rate of 74.0 births per 1,000 women, while women with the education attainment of less than high school have the lowest fertility at 14.0 births per 1,000 women. Women with the education attainment of college or associate's degree represent 53.9% of all women with births.
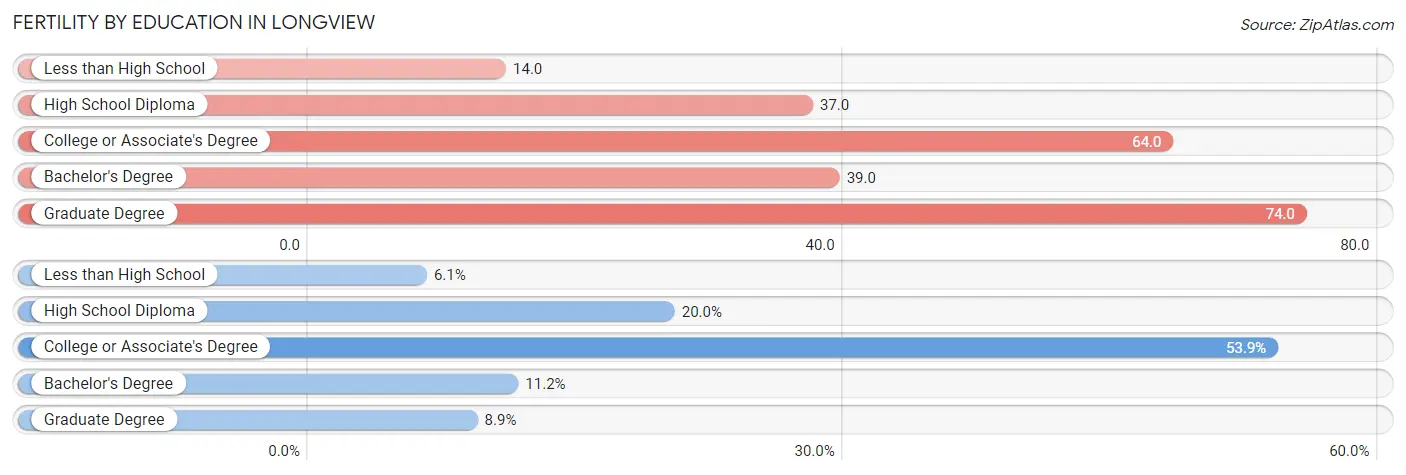
| Educational Attainment | Women with Births | Births / 1,000 Women |
| Less than High School | 53 (6.0%) | 14.0 |
| High School Diploma | 175 (20.0%) | 37.0 |
| College or Associate's Degree | 472 (53.9%) | 64.0 |
| Bachelor's Degree | 98 (11.2%) | 39.0 |
| Graduate Degree | 78 (8.9%) | 74.0 |
| Total | 876 (100.0%) | 45.0 |
Fertility by Education by Marriage Status in Longview
50.8% of women with births in Longview are unmarried. Women with the educational attainment of bachelor's degree are most likely to be married with 100.0% of them married at childbirth, while women with the educational attainment of less than high school are least likely to be married with 100.0% of them unmarried at childbirth.
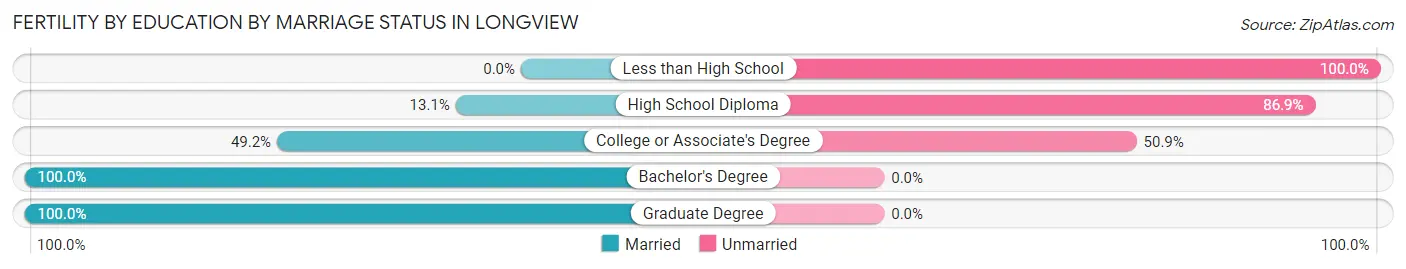
| Educational Attainment | Married | Unmarried |
| Less than High School | 0 (0.0%) | 53 (100.0%) |
| High School Diploma | 23 (13.1%) | 152 (86.9%) |
| College or Associate's Degree | 232 (49.1%) | 240 (50.8%) |
| Bachelor's Degree | 98 (100.0%) | 0 (0.0%) |
| Graduate Degree | 78 (100.0%) | 0 (0.0%) |
| Total | 431 (49.2%) | 445 (50.8%) |
Employment Characteristics in Longview
Employment by Class of Employer in Longview
Among the 38,198 employed individuals in Longview, private company employees (27,698 | 72.5%), not-for-profit organizations (2,963 | 7.8%), and self-employed (not incorporated) (2,233 | 5.9%) make up the most common classes of employment.
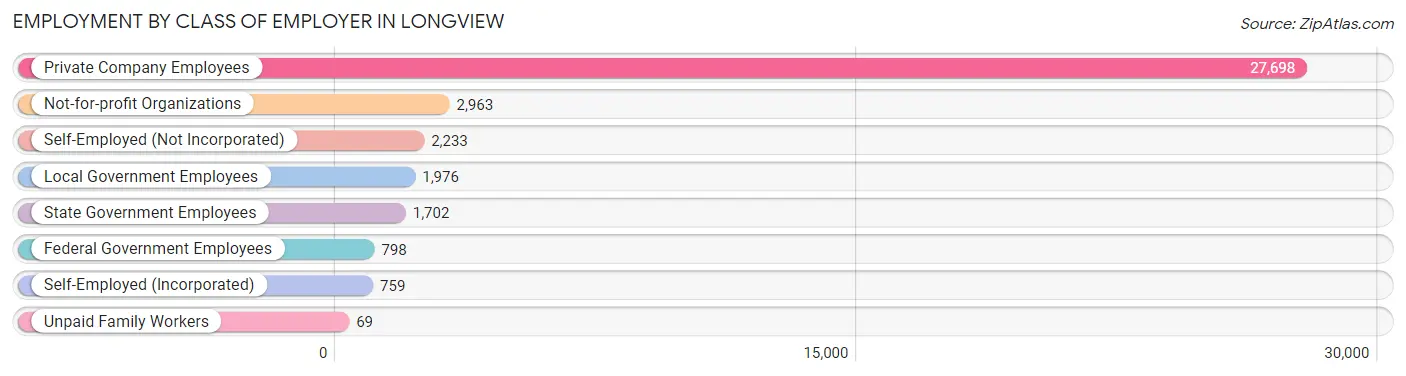
| Employer Class | # Employees | % Employees |
| Private Company Employees | 27,698 | 72.5% |
| Self-Employed (Incorporated) | 759 | 2.0% |
| Self-Employed (Not Incorporated) | 2,233 | 5.9% |
| Not-for-profit Organizations | 2,963 | 7.8% |
| Local Government Employees | 1,976 | 5.2% |
| State Government Employees | 1,702 | 4.5% |
| Federal Government Employees | 798 | 2.1% |
| Unpaid Family Workers | 69 | 0.2% |
| Total | 38,198 | 100.0% |
Employment Status by Age in Longview
According to the labor force statistics for Longview, out of the total population over 16 years of age (64,344), 62.1% or 39,958 individuals are in the labor force, with 3.5% or 1,399 of them unemployed. The age group with the highest labor force participation rate is 25 to 29 years, with 84.4% or 5,183 individuals in the labor force. Within the labor force, the 75 years and over age range has the highest percentage of unemployed individuals, with 7.7% or 30 of them being unemployed.
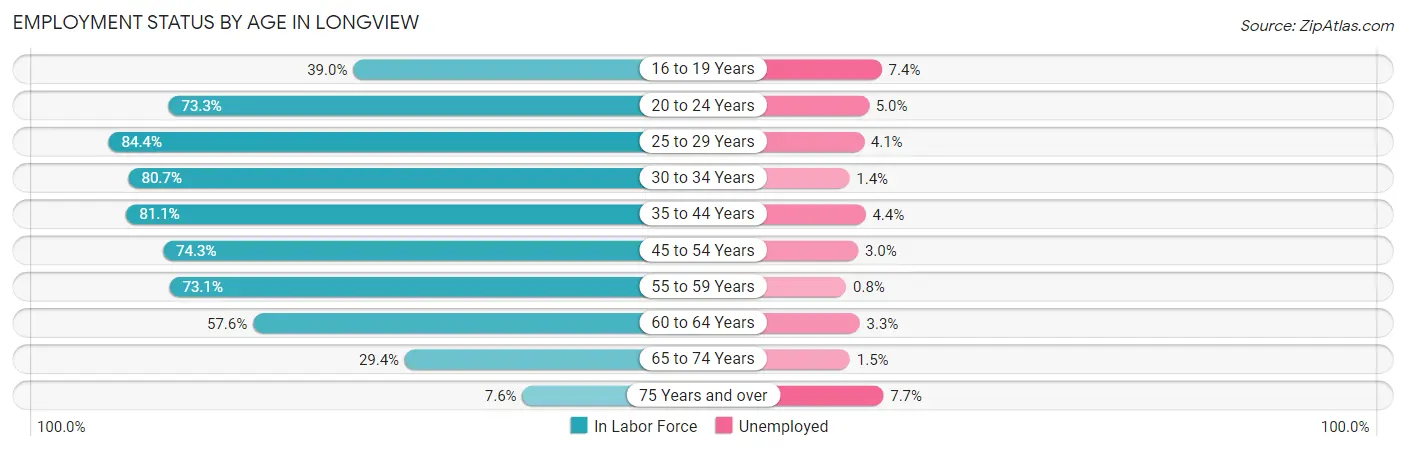
| Age Bracket | In Labor Force | Unemployed |
| 16 to 19 Years | 1,819 (39.0%) | 135 (7.4%) |
| 20 to 24 Years | 4,712 (73.3%) | 236 (5.0%) |
| 25 to 29 Years | 5,183 (84.4%) | 213 (4.1%) |
| 30 to 34 Years | 4,735 (80.7%) | 66 (1.4%) |
| 35 to 44 Years | 7,976 (81.1%) | 351 (4.4%) |
| 45 to 54 Years | 6,587 (74.3%) | 198 (3.0%) |
| 55 to 59 Years | 3,309 (73.1%) | 26 (0.8%) |
| 60 to 64 Years | 3,011 (57.6%) | 99 (3.3%) |
| 65 to 74 Years | 2,241 (29.4%) | 34 (1.5%) |
| 75 Years and over | 392 (7.6%) | 30 (7.7%) |
| Total | 39,958 (62.1%) | 1,399 (3.5%) |
Employment Status by Educational Attainment in Longview
According to labor force statistics for Longview, 76.1% of individuals (30,793) out of the total population between 25 and 64 years of age (40,464) are in the labor force, with 3.1% or 955 of them being unemployed. The group with the highest labor force participation rate are those with the educational attainment of bachelor's degree or higher, with 86.5% or 7,674 individuals in the labor force. Within the labor force, individuals with less than high school education have the highest percentage of unemployment, with 4.4% or 150 of them being unemployed.
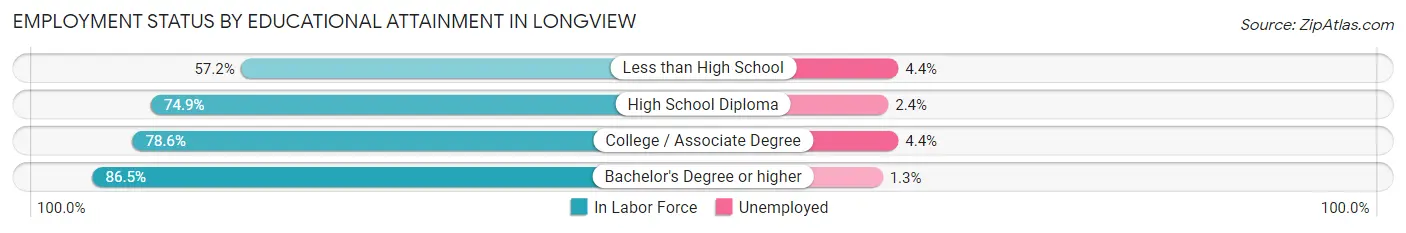
| Educational Attainment | In Labor Force | Unemployed |
| Less than High School | 3,417 (57.2%) | 263 (4.4%) |
| High School Diploma | 8,392 (74.9%) | 269 (2.4%) |
| College / Associate Degree | 11,330 (78.6%) | 634 (4.4%) |
| Bachelor's Degree or higher | 7,674 (86.5%) | 115 (1.3%) |
| Total | 30,793 (76.1%) | 1,254 (3.1%) |
Employment Occupations by Sex in Longview
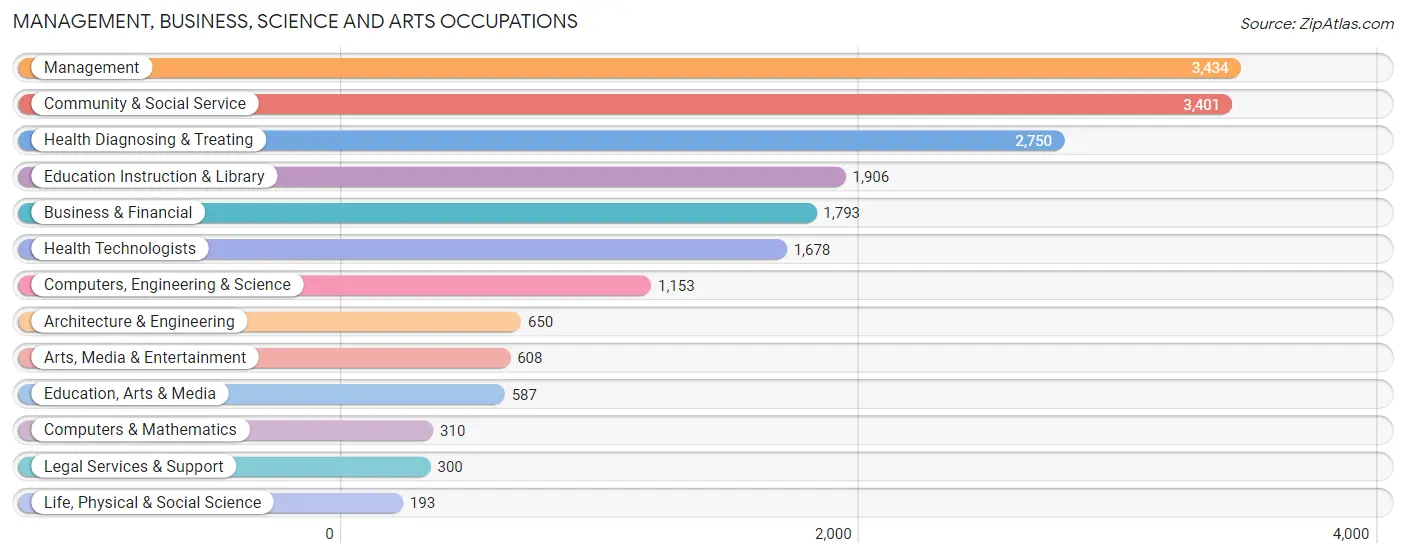
Management, Business, Science and Arts Occupations
The most common Management, Business, Science and Arts occupations in Longview are Management (3,434 | 8.9%), Community & Social Service (3,401 | 8.8%), Health Diagnosing & Treating (2,750 | 7.1%), Education Instruction & Library (1,906 | 4.9%), and Business & Financial (1,793 | 4.6%).
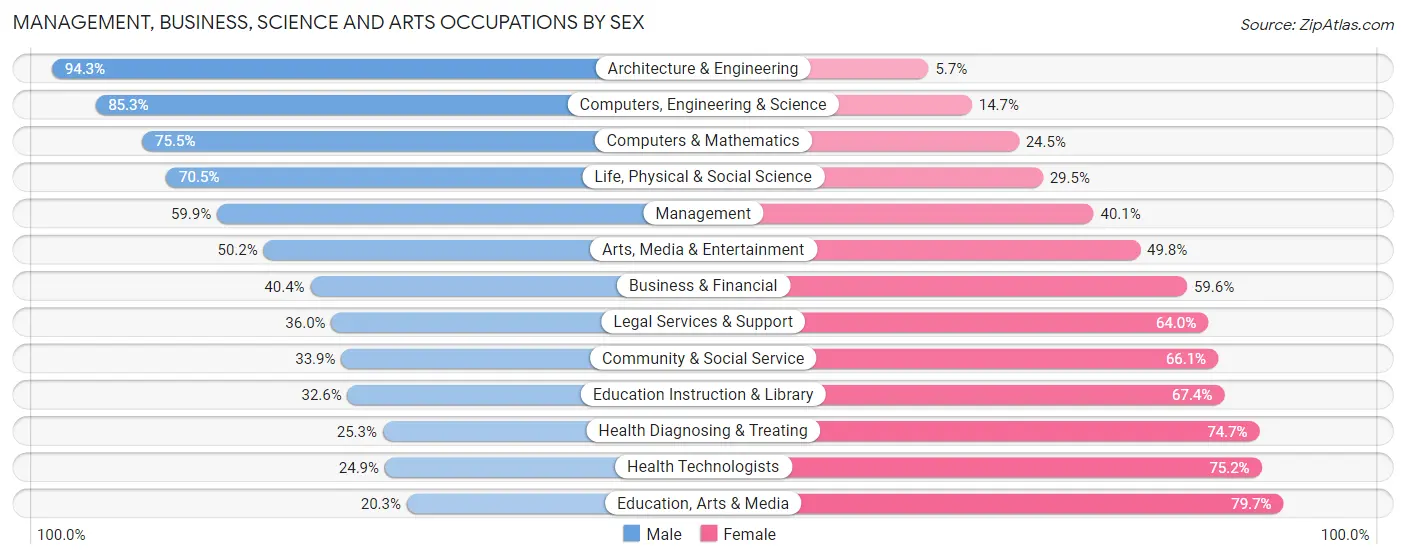
Management, Business, Science and Arts Occupations by Sex
Within the Management, Business, Science and Arts occupations in Longview, the most male-oriented occupations are Architecture & Engineering (94.3%), Computers, Engineering & Science (85.3%), and Computers & Mathematics (75.5%), while the most female-oriented occupations are Education, Arts & Media (79.7%), Health Technologists (75.1%), and Health Diagnosing & Treating (74.7%).
| Occupation | Male | Female |
| Management | 2,056 (59.9%) | 1,378 (40.1%) |
| Business & Financial | 724 (40.4%) | 1,069 (59.6%) |
| Computers, Engineering & Science | 983 (85.3%) | 170 (14.7%) |
| Computers & Mathematics | 234 (75.5%) | 76 (24.5%) |
| Architecture & Engineering | 613 (94.3%) | 37 (5.7%) |
| Life, Physical & Social Science | 136 (70.5%) | 57 (29.5%) |
| Community & Social Service | 1,154 (33.9%) | 2,247 (66.1%) |
| Education, Arts & Media | 119 (20.3%) | 468 (79.7%) |
| Legal Services & Support | 108 (36.0%) | 192 (64.0%) |
| Education Instruction & Library | 622 (32.6%) | 1,284 (67.4%) |
| Arts, Media & Entertainment | 305 (50.2%) | 303 (49.8%) |
| Health Diagnosing & Treating | 695 (25.3%) | 2,055 (74.7%) |
| Health Technologists | 417 (24.8%) | 1,261 (75.1%) |
| Total (Category) | 5,612 (44.8%) | 6,919 (55.2%) |
| Total (Overall) | 20,136 (52.2%) | 18,446 (47.8%) |
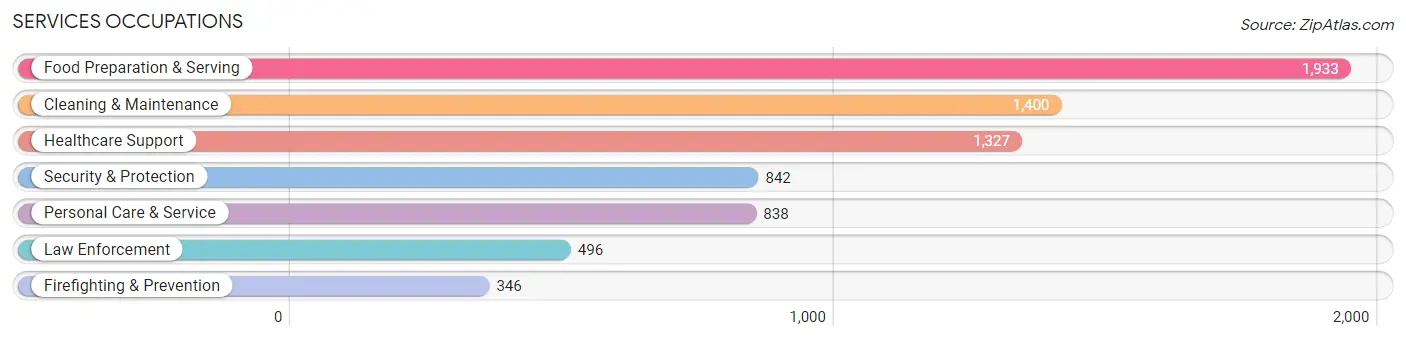
Services Occupations
The most common Services occupations in Longview are Food Preparation & Serving (1,933 | 5.0%), Cleaning & Maintenance (1,400 | 3.6%), Healthcare Support (1,327 | 3.4%), Security & Protection (842 | 2.2%), and Personal Care & Service (838 | 2.2%).
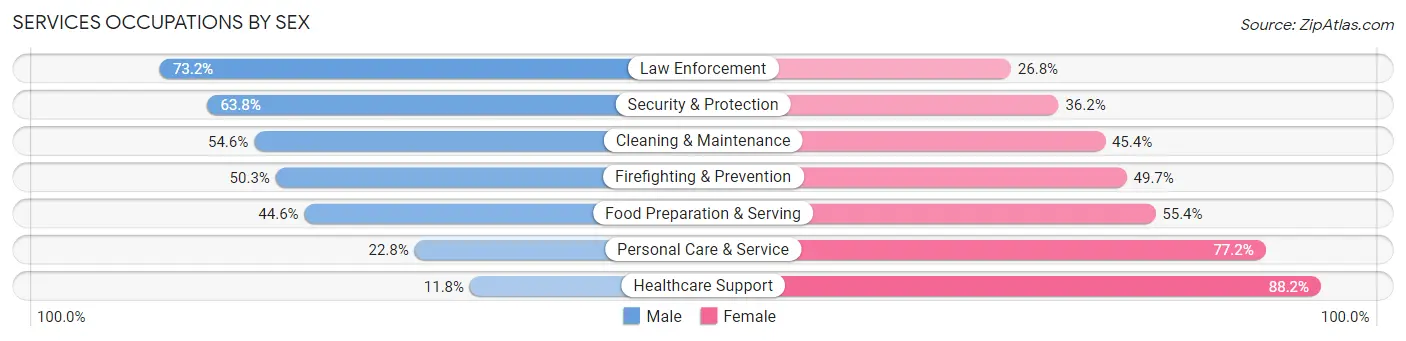
Services Occupations by Sex
Within the Services occupations in Longview, the most male-oriented occupations are Law Enforcement (73.2%), Security & Protection (63.8%), and Cleaning & Maintenance (54.6%), while the most female-oriented occupations are Healthcare Support (88.2%), Personal Care & Service (77.2%), and Food Preparation & Serving (55.4%).
| Occupation | Male | Female |
| Healthcare Support | 157 (11.8%) | 1,170 (88.2%) |
| Security & Protection | 537 (63.8%) | 305 (36.2%) |
| Firefighting & Prevention | 174 (50.3%) | 172 (49.7%) |
| Law Enforcement | 363 (73.2%) | 133 (26.8%) |
| Food Preparation & Serving | 862 (44.6%) | 1,071 (55.4%) |
| Cleaning & Maintenance | 764 (54.6%) | 636 (45.4%) |
| Personal Care & Service | 191 (22.8%) | 647 (77.2%) |
| Total (Category) | 2,511 (39.6%) | 3,829 (60.4%) |
| Total (Overall) | 20,136 (52.2%) | 18,446 (47.8%) |
Sales and Office Occupations
The most common Sales and Office occupations in Longview are Office & Administration (4,857 | 12.6%), and Sales & Related (4,318 | 11.2%).

Sales and Office Occupations by Sex

| Occupation | Male | Female |
| Sales & Related | 2,023 (46.9%) | 2,295 (53.1%) |
| Office & Administration | 905 (18.6%) | 3,952 (81.4%) |
| Total (Category) | 2,928 (31.9%) | 6,247 (68.1%) |
| Total (Overall) | 20,136 (52.2%) | 18,446 (47.8%) |
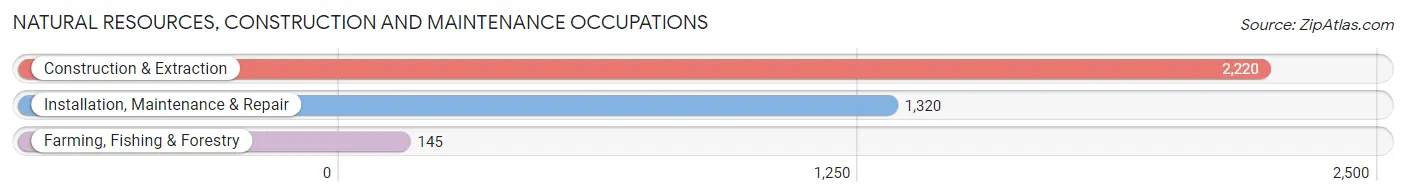
Natural Resources, Construction and Maintenance Occupations
The most common Natural Resources, Construction and Maintenance occupations in Longview are Construction & Extraction (2,220 | 5.8%), Installation, Maintenance & Repair (1,320 | 3.4%), and Farming, Fishing & Forestry (145 | 0.4%).
Natural Resources, Construction and Maintenance Occupations by Sex

| Occupation | Male | Female |
| Farming, Fishing & Forestry | 145 (100.0%) | 0 (0.0%) |
| Construction & Extraction | 2,158 (97.2%) | 62 (2.8%) |
| Installation, Maintenance & Repair | 1,320 (100.0%) | 0 (0.0%) |
| Total (Category) | 3,623 (98.3%) | 62 (1.7%) |
| Total (Overall) | 20,136 (52.2%) | 18,446 (47.8%) |
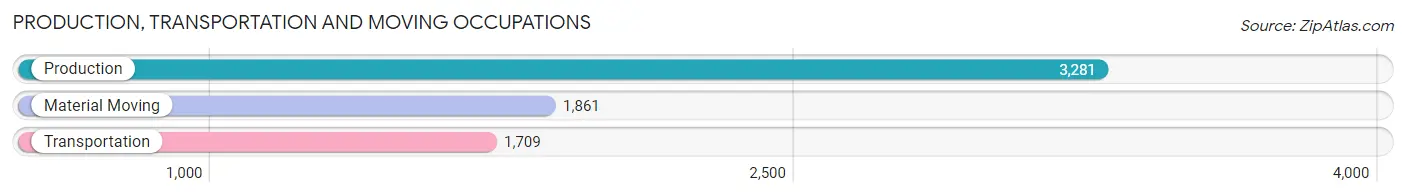
Production, Transportation and Moving Occupations
The most common Production, Transportation and Moving occupations in Longview are Production (3,281 | 8.5%), Material Moving (1,861 | 4.8%), and Transportation (1,709 | 4.4%).
Production, Transportation and Moving Occupations by Sex
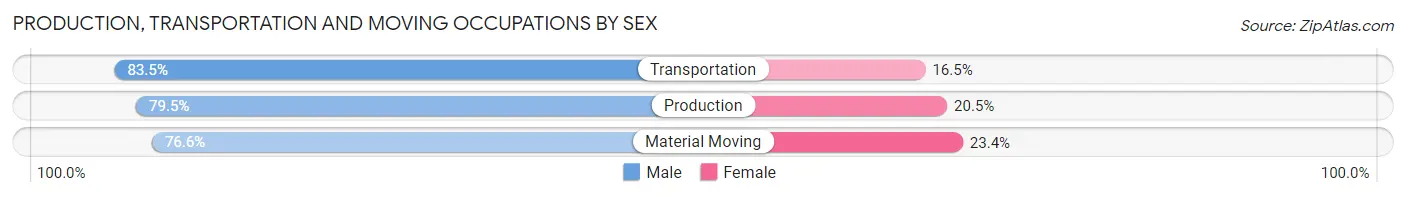
| Occupation | Male | Female |
| Production | 2,609 (79.5%) | 672 (20.5%) |
| Transportation | 1,427 (83.5%) | 282 (16.5%) |
| Material Moving | 1,426 (76.6%) | 435 (23.4%) |
| Total (Category) | 5,462 (79.7%) | 1,389 (20.3%) |
| Total (Overall) | 20,136 (52.2%) | 18,446 (47.8%) |
Employment Industries by Sex in Longview
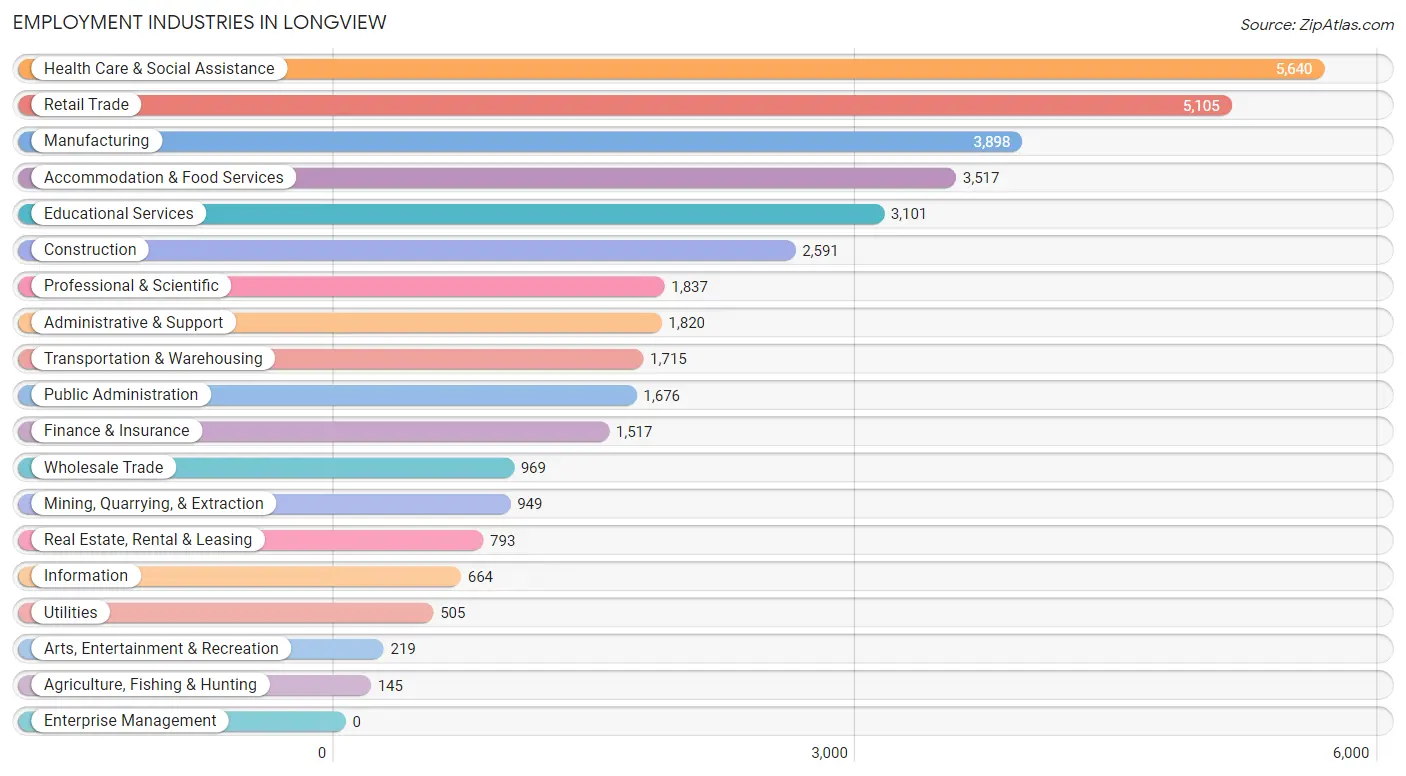
Employment Industries in Longview
The major employment industries in Longview include Health Care & Social Assistance (5,640 | 14.6%), Retail Trade (5,105 | 13.2%), Manufacturing (3,898 | 10.1%), Accommodation & Food Services (3,517 | 9.1%), and Educational Services (3,101 | 8.0%).
Employment Industries by Sex in Longview
The Longview industries that see more men than women are Agriculture, Fishing & Hunting (100.0%), Construction (86.1%), and Wholesale Trade (85.5%), whereas the industries that tend to have a higher number of women are Health Care & Social Assistance (81.3%), Finance & Insurance (71.2%), and Educational Services (66.0%).
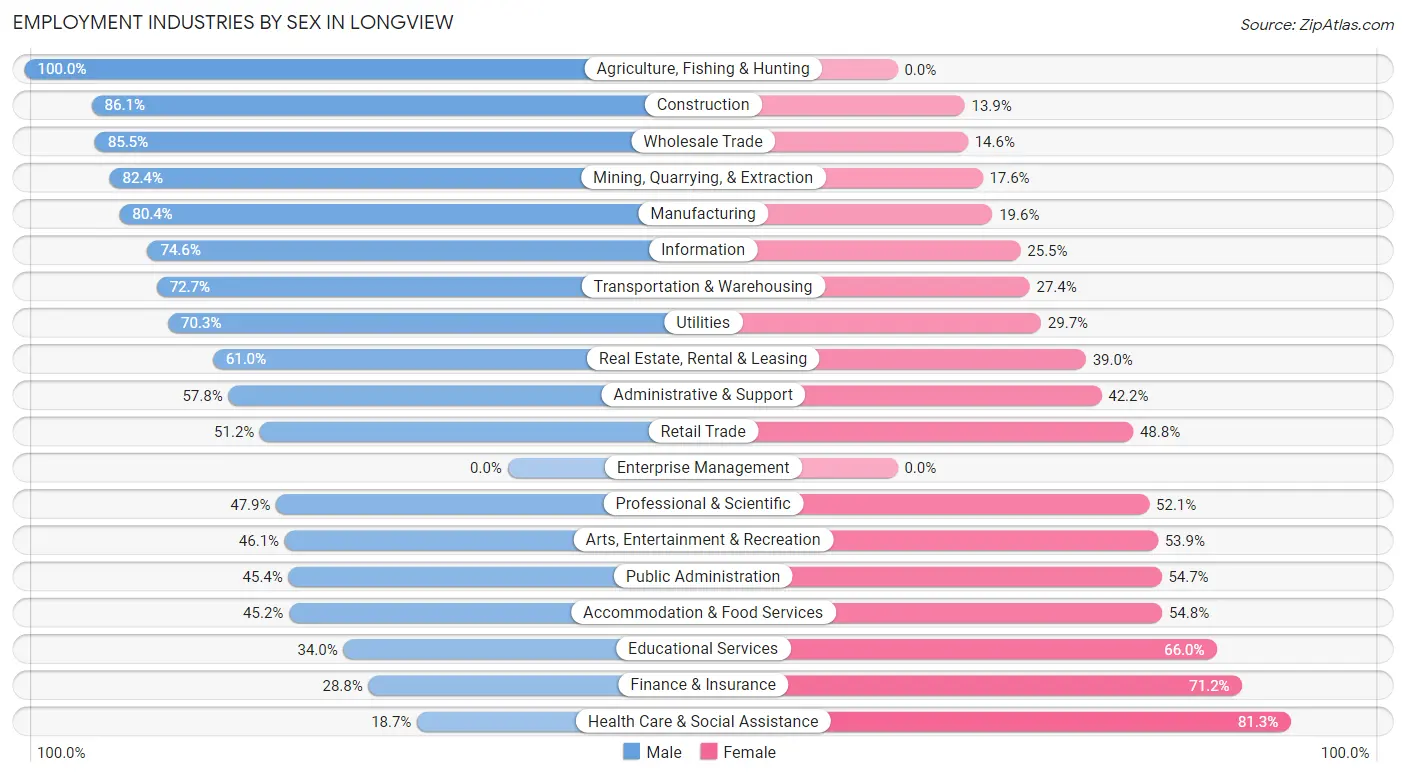
| Industry | Male | Female |
| Agriculture, Fishing & Hunting | 145 (100.0%) | 0 (0.0%) |
| Mining, Quarrying, & Extraction | 782 (82.4%) | 167 (17.6%) |
| Construction | 2,231 (86.1%) | 360 (13.9%) |
| Manufacturing | 3,133 (80.4%) | 765 (19.6%) |
| Wholesale Trade | 828 (85.5%) | 141 (14.5%) |
| Retail Trade | 2,616 (51.2%) | 2,489 (48.8%) |
| Transportation & Warehousing | 1,246 (72.7%) | 469 (27.4%) |
| Utilities | 355 (70.3%) | 150 (29.7%) |
| Information | 495 (74.6%) | 169 (25.5%) |
| Finance & Insurance | 437 (28.8%) | 1,080 (71.2%) |
| Real Estate, Rental & Leasing | 484 (61.0%) | 309 (39.0%) |
| Professional & Scientific | 880 (47.9%) | 957 (52.1%) |
| Enterprise Management | 0 (0.0%) | 0 (0.0%) |
| Administrative & Support | 1,052 (57.8%) | 768 (42.2%) |
| Educational Services | 1,054 (34.0%) | 2,047 (66.0%) |
| Health Care & Social Assistance | 1,057 (18.7%) | 4,583 (81.3%) |
| Arts, Entertainment & Recreation | 101 (46.1%) | 118 (53.9%) |
| Accommodation & Food Services | 1,591 (45.2%) | 1,926 (54.8%) |
| Public Administration | 760 (45.4%) | 916 (54.6%) |
| Total | 20,136 (52.2%) | 18,446 (47.8%) |
Education in Longview
School Enrollment in Longview
The most common levels of schooling among the 19,709 students in Longview are high school (4,651 | 23.6%), elementary school (4,354 | 22.1%), and middle school (4,313 | 21.9%).
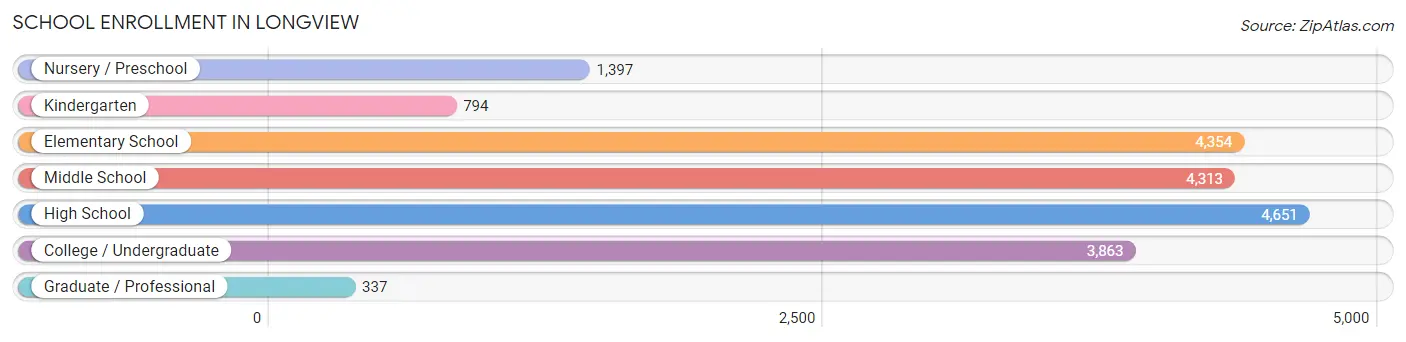
| School Level | # Students | % Students |
| Nursery / Preschool | 1,397 | 7.1% |
| Kindergarten | 794 | 4.0% |
| Elementary School | 4,354 | 22.1% |
| Middle School | 4,313 | 21.9% |
| High School | 4,651 | 23.6% |
| College / Undergraduate | 3,863 | 19.6% |
| Graduate / Professional | 337 | 1.7% |
| Total | 19,709 | 100.0% |
School Enrollment by Age by Funding Source in Longview
Out of a total of 19,709 students who are enrolled in schools in Longview, 2,641 (13.4%) attend a private institution, while the remaining 17,068 (86.6%) are enrolled in public schools. The age group of 3 to 4 year olds has the highest likelihood of being enrolled in private schools, with 429 (44.6% in the age bracket) enrolled. Conversely, the age group of 10 to 14 year olds has the lowest likelihood of being enrolled in a private school, with 5,438 (94.7% in the age bracket) attending a public institution.
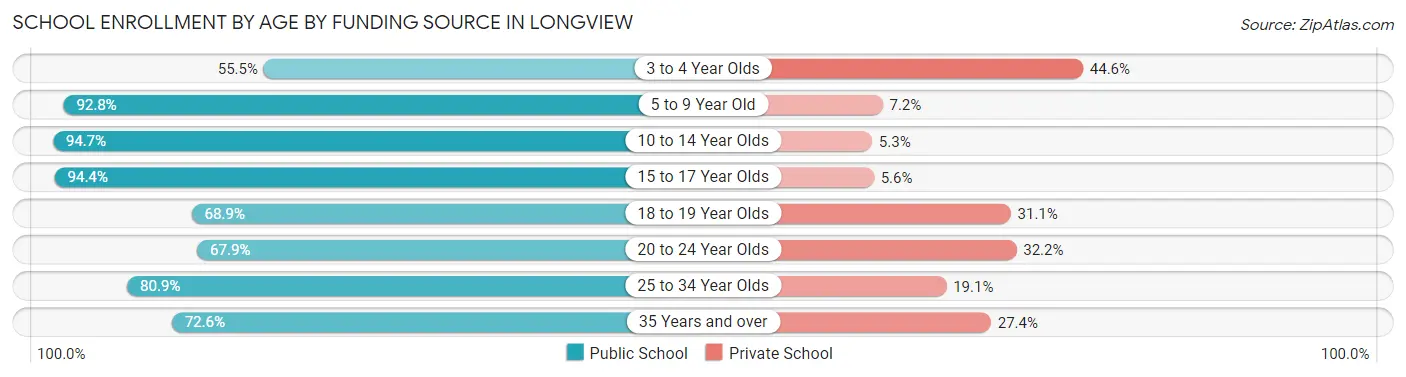
| Age Bracket | Public School | Private School |
| 3 to 4 Year Olds | 534 (55.4%) | 429 (44.6%) |
| 5 to 9 Year Old | 4,446 (92.8%) | 347 (7.2%) |
| 10 to 14 Year Olds | 5,438 (94.7%) | 302 (5.3%) |
| 15 to 17 Year Olds | 3,286 (94.4%) | 195 (5.6%) |
| 18 to 19 Year Olds | 1,006 (68.9%) | 454 (31.1%) |
| 20 to 24 Year Olds | 1,247 (67.8%) | 591 (32.2%) |
| 25 to 34 Year Olds | 614 (80.9%) | 145 (19.1%) |
| 35 Years and over | 490 (72.6%) | 185 (27.4%) |
| Total | 17,068 (86.6%) | 2,641 (13.4%) |
Educational Attainment by Field of Study in Longview
Business (2,621 | 20.3%), education (2,315 | 17.9%), science & technology (1,818 | 14.1%), arts & humanities (932 | 7.2%), and engineering (892 | 6.9%) are the most common fields of study among 12,929 individuals in Longview who have obtained a bachelor's degree or higher.
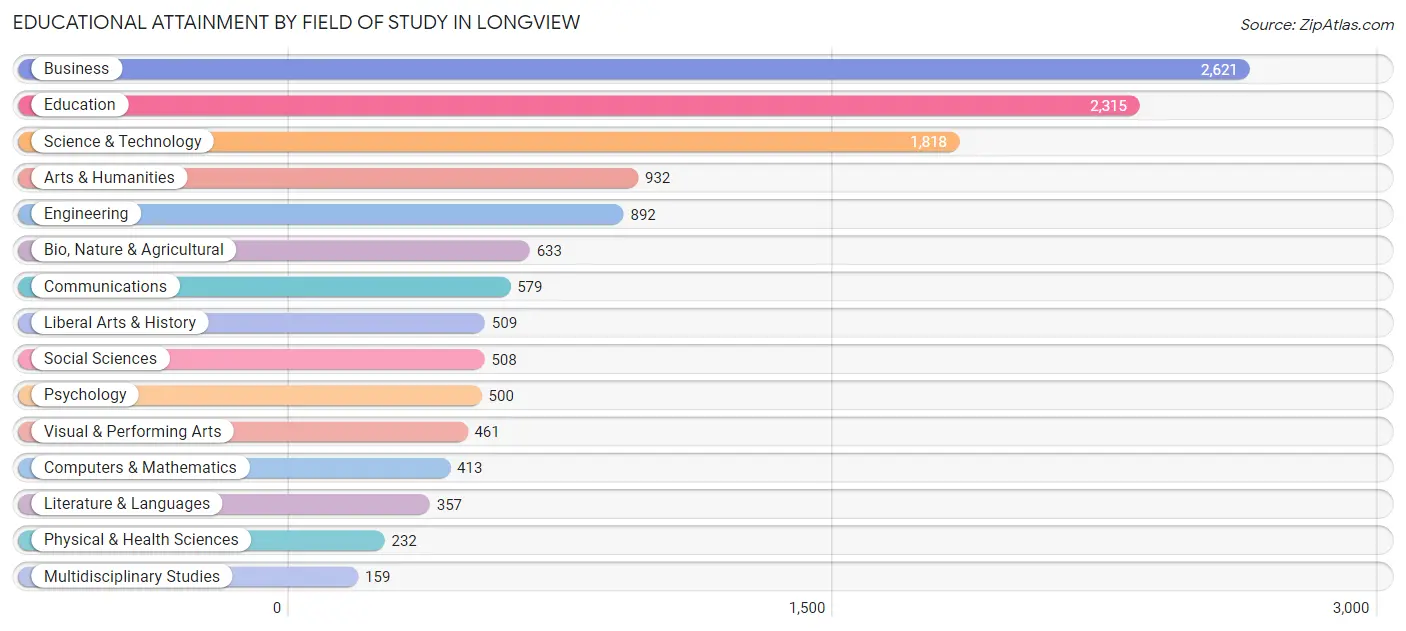
| Field of Study | # Graduates | % Graduates |
| Computers & Mathematics | 413 | 3.2% |
| Bio, Nature & Agricultural | 633 | 4.9% |
| Physical & Health Sciences | 232 | 1.8% |
| Psychology | 500 | 3.9% |
| Social Sciences | 508 | 3.9% |
| Engineering | 892 | 6.9% |
| Multidisciplinary Studies | 159 | 1.2% |
| Science & Technology | 1,818 | 14.1% |
| Business | 2,621 | 20.3% |
| Education | 2,315 | 17.9% |
| Literature & Languages | 357 | 2.8% |
| Liberal Arts & History | 509 | 3.9% |
| Visual & Performing Arts | 461 | 3.6% |
| Communications | 579 | 4.5% |
| Arts & Humanities | 932 | 7.2% |
| Total | 12,929 | 100.0% |
Transportation & Commute in Longview
Vehicle Availability by Sex in Longview
The most prevalent vehicle ownership categories in Longview are males with 2 vehicles (8,939, accounting for 45.6%) and females with 2 vehicles (6,614, making up 49.4%).
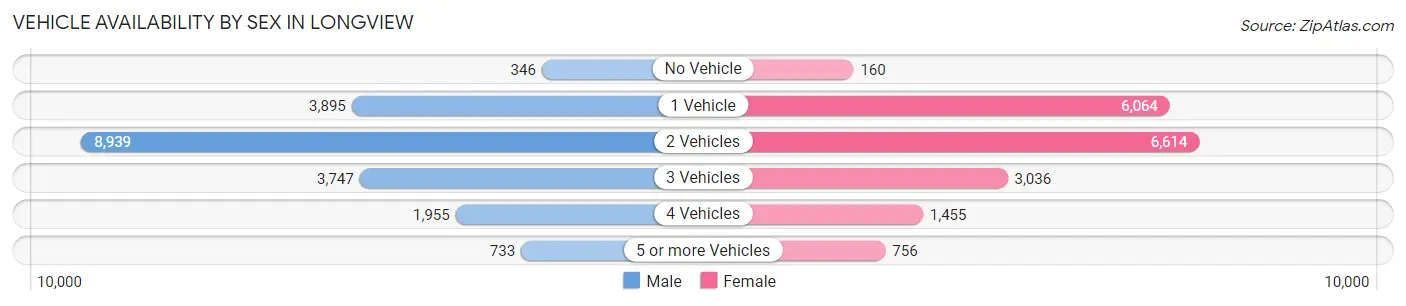
| Vehicles Available | Male | Female |
| No Vehicle | 346 (1.8%) | 160 (0.9%) |
| 1 Vehicle | 3,895 (19.9%) | 6,064 (33.5%) |
| 2 Vehicles | 8,939 (45.6%) | 6,614 (36.6%) |
| 3 Vehicles | 3,747 (19.1%) | 3,036 (16.8%) |
| 4 Vehicles | 1,955 (10.0%) | 1,455 (8.1%) |
| 5 or more Vehicles | 733 (3.7%) | 756 (4.2%) |
| Total | 19,615 (100.0%) | 18,085 (100.0%) |
Commute Time in Longview
The most frequently occuring commute durations in Longview are 15 to 19 minutes (7,974 commuters, 21.9%), 10 to 14 minutes (7,882 commuters, 21.6%), and 5 to 9 minutes (5,923 commuters, 16.3%).
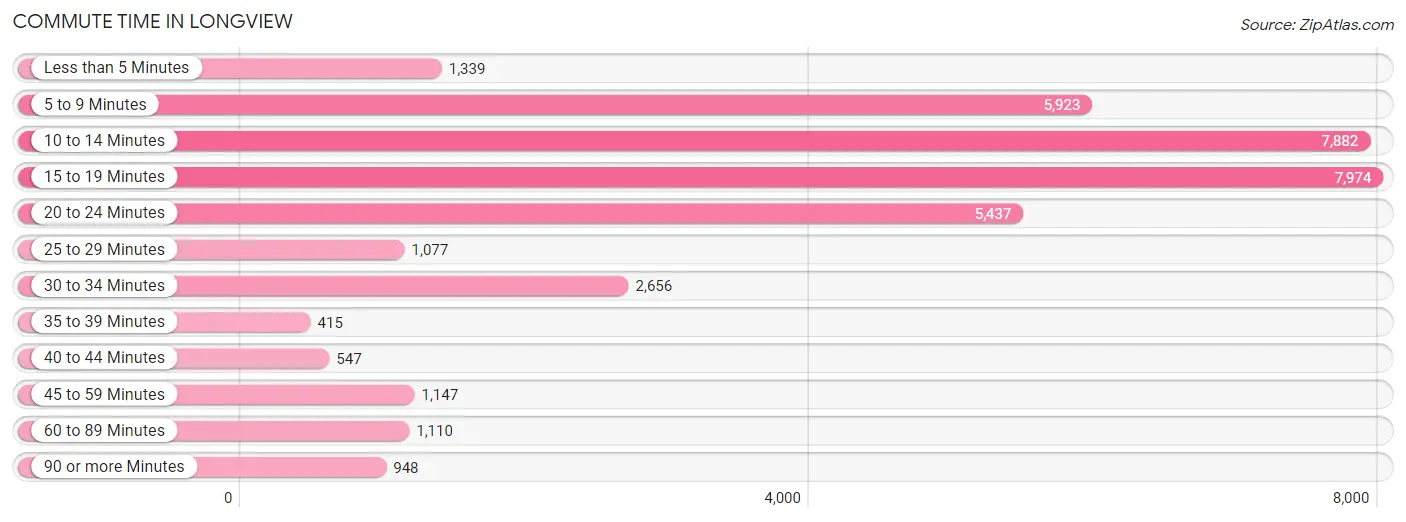
| Commute Time | # Commuters | % Commuters |
| Less than 5 Minutes | 1,339 | 3.7% |
| 5 to 9 Minutes | 5,923 | 16.3% |
| 10 to 14 Minutes | 7,882 | 21.6% |
| 15 to 19 Minutes | 7,974 | 21.9% |
| 20 to 24 Minutes | 5,437 | 14.9% |
| 25 to 29 Minutes | 1,077 | 2.9% |
| 30 to 34 Minutes | 2,656 | 7.3% |
| 35 to 39 Minutes | 415 | 1.1% |
| 40 to 44 Minutes | 547 | 1.5% |
| 45 to 59 Minutes | 1,147 | 3.2% |
| 60 to 89 Minutes | 1,110 | 3.0% |
| 90 or more Minutes | 948 | 2.6% |
Commute Time by Sex in Longview
The most common commute times in Longview are 15 to 19 minutes (4,386 commuters, 22.6%) for males and 10 to 14 minutes (3,919 commuters, 23.0%) for females.
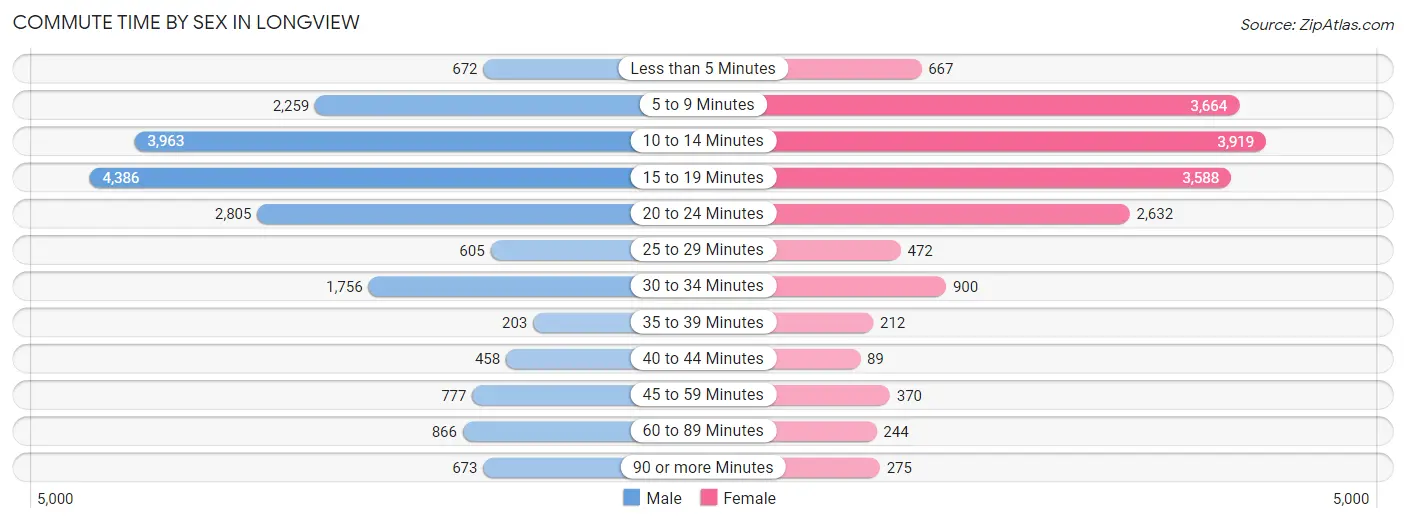
| Commute Time | Male | Female |
| Less than 5 Minutes | 672 (3.5%) | 667 (3.9%) |
| 5 to 9 Minutes | 2,259 (11.6%) | 3,664 (21.5%) |
| 10 to 14 Minutes | 3,963 (20.4%) | 3,919 (23.0%) |
| 15 to 19 Minutes | 4,386 (22.6%) | 3,588 (21.1%) |
| 20 to 24 Minutes | 2,805 (14.4%) | 2,632 (15.4%) |
| 25 to 29 Minutes | 605 (3.1%) | 472 (2.8%) |
| 30 to 34 Minutes | 1,756 (9.0%) | 900 (5.3%) |
| 35 to 39 Minutes | 203 (1.1%) | 212 (1.2%) |
| 40 to 44 Minutes | 458 (2.4%) | 89 (0.5%) |
| 45 to 59 Minutes | 777 (4.0%) | 370 (2.2%) |
| 60 to 89 Minutes | 866 (4.5%) | 244 (1.4%) |
| 90 or more Minutes | 673 (3.5%) | 275 (1.6%) |
Time of Departure to Work by Sex in Longview
The most frequent times of departure to work in Longview are 7:30 AM to 7:59 AM (2,895, 14.9%) for males and 7:30 AM to 7:59 AM (3,065, 18.0%) for females.
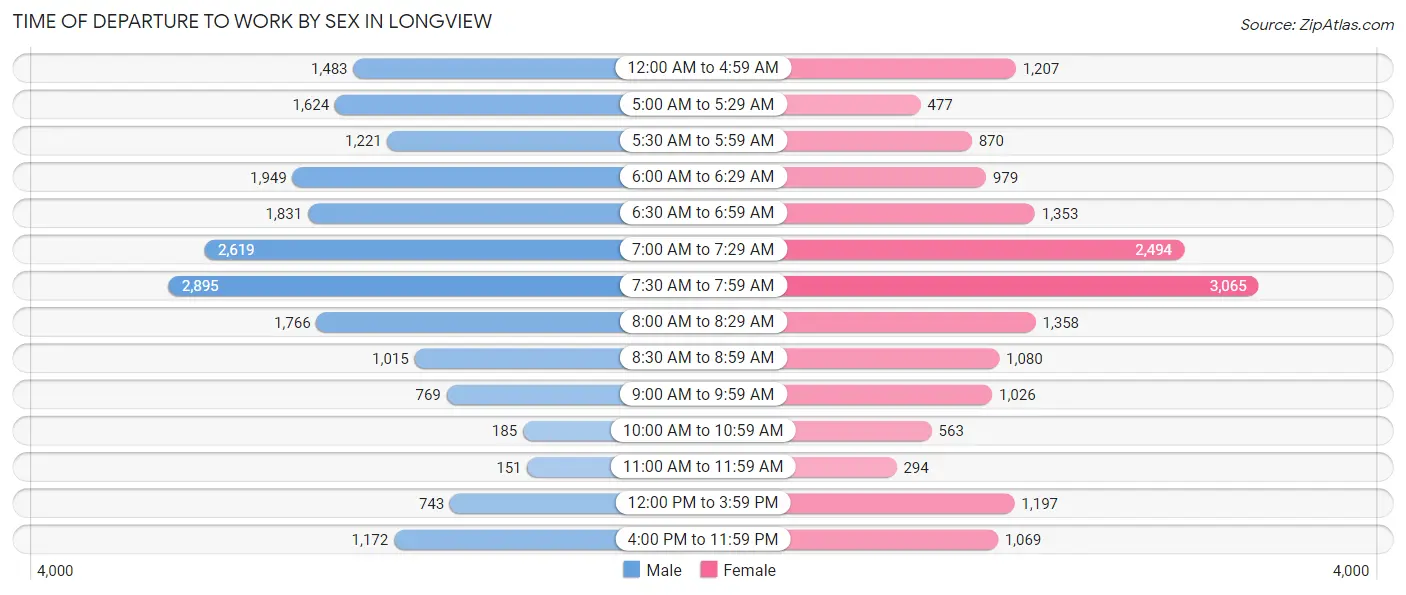
| Time of Departure | Male | Female |
| 12:00 AM to 4:59 AM | 1,483 (7.6%) | 1,207 (7.1%) |
| 5:00 AM to 5:29 AM | 1,624 (8.4%) | 477 (2.8%) |
| 5:30 AM to 5:59 AM | 1,221 (6.3%) | 870 (5.1%) |
| 6:00 AM to 6:29 AM | 1,949 (10.0%) | 979 (5.8%) |
| 6:30 AM to 6:59 AM | 1,831 (9.4%) | 1,353 (7.9%) |
| 7:00 AM to 7:29 AM | 2,619 (13.5%) | 2,494 (14.6%) |
| 7:30 AM to 7:59 AM | 2,895 (14.9%) | 3,065 (18.0%) |
| 8:00 AM to 8:29 AM | 1,766 (9.1%) | 1,358 (8.0%) |
| 8:30 AM to 8:59 AM | 1,015 (5.2%) | 1,080 (6.3%) |
| 9:00 AM to 9:59 AM | 769 (4.0%) | 1,026 (6.0%) |
| 10:00 AM to 10:59 AM | 185 (0.9%) | 563 (3.3%) |
| 11:00 AM to 11:59 AM | 151 (0.8%) | 294 (1.7%) |
| 12:00 PM to 3:59 PM | 743 (3.8%) | 1,197 (7.0%) |
| 4:00 PM to 11:59 PM | 1,172 (6.0%) | 1,069 (6.3%) |
| Total | 19,423 (100.0%) | 17,032 (100.0%) |
Housing Occupancy in Longview
Occupancy by Ownership in Longview
Of the total 32,169 dwellings in Longview, owner-occupied units account for 17,164 (53.4%), while renter-occupied units make up 15,005 (46.6%).
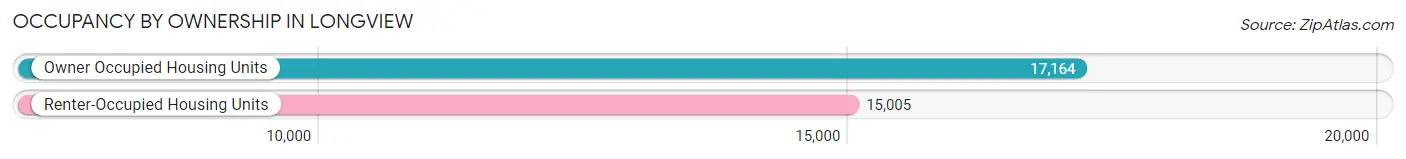
| Occupancy | # Housing Units | % Housing Units |
| Owner Occupied Housing Units | 17,164 | 53.4% |
| Renter-Occupied Housing Units | 15,005 | 46.6% |
| Total Occupied Housing Units | 32,169 | 100.0% |
Occupancy by Household Size in Longview
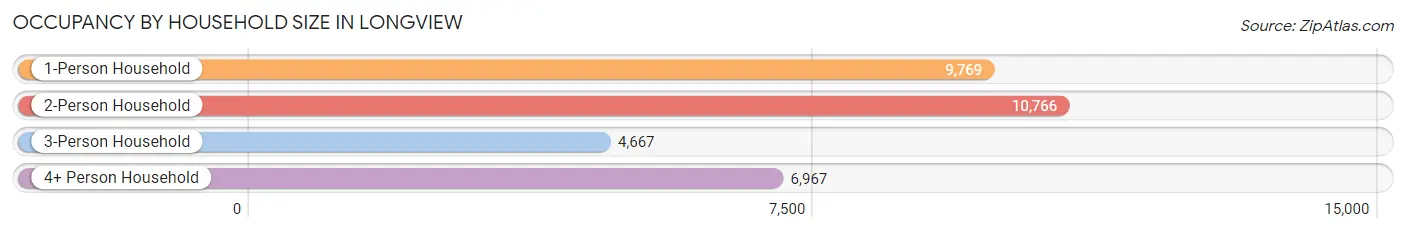
| Household Size | # Housing Units | % Housing Units |
| 1-Person Household | 9,769 | 30.4% |
| 2-Person Household | 10,766 | 33.5% |
| 3-Person Household | 4,667 | 14.5% |
| 4+ Person Household | 6,967 | 21.7% |
| Total Housing Units | 32,169 | 100.0% |
Occupancy by Ownership by Household Size in Longview
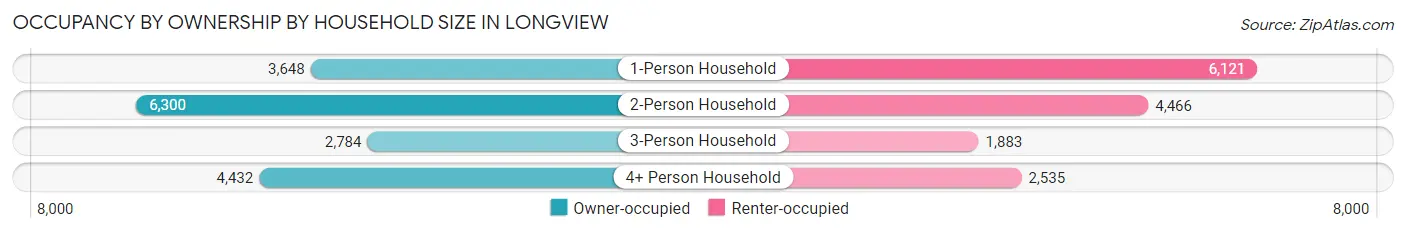
| Household Size | Owner-occupied | Renter-occupied |
| 1-Person Household | 3,648 (37.3%) | 6,121 (62.7%) |
| 2-Person Household | 6,300 (58.5%) | 4,466 (41.5%) |
| 3-Person Household | 2,784 (59.7%) | 1,883 (40.4%) |
| 4+ Person Household | 4,432 (63.6%) | 2,535 (36.4%) |
| Total Housing Units | 17,164 (53.4%) | 15,005 (46.6%) |
Occupancy by Educational Attainment in Longview
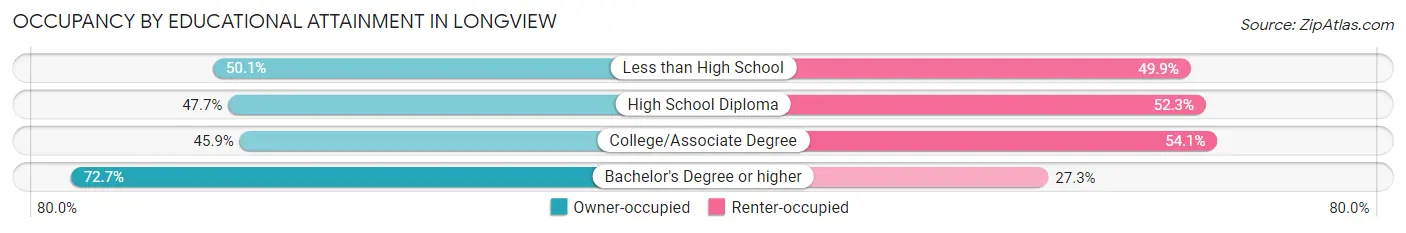
| Household Size | Owner-occupied | Renter-occupied |
| Less than High School | 1,745 (50.1%) | 1,736 (49.9%) |
| High School Diploma | 3,818 (47.7%) | 4,185 (52.3%) |
| College/Associate Degree | 5,880 (45.9%) | 6,933 (54.1%) |
| Bachelor's Degree or higher | 5,721 (72.7%) | 2,151 (27.3%) |
Occupancy by Age of Householder in Longview
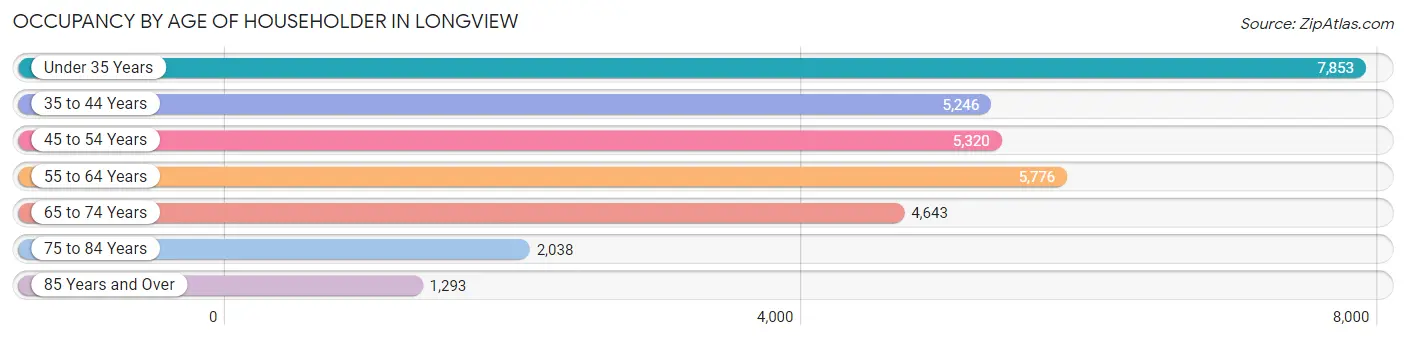
| Age Bracket | # Households | % Households |
| Under 35 Years | 7,853 | 24.4% |
| 35 to 44 Years | 5,246 | 16.3% |
| 45 to 54 Years | 5,320 | 16.5% |
| 55 to 64 Years | 5,776 | 18.0% |
| 65 to 74 Years | 4,643 | 14.4% |
| 75 to 84 Years | 2,038 | 6.3% |
| 85 Years and Over | 1,293 | 4.0% |
| Total | 32,169 | 100.0% |
Housing Finances in Longview
Median Income by Occupancy in Longview
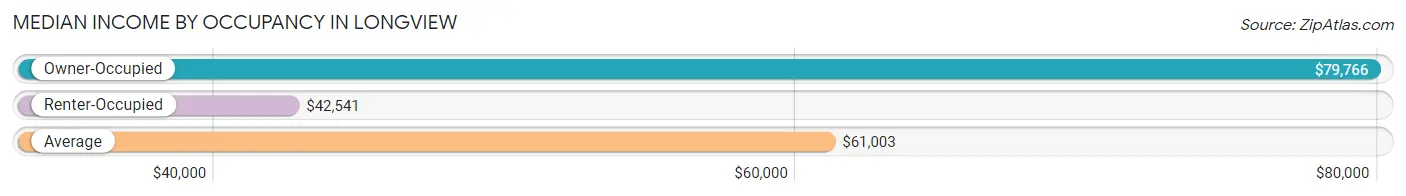
| Occupancy Type | # Households | Median Income |
| Owner-Occupied | 17,164 (53.4%) | $79,766 |
| Renter-Occupied | 15,005 (46.6%) | $42,541 |
| Average | 32,169 (100.0%) | $61,003 |
Occupancy by Householder Income Bracket in Longview
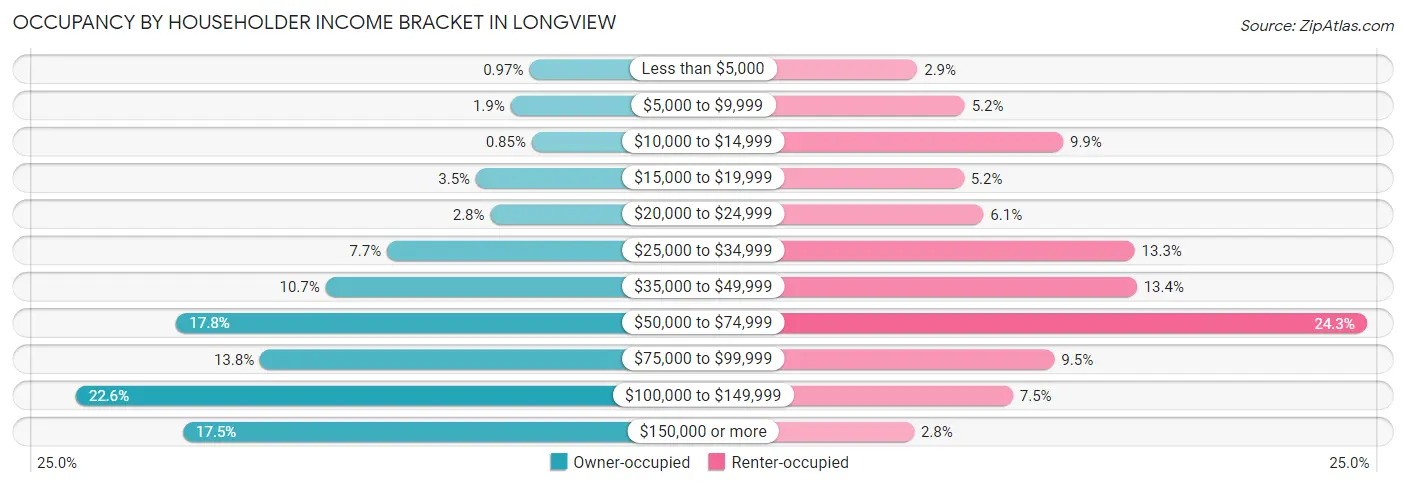
| Income Bracket | Owner-occupied | Renter-occupied |
| Less than $5,000 | 166 (1.0%) | 441 (2.9%) |
| $5,000 to $9,999 | 319 (1.9%) | 780 (5.2%) |
| $10,000 to $14,999 | 146 (0.9%) | 1,482 (9.9%) |
| $15,000 to $19,999 | 603 (3.5%) | 773 (5.1%) |
| $20,000 to $24,999 | 484 (2.8%) | 914 (6.1%) |
| $25,000 to $34,999 | 1,329 (7.7%) | 1,994 (13.3%) |
| $35,000 to $49,999 | 1,832 (10.7%) | 2,009 (13.4%) |
| $50,000 to $74,999 | 3,050 (17.8%) | 3,650 (24.3%) |
| $75,000 to $99,999 | 2,367 (13.8%) | 1,421 (9.5%) |
| $100,000 to $149,999 | 3,872 (22.6%) | 1,124 (7.5%) |
| $150,000 or more | 2,996 (17.5%) | 417 (2.8%) |
| Total | 17,164 (100.0%) | 15,005 (100.0%) |
Monthly Housing Cost Tiers in Longview
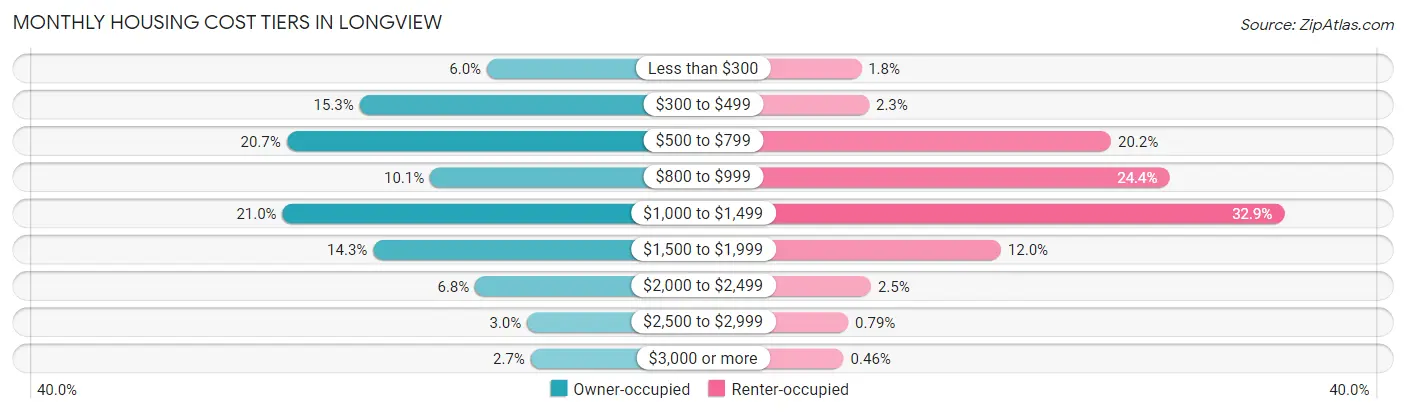
| Monthly Cost | Owner-occupied | Renter-occupied |
| Less than $300 | 1,021 (5.9%) | 262 (1.8%) |
| $300 to $499 | 2,631 (15.3%) | 350 (2.3%) |
| $500 to $799 | 3,554 (20.7%) | 3,023 (20.2%) |
| $800 to $999 | 1,741 (10.1%) | 3,667 (24.4%) |
| $1,000 to $1,499 | 3,606 (21.0%) | 4,937 (32.9%) |
| $1,500 to $1,999 | 2,459 (14.3%) | 1,807 (12.0%) |
| $2,000 to $2,499 | 1,170 (6.8%) | 370 (2.5%) |
| $2,500 to $2,999 | 513 (3.0%) | 118 (0.8%) |
| $3,000 or more | 469 (2.7%) | 69 (0.5%) |
| Total | 17,164 (100.0%) | 15,005 (100.0%) |
Physical Housing Characteristics in Longview
Housing Structures in Longview
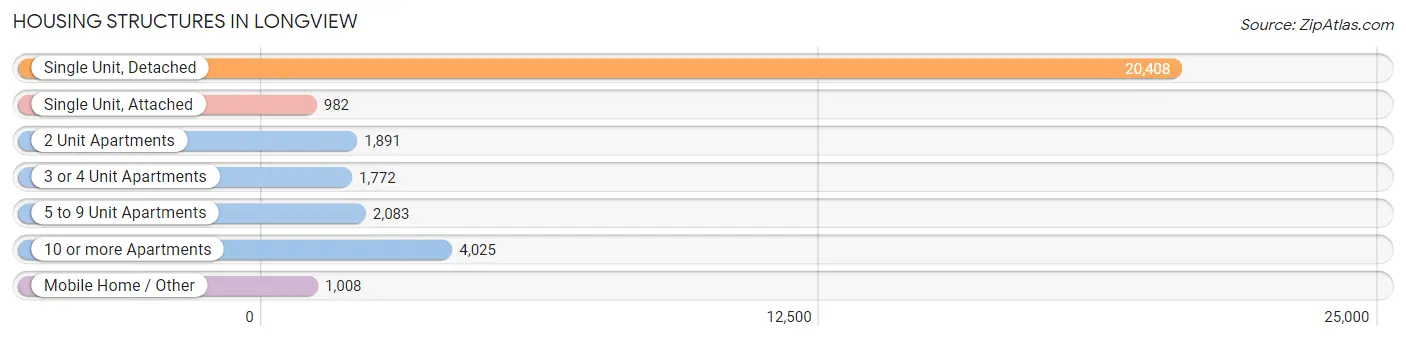
| Structure Type | # Housing Units | % Housing Units |
| Single Unit, Detached | 20,408 | 63.4% |
| Single Unit, Attached | 982 | 3.0% |
| 2 Unit Apartments | 1,891 | 5.9% |
| 3 or 4 Unit Apartments | 1,772 | 5.5% |
| 5 to 9 Unit Apartments | 2,083 | 6.5% |
| 10 or more Apartments | 4,025 | 12.5% |
| Mobile Home / Other | 1,008 | 3.1% |
| Total | 32,169 | 100.0% |
Housing Structures by Occupancy in Longview
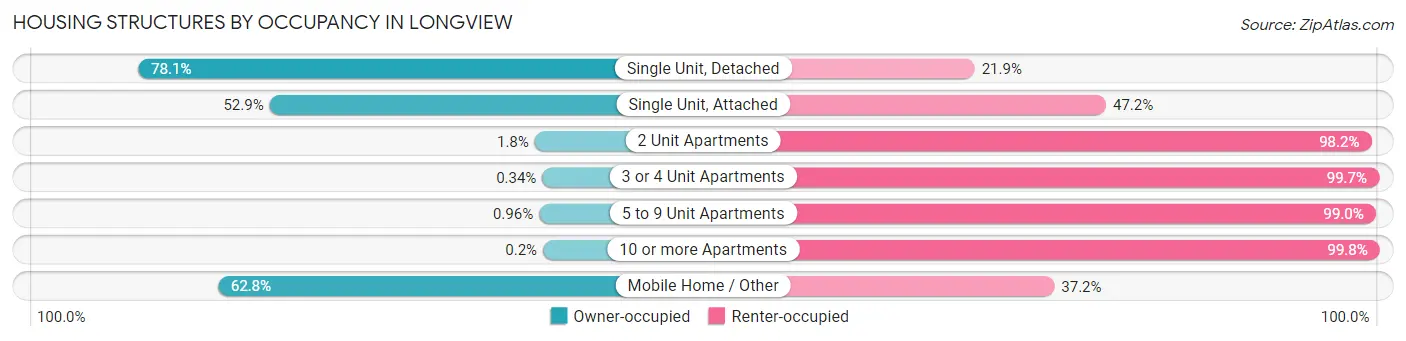
| Structure Type | Owner-occupied | Renter-occupied |
| Single Unit, Detached | 15,944 (78.1%) | 4,464 (21.9%) |
| Single Unit, Attached | 519 (52.8%) | 463 (47.1%) |
| 2 Unit Apartments | 34 (1.8%) | 1,857 (98.2%) |
| 3 or 4 Unit Apartments | 6 (0.3%) | 1,766 (99.7%) |
| 5 to 9 Unit Apartments | 20 (1.0%) | 2,063 (99.0%) |
| 10 or more Apartments | 8 (0.2%) | 4,017 (99.8%) |
| Mobile Home / Other | 633 (62.8%) | 375 (37.2%) |
| Total | 17,164 (53.4%) | 15,005 (46.6%) |
Housing Structures by Number of Rooms in Longview
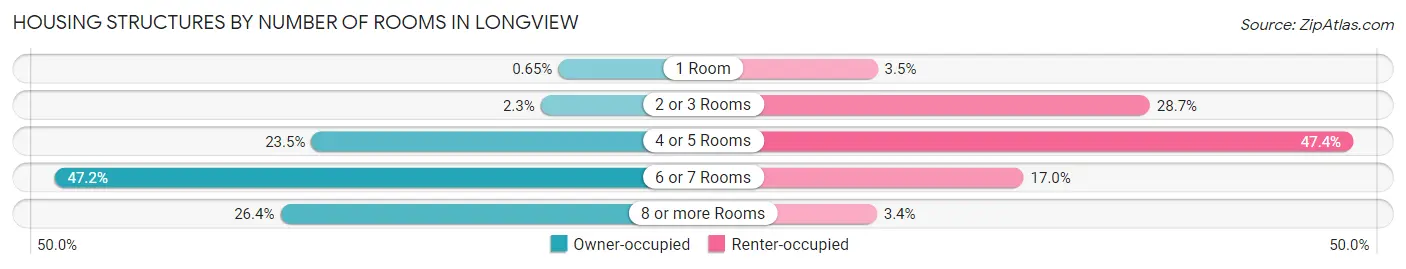
| Number of Rooms | Owner-occupied | Renter-occupied |
| 1 Room | 111 (0.6%) | 524 (3.5%) |
| 2 or 3 Rooms | 391 (2.3%) | 4,302 (28.7%) |
| 4 or 5 Rooms | 4,032 (23.5%) | 7,118 (47.4%) |
| 6 or 7 Rooms | 8,106 (47.2%) | 2,549 (17.0%) |
| 8 or more Rooms | 4,524 (26.4%) | 512 (3.4%) |
| Total | 17,164 (100.0%) | 15,005 (100.0%) |
Housing Structure by Heating Type in Longview
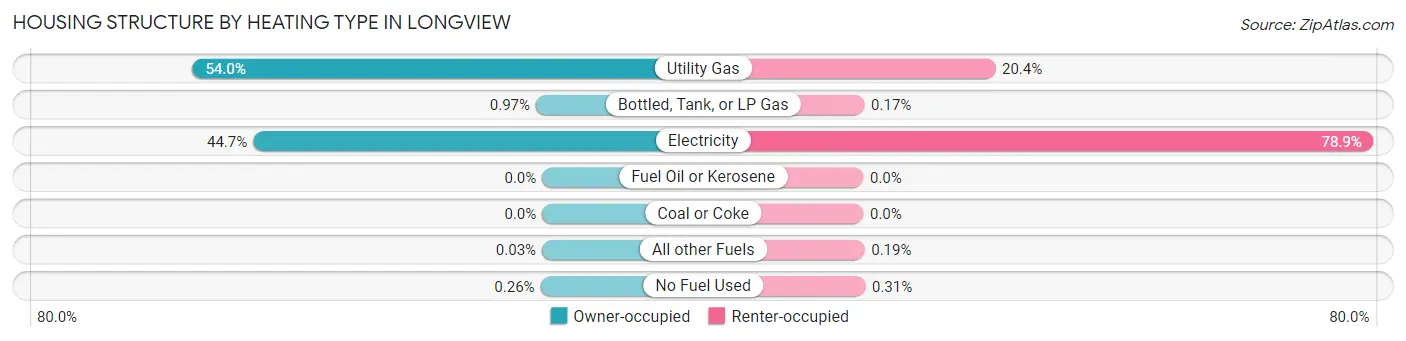
| Heating Type | Owner-occupied | Renter-occupied |
| Utility Gas | 9,276 (54.0%) | 3,061 (20.4%) |
| Bottled, Tank, or LP Gas | 166 (1.0%) | 26 (0.2%) |
| Electricity | 7,671 (44.7%) | 11,843 (78.9%) |
| Fuel Oil or Kerosene | 0 (0.0%) | 0 (0.0%) |
| Coal or Coke | 0 (0.0%) | 0 (0.0%) |
| All other Fuels | 6 (0.0%) | 28 (0.2%) |
| No Fuel Used | 45 (0.3%) | 47 (0.3%) |
| Total | 17,164 (100.0%) | 15,005 (100.0%) |
Household Vehicle Usage in Longview
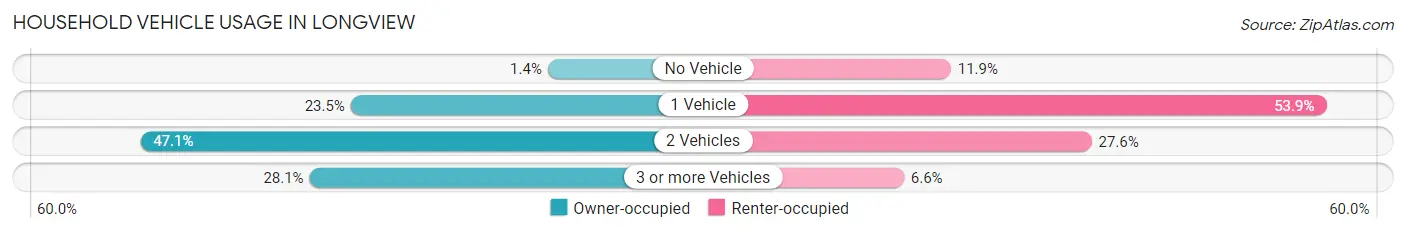
| Vehicles per Household | Owner-occupied | Renter-occupied |
| No Vehicle | 240 (1.4%) | 1,779 (11.9%) |
| 1 Vehicle | 4,028 (23.5%) | 8,089 (53.9%) |
| 2 Vehicles | 8,075 (47.0%) | 4,146 (27.6%) |
| 3 or more Vehicles | 4,821 (28.1%) | 991 (6.6%) |
| Total | 17,164 (100.0%) | 15,005 (100.0%) |
Real Estate & Mortgages in Longview
Real Estate and Mortgage Overview in Longview
| Characteristic | Without Mortgage | With Mortgage |
| Housing Units | 7,827 | 9,337 |
| Median Property Value | $160,100 | $178,900 |
| Median Household Income | $58,130 | $1,921 |
| Monthly Housing Costs | $524 | $450 |
| Real Estate Taxes | $1,755 | $291 |
Property Value by Mortgage Status in Longview
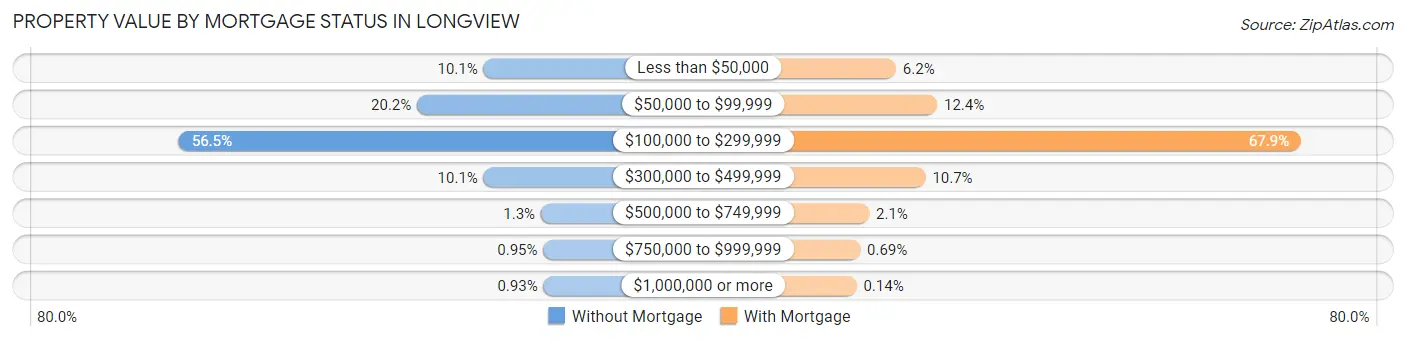
| Property Value | Without Mortgage | With Mortgage |
| Less than $50,000 | 788 (10.1%) | 574 (6.1%) |
| $50,000 to $99,999 | 1,580 (20.2%) | 1,160 (12.4%) |
| $100,000 to $299,999 | 4,422 (56.5%) | 6,339 (67.9%) |
| $300,000 to $499,999 | 787 (10.1%) | 994 (10.6%) |
| $500,000 to $749,999 | 103 (1.3%) | 193 (2.1%) |
| $750,000 to $999,999 | 74 (0.9%) | 64 (0.7%) |
| $1,000,000 or more | 73 (0.9%) | 13 (0.1%) |
| Total | 7,827 (100.0%) | 9,337 (100.0%) |
Household Income by Mortgage Status in Longview
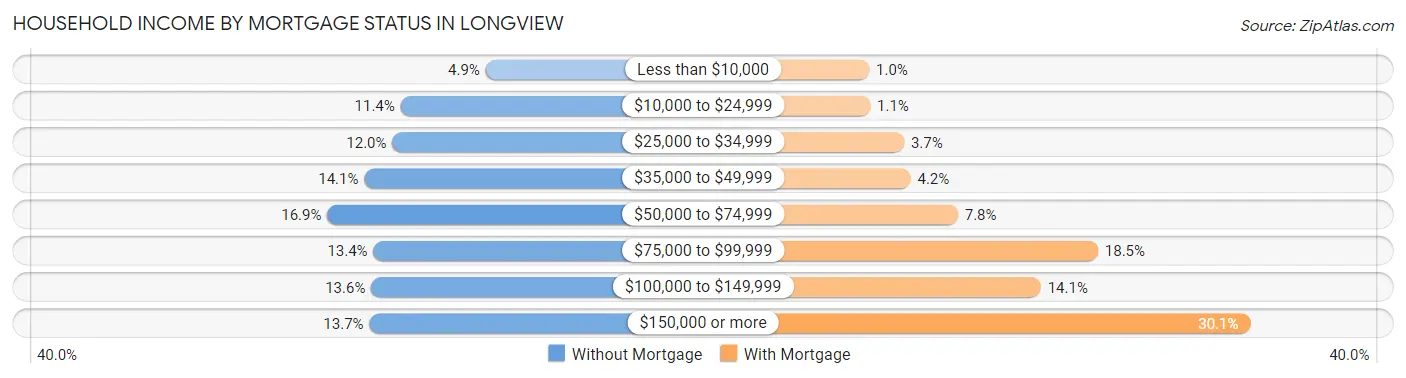
| Household Income | Without Mortgage | With Mortgage |
| Less than $10,000 | 381 (4.9%) | 96 (1.0%) |
| $10,000 to $24,999 | 888 (11.4%) | 104 (1.1%) |
| $25,000 to $34,999 | 938 (12.0%) | 345 (3.7%) |
| $35,000 to $49,999 | 1,105 (14.1%) | 391 (4.2%) |
| $50,000 to $74,999 | 1,326 (16.9%) | 727 (7.8%) |
| $75,000 to $99,999 | 1,050 (13.4%) | 1,724 (18.5%) |
| $100,000 to $149,999 | 1,064 (13.6%) | 1,317 (14.1%) |
| $150,000 or more | 1,075 (13.7%) | 2,808 (30.1%) |
| Total | 7,827 (100.0%) | 9,337 (100.0%) |
Property Value to Household Income Ratio in Longview
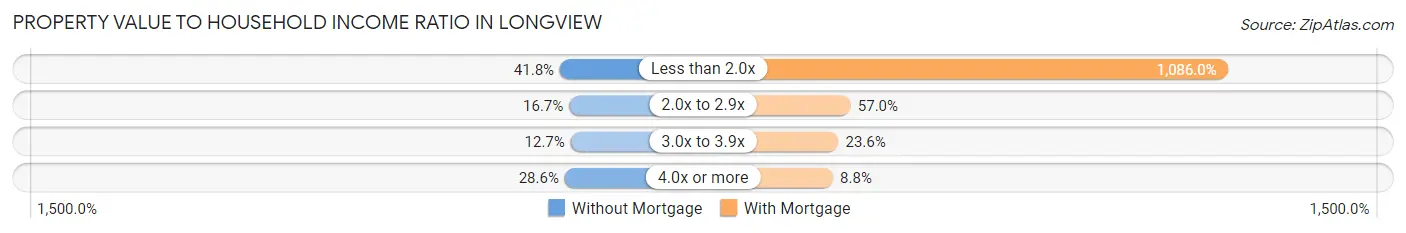
| Value-to-Income Ratio | Without Mortgage | With Mortgage |
| Less than 2.0x | 3,268 (41.7%) | 101,400 (1,086.0%) |
| 2.0x to 2.9x | 1,304 (16.7%) | 5,325 (57.0%) |
| 3.0x to 3.9x | 991 (12.7%) | 2,205 (23.6%) |
| 4.0x or more | 2,238 (28.6%) | 824 (8.8%) |
| Total | 7,827 (100.0%) | 9,337 (100.0%) |
Real Estate Taxes by Mortgage Status in Longview
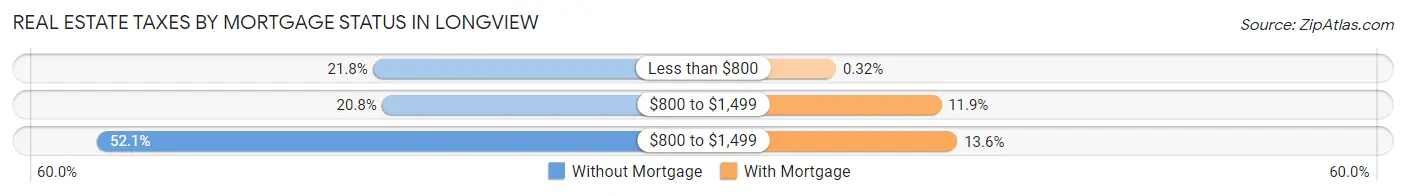
| Property Taxes | Without Mortgage | With Mortgage |
| Less than $800 | 1,702 (21.7%) | 30 (0.3%) |
| $800 to $1,499 | 1,626 (20.8%) | 1,106 (11.8%) |
| $800 to $1,499 | 4,074 (52.0%) | 1,271 (13.6%) |
| Total | 7,827 (100.0%) | 9,337 (100.0%) |
Health & Disability in Longview
Health Insurance Coverage by Age in Longview
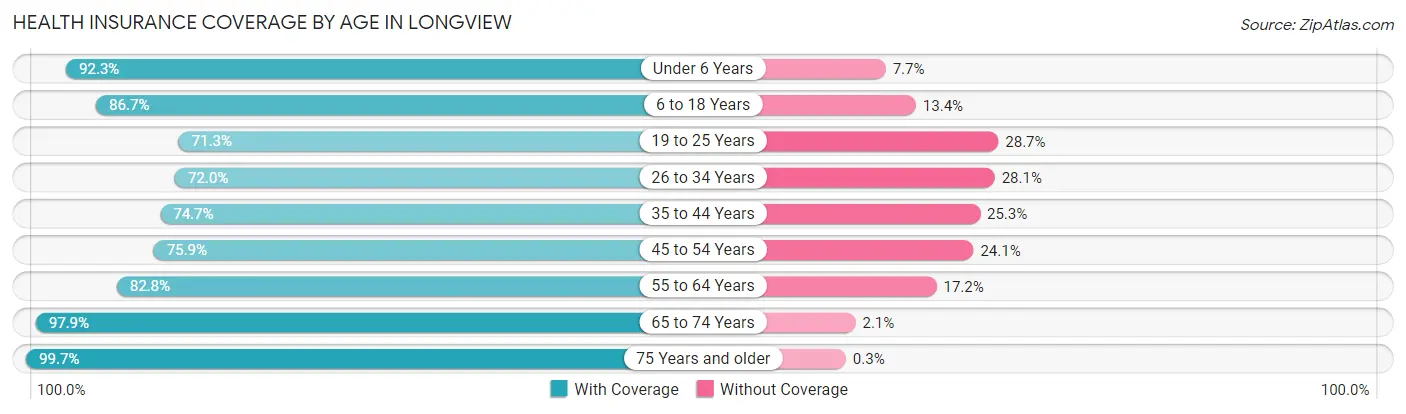
| Age Bracket | With Coverage | Without Coverage |
| Under 6 Years | 5,987 (92.3%) | 501 (7.7%) |
| 6 to 18 Years | 12,934 (86.7%) | 1,993 (13.4%) |
| 19 to 25 Years | 6,152 (71.3%) | 2,480 (28.7%) |
| 26 to 34 Years | 7,533 (72.0%) | 2,937 (28.1%) |
| 35 to 44 Years | 7,146 (74.7%) | 2,422 (25.3%) |
| 45 to 54 Years | 6,543 (75.9%) | 2,076 (24.1%) |
| 55 to 64 Years | 7,918 (82.8%) | 1,645 (17.2%) |
| 65 to 74 Years | 7,225 (97.9%) | 155 (2.1%) |
| 75 Years and older | 4,672 (99.7%) | 14 (0.3%) |
| Total | 66,110 (82.3%) | 14,223 (17.7%) |
Health Insurance Coverage by Citizenship Status in Longview

| Citizenship Status | With Coverage | Without Coverage |
| Native Born | 5,987 (92.3%) | 501 (7.7%) |
| Foreign Born, Citizen | 12,934 (86.7%) | 1,993 (13.4%) |
| Foreign Born, not a Citizen | 6,152 (71.3%) | 2,480 (28.7%) |
Health Insurance Coverage by Household Income in Longview
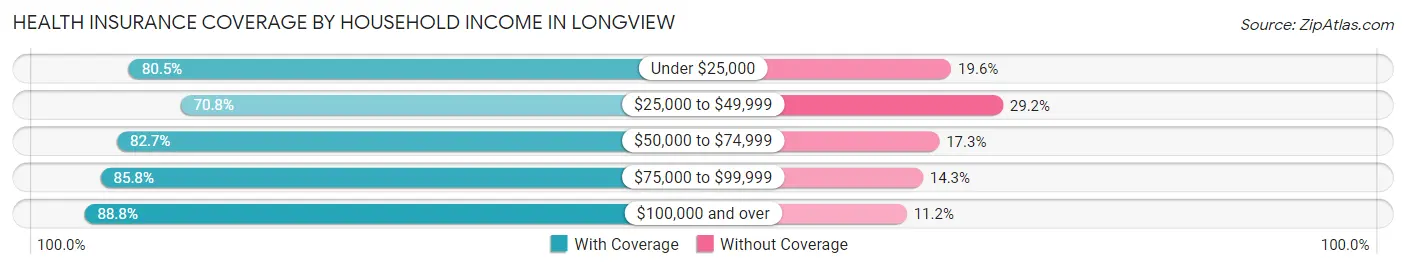
| Household Income | With Coverage | Without Coverage |
| Under $25,000 | 8,184 (80.4%) | 1,989 (19.6%) |
| $25,000 to $49,999 | 10,964 (70.8%) | 4,530 (29.2%) |
| $50,000 to $74,999 | 13,948 (82.7%) | 2,922 (17.3%) |
| $75,000 to $99,999 | 9,234 (85.8%) | 1,535 (14.2%) |
| $100,000 and over | 22,214 (88.8%) | 2,810 (11.2%) |
Public vs Private Health Insurance Coverage by Age in Longview
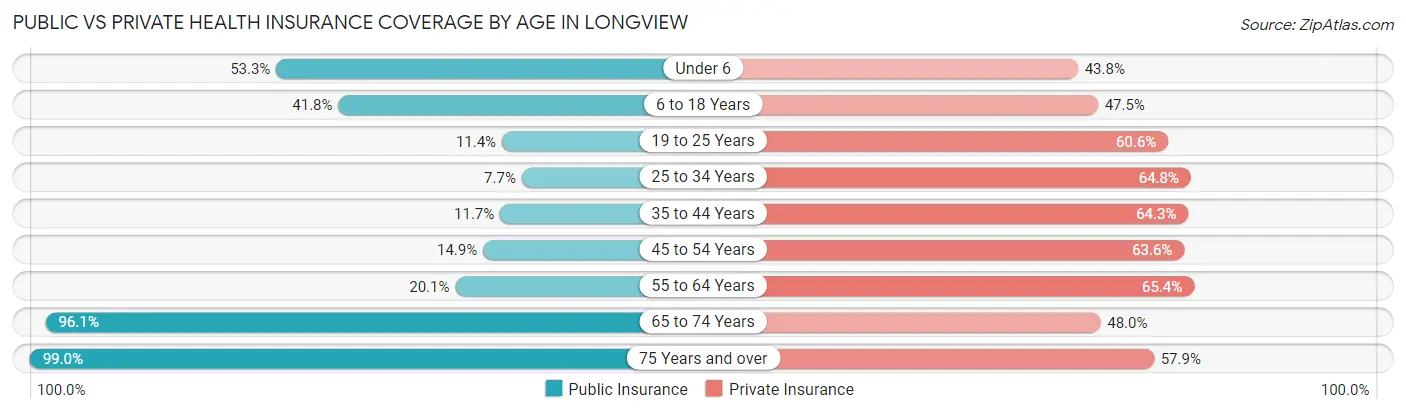
| Age Bracket | Public Insurance | Private Insurance |
| Under 6 | 3,458 (53.3%) | 2,841 (43.8%) |
| 6 to 18 Years | 6,233 (41.8%) | 7,091 (47.5%) |
| 19 to 25 Years | 984 (11.4%) | 5,228 (60.6%) |
| 25 to 34 Years | 808 (7.7%) | 6,782 (64.8%) |
| 35 to 44 Years | 1,123 (11.7%) | 6,152 (64.3%) |
| 45 to 54 Years | 1,285 (14.9%) | 5,477 (63.5%) |
| 55 to 64 Years | 1,918 (20.1%) | 6,251 (65.4%) |
| 65 to 74 Years | 7,094 (96.1%) | 3,541 (48.0%) |
| 75 Years and over | 4,641 (99.0%) | 2,713 (57.9%) |
| Total | 27,544 (34.3%) | 46,076 (57.4%) |
Disability Status by Sex by Age in Longview
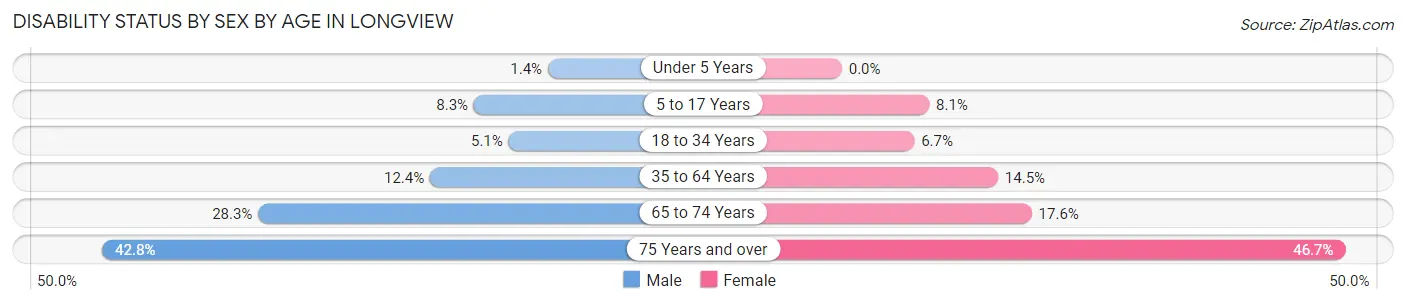
| Age Bracket | Male | Female |
| Under 5 Years | 41 (1.4%) | 0 (0.0%) |
| 5 to 17 Years | 613 (8.3%) | 606 (8.1%) |
| 18 to 34 Years | 519 (5.1%) | 681 (6.7%) |
| 35 to 64 Years | 1,670 (12.4%) | 2,065 (14.5%) |
| 65 to 74 Years | 973 (28.3%) | 695 (17.6%) |
| 75 Years and over | 716 (42.8%) | 1,408 (46.7%) |
Disability Class by Sex by Age in Longview
Disability Class: Hearing Difficulty
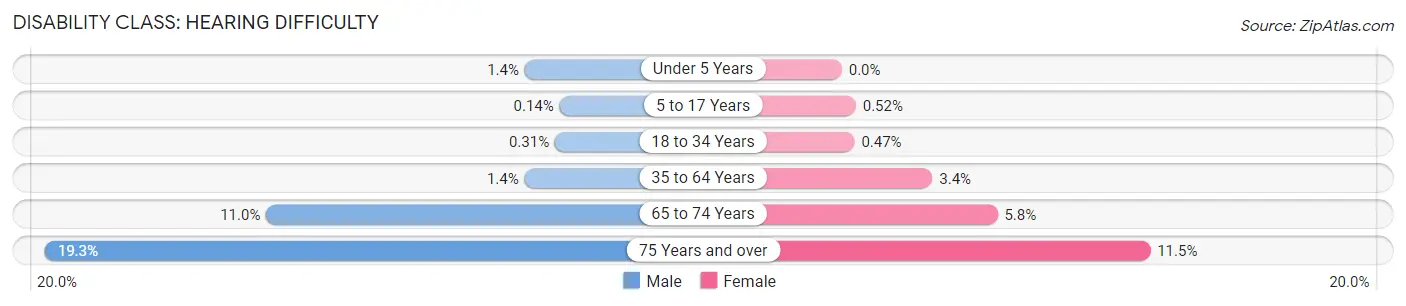
| Age Bracket | Male | Female |
| Under 5 Years | 41 (1.4%) | 0 (0.0%) |
| 5 to 17 Years | 10 (0.1%) | 39 (0.5%) |
| 18 to 34 Years | 32 (0.3%) | 48 (0.5%) |
| 35 to 64 Years | 195 (1.4%) | 479 (3.4%) |
| 65 to 74 Years | 379 (11.0%) | 228 (5.8%) |
| 75 Years and over | 322 (19.3%) | 345 (11.5%) |
Disability Class: Vision Difficulty
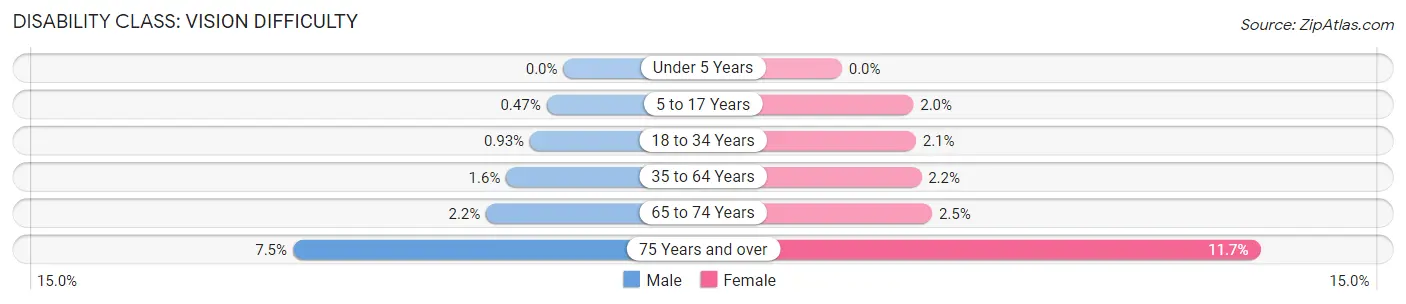
| Age Bracket | Male | Female |
| Under 5 Years | 0 (0.0%) | 0 (0.0%) |
| 5 to 17 Years | 35 (0.5%) | 149 (2.0%) |
| 18 to 34 Years | 95 (0.9%) | 209 (2.1%) |
| 35 to 64 Years | 215 (1.6%) | 315 (2.2%) |
| 65 to 74 Years | 74 (2.1%) | 99 (2.5%) |
| 75 Years and over | 126 (7.5%) | 351 (11.7%) |
Disability Class: Cognitive Difficulty
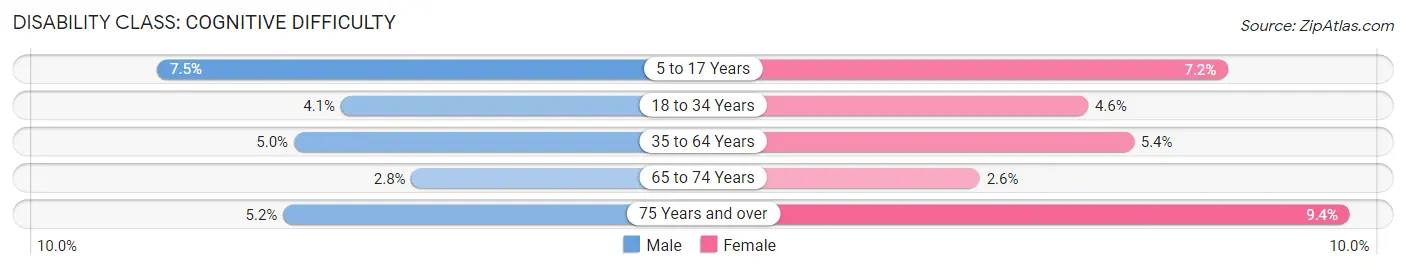
| Age Bracket | Male | Female |
| 5 to 17 Years | 557 (7.5%) | 537 (7.2%) |
| 18 to 34 Years | 422 (4.1%) | 463 (4.6%) |
| 35 to 64 Years | 675 (5.0%) | 772 (5.4%) |
| 65 to 74 Years | 97 (2.8%) | 101 (2.6%) |
| 75 Years and over | 87 (5.2%) | 284 (9.4%) |
Disability Class: Ambulatory Difficulty
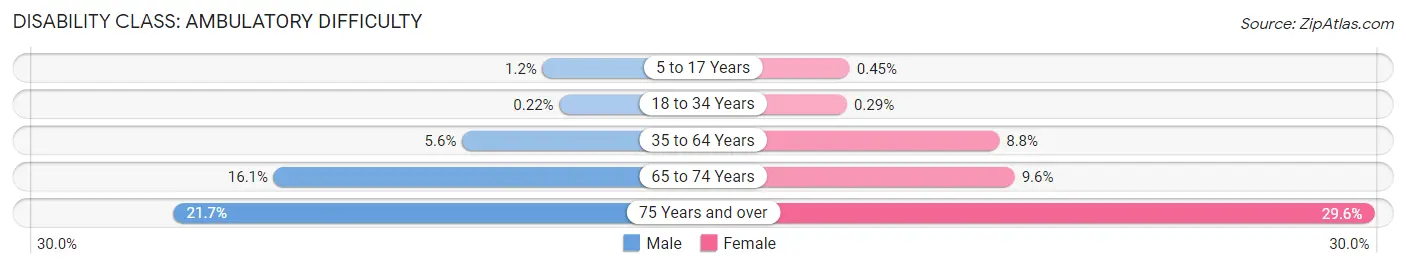
| Age Bracket | Male | Female |
| 5 to 17 Years | 85 (1.1%) | 34 (0.4%) |
| 18 to 34 Years | 22 (0.2%) | 29 (0.3%) |
| 35 to 64 Years | 760 (5.6%) | 1,250 (8.8%) |
| 65 to 74 Years | 554 (16.1%) | 380 (9.6%) |
| 75 Years and over | 363 (21.7%) | 893 (29.6%) |
Disability Class: Self-Care Difficulty
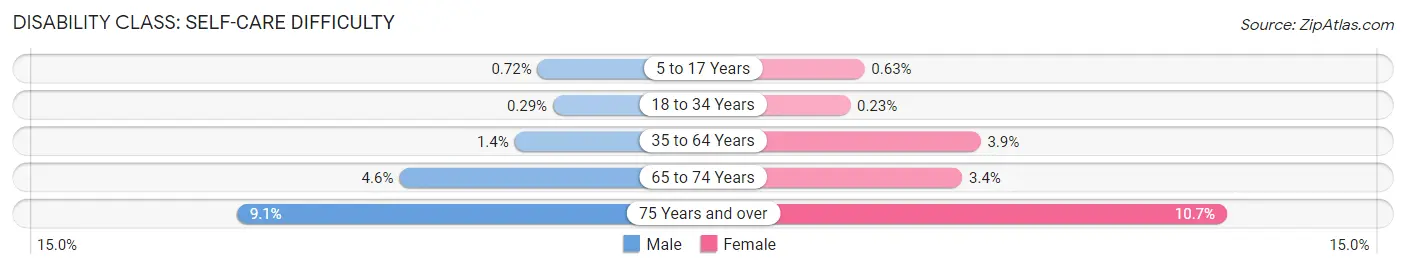
| Age Bracket | Male | Female |
| 5 to 17 Years | 53 (0.7%) | 47 (0.6%) |
| 18 to 34 Years | 30 (0.3%) | 23 (0.2%) |
| 35 to 64 Years | 183 (1.4%) | 550 (3.9%) |
| 65 to 74 Years | 157 (4.6%) | 132 (3.4%) |
| 75 Years and over | 152 (9.1%) | 323 (10.7%) |
Technology Access in Longview
Computing Device Access in Longview
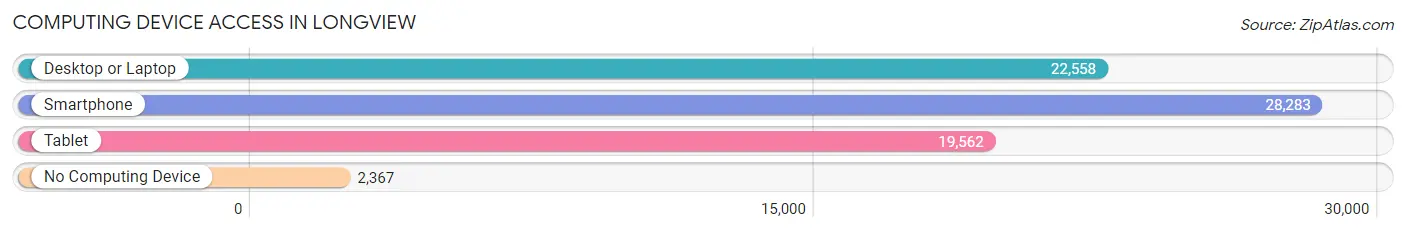
| Device Type | # Households | % Households |
| Desktop or Laptop | 22,558 | 70.1% |
| Smartphone | 28,283 | 87.9% |
| Tablet | 19,562 | 60.8% |
| No Computing Device | 2,367 | 7.4% |
| Total | 32,169 | 100.0% |
Internet Access in Longview
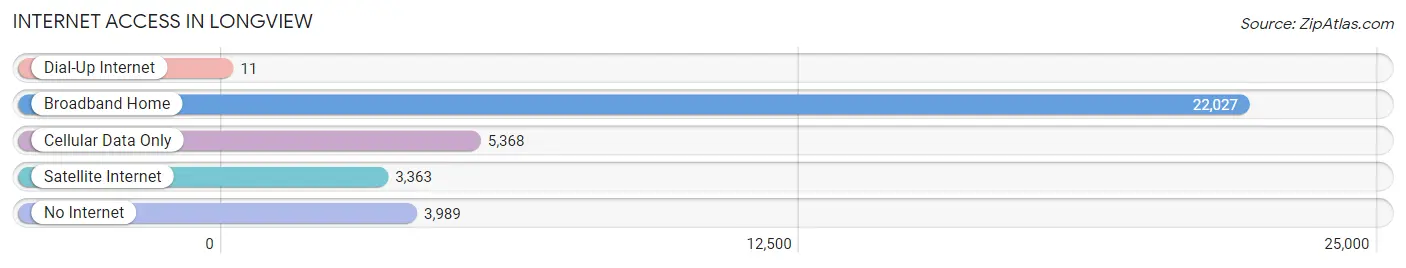
| Internet Type | # Households | % Households |
| Dial-Up Internet | 11 | 0.0% |
| Broadband Home | 22,027 | 68.5% |
| Cellular Data Only | 5,368 | 16.7% |
| Satellite Internet | 3,363 | 10.4% |
| No Internet | 3,989 | 12.4% |
| Total | 32,169 | 100.0% |
Longview Summary
Longview, Texas is a city located in Gregg and Harrison Counties in the northeastern part of the state. It is the county seat of Gregg County and is the largest city in the Longview Metropolitan Statistical Area. The city was founded in 1871 and has a population of approximately 80,000 people.
History
Longview was founded in 1871 by a group of settlers from the nearby town of Gilmer. The settlers were led by John Gregg, who named the town after his father, Thomas Long. The town was originally a small farming community, but it quickly grew into a bustling city. In 1873, the Texas and Pacific Railway arrived in Longview, connecting the city to the rest of the state. This allowed for the growth of the city’s economy and population.
In the early 1900s, Longview experienced a period of rapid growth. The city’s population increased from 1,000 in 1900 to over 10,000 by 1930. This growth was largely due to the discovery of oil in the area in 1930. The discovery of oil led to the development of the Longview Oil Field, which is still in operation today.
In the 1950s, Longview experienced another period of growth. The city’s population increased from 15,000 in 1950 to over 50,000 by 1970. This growth was largely due to the development of the city’s industrial sector. The city’s economy was largely based on the production of oil and gas, as well as the manufacturing of paper products.
Geography
Longview is located in the northeastern part of Texas, in Gregg and Harrison Counties. The city is situated on the banks of the Sabine River, which forms the border between Texas and Louisiana. The city is located approximately 100 miles east of Dallas and 150 miles north of Houston.
The city has a total area of 33.3 square miles, of which 32.9 square miles is land and 0.4 square miles is water. The city is located in the Piney Woods region of Texas, which is characterized by rolling hills and dense forests.
Economy
Longview’s economy is largely based on the production of oil and gas, as well as the manufacturing of paper products. The city is home to several large oil and gas companies, including ExxonMobil, Chevron, and Shell. The city is also home to several paper mills, including International Paper and Georgia-Pacific.
The city’s economy is also supported by a number of other industries, including healthcare, retail, and tourism. The city is home to several hospitals and medical centers, as well as a number of retail stores and restaurants. The city is also a popular tourist destination, with attractions such as the Longview Zoo and the Longview Museum of Fine Arts.
Demographics
As of the 2010 census, Longview had a population of 80,455 people. The city’s population is largely white (63.2%), followed by African American (25.2%), Hispanic (7.3%), and Asian (2.3%). The median household income in the city is $41,945, and the median home value is $117,400.
Longview is a diverse city with a rich history and a vibrant economy. The city is home to a number of large companies, as well as a number of smaller businesses. The city is also a popular tourist destination, with attractions such as the Longview Zoo and the Longview Museum of Fine Arts. Longview is a great place to live, work, and play.
Common Questions
What is Per Capita Income in Longview?
Per Capita income in Longview is $32,366.
What is the Median Family Income in Longview?
Median Family Income in Longview is $71,347.
What is the Median Household income in Longview?
Median Household Income in Longview is $61,003.
What is Income or Wage Gap in Longview?
Income or Wage Gap in Longview is 36.6%.
Women in Longview earn 63.4 cents for every dollar earned by a man.
What is Family Income Deficit in Longview?
Family Income Deficit in Longview is $10,851.
Families that are below poverty line in Longview earn $10,851 less on average than the poverty threshold level.
What is Inequality or Gini Index in Longview?
Inequality or Gini Index in Longview is 0.46.
What is the Total Population of Longview?
Total Population of Longview is 82,176.
What is the Total Male Population of Longview?
Total Male Population of Longview is 40,181.
What is the Total Female Population of Longview?
Total Female Population of Longview is 41,995.
What is the Ratio of Males per 100 Females in Longview?
There are 95.68 Males per 100 Females in Longview.
What is the Ratio of Females per 100 Males in Longview?
There are 104.51 Females per 100 Males in Longview.
What is the Median Population Age in Longview?
Median Population Age in Longview is 35.1 Years.
What is the Average Family Size in Longview
Average Family Size in Longview is 3.1 People.
What is the Average Household Size in Longview
Average Household Size in Longview is 2.4 People.
How Large is the Labor Force in Longview?
There are 39,958 People in the Labor Forcein in Longview.
What is the Percentage of People in the Labor Force in Longview?
62.1% of People are in the Labor Force in Longview.
What is the Unemployment Rate in Longview?
Unemployment Rate in Longview is 3.5%.