Hereford, TX Map & Demographics
Hereford Map
Hereford Overview
$22,093
PER CAPITA INCOME
$52,750
AVG FAMILY INCOME
$51,164
AVG HOUSEHOLD INCOME
25.3%
WAGE / INCOME GAP [ % ]
74.7¢/ $1
WAGE / INCOME GAP [ $ ]
$11,647
FAMILY INCOME DEFICIT
0.40
INEQUALITY / GINI INDEX
14,943
TOTAL POPULATION
7,524
MALE POPULATION
7,419
FEMALE POPULATION
101.42
MALES / 100 FEMALES
98.60
FEMALES / 100 MALES
29.6
MEDIAN AGE
3.5
AVG FAMILY SIZE
3.0
AVG HOUSEHOLD SIZE
6,929
LABOR FORCE [ PEOPLE ]
65.3%
PERCENT IN LABOR FORCE
2.7%
UNEMPLOYMENT RATE
Hereford Zip Codes
Hereford Area Codes
Income in Hereford
Income Overview in Hereford
Per Capita Income in Hereford is $22,093, while median incomes of families and households are $52,750 and $51,164 respectively.
| Characteristic | Number | Measure |
| Per Capita Income | 14,943 | $22,093 |
| Median Family Income | 3,718 | $52,750 |
| Mean Family Income | 3,718 | $71,613 |
| Median Household Income | 4,846 | $51,164 |
| Mean Household Income | 4,846 | $66,356 |
| Income Deficit | 3,718 | $11,647 |
| Wage / Income Gap (%) | 14,943 | 25.33% |
| Wage / Income Gap ($) | 14,943 | 74.67¢ per $1 |
| Gini / Inequality Index | 14,943 | 0.40 |
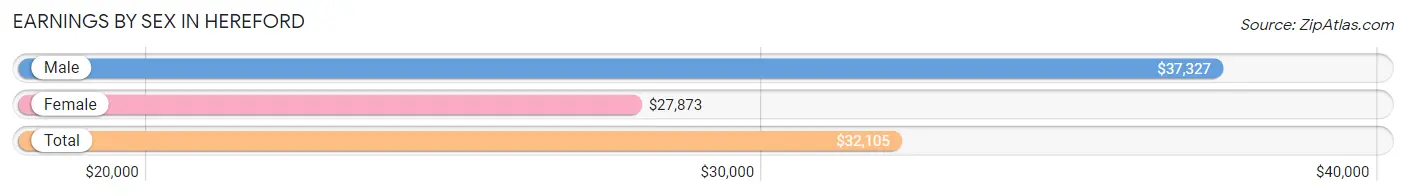
Earnings by Sex in Hereford
Average Earnings in Hereford are $32,105, $37,327 for men and $27,873 for women, a difference of 25.3%.
| Sex | Number | Average Earnings |
| Male | 4,201 (58.6%) | $37,327 |
| Female | 2,972 (41.4%) | $27,873 |
| Total | 7,173 (100.0%) | $32,105 |
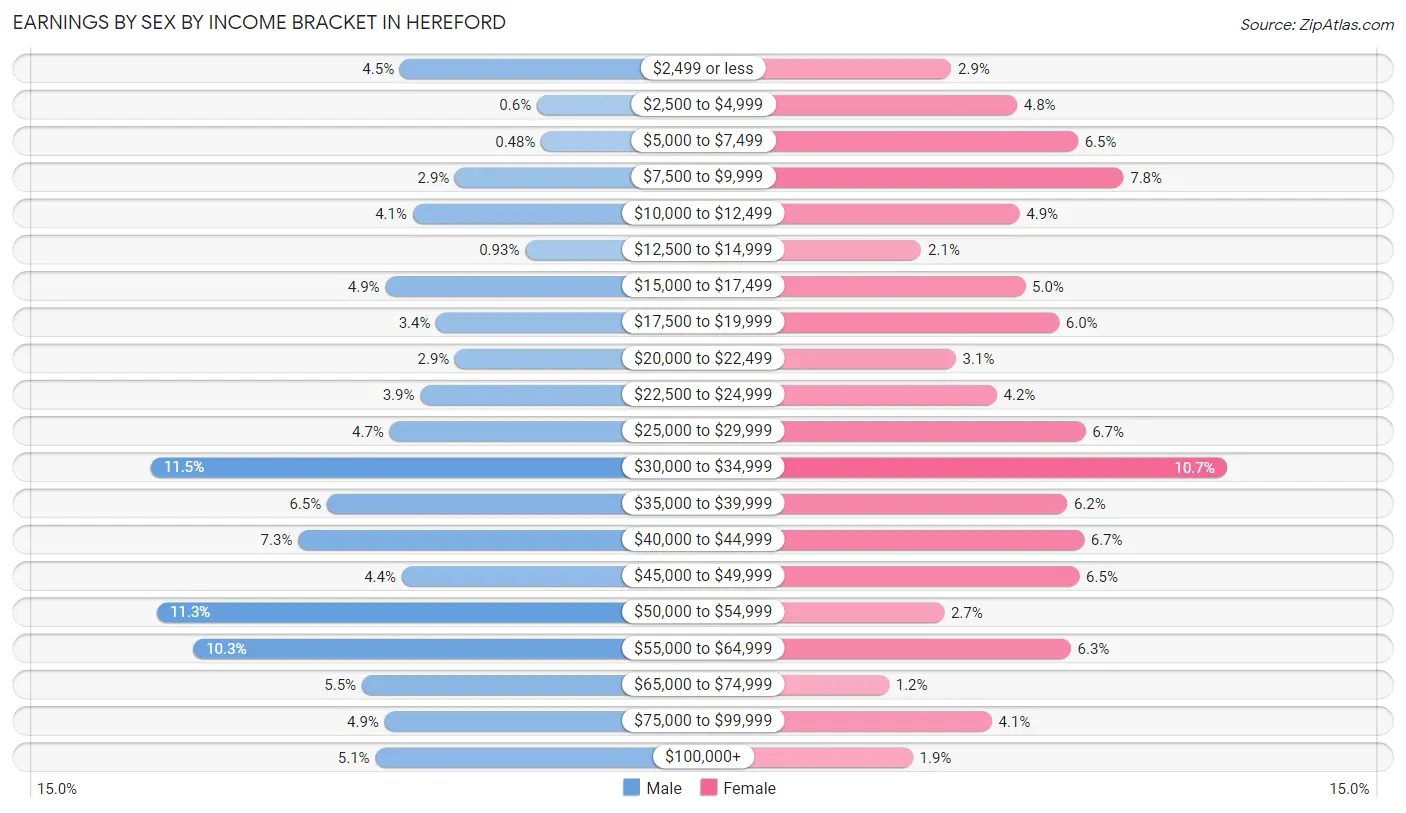
Earnings by Sex by Income Bracket in Hereford
The most common earnings brackets in Hereford are $30,000 to $34,999 for men (481 | 11.5%) and $30,000 to $34,999 for women (317 | 10.7%).
| Income | Male | Female |
| $2,499 or less | 187 (4.4%) | 87 (2.9%) |
| $2,500 to $4,999 | 25 (0.6%) | 142 (4.8%) |
| $5,000 to $7,499 | 20 (0.5%) | 193 (6.5%) |
| $7,500 to $9,999 | 122 (2.9%) | 231 (7.8%) |
| $10,000 to $12,499 | 172 (4.1%) | 144 (4.9%) |
| $12,500 to $14,999 | 39 (0.9%) | 62 (2.1%) |
| $15,000 to $17,499 | 204 (4.9%) | 149 (5.0%) |
| $17,500 to $19,999 | 144 (3.4%) | 177 (6.0%) |
| $20,000 to $22,499 | 122 (2.9%) | 91 (3.1%) |
| $22,500 to $24,999 | 163 (3.9%) | 125 (4.2%) |
| $25,000 to $29,999 | 199 (4.7%) | 199 (6.7%) |
| $30,000 to $34,999 | 481 (11.5%) | 317 (10.7%) |
| $35,000 to $39,999 | 273 (6.5%) | 184 (6.2%) |
| $40,000 to $44,999 | 307 (7.3%) | 198 (6.7%) |
| $45,000 to $49,999 | 185 (4.4%) | 194 (6.5%) |
| $50,000 to $54,999 | 474 (11.3%) | 81 (2.7%) |
| $55,000 to $64,999 | 431 (10.3%) | 187 (6.3%) |
| $65,000 to $74,999 | 232 (5.5%) | 35 (1.2%) |
| $75,000 to $99,999 | 205 (4.9%) | 121 (4.1%) |
| $100,000+ | 216 (5.1%) | 55 (1.8%) |
| Total | 4,201 (100.0%) | 2,972 (100.0%) |
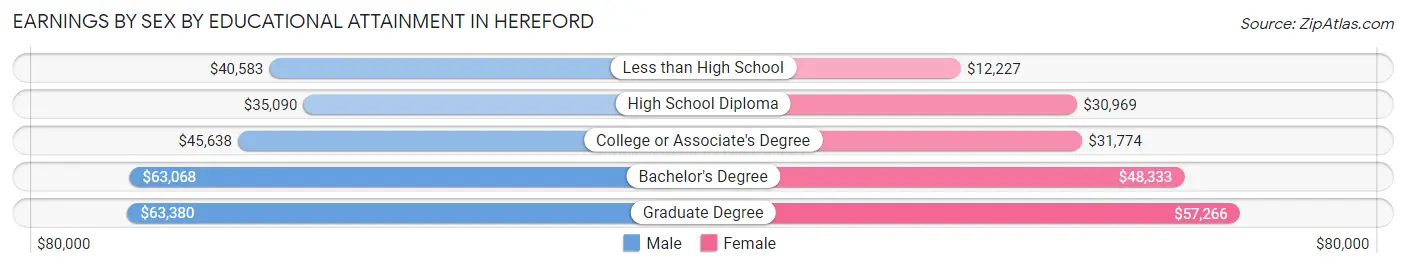
Earnings by Sex by Educational Attainment in Hereford
Average earnings in Hereford are $43,414 for men and $31,126 for women, a difference of 28.3%. Men with an educational attainment of graduate degree enjoy the highest average annual earnings of $63,380, while those with high school diploma education earn the least with $35,090. Women with an educational attainment of graduate degree earn the most with the average annual earnings of $57,266, while those with less than high school education have the smallest earnings of $12,227.
| Educational Attainment | Male Income | Female Income |
| Less than High School | $40,583 | $12,227 |
| High School Diploma | $35,090 | $30,969 |
| College or Associate's Degree | $45,638 | $31,774 |
| Bachelor's Degree | $63,068 | $48,333 |
| Graduate Degree | $63,380 | $57,266 |
| Total | $43,414 | $31,126 |
Family Income in Hereford
Family Income Brackets in Hereford
According to the Hereford family income data, there are 807 families falling into the $50,000 to $74,999 income range, which is the most common income bracket and makes up 21.7% of all families. Conversely, the $200,000+ income bracket is the least frequent group with only 123 families (3.3%) belonging to this category.
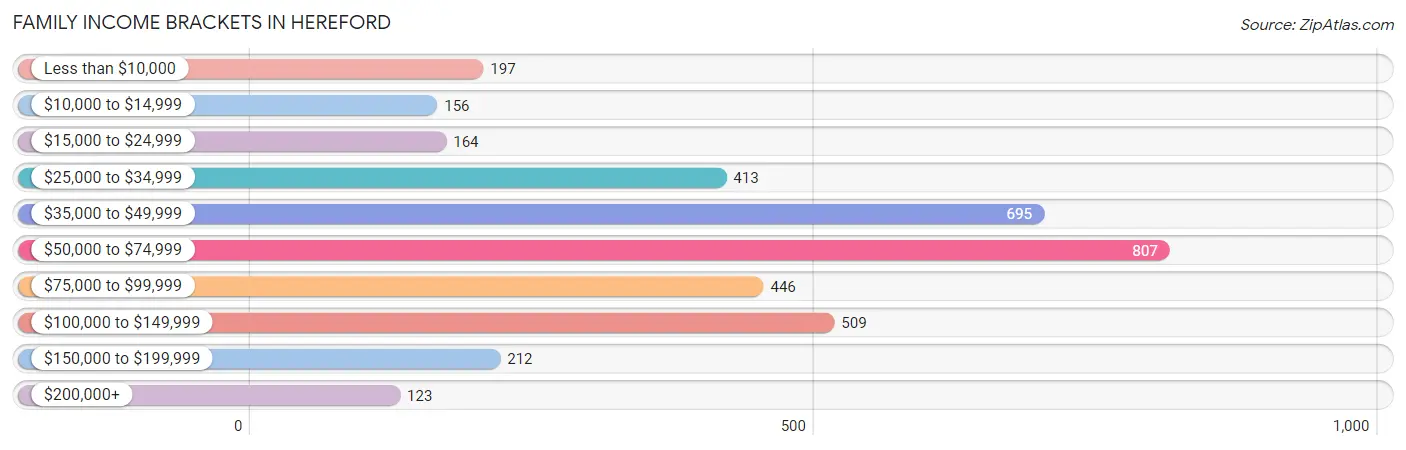
| Income Bracket | # Families | % Families |
| Less than $10,000 | 197 | 5.3% |
| $10,000 to $14,999 | 156 | 4.2% |
| $15,000 to $24,999 | 164 | 4.4% |
| $25,000 to $34,999 | 413 | 11.1% |
| $35,000 to $49,999 | 695 | 18.7% |
| $50,000 to $74,999 | 807 | 21.7% |
| $75,000 to $99,999 | 446 | 12.0% |
| $100,000 to $149,999 | 509 | 13.7% |
| $150,000 to $199,999 | 212 | 5.7% |
| $200,000+ | 123 | 3.3% |
Family Income by Famaliy Size in Hereford
6-person families (207 | 5.6%) account for the highest median family income in Hereford with $124,598 per family, while 3-person families (787 | 21.2%) have the highest median income of $24,571 per family member.
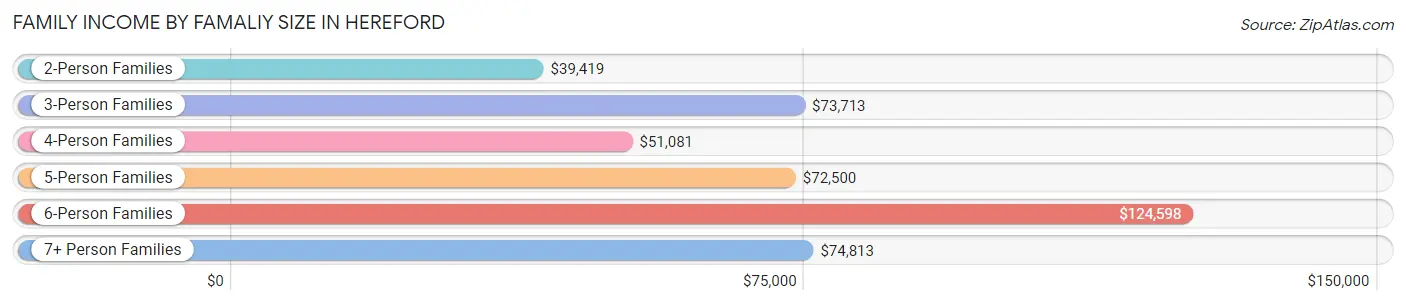
| Income Bracket | # Families | Median Income |
| 2-Person Families | 1,616 (43.5%) | $39,419 |
| 3-Person Families | 787 (21.2%) | $73,713 |
| 4-Person Families | 625 (16.8%) | $51,081 |
| 5-Person Families | 298 (8.0%) | $72,500 |
| 6-Person Families | 207 (5.6%) | $124,598 |
| 7+ Person Families | 185 (5.0%) | $74,813 |
| Total | 3,718 (100.0%) | $52,750 |
Family Income by Number of Earners in Hereford
The median family income in Hereford is $52,750, with families comprising 3+ earners (383) having the highest median family income of $113,098, while families with no earners (310) have the lowest median family income of $25,789, accounting for 10.3% and 8.3% of families, respectively.
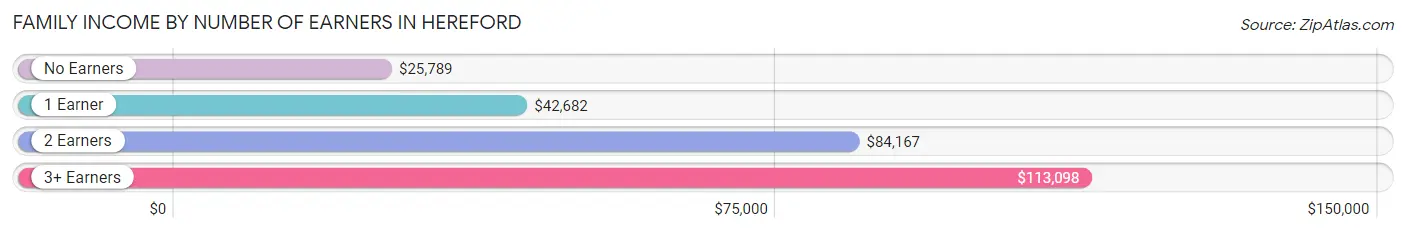
| Number of Earners | # Families | Median Income |
| No Earners | 310 (8.3%) | $25,789 |
| 1 Earner | 1,481 (39.8%) | $42,682 |
| 2 Earners | 1,544 (41.5%) | $84,167 |
| 3+ Earners | 383 (10.3%) | $113,098 |
| Total | 3,718 (100.0%) | $52,750 |
Household Income in Hereford
Household Income Brackets in Hereford
With 1,037 households falling in the category, the $35,000 to $49,999 income range is the most frequent in Hereford, accounting for 21.4% of all households. In contrast, only 121 households (2.5%) fall into the $200,000+ income bracket, making it the least populous group.
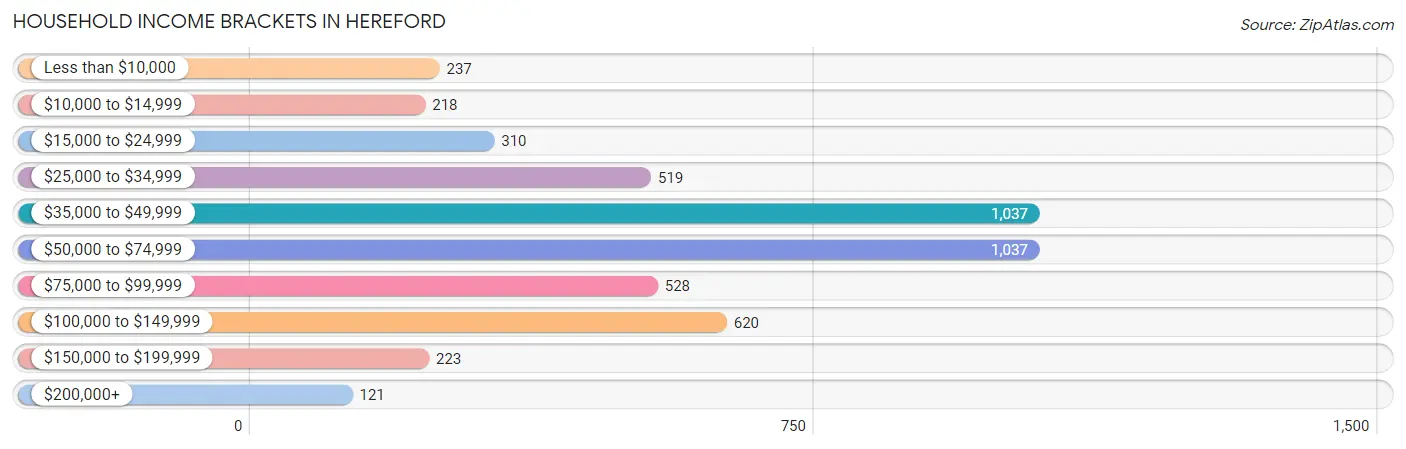
| Income Bracket | # Households | % Households |
| Less than $10,000 | 237 | 4.9% |
| $10,000 to $14,999 | 218 | 4.5% |
| $15,000 to $24,999 | 310 | 6.4% |
| $25,000 to $34,999 | 519 | 10.7% |
| $35,000 to $49,999 | 1,037 | 21.4% |
| $50,000 to $74,999 | 1,037 | 21.4% |
| $75,000 to $99,999 | 528 | 10.9% |
| $100,000 to $149,999 | 620 | 12.8% |
| $150,000 to $199,999 | 223 | 4.6% |
| $200,000+ | 121 | 2.5% |
Household Income by Householder Age in Hereford
The median household income in Hereford is $51,164, with the highest median household income of $55,510 found in the 25 to 44 years age bracket for the primary householder. A total of 1,748 households (36.1%) fall into this category. Meanwhile, the 65+ years age bracket for the primary householder has the lowest median household income of $37,163, with 1,060 households (21.9%) in this group.
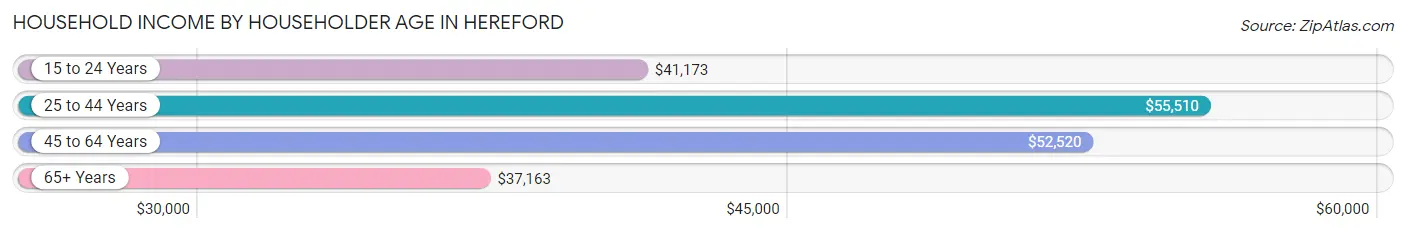
| Income Bracket | # Households | Median Income |
| 15 to 24 Years | 347 (7.2%) | $41,173 |
| 25 to 44 Years | 1,748 (36.1%) | $55,510 |
| 45 to 64 Years | 1,691 (34.9%) | $52,520 |
| 65+ Years | 1,060 (21.9%) | $37,163 |
| Total | 4,846 (100.0%) | $51,164 |
Poverty in Hereford
Income Below Poverty by Sex and Age in Hereford
With 13.5% poverty level for males and 16.4% for females among the residents of Hereford, 16 and 17 year old males and 5 year old females are the most vulnerable to poverty, with 57 males (32.0%) and 70 females (88.6%) in their respective age groups living below the poverty level.
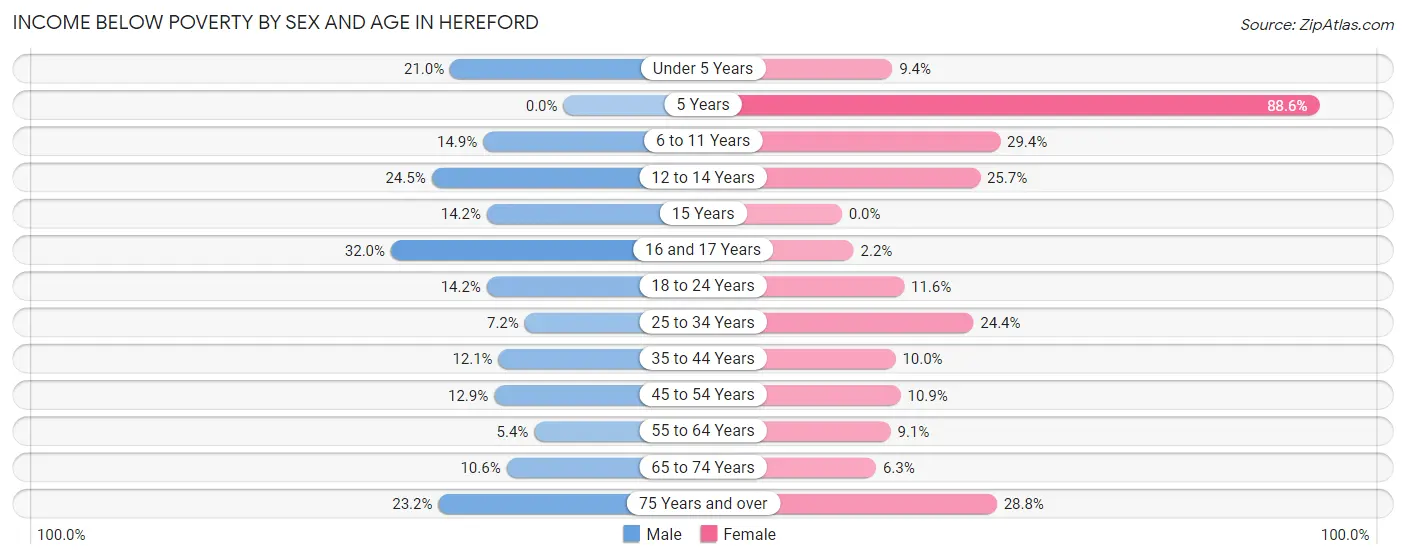
| Age Bracket | Male | Female |
| Under 5 Years | 155 (21.0%) | 49 (9.4%) |
| 5 Years | 0 (0.0%) | 70 (88.6%) |
| 6 to 11 Years | 122 (14.9%) | 237 (29.4%) |
| 12 to 14 Years | 105 (24.5%) | 109 (25.7%) |
| 15 Years | 28 (14.2%) | 0 (0.0%) |
| 16 and 17 Years | 57 (32.0%) | 7 (2.2%) |
| 18 to 24 Years | 116 (14.2%) | 91 (11.6%) |
| 25 to 34 Years | 81 (7.2%) | 275 (24.4%) |
| 35 to 44 Years | 98 (12.0%) | 85 (10.0%) |
| 45 to 54 Years | 80 (12.9%) | 76 (10.9%) |
| 55 to 64 Years | 40 (5.4%) | 65 (9.0%) |
| 65 to 74 Years | 50 (10.5%) | 35 (6.3%) |
| 75 Years and over | 65 (23.2%) | 92 (28.7%) |
| Total | 997 (13.5%) | 1,191 (16.4%) |
Income Above Poverty by Sex and Age in Hereford
According to the poverty statistics in Hereford, males aged 5 years and females aged 15 years are the age groups that are most secure financially, with 100.0% of males and 100.0% of females in these age groups living above the poverty line.
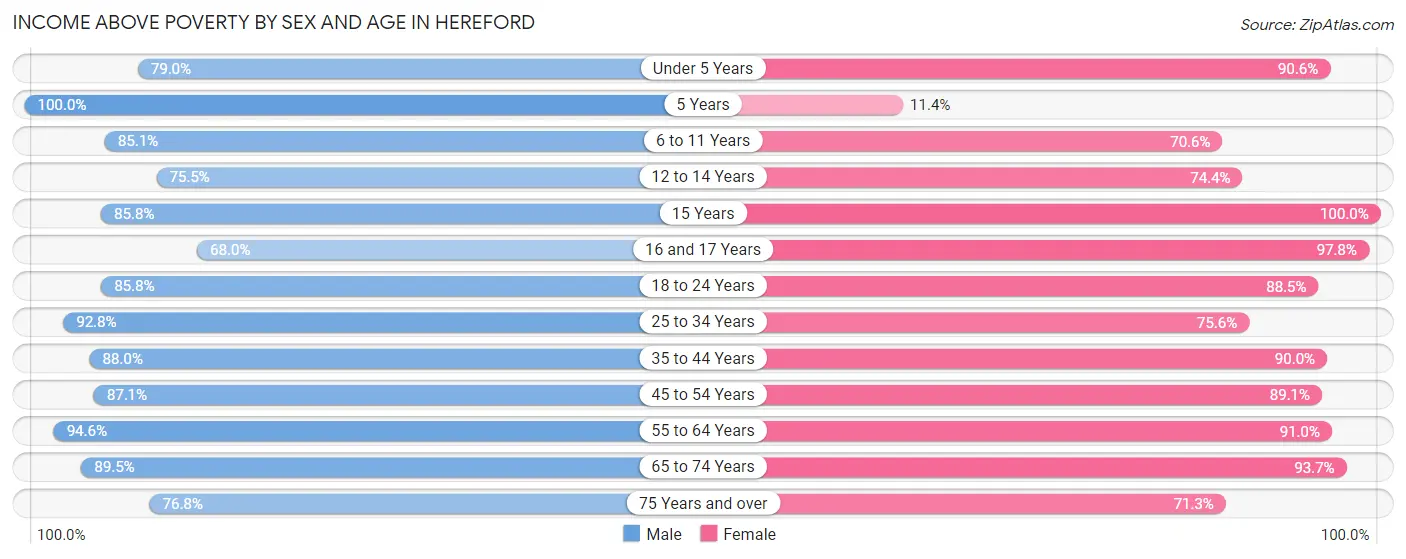
| Age Bracket | Male | Female |
| Under 5 Years | 582 (79.0%) | 474 (90.6%) |
| 5 Years | 181 (100.0%) | 9 (11.4%) |
| 6 to 11 Years | 696 (85.1%) | 570 (70.6%) |
| 12 to 14 Years | 324 (75.5%) | 316 (74.4%) |
| 15 Years | 169 (85.8%) | 38 (100.0%) |
| 16 and 17 Years | 121 (68.0%) | 313 (97.8%) |
| 18 to 24 Years | 699 (85.8%) | 697 (88.4%) |
| 25 to 34 Years | 1,046 (92.8%) | 851 (75.6%) |
| 35 to 44 Years | 715 (87.9%) | 768 (90.0%) |
| 45 to 54 Years | 542 (87.1%) | 621 (89.1%) |
| 55 to 64 Years | 700 (94.6%) | 653 (90.9%) |
| 65 to 74 Years | 424 (89.4%) | 517 (93.7%) |
| 75 Years and over | 215 (76.8%) | 228 (71.3%) |
| Total | 6,414 (86.6%) | 6,055 (83.6%) |
Income Below Poverty Among Married-Couple Families in Hereford
The poverty statistics for married-couple families in Hereford show that 6.0% or 154 of the total 2,544 families live below the poverty line. Families with 5 or more children have the highest poverty rate of 43.2%, comprising of 57 families. On the other hand, families with 1 or 2 children have the lowest poverty rate of 0.4%, which includes 4 families.
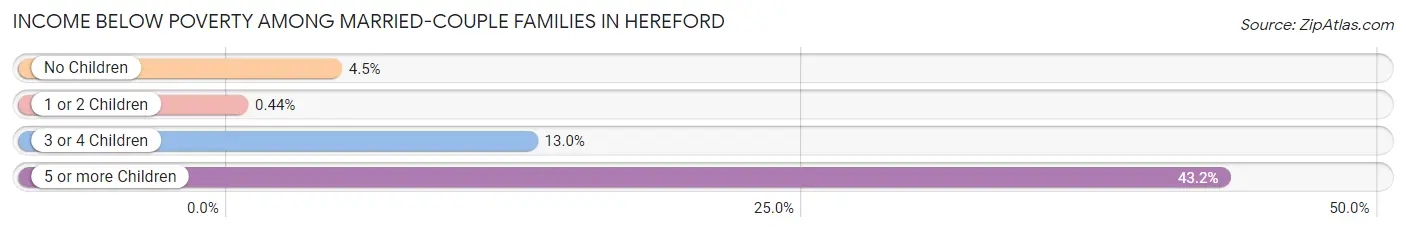
| Children | Above Poverty | Below Poverty |
| No Children | 1,140 (95.5%) | 54 (4.5%) |
| 1 or 2 Children | 915 (99.6%) | 4 (0.4%) |
| 3 or 4 Children | 260 (87.0%) | 39 (13.0%) |
| 5 or more Children | 75 (56.8%) | 57 (43.2%) |
| Total | 2,390 (94.0%) | 154 (6.0%) |
Income Below Poverty Among Single-Parent Households in Hereford
According to the poverty data in Hereford, 28.0% or 130 single-father households and 26.2% or 186 single-mother households are living below the poverty line. Among single-father households, those with no children have the highest poverty rate, with 83 households (35.0%) experiencing poverty. Likewise, among single-mother households, those with 1 or 2 children have the highest poverty rate, with 161 households (37.5%) falling below the poverty line.
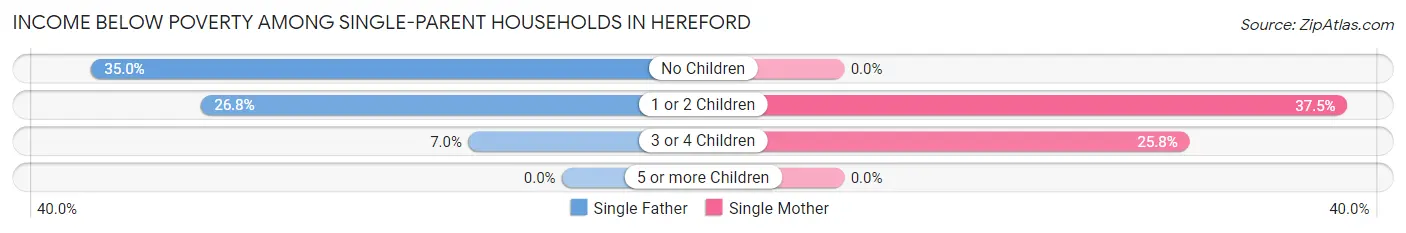
| Children | Single Father | Single Mother |
| No Children | 83 (35.0%) | 0 (0.0%) |
| 1 or 2 Children | 44 (26.8%) | 161 (37.5%) |
| 3 or 4 Children | 3 (7.0%) | 25 (25.8%) |
| 5 or more Children | 0 (0.0%) | 0 (0.0%) |
| Total | 130 (28.0%) | 186 (26.2%) |
Income Below Poverty Among Married-Couple vs Single-Parent Households in Hereford
The poverty data for Hereford shows that 154 of the married-couple family households (6.0%) and 316 of the single-parent households (26.9%) are living below the poverty level. Within the married-couple family households, those with 5 or more children have the highest poverty rate, with 57 households (43.2%) falling below the poverty line. Among the single-parent households, those with 1 or 2 children have the highest poverty rate, with 205 household (34.6%) living below poverty.
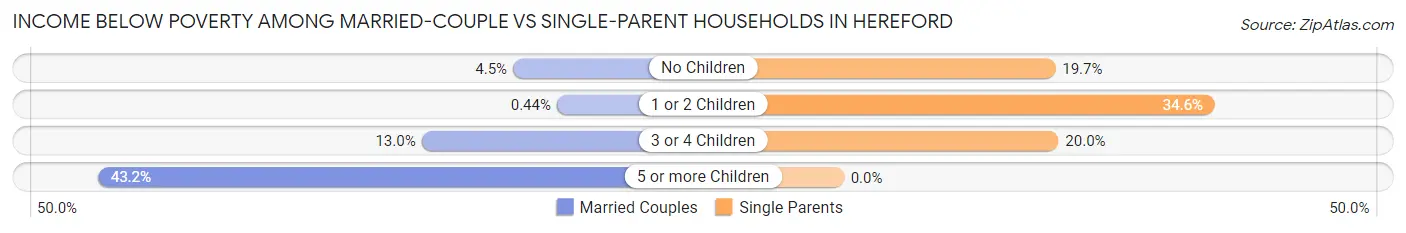
| Children | Married-Couple Families | Single-Parent Households |
| No Children | 54 (4.5%) | 83 (19.7%) |
| 1 or 2 Children | 4 (0.4%) | 205 (34.6%) |
| 3 or 4 Children | 39 (13.0%) | 28 (20.0%) |
| 5 or more Children | 57 (43.2%) | 0 (0.0%) |
| Total | 154 (6.0%) | 316 (26.9%) |
Race in Hereford
The most populous races in Hereford are Hispanic or Latino (12,092 | 80.9%), White / Caucasian (8,982 | 60.1%), and Two or more Races (3,994 | 26.7%).
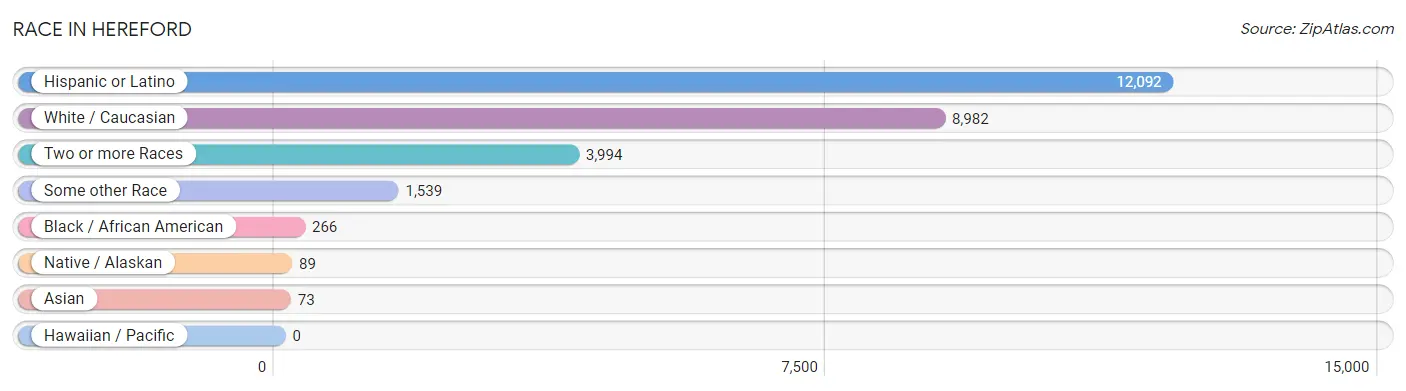
| Race | # Population | % Population |
| Asian | 73 | 0.5% |
| Black / African American | 266 | 1.8% |
| Hawaiian / Pacific | 0 | 0.0% |
| Hispanic or Latino | 12,092 | 80.9% |
| Native / Alaskan | 89 | 0.6% |
| White / Caucasian | 8,982 | 60.1% |
| Two or more Races | 3,994 | 26.7% |
| Some other Race | 1,539 | 10.3% |
| Total | 14,943 | 100.0% |
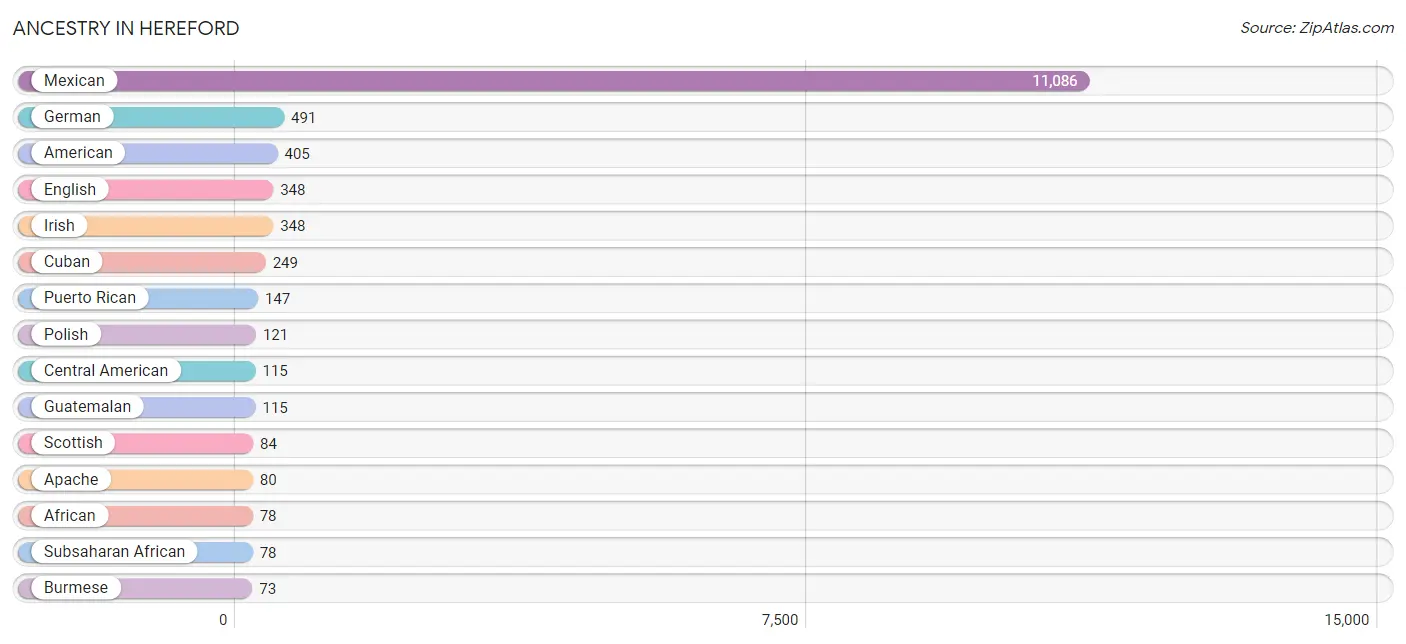
Ancestry in Hereford
The most populous ancestries reported in Hereford are Mexican (11,086 | 74.2%), German (491 | 3.3%), American (405 | 2.7%), English (348 | 2.3%), and Irish (348 | 2.3%), together accounting for 84.9% of all Hereford residents.
| Ancestry | # Population | % Population |
| African | 78 | 0.5% |
| American | 405 | 2.7% |
| Apache | 80 | 0.5% |
| British | 43 | 0.3% |
| Burmese | 73 | 0.5% |
| Central American | 115 | 0.8% |
| Central American Indian | 21 | 0.1% |
| Cherokee | 72 | 0.5% |
| Choctaw | 72 | 0.5% |
| Cuban | 249 | 1.7% |
| Czech | 14 | 0.1% |
| Dutch | 64 | 0.4% |
| Eastern European | 10 | 0.1% |
| English | 348 | 2.3% |
| European | 64 | 0.4% |
| Finnish | 42 | 0.3% |
| French | 42 | 0.3% |
| German | 491 | 3.3% |
| Guatemalan | 115 | 0.8% |
| Irish | 348 | 2.3% |
| Italian | 34 | 0.2% |
| Mexican | 11,086 | 74.2% |
| Norwegian | 35 | 0.2% |
| Polish | 121 | 0.8% |
| Puerto Rican | 147 | 1.0% |
| Scotch-Irish | 67 | 0.4% |
| Scottish | 84 | 0.6% |
| Seminole | 18 | 0.1% |
| Sioux | 31 | 0.2% |
| Slovak | 10 | 0.1% |
| Spaniard | 10 | 0.1% |
| Subsaharan African | 78 | 0.5% |
| Swiss | 28 | 0.2% |
| Welsh | 38 | 0.3% | View All 34 Rows |
Immigrants in Hereford
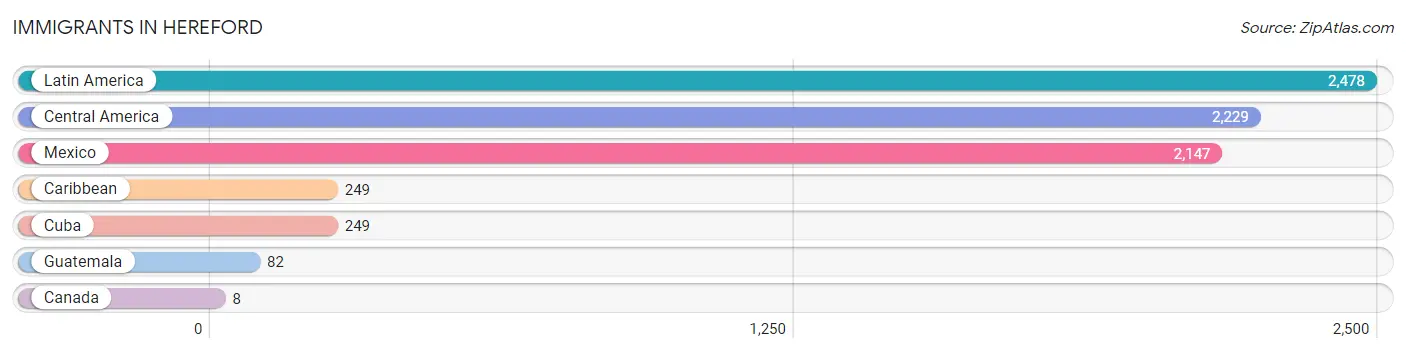
The most numerous immigrant groups reported in Hereford came from Latin America (2,478 | 16.6%), Central America (2,229 | 14.9%), Mexico (2,147 | 14.4%), Caribbean (249 | 1.7%), and Cuba (249 | 1.7%), together accounting for 49.2% of all Hereford residents.
| Immigration Origin | # Population | % Population |
| Canada | 8 | 0.1% |
| Caribbean | 249 | 1.7% |
| Central America | 2,229 | 14.9% |
| Cuba | 249 | 1.7% |
| Guatemala | 82 | 0.5% |
| Latin America | 2,478 | 16.6% |
| Mexico | 2,147 | 14.4% | View All 7 Rows |
Sex and Age in Hereford
Sex and Age in Hereford
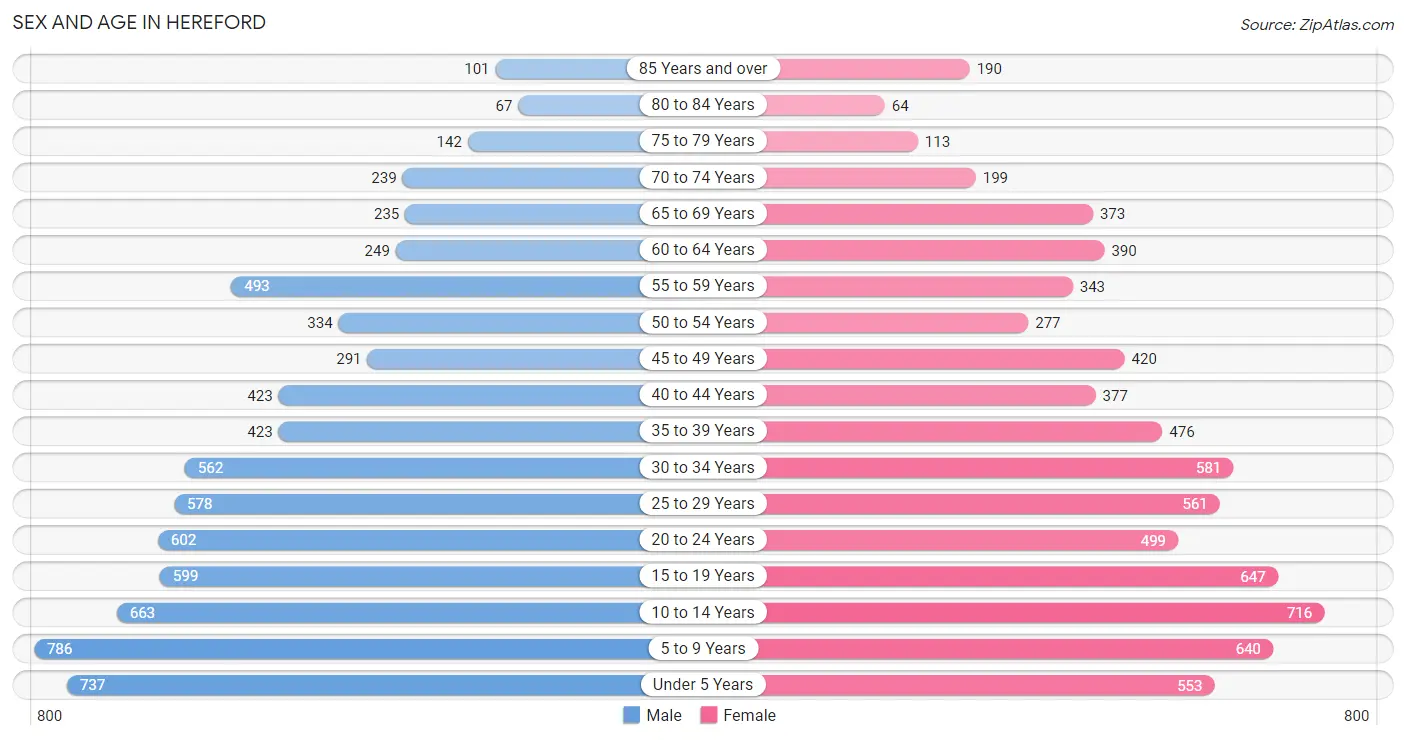
The most populous age groups in Hereford are 5 to 9 Years (786 | 10.4%) for men and 10 to 14 Years (716 | 9.7%) for women.
| Age Bracket | Male | Female |
| Under 5 Years | 737 (9.8%) | 553 (7.4%) |
| 5 to 9 Years | 786 (10.4%) | 640 (8.6%) |
| 10 to 14 Years | 663 (8.8%) | 716 (9.7%) |
| 15 to 19 Years | 599 (8.0%) | 647 (8.7%) |
| 20 to 24 Years | 602 (8.0%) | 499 (6.7%) |
| 25 to 29 Years | 578 (7.7%) | 561 (7.6%) |
| 30 to 34 Years | 562 (7.5%) | 581 (7.8%) |
| 35 to 39 Years | 423 (5.6%) | 476 (6.4%) |
| 40 to 44 Years | 423 (5.6%) | 377 (5.1%) |
| 45 to 49 Years | 291 (3.9%) | 420 (5.7%) |
| 50 to 54 Years | 334 (4.4%) | 277 (3.7%) |
| 55 to 59 Years | 493 (6.6%) | 343 (4.6%) |
| 60 to 64 Years | 249 (3.3%) | 390 (5.3%) |
| 65 to 69 Years | 235 (3.1%) | 373 (5.0%) |
| 70 to 74 Years | 239 (3.2%) | 199 (2.7%) |
| 75 to 79 Years | 142 (1.9%) | 113 (1.5%) |
| 80 to 84 Years | 67 (0.9%) | 64 (0.9%) |
| 85 Years and over | 101 (1.3%) | 190 (2.6%) |
| Total | 7,524 (100.0%) | 7,419 (100.0%) |
Families and Households in Hereford
Median Family Size in Hereford
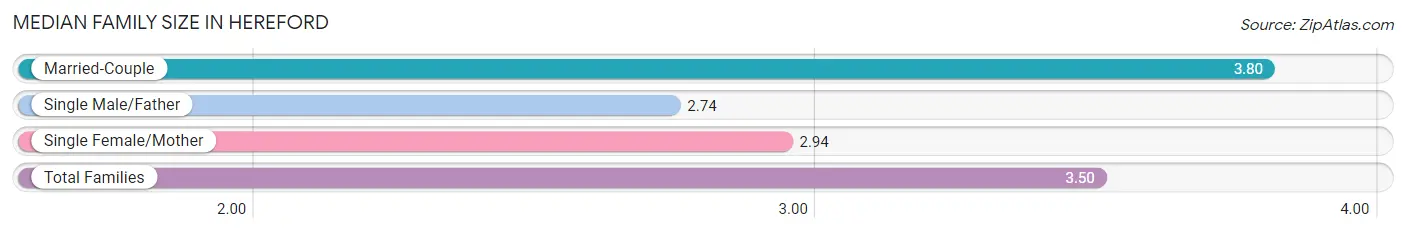
The median family size in Hereford is 3.50 persons per family, with married-couple families (2,544 | 68.4%) accounting for the largest median family size of 3.8 persons per family. On the other hand, single male/father families (464 | 12.5%) represent the smallest median family size with 2.74 persons per family.
| Family Type | # Families | Family Size |
| Married-Couple | 2,544 (68.4%) | 3.80 |
| Single Male/Father | 464 (12.5%) | 2.74 |
| Single Female/Mother | 710 (19.1%) | 2.94 |
| Total Families | 3,718 (100.0%) | 3.50 |
Median Household Size in Hereford
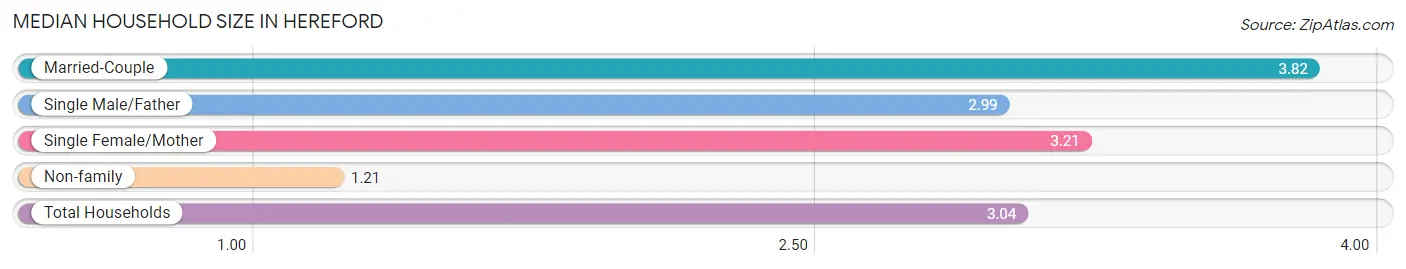
The median household size in Hereford is 3.04 persons per household, with married-couple households (2,544 | 52.5%) accounting for the largest median household size of 3.82 persons per household. non-family households (1,128 | 23.3%) represent the smallest median household size with 1.21 persons per household.
| Household Type | # Households | Household Size |
| Married-Couple | 2,544 (52.5%) | 3.82 |
| Single Male/Father | 464 (9.6%) | 2.99 |
| Single Female/Mother | 710 (14.6%) | 3.21 |
| Non-family | 1,128 (23.3%) | 1.21 |
| Total Households | 4,846 (100.0%) | 3.04 |
Household Size by Marriage Status in Hereford
Out of a total of 4,846 households in Hereford, 3,718 (76.7%) are family households, while 1,128 (23.3%) are nonfamily households. The most numerous type of family households are 2-person households, comprising 1,524, and the most common type of nonfamily households are 1-person households, comprising 952.
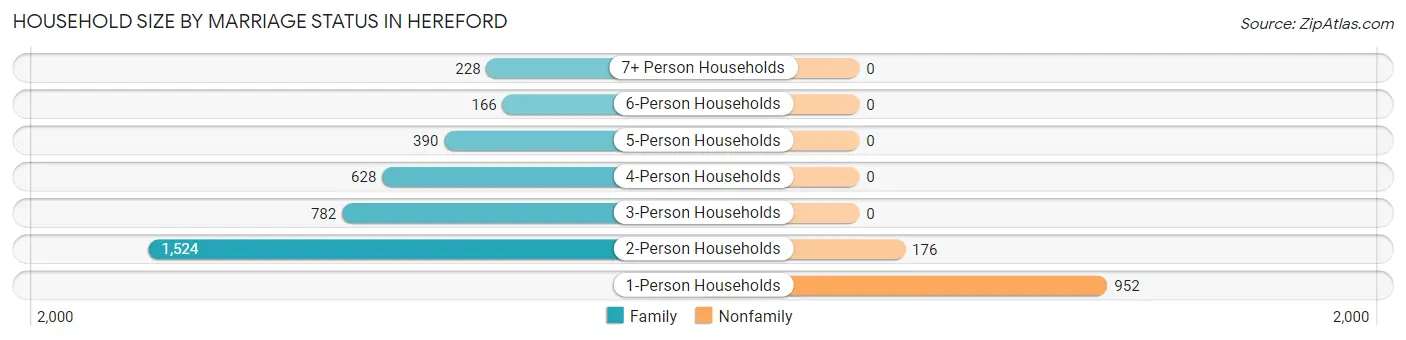
| Household Size | Family Households | Nonfamily Households |
| 1-Person Households | - | 952 (19.7%) |
| 2-Person Households | 1,524 (31.5%) | 176 (3.6%) |
| 3-Person Households | 782 (16.1%) | 0 (0.0%) |
| 4-Person Households | 628 (13.0%) | 0 (0.0%) |
| 5-Person Households | 390 (8.1%) | 0 (0.0%) |
| 6-Person Households | 166 (3.4%) | 0 (0.0%) |
| 7+ Person Households | 228 (4.7%) | 0 (0.0%) |
| Total | 3,718 (76.7%) | 1,128 (23.3%) |
Female Fertility in Hereford
Fertility by Age in Hereford
Average fertility rate in Hereford is 57.0 births per 1,000 women. Women in the age bracket of 20 to 34 years have the highest fertility rate with 100.0 births per 1,000 women. Women in the age bracket of 20 to 34 years acount for 80.4% of all women with births.
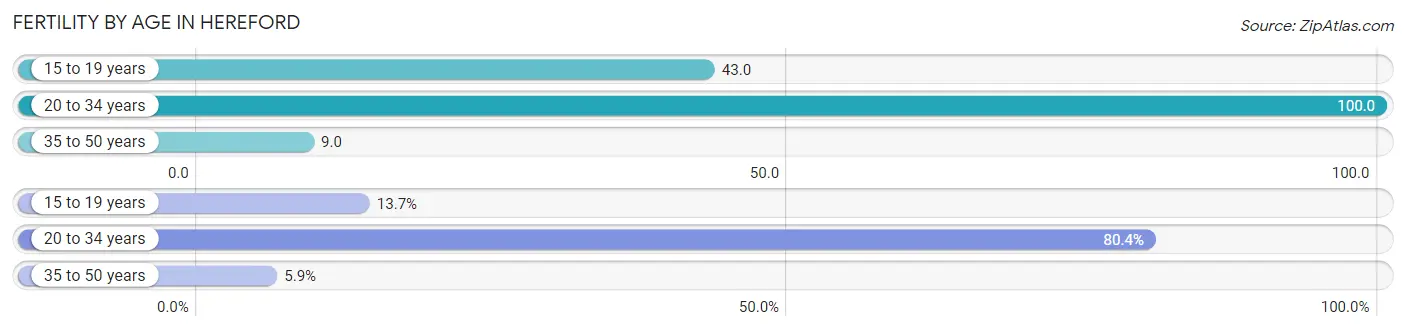
| Age Bracket | Women with Births | Births / 1,000 Women |
| 15 to 19 years | 28 (13.7%) | 43.0 |
| 20 to 34 years | 164 (80.4%) | 100.0 |
| 35 to 50 years | 12 (5.9%) | 9.0 |
| Total | 204 (100.0%) | 57.0 |
Fertility by Age by Marriage Status in Hereford
55.9% of women with births (204) in Hereford are married. The highest percentage of unmarried women with births falls into 15 to 19 years age bracket with 100.0% of them unmarried at the time of birth, while the lowest percentage of unmarried women with births belong to 35 to 50 years age bracket with 0.0% of them unmarried.
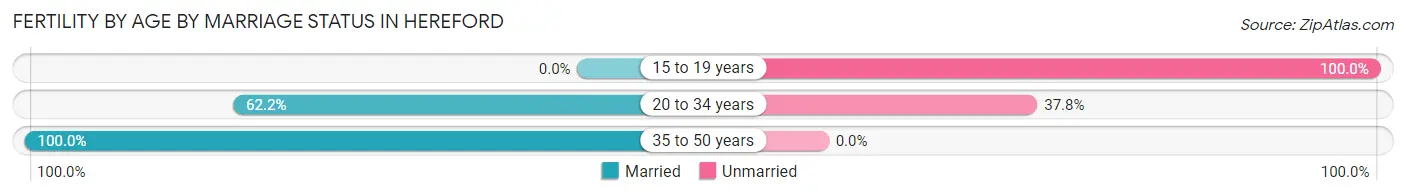
| Age Bracket | Married | Unmarried |
| 15 to 19 years | 0 (0.0%) | 28 (100.0%) |
| 20 to 34 years | 102 (62.2%) | 62 (37.8%) |
| 35 to 50 years | 12 (100.0%) | 0 (0.0%) |
| Total | 114 (55.9%) | 90 (44.1%) |
Fertility by Education in Hereford
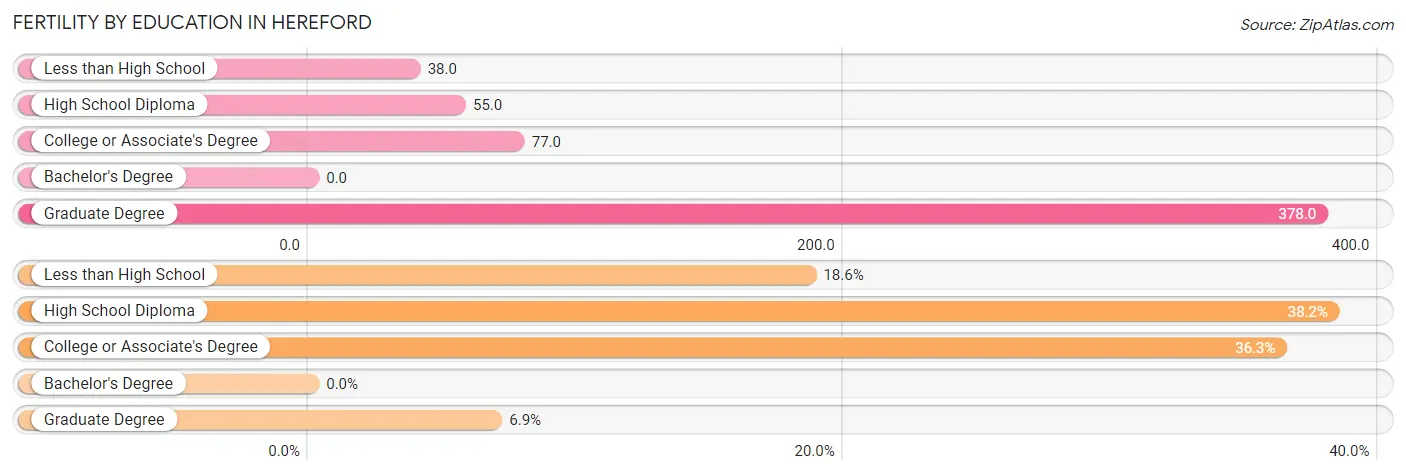
| Educational Attainment | Women with Births | Births / 1,000 Women |
| Less than High School | 38 (18.6%) | 38.0 |
| High School Diploma | 78 (38.2%) | 55.0 |
| College or Associate's Degree | 74 (36.3%) | 77.0 |
| Bachelor's Degree | 0 (0.0%) | 0.0 |
| Graduate Degree | 14 (6.9%) | 378.0 |
| Total | 204 (100.0%) | 57.0 |
Fertility by Education by Marriage Status in Hereford
44.1% of women with births in Hereford are unmarried. Women with the educational attainment of graduate degree are most likely to be married with 100.0% of them married at childbirth, while women with the educational attainment of less than high school are least likely to be married with 100.0% of them unmarried at childbirth.
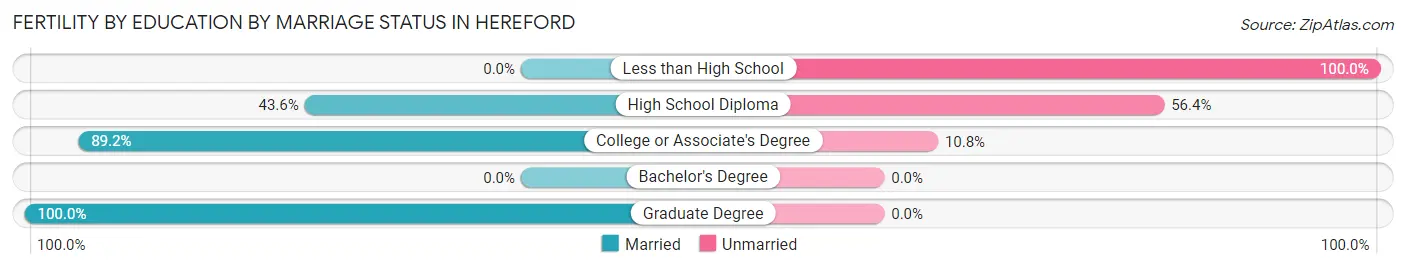
| Educational Attainment | Married | Unmarried |
| Less than High School | 0 (0.0%) | 38 (100.0%) |
| High School Diploma | 34 (43.6%) | 44 (56.4%) |
| College or Associate's Degree | 66 (89.2%) | 8 (10.8%) |
| Bachelor's Degree | 0 (0.0%) | 0 (0.0%) |
| Graduate Degree | 14 (100.0%) | 0 (0.0%) |
| Total | 114 (55.9%) | 90 (44.1%) |
Employment Characteristics in Hereford
Employment by Class of Employer in Hereford
Among the 6,603 employed individuals in Hereford, private company employees (4,889 | 74.0%), local government employees (668 | 10.1%), and self-employed (not incorporated) (412 | 6.2%) make up the most common classes of employment.
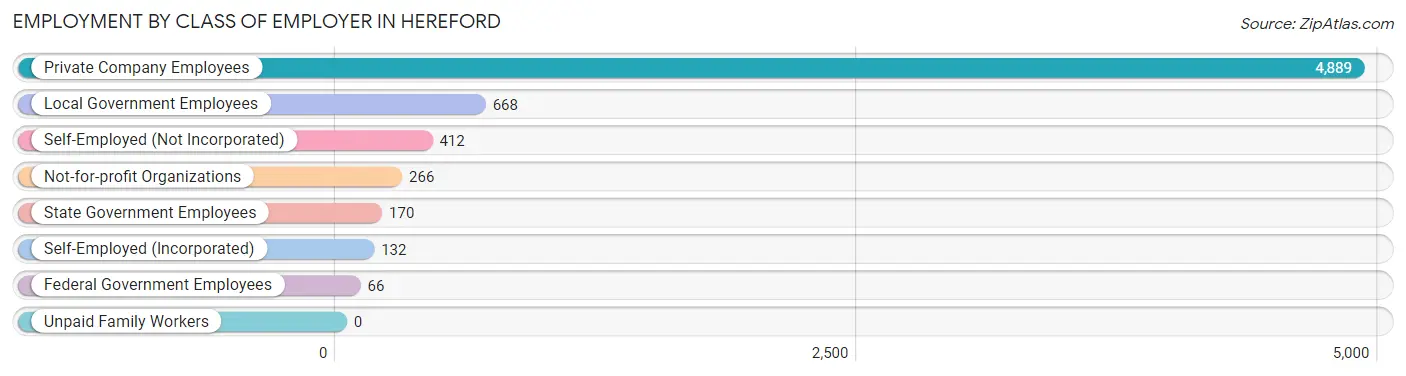
| Employer Class | # Employees | % Employees |
| Private Company Employees | 4,889 | 74.0% |
| Self-Employed (Incorporated) | 132 | 2.0% |
| Self-Employed (Not Incorporated) | 412 | 6.2% |
| Not-for-profit Organizations | 266 | 4.0% |
| Local Government Employees | 668 | 10.1% |
| State Government Employees | 170 | 2.6% |
| Federal Government Employees | 66 | 1.0% |
| Unpaid Family Workers | 0 | 0.0% |
| Total | 6,603 | 100.0% |
Employment Status by Age in Hereford
According to the labor force statistics for Hereford, out of the total population over 16 years of age (10,611), 65.3% or 6,929 individuals are in the labor force, with 2.7% or 187 of them unemployed. The age group with the highest labor force participation rate is 35 to 44 years, with 88.6% or 1,505 individuals in the labor force. Within the labor force, the 16 to 19 years age range has the highest percentage of unemployed individuals, with 8.8% or 39 of them being unemployed.
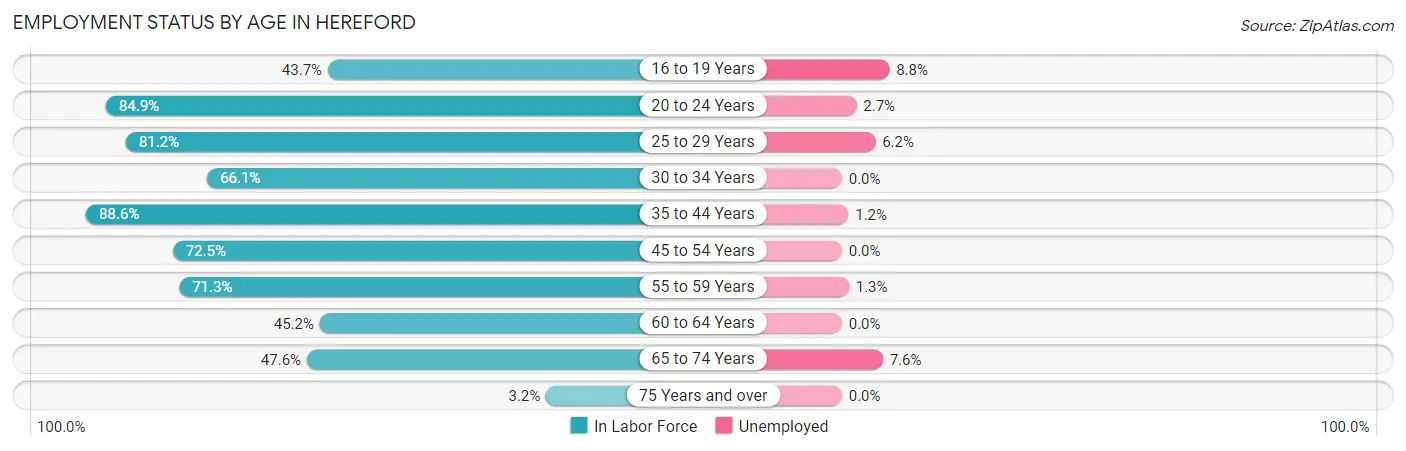
| Age Bracket | In Labor Force | Unemployed |
| 16 to 19 Years | 441 (43.7%) | 39 (8.8%) |
| 20 to 24 Years | 935 (84.9%) | 25 (2.7%) |
| 25 to 29 Years | 925 (81.2%) | 57 (6.2%) |
| 30 to 34 Years | 756 (66.1%) | 0 (0.0%) |
| 35 to 44 Years | 1,505 (88.6%) | 18 (1.2%) |
| 45 to 54 Years | 958 (72.5%) | 0 (0.0%) |
| 55 to 59 Years | 596 (71.3%) | 8 (1.3%) |
| 60 to 64 Years | 289 (45.2%) | 0 (0.0%) |
| 65 to 74 Years | 498 (47.6%) | 38 (7.6%) |
| 75 Years and over | 22 (3.2%) | 0 (0.0%) |
| Total | 6,929 (65.3%) | 187 (2.7%) |
Employment Status by Educational Attainment in Hereford
According to labor force statistics for Hereford, 74.2% of individuals (5,029) out of the total population between 25 and 64 years of age (6,778) are in the labor force, with 1.7% or 85 of them being unemployed. The group with the highest labor force participation rate are those with the educational attainment of college / associate degree, with 86.5% or 1,266 individuals in the labor force. Within the labor force, individuals with high school diploma education have the highest percentage of unemployment, with 2.7% or 65 of them being unemployed.
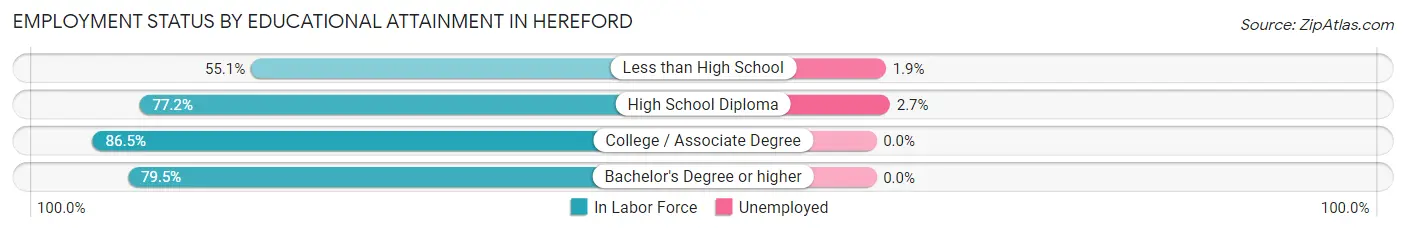
| Educational Attainment | In Labor Force | Unemployed |
| Less than High School | 878 (55.1%) | 30 (1.9%) |
| High School Diploma | 2,412 (77.2%) | 84 (2.7%) |
| College / Associate Degree | 1,266 (86.5%) | 0 (0.0%) |
| Bachelor's Degree or higher | 473 (79.5%) | 0 (0.0%) |
| Total | 5,029 (74.2%) | 115 (1.7%) |
Employment Occupations by Sex in Hereford
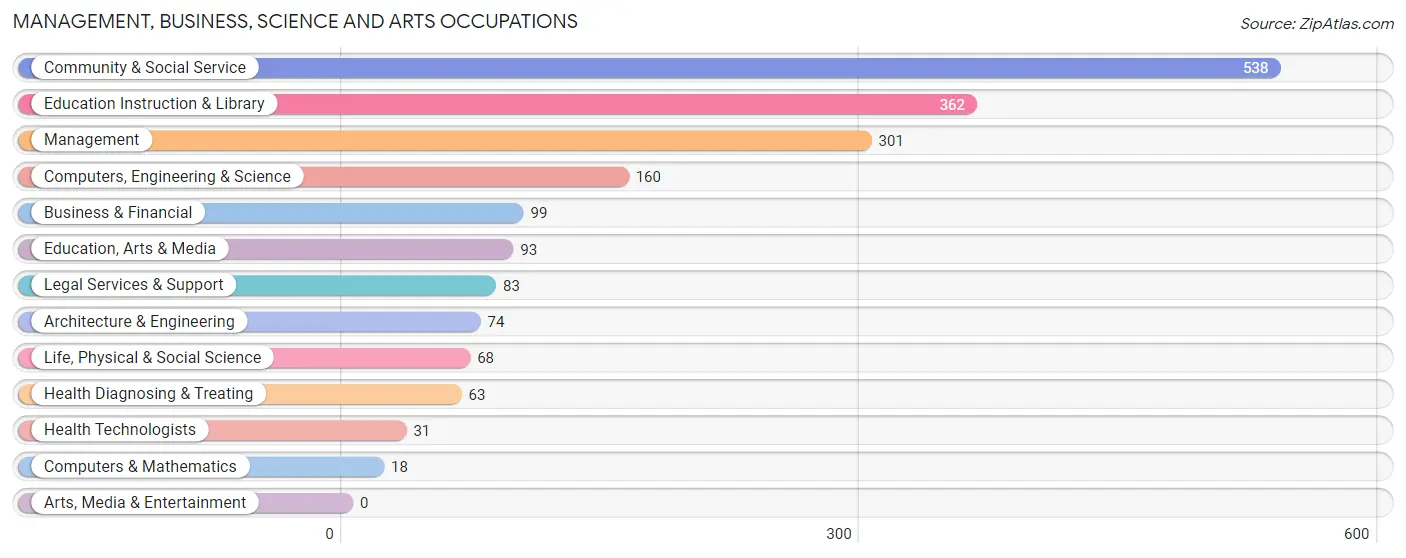
Management, Business, Science and Arts Occupations
The most common Management, Business, Science and Arts occupations in Hereford are Community & Social Service (538 | 8.0%), Education Instruction & Library (362 | 5.4%), Management (301 | 4.5%), Computers, Engineering & Science (160 | 2.4%), and Business & Financial (99 | 1.5%).
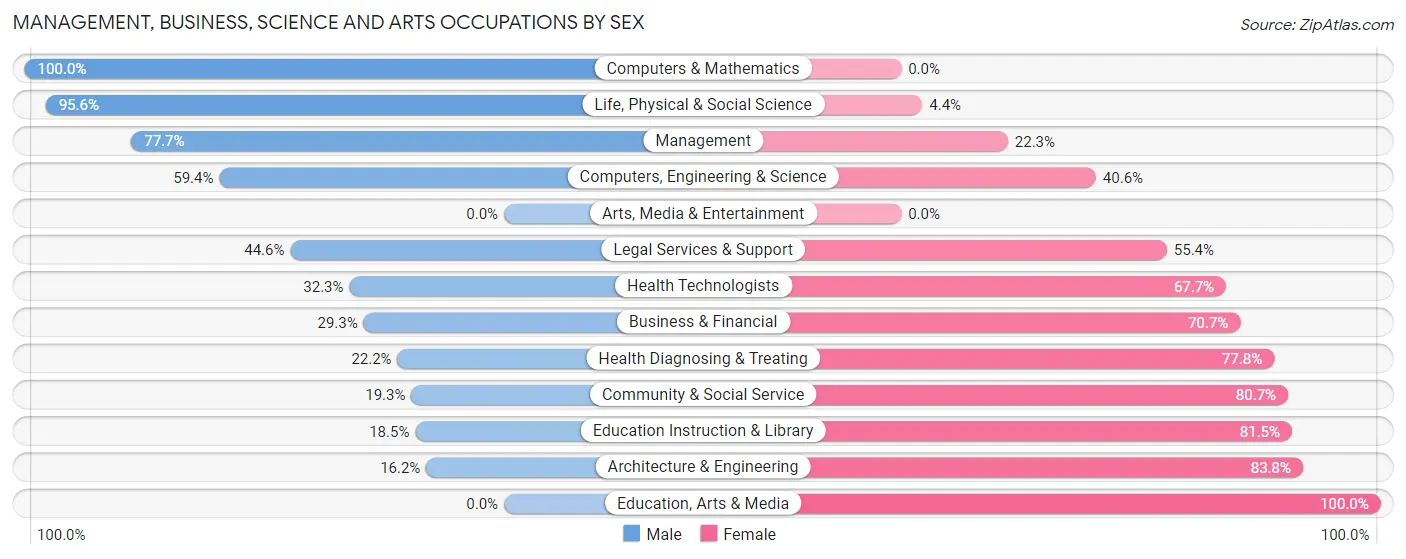
Management, Business, Science and Arts Occupations by Sex
Within the Management, Business, Science and Arts occupations in Hereford, the most male-oriented occupations are Computers & Mathematics (100.0%), Life, Physical & Social Science (95.6%), and Management (77.7%), while the most female-oriented occupations are Education, Arts & Media (100.0%), Architecture & Engineering (83.8%), and Education Instruction & Library (81.5%).
| Occupation | Male | Female |
| Management | 234 (77.7%) | 67 (22.3%) |
| Business & Financial | 29 (29.3%) | 70 (70.7%) |
| Computers, Engineering & Science | 95 (59.4%) | 65 (40.6%) |
| Computers & Mathematics | 18 (100.0%) | 0 (0.0%) |
| Architecture & Engineering | 12 (16.2%) | 62 (83.8%) |
| Life, Physical & Social Science | 65 (95.6%) | 3 (4.4%) |
| Community & Social Service | 104 (19.3%) | 434 (80.7%) |
| Education, Arts & Media | 0 (0.0%) | 93 (100.0%) |
| Legal Services & Support | 37 (44.6%) | 46 (55.4%) |
| Education Instruction & Library | 67 (18.5%) | 295 (81.5%) |
| Arts, Media & Entertainment | 0 (0.0%) | 0 (0.0%) |
| Health Diagnosing & Treating | 14 (22.2%) | 49 (77.8%) |
| Health Technologists | 10 (32.3%) | 21 (67.7%) |
| Total (Category) | 476 (41.0%) | 685 (59.0%) |
| Total (Overall) | 4,025 (59.7%) | 2,716 (40.3%) |
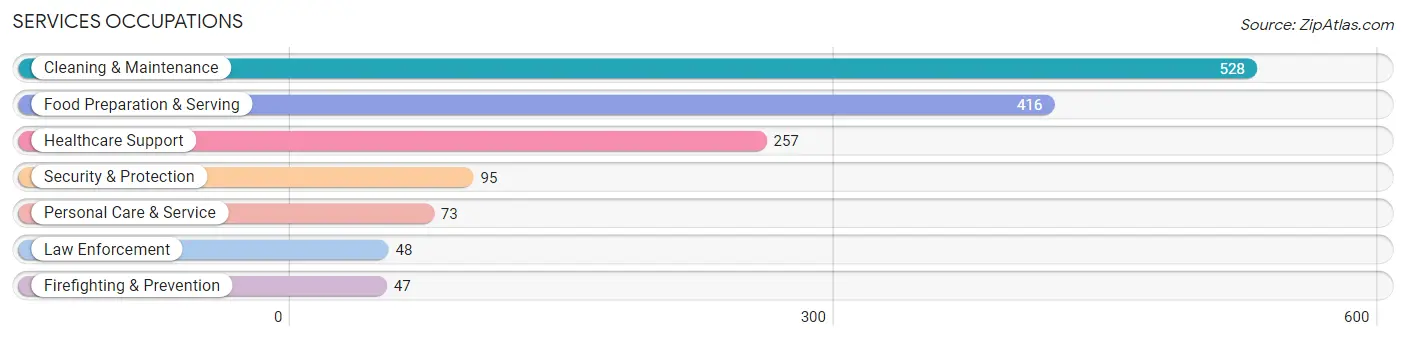
Services Occupations
The most common Services occupations in Hereford are Cleaning & Maintenance (528 | 7.8%), Food Preparation & Serving (416 | 6.2%), Healthcare Support (257 | 3.8%), Security & Protection (95 | 1.4%), and Personal Care & Service (73 | 1.1%).
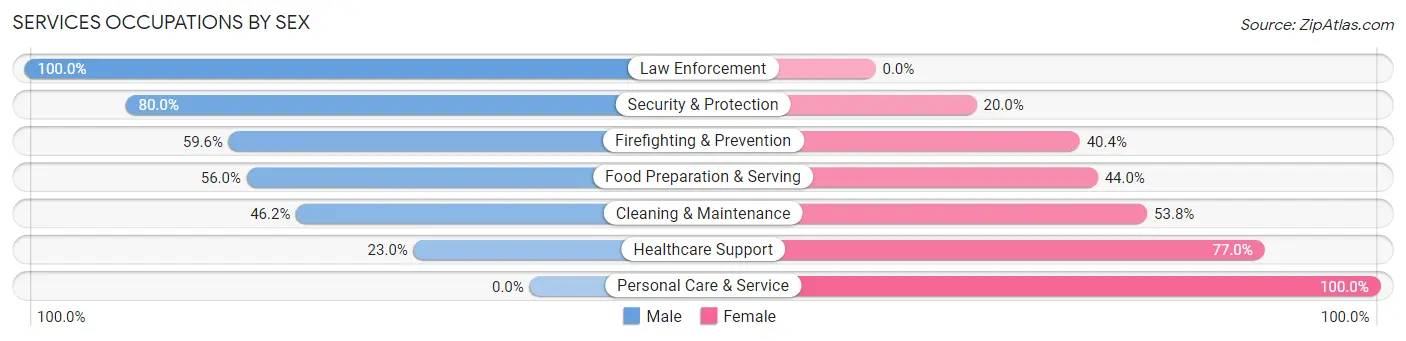
Services Occupations by Sex
Within the Services occupations in Hereford, the most male-oriented occupations are Law Enforcement (100.0%), Security & Protection (80.0%), and Firefighting & Prevention (59.6%), while the most female-oriented occupations are Personal Care & Service (100.0%), Healthcare Support (77.0%), and Cleaning & Maintenance (53.8%).
| Occupation | Male | Female |
| Healthcare Support | 59 (23.0%) | 198 (77.0%) |
| Security & Protection | 76 (80.0%) | 19 (20.0%) |
| Firefighting & Prevention | 28 (59.6%) | 19 (40.4%) |
| Law Enforcement | 48 (100.0%) | 0 (0.0%) |
| Food Preparation & Serving | 233 (56.0%) | 183 (44.0%) |
| Cleaning & Maintenance | 244 (46.2%) | 284 (53.8%) |
| Personal Care & Service | 0 (0.0%) | 73 (100.0%) |
| Total (Category) | 612 (44.7%) | 757 (55.3%) |
| Total (Overall) | 4,025 (59.7%) | 2,716 (40.3%) |
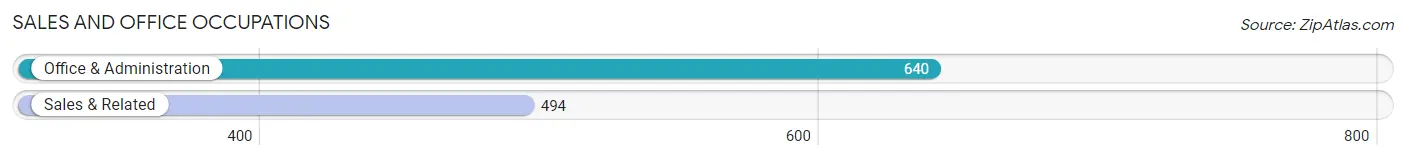
Sales and Office Occupations
The most common Sales and Office occupations in Hereford are Office & Administration (640 | 9.5%), and Sales & Related (494 | 7.3%).
Sales and Office Occupations by Sex
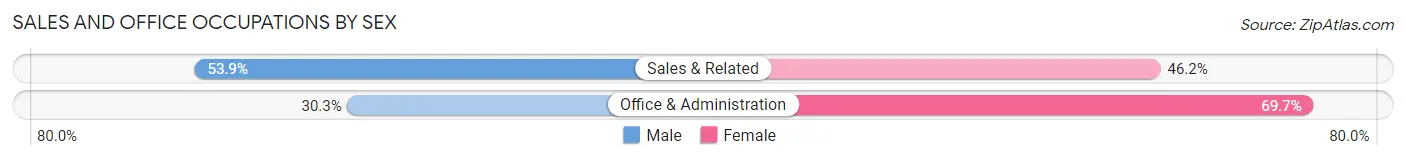
| Occupation | Male | Female |
| Sales & Related | 266 (53.8%) | 228 (46.2%) |
| Office & Administration | 194 (30.3%) | 446 (69.7%) |
| Total (Category) | 460 (40.6%) | 674 (59.4%) |
| Total (Overall) | 4,025 (59.7%) | 2,716 (40.3%) |
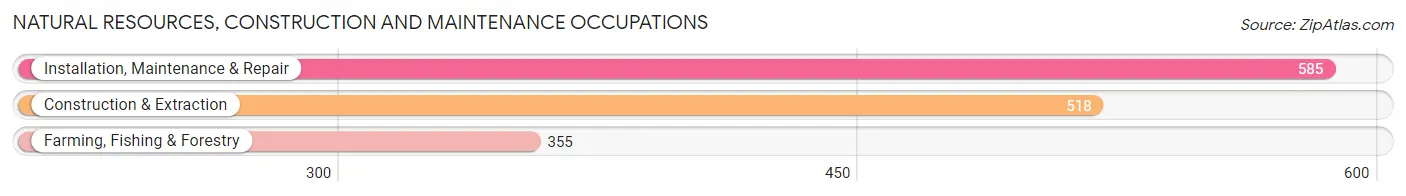
Natural Resources, Construction and Maintenance Occupations
The most common Natural Resources, Construction and Maintenance occupations in Hereford are Installation, Maintenance & Repair (585 | 8.7%), Construction & Extraction (518 | 7.7%), and Farming, Fishing & Forestry (355 | 5.3%).
Natural Resources, Construction and Maintenance Occupations by Sex
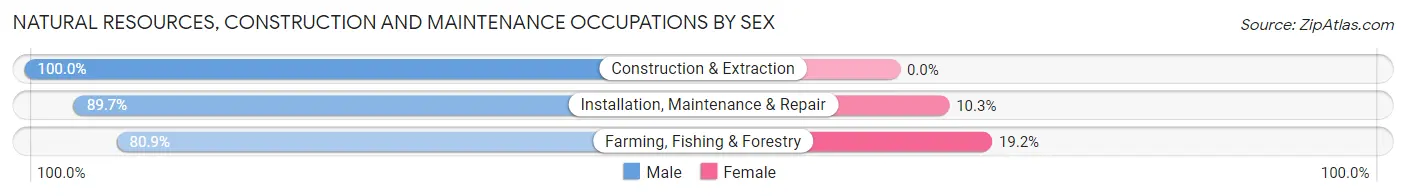
| Occupation | Male | Female |
| Farming, Fishing & Forestry | 287 (80.8%) | 68 (19.2%) |
| Construction & Extraction | 518 (100.0%) | 0 (0.0%) |
| Installation, Maintenance & Repair | 525 (89.7%) | 60 (10.3%) |
| Total (Category) | 1,330 (91.2%) | 128 (8.8%) |
| Total (Overall) | 4,025 (59.7%) | 2,716 (40.3%) |
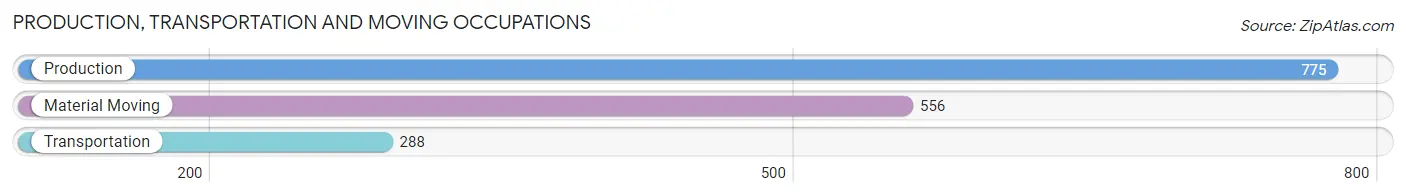
Production, Transportation and Moving Occupations
The most common Production, Transportation and Moving occupations in Hereford are Production (775 | 11.5%), Material Moving (556 | 8.3%), and Transportation (288 | 4.3%).
Production, Transportation and Moving Occupations by Sex
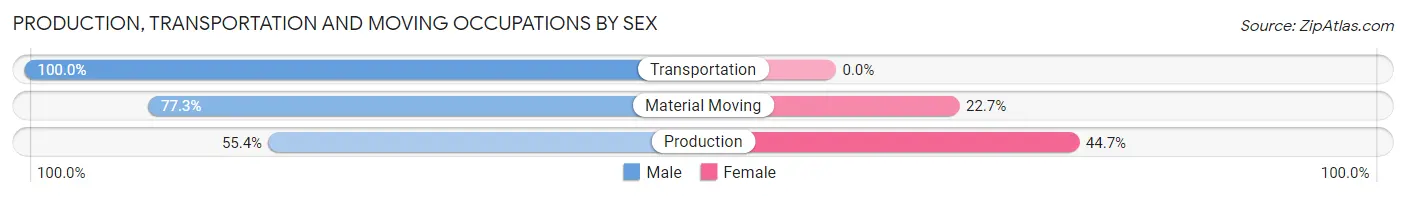
| Occupation | Male | Female |
| Production | 429 (55.3%) | 346 (44.7%) |
| Transportation | 288 (100.0%) | 0 (0.0%) |
| Material Moving | 430 (77.3%) | 126 (22.7%) |
| Total (Category) | 1,147 (70.9%) | 472 (29.1%) |
| Total (Overall) | 4,025 (59.7%) | 2,716 (40.3%) |
Employment Industries by Sex in Hereford
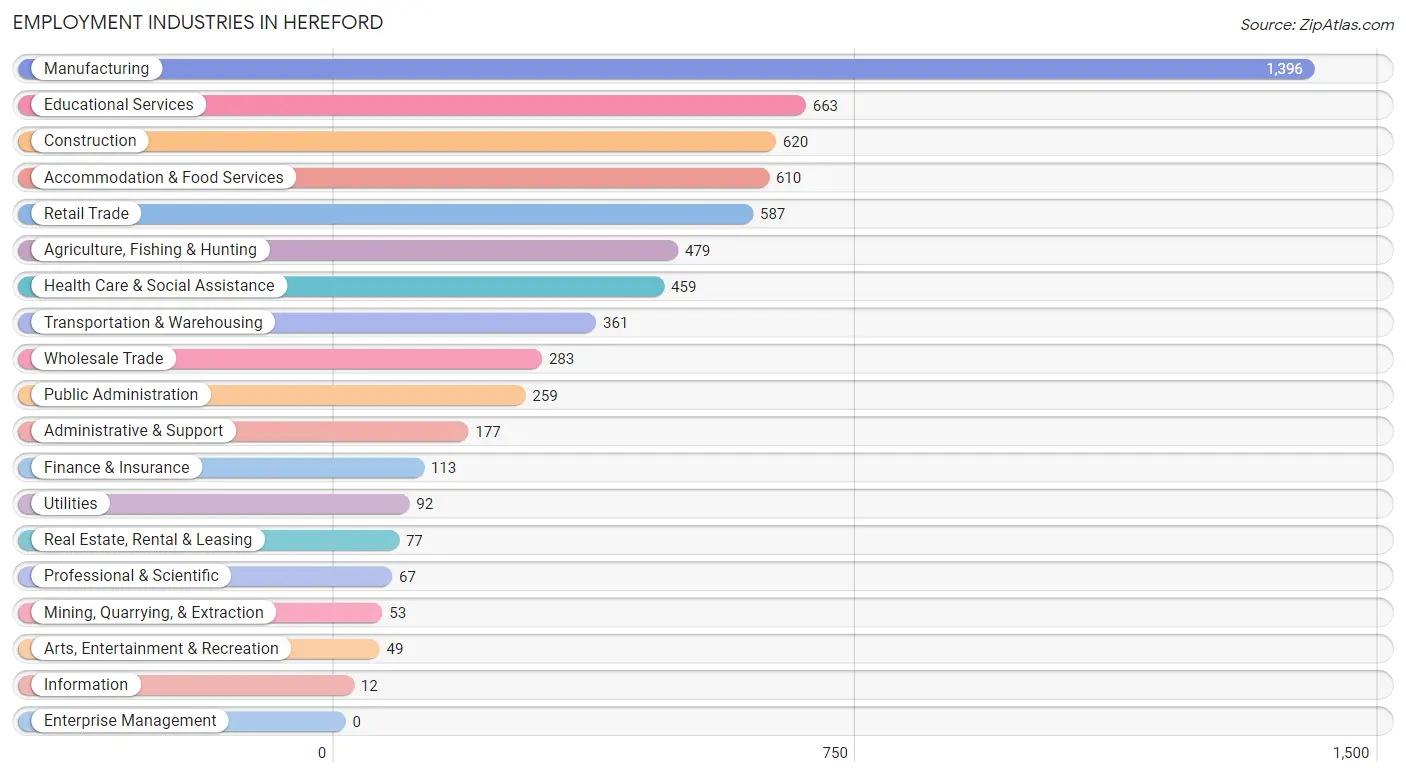
Employment Industries in Hereford
The major employment industries in Hereford include Manufacturing (1,396 | 20.7%), Educational Services (663 | 9.8%), Construction (620 | 9.2%), Accommodation & Food Services (610 | 9.0%), and Retail Trade (587 | 8.7%).
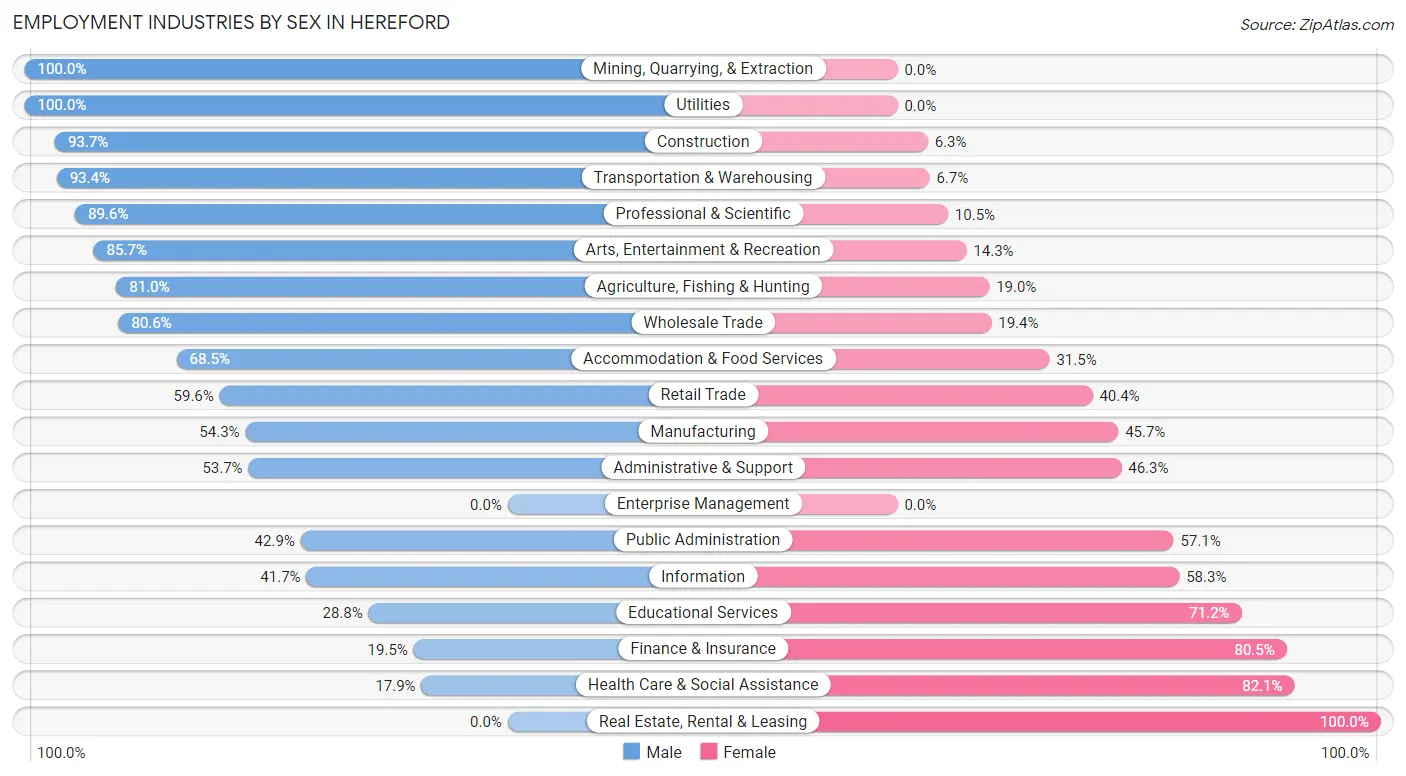
Employment Industries by Sex in Hereford
The Hereford industries that see more men than women are Mining, Quarrying, & Extraction (100.0%), Utilities (100.0%), and Construction (93.7%), whereas the industries that tend to have a higher number of women are Real Estate, Rental & Leasing (100.0%), Health Care & Social Assistance (82.1%), and Finance & Insurance (80.5%).
| Industry | Male | Female |
| Agriculture, Fishing & Hunting | 388 (81.0%) | 91 (19.0%) |
| Mining, Quarrying, & Extraction | 53 (100.0%) | 0 (0.0%) |
| Construction | 581 (93.7%) | 39 (6.3%) |
| Manufacturing | 758 (54.3%) | 638 (45.7%) |
| Wholesale Trade | 228 (80.6%) | 55 (19.4%) |
| Retail Trade | 350 (59.6%) | 237 (40.4%) |
| Transportation & Warehousing | 337 (93.3%) | 24 (6.7%) |
| Utilities | 92 (100.0%) | 0 (0.0%) |
| Information | 5 (41.7%) | 7 (58.3%) |
| Finance & Insurance | 22 (19.5%) | 91 (80.5%) |
| Real Estate, Rental & Leasing | 0 (0.0%) | 77 (100.0%) |
| Professional & Scientific | 60 (89.5%) | 7 (10.4%) |
| Enterprise Management | 0 (0.0%) | 0 (0.0%) |
| Administrative & Support | 95 (53.7%) | 82 (46.3%) |
| Educational Services | 191 (28.8%) | 472 (71.2%) |
| Health Care & Social Assistance | 82 (17.9%) | 377 (82.1%) |
| Arts, Entertainment & Recreation | 42 (85.7%) | 7 (14.3%) |
| Accommodation & Food Services | 418 (68.5%) | 192 (31.5%) |
| Public Administration | 111 (42.9%) | 148 (57.1%) |
| Total | 4,025 (59.7%) | 2,716 (40.3%) |
Education in Hereford
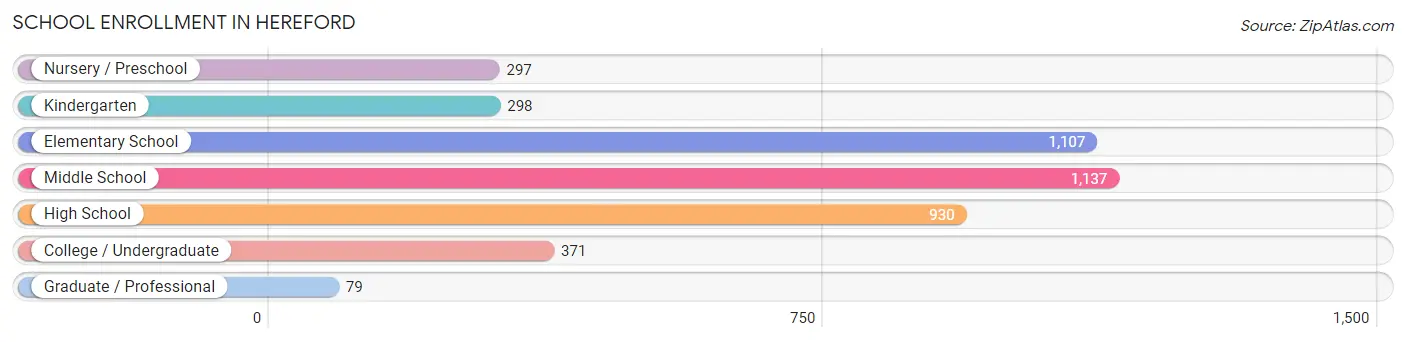
School Enrollment in Hereford
The most common levels of schooling among the 4,219 students in Hereford are middle school (1,137 | 27.0%), elementary school (1,107 | 26.2%), and high school (930 | 22.0%).
| School Level | # Students | % Students |
| Nursery / Preschool | 297 | 7.0% |
| Kindergarten | 298 | 7.1% |
| Elementary School | 1,107 | 26.2% |
| Middle School | 1,137 | 27.0% |
| High School | 930 | 22.0% |
| College / Undergraduate | 371 | 8.8% |
| Graduate / Professional | 79 | 1.9% |
| Total | 4,219 | 100.0% |
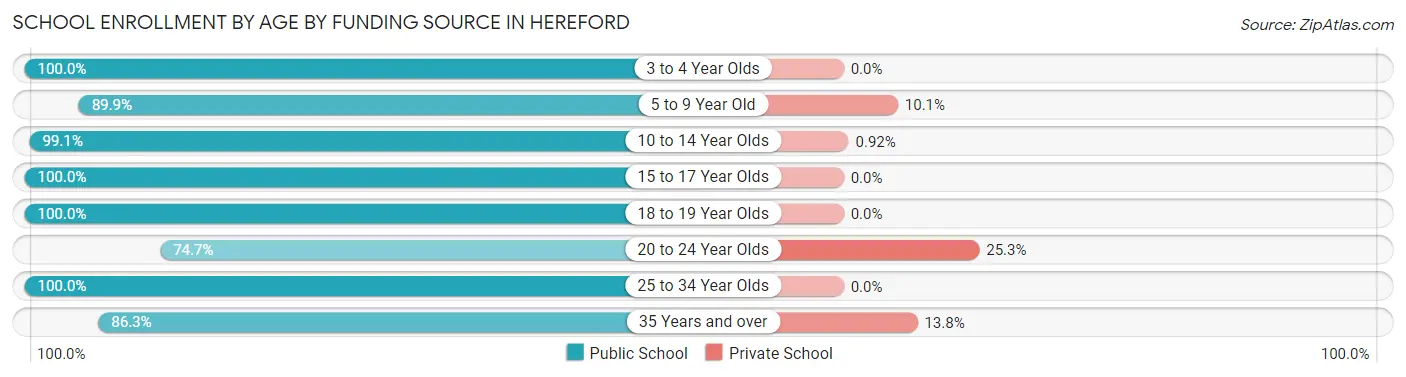
School Enrollment by Age by Funding Source in Hereford
Out of a total of 4,219 students who are enrolled in schools in Hereford, 232 (5.5%) attend a private institution, while the remaining 3,987 (94.5%) are enrolled in public schools. The age group of 20 to 24 year olds has the highest likelihood of being enrolled in private schools, with 73 (25.3% in the age bracket) enrolled. Conversely, the age group of 3 to 4 year olds has the lowest likelihood of being enrolled in a private school, with 250 (100.0% in the age bracket) attending a public institution.
| Age Bracket | Public School | Private School |
| 3 to 4 Year Olds | 250 (100.0%) | 0 (0.0%) |
| 5 to 9 Year Old | 1,114 (89.9%) | 125 (10.1%) |
| 10 to 14 Year Olds | 1,287 (99.1%) | 12 (0.9%) |
| 15 to 17 Year Olds | 660 (100.0%) | 0 (0.0%) |
| 18 to 19 Year Olds | 268 (100.0%) | 0 (0.0%) |
| 20 to 24 Year Olds | 216 (74.7%) | 73 (25.3%) |
| 25 to 34 Year Olds | 54 (100.0%) | 0 (0.0%) |
| 35 Years and over | 138 (86.3%) | 22 (13.8%) |
| Total | 3,987 (94.5%) | 232 (5.5%) |
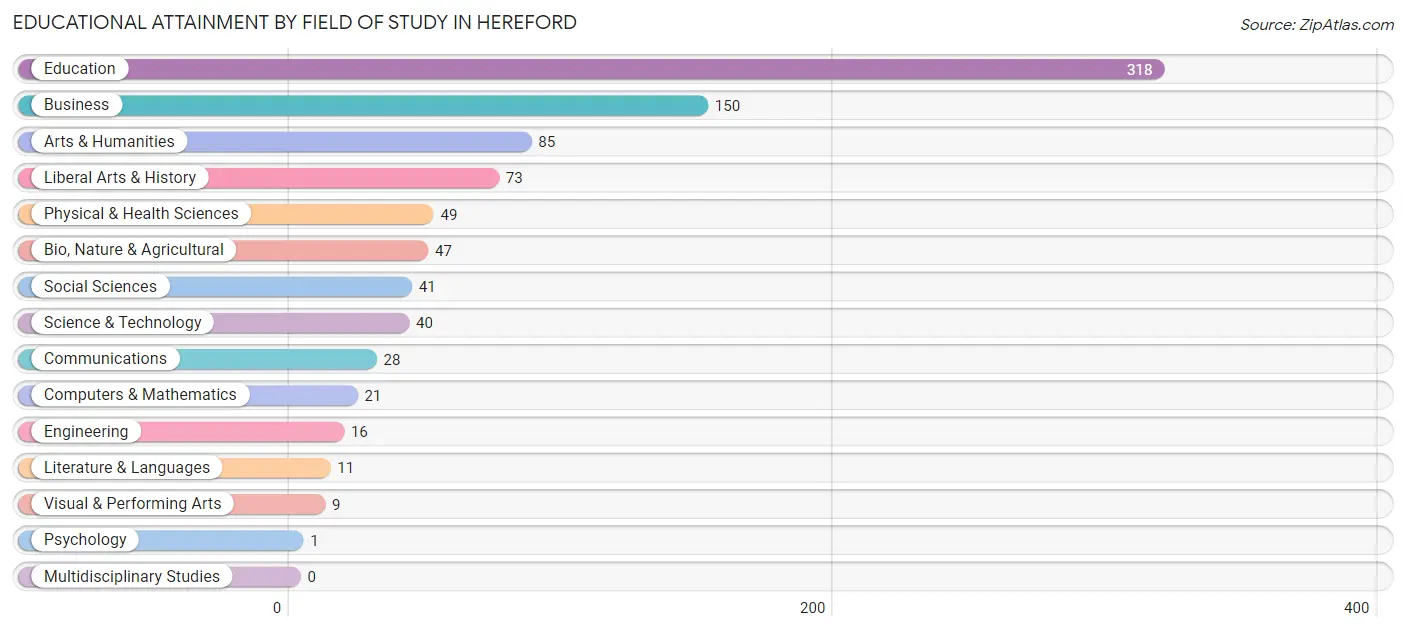
Educational Attainment by Field of Study in Hereford
Education (318 | 35.8%), business (150 | 16.9%), arts & humanities (85 | 9.6%), liberal arts & history (73 | 8.2%), and physical & health sciences (49 | 5.5%) are the most common fields of study among 889 individuals in Hereford who have obtained a bachelor's degree or higher.
| Field of Study | # Graduates | % Graduates |
| Computers & Mathematics | 21 | 2.4% |
| Bio, Nature & Agricultural | 47 | 5.3% |
| Physical & Health Sciences | 49 | 5.5% |
| Psychology | 1 | 0.1% |
| Social Sciences | 41 | 4.6% |
| Engineering | 16 | 1.8% |
| Multidisciplinary Studies | 0 | 0.0% |
| Science & Technology | 40 | 4.5% |
| Business | 150 | 16.9% |
| Education | 318 | 35.8% |
| Literature & Languages | 11 | 1.2% |
| Liberal Arts & History | 73 | 8.2% |
| Visual & Performing Arts | 9 | 1.0% |
| Communications | 28 | 3.2% |
| Arts & Humanities | 85 | 9.6% |
| Total | 889 | 100.0% |
Transportation & Commute in Hereford
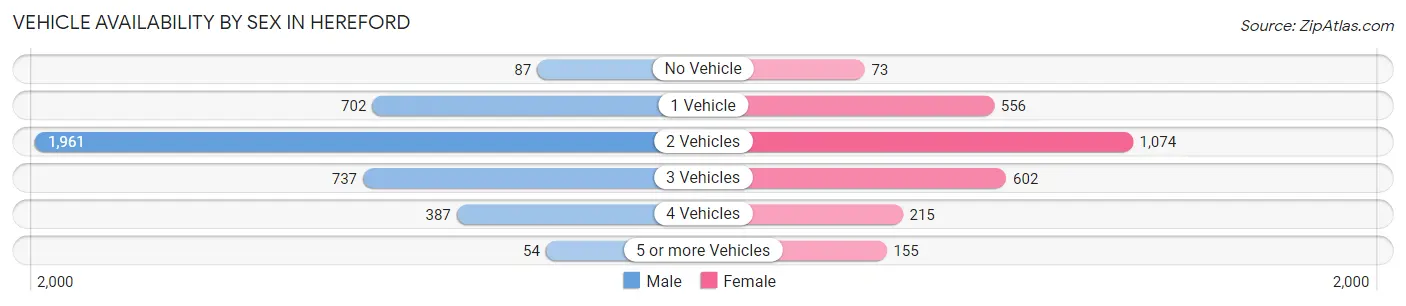
Vehicle Availability by Sex in Hereford
The most prevalent vehicle ownership categories in Hereford are males with 2 vehicles (1,961, accounting for 49.9%) and females with 2 vehicles (1,074, making up 73.3%).
| Vehicles Available | Male | Female |
| No Vehicle | 87 (2.2%) | 73 (2.7%) |
| 1 Vehicle | 702 (17.9%) | 556 (20.8%) |
| 2 Vehicles | 1,961 (49.9%) | 1,074 (40.2%) |
| 3 Vehicles | 737 (18.8%) | 602 (22.5%) |
| 4 Vehicles | 387 (9.9%) | 215 (8.0%) |
| 5 or more Vehicles | 54 (1.4%) | 155 (5.8%) |
| Total | 3,928 (100.0%) | 2,675 (100.0%) |
Commute Time in Hereford
The most frequently occuring commute durations in Hereford are 5 to 9 minutes (1,779 commuters, 27.6%), 10 to 14 minutes (1,497 commuters, 23.2%), and 15 to 19 minutes (1,214 commuters, 18.8%).
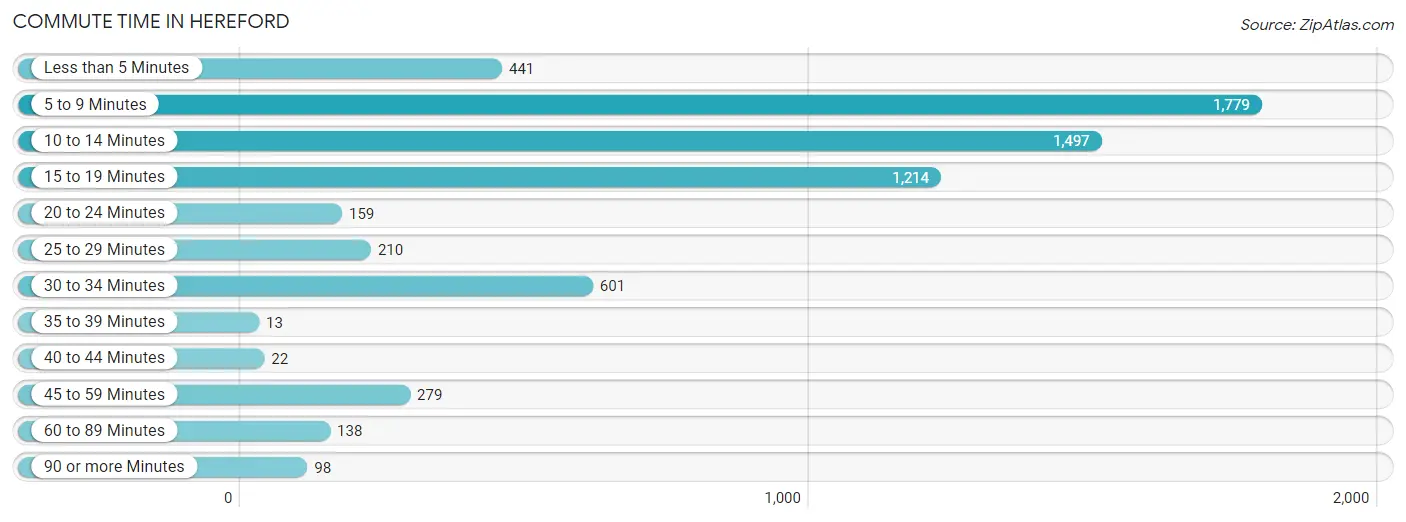
| Commute Time | # Commuters | % Commuters |
| Less than 5 Minutes | 441 | 6.8% |
| 5 to 9 Minutes | 1,779 | 27.6% |
| 10 to 14 Minutes | 1,497 | 23.2% |
| 15 to 19 Minutes | 1,214 | 18.8% |
| 20 to 24 Minutes | 159 | 2.5% |
| 25 to 29 Minutes | 210 | 3.3% |
| 30 to 34 Minutes | 601 | 9.3% |
| 35 to 39 Minutes | 13 | 0.2% |
| 40 to 44 Minutes | 22 | 0.3% |
| 45 to 59 Minutes | 279 | 4.3% |
| 60 to 89 Minutes | 138 | 2.1% |
| 90 or more Minutes | 98 | 1.5% |
Commute Time by Sex in Hereford
The most common commute times in Hereford are 10 to 14 minutes (989 commuters, 25.9%) for males and 5 to 9 minutes (1,015 commuters, 38.6%) for females.
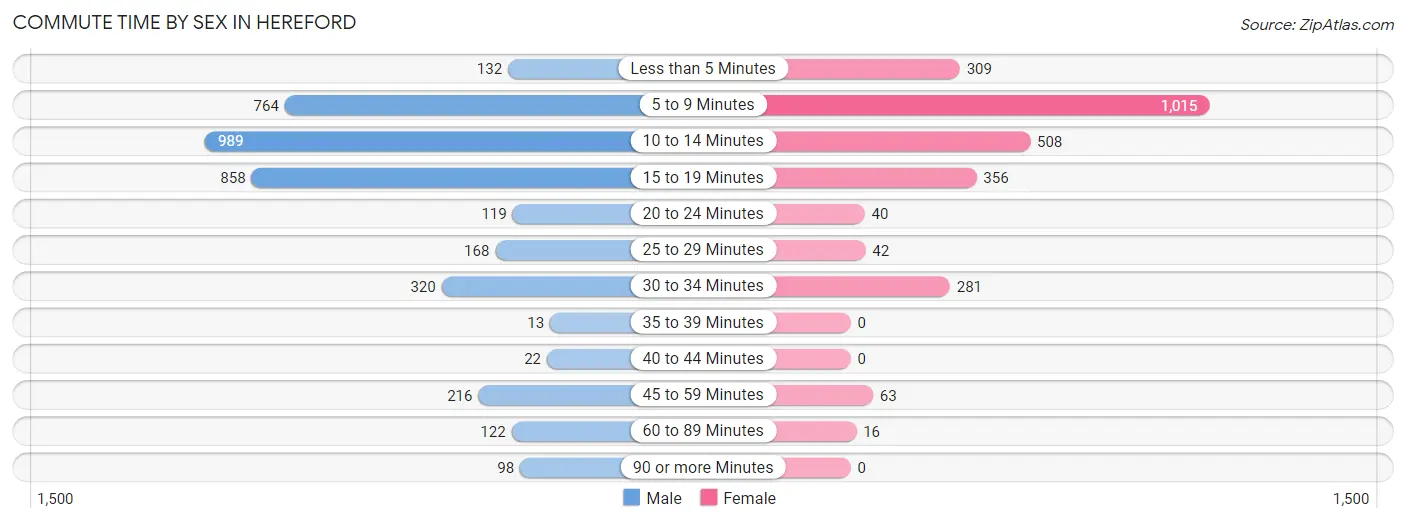
| Commute Time | Male | Female |
| Less than 5 Minutes | 132 (3.5%) | 309 (11.7%) |
| 5 to 9 Minutes | 764 (20.0%) | 1,015 (38.6%) |
| 10 to 14 Minutes | 989 (25.9%) | 508 (19.3%) |
| 15 to 19 Minutes | 858 (22.5%) | 356 (13.5%) |
| 20 to 24 Minutes | 119 (3.1%) | 40 (1.5%) |
| 25 to 29 Minutes | 168 (4.4%) | 42 (1.6%) |
| 30 to 34 Minutes | 320 (8.4%) | 281 (10.7%) |
| 35 to 39 Minutes | 13 (0.3%) | 0 (0.0%) |
| 40 to 44 Minutes | 22 (0.6%) | 0 (0.0%) |
| 45 to 59 Minutes | 216 (5.7%) | 63 (2.4%) |
| 60 to 89 Minutes | 122 (3.2%) | 16 (0.6%) |
| 90 or more Minutes | 98 (2.6%) | 0 (0.0%) |
Time of Departure to Work by Sex in Hereford
The most frequent times of departure to work in Hereford are 7:00 AM to 7:29 AM (590, 15.4%) for males and 7:30 AM to 7:59 AM (808, 30.7%) for females.
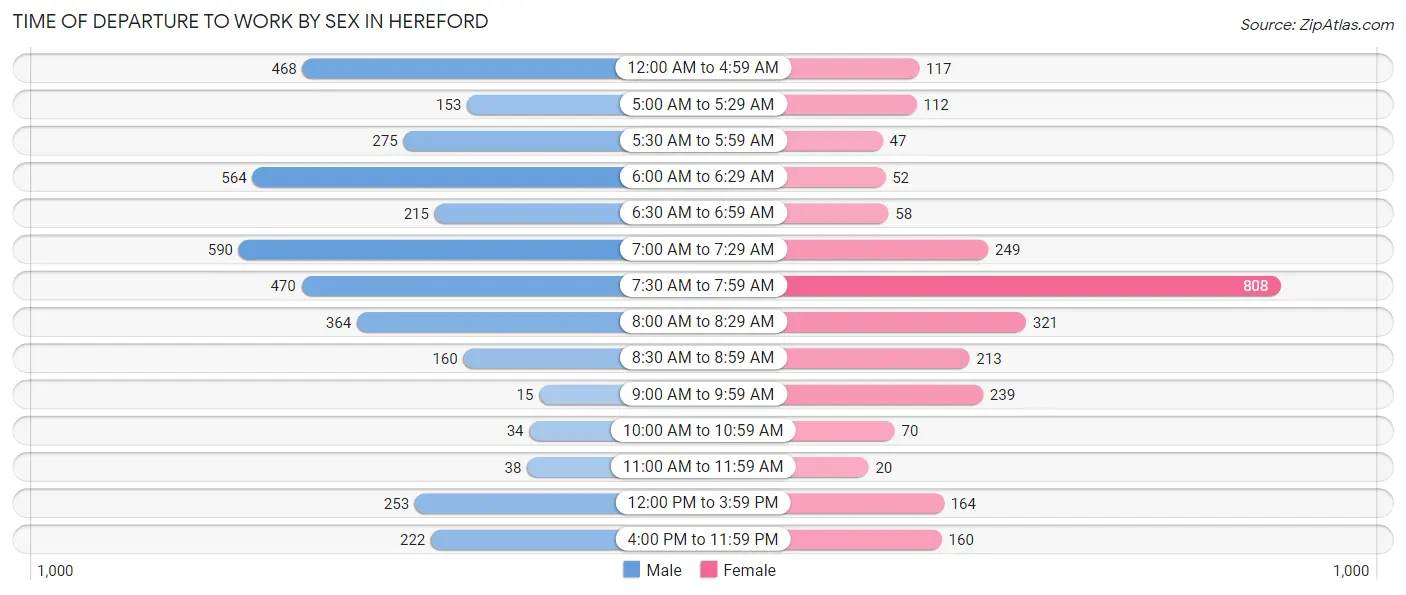
| Time of Departure | Male | Female |
| 12:00 AM to 4:59 AM | 468 (12.2%) | 117 (4.4%) |
| 5:00 AM to 5:29 AM | 153 (4.0%) | 112 (4.3%) |
| 5:30 AM to 5:59 AM | 275 (7.2%) | 47 (1.8%) |
| 6:00 AM to 6:29 AM | 564 (14.8%) | 52 (2.0%) |
| 6:30 AM to 6:59 AM | 215 (5.6%) | 58 (2.2%) |
| 7:00 AM to 7:29 AM | 590 (15.4%) | 249 (9.5%) |
| 7:30 AM to 7:59 AM | 470 (12.3%) | 808 (30.7%) |
| 8:00 AM to 8:29 AM | 364 (9.5%) | 321 (12.2%) |
| 8:30 AM to 8:59 AM | 160 (4.2%) | 213 (8.1%) |
| 9:00 AM to 9:59 AM | 15 (0.4%) | 239 (9.1%) |
| 10:00 AM to 10:59 AM | 34 (0.9%) | 70 (2.7%) |
| 11:00 AM to 11:59 AM | 38 (1.0%) | 20 (0.8%) |
| 12:00 PM to 3:59 PM | 253 (6.6%) | 164 (6.2%) |
| 4:00 PM to 11:59 PM | 222 (5.8%) | 160 (6.1%) |
| Total | 3,821 (100.0%) | 2,630 (100.0%) |
Housing Occupancy in Hereford
Occupancy by Ownership in Hereford
Of the total 4,846 dwellings in Hereford, owner-occupied units account for 3,023 (62.4%), while renter-occupied units make up 1,823 (37.6%).
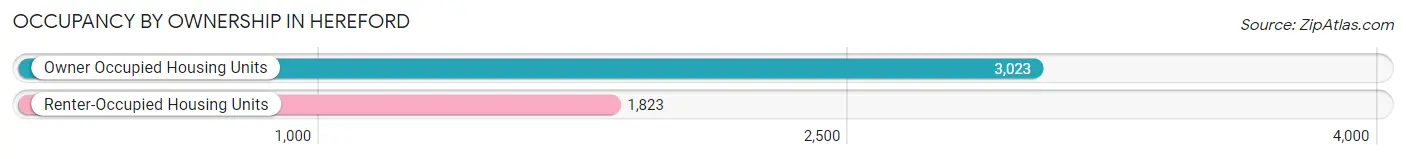
| Occupancy | # Housing Units | % Housing Units |
| Owner Occupied Housing Units | 3,023 | 62.4% |
| Renter-Occupied Housing Units | 1,823 | 37.6% |
| Total Occupied Housing Units | 4,846 | 100.0% |
Occupancy by Household Size in Hereford
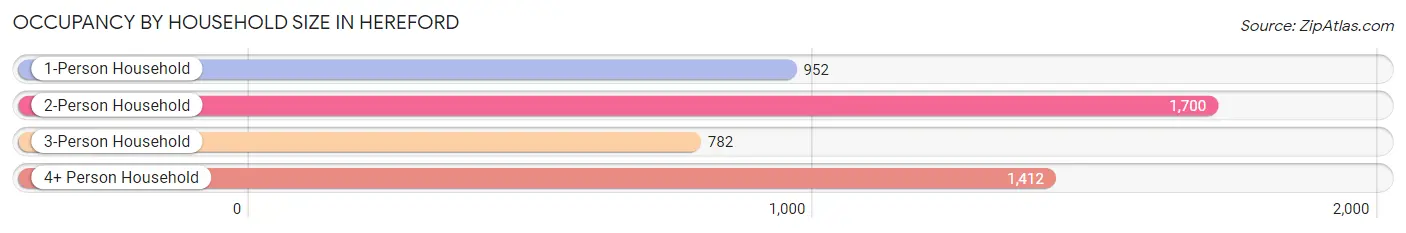
| Household Size | # Housing Units | % Housing Units |
| 1-Person Household | 952 | 19.7% |
| 2-Person Household | 1,700 | 35.1% |
| 3-Person Household | 782 | 16.1% |
| 4+ Person Household | 1,412 | 29.1% |
| Total Housing Units | 4,846 | 100.0% |
Occupancy by Ownership by Household Size in Hereford
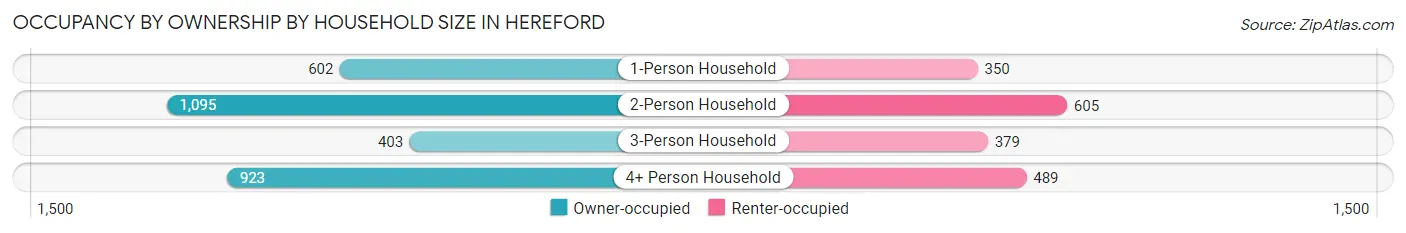
| Household Size | Owner-occupied | Renter-occupied |
| 1-Person Household | 602 (63.2%) | 350 (36.8%) |
| 2-Person Household | 1,095 (64.4%) | 605 (35.6%) |
| 3-Person Household | 403 (51.5%) | 379 (48.5%) |
| 4+ Person Household | 923 (65.4%) | 489 (34.6%) |
| Total Housing Units | 3,023 (62.4%) | 1,823 (37.6%) |
Occupancy by Educational Attainment in Hereford
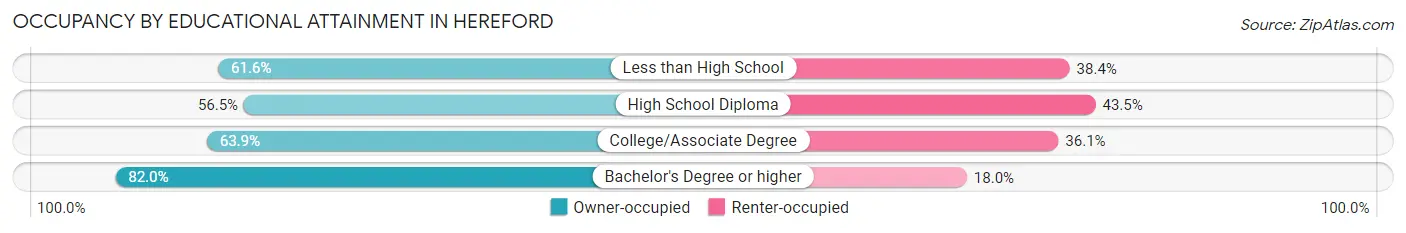
| Household Size | Owner-occupied | Renter-occupied |
| Less than High School | 784 (61.6%) | 488 (38.4%) |
| High School Diploma | 1,141 (56.5%) | 878 (43.5%) |
| College/Associate Degree | 624 (63.9%) | 353 (36.1%) |
| Bachelor's Degree or higher | 474 (82.0%) | 104 (18.0%) |
Occupancy by Age of Householder in Hereford
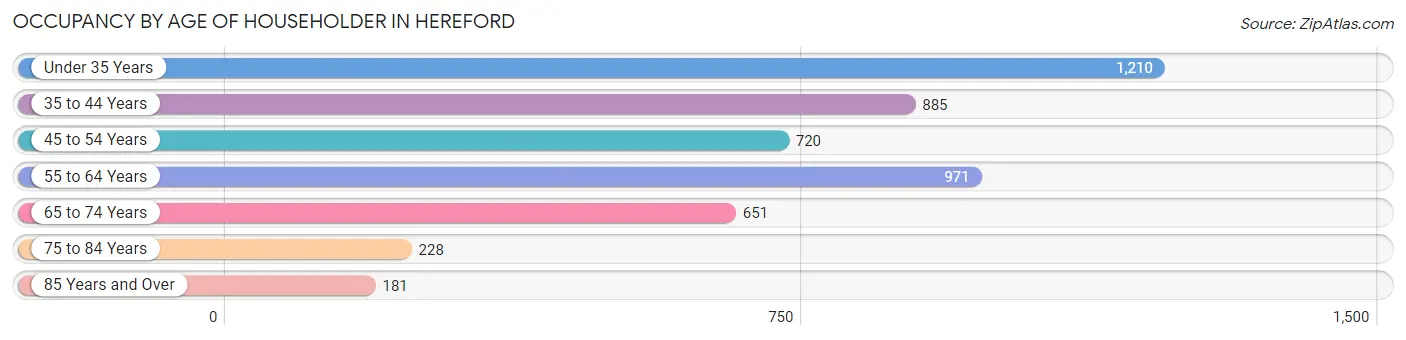
| Age Bracket | # Households | % Households |
| Under 35 Years | 1,210 | 25.0% |
| 35 to 44 Years | 885 | 18.3% |
| 45 to 54 Years | 720 | 14.9% |
| 55 to 64 Years | 971 | 20.0% |
| 65 to 74 Years | 651 | 13.4% |
| 75 to 84 Years | 228 | 4.7% |
| 85 Years and Over | 181 | 3.7% |
| Total | 4,846 | 100.0% |
Housing Finances in Hereford
Median Income by Occupancy in Hereford
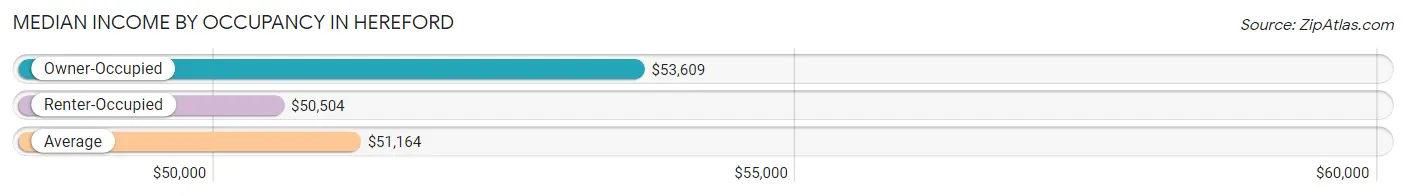
| Occupancy Type | # Households | Median Income |
| Owner-Occupied | 3,023 (62.4%) | $53,609 |
| Renter-Occupied | 1,823 (37.6%) | $50,504 |
| Average | 4,846 (100.0%) | $51,164 |
Occupancy by Householder Income Bracket in Hereford
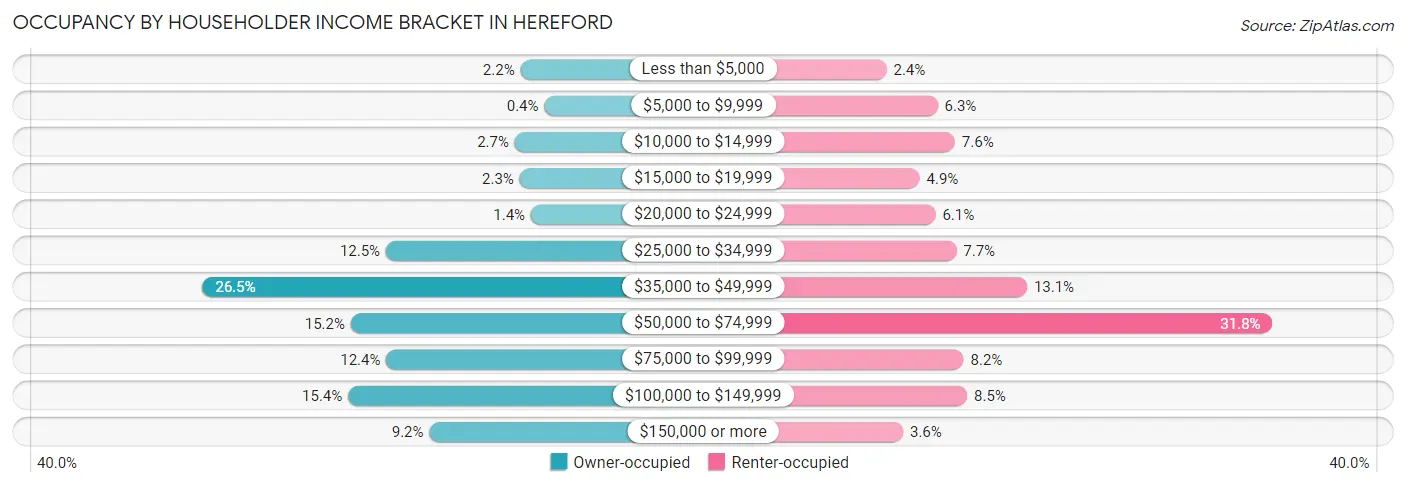
| Income Bracket | Owner-occupied | Renter-occupied |
| Less than $5,000 | 67 (2.2%) | 43 (2.4%) |
| $5,000 to $9,999 | 12 (0.4%) | 114 (6.2%) |
| $10,000 to $14,999 | 80 (2.6%) | 138 (7.6%) |
| $15,000 to $19,999 | 69 (2.3%) | 89 (4.9%) |
| $20,000 to $24,999 | 43 (1.4%) | 111 (6.1%) |
| $25,000 to $34,999 | 377 (12.5%) | 140 (7.7%) |
| $35,000 to $49,999 | 800 (26.5%) | 238 (13.1%) |
| $50,000 to $74,999 | 458 (15.1%) | 579 (31.8%) |
| $75,000 to $99,999 | 376 (12.4%) | 150 (8.2%) |
| $100,000 to $149,999 | 464 (15.3%) | 155 (8.5%) |
| $150,000 or more | 277 (9.2%) | 66 (3.6%) |
| Total | 3,023 (100.0%) | 1,823 (100.0%) |
Monthly Housing Cost Tiers in Hereford
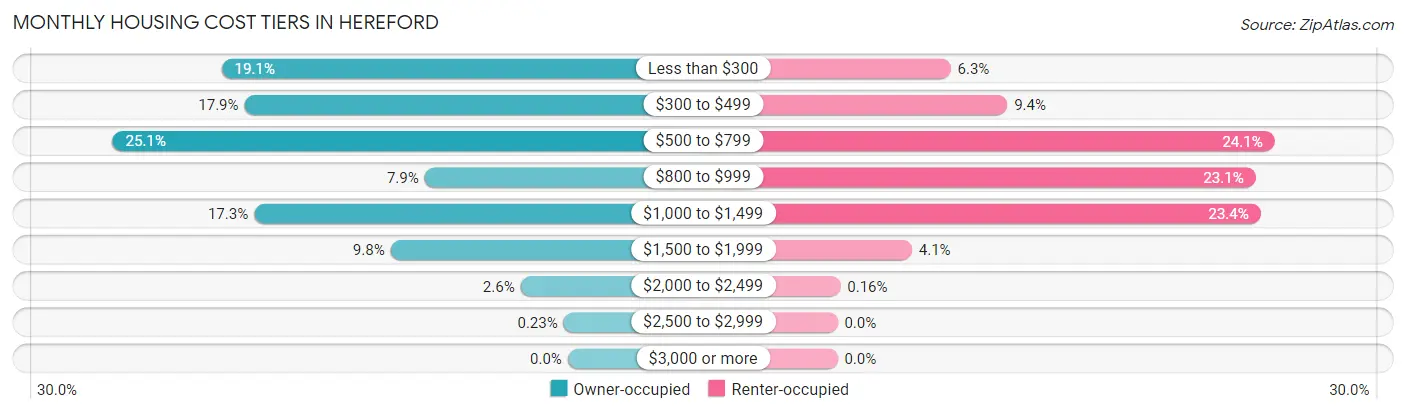
| Monthly Cost | Owner-occupied | Renter-occupied |
| Less than $300 | 578 (19.1%) | 114 (6.2%) |
| $300 to $499 | 540 (17.9%) | 171 (9.4%) |
| $500 to $799 | 760 (25.1%) | 440 (24.1%) |
| $800 to $999 | 239 (7.9%) | 421 (23.1%) |
| $1,000 to $1,499 | 524 (17.3%) | 426 (23.4%) |
| $1,500 to $1,999 | 296 (9.8%) | 75 (4.1%) |
| $2,000 to $2,499 | 79 (2.6%) | 3 (0.2%) |
| $2,500 to $2,999 | 7 (0.2%) | 0 (0.0%) |
| $3,000 or more | 0 (0.0%) | 0 (0.0%) |
| Total | 3,023 (100.0%) | 1,823 (100.0%) |
Physical Housing Characteristics in Hereford
Housing Structures in Hereford
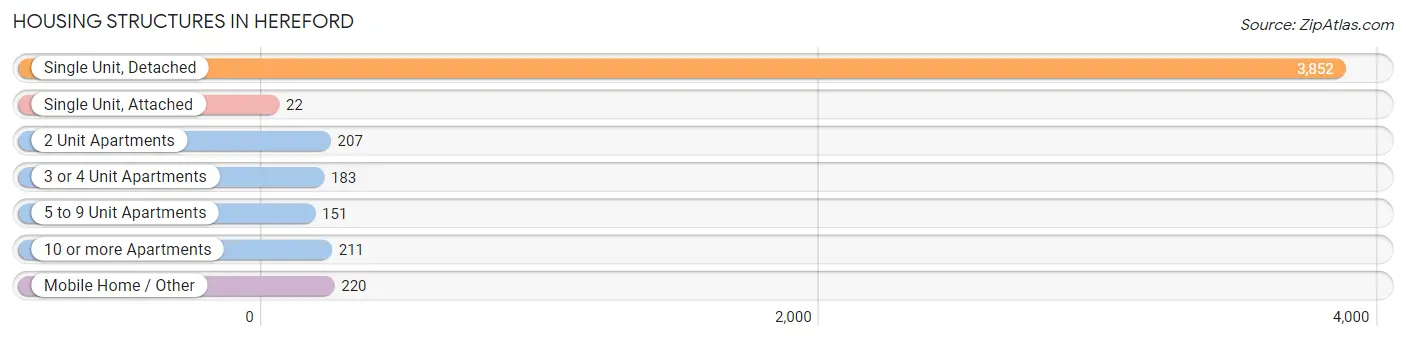
| Structure Type | # Housing Units | % Housing Units |
| Single Unit, Detached | 3,852 | 79.5% |
| Single Unit, Attached | 22 | 0.4% |
| 2 Unit Apartments | 207 | 4.3% |
| 3 or 4 Unit Apartments | 183 | 3.8% |
| 5 to 9 Unit Apartments | 151 | 3.1% |
| 10 or more Apartments | 211 | 4.3% |
| Mobile Home / Other | 220 | 4.5% |
| Total | 4,846 | 100.0% |
Housing Structures by Occupancy in Hereford
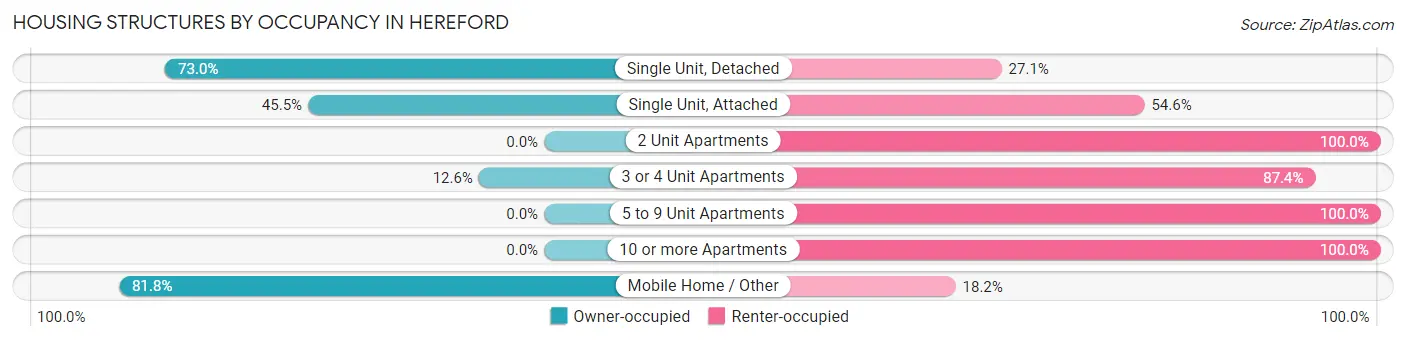
| Structure Type | Owner-occupied | Renter-occupied |
| Single Unit, Detached | 2,810 (73.0%) | 1,042 (27.1%) |
| Single Unit, Attached | 10 (45.5%) | 12 (54.5%) |
| 2 Unit Apartments | 0 (0.0%) | 207 (100.0%) |
| 3 or 4 Unit Apartments | 23 (12.6%) | 160 (87.4%) |
| 5 to 9 Unit Apartments | 0 (0.0%) | 151 (100.0%) |
| 10 or more Apartments | 0 (0.0%) | 211 (100.0%) |
| Mobile Home / Other | 180 (81.8%) | 40 (18.2%) |
| Total | 3,023 (62.4%) | 1,823 (37.6%) |
Housing Structures by Number of Rooms in Hereford
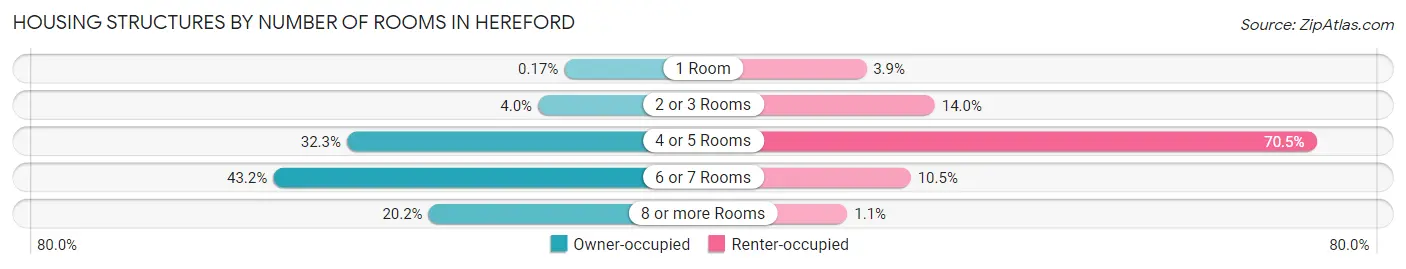
| Number of Rooms | Owner-occupied | Renter-occupied |
| 1 Room | 5 (0.2%) | 71 (3.9%) |
| 2 or 3 Rooms | 122 (4.0%) | 256 (14.0%) |
| 4 or 5 Rooms | 977 (32.3%) | 1,285 (70.5%) |
| 6 or 7 Rooms | 1,307 (43.2%) | 191 (10.5%) |
| 8 or more Rooms | 612 (20.2%) | 20 (1.1%) |
| Total | 3,023 (100.0%) | 1,823 (100.0%) |
Housing Structure by Heating Type in Hereford
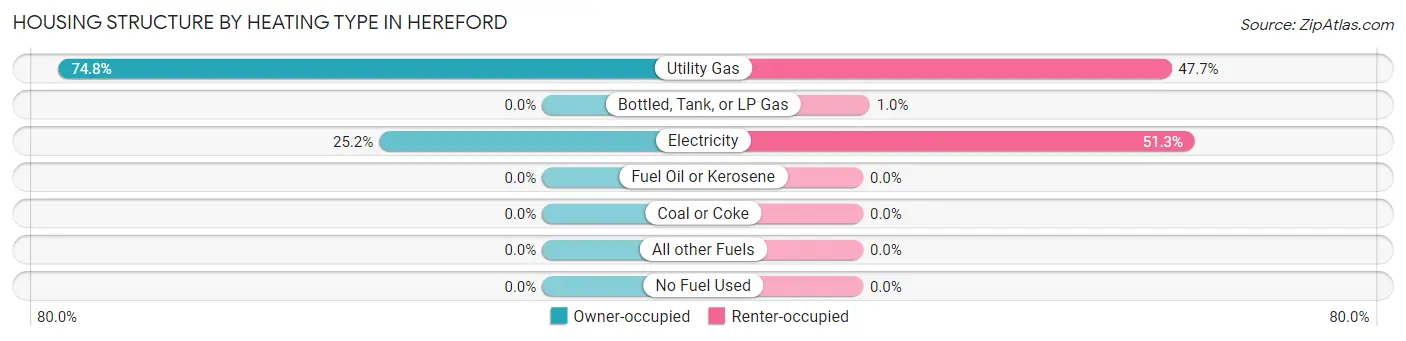
| Heating Type | Owner-occupied | Renter-occupied |
| Utility Gas | 2,261 (74.8%) | 869 (47.7%) |
| Bottled, Tank, or LP Gas | 0 (0.0%) | 19 (1.0%) |
| Electricity | 762 (25.2%) | 935 (51.3%) |
| Fuel Oil or Kerosene | 0 (0.0%) | 0 (0.0%) |
| Coal or Coke | 0 (0.0%) | 0 (0.0%) |
| All other Fuels | 0 (0.0%) | 0 (0.0%) |
| No Fuel Used | 0 (0.0%) | 0 (0.0%) |
| Total | 3,023 (100.0%) | 1,823 (100.0%) |
Household Vehicle Usage in Hereford
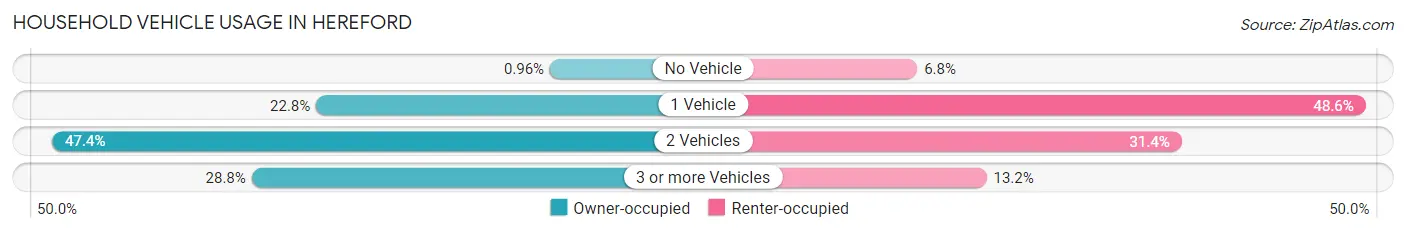
| Vehicles per Household | Owner-occupied | Renter-occupied |
| No Vehicle | 29 (1.0%) | 123 (6.8%) |
| 1 Vehicle | 689 (22.8%) | 886 (48.6%) |
| 2 Vehicles | 1,434 (47.4%) | 573 (31.4%) |
| 3 or more Vehicles | 871 (28.8%) | 241 (13.2%) |
| Total | 3,023 (100.0%) | 1,823 (100.0%) |
Real Estate & Mortgages in Hereford
Real Estate and Mortgage Overview in Hereford
| Characteristic | Without Mortgage | With Mortgage |
| Housing Units | 1,780 | 1,243 |
| Median Property Value | $82,000 | $132,600 |
| Median Household Income | $42,236 | $110 |
| Monthly Housing Costs | $425 | $0 |
| Real Estate Taxes | $1,244 | $50 |
Property Value by Mortgage Status in Hereford
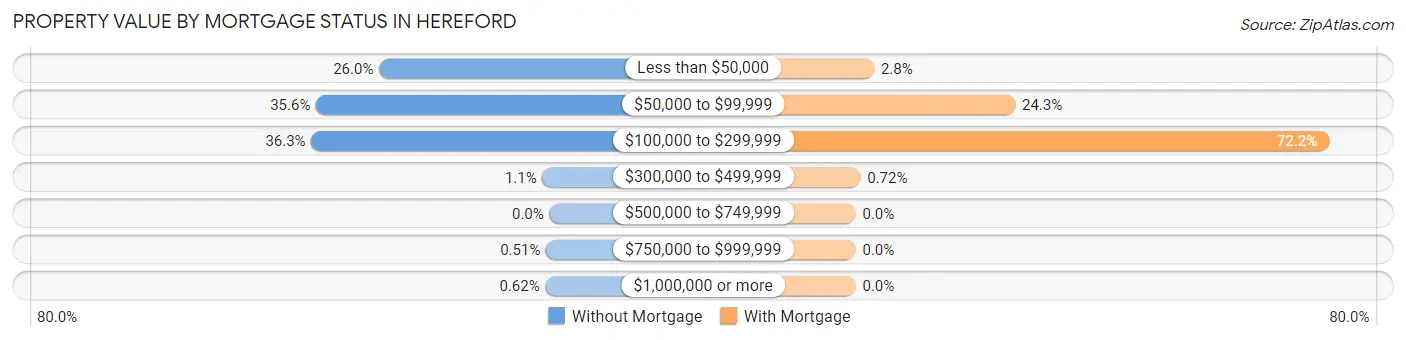
| Property Value | Without Mortgage | With Mortgage |
| Less than $50,000 | 462 (26.0%) | 35 (2.8%) |
| $50,000 to $99,999 | 633 (35.6%) | 302 (24.3%) |
| $100,000 to $299,999 | 646 (36.3%) | 897 (72.2%) |
| $300,000 to $499,999 | 19 (1.1%) | 9 (0.7%) |
| $500,000 to $749,999 | 0 (0.0%) | 0 (0.0%) |
| $750,000 to $999,999 | 9 (0.5%) | 0 (0.0%) |
| $1,000,000 or more | 11 (0.6%) | 0 (0.0%) |
| Total | 1,780 (100.0%) | 1,243 (100.0%) |
Household Income by Mortgage Status in Hereford
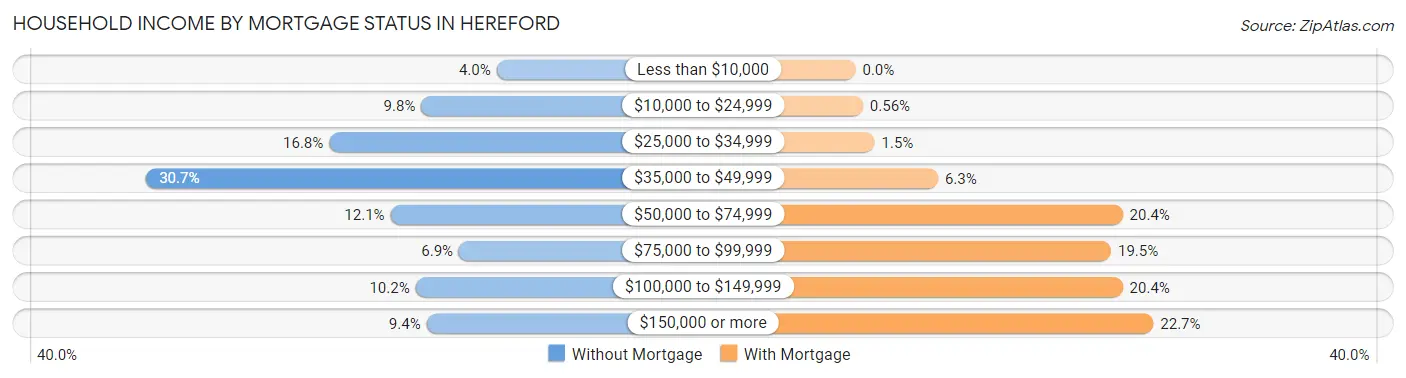
| Household Income | Without Mortgage | With Mortgage |
| Less than $10,000 | 72 (4.0%) | 0 (0.0%) |
| $10,000 to $24,999 | 174 (9.8%) | 7 (0.6%) |
| $25,000 to $34,999 | 299 (16.8%) | 18 (1.5%) |
| $35,000 to $49,999 | 547 (30.7%) | 78 (6.3%) |
| $50,000 to $74,999 | 216 (12.1%) | 253 (20.3%) |
| $75,000 to $99,999 | 123 (6.9%) | 242 (19.5%) |
| $100,000 to $149,999 | 182 (10.2%) | 253 (20.3%) |
| $150,000 or more | 167 (9.4%) | 282 (22.7%) |
| Total | 1,780 (100.0%) | 1,243 (100.0%) |
Property Value to Household Income Ratio in Hereford
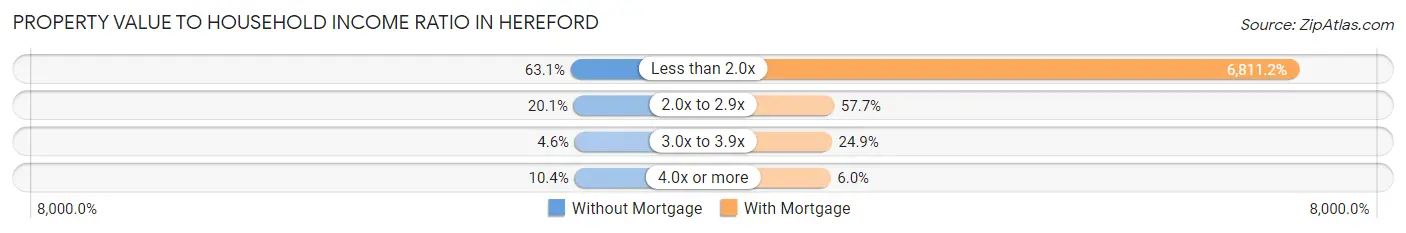
| Value-to-Income Ratio | Without Mortgage | With Mortgage |
| Less than 2.0x | 1,123 (63.1%) | 84,663 (6,811.2%) |
| 2.0x to 2.9x | 358 (20.1%) | 717 (57.7%) |
| 3.0x to 3.9x | 82 (4.6%) | 309 (24.9%) |
| 4.0x or more | 185 (10.4%) | 75 (6.0%) |
| Total | 1,780 (100.0%) | 1,243 (100.0%) |
Real Estate Taxes by Mortgage Status in Hereford
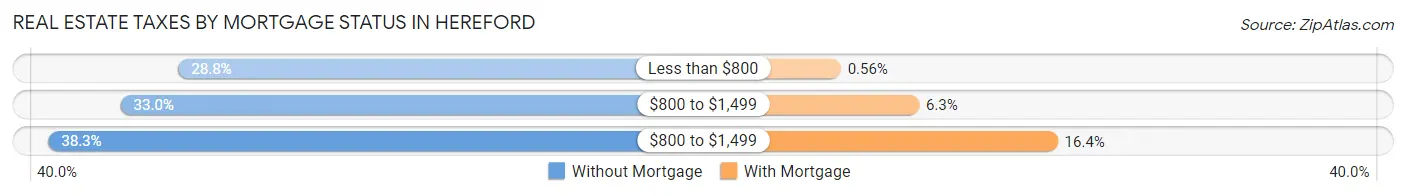
| Property Taxes | Without Mortgage | With Mortgage |
| Less than $800 | 512 (28.8%) | 7 (0.6%) |
| $800 to $1,499 | 587 (33.0%) | 78 (6.3%) |
| $800 to $1,499 | 681 (38.3%) | 204 (16.4%) |
| Total | 1,780 (100.0%) | 1,243 (100.0%) |
Health & Disability in Hereford
Health Insurance Coverage by Age in Hereford
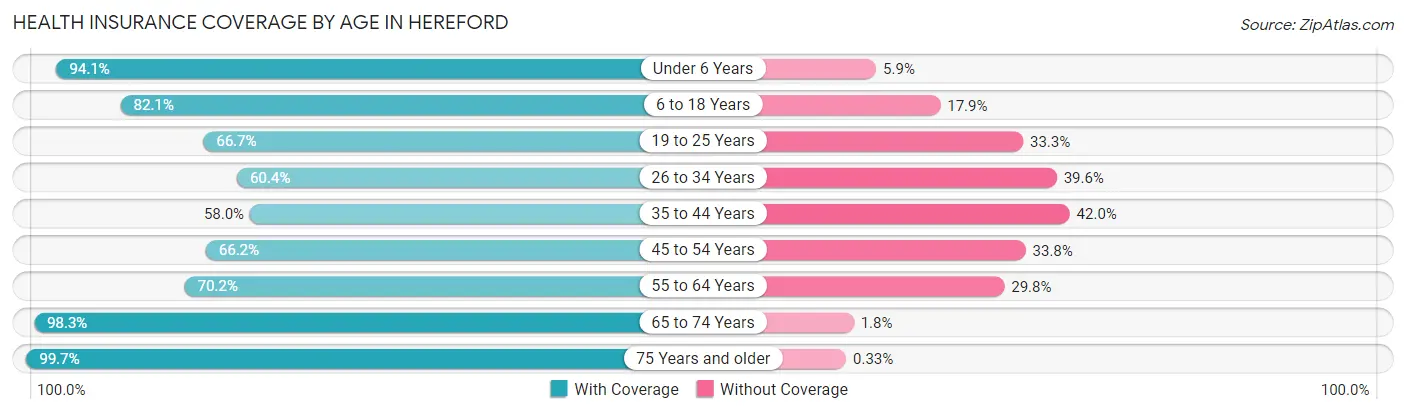
| Age Bracket | With Coverage | Without Coverage |
| Under 6 Years | 1,458 (94.1%) | 92 (5.9%) |
| 6 to 18 Years | 2,889 (82.1%) | 630 (17.9%) |
| 19 to 25 Years | 958 (66.7%) | 479 (33.3%) |
| 26 to 34 Years | 1,314 (60.4%) | 862 (39.6%) |
| 35 to 44 Years | 966 (58.0%) | 700 (42.0%) |
| 45 to 54 Years | 873 (66.2%) | 446 (33.8%) |
| 55 to 64 Years | 1,023 (70.2%) | 435 (29.8%) |
| 65 to 74 Years | 1,008 (98.3%) | 18 (1.8%) |
| 75 Years and older | 598 (99.7%) | 2 (0.3%) |
| Total | 11,087 (75.2%) | 3,664 (24.8%) |
Health Insurance Coverage by Citizenship Status in Hereford
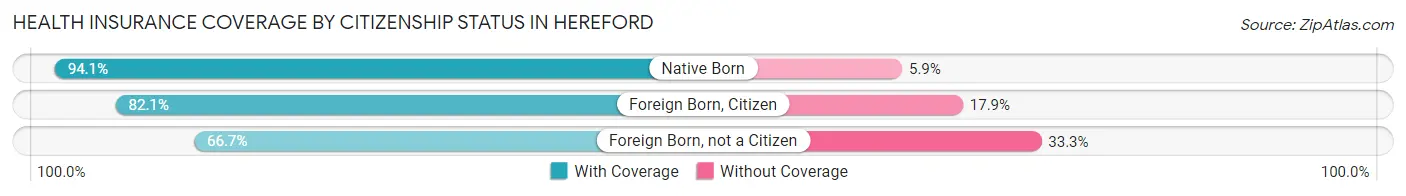
| Citizenship Status | With Coverage | Without Coverage |
| Native Born | 1,458 (94.1%) | 92 (5.9%) |
| Foreign Born, Citizen | 2,889 (82.1%) | 630 (17.9%) |
| Foreign Born, not a Citizen | 958 (66.7%) | 479 (33.3%) |
Health Insurance Coverage by Household Income in Hereford
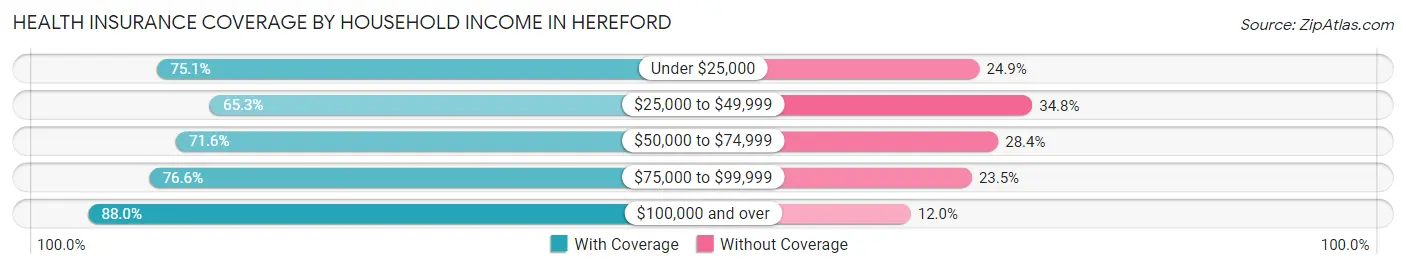
| Household Income | With Coverage | Without Coverage |
| Under $25,000 | 1,458 (75.1%) | 483 (24.9%) |
| $25,000 to $49,999 | 2,537 (65.2%) | 1,351 (34.7%) |
| $50,000 to $74,999 | 2,373 (71.6%) | 941 (28.4%) |
| $75,000 to $99,999 | 1,446 (76.5%) | 443 (23.4%) |
| $100,000 and over | 3,267 (88.0%) | 445 (12.0%) |
Public vs Private Health Insurance Coverage by Age in Hereford
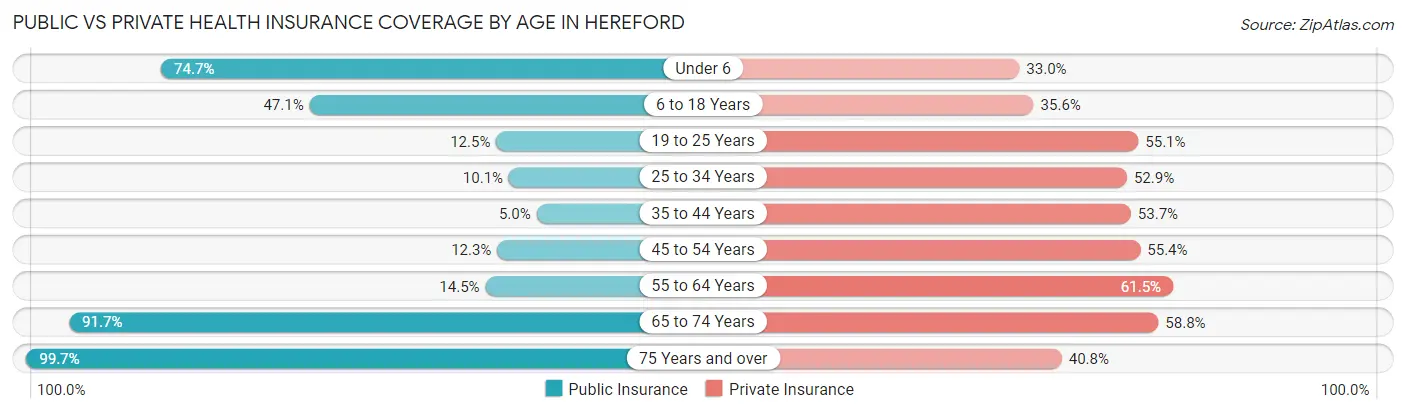
| Age Bracket | Public Insurance | Private Insurance |
| Under 6 | 1,157 (74.7%) | 511 (33.0%) |
| 6 to 18 Years | 1,658 (47.1%) | 1,253 (35.6%) |
| 19 to 25 Years | 179 (12.5%) | 791 (55.0%) |
| 25 to 34 Years | 220 (10.1%) | 1,152 (52.9%) |
| 35 to 44 Years | 83 (5.0%) | 894 (53.7%) |
| 45 to 54 Years | 162 (12.3%) | 731 (55.4%) |
| 55 to 64 Years | 211 (14.5%) | 896 (61.5%) |
| 65 to 74 Years | 941 (91.7%) | 603 (58.8%) |
| 75 Years and over | 598 (99.7%) | 245 (40.8%) |
| Total | 5,209 (35.3%) | 7,076 (48.0%) |
Disability Status by Sex by Age in Hereford
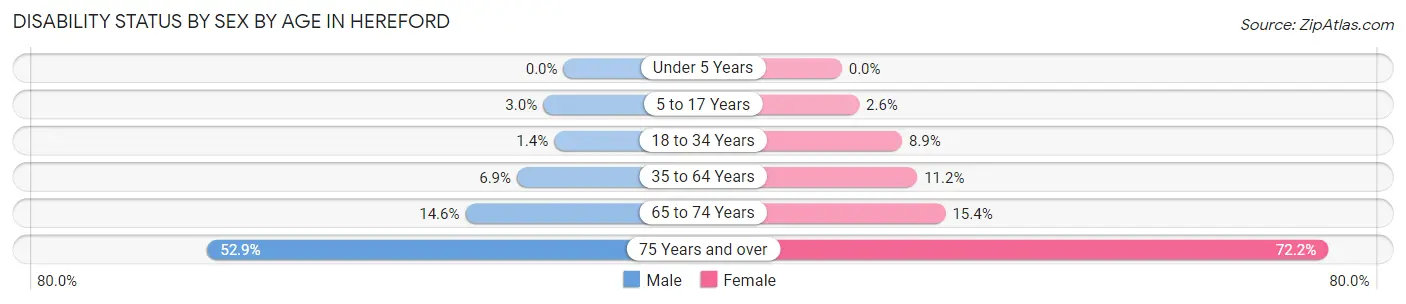
| Age Bracket | Male | Female |
| Under 5 Years | 0 (0.0%) | 0 (0.0%) |
| 5 to 17 Years | 55 (3.0%) | 44 (2.6%) |
| 18 to 34 Years | 27 (1.4%) | 171 (8.9%) |
| 35 to 64 Years | 150 (6.9%) | 254 (11.2%) |
| 65 to 74 Years | 69 (14.6%) | 85 (15.4%) |
| 75 Years and over | 148 (52.9%) | 231 (72.2%) |
Disability Class by Sex by Age in Hereford
Disability Class: Hearing Difficulty
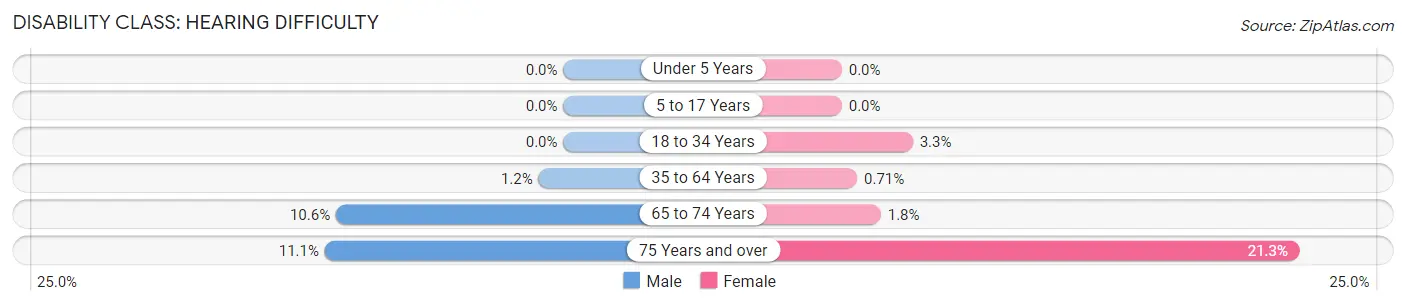
| Age Bracket | Male | Female |
| Under 5 Years | 0 (0.0%) | 0 (0.0%) |
| 5 to 17 Years | 0 (0.0%) | 0 (0.0%) |
| 18 to 34 Years | 0 (0.0%) | 63 (3.3%) |
| 35 to 64 Years | 25 (1.1%) | 16 (0.7%) |
| 65 to 74 Years | 50 (10.5%) | 10 (1.8%) |
| 75 Years and over | 31 (11.1%) | 68 (21.2%) |
Disability Class: Vision Difficulty
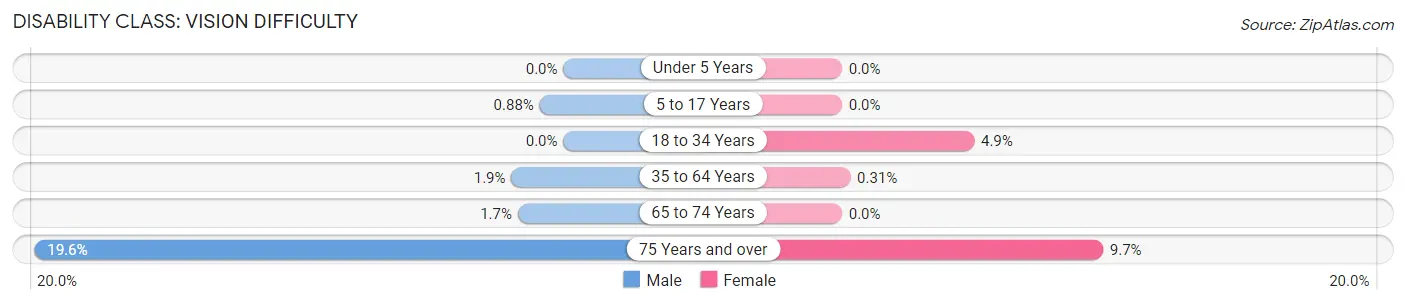
| Age Bracket | Male | Female |
| Under 5 Years | 0 (0.0%) | 0 (0.0%) |
| 5 to 17 Years | 16 (0.9%) | 0 (0.0%) |
| 18 to 34 Years | 0 (0.0%) | 94 (4.9%) |
| 35 to 64 Years | 42 (1.9%) | 7 (0.3%) |
| 65 to 74 Years | 8 (1.7%) | 0 (0.0%) |
| 75 Years and over | 55 (19.6%) | 31 (9.7%) |
Disability Class: Cognitive Difficulty
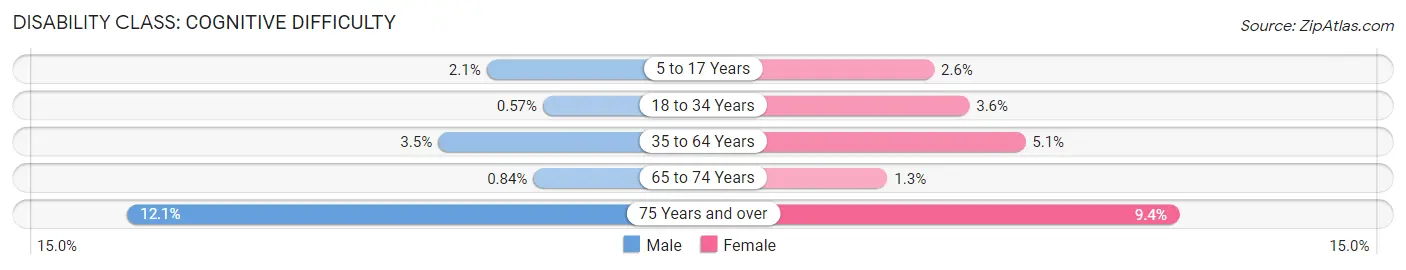
| Age Bracket | Male | Female |
| 5 to 17 Years | 39 (2.1%) | 44 (2.6%) |
| 18 to 34 Years | 11 (0.6%) | 68 (3.5%) |
| 35 to 64 Years | 76 (3.5%) | 116 (5.1%) |
| 65 to 74 Years | 4 (0.8%) | 7 (1.3%) |
| 75 Years and over | 34 (12.1%) | 30 (9.4%) |
Disability Class: Ambulatory Difficulty
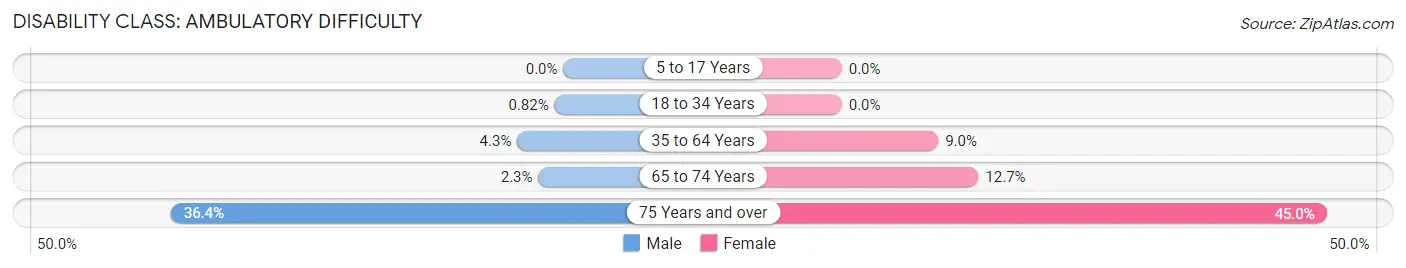
| Age Bracket | Male | Female |
| 5 to 17 Years | 0 (0.0%) | 0 (0.0%) |
| 18 to 34 Years | 16 (0.8%) | 0 (0.0%) |
| 35 to 64 Years | 93 (4.3%) | 203 (8.9%) |
| 65 to 74 Years | 11 (2.3%) | 70 (12.7%) |
| 75 Years and over | 102 (36.4%) | 144 (45.0%) |
Disability Class: Self-Care Difficulty
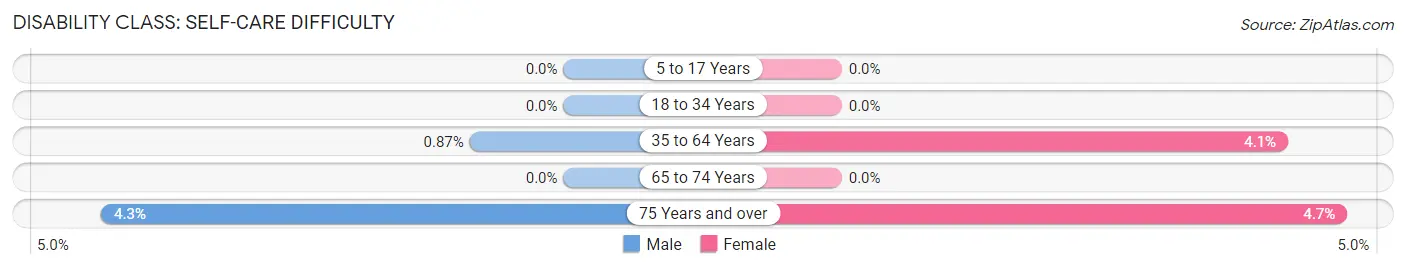
| Age Bracket | Male | Female |
| 5 to 17 Years | 0 (0.0%) | 0 (0.0%) |
| 18 to 34 Years | 0 (0.0%) | 0 (0.0%) |
| 35 to 64 Years | 19 (0.9%) | 94 (4.1%) |
| 65 to 74 Years | 0 (0.0%) | 0 (0.0%) |
| 75 Years and over | 12 (4.3%) | 15 (4.7%) |
Technology Access in Hereford
Computing Device Access in Hereford
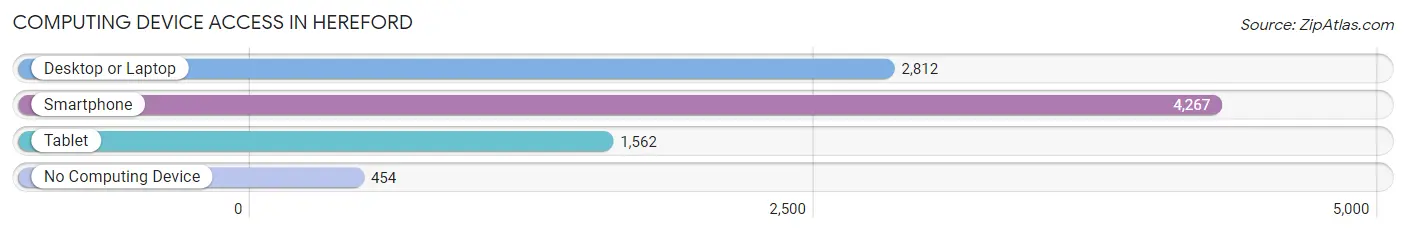
| Device Type | # Households | % Households |
| Desktop or Laptop | 2,812 | 58.0% |
| Smartphone | 4,267 | 88.0% |
| Tablet | 1,562 | 32.2% |
| No Computing Device | 454 | 9.4% |
| Total | 4,846 | 100.0% |
Internet Access in Hereford
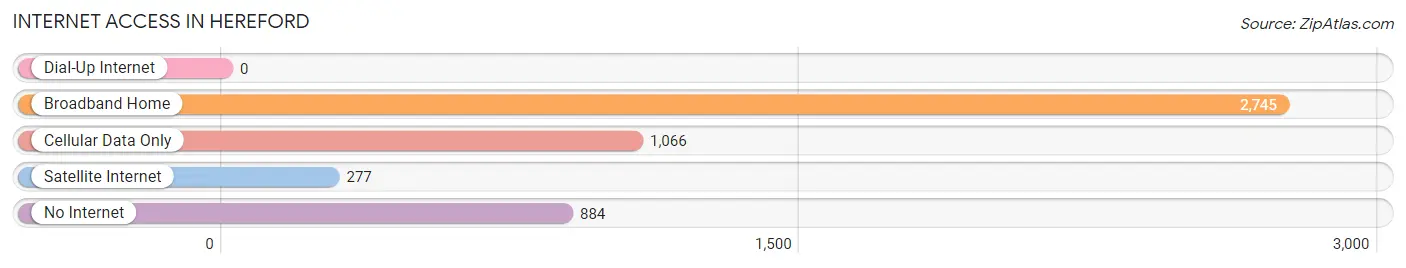
| Internet Type | # Households | % Households |
| Dial-Up Internet | 0 | 0.0% |
| Broadband Home | 2,745 | 56.6% |
| Cellular Data Only | 1,066 | 22.0% |
| Satellite Internet | 277 | 5.7% |
| No Internet | 884 | 18.2% |
| Total | 4,846 | 100.0% |
Hereford Summary
History
The small town of Hereford, Texas is located in Deaf Smith County in the Texas Panhandle. It is the county seat and the largest city in the county. The town was founded in 1890 and was named after Hereford, England. The town was originally a stop on the Santa Fe Railroad and was known as “The Town of Hereford”.
The town was originally settled by ranchers and farmers who were attracted to the area by the abundance of water and grass. The town grew quickly and by the early 1900s, Hereford had become a major center for the cattle industry. The town was also home to several businesses, including a bank, a hotel, a newspaper, and a school.
In the 1920s, Hereford began to experience a population boom as the town became a center for the cotton industry. The town was also home to several cotton gins and a cottonseed oil mill. The town continued to grow throughout the 20th century and by the 2000 census, Hereford had a population of 15,370.
Geography
Hereford is located in the Texas Panhandle, approximately 30 miles east of Amarillo. The town is situated on the Canadian River and is surrounded by rolling hills and prairies. The town is located at an elevation of 3,400 feet and has a semi-arid climate with hot summers and cold winters.
The town covers an area of 8.3 square miles and is home to several parks, including Hereford City Park, which features a swimming pool, tennis courts, and a playground. The town is also home to several golf courses, including the Hereford Country Club.
Economy
Hereford’s economy is largely based on agriculture and ranching. The town is home to several large cattle ranches and is a major center for the beef industry. The town is also home to several large cotton farms and is a major center for the cotton industry.
The town is also home to several manufacturing companies, including a plastics plant and a food processing plant. The town is also home to several retail stores, including a Walmart Supercenter.
Demographics
As of the 2000 census, Hereford had a population of 15,370. The racial makeup of the town was 75.3% White, 0.7% African American, 0.7% Native American, 0.3% Asian, 0.1% Pacific Islander, 20.7% from other races, and 2.1% from two or more races. Hispanic or Latino of any race were 44.2% of the population.
The median income for a household in the town was $27,917 and the median income for a family was $32,917. The per capita income for the town was $14,917. About 18.2% of families and 22.2% of the population were below the poverty line, including 28.2% of those under age 18 and 14.2% of those age 65 or over.
Common Questions
What is Per Capita Income in Hereford?
Per Capita income in Hereford is $22,093.
What is the Median Family Income in Hereford?
Median Family Income in Hereford is $52,750.
What is the Median Household income in Hereford?
Median Household Income in Hereford is $51,164.
What is Income or Wage Gap in Hereford?
Income or Wage Gap in Hereford is 25.3%.
Women in Hereford earn 74.7 cents for every dollar earned by a man.
What is Family Income Deficit in Hereford?
Family Income Deficit in Hereford is $11,647.
Families that are below poverty line in Hereford earn $11,647 less on average than the poverty threshold level.
What is Inequality or Gini Index in Hereford?
Inequality or Gini Index in Hereford is 0.40.
What is the Total Population of Hereford?
Total Population of Hereford is 14,943.
What is the Total Male Population of Hereford?
Total Male Population of Hereford is 7,524.
What is the Total Female Population of Hereford?
Total Female Population of Hereford is 7,419.
What is the Ratio of Males per 100 Females in Hereford?
There are 101.42 Males per 100 Females in Hereford.
What is the Ratio of Females per 100 Males in Hereford?
There are 98.60 Females per 100 Males in Hereford.
What is the Median Population Age in Hereford?
Median Population Age in Hereford is 29.6 Years.
What is the Average Family Size in Hereford
Average Family Size in Hereford is 3.5 People.
What is the Average Household Size in Hereford
Average Household Size in Hereford is 3.0 People.
How Large is the Labor Force in Hereford?
There are 6,929 People in the Labor Forcein in Hereford.
What is the Percentage of People in the Labor Force in Hereford?
65.3% of People are in the Labor Force in Hereford.
What is the Unemployment Rate in Hereford?
Unemployment Rate in Hereford is 2.7%.