Spanish vs German Russian Married-Couple Family Poverty

COMPARE

Spanish
Race
Ancestry
AfghanAfricanAlaska NativeAlaskan AthabascanAlbanianAleutAlsatianAmericanApacheArabArapahoArgentineanArmenianAssyrian/Chaldean/SyriacAustralianAustrianBahamianBangladeshiBarbadianBasqueBelgianBelizeanBermudanBhutaneseBlackfeetBolivianBrazilianBritishBritish West IndianBulgarianBurmeseCajunCambodianCanadianCape VerdeanCarpatho RusynCelticCentral AmericanCentral American IndianCherokeeCheyenneChickasawChileanChineseChippewaChoctawColombianColvilleComancheCosta RicanCreeCreekCroatianCrowCubanCypriotCzechCzechoslovakianDanishDelawareDominicanDutchDutch West IndianEastern EuropeanEcuadorianEgyptianEnglishEstonianEthiopianEuropeanFijianFilipinoFinnishFrenchFrench American IndianFrench CanadianGermanGhanaianGreekGuamanian/ChamorroGuatemalanGuyaneseHaitianHmongHonduranHopiHoumaHungarianIcelanderIndian (Asian)IndonesianInupiatIranianIraqiIrishIroquoisIsraeliItalianJamaicanJapaneseJordanianKenyanKiowaKoreanLaotianLatvianLebaneseLiberianLithuanianLumbeeLuxembourgerMacedonianMalaysianMalteseMarshalleseMenomineeMexicanMexican American IndianMongolianMoroccanNative HawaiianNavajoNepaleseNew ZealanderNicaraguanNigerianNorthern EuropeanNorwegianOkinawanOsageOttawaPaiutePakistaniPalestinianPanamanianParaguayanPennsylvania GermanPeruvianPimaPolishPortuguesePotawatomiPuebloPuerto RicanPuget Sound SalishRomanianRussianSalvadoranSamoanScandinavianScotch-IrishScottishSeminoleSenegaleseSerbianShoshoneSierra LeoneanSiouxSlavicSlovakSloveneSomaliSouth AfricanSouth AmericanSouth American IndianSoviet UnionSpaniardSpanishSpanish AmericanSpanish American IndianSri LankanSubsaharan AfricanSudaneseSwedishSwissSyrianTaiwaneseThaiTlingit-HaidaTohono O'OdhamTonganTrinidadian and TobagonianTsimshianTurkishU.S. Virgin IslanderUgandanUkrainianUruguayanUteVenezuelanVietnameseWelshWest IndianYakamaYaquiYugoslavianYumanYup'ikZimbabwean
Immigration
NonimmigrantsImmigrantsAfghanistanAfricaAlbaniaArgentinaArmeniaAsiaAustraliaAustriaBahamasBangladeshBarbadosBelarusBelgiumBelizeBoliviaBosnia and HerzegovinaBrazilBulgariaBurma/MyanmarCabo VerdeCambodiaCameroonCanadaCaribbeanCentral AmericaChileChinaColombiaCongoCosta RicaCroatiaCubaCzechoslovakiaDenmarkDominicaDominican RepublicEastern AfricaEastern AsiaEastern EuropeEcuadorEgyptEl SalvadorEnglandEritreaEthiopiaEuropeFijiFranceGermanyGhanaGreeceGrenadaGuatemalaGuyanaHaitiHondurasHong KongHungaryIndiaIndonesiaIranIraqIrelandIsraelItalyJamaicaJapanJordanKazakhstanKenyaKoreaKuwaitLaosLatin AmericaLatviaLebanonLiberiaLithuaniaMalaysiaMexicoMicronesiaMiddle AfricaMoldovaMoroccoNepalNetherlandsNicaraguaNigeriaNorth AmericaNorth MacedoniaNorthern AfricaNorthern EuropeNorwayOceaniaPakistanPanamaPeruPhilippinesPolandPortugalRomaniaRussiaSaudi ArabiaScotlandSenegalSerbiaSierra LeoneSingaporeSomaliaSouth AfricaSouth AmericaSouth Central AsiaSouth Eastern AsiaSouthern EuropeSpainSri LankaSt. Vincent and the GrenadinesSudanSwedenSwitzerlandSyriaTaiwanThailandTrinidad and TobagoTurkeyUgandaUkraineUruguayUzbekistanVenezuelaVietnamWest IndiesWestern AfricaWestern AsiaWestern EuropeYemenZaireZimbabweAzores
German Russian
Race
Ancestry
AfghanAfricanAlaska NativeAlaskan AthabascanAlbanianAleutAlsatianAmericanApacheArabArapahoArgentineanArmenianAssyrian/Chaldean/SyriacAustralianAustrianBahamianBangladeshiBarbadianBasqueBelgianBelizeanBermudanBhutaneseBlackfeetBolivianBrazilianBritishBritish West IndianBulgarianBurmeseCajunCambodianCanadianCape VerdeanCarpatho RusynCelticCentral AmericanCentral American IndianCherokeeCheyenneChickasawChileanChineseChippewaChoctawColombianColvilleComancheCosta RicanCreeCreekCroatianCrowCubanCypriotCzechCzechoslovakianDanishDelawareDominicanDutchDutch West IndianEastern EuropeanEcuadorianEgyptianEnglishEstonianEthiopianEuropeanFijianFilipinoFinnishFrenchFrench American IndianFrench CanadianGermanGerman RussianGhanaianGreekGuamanian/ChamorroGuatemalanGuyaneseHaitianHmongHonduranHopiHoumaHungarianIcelanderIndian (Asian)IndonesianInupiatIranianIraqiIrishIroquoisIsraeliItalianJamaicanJapaneseJordanianKenyanKiowaKoreanLaotianLatvianLebaneseLiberianLithuanianLumbeeLuxembourgerMacedonianMalaysianMalteseMarshalleseMenomineeMexicanMexican American IndianMongolianMoroccanNative HawaiianNavajoNepaleseNew ZealanderNicaraguanNigerianNorthern EuropeanNorwegianOkinawanOsageOttawaPaiutePakistaniPalestinianPanamanianParaguayanPennsylvania GermanPeruvianPimaPolishPortuguesePotawatomiPuebloPuerto RicanPuget Sound SalishRomanianRussianSalvadoranSamoanScandinavianScotch-IrishScottishSeminoleSenegaleseSerbianShoshoneSierra LeoneanSiouxSlavicSlovakSloveneSomaliSouth AfricanSouth AmericanSouth American IndianSoviet UnionSpaniardSpanish AmericanSpanish American IndianSri LankanSubsaharan AfricanSudaneseSwedishSwissSyrianTaiwaneseThaiTlingit-HaidaTohono O'OdhamTonganTrinidadian and TobagonianTsimshianTurkishU.S. Virgin IslanderUgandanUkrainianUruguayanUteVenezuelanVietnameseWelshWest IndianYakamaYaquiYugoslavianYumanYup'ikZimbabwean
Immigration
NonimmigrantsImmigrantsAfghanistanAfricaAlbaniaArgentinaArmeniaAsiaAustraliaAustriaBahamasBangladeshBarbadosBelarusBelgiumBelizeBoliviaBosnia and HerzegovinaBrazilBulgariaBurma/MyanmarCabo VerdeCambodiaCameroonCanadaCaribbeanCentral AmericaChileChinaColombiaCongoCosta RicaCroatiaCubaCzechoslovakiaDenmarkDominicaDominican RepublicEastern AfricaEastern AsiaEastern EuropeEcuadorEgyptEl SalvadorEnglandEritreaEthiopiaEuropeFijiFranceGermanyGhanaGreeceGrenadaGuatemalaGuyanaHaitiHondurasHong KongHungaryIndiaIndonesiaIranIraqIrelandIsraelItalyJamaicaJapanJordanKazakhstanKenyaKoreaKuwaitLaosLatin AmericaLatviaLebanonLiberiaLithuaniaMalaysiaMexicoMicronesiaMiddle AfricaMoldovaMoroccoNepalNetherlandsNicaraguaNigeriaNorth AmericaNorth MacedoniaNorthern AfricaNorthern EuropeNorwayOceaniaPakistanPanamaPeruPhilippinesPolandPortugalRomaniaRussiaSaudi ArabiaScotlandSenegalSerbiaSierra LeoneSingaporeSomaliaSouth AfricaSouth AmericaSouth Central AsiaSouth Eastern AsiaSouthern EuropeSpainSri LankaSt. Vincent and the GrenadinesSudanSwedenSwitzerlandSyriaTaiwanThailandTrinidad and TobagoTurkeyUgandaUkraineUruguayUzbekistanVenezuelaVietnamWest IndiesWestern AfricaWestern AsiaWestern EuropeYemenZaireZimbabweAzores
Married-Couple Family Poverty
Income
Poverty
Unemployment
Labor Participation
Family Structure
Vehicle Availability
Education Level
Disability

Married-Couple Family Poverty Comparison

Spanish

German Russians

Average
Excellent
5.3%
MARRIED-COUPLE FAMILY POVERTY
41.4/ 100
METRIC RATING
179th/ 347
METRIC RANK
5.0%
MARRIED-COUPLE FAMILY POVERTY
85.1/ 100
METRIC RATING
139th/ 347
METRIC RANK

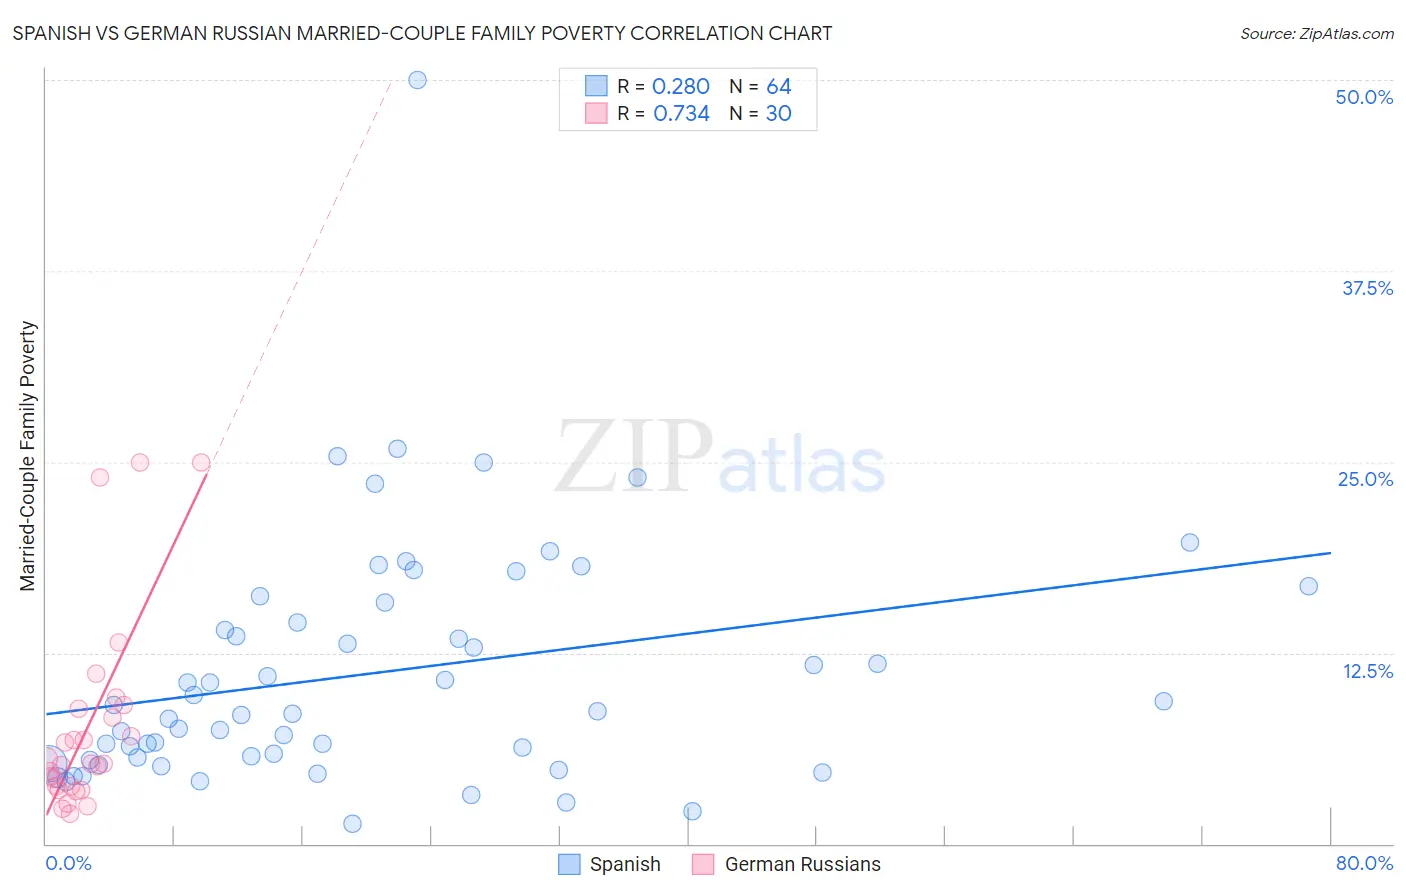
Spanish vs German Russian Married-Couple Family Poverty Correlation Chart

The statistical analysis conducted on geographies consisting of 418,282,486 people shows a weak positive correlation between the proportion of Spanish and poverty level among married-couple families in the United States with a correlation coefficient (R) of 0.280 and weighted average of 5.3%. Similarly, the statistical analysis conducted on geographies consisting of 96,237,761 people shows a strong positive correlation between the proportion of German Russians and poverty level among married-couple families in the United States with a correlation coefficient (R) of 0.734 and weighted average of 5.0%, a difference of 6.4%.
Spanish vs German Russian Married-Couple Family Poverty

Married-Couple Family Poverty Correlation Summary

MeasurementSpanishGerman Russian
Minimum1.3%2.0%
Maximum50.0%25.0%
Range48.7%23.0%
Mean11.1%7.6%
Median8.6%5.3%
Interquartile 25% (IQ1)5.6%3.7%
Interquartile 75% (IQ3)15.2%8.9%
Interquartile Range (IQR)9.6%5.1%
Standard Deviation (Sample)8.0%6.4%
Standard Deviation (Population)8.0%6.3%

Similar Demographics by Married-Couple Family Poverty

Demographics Similar to Spanish by Married-Couple Family Poverty

In terms of married-couple family poverty, the demographic groups most similar to Spanish are Immigrants from Sierra Leone (5.3%, a difference of 0.25%), Immigrants from Chile (5.3%, a difference of 0.31%), Immigrants from Ukraine (5.2%, a difference of 0.42%), Immigrants from Kazakhstan (5.2%, a difference of 0.44%), and Immigrants from Vietnam (5.3%, a difference of 0.44%).
DemographicsRating | RankMarried-Couple Family Poverty
Immigrants | Northern Africa
51.3
/100
|
#172
Average
5.2%
Alsatians
51.2
/100
|
#173
Average
5.2%
Immigrants | Eastern Africa
50.0
/100
|
#174
Average
5.2%
Marshallese
47.9
/100
|
#175
Average
5.2%
Menominee
47.8
/100
|
#176
Average
5.2%
Immigrants | Kazakhstan
45.1
/100
|
#177
Average
5.2%
Immigrants | Ukraine
44.9
/100
|
#178
Average
5.2%
Spanish
41.4
/100
|
#179
Average
5.3%
Immigrants | Sierra Leone
39.3
/100
|
#180
Fair
5.3%
Immigrants | Chile
38.8
/100
|
#181
Fair
5.3%
Immigrants | Vietnam
37.7
/100
|
#182
Fair
5.3%
Peruvians
37.6
/100
|
#183
Fair
5.3%
Immigrants | Nonimmigrants
35.8
/100
|
#184
Fair
5.3%
Americans
35.4
/100
|
#185
Fair
5.3%
Hungarians
34.7
/100
|
#186
Fair
5.3%

Demographics Similar to German Russians by Married-Couple Family Poverty

In terms of married-couple family poverty, the demographic groups most similar to German Russians are Immigrants from Portugal (5.0%, a difference of 0.060%), Immigrants from Brazil (5.0%, a difference of 0.11%), Immigrants from China (5.0%, a difference of 0.11%), Chilean (4.9%, a difference of 0.23%), and Guamanian/Chamorro (4.9%, a difference of 0.36%).
DemographicsRating | RankMarried-Couple Family Poverty
Puget Sound Salish
90.4
/100
|
#132
Exceptional
4.9%
Immigrants | Kenya
90.2
/100
|
#133
Exceptional
4.9%
Samoans
90.2
/100
|
#134
Exceptional
4.9%
Assyrians/Chaldeans/Syriacs
89.4
/100
|
#135
Excellent
4.9%
Immigrants | Hungary
88.7
/100
|
#136
Excellent
4.9%
Guamanians/Chamorros
86.5
/100
|
#137
Excellent
4.9%
Chileans
86.0
/100
|
#138
Excellent
4.9%
German Russians
85.1
/100
|
#139
Excellent
5.0%
Immigrants | Portugal
84.8
/100
|
#140
Excellent
5.0%
Immigrants | Brazil
84.6
/100
|
#141
Excellent
5.0%
Immigrants | China
84.6
/100
|
#142
Excellent
5.0%
Immigrants | Egypt
83.4
/100
|
#143
Excellent
5.0%
Hmong
83.2
/100
|
#144
Excellent
5.0%
Immigrants | Spain
79.9
/100
|
#145
Good
5.0%
Mongolians
79.8
/100
|
#146
Good
5.0%