Nepalese Wage/Income Gap
COMPARE
Nepalese
Select to Compare
Wage/Income Gap
Nepalese Wage/Income Gap
22.2%
WAGE/INCOME GAP
100.0/ 100
METRIC RATING
54th/ 347
METRIC RANK
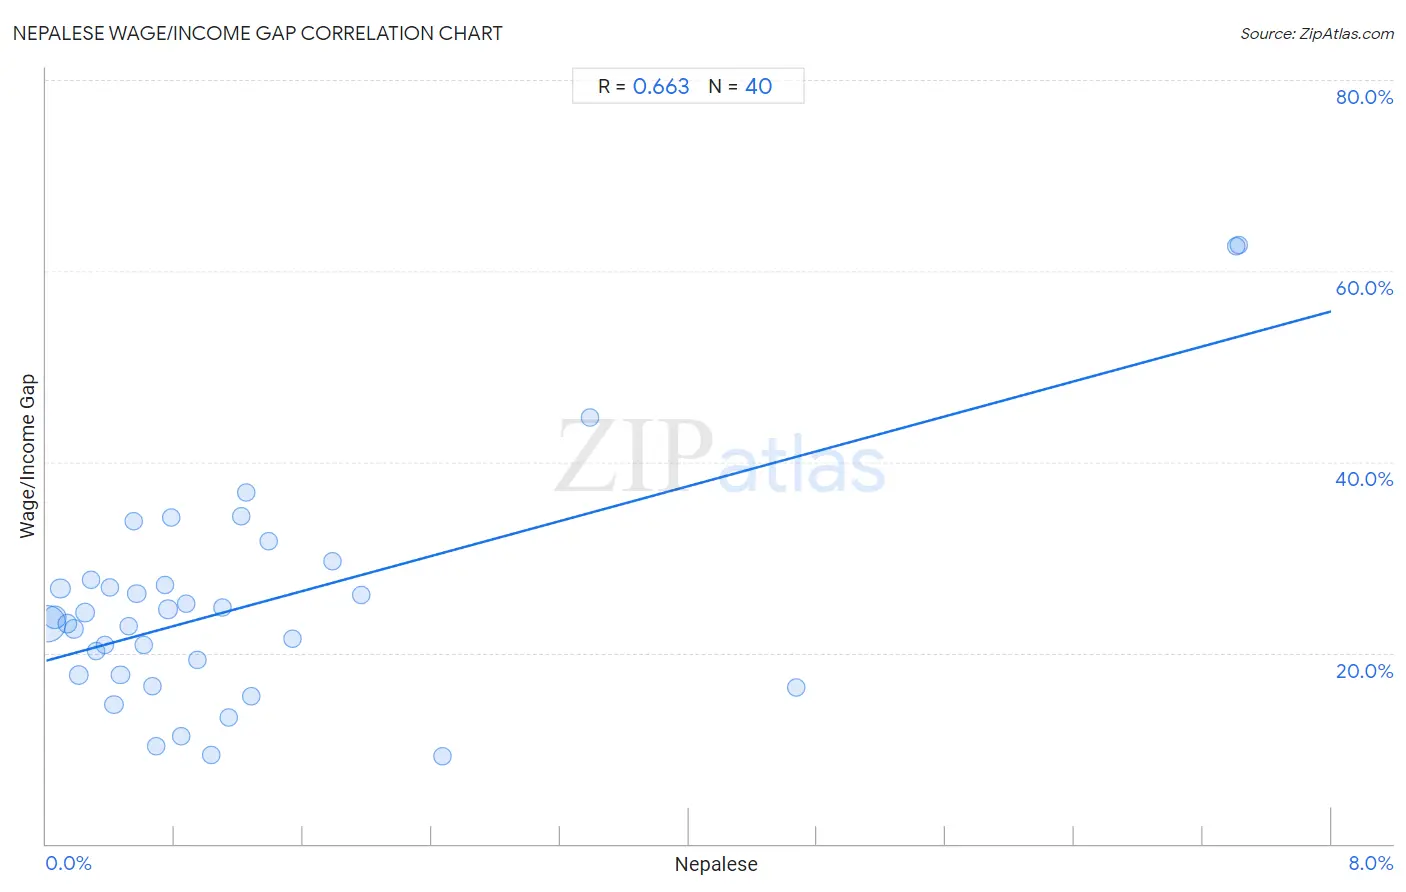
Nepalese Wage/Income Gap Correlation Chart
The statistical analysis conducted on geographies consisting of 24,519,153 people shows a significant positive correlation between the proportion of Nepalese and wage/income gap percentage in the United States with a correlation coefficient (R) of 0.663 and weighted average of 22.2%. On average, for every 1% (one percent) increase in Nepalese within a typical geography, there is an increase of 4.6% in wage/income gap percentage.
It is essential to understand that the correlation between the percentage of Nepalese and wage/income gap percentage does not imply a direct cause-and-effect relationship. It remains uncertain whether the presence of Nepalese influences an upward or downward trend in the level of wage/income gap percentage within an area, or if Nepalese simply ended up residing in those areas with higher or lower levels of wage/income gap percentage due to other factors.
Demographics Similar to Nepalese by Wage/Income Gap
In terms of wage/income gap, the demographic groups most similar to Nepalese are Bangladeshi (22.2%, a difference of 0.23%), Immigrants from Cameroon (22.2%, a difference of 0.24%), Tohono O'odham (22.1%, a difference of 0.32%), Immigrants from Zaire (22.3%, a difference of 0.40%), and Immigrants from Ghana (22.3%, a difference of 0.43%).
| Demographics | Rating | Rank | Wage/Income Gap |
| Immigrants from Congo | 100.0 /100 | #47 | Exceptional 21.7% |
| Blacks/African Americans | 100.0 /100 | #48 | Exceptional 21.7% |
| Ethiopians | 100.0 /100 | #49 | Exceptional 21.8% |
| Immigrants from Western Africa | 100.0 /100 | #50 | Exceptional 22.0% |
| Tohono O'odham | 100.0 /100 | #51 | Exceptional 22.1% |
| Immigrants from Cameroon | 100.0 /100 | #52 | Exceptional 22.2% |
| Bangladeshis | 100.0 /100 | #53 | Exceptional 22.2% |
| Nepalese | 100.0 /100 | #54 | Exceptional 22.2% |
| Immigrants from Zaire | 100.0 /100 | #55 | Exceptional 22.3% |
| Immigrants from Ghana | 100.0 /100 | #56 | Exceptional 22.3% |
| Ghanaians | 100.0 /100 | #57 | Exceptional 22.3% |
| Immigrants from Cuba | 100.0 /100 | #58 | Exceptional 22.4% |
| Navajo | 100.0 /100 | #59 | Exceptional 22.4% |
| Immigrants from Middle Africa | 100.0 /100 | #60 | Exceptional 22.4% |
| Immigrants from Fiji | 100.0 /100 | #61 | Exceptional 22.4% |
Nepalese Wage/Income Gap Correlation Summary
| Measurement | Nepalese Data | Wage/Income Gap Data |
| Minimum | 0.0096% | 9.1% |
| Maximum | 7.4% | 62.8% |
| Range | 7.4% | 53.7% |
| Mean | 1.3% | 25.0% |
| Median | 0.75% | 23.4% |
| Interquartile 25% (IQ1) | 0.38% | 17.7% |
| Interquartile 75% (IQ3) | 1.3% | 27.4% |
| Interquartile Range (IQR) | 0.88% | 9.7% |
| Standard Deviation (Sample) | 1.7% | 11.7% |
| Standard Deviation (Population) | 1.7% | 11.5% |
Correlation Details
| Nepalese Percentile | Sample Size | Wage/Income Gap |
[ 0.0% - 0.5% ] 0.0096% | 13,361,715 | 23.1% |
[ 0.0% - 0.5% ] 0.054% | 3,796,807 | 23.7% |
[ 0.0% - 0.5% ] 0.089% | 1,243,192 | 26.7% |
[ 0.0% - 0.5% ] 0.13% | 1,096,236 | 23.1% |
[ 0.0% - 0.5% ] 0.17% | 641,382 | 22.5% |
[ 0.0% - 0.5% ] 0.21% | 853,168 | 17.7% |
[ 0.0% - 0.5% ] 0.24% | 759,597 | 24.2% |
[ 0.0% - 0.5% ] 0.28% | 277,682 | 27.6% |
[ 0.0% - 0.5% ] 0.31% | 230,778 | 20.2% |
[ 0.0% - 0.5% ] 0.36% | 142,782 | 20.8% |
[ 0.0% - 0.5% ] 0.40% | 123,268 | 26.8% |
[ 0.0% - 0.5% ] 0.42% | 568,342 | 14.6% |
[ 0.0% - 0.5% ] 0.46% | 197,873 | 17.7% |
[ 0.5% - 1.0% ] 0.51% | 111,359 | 22.8% |
[ 0.5% - 1.0% ] 0.54% | 87,441 | 33.7% |
[ 0.5% - 1.0% ] 0.56% | 189,407 | 26.2% |
[ 0.5% - 1.0% ] 0.60% | 38,459 | 20.8% |
[ 0.5% - 1.0% ] 0.66% | 91,359 | 16.5% |
[ 0.5% - 1.0% ] 0.69% | 60,850 | 10.2% |
[ 0.5% - 1.0% ] 0.74% | 22,145 | 27.1% |
[ 0.5% - 1.0% ] 0.76% | 120,701 | 24.6% |
[ 0.5% - 1.0% ] 0.78% | 16,150 | 34.2% |
[ 0.5% - 1.0% ] 0.84% | 56,650 | 11.2% |
[ 0.5% - 1.0% ] 0.87% | 57,943 | 25.2% |
[ 0.5% - 1.0% ] 0.94% | 118,105 | 19.3% |
[ 1.0% - 1.5% ] 1.03% | 7,581 | 9.3% |
[ 1.0% - 1.5% ] 1.10% | 20,835 | 24.8% |
[ 1.0% - 1.5% ] 1.13% | 41,311 | 13.3% |
[ 1.0% - 1.5% ] 1.21% | 5,202 | 34.4% |
[ 1.0% - 1.5% ] 1.25% | 2,486 | 36.8% |
[ 1.0% - 1.5% ] 1.28% | 33,116 | 15.5% |
[ 1.0% - 1.5% ] 1.38% | 80,543 | 31.7% |
[ 1.5% - 2.0% ] 1.53% | 10,902 | 21.5% |
[ 1.5% - 2.0% ] 1.78% | 14,824 | 29.6% |
[ 1.5% - 2.0% ] 1.96% | 30,556 | 26.1% |
[ 2.0% - 2.5% ] 2.47% | 1,297 | 9.1% |
[ 3.0% - 3.5% ] 3.39% | 3,955 | 44.6% |
[ 4.5% - 5.0% ] 4.67% | 2,291 | 16.4% |
[ 7.0% - 7.5% ] 7.41% | 432 | 62.6% |
[ 7.0% - 7.5% ] 7.42% | 431 | 62.8% |