Immigrants from Western Europe 3 or more Vehicles in Household

COMPARE

Immigrants from Western Europe
Race
Ancestry
AfghanAfricanAlaska NativeAlaskan AthabascanAlbanianAleutAlsatianAmericanApacheArabArapahoArgentineanArmenianAssyrian/Chaldean/SyriacAustralianAustrianBahamianBangladeshiBarbadianBasqueBelgianBelizeanBermudanBhutaneseBlackfeetBolivianBrazilianBritishBritish West IndianBulgarianBurmeseCajunCambodianCanadianCape VerdeanCarpatho RusynCelticCentral AmericanCentral American IndianCherokeeCheyenneChickasawChileanChineseChippewaChoctawColombianColvilleComancheCosta RicanCreeCreekCroatianCrowCubanCypriotCzechCzechoslovakianDanishDelawareDominicanDutchDutch West IndianEastern EuropeanEcuadorianEgyptianEnglishEstonianEthiopianEuropeanFijianFilipinoFinnishFrenchFrench American IndianFrench CanadianGermanGerman RussianGhanaianGreekGuamanian/ChamorroGuatemalanGuyaneseHaitianHmongHonduranHopiHoumaHungarianIcelanderIndian (Asian)IndonesianInupiatIranianIraqiIrishIroquoisIsraeliItalianJamaicanJapaneseJordanianKenyanKiowaKoreanLaotianLatvianLebaneseLiberianLithuanianLumbeeLuxembourgerMacedonianMalaysianMalteseMarshalleseMenomineeMexicanMexican American IndianMongolianMoroccanNative HawaiianNavajoNepaleseNew ZealanderNicaraguanNigerianNorthern EuropeanNorwegianOkinawanOsageOttawaPaiutePakistaniPalestinianPanamanianParaguayanPennsylvania GermanPeruvianPimaPolishPortuguesePotawatomiPuebloPuerto RicanPuget Sound SalishRomanianRussianSalvadoranSamoanScandinavianScotch-IrishScottishSeminoleSenegaleseSerbianShoshoneSierra LeoneanSiouxSlavicSlovakSloveneSomaliSouth AfricanSouth AmericanSouth American IndianSoviet UnionSpaniardSpanishSpanish AmericanSpanish American IndianSri LankanSubsaharan AfricanSudaneseSwedishSwissSyrianTaiwaneseThaiTlingit-HaidaTohono O'OdhamTonganTrinidadian and TobagonianTsimshianTurkishU.S. Virgin IslanderUgandanUkrainianUruguayanUteVenezuelanVietnameseWelshWest IndianYakamaYaquiYugoslavianYumanYup'ikZimbabwean
Immigration
NonimmigrantsImmigrantsAfghanistanAfricaAlbaniaArgentinaArmeniaAsiaAustraliaAustriaBahamasBangladeshBarbadosBelarusBelgiumBelizeBoliviaBosnia and HerzegovinaBrazilBulgariaBurma/MyanmarCabo VerdeCambodiaCameroonCanadaCaribbeanCentral AmericaChileChinaColombiaCongoCosta RicaCroatiaCubaCzechoslovakiaDenmarkDominicaDominican RepublicEastern AfricaEastern AsiaEastern EuropeEcuadorEgyptEl SalvadorEnglandEritreaEthiopiaEuropeFijiFranceGermanyGhanaGreeceGrenadaGuatemalaGuyanaHaitiHondurasHong KongHungaryIndiaIndonesiaIranIraqIrelandIsraelItalyJamaicaJapanJordanKazakhstanKenyaKoreaKuwaitLaosLatin AmericaLatviaLebanonLiberiaLithuaniaMalaysiaMexicoMicronesiaMiddle AfricaMoldovaMoroccoNepalNetherlandsNicaraguaNigeriaNorth AmericaNorth MacedoniaNorthern AfricaNorthern EuropeNorwayOceaniaPakistanPanamaPeruPhilippinesPolandPortugalRomaniaRussiaSaudi ArabiaScotlandSenegalSerbiaSierra LeoneSingaporeSomaliaSouth AfricaSouth AmericaSouth Central AsiaSouth Eastern AsiaSouthern EuropeSpainSri LankaSt. Vincent and the GrenadinesSudanSwedenSwitzerlandSyriaTaiwanThailandTrinidad and TobagoTurkeyUgandaUkraineUruguayUzbekistanVenezuelaVietnamWest IndiesWestern AfricaWestern AsiaWestern EuropeYemenZaireZimbabweAzores
Select to Compare
Race
Ancestry
AfghanAfricanAlaska NativeAlaskan AthabascanAlbanianAleutAlsatianAmericanApacheArabArapahoArgentineanArmenianAssyrian/Chaldean/SyriacAustralianAustrianBahamianBangladeshiBarbadianBasqueBelgianBelizeanBermudanBhutaneseBlackfeetBolivianBrazilianBritishBritish West IndianBulgarianBurmeseCajunCambodianCanadianCape VerdeanCarpatho RusynCelticCentral AmericanCentral American IndianCherokeeCheyenneChickasawChileanChineseChippewaChoctawColombianColvilleComancheCosta RicanCreeCreekCroatianCrowCubanCypriotCzechCzechoslovakianDanishDelawareDominicanDutchDutch West IndianEastern EuropeanEcuadorianEgyptianEnglishEstonianEthiopianEuropeanFijianFilipinoFinnishFrenchFrench American IndianFrench CanadianGermanGerman RussianGhanaianGreekGuamanian/ChamorroGuatemalanGuyaneseHaitianHmongHonduranHopiHoumaHungarianIcelanderIndian (Asian)IndonesianInupiatIranianIraqiIrishIroquoisIsraeliItalianJamaicanJapaneseJordanianKenyanKiowaKoreanLaotianLatvianLebaneseLiberianLithuanianLumbeeLuxembourgerMacedonianMalaysianMalteseMarshalleseMenomineeMexicanMexican American IndianMongolianMoroccanNative HawaiianNavajoNepaleseNew ZealanderNicaraguanNigerianNorthern EuropeanNorwegianOkinawanOsageOttawaPaiutePakistaniPalestinianPanamanianParaguayanPennsylvania GermanPeruvianPimaPolishPortuguesePotawatomiPuebloPuerto RicanPuget Sound SalishRomanianRussianSalvadoranSamoanScandinavianScotch-IrishScottishSeminoleSenegaleseSerbianShoshoneSierra LeoneanSiouxSlavicSlovakSloveneSomaliSouth AfricanSouth AmericanSouth American IndianSoviet UnionSpaniardSpanishSpanish AmericanSpanish American IndianSri LankanSubsaharan AfricanSudaneseSwedishSwissSyrianTaiwaneseThaiTlingit-HaidaTohono O'OdhamTonganTrinidadian and TobagonianTsimshianTurkishU.S. Virgin IslanderUgandanUkrainianUruguayanUteVenezuelanVietnameseWelshWest IndianYakamaYaquiYugoslavianYumanYup'ikZimbabwean
Immigration
NonimmigrantsImmigrantsAfghanistanAfricaAlbaniaArgentinaArmeniaAsiaAustraliaAustriaBahamasBangladeshBarbadosBelarusBelgiumBelizeBoliviaBosnia and HerzegovinaBrazilBulgariaBurma/MyanmarCabo VerdeCambodiaCameroonCanadaCaribbeanCentral AmericaChileChinaColombiaCongoCosta RicaCroatiaCubaCzechoslovakiaDenmarkDominicaDominican RepublicEastern AfricaEastern AsiaEastern EuropeEcuadorEgyptEl SalvadorEnglandEritreaEthiopiaEuropeFijiFranceGermanyGhanaGreeceGrenadaGuatemalaGuyanaHaitiHondurasHong KongHungaryIndiaIndonesiaIranIraqIrelandIsraelItalyJamaicaJapanJordanKazakhstanKenyaKoreaKuwaitLaosLatin AmericaLatviaLebanonLiberiaLithuaniaMalaysiaMexicoMicronesiaMiddle AfricaMoldovaMoroccoNepalNetherlandsNicaraguaNigeriaNorth AmericaNorth MacedoniaNorthern AfricaNorthern EuropeNorwayOceaniaPakistanPanamaPeruPhilippinesPolandPortugalRomaniaRussiaSaudi ArabiaScotlandSenegalSerbiaSierra LeoneSingaporeSomaliaSouth AfricaSouth AmericaSouth Central AsiaSouth Eastern AsiaSouthern EuropeSpainSri LankaSt. Vincent and the GrenadinesSudanSwedenSwitzerlandSyriaTaiwanThailandTrinidad and TobagoTurkeyUgandaUkraineUruguayUzbekistanVenezuelaVietnamWest IndiesWestern AfricaWestern AsiaYemenZaireZimbabweAzores
3 or more Vehicles in Household
Income
Poverty
Unemployment
Labor Participation
Family Structure
Vehicle Availability
Education Level
Disability

Immigrants from Western Europe 3 or more Vehicles in Household
Average

19.5%
3+ VEHICLES AVAILABLE
53.2/ 100
METRIC RATING
171st/ 347
METRIC RANK

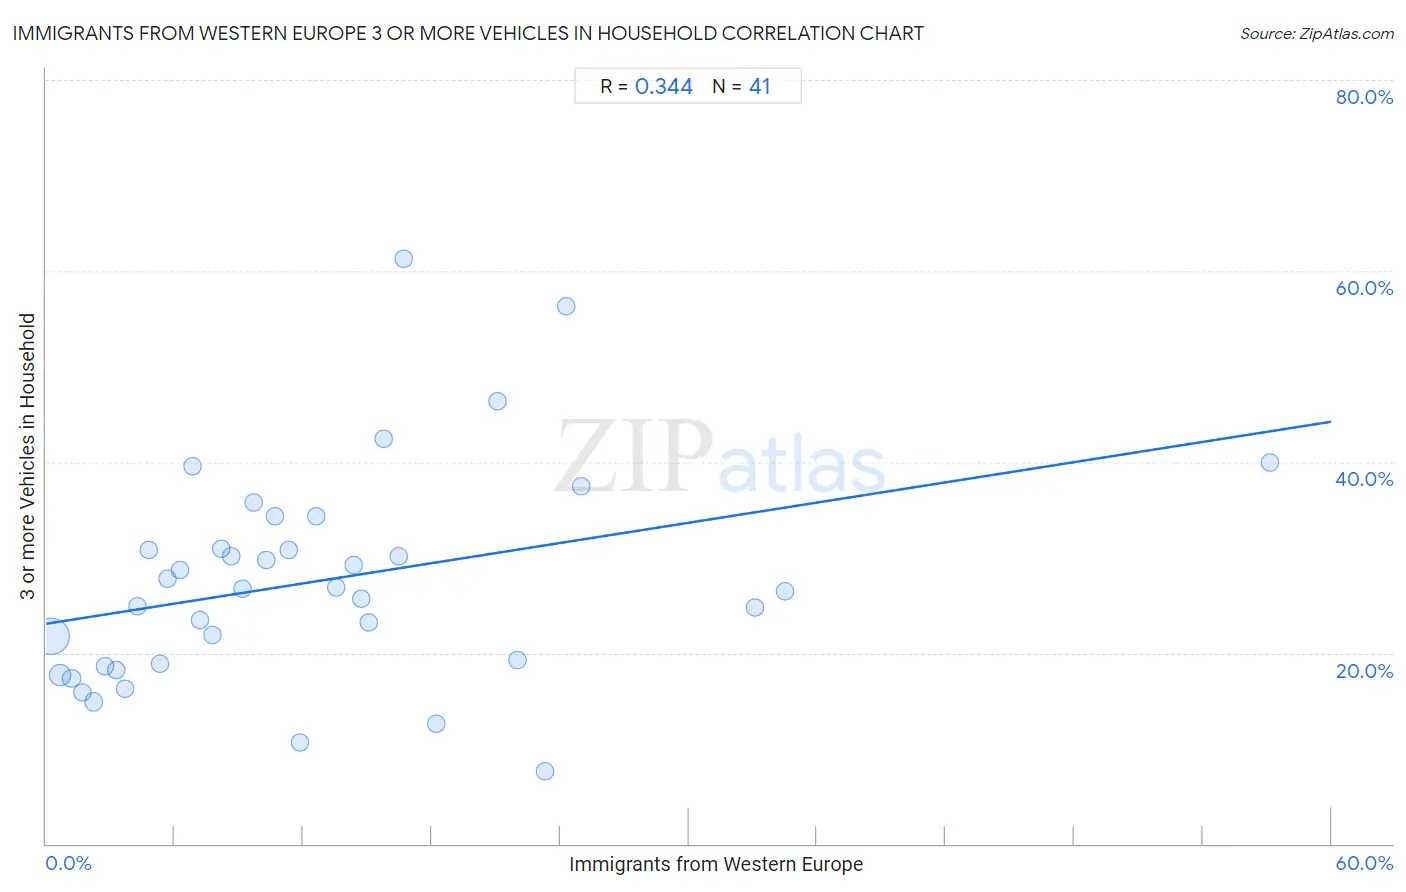
Immigrants from Western Europe 3 or more Vehicles in Household Correlation Chart

The statistical analysis conducted on geographies consisting of 493,637,379 people shows a mild positive correlation between the proportion of Immigrants from Western Europe and percentage of households with 3 or more vehicles available in the United States with a correlation coefficient (R) of 0.344 and weighted average of 19.5%. On average, for every 1% (one percent) increase in Immigrants from Western Europe within a typical geography, there is an increase of 0.35% in percentage of households with 3 or more vehicles available.
Immigrants from Western Europe 3 or more Vehicles in Household
It is essential to understand that the correlation between the percentage of Immigrants from Western Europe and percentage of households with 3 or more vehicles available does not imply a direct cause-and-effect relationship. It remains uncertain whether the presence of Immigrants from Western Europe influences an upward or downward trend in the level of percentage of households with 3 or more vehicles available within an area, or if Immigrants from Western Europe simply ended up residing in those areas with higher or lower levels of percentage of households with 3 or more vehicles available due to other factors.

Demographics Similar to Immigrants from Western Europe by 3 or more Vehicles in Household

In terms of 3 or more vehicles in household, the demographic groups most similar to Immigrants from Western Europe are Kiowa (19.5%, a difference of 0.18%), Iraqi (19.6%, a difference of 0.21%), Immigrants from Northern Europe (19.5%, a difference of 0.23%), Immigrants from South Africa (19.5%, a difference of 0.24%), and Immigrants from Denmark (19.6%, a difference of 0.34%).
DemographicsRating | Rank3 or more Vehicles in Household
Yugoslavians
62.9
/100
|
#164
Good
19.7%
Immigrants from Costa Rica
61.9
/100
|
#165
Good
19.7%
Immigrants from Cameroon
60.9
/100
|
#166
Good
19.7%
Ukrainians
58.9
/100
|
#167
Average
19.6%
Peruvians
58.8
/100
|
#168
Average
19.6%
Immigrants from Denmark
57.6
/100
|
#169
Average
19.6%
Iraqis
56.0
/100
|
#170
Average
19.6%
Immigrants from Western Europe
53.2
/100
|
#171
Average
19.5%
Kiowa
50.9
/100
|
#172
Average
19.5%
Immigrants from Northern Europe
50.2
/100
|
#173
Average
19.5%
Immigrants from South Africa
50.0
/100
|
#174
Average
19.5%
Syrians
47.0
/100
|
#175
Average
19.5%
Iroquois
46.0
/100
|
#176
Average
19.4%
Immigrants from Peru
41.1
/100
|
#177
Average
19.4%
Immigrants from Syria
40.3
/100
|
#178
Average
19.4%

Immigrants from Western Europe 3 or more Vehicles in Household Correlation Summary

MeasurementImmigrants from Western Europe Data3 or more Vehicles in Household Data
Minimum0.21%7.5%
Maximum57.1%61.3%
Range56.9%53.7%
Mean12.7%27.5%
Median10.3%26.7%
Interquartile 25% (IQ1)5.0%18.7%
Interquartile 75% (IQ3)16.6%32.6%
Interquartile Range (IQR)11.5%13.9%
Standard Deviation (Sample)11.0%11.3%
Standard Deviation (Population)10.9%11.2%

Correlation Details

Immigrants from Western Europe PercentileSample Size3 or more Vehicles in Household
[
0.0%
-
0.5%
]
0.21%
395,770,69621.7%
[
0.5%
-
1.0%
]
0.66%
77,178,09117.6%
[
1.0%
-
1.5%
]
1.19%
13,226,03617.3%
[
1.5%
-
2.0%
]
1.71%
4,200,50615.8%
[
2.0%
-
2.5%
]
2.20%
2,048,32714.9%
[
2.5%
-
3.0%
]
2.73%
642,11618.6%
[
3.0%
-
3.5%
]
3.25%
210,41318.2%
[
3.5%
-
4.0%
]
3.65%
137,70216.2%
[
4.0%
-
4.5%
]
4.25%
62,71024.9%
[
4.5%
-
5.0%
]
4.77%
42,07230.8%
[
5.0%
-
5.5%
]
5.30%
43,59318.8%
[
5.5%
-
6.0%
]
5.67%
11,20127.8%
[
6.0%
-
6.5%
]
6.26%
9,79028.6%
[
6.5%
-
7.0%
]
6.82%
4,64939.5%
[
7.0%
-
7.5%
]
7.20%
11,19523.4%
[
7.5%
-
8.0%
]
7.74%
9,55921.8%
[
8.0%
-
8.5%
]
8.16%
3,66330.9%
[
8.5%
-
9.0%
]
8.62%
8,96130.1%
[
9.0%
-
9.5%
]
9.17%
3,19426.7%
[
9.5%
-
10.0%
]
9.71%
3,97635.8%
[
10.0%
-
10.5%
]
10.29%
2,40029.7%
[
10.5%
-
11.0%
]
10.70%
65434.3%
[
11.0%
-
11.5%
]
11.34%
59130.8%
[
11.5%
-
12.0%
]
11.84%
15210.6%
[
12.5%
-
13.0%
]
12.61%
69034.2%
[
13.5%
-
14.0%
]
13.56%
11826.9%
[
14.0%
-
14.5%
]
14.35%
41829.2%
[
14.5%
-
15.0%
]
14.69%
17725.7%
[
15.0%
-
15.5%
]
15.04%
83823.1%
[
15.5%
-
16.0%
]
15.75%
27342.4%
[
16.0%
-
16.5%
]
16.47%
60730.1%
[
16.5%
-
17.0%
]
16.67%
14461.3%
[
18.0%
-
18.5%
]
18.19%
83012.6%
[
21.0%
-
21.5%
]
21.05%
9546.4%
[
21.5%
-
22.0%
]
21.98%
9119.3%
[
23.0%
-
23.5%
]
23.31%
3997.5%
[
24.0%
-
24.5%
]
24.27%
10356.2%
[
25.0%
-
25.5%
]
25.00%
1637.5%
[
33.0%
-
33.5%
]
33.10%
14224.7%
[
34.0%
-
34.5%
]
34.48%
5826.5%
[
57.0%
-
57.5%
]
57.14%
13340.0%