Immigrants from Somalia 3 or more Vehicles in Household
COMPARE
Immigrants from Somalia
Select to Compare
3 or more Vehicles in Household
Immigrants from Somalia 3 or more Vehicles in Household
15.9%
3+ VEHICLES AVAILABLE
0.0/ 100
METRIC RATING
309th/ 347
METRIC RANK
Immigrants from Somalia 3 or more Vehicles in Household Correlation Chart
The statistical analysis conducted on geographies consisting of 92,101,746 people shows a mild negative correlation between the proportion of Immigrants from Somalia and percentage of households with 3 or more vehicles available in the United States with a correlation coefficient (R) of -0.384 and weighted average of 15.9%. On average, for every 1% (one percent) increase in Immigrants from Somalia within a typical geography, there is a decrease of 0.52% in percentage of households with 3 or more vehicles available.
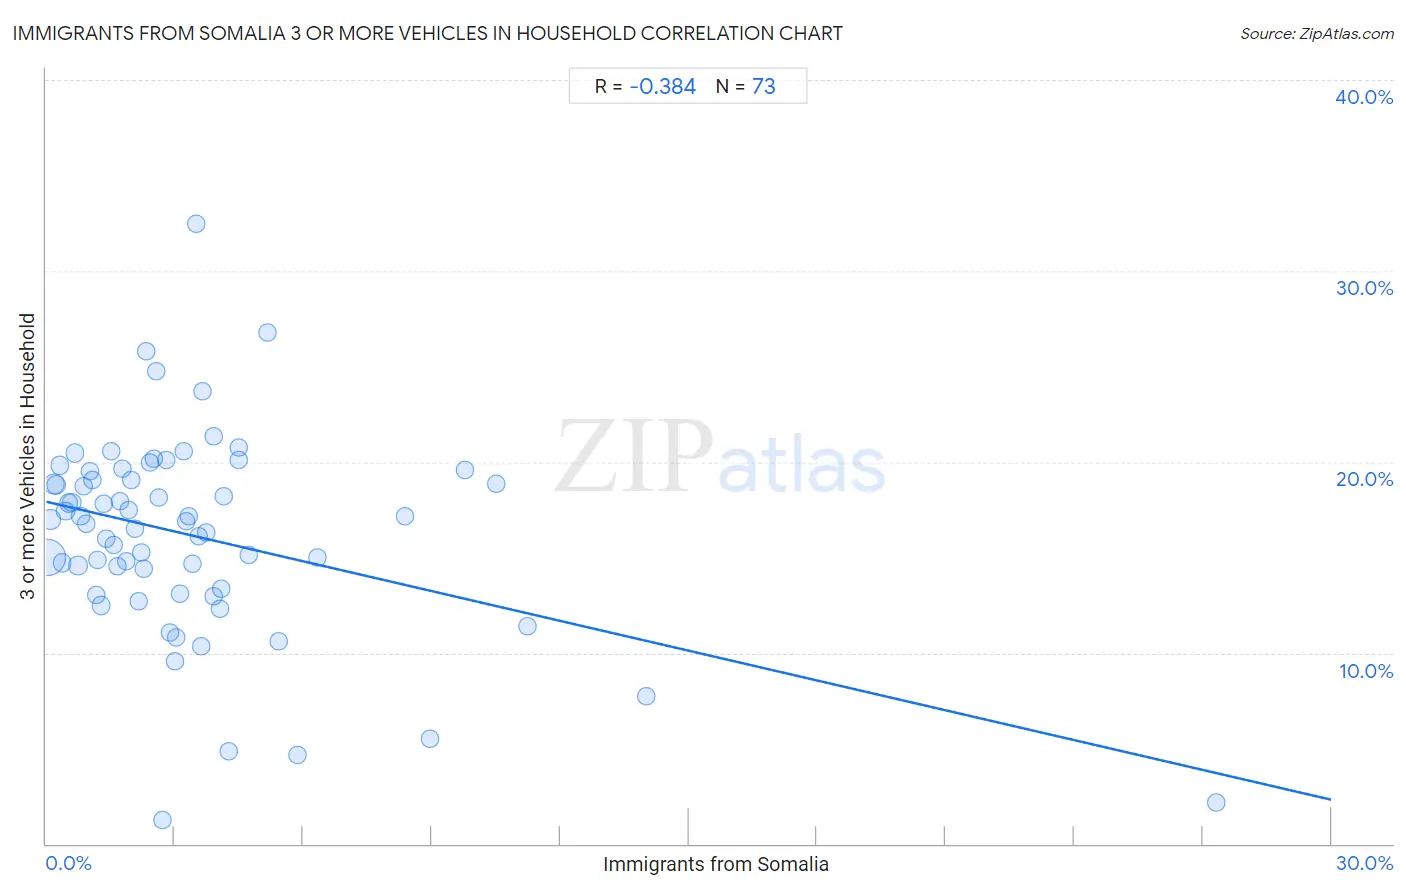
It is essential to understand that the correlation between the percentage of Immigrants from Somalia and percentage of households with 3 or more vehicles available does not imply a direct cause-and-effect relationship. It remains uncertain whether the presence of Immigrants from Somalia influences an upward or downward trend in the level of percentage of households with 3 or more vehicles available within an area, or if Immigrants from Somalia simply ended up residing in those areas with higher or lower levels of percentage of households with 3 or more vehicles available due to other factors.
Demographics Similar to Immigrants from Somalia by 3 or more Vehicles in Household
In terms of 3 or more vehicles in household, the demographic groups most similar to Immigrants from Somalia are Moroccan (15.9%, a difference of 0.24%), Albanian (15.8%, a difference of 0.74%), Houma (16.1%, a difference of 0.92%), Immigrants from Ghana (16.2%, a difference of 1.5%), and Somali (16.2%, a difference of 1.7%).
| Demographics | Rating | Rank | 3 or more Vehicles in Household |
| Immigrants from Greece | 0.0 /100 | #302 | Tragic 16.5% |
| Immigrants from Serbia | 0.0 /100 | #303 | Tragic 16.4% |
| Ghanaians | 0.0 /100 | #304 | Tragic 16.4% |
| Immigrants from Morocco | 0.0 /100 | #305 | Tragic 16.3% |
| Somalis | 0.0 /100 | #306 | Tragic 16.2% |
| Immigrants from Ghana | 0.0 /100 | #307 | Tragic 16.2% |
| Houma | 0.0 /100 | #308 | Tragic 16.1% |
| Immigrants from Somalia | 0.0 /100 | #309 | Tragic 15.9% |
| Moroccans | 0.0 /100 | #310 | Tragic 15.9% |
| Albanians | 0.0 /100 | #311 | Tragic 15.8% |
| Puerto Ricans | 0.0 /100 | #312 | Tragic 15.6% |
| Immigrants from Israel | 0.0 /100 | #313 | Tragic 15.6% |
| Immigrants from Belarus | 0.0 /100 | #314 | Tragic 15.5% |
| Haitians | 0.0 /100 | #315 | Tragic 15.5% |
| U.S. Virgin Islanders | 0.0 /100 | #316 | Tragic 15.4% |
Immigrants from Somalia 3 or more Vehicles in Household Correlation Summary
| Measurement | Immigrants from Somalia Data | 3 or more Vehicles in Household Data |
| Minimum | 0.018% | 1.3% |
| Maximum | 27.3% | 32.4% |
| Range | 27.3% | 31.2% |
| Mean | 3.4% | 16.1% |
| Median | 2.6% | 16.9% |
| Interquartile 25% (IQ1) | 1.2% | 13.2% |
| Interquartile 75% (IQ3) | 4.0% | 19.3% |
| Interquartile Range (IQR) | 2.7% | 6.1% |
| Standard Deviation (Sample) | 3.9% | 5.3% |
| Standard Deviation (Population) | 3.9% | 5.3% |
Correlation Details
| Immigrants from Somalia Percentile | Sample Size | 3 or more Vehicles in Household |
[ 0.0% - 0.5% ] 0.018% | 57,933,864 | 15.0% |
[ 0.0% - 0.5% ] 0.10% | 10,768,448 | 17.0% |
[ 0.0% - 0.5% ] 0.18% | 5,855,025 | 18.9% |
[ 0.0% - 0.5% ] 0.24% | 4,543,718 | 18.8% |
[ 0.0% - 0.5% ] 0.31% | 1,492,284 | 19.8% |
[ 0.0% - 0.5% ] 0.37% | 1,988,208 | 14.7% |
[ 0.0% - 0.5% ] 0.45% | 832,727 | 17.4% |
[ 0.5% - 1.0% ] 0.52% | 606,304 | 17.8% |
[ 0.5% - 1.0% ] 0.60% | 635,989 | 17.9% |
[ 0.5% - 1.0% ] 0.67% | 500,964 | 20.5% |
[ 0.5% - 1.0% ] 0.74% | 639,860 | 14.6% |
[ 0.5% - 1.0% ] 0.80% | 471,196 | 17.2% |
[ 0.5% - 1.0% ] 0.86% | 537,236 | 18.7% |
[ 0.5% - 1.0% ] 0.94% | 233,534 | 16.8% |
[ 1.0% - 1.5% ] 1.03% | 209,423 | 19.5% |
[ 1.0% - 1.5% ] 1.07% | 140,406 | 19.1% |
[ 1.0% - 1.5% ] 1.16% | 119,914 | 13.0% |
[ 1.0% - 1.5% ] 1.21% | 458,328 | 14.9% |
[ 1.0% - 1.5% ] 1.28% | 965,145 | 12.5% |
[ 1.0% - 1.5% ] 1.35% | 51,488 | 17.8% |
[ 1.0% - 1.5% ] 1.41% | 238,741 | 16.0% |
[ 1.5% - 2.0% ] 1.50% | 203,501 | 20.6% |
[ 1.5% - 2.0% ] 1.57% | 242,134 | 15.6% |
[ 1.5% - 2.0% ] 1.65% | 39,564 | 14.5% |
[ 1.5% - 2.0% ] 1.72% | 128,441 | 17.9% |
[ 1.5% - 2.0% ] 1.79% | 207,559 | 19.6% |
[ 1.5% - 2.0% ] 1.86% | 86,966 | 14.8% |
[ 1.5% - 2.0% ] 1.94% | 78,564 | 17.5% |
[ 1.5% - 2.0% ] 1.99% | 99,000 | 19.1% |
[ 2.0% - 2.5% ] 2.06% | 170,632 | 16.5% |
[ 2.0% - 2.5% ] 2.16% | 56,020 | 12.7% |
[ 2.0% - 2.5% ] 2.21% | 25,299 | 15.2% |
[ 2.0% - 2.5% ] 2.27% | 29,001 | 14.4% |
[ 2.0% - 2.5% ] 2.32% | 24,790 | 25.8% |
[ 2.0% - 2.5% ] 2.41% | 85,038 | 20.0% |
[ 2.5% - 3.0% ] 2.51% | 40,813 | 20.1% |
[ 2.5% - 3.0% ] 2.56% | 7,066 | 24.8% |
[ 2.5% - 3.0% ] 2.64% | 45,105 | 18.2% |
[ 2.5% - 3.0% ] 2.72% | 2,245 | 1.3% |
[ 2.5% - 3.0% ] 2.79% | 24,685 | 20.1% |
[ 2.5% - 3.0% ] 2.89% | 8,923 | 11.1% |
[ 2.5% - 3.0% ] 3.00% | 36,473 | 9.5% |
[ 3.0% - 3.5% ] 3.04% | 439,052 | 10.8% |
[ 3.0% - 3.5% ] 3.12% | 14,212 | 13.1% |
[ 3.0% - 3.5% ] 3.22% | 21,569 | 20.5% |
[ 3.0% - 3.5% ] 3.28% | 21,006 | 16.9% |
[ 3.0% - 3.5% ] 3.34% | 32,266 | 17.1% |
[ 3.0% - 3.5% ] 3.40% | 23,785 | 14.6% |
[ 3.0% - 3.5% ] 3.49% | 10,662 | 32.4% |
[ 3.5% - 4.0% ] 3.56% | 68,910 | 16.1% |
[ 3.5% - 4.0% ] 3.62% | 49,196 | 10.3% |
[ 3.5% - 4.0% ] 3.65% | 48,985 | 23.7% |
[ 3.5% - 4.0% ] 3.75% | 100,849 | 16.3% |
[ 3.5% - 4.0% ] 3.91% | 30,927 | 21.3% |
[ 3.5% - 4.0% ] 3.92% | 30,938 | 13.0% |
[ 4.0% - 4.5% ] 4.06% | 43,391 | 12.3% |
[ 4.0% - 4.5% ] 4.08% | 81,929 | 13.4% |
[ 4.0% - 4.5% ] 4.13% | 27,523 | 18.2% |
[ 4.0% - 4.5% ] 4.25% | 6,968 | 4.9% |
[ 4.0% - 4.5% ] 4.48% | 2,589 | 20.1% |
[ 4.0% - 4.5% ] 4.48% | 4,842 | 20.7% |
[ 4.5% - 5.0% ] 4.73% | 39,177 | 15.1% |
[ 5.0% - 5.5% ] 5.16% | 5,984 | 26.8% |
[ 5.0% - 5.5% ] 5.43% | 40,898 | 10.6% |
[ 5.5% - 6.0% ] 5.87% | 1,005 | 4.6% |
[ 6.0% - 6.5% ] 6.33% | 30,625 | 15.0% |
[ 8.0% - 8.5% ] 8.37% | 3,693 | 17.1% |
[ 8.5% - 9.0% ] 8.96% | 28,172 | 5.5% |
[ 9.5% - 10.0% ] 9.77% | 8,290 | 19.6% |
[ 10.5% - 11.0% ] 10.52% | 7,703 | 18.8% |
[ 11.0% - 11.5% ] 11.24% | 1,930 | 11.4% |
[ 14.0% - 14.5% ] 14.00% | 1,157 | 7.7% |
[ 27.0% - 27.5% ] 27.31% | 8,892 | 2.2% |